Strength of Screw Connections Subject to Shear Force
35
Strength of Screw Connections Subject to Shear Force RESEARCH REPORT RP04-2 NOVEMBER 2004 REVISION 2006 r e s e a r c h r e p o r American Iron and Steel Institute Committee on Specifications for the Design of Cold-Formed Steel Structural Members
-
Upload
agustin-yanez-quezada -
Category
Documents
-
view
219 -
download
0
Transcript of Strength of Screw Connections Subject to Shear Force

8/4/2019 Strength of Screw Connections Subject to Shear Force
http://slidepdf.com/reader/full/strength-of-screw-connections-subject-to-shear-force 1/34
Strength of ScrewConnections Subject to
Shear Force
R E S E A R C H R E P O R T R P 0 4 - 2
N O V E M B E R 2 0 0 4
R E V I S I O N 2 0 0 6
res
earch repor
American Iron and Steel Institute
Committee on Specifications
for the Design of Cold-Formed
Steel Structural Members

8/4/2019 Strength of Screw Connections Subject to Shear Force
http://slidepdf.com/reader/full/strength-of-screw-connections-subject-to-shear-force 2/34
The material contained herein has been developed by researchers based on their researchfindings. The material has also been reviewed by the American Iron and Steel InstituteCommittee on Specifications for the Design of Cold-Formed Steel Structural Members. TheCommittee acknowledges and is grateful for the contributions of such researchers.
The material herein is for general information only. The information in it should not be
used without first securing competent advice with respect to its suitability for any givenapplication. The publication of the information is not intended as a representation or warrantyon the part of the American Iron and Steel Institute, or of any other person named herein, thatthe information is suitable for any general or particular use or of freedom from infringement ofany patent or patents. Anyone making use of the information assumes all liability arising fromsuch use.
Copyright 2004 American Iron and Steel Institute
Revised Edition Copyright 2006 American Iron and Steel Institute

8/4/2019 Strength of Screw Connections Subject to Shear Force
http://slidepdf.com/reader/full/strength-of-screw-connections-subject-to-shear-force 3/34
Civil Engineering Study 04-1
Cold-Formed Steel Series
Final Report
STRENGTH OF SCREW CONNECTIONS
SUBJECT TO SHEAR FORCE
by
Michael Rotimi Babalola
Research Assistant
Roger A. LaBoube
Project Director
A Research Project Sponsored by the
American Iron and Steel Institute
November, 2004
Department of Civil Engineering
Wei-Wen Yu Center for Cold-Formed Steel Structures
University of Missouri-Rolla
Rolla, Missouri

8/4/2019 Strength of Screw Connections Subject to Shear Force
http://slidepdf.com/reader/full/strength-of-screw-connections-subject-to-shear-force 4/34
PREFACE
The report summarizes a study related to the design of cold-formed steel screw
connections. The study included a review of available literature and a compilation of the
available test data pertaining to the strength of a screw connection subject to a shear
force.
Currently, there are equations for predicting the nominal shear strength of a screw
connection given in the American Iron and Steel Institute’s North American Specification
for the Design of Cold-Formed Steel Structural Members. In an effort to increase the
scope of application of the nominal shear strength equations, studies by Rogers and
Hancock at the Department of Civil Engineering at the University of Sydney in Australia
led to the development of a varied form of screw strength equations. A significant aspect
of the University of Sydney study was the testing of screw connections using low
ductility steels.
The research reported herein analyzed screw connection test data from six
different research programs. The test data was evaluated by comparison to both the AISI
equations and the equations developed at the University of Sydney. The intent of this
research was to determine the applicability and accuracy of the equations. Both normal
and low ductility screw connections were included in the analysis.
For applications in which t2 /t1> 1.0, normal ductility steel, and connections with
less than seven screws, the Rogers and Hancock equation provides a slightly more
accurate prediction of the connection strength.
For more than seven screws in a connection, the Rogers and Hancock equation
was found to over estimate the tested connection capacity and thus a reduction factor of

8/4/2019 Strength of Screw Connections Subject to Shear Force
http://slidepdf.com/reader/full/strength-of-screw-connections-subject-to-shear-force 5/34
0.85 has been proposed in order to provide satisfactory prediction of the connection
strength.
This report is based on a thesis submitted to the Faculty of the Graduate School of
the University of Missouri-Rolla in partial fulfillment of the requirements for the degree
of Masters of Science in Civil Engineering.
Technical guidance for this study was provided by the American Iron and Steel
Institute’s Subcommittee on Connections (A. Harrold, Chairperson). The
Subcommittee’s guidance is gratefully acknowledged. Thanks are also extended to H.H.
Chen, AISI staff for her assistance.

8/4/2019 Strength of Screw Connections Subject to Shear Force
http://slidepdf.com/reader/full/strength-of-screw-connections-subject-to-shear-force 6/34
1
1. INTRODUCTION
1.1 GENERAL
Screws can provide a rapid and effective means to fasten steel metal siding and
roofing to framing members. Screws can also be used for connections in steel framing
systems and roof trusses.
Tapping screws are externally threaded fasteners with the ability to tap their
own internal mating threads when driven into metallic materials. Cold-formed steel
construction utilizes several types of tapping screws. The self-drilling screws are
externally threaded fasteners with the ability to drill their own hole and form, or tap, their
own internal threads without deforming their own thread. These screws are high-strength,
one-piece installation fasteners. Self-piercing screws are high-strength, one-piece one-
side installation fasteners with sharp point angles of 20 to 26 degrees and are used to
attach rigid materials to 33mils (one thickness) or thinner. The self-piercing screws are
externally threaded fasteners with the ability to self-pierce metallic material, form a
sleeve by extruding metallic material and tap their own mating threads when driven.
When choosing the proper fastener for cold-formed steel construction two
fundamental questions must be answered: What materials are being joined? and what is
the total thickness of the material in the connection? When the application has been
defined, it is then possible to choose fasteners with the appropriate point design, body
diameter, length, head style, drive, thread type and plating.
Point types include self-piercing or self-drilling. Several types of tapping screws
are available, including thread cutting, thread rolling and thread forming which all require

8/4/2019 Strength of Screw Connections Subject to Shear Force
http://slidepdf.com/reader/full/strength-of-screw-connections-subject-to-shear-force 7/34
2
a pre-drilled hole. The body diameter is specified by the nominal screw size. The length
of the fastener is measured from the bearing surface of the fastener to the end of the
point. The length of self-drilling screws may require special consideration since some
designs have an unthreaded pilot section or reamer wings between the threads and the
drill point. Common head styles include flat, oval, wafer, truss, modified truss, hex
washer head, pan, round washer and pancake.
1.2 STANDARD TEST
There exists a standard for testing screw strength. The American Iron and Steel
Institute’s Cold-Formed Steel Design Manual (AISI, 2002) gives test methods for
determining the strength of a screw connection. In the AISI TS-4-02 and AISI TS-5-02,
the standard test methods for determining the tensile and shear strength of screws
connections and mechanically fastened cold-formed steel connections are defined.
1.3 CONNECTION STRENGTH
Screw connection strength equations in the current American Iron and Steel
Institute’s Cold-Formed Steel Design Manual (AISI 2001) are based on worldwide tests.
Screw connection tests used to formulate the provisions included single fastener
specimens as well as multiple fastener specimens. However, it is recommended that at
least two screws should be used to connect individual elements.

8/4/2019 Strength of Screw Connections Subject to Shear Force
http://slidepdf.com/reader/full/strength-of-screw-connections-subject-to-shear-force 8/34
4
2. REVIEW OF LITERATURE
2.1 GENERAL
The following summarizes literature considered important for this study.
2.2 STANDARD TEST
The following are the various sources that outline testing methods in use for
determining the mechanical properties of screws and screw connections.
2.2.1. Society of Automotive Engineers J78 (SAE REV 1998). SAE J78 Self
Drilling Tapping Screws (SAE, REV 1998) addresses mechanical requirements for self-
drilling screws, as well as dimensional, material, process, performance, selection and
installation.
The tests in SAE J78 specification focus on torsional strength, rather than the
tensile or shear strengths of the screws.
2.2.2. American Society for Testing and Materials C1513-01. The standard
specification for steel tapping screws for cold-formed steel framing connections covers
steel self-drilling and self- piercing tapping. This standard also covers test methods for
determining performance (hardness, ductility, torsional strength, drill drive, self-drilling
tapping screw drill capacity) requirements and physical properties.
The test standard does not cover tensile or shear strength.
2.2.3. American Iron and Steel Institute. The American Iron and Steel
Institute’s document, Test Method for Mechanically Fastened Cold-Formed Steel
Connections (AISI, 1996b) outlines a lap-joint shear test. The shear test involves lapping
two sheets together and connecting them with a self-drilling screw. The assembly is put

8/4/2019 Strength of Screw Connections Subject to Shear Force
http://slidepdf.com/reader/full/strength-of-screw-connections-subject-to-shear-force 9/34
5
into a tension testing machine and a uniaxial tension force is applied. Tension tests are
also specified for determining pull-over and pull-out of a screw.
2.2.4. Manufacturers Test Methods. The test procedure, results, and installation
information was provided by several manufacturers. The previously mentioned
documents SAE J78 (SAE, 1979), ASTM C1513-01 or the AISI Test Methods for
Mechanically Fastened Cold-Formed Steel Connections were often cited as references by
manufacturers.
ITW Buildex,s standard is titled, Work Instruction QWI 10.6- Lab Instructions for
Mechanical Properties Testing of Buildex Fasteners” (ITW Buildex, 1995). Buildex
specifies its fixtures and testing rate. The tests consist of pull-out, pull-over, torsion,
tension and shear.
Another manufacturer’s standard considered in this project is by Vicwest
(Sommerstein, 1996). This test standard includes a fixture for testing pull-over, pull-out
and shear strength of screw connections.
2.3 CONNECTION STRENGTH
The references listed below present information on available data regarding the
shear strength of a screw connection. The nominal strength of the screw P ns shall be
determined by test according to section F1 (a) of 2001 edition of the AISI Specification.
2.3.1. Buildex Division Illinois (1979). The Buildex Division-Illinois Tool
Works, inc. carried out a total of 141 tests on some of the more common types and sizes
of screws and sheet materials.

8/4/2019 Strength of Screw Connections Subject to Shear Force
http://slidepdf.com/reader/full/strength-of-screw-connections-subject-to-shear-force 10/34
6
In the shear test series, screw-fastened connections between two steel sheets in a
single lap configuration were evaluated. The connections were subjected to forces
parallel to the plane of interconnection. The ultimate shear value load of single lap
connection was noted.
Seven different types of screws were tested: Teks 1 to 5, mini-point (M-P) and
Teks2-MBHT (Teks2-M) screws. The steel sheets had thicknesses ranging between
Gauges 26 (0.018in) and 1/8 in, and had Fu /Fy ratios consistent with normal ductile steels.
Shown in Appendix A are the sheet properties and the types of screws used.
2.3.2. Eastman (1976). DOFASCO in Hamilton, Canada sponsored a total of 160
screw connection tests to determine the ultimate shear load for the connection. Various
types of screws ranging in sizes between No.8 and No.14 were used in the test program.
The types of screws tested were screw Types A and AB, Teks 2F, Teks 1- Stitch and
Teks 2-MBHT. The thickness of the steel sheets ranged from Gauge 24 (0.0239 in.) to
Gauge 18 (0.0485 in.) and had Fu /Fy ratios appropriate for normal ductile steels.
2.3.3. Sokol (1999). Sokol, s work is summarized in Civil Engineering Study 98-3
(Cold-Formed Steel Series of UMR), titled, “Determination of the tensile and shear
strengths of screws and the effect of screw patterns on Cold-Formed steel connections.”
Sokol, s research established a standard test method for determining the screw
strength. The study involved defining a test procedure and validating the test method
concepts for practicality and reliability.
The connection strength was also studied and involved the testing of 200 single lap
connections of normal ductility steel sheets. Three sheet thicknesses (0.053 in., 0.040 in.,
8/4/2019 Strength of Screw Connections Subject to Shear Force
http://slidepdf.com/reader/full/strength-of-screw-connections-subject-to-shear-force 11/34
7
0.030 in) were considered. Three self-drilling screw sizes, No. 8, No. 10 and No. 12 with
the spacing of 2d and 3d (d is the diameter of the screw threads) were studied.
2.3.4. Daudet (1996). Daudet, s work is summarized in his Master’s Thesis, titled,
“Self-Drilling Screw connections in Low Ductility Light Gage Steel”. Daudet
investigated double-lap and single-lap shear connections that used self-drilling screws.
The steel used in the study included both normal and low ductility sheets with thickness
of 0.029 in., 0.037 in., 0.040in., 0.043 in., 0.050 in. and 0.054 in.
The studies include both single- screw and two- screw connections with screw
sizes of No. 10, No. 12 and 0.25 in. screws.
2.3.5. Vicwest (1998). The fasteners considered by Vicwest included self-tapping
and self-drilling screws with sizes between nominal 0.168 in. outside thread diameter
(No. 8) and 0.348 in. The connection failures covered include fastener pull-out from base
material, pull-over of fastened material over head of fastener, and shear failure.
The connection tested in a shear test may fail in four possible ways including:
bearing failure of material, material tearing due to tension failure of net section, shearing
of the fastener and tilting of fastener.
2.3.6. Rogers and Hancock (1997). Rogers and Hancock carried out 88 different
tests using six different types of screws. The types of sheets used were 042/042-G550,
060/060-G550, 042/060-G550, 0042/100-G550, 055/055-G300 and 055/080-G300. The
screw diameters ranged from 0.165 in. to 0.252 in. and the sheet thickness was between
0.0161 in. to 0.0390 in. G550 steel sheet is a low ductility material where as G300 is
normal ductility steel. Single-lap connections were investigated for the different

8/4/2019 Strength of Screw Connections Subject to Shear Force
http://slidepdf.com/reader/full/strength-of-screw-connections-subject-to-shear-force 12/34
8
thicknesses of steel sheet stated above with two or four screw patterns. The failure modes
investigated included bearing, tilting and bearing/tilting.
Rogers and Hancock developed the following connection strength equations:
For t2 /t1≤1.0
Pns = 4.2*(t23*d)
1/2*Fu2 Eq. 2.3.6-1
Pns = C*t1*d*Fu1 Eq. 2.3.6-2
Pns = C*t2*d*Fu2 Eq. 2.3.6-3
For t2 /t1 <2.5
Pns = C*t1*d*Fu1 Eq. 2.3.6-4
Pns = C*t2*d*Fu2 Eq. 2.3.6-5
Where C is
d/t C
d/t< 6 2.7
6<d/t<13 3.3-0.1d/t
d/t>13 2.0
Where:
d = nominal screw diameter.
t1 = thickness of member in contact with the screw head.
t 2 = thickness of member not in contact with the screw head.
Fu1 = tensile strength of member in contact with screw head.
Fu2 = tensile strength of member not in contact with screw head.
Pns = nominal shear strength per screw.
t = the thickness of the smaller member.

8/4/2019 Strength of Screw Connections Subject to Shear Force
http://slidepdf.com/reader/full/strength-of-screw-connections-subject-to-shear-force 13/34
9
C = Varying coefficient determine by the value of d/t.
2.3.7. American Iron and Steel Institute (AISI 2001). Based on a study by
Pekoz (1990), in the AISI Specification section E4.3 (2001) there are five equations to
determine the nominal shear strength per screw, Pns:
For t2 /t1< 1.0 the smallest of the three equations controls.
Pns = 4.2*(t23*d) 1/2*Fu2 Eq. 2.3.7-1
Pns = 2.7*t1*d*Fu1 Eq. 2.3.7-2
Pns = 2.7*t2*d*Fu2 Eq. 2.3.7-3
For t2 /t1 > 2.5, Pns shall be taken as the smaller of the two equations controls.
Pns = 2.7*t1*d*Fu1 Eq. 2.3.7-4
Pns = 2.7*t2*d*Fu2 Eq. 2.3.7-5
For 1.0<t2 /t1 <2.5, Pns shall be determined by linear interpolation between the above two
cases.
Where:
d = nominal screw diameter.
t1 = thickness of member in contact with the screw head.
t 2 = thickness of member not in contact with the screw head.
Fu1 = tensile strength of member in contact with screw head.
Fu2 = tensile strength of member not in contact with screw head.
Pns = nominal shear strength (resistance) per screw.
t = the thickness of the smaller member.

8/4/2019 Strength of Screw Connections Subject to Shear Force
http://slidepdf.com/reader/full/strength-of-screw-connections-subject-to-shear-force 14/34
10
3. DATA ANALYSIS
3.1 INTRODUCTION
Tests were compiled from a variety of sources for the shear strength of screw
single-lap connections. These test data were used to compare with AISI equations,
Eq.2.3.7-1 to Eq.2.3.7-5 and the equation from Rogers and Hancock, Equations 2.3.6-1 to
2.3.6-5.
3.2
BUILDEX DATA COMPARED WITH AISI METHOD
The Buildex Division-Illinois Tools Works, inc. carried out a total of 141 tests on
the more common types and sizes of screws and sheets materials.
In comparing test data with the AISI equations, the governing principal parameter
is t2 /t1; the nominal shear strength per screw is the smallest of the five computed values
(Eqs 2.3.7-1 to 2.3.7-5). The ratio of failure shear strength for test to computed results
(Pt /Pns) was recorded for the 141 samples tested. The Mean (1.054), Standard Deviation
(0.240) and Coefficient of Variation (0.228) for (Pt/Pns) of the 141 samples were also
computed.
3.3 BUILDEX DATA COMPARED WITH ROGERS AND HANCOCK
METHOD
In comparing analysis between Buildex test results and that of the Rogers and
Hancock method (Eqs 2.3.6-1 to 2.3.6-5), the governing principals parameters are t2 /t1,
d/t and the varying coefficient (C); the nominal shear strength per screw was the smallest
of the computed values. The ratio of failure shear strength for test to computed results

8/4/2019 Strength of Screw Connections Subject to Shear Force
http://slidepdf.com/reader/full/strength-of-screw-connections-subject-to-shear-force 15/34
11
(Pt /Pns) was recorded for the 141samples tested. The Mean (1.109), Standard Deviation
(0.232) and Coefficient of Variation (0.209) for (Pt /Pns) of the 141 samples were also
computed.
3.4 DOFASCO DATA COMPARED WITH AISI METHOD
DOFASCO carried out a total of 160 tests. For comparison analysis with AISI
equations, the governing principal parameter is t2 /t1; the nominal shear strength per screw
is the smallest of the five computed values. The ratio of failure shear strength for the test
to computed results (Pt /Pns) was recorded for the 160 samples tested. The Mean (0.984),
Standard Deviation (0.182) and Coefficient of Variation (0.185) for ratio P t /Pns of the 160
samples were also computed.
3.5 DOFASCO DATA COMPARED WITH ROGERS AND HANCOCK
METHOD
For the comparison analysis between the DOFASCO test results and the Rogers
and Hancock method, the governing principal parameters are t2 /t1, d/t and the varying
coefficient (C), the nominal shear strength per screw was the smallest of the computed
values. The ratio of failure shear strength for test to computed results (Pt /Pns) was
recorded for the 160 samples tested. The Mean (0.996), Standard Deviation (0.181) and
Coefficient of Variation (0.182) for (Pt /Pns) of the 160 samples were also computed.

8/4/2019 Strength of Screw Connections Subject to Shear Force
http://slidepdf.com/reader/full/strength-of-screw-connections-subject-to-shear-force 16/34
12
3.6 TEST DATA FROM ROGERS AND HANCOCK COMPARED WITH AISI
METHOD
Rogers and Hancock developed their data from 150 different tests using six
different types of screws.
For the comparison analysis between Rogers and Hancock and AISI equation, the
governing principal parameter is t2 /t1, the nominal shear strength per screw was the
smallest of the computed values. The ratio of failure shear strength for test to computed
results (Pt /Pns) was recorded for the 180 samples tested. The Mean (0.997), Standard
Deviation (0.204) and Coefficient of Variation (0.206) for (Pt /Pns) of the 150 samples
were also computed and recorded.
3.7 TEST DATA FROM ROGERS AND HANCOCK COMPARED WITH
ROGERS AND HANCOCK METHOD
In comparing the analysis between University of Sydney test and the equations
developed by Rogers and Hancock, the governing principal parameters are t2 /t1, d/t
and the varying coefficient (C); the nominal shear strength per screw was the
smallest of the computed values. The ratio of failure shear strength for test to
computed results (Pt /Pns) was recorded for the 88 samples tested. The Mean (1.019),
Standard Deviation (0.194) and Coefficient of Variation (0.190) for (P t /Pns) of the
150 samples were computed.
3.8 VICWEST DATA COMPARED WITH AISI METHOD
Vicwest carried out tests using two types of screws, the self-tapping and self-
drilling. A total of 520 tests were carried out on self- tapping screw and 680 tests on self
–drilling screw.
8/4/2019 Strength of Screw Connections Subject to Shear Force
http://slidepdf.com/reader/full/strength-of-screw-connections-subject-to-shear-force 17/34
13
In the comparing analysis with AISI equations, the governing principal parameter
is t2 /t1; the nominal shear strength per screw was the smallest of the five computed
values. The ratio of failure shear strength for test to computed results (Pt /Pns) was
recorded for the 520 self- tapping samples and 680 self-drilling samples. The Mean for
Self-tapping screw (1.111) and for Self-drilling screw (1.035), Standard Deviation for
Self-tapping screw (0.261) and for Self-drilling screw (0.199) and Coefficient of
Variation for Self-tapping screw (0.235) and Self-drilling (0.193) (Pt /Pns) of the total
1250 samples were computed.
3.9 VICWEST DATA COMPARED WITH ROGERS AND HANCOCK
METHOD
Vicwest carried out tests using two types of screws, the self tapping and self -
drilling. A total of 520 tests were carried out on self tapping screw and 680 tests on self –
drilling screw.
In the comparing analysis, the governing principal parameters are t2 /t
1, d/t and the
varying coefficient (C); the nominal shear strength per screw was the smallest of the
computed values. The ratio of failure shear strength for test to computed results
Pt /Pns) was recorded for the 1250 samples tested. The Mean, Standard Deviation and
Coefficient of Variation for (Pt /Pns) of the 1250 samples were computed as 1.035, 0.199,
and 0.199.
3.10 SOKOL DATA COMPARED WITH AISI METHOD

8/4/2019 Strength of Screw Connections Subject to Shear Force
http://slidepdf.com/reader/full/strength-of-screw-connections-subject-to-shear-force 18/34
14
Sokol carried out tests on self-drilling screws with spacing of two times and three
times the screw diameter under different patterns of screw arrangements. In this
comparison, the connections with three times the screw diameter are used.
For the comparison analysis between the Sokol test results and the AISI Method,
the governing principal parameter is t2 /t1; the nominal shear strength per screw was the
smallest of the five computed values. The ratios of failure shear strength for the test to
computed results (Pt /Pns) were recorded for the samples.
The Mean (0.855), Standard Deviation (0.126) and Coefficient of Variation
(0.147) for the ratio Pt /Pns of all the samples were computed.
3.11 SOKOL DATA COMPARED WITH ROGERS AND HANCOCK METHOD
For the comparison analysis between Sokol’s test results and the Rogers and
Hancock Method, the governing principal parameters are t2 /t1, d/t and the varying
coefficient (C), the nominal shear strength per screw was the smallest of the computed
values. The ratio of the failure shear strength for test to computed results (P t /Pns) was
recorded for all the samples. The Mean (0.854), Standard Deviation (0.126) and
Coefficient of Variation (0.147) for (Pt /Pns) were recorded for all the samples.
3.12 DAUDET DATA COMPARED WITH AISI METHOD
Daudet’s test results used in this study were from tests using low ductility steel.
A total of 111 tests was performed.

8/4/2019 Strength of Screw Connections Subject to Shear Force
http://slidepdf.com/reader/full/strength-of-screw-connections-subject-to-shear-force 19/34
15
For the comparison analysis between Daudet’s test results and the AISI Method,
the governing parameter is t2 /t1; the nominal shear strength per screw was the smallest of
the five computed values.
The ratio of failure shear strength for the test to computed results (P t /Pns) was
recorded for the 111 samples tested. The Mean (0.866), Standard Deviation (0.168) and
Coefficient of Variation (0.193) for ratio Pt /Pns of the 114 samples were also computed.
3.13 DAUDET DATA COMPARED WITH ROGERS AND HANCOCK
METHOD
For the comparison analysis between Daudet’s test results and the Rogers and
Hancock Method, the governing principal parameters are t2 /t1, d/t and the varying
coefficient (C); the nominal shear strength per screw was the smallest of the computed
values.
The ratio of failure shear strength for test to computed results (Pt /Pns) was
recorded for the 114 samples tested. The Mean (0.866), Standard Deviation (0.168) and
Coefficient of Variation (0.193) for (Pt /Pns) of the 114 samples were also computed.

8/4/2019 Strength of Screw Connections Subject to Shear Force
http://slidepdf.com/reader/full/strength-of-screw-connections-subject-to-shear-force 20/34
16
4. EVALUATION OF DATA
4.1 INTRODUCTION
Tests were compiled from a variety of sources for the shear strength of single-lap
screw connections. Between the six different sets of data, there were a total of 1890
test data points considered in the analysis. To analyze each of the different equations, a
spreadsheet was developed to evaluate the nominal shear strength. This value was then
compared to the tested value of shear strength, forming a ratio of P test /Pns. The mean,
standard deviation and coefficient of variation were determined for each set of data.
4.2 BUILDEX RESULTS WITH AISI AND ROGERS AND HANCOCK
RESULTS
In addition to all the test data from Buildex being evaluated together, the data was
divided into sub-groups according to screw-sizes and also evaluated.
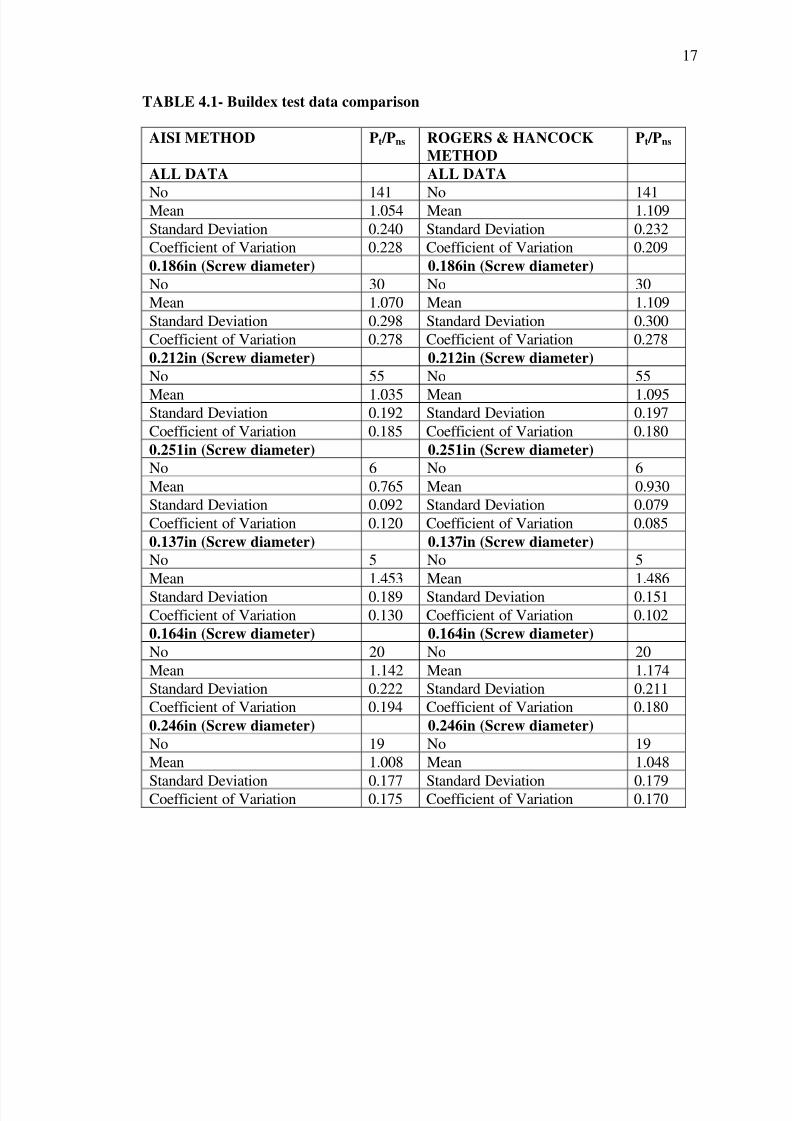
Table 4.1 summarizes the statistical data, showing the number of tests, the mean,
standard deviation and coefficient of variation for the Buildex test data for each screw
sizes.
The statistical parameters in Table 4.1 show a smaller coefficient of variation and
a higher ratio of Ptest /Pns when the Rogers and Hancock equations are used. This indicates
that for data from Buildex the Rogers and Hancock equations are in fact more accurate at
predicting the shear strength of the screw connection.
8/4/2019 Strength of Screw Connections Subject to Shear Force
http://slidepdf.com/reader/full/strength-of-screw-connections-subject-to-shear-force 21/34
17
TABLE 4.1- Buildex test data comparison
AISI METHOD Pt /Pns ROGERS & HANCOCK
METHOD
Pt /Pns
ALL DATA ALL DATA
No 141 No 141Mean 1.054 Mean 1.109
Standard Deviation 0.240 Standard Deviation 0.232
Coefficient of Variation 0.228 Coefficient of Variation 0.209
0.186in (Screw diameter) 0.186in (Screw diameter)
No 30 No 30
Mean 1.070 Mean 1.109
Standard Deviation 0.298 Standard Deviation 0.300
Coefficient of Variation 0.278 Coefficient of Variation 0.278
0.212in (Screw diameter) 0.212in (Screw diameter)
No 55 No 55
Mean 1.035 Mean 1.095Standard Deviation 0.192 Standard Deviation 0.197
Coefficient of Variation 0.185 Coefficient of Variation 0.180
0.251in (Screw diameter) 0.251in (Screw diameter)
No 6 No 6
Mean 0.765 Mean 0.930
Standard Deviation 0.092 Standard Deviation 0.079
Coefficient of Variation 0.120 Coefficient of Variation 0.085
0.137in (Screw diameter) 0.137in (Screw diameter)
No 5 No 5
Mean 1.453 Mean 1.486
Standard Deviation 0.189 Standard Deviation 0.151
Coefficient of Variation 0.130 Coefficient of Variation 0.102
0.164in (Screw diameter) 0.164in (Screw diameter)
No 20 No 20
Mean 1.142 Mean 1.174
Standard Deviation 0.222 Standard Deviation 0.211
Coefficient of Variation 0.194 Coefficient of Variation 0.180
0.246in (Screw diameter) 0.246in (Screw diameter)
No 19 No 19
Mean 1.008 Mean 1.048
Standard Deviation 0.177 Standard Deviation 0.179Coefficient of Variation 0.175 Coefficient of Variation 0.170

8/4/2019 Strength of Screw Connections Subject to Shear Force
http://slidepdf.com/reader/full/strength-of-screw-connections-subject-to-shear-force 22/34
18
TABLE 4.1- Buildex test data comparison (cont.)
0.243in (Screw diameter) 0.243in (Screw diameter)
No 6 No 6
Mean 0.953 Mean 1.132
Standard Deviation 0.204 Standard Deviation 0.156Coefficient of Variation 0.214 Coefficient of Variation 0.138
4.3 DOFASCO RESULTS WITH AISI AND ROGERS AND HANCOCK
RESULTS
The data from DOFASCO indicated both self-drilling and self-tapping screws
were used in the test program. The screw data was analyzed by dividing the data into sub-
groups according to screw-types and sizes also evaluated.
Table 4.2 summarizes the statistical data, showing the number of tests, the mean,
standard deviation and coefficient of variation for the DOFASCO test data for each screw
sizes.
The statistical parameters in Tables 4.2, 4.3 and 4.4 show a smaller coefficient of
variation and a higher ratio of Ptest /Pns when the Rogers and Hancock equations are used.
This indicates that for the data from DOFASCO, the University of Sydney is in fact more
accurate at predicting the shear strength of the screw connection.
DOFASCO data indicated that the screw type, self-tapping or self-drilling, had
little influence on the strength of the connection.

8/4/2019 Strength of Screw Connections Subject to Shear Force
http://slidepdf.com/reader/full/strength-of-screw-connections-subject-to-shear-force 23/34
19
TABLE 4.2- Dofasco test data comparison
AISI METHOD Pt /Pns ROGERS & HANCOCK
METHOD
Pt /Pns
ALL DATA ALL DATA
No 160 No 160Mean 0.984 Mean 0.996
Standard Deviation 0.182 Standard Deviation 0.181
Coefficient of Variation 0.185 Coefficient of Variation 0.182
SCREW A SCREW A
No 48 No 48
Mean 0.989 Mean 1.001
Standard Deviation 0.180 Standard Deviation 0.180
Coefficient of Variation 0.182 Coefficient of Variation 0.180
SCREW AB SCREW AB
No 56 No 56
Mean 0.956 Mean 0.970Standard Deviation 0.178 Standard Deviation 0.180
Coefficient of Variation 0.186 Coefficient of Variation 0.186
TEKS/2F TEKS/2F
No 16 No 16
Mean 1.032 Mean 1.035
Standard Deviation 0.220 Standard Deviation 0.221
Coefficient of Variation 0.213 Coefficient of Variation 0.214
TEKS/1 STITCH TEKS/1 STITCH
No 32 No 32
Mean 1.000 Mean 1.014
Standard Deviation 0.181 Standard Deviation 0.171
Coefficient of Variation 0.181 Coefficient of Variation 0.168
TEKS/2 MBHT TEKS/2 MBHT
No 8 No 8
Mean 0.980 Mean 0.994
Standard Deviation 0.153 Standard Deviation 0.159
Coefficient of Variation 0.156 Coefficient of Variation 0.160

8/4/2019 Strength of Screw Connections Subject to Shear Force
http://slidepdf.com/reader/full/strength-of-screw-connections-subject-to-shear-force 24/34
20
TABLE 4.3- Dofasco test data comparison (self-drilling screws)
AISI METHOD Pt /Pns ROGERS & HANCOCK
METHOD
Pt /Pns
ALL DATA ALL DATA
No 56 No 56Mean 1.006 Mean 1.017
Standard Deviation 0.187 Standard Deviation 0.182
Coefficient of Variation 0.186 Coefficient of Variation 0.179
0.164in (Screw diameter) 0.164in (Screw diameter)
No 16 No 16
Mean 1.032 Mean 1.035
Standard Deviation 0.220 Standard Deviation 0.221
Coefficient of Variation 0.213 Coefficient of Variation 0.214
0.186in (Screw diameter) 0.186in (Screw diameter)
No 16 No 16
Mean 1.003 Mean 1.010Standard Deviation 0.189 Standard Deviation 0.189
Coefficient of Variation 0.188 Coefficient of Variation 0.187
0.212in (Screw diameter) 0.212in (Screw diameter)
No 8 No 8
Mean 0.980 Mean 0.994
Standard Deviation 0.153 Standard Deviation 0.159
Coefficient of Variation 0.156 Coefficient of Variation 0.160
0.243in (Screw diameter) 0.243in (Screw diameter)
No 16 No 16
Mean 0.996 Mean 1.018
Standard Deviation 0.178 Standard Deviation 0.157
Coefficient of Variation 0.179 Coefficient of Variation 0.154
TABLE 4.4- Dofasco test data comparison (self-tapping screws)
AISI METHOD Pt /Pns ROGERS & HANCOCK
METHOD
Pt /Pns
ALL DATA ALL DATA
No 104 No 104
Mean 0.972 Mean 0.985
Standard Deviation 0.179 Standard Deviation 0.180
Coefficient of Variation 0.184 Coefficient of Variation 0.183
0.164in (Screw diameter) 0.164in (Screw diameter)
No 32 No 32
Mean 1.032 Mean 1.034
Standard Deviation 0.198 Standard Deviation 0.198

8/4/2019 Strength of Screw Connections Subject to Shear Force
http://slidepdf.com/reader/full/strength-of-screw-connections-subject-to-shear-force 25/34
21
TABLE 4.4- Dofasco test data comparison (self-tapping screws) (cont.)
Coefficient of Variation 0.192 Coefficient of Variation 0.191
0.186in (Screw diameter) 0.186in (Screw diameter)
No 32 No 32
Mean 0.990 Mean 0.996Standard Deviation 0.180 Standard Deviation 0.178
Coefficient of Variation 0.182 Coefficient of Variation 0.179
0.243in (Screw diameter) 0.243in (Screw diameter)
No 40 No 40
Mean 0.909 Mean 0.935
Standard Deviation 0.146 Standard Deviation 0.157
Coefficient of Variation 0.156 Coefficient of Variation 0.167
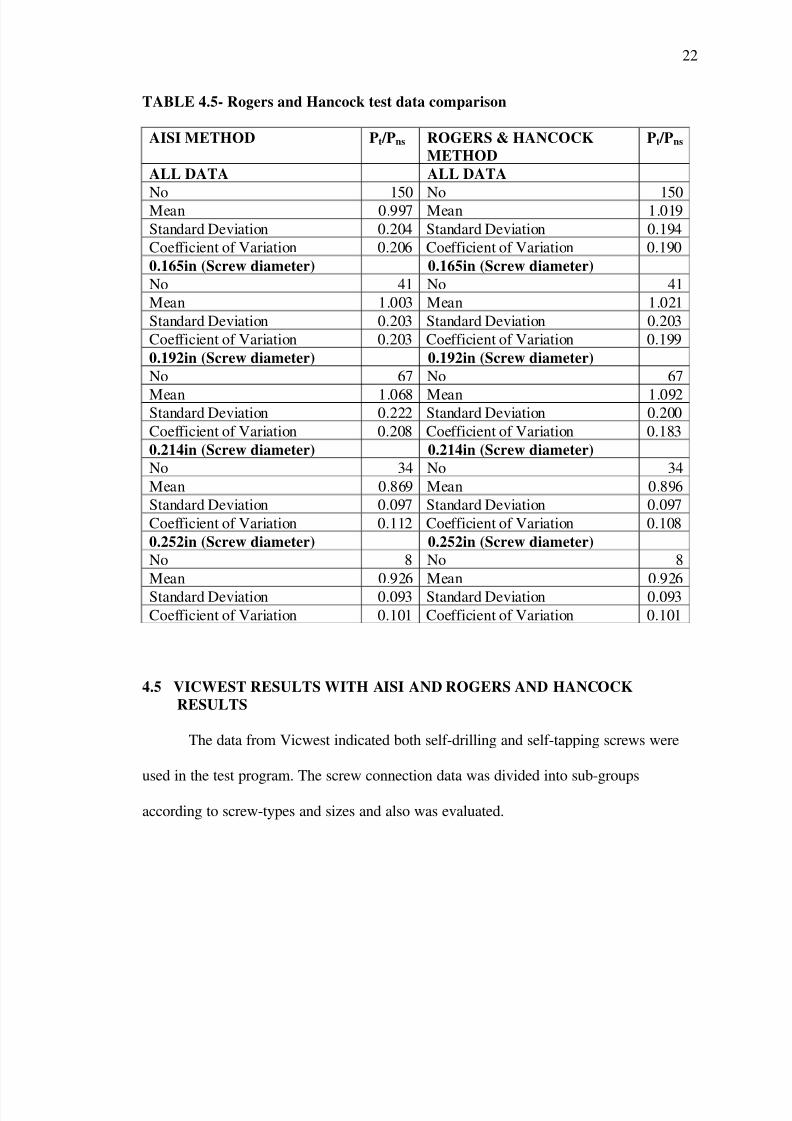
4.4 ROGERS AND HANCOCK RESULTS WITH AISI AND ROGERS ANDHANCOCK RESULTS
Rogers and Hancock used low ductility steels in carrying out many of their test on the
shear strength of a screw connection. Besides all the test data from University of Sydney
being evaluated together, the data was divided into sub-groups according to screw-sizes
and also evaluated.
Table 4.5 summarizes all of this data, showing the number of tests, the mean,
standard deviation and coefficient of variation for the University of Sydney test data for
each screw sizes.
The statistical analysis shows a higher mean value for the Rogers and Hancock
method compared with AISI method but again has a lower standard deviation and
coefficient of variation.
8/4/2019 Strength of Screw Connections Subject to Shear Force
http://slidepdf.com/reader/full/strength-of-screw-connections-subject-to-shear-force 26/34
22
TABLE 4.5- Rogers and Hancock test data comparison
AISI METHOD Pt /Pns ROGERS & HANCOCK
METHOD
Pt /Pns
ALL DATA ALL DATA
No 150 No 150Mean 0.997 Mean 1.019
Standard Deviation 0.204 Standard Deviation 0.194
Coefficient of Variation 0.206 Coefficient of Variation 0.190
0.165in (Screw diameter) 0.165in (Screw diameter)
No 41 No 41
Mean 1.003 Mean 1.021
Standard Deviation 0.203 Standard Deviation 0.203
Coefficient of Variation 0.203 Coefficient of Variation 0.199
0.192in (Screw diameter) 0.192in (Screw diameter)
No 67 No 67
Mean 1.068 Mean 1.092Standard Deviation 0.222 Standard Deviation 0.200
Coefficient of Variation 0.208 Coefficient of Variation 0.183
0.214in (Screw diameter) 0.214in (Screw diameter)
No 34 No 34
Mean 0.869 Mean 0.896
Standard Deviation 0.097 Standard Deviation 0.097
Coefficient of Variation 0.112 Coefficient of Variation 0.108
0.252in (Screw diameter) 0.252in (Screw diameter)
No 8 No 8
Mean 0.926 Mean 0.926
Standard Deviation 0.093 Standard Deviation 0.093
Coefficient of Variation 0.101 Coefficient of Variation 0.101
4.5 VICWEST RESULTS WITH AISI AND ROGERS AND HANCOCK
RESULTS
The data from Vicwest indicated both self-drilling and self-tapping screws were
used in the test program. The screw connection data was divided into sub-groups
according to screw-types and sizes and also was evaluated.

8/4/2019 Strength of Screw Connections Subject to Shear Force
http://slidepdf.com/reader/full/strength-of-screw-connections-subject-to-shear-force 27/34
23
Tables 4.6 and 4.7 summarizes all of this data, showing the number of tests, the
mean, standard deviation and coefficient of variation for Vicwest test data for each screw
sizes.
The statistical analysis shows a higher mean value of the Rogers and Hancock
method compared with AISI method and again a lower standard deviation and coefficient
of variation.
TABLE 4.6- Vicwest test data comparison (self-drilling screws)
AISI METHOD Pt /Pns ROGERS & HANCOCKMETHOD Pt /Pns
ALL DATA ALL DATA
No 680 No 680
Mean 1.035 Mean 1.043
Standard Deviation 0.199 Standard Deviation 0.207
Coefficient of Variation 0.193 Coefficient of Variation 0.198
0.189in (Screw diameter) 0.189in (Screw diameter)
No 90 No 90
Mean 1.036 Mean 1.048
Standard Deviation 0.164 Standard Deviation 0.172
Coefficient of Variation 0.158 Coefficient of Variation 0.1640.215in (Screw diameter) 0.215in (Screw diameter)
No 340 No 340
Mean 1.082 Mean 1.087
Standard Deviation 0.227 Standard Deviation 0.235
Coefficient of Variation 0.210 Coefficient of Variation 0.216
0.246in (Screw diameter) 0.246in (Screw diameter)
No 250 No 250
Mean 0.970 Mean 0.982
Standard Deviation 0.146 Standard Deviation 0.156
Coefficient of Variation 0.151 Coefficient of Variation 0.159

8/4/2019 Strength of Screw Connections Subject to Shear Force
http://slidepdf.com/reader/full/strength-of-screw-connections-subject-to-shear-force 28/34
24
TABLE 4.7- Vicwest test data comparison (self-tapping screws)
AISI METHOD Pt /Pns ROGERS & HANCOCK
METHOD
Pt /Pns
ALL DATA ALL DATA
No 520 No 520Mean 1.111 Mean 1.123
Standard Deviation 0.261 Standard Deviation 0.252
Coefficient of Variation 0.235 Coefficient of Variation 0.225
0.246in (Screw diameter) 0.246in (Screw diameter)
No 310 No 310
Mean 1.159 Mean 1.171
Standard Deviation 0.244 Standard Deviation 0.232
Coefficient of Variation 0.211 Coefficient of Variation 0.198
0.254in (Screw diameter) 0.254in (Screw diameter)
No 150 No 150
Mean 1.108 Mean 1.128Standard Deviation 0.286 Standard Deviation 0.273
Coefficient of Variation 0.258 Coefficient of Variation 0.242
0.290in (Screw diameter) 0.290in (Screw diameter)
No 60 No 60
Mean 0.870 Mean 0.865
Standard Deviation 0.098 Standard Deviation 0.101
Coefficient of Variation 0.113 Coefficient of Variation 0.116
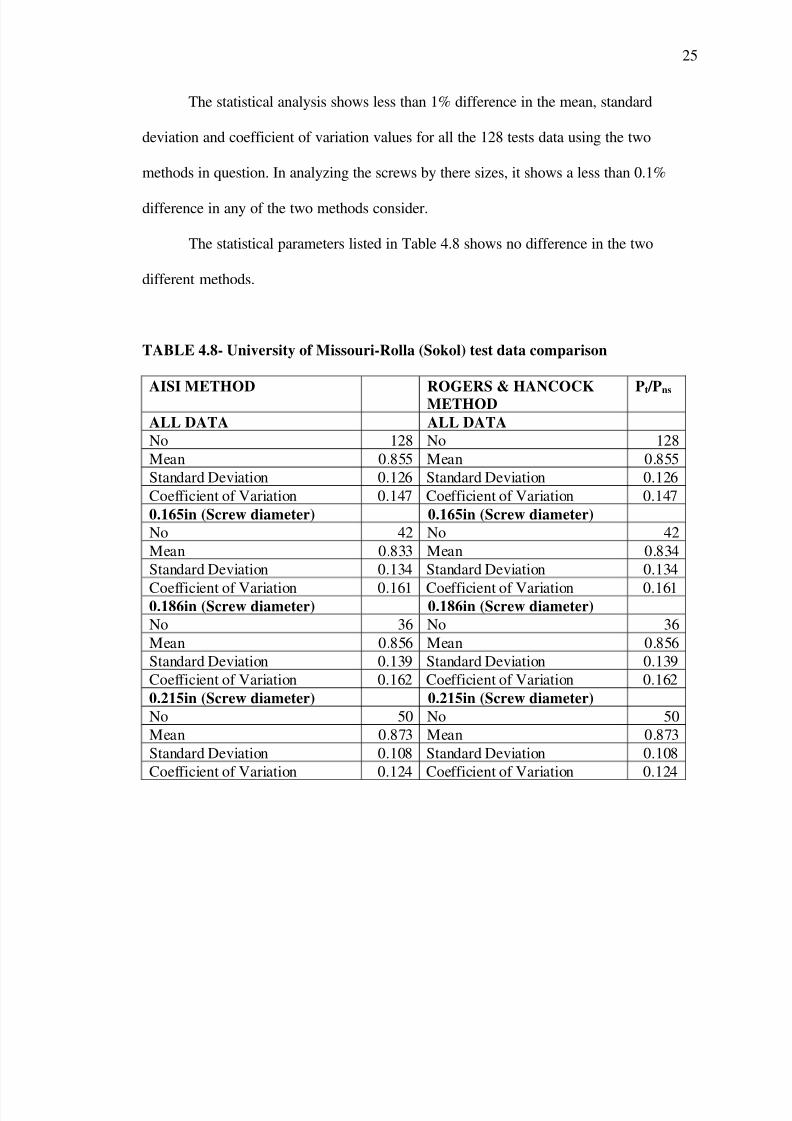
4.6 SOKOL RESULTS WITH AISI AND ROGERS AND HANCOCK RESULTS
Normal ductility steel was used in the Civil Engineering Study 98-3 and the screw
sizes were No.8 (0.165 in.), No.10 (0.186 in.) and No.12 (0.215 in.) with spacing of 2d
and 3d (d is the diameter of the screw threads).
In this study, only the 3d spacing test data were evaluated against the AISI and
Australian equations. Besides all the test data from Sokol being evaluated together, the
data was divided into sub-groups according to screw-sizes and also evaluated.
Table 4.8 summarizes all of this data, showing the number of tests, the mean,
standard deviation and coefficient of variation for Sokol test data for each screw sizes.
8/4/2019 Strength of Screw Connections Subject to Shear Force
http://slidepdf.com/reader/full/strength-of-screw-connections-subject-to-shear-force 29/34
25
The statistical analysis shows less than 1% difference in the mean, standard
deviation and coefficient of variation values for all the 128 tests data using the two
methods in question. In analyzing the screws by there sizes, it shows a less than 0.1%
difference in any of the two methods consider.
The statistical parameters listed in Table 4.8 shows no difference in the two
different methods.
TABLE 4.8- University of Missouri-Rolla (Sokol) test data comparison
AISI METHOD ROGERS & HANCOCKMETHOD Pt /Pns
ALL DATA ALL DATA
No 128 No 128
Mean 0.855 Mean 0.855
Standard Deviation 0.126 Standard Deviation 0.126
Coefficient of Variation 0.147 Coefficient of Variation 0.147
0.165in (Screw diameter) 0.165in (Screw diameter)
No 42 No 42
Mean 0.833 Mean 0.834
Standard Deviation 0.134 Standard Deviation 0.134
Coefficient of Variation 0.161 Coefficient of Variation 0.1610.186in (Screw diameter) 0.186in (Screw diameter)
No 36 No 36
Mean 0.856 Mean 0.856
Standard Deviation 0.139 Standard Deviation 0.139
Coefficient of Variation 0.162 Coefficient of Variation 0.162
0.215in (Screw diameter) 0.215in (Screw diameter)
No 50 No 50
Mean 0.873 Mean 0.873
Standard Deviation 0.108 Standard Deviation 0.108
Coefficient of Variation 0.124 Coefficient of Variation 0.124

8/4/2019 Strength of Screw Connections Subject to Shear Force
http://slidepdf.com/reader/full/strength-of-screw-connections-subject-to-shear-force 30/34
26
4.7 DAUDET RESULTS WITH AISI AND ROGERS AND HANCOCK
RESULTS
Daudet,s work is summarized in his Master’s Thesis, titled, Self-Drilling Screw
connections in Low Ductility Light Gage Steel. Daudet investigated double-lap and
single-lap shear connections that used self-drilling screws. The steel used in the study
included both normal and low ductility sheets with thickness of 0.029 in., 0.037 in., 0.04
in., 0.043 in., 0.050 in. and 0.054 in.
The studies include both single- screw and two- screw connections with screw
sizes of No. 10, No. 12 and 0.25 in. screws.
In this study, the low ductility steel sheet tests data were evaluated with AISI and
Australian equations. Besides all the tests data from Daudet being evaluated together, the
data was divided into sub-groups according to screw-sizes and also evaluated.
Table 4.9 summarizes all of this data, showing the number of tests, the mean,
standard deviation and coefficient of variation for the Daudet tests data for each screw
sizes.
The statistical analysis shows the same Mean, Standard deviation and Coefficient
of variation values for all the 111 tests data using the two methods in question. In
analyzing the screws by there sizes, it shows also the same values for the two methods in
question.

8/4/2019 Strength of Screw Connections Subject to Shear Force
http://slidepdf.com/reader/full/strength-of-screw-connections-subject-to-shear-force 31/34
27
TABLE 4.9- University of Pittsburgh (Daudet) test data comparison
AISI METHOD Pt /Pns ROGERS & HANCOCK
METHOD
Pt /Pns
ALL DATA ALL DATA
No 111 No 111
Mean 0.866 Mean 0.866
Standard Deviation 0.168 Standard Deviation 0.168
Coefficient of Variation 0.193 Coefficient of Variation 0.193
0.188in (Screw diameter) 0.188in (Screw diameter)
No 24 No 24
Mean 0.847 Mean 0.847
Standard Deviation 0.169 Standard Deviation 0.169
Coefficient of Variation 0.199 Coefficient of Variation 0.199
0.190in (Screw diameter) 0.190in (Screw diameter) No 18 No 18
Mean 0.854 Mean 0.854
Standard Deviation 0.169 Standard Deviation 0.169
Coefficient of Variation 0.198 Coefficient of Variation 0.198
0.210in (Screw diameter) 0.210in (Screw diameter)
No 12 No 12
Mean 0.848 Mean 0.848
Standard Deviation 0.150 Standard Deviation 0.150
Coefficient of Variation 0.177 Coefficient of Variation 0.177
0.212in (Screw diameter) 0.212in (Screw diameter)
No 30 No 30
Mean 0.916 Mean 0.916
Standard Deviation 0.172 Standard Deviation 0.172
Coefficient of Variation 0.188 Coefficient of Variation 0.188
0.240in (Screw diameter) 0.240in (Screw diameter)
No 12 No 12
Mean 0.926 Mean 0.926
Standard Deviation 0.126 Standard Deviation 0.126
Coefficient of Variation 0.136 Coefficient of Variation 0.136
0.243in (Screw diameter) 0.243in (Screw diameter)
No 15 No 15Mean 0.780 Mean 0.780
Standard Deviation 0.173 Standard Deviation 0.173
Coefficient of Variation 0.222 Coefficient of Variation 0.222

8/4/2019 Strength of Screw Connections Subject to Shear Force
http://slidepdf.com/reader/full/strength-of-screw-connections-subject-to-shear-force 32/34
28
5. CONCLUSIONS
A total of 1890 test data from six different sources (235 in low ductility and 1655
in normal ductility steels) were analyzed using both the AISI equations and the equations
from Rogers and Hancock at the University of Sydney.
Based on the data analysis, the following design recommendations were deduced:
1. For connections within two to seven screws in low or normal ductility steels,
Rogers and Hancock equations provide a marginally more accurate prediction of
the connection strength.
2. For connection with more than seven screws in low and normal ductility steels,
Rogers and Hancock equations should be multiplied by a reduction of 0.85. The
0.85 reduction factor is based on tests by Sokol in which it was determined that as
the number of screws increased the connection capacity was not proportional to
the number of screws in the connection. Although Rogers and Hancock tested
connections with four or fewer screws, based on engineering judgment the 0.85
reduction is recommended to be applied to the Rogers and Hancock equations.
3. For single screw connections with normal ductility steels, Rogers and Hancock
equations are marginally more accurate prediction of the connection strength.
4. For connections with a single screw in low ductility steel, Rogers and Hancock
equations should be multiplied by a reduction of 0.85.
5. The equations are valid for self-drilling and self-tapping screws.

8/4/2019 Strength of Screw Connections Subject to Shear Force
http://slidepdf.com/reader/full/strength-of-screw-connections-subject-to-shear-force 33/34
29
BIBLIOGRAPHY
American Iron and Steel Institute (2001), North American Specification for the
Design of Cold-Formed Steel Structural Members, Washington, D.C.
Daudet, R.L. (1996), “Self-Drilling Screw Connections in Low Ductility Light
Gage Steel,” submitted to the Graduate Faculty at the University of
Pittsburgh in partial fulfillment for the degree Master of Science in Civil
Engineering.
Eastman, R.W. (1976), Report on Screw Fastened Sheet Steel Connections, Two
Volumes, Report for Canadian Steel Industries Construction Council, DOFASCO,Hamilton, Canada.
Janusz, M., Sledz, M. and Moravek, S. (1979), Teks Fasteners, Pullout and ShearCharacteristics In Various Thicknesses of Steels, Second Edition, Buildex
Division-Illinois Tools Works, Inc.
Pekoz, T. (1990), “Design of Cold-Formed Steel Screw Connections, Proceedings of theTenth International Specialty Conference on Cold-Formed Steel Structures,
Department of Civil Engineering, University of Missouri-Rolla
Rogers, C.A.and Hancock, G.J.(1997) “Screwed Connection tests of Thin G550 and
G300 Sheet Steels,” Centre for Advanced Structural Engineering, Department of Civil Engineering, University of Sydney, Australia, December.
SAE J78 Self Drilling Tapping Screws (SAE, REV 1998) Society of AutomotiveEngineers, Warrendale, Pennsylvania.
Sokol, A.M (1998)., “Determination of the Tensile and Shear Strengths of ScrewsAnd The Effect of Screw Patterns on Cold-Formed Steel Connections,”
Civil Engineering Study 98-3, University of Missouri-Rolla.
Sommerstein, M. and Mandelzys, B. (1996). Vicwest Fasteners Manual, Vicwest- ADivision of Jannock Steel Fabricating Company.
Test Method for Mechanically Fastened Cold-Formed Steel Connections (2002),American Iron and Steel Institute, Washington, D.C.

8/4/2019 Strength of Screw Connections Subject to Shear Force
http://slidepdf.com/reader/full/strength-of-screw-connections-subject-to-shear-force 34/34
American Iron and Steel Institute
1140 Connecticut Avenue, NW
Suite 705
Washington, DC 20036
www.steel.org
R e s e a r c h
R e p o r t
R P - 0 4 - 2