STRENGTH DEVELOPMENT VERSUS PROCESS DATA · PDF fileUltrasonic welding of thermoplastic...
27
Submitted to Composites Part A: Applied Science and Manufacturing 1 STRENGTH DEVELOPMENT VERSUS PROCESS DATA IN ULTRASONIC WELDING OF THERMOPLASTIC COMPOSITES WITH FLAT ENERGY DIRECTORS AND ITS APPLICATION TO THE DEFINITION OF OPTIMUM PROCESSING PARAMETERS Irene Fernandez Villegas* Structural Integrity and Composites, Delft University of Technology *Corresponding author: Kluyverweg 1, 2629 HS Delft, The Netherlands T: 0031152789745 F: 0031152781151 [email protected] Abstract Ultrasonic welding of thermoplastic composites is a very interesting joining technique as a result of good quality joints, very short welding times and the fact that no foreign material, e.g. a metal mesh, is required at the welding interface in any case. This paper describes one further advantage, the ability to relate weld strength to the welding process data, namely dissipated power and displacement of the sonotrode, in ultrasonic welding of thermoplastic composite parts with flat energy directors. This relationship, combined with displacement-controlled welding, allows for fast definition of optimum welding parameters which consistently result in high-strength welded joints. Keywords: A. Thermoplastic resin; B. Mechanical Properties; E. Assembly; E. Joints/Joining 1 Introduction Ultrasonic welding is a very attractive assembling technique for thermoplastic composites since it is very fast, it does not require the use of foreign materials, e.g. a metal mesh, at the welding interface regardless the nature of the material being welded and it provides excellent quality joints. It is very well suited for the welding of small areas and it can, in principle, be applied in a sequential manner for the welding of larger areas [1]. The main points of attention for ultrasonic welding are that specific joint designs are generally needed to concentrate the ultrasonic energy at the welding interface, the welding
-
Upload
dinhnguyet -
Category
Documents
-
view
218 -
download
1
Transcript of STRENGTH DEVELOPMENT VERSUS PROCESS DATA · PDF fileUltrasonic welding of thermoplastic...

Submitted to Composites Part A: Applied Science and Manufacturing
1
STRENGTH DEVELOPMENT VERSUS PROCESS DATA IN ULTRASONIC WELDING OF
THERMOPLASTIC COMPOSITES WITH FLAT ENERGY DIRECTORS AND ITS
APPLICATION TO THE DEFINITION OF OPTIMUM PROCESSING PARAMETERS
Irene Fernandez Villegas*
Structural Integrity and Composites, Delft University of Technology
*Corresponding author:
Kluyverweg 1, 2629 HS Delft, The Netherlands
T: 0031152789745
F: 0031152781151
Abstract
Ultrasonic welding of thermoplastic composites is a very interesting joining technique as a result of good
quality joints, very short welding times and the fact that no foreign material, e.g. a metal mesh, is required
at the welding interface in any case. This paper describes one further advantage, the ability to relate weld
strength to the welding process data, namely dissipated power and displacement of the sonotrode, in
ultrasonic welding of thermoplastic composite parts with flat energy directors. This relationship,
combined with displacement-controlled welding, allows for fast definition of optimum welding
parameters which consistently result in high-strength welded joints.
Keywords: A. Thermoplastic resin; B. Mechanical Properties; E. Assembly; E. Joints/Joining
1 Introduction
Ultrasonic welding is a very attractive assembling technique for thermoplastic composites since it is
very fast, it does not require the use of foreign materials, e.g. a metal mesh, at the welding interface
regardless the nature of the material being welded and it provides excellent quality joints. It is very well
suited for the welding of small areas and it can, in principle, be applied in a sequential manner for the
welding of larger areas [1]. The main points of attention for ultrasonic welding are that specific joint
designs are generally needed to concentrate the ultrasonic energy at the welding interface, the welding

2
parameters are highly coupled and it shows high sensitivity to tolerances and clamping of the parts to be
welded. Ultrasonic welding of unreinforced thermoplastic parts is an assembly process widely used in the
plastics industry [2]. As for its application to fibre-reinforced thermoplastic composites, ultrasonic
welding is common practice for stacking the individual pre-preg layers during hand lay-up , of which a
step beyond is automated fibre placement based on ultrasonic heating [3-5]. However, unlike other
techniques such as resistance or induction welding [6,7], ultrasonic welding has not been industrially
applied to the structural joining of thermoplastic composite parts. The development of robust welding
procedures based on the understanding of the process is deemed as a necessary step to increase the
readiness level of this technology, which, owing to the very short welding times, could be a very cost-
effective solution for the assembly of mass-produced parts such as clips and brackets in composite
aircrafts or composite automotive parts.
The ultrasonic welding process mainly consists of a vibration phase followed by a solidification
phase. Ultrasonic heat is generated during the vibration phase of the process upon the application of
pressure and of high-frequency (10 – 70 kHz) and low-amplitude (10-250 µm) vibrations transverse to the
parts to be welded [2]. The main heating mechanisms are surface friction and viscoelastic friction [8,9].
During the solidification phase, the weld is allowed to cool down under pressure below the glass
transition temperature Tg of the thermoplastic resin to achieve consolidation. The main process
parameters are:
(i) Welding force, amplitude of vibration and vibration time, for the vibration phase
(ii) Solidification force and solidification time, for the solidification phase
Mechanical vibration and welding and solidification forces are applied to the parts to be joined by means
of a sonotrode. The sonotrode is connected to a piezoelectric transducer through a booster. The
piezoelectric transducer generates mechanical vibration, which is amplified by the booster and the
sonotrode. The support collar of the transducer-booster-sonotrode system is attached to a pneumatic press
that provides vertical movement along with the welding and the solidification force.
Energy directors are used in ultrasonic welding to promote heat generation at the interface between
the parts to be joined. Energy directors are traditionally man-made resin protrusions on the welding
surfaces. As a result of their smaller cross section, they undergo higher strains during the welding process
and hence experience higher viscoelastic heating rates than the bulk material [10]. Unreinforced
thermoplastic parts intended to be assembled through ultrasonic welding are directly moulded with energy

3
directors on the joining surfaces. In the case of ultrasonic welding of thermoplastic composite parts,
energy directors made of the matrix resin have been traditionally moulded on the already consolidated
adherends in a secondary production step [11-14]. Based on regular procedures of the plastics industry,
these energy directors are usually linear ridges with triangular, rectangular or semi-circular cross sections
[15]. The shape, size, number and orientation of the energy directors have a major effect on the welding
process and its results, since they influence heat generation and resin flow at the welding interface [14,16-
18]. Quite recently Villegas has presented in [19] successful results obtained with flat energy directors
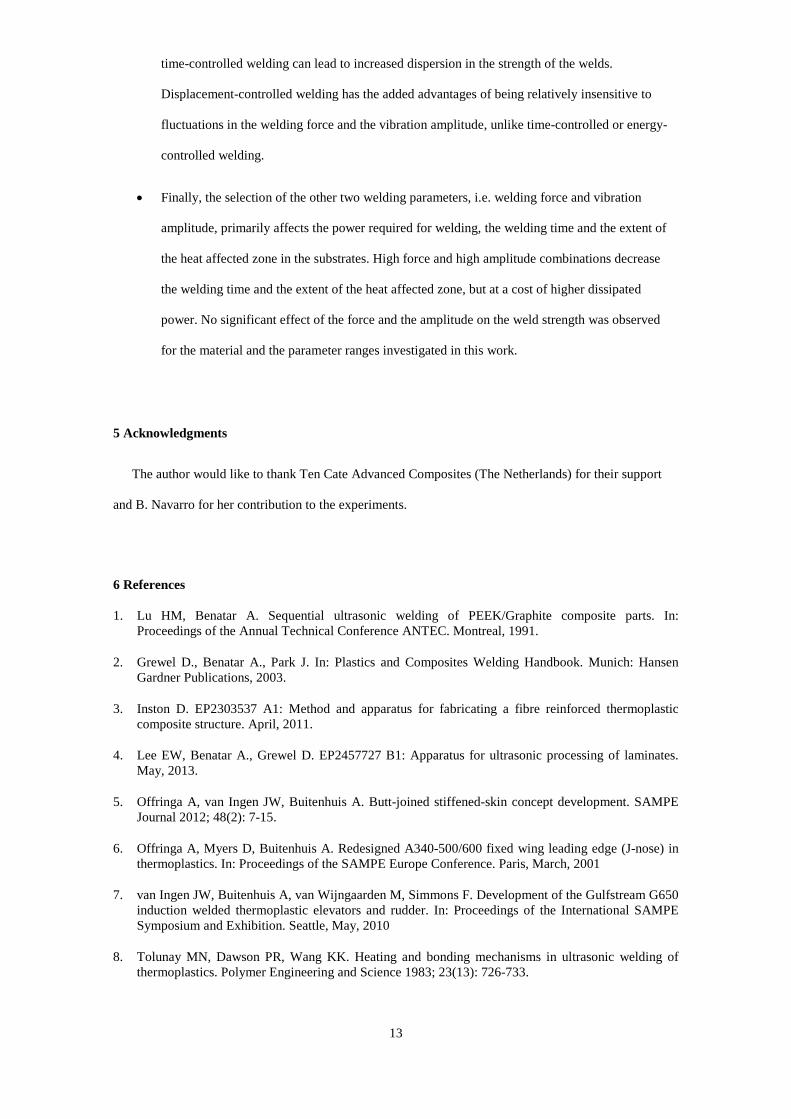
consisting of a loose matrix resin film placed at the welding interface (Figure 1(a)). Preferential heating of
the flat energy director occurs as a result of the lower compressive stiffness of the neat resin film as
compared to the stiffness of the composite adherends. The use of flat energy directors greatly simplifies
ultrasonic welding of thermoplastic composites and provides 100% welded areas without the need for
extensive optimisation of the interfaces, i. e. the definition of optimum shape, size, number and position
of the energy directors.
Apart from its high assembly rates, a significant advantage of ultrasonic welding of thermoplastic
composites as compared to other welding techniques is that it allows for in situ monitoring through
process data. This possibility was first indicated by Benatar and Gutowski in [11], who analysed changes
in the dissipated power and the acceleration of the base caused by the flow of triangular energy directors.
Villegas built on this idea and showed in [19] a clear correlation between the feedback of a
microprocessor-controlled welder and the physical changes at the welding interface for flat-energy-
director ultrasonic welding. In that study the dissipated power and the displacement of the sonotrode were
found to define five distinct stages within the vibration phase of the welding process as shown in Figure
1(b) and described in what follows.
•Stage 1: heating of the energy director without any observable physical changes at the welding interface.
This stage features a continuous increase of the dissipated power until a maximum is reached.
•Stage 2: the flat energy director starts to locally melt as a hot-spot nucleation and growth process.
Surface friction heating mostly controls the nucleation of hot spots and, as described in [9], it triggers the
viscoelastic heating mechanism, which has a predominant influence in the growth of hot spots. Stage 2 is
characterised by a power decrease while the displacement of the sonotrode stays constant.
4
•Stage 3: the whole energy director is molten. This stage is characterised by a simultaneous increase of
the power and by downward movement of the sonotrode (increased displacement in Figure 1(b)), which
pushes the uppermost adherend downwards and causes squeeze flow of the molten energy director.
•Stage 4: along with the flow of the energy director, the matrix in the uppermost layers of the composite
adherends starts to locally melt. This stage features a plateau in the dissipated power.
•Stage 5: melting of the matrix in the adherends is predominant in this stage, which is characterised by a
drop in the power.
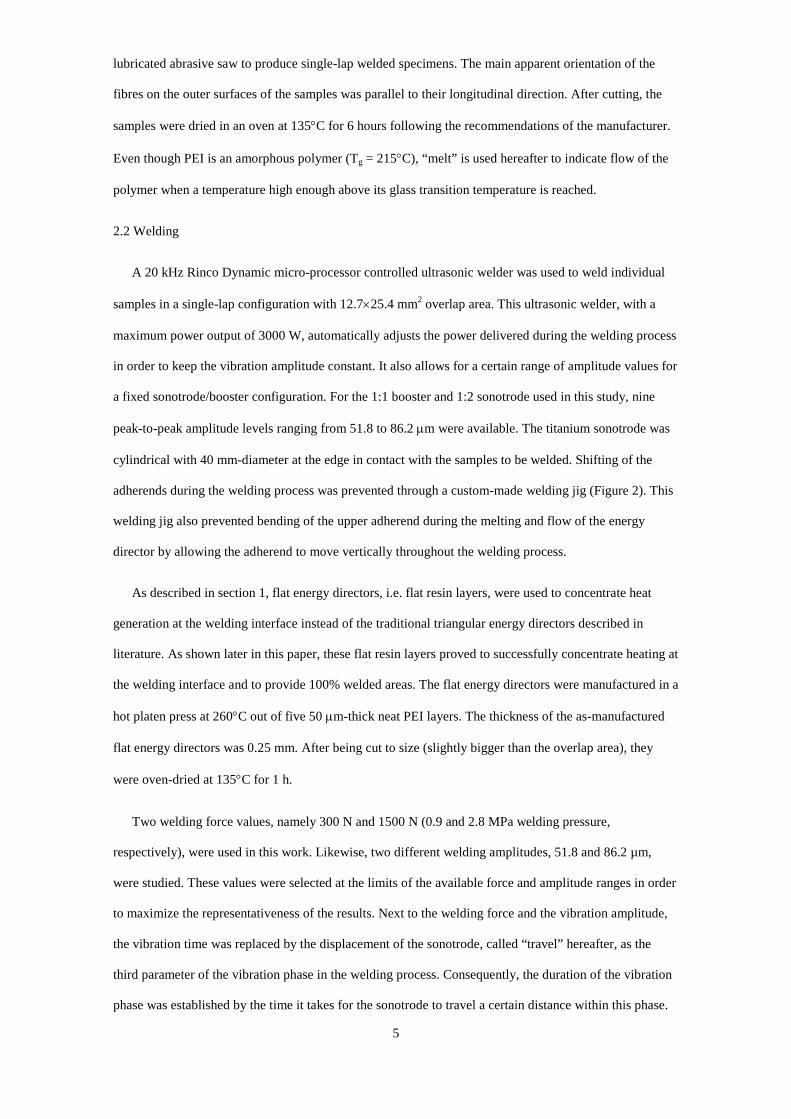
This paper goes one step beyond by investigating the applicability of the process data provided by the
welder to simplifying the definition of optimum process parameters in ultrasonic welding of thermoplastic
composites with flat energy directors. Optimum sets of process parameters, i.e. those that result in high-
strength welds, are usually defined for other welding techniques by correlating the temperature at the
welding interface and the pressure with the weld strength. This correlation usually involves extensive
experimental work and/or the development of heat transfer and consolidation models [20]. In the specific
case of ultrasonic welding there is an added complexity that derives from the difficulty of measuring
temperatures at the welding interface. If thermocouples are placed between the adherends they tend to act
as energy directors and therefore they significantly alter the process. The use of alternatives such as
infrared thermography is limited due to restricted access to the welding area, which remains covered by
the sonotrode during the entire process. This work has a two-fold aim: firstly, defining relationships
between the weld strength and the power and displacement data provided by the ultrasonic welder;
secondly, establishing a procedure that allows using such relation as a tool to consistently obtain high-
strength welds. A purely experimental approach is followed based on mechanical testing, fractography
and cross-sectional analysis.
2 Experimental
2.1 Adherends
The material used in this study was Cetex CF/PEI (carbon-fibre reinforced polyetherimide) with 5
harness satin fabric reinforcement, from Ten Cate Advanced Composites in The Netherlands. Laminates
with a [0/90]3S stacking sequence and 1.92 mm nominal final thickness were consolidated in a hot-platen
press at 320°C and 20 bar for 30 min. 100 mm x 25.4 mm samples were cut from the laminates with a
5
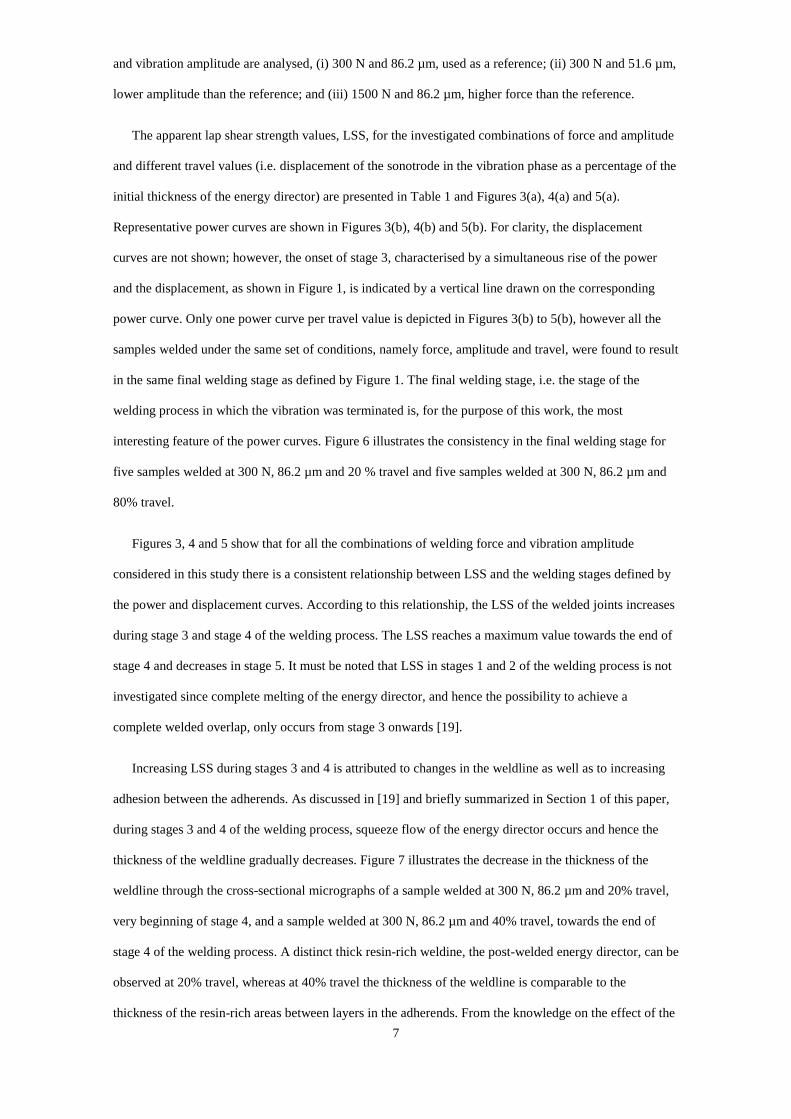
lubricated abrasive saw to produce single-lap welded specimens. The main apparent orientation of the
fibres on the outer surfaces of the samples was parallel to their longitudinal direction. After cutting, the
samples were dried in an oven at 135°C for 6 hours following the recommendations of the manufacturer.
Even though PEI is an amorphous polymer (Tg = 215°C), “melt” is used hereafter to indicate flow of the
polymer when a temperature high enough above its glass transition temperature is reached.
2.2 Welding
A 20 kHz Rinco Dynamic micro-processor controlled ultrasonic welder was used to weld individual
samples in a single-lap configuration with 12.7×25.4 mm2 overlap area. This ultrasonic welder, with a
maximum power output of 3000 W, automatically adjusts the power delivered during the welding process
in order to keep the vibration amplitude constant. It also allows for a certain range of amplitude values for
a fixed sonotrode/booster configuration. For the 1:1 booster and 1:2 sonotrode used in this study, nine
peak-to-peak amplitude levels ranging from 51.8 to 86.2 µm were available. The titanium sonotrode was
cylindrical with 40 mm-diameter at the edge in contact with the samples to be welded. Shifting of the
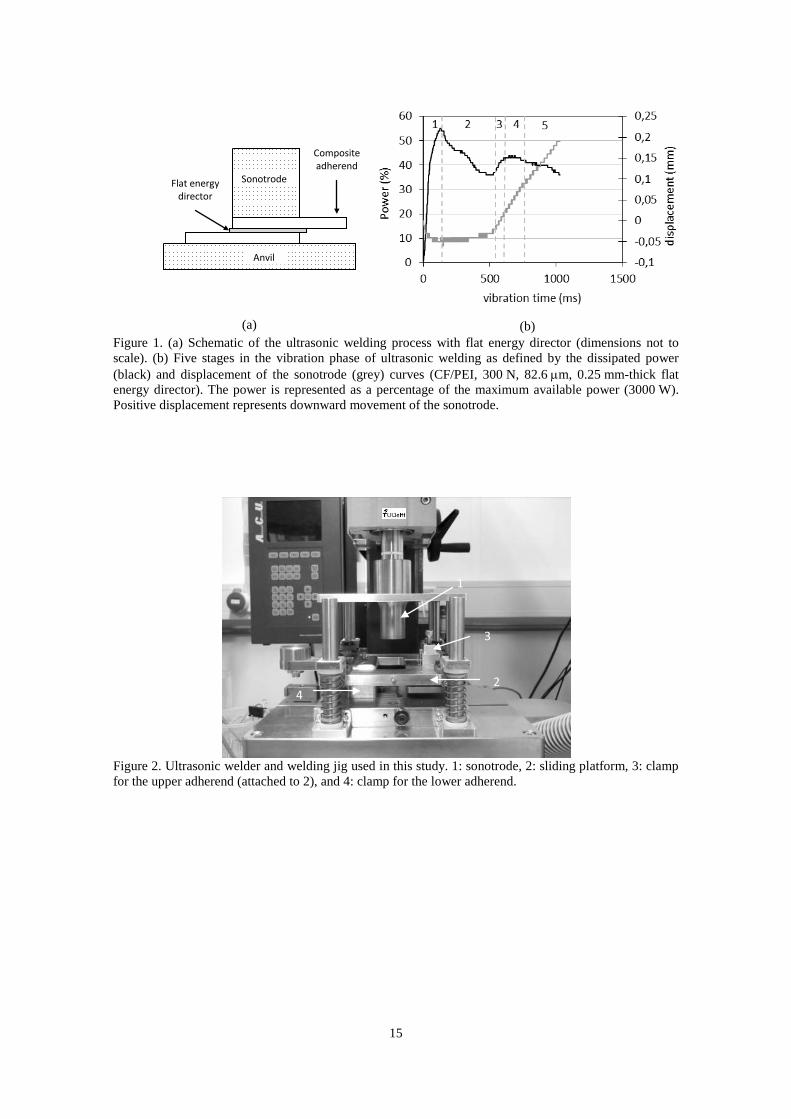
adherends during the welding process was prevented through a custom-made welding jig (Figure 2). This
welding jig also prevented bending of the upper adherend during the melting and flow of the energy
director by allowing the adherend to move vertically throughout the welding process.
As described in section 1, flat energy directors, i.e. flat resin layers, were used to concentrate heat
generation at the welding interface instead of the traditional triangular energy directors described in
literature. As shown later in this paper, these flat resin layers proved to successfully concentrate heating at
the welding interface and to provide 100% welded areas. The flat energy directors were manufactured in a
hot platen press at 260°C out of five 50 µm-thick neat PEI layers. The thickness of the as-manufactured
flat energy directors was 0.25 mm. After being cut to size (slightly bigger than the overlap area), they
were oven-dried at 135°C for 1 h.
Two welding force values, namely 300 N and 1500 N (0.9 and 2.8 MPa welding pressure,
respectively), were used in this work. Likewise, two different welding amplitudes, 51.8 and 86.2 µm,
were studied. These values were selected at the limits of the available force and amplitude ranges in order
to maximize the representativeness of the results. Next to the welding force and the vibration amplitude,
the vibration time was replaced by the displacement of the sonotrode, called “travel” hereafter, as the
third parameter of the vibration phase in the welding process. Consequently, the duration of the vibration
phase was established by the time it takes for the sonotrode to travel a certain distance within this phase.

6
Displacement-controlled welding, enabled by modern ultrasonic welders, was found to have several
advantages over time-controlled and energy-controlled welding, which will be discussed later in this
paper. In order to provide the duration of the vibration phase with a clear physical meaning, travel was
expressed in this work as a percentage of the thickness of the as-manufactured energy director, i.e.
0.25 mm. It must be noted however that at the beginning of the vibration phase the adherends and energy
director are already subjected to the welding pressure. Consequently the thickness of the energy director
at the beginning of the vibration phase is lower than 0.25 mm and squeeze flow of the complete energy
director will hence happen before 100% travel is reached. The solidification force and time were
respectively set to 1000 N (1.9 MPa solidification pressure) and 4 s for every set of welding parameters
based on previous experience.
2.3 Testing and evaluation
The single-lap welded samples were mechanically tested in a Zwick/Roell 250 KN universal testing
machine following the ASTM D1002 standard and with a crosshead speed of 0.13 mm/min. As an
alternative to the use of tabs, the grips of the testing machine were offset to ensure parallelism between
the load path and the weldline in every sample. The apparent single-lap shear strength (LSS) of the welds
was calculated as the maximum load divided by the total overlap area, i.e. 12.7×25.4 mm2. Five samples
were tested per set of welding conditions.
Micrographic cross-sections in the centre of the overlap were used to assess the changes at the
welding interface and in the composite adherends at different stages of the welding process. Likewise,
fractography was used to evaluate the main failure modes in the different welding conditions.
Finally, the dissipated power and the displacement of the sonotrode during the vibration phase of the
welding process were obtained as feedback from the ultrasonic welder. The welder also provided the total
vibration time and welding energy for each welded sample.
3 Results and discussion
3.1 Power/displacement curves and weld strength
This section investigates correlations between power and displacement curves and strength of the
welded joints. In order to do so, weld strength, power and displacement curves for samples welded at
different stages within the welding process are presented. Three different combinations of welding force
7
and vibration amplitude are analysed, (i) 300 N and 86.2 µm, used as a reference; (ii) 300 N and 51.6 µm,
lower amplitude than the reference; and (iii) 1500 N and 86.2 µm, higher force than the reference.
The apparent lap shear strength values, LSS, for the investigated combinations of force and amplitude
and different travel values (i.e. displacement of the sonotrode in the vibration phase as a percentage of the
initial thickness of the energy director) are presented in Table 1 and Figures 3(a), 4(a) and 5(a).
Representative power curves are shown in Figures 3(b), 4(b) and 5(b). For clarity, the displacement
curves are not shown; however, the onset of stage 3, characterised by a simultaneous rise of the power
and the displacement, as shown in Figure 1, is indicated by a vertical line drawn on the corresponding
power curve. Only one power curve per travel value is depicted in Figures 3(b) to 5(b), however all the
samples welded under the same set of conditions, namely force, amplitude and travel, were found to result
in the same final welding stage as defined by Figure 1. The final welding stage, i.e. the stage of the
welding process in which the vibration was terminated is, for the purpose of this work, the most
interesting feature of the power curves. Figure 6 illustrates the consistency in the final welding stage for
five samples welded at 300 N, 86.2 µm and 20 % travel and five samples welded at 300 N, 86.2 µm and
80% travel.
Figures 3, 4 and 5 show that for all the combinations of welding force and vibration amplitude
considered in this study there is a consistent relationship between LSS and the welding stages defined by
the power and displacement curves. According to this relationship, the LSS of the welded joints increases
during stage 3 and stage 4 of the welding process. The LSS reaches a maximum value towards the end of
stage 4 and decreases in stage 5. It must be noted that LSS in stages 1 and 2 of the welding process is not
investigated since complete melting of the energy director, and hence the possibility to achieve a
complete welded overlap, only occurs from stage 3 onwards [19].
Increasing LSS during stages 3 and 4 is attributed to changes in the weldline as well as to increasing
adhesion between the adherends. As discussed in [19] and briefly summarized in Section 1 of this paper,
during stages 3 and 4 of the welding process, squeeze flow of the energy director occurs and hence the
thickness of the weldline gradually decreases. Figure 7 illustrates the decrease in the thickness of the
weldline through the cross-sectional micrographs of a sample welded at 300 N, 86.2 µm and 20% travel,
very beginning of stage 4, and a sample welded at 300 N, 86.2 µm and 40% travel, towards the end of
stage 4 of the welding process. A distinct thick resin-rich weldine, the post-welded energy director, can be
observed at 20% travel, whereas at 40% travel the thickness of the weldline is comparable to the
thickness of the resin-rich areas between layers in the adherends. From the knowledge on the effect of the

8
bondline thickness on the strength of adhesive bonded joints [21], the decrease in the thickness of the
weldine can be expected to reduce to a certain extent the peak stresses at the edges of the overlap in
single-lap joints and hence to contribute to the increase of the apparent lap shear strength. As what
concerns the evolution of the adhesion, not only is stage 4 of the welding process characterised by
squeeze flow of the energy director but also by local melting of the resin within the adherends.
Consequently, molecular inter-diffusion, and therefore enhanced adhesion occur in stage 4. The fracture
surfaces in Figures 8 to 10 for 300 N force, 86.2 µm amplitude and 12%, 20% and 40% travel,
respectively, illustrate the evolution of the adhesion during stages 3 and 4. In stage 3, bonds are created
between the energy director and the resin on the outermost surface of the adherends. The corresponding
fracture surfaces hence show the post-welded energy director mostly covered by fibre imprints on one
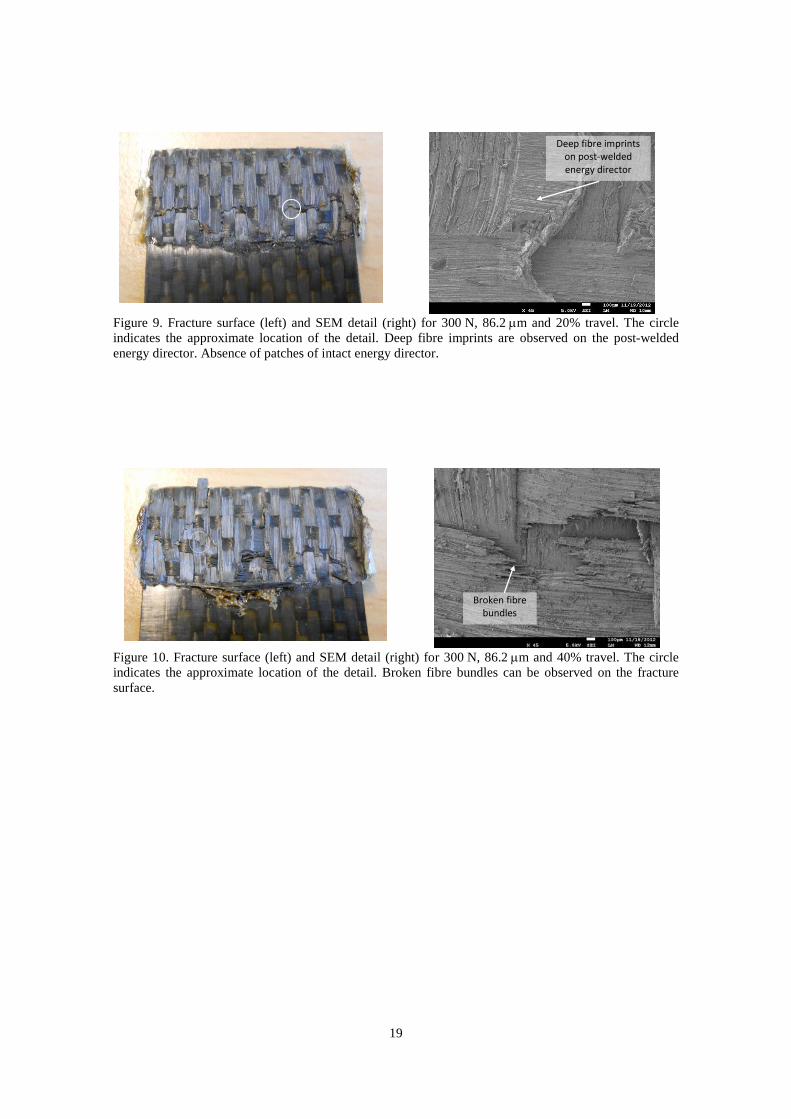
side and relatively bare, unbroken fibre bundles on the other side (Figure 8). As travel increases, the
imprints of the fibres on the post-welded energy director become deeper and patches of intact energy
director, which could be observed at a shorter travel (Figure 8), are no longer found (Figure 9). Further on
in stage 4, broken fibre bundles are present on the fracture surfaces (Figure 10) as a result of the enhanced
adhesion enabled by diffusion of the polymer chains from the welding interface deeper into the
adherends.
Decreasing LSS in stage 5 could be, in opinion of the author, at least partially attributed to fibre
deformation in the adherends as a consequence of the welding process. Stage 5 is primarily characterised
by melting and flow of the resin within the adherends [19]. Therefore, as welding progresses within stage
5, there is an increasing amount of fibre bundles surrounded by molten resin, and hence unsupported,
which will deform under the applied vibration. Fibre-bundle deformation, invariably observed in stage-5
fracture surfaces, shows different degrees for different processing conditions. For instance, decreasing the
amplitude of vibration plausibly leads to decreased fibre deformation as shown in the fracture surfaces of
Figure 11. This decreased fibre deformation did not however result in significant LSS differences.
Another phenomenon which could also affect the LSS, observed already towards the end of stage 4 but
mostly within stage 5, is kinking of the uppermost layers of the adherends and increased resin flash due to
local flow of the matrix at the edges of the overlap [19] (see Figure 12). The exact effect of these kinks
and the resin flash in the stress distribution during lap shear testing, and therefore their effect in the LSS,
is unknown. Finally, local porosity often observed in the vicinity of the kinks (see Figure 12), is suspected
to act as a location for failure initiation resulting in the occurrence of local deep laminate tearing

9
especially for early stage-5 welds (see Figure 13). Further on in stage 5, no more deep tearing is observed
and failure occurs at the interface, most probably weakened by fibre-bundle deformation.
3.2 Displacement-controlled welding
As stated in the previous section, the strongest welds with minimum fibre deformation are obtained in
stage 4 of the welding process as defined by the power and displacement curves. It was also shown that
displacement-controlled welding allows us to consistently obtain welds in the same stage of the welding
process given a fixed set of welding conditions, namely force, amplitude and travel. This section
evaluates the suitability of time-controlled and energy-controlled welding as compared to displacement-
controlled welding based on scatter, sensitivity to the welding configuration and robustness.
Lap shear strength, LSS, of the welds versus vibration time, welding energy and travel, are plotted in
Figures 14, 15 and 16 respectively. It must be noted that neither time nor energy-controlled welding was
performed in this research and hence the time and energy values plotted in the x-axis in Figures 14 and
15, result from the different force, amplitude and travel combinations investigated, as presented in Table
2.
One of the main observations with regards to the dispersion of the results is that, especially for low
force and low amplitude, 300 N and 51.8 µm in this study, the vibration time for a given travel value
shows significant scatter (Figure 14). The scatter in the vibration time is mostly related to differences in
how long it takes to melt the complete energy director, i.e. the duration of stage 2 (Figure 1). As
explained in [19], variations in the time required to melt the energy directors result from the fact that
heating of a flat energy director is triggered by surface friction [9]. The onset of the heating process hence
depends on the actual degree of contact between the energy director and the adherends, which particularly
for low welding forces varies substantially from sample to sample. As a result of the scatter in the
vibration time, using time-controlled welding will likely result in welds at different stages of the welding
process and thus at different levels of strength development, as also inferred from Figure 6. Time-
controlled welding is hence expected to lead to significant scatter in the weld strength as opposed to
displacement-controlled welding.
The dispersion of the welding energy for a given travel value is smaller than that of the vibration time
(Figure 15). From this standpoint, the welding energy is a more suitable controlling parameter than the
vibration time, as also indicated by Harras et al. in [13]. Nevertheless, the welding energy computed by

10
the ultrasonic welder not only does comprise the energy actually used to create the weld but also the
energy dissipated in the adherends, the welding fixture and the base [11]. Therefore changing the welding
configuration would need the optimum welding energy, i.e. the welding energy that results in maximum
weld strength, to be redefined. Contrarily, the optimum travel is chiefly related to the physical changes
occurring at the welding interface and therefore independent of the energy dissipated in the surroundings.
Consequently, the optimum travel, in displacement-controlled welding, is expected to be relatively
insensitive to changes in the welding configuration as opposed to the optimum welding energy, in energy-
controlled welding. To validate this assertion, adherends twice as thick as the regular adherends in this
work were welded at 300 N welding force and 86.2 µm vibration amplitude. Displacement-controlled
welding with 40% travel, which, as shown in Table 1 is the travel that lead to the highest LSS for the
thinner adherends under 300 N and 86.2 µm, was used. As expected, this combination of parameters
resulted also for the thick samples in optimum, stage-4 welds (see Figure 17) and same failure mode as
the thinner samples. The dissipated energy was however around 17% higher for the thick samples than for
the thin samples (see Table 3), which is a significant difference similar to the energy gap between
consecutive welding stages as shown in Table 2 for 300 N and 86.2 µm. These significant differences in
the welding energy for the thick and thin samples indicate that if an energy-controlled process had been
used, the changes in adherend thickness should have been accompanied by changes in the value of the
controlling parameter in order to result in optimum, maximum weld strength.
As what concerns the robustness of the welding process, Figure 16 and Table 1 show the existence of
some differences in the evolution of LSS versus travel especially for the high force and high amplitude
combination, 1500 N and 86.2 µm, as compared to the low-force, 300 N, cases. A certain delay in the
travel-wise evolution of LSS for high force and high amplitude conditions is believed to result from
notably faster resin squeeze flow at the interface as well as a lower actual thickness of the energy director
at the beginning of the vibration. Nevertheless, it must be noted that these minor differences in LSS
evolution correspond to substantial changes in the welding force and the vibration amplitude. Therefore,
fluctuations in the force and the amplitude during normal welding operations are not expected to have a
significant impact in the strength of the welds for a certain fixed travel. Moreover, the LSS versus travel
curves are relatively flat in the extensive travel range investigated. Consequently, potential travel
fluctuations are not expected to have a substantial effect in the LSS either. On the contrary, in time-
controlled or energy-controlled welding, the weld strength is much more sensitive, especially to changes

11
in the force or the amplitude, as indicated by Figures 14 and 15. It can be hence stated that displacement-
controlled welding is a more robust procedure than either time-controlled or energy-controlled welding.
3.3 Welding force and vibration amplitude
As discussed so far, for each combination of welding force and vibration amplitude the highest weld
strength is achieved in the stage 4 of the power curve. An optimum travel value can then be defined
which, in a displacement-controlled welding, will consistently lead to stage-4, and thus high-strength,
welds. This section elaborates on the effects of the other two main process parameters, namely the
welding force and the vibration amplitude, in the welding process and the weld quality. Since the
maximum strength attainable is fairly independent of the force/amplitude combination, as seen in Figure
16, the main outputs discussed in this section are the dissipated power, the vibration time and the extent
of the heat affected zone (HAZ) in the adherends.
Changes in the welding force and in the vibration amplitude are known to have a significant effect in
the dissipated power and in the vibration time [19]. As depicted in Figure 18 and Table 2, increasing
either the amplitude or the welding force results in higher dissipated power and in much faster heating
rates at the welding interface, which decreases the vibration time for a given travel value. Therefore,
selection of the welding force and/or the vibration amplitude has a direct impact in the welding process. A
high force and high amplitude combination leads to faster welding but, at the same time, increases the
power requirement, which hence limits the maximum size of the area that can be welded in one step [19].
Moreover the welding force and the amplitude of vibration were found to have a significant effect on
the HAZ in the adherends. Figure 19 shows cross-sectional micrographs of samples not consolidated after
vibration. Deconsolidation voids, observed where the temperature exceeded the Tg of the matrix in the
adherends, indicate the extension of the HAZ. The high force and high amplitude combination resulted in
the smallest HAZ. The small HAZ is attributed to very fast heating and thus a very short time for the heat
generated at the energy director to be transferred into the substrates. Differences in the extent of the HAZ
are expected to lead to differences in the residual stresses in the welds. Residual stresses and strains are of
great importance in structural welding and should be investigated in further research. On the other hand, a
very restricted HAZ limits the volume of resin that participates in the molecular inter-diffusion process
which ensures proper adhesion. Therefore it could lead to weaker welds although no significant drop in
maximum LSS for high force and high amplitude conditions was observed in this work.

12
4 Conclusions
This paper investigated the development of weld strength in ultrasonic welding of continuous-fibre
reinforced thermoplastic composites, namely carbon fibre fabric/polyetherimide, with flat energy
directors. Weld strength, morphology of the joints and failure modes were analysed at relevant stages of
the welding process as defined by the dissipated power and the displacement of the sonotrode. The main
goal was to determine whether and how the feedback from the ultrasonic welder on power and
displacement can be used to define sets of welding conditions, namely welding force, vibration amplitude
and vibration time, for maximum strength welds. The main conclusions of this fully experimental
research work are the following:
• There is a consistent relationship between the weld strength and stages 3 to 5 of the vibration
phase of the welding process. Weld strength gradually increases during stages 3 and 4, stage 3
being characterised by flow of the energy director and stage 4 by simultaneous flow of the
energy director and melting of the matrix in the uppermost layers of the adherends. Contrarily,
weld strength decreases during stage 5, where mostly melting of the matrix in the adherends
occurs. The increase of weld strength, quantified through single lap shear tests, is attributed to
the decrease of the weldline thickness and to the increase of adhesion in the form of molecular
inter-diffusion at the welding interface. The decrease of weld strength is mostly attributed to
deformation of the fibre bundles under vibration.
• Maximum weld strength is achieved within stage 4 of the welding process, which therefore
constitutes a target for optimum welding conditions. For each given combination of welding
force and vibration amplitude, the power and displacement curves provide a range of vibration
times, or alternatively a range of sonotrode displacement values, which delimits stage 4.
Therefore, once the welding force and the vibration amplitude have been set, the third parameter
governing the vibration phase of the welding process, namely the duration of the vibration phase,
can be chosen based on power and displacement data.
• Indirectly controlling the duration of the vibration phase through the displacement of the
sonotrode, i.e. displacement-controlled welding, leads to welds within the same process stage.
Consequently, stage-4, and hence, high-strength welds are consistently obtained for a certain
optimal travel or displacement value defined by the power and displacement curves. If the
vibration time is used instead, it is likely that welds at different stages are obtained and therefore
13
time-controlled welding can lead to increased dispersion in the strength of the welds.
Displacement-controlled welding has the added advantages of being relatively insensitive to
fluctuations in the welding force and the vibration amplitude, unlike time-controlled or energy-
controlled welding.
• Finally, the selection of the other two welding parameters, i.e. welding force and vibration
amplitude, primarily affects the power required for welding, the welding time and the extent of
the heat affected zone in the substrates. High force and high amplitude combinations decrease
the welding time and the extent of the heat affected zone, but at a cost of higher dissipated
power. No significant effect of the force and the amplitude on the weld strength was observed
for the material and the parameter ranges investigated in this work.
5 Acknowledgments
The author would like to thank Ten Cate Advanced Composites (The Netherlands) for their support
and B. Navarro for her contribution to the experiments.
6 References
1. Lu HM, Benatar A. Sequential ultrasonic welding of PEEK/Graphite composite parts. In: Proceedings of the Annual Technical Conference ANTEC. Montreal, 1991.
2. Grewel D., Benatar A., Park J. In: Plastics and Composites Welding Handbook. Munich: Hansen Gardner Publications, 2003.
3. Inston D. EP2303537 A1: Method and apparatus for fabricating a fibre reinforced thermoplastic composite structure. April, 2011.
4. Lee EW, Benatar A., Grewel D. EP2457727 B1: Apparatus for ultrasonic processing of laminates. May, 2013.
5. Offringa A, van Ingen JW, Buitenhuis A. Butt-joined stiffened-skin concept development. SAMPE Journal 2012; 48(2): 7-15.
6. Offringa A, Myers D, Buitenhuis A. Redesigned A340-500/600 fixed wing leading edge (J-nose) in thermoplastics. In: Proceedings of the SAMPE Europe Conference. Paris, March, 2001
7. van Ingen JW, Buitenhuis A, van Wijngaarden M, Simmons F. Development of the Gulfstream G650 induction welded thermoplastic elevators and rudder. In: Proceedings of the International SAMPE Symposium and Exhibition. Seattle, May, 2010
8. Tolunay MN, Dawson PR, Wang KK. Heating and bonding mechanisms in ultrasonic welding of thermoplastics. Polymer Engineering and Science 1983; 23(13): 726-733.

14
9. Zhang Z, Wang X, Luo Y, Zhang Z, Wang L. Study on heating process of ultrasonic welding for thermoplastics. Journal of Thermoplastic Composite Materials 2010; 23(5): 647-664.
10. Potente H. Ultrasonic Welding – Principles and Theory. Materials and Design 1984; 5(5): 228-234.
11. Benatar A, Gutowski TG. Ultrasonic welding of PEEK graphite APC-2 composites. Polymer Engineering and Science 1989; 29(23): 1705-1721.
12. Eveno EC, Gillespie JW Jr. Experimental investigation of ultrasonic welding of graphite reinforced polyetheretherketone composites. In: Proceedings of National SAMPE Technical Conference. Atlantic City, 1989.
13. Harras BK, Cole C, Vu-Khanh T. Optimization of the ultrasonic welding of PEEK-carbon composites. Journal of Reinforced Plastics and Composites 1996; 15(2): 174-182.
14. Liu SJ, Chang IT. Factors affecting the joint strength of ultrasonically welded polypropylene composites. Polymer Composites 2001; 22(1):132-141.
15. Huang Y. Study on design of welding joint and structure of welding based on ultrasonic welding theory. Applied mechanics and materials 2012; 101-102: 871-875.
16. Chuan YK, Chien LH, Chang BC, Liu SJ. Effects of the shape of the energy director on far-field ultrasonic welding of thermoplastics. Polymer Engineering and Science, Januay 2000; 40(1): 157-167.
17. Villegas I. F., Bersee H.E.N. Ultrasonic welding of advanced thermoplastic composites: an investigation on energy-directing surfaces. Advances in Polymer Technology 2010; 29(2): 112-121.
18. Levy A, Le Corre S, Poitou A. Ultrasonic welding of thermoplastic composites: a numerical analysis of the mesoscopic scale relating processing parameters, flow of polymer and quality of adhesion, International Journal of Material Forming 2014; 7(1):39-51.
19. Villegas I. F. In situ monitoring of ultrasonic welding of thermoplastic composites through power and displacement data. Journal of Thermoplastic Composites 2013;http://dx.doi.org/10.1177/0892705712475015 (in press).
20. Ageorges C., Ye L., Hou M.. Advances in fusion bonding techniques for joining thermoplastic matrix composites: a review. Composites Part A 2001; 32; 839-852.
21. Gleich DM, van Tooren MJL, Beukers A. Analysis and evaluation of bondline thickness effects on failure load in adhesively bonded structures. Journal of Adhesion Science and Technology 2001; 15(9): 1901-1101.
22. Guess TR, Allred RE, Gerstle FP Jr. Comparison of lap shear test specimens. Journal of testing and evaluation 1977; 5(3): 84-93.
15
(a)
(b) Figure 1. (a) Schematic of the ultrasonic welding process with flat energy director (dimensions not to scale). (b) Five stages in the vibration phase of ultrasonic welding as defined by the dissipated power (black) and displacement of the sonotrode (grey) curves (CF/PEI, 300 N, 82.6 µm, 0.25 mm-thick flat energy director). The power is represented as a percentage of the maximum available power (3000 W). Positive displacement represents downward movement of the sonotrode.
Figure 2. Ultrasonic welder and welding jig used in this study. 1: sonotrode, 2: sliding platform, 3: clamp for the upper adherend (attached to 2), and 4: clamp for the lower adherend.
1
3
2 4
Sonotrode
Anvil
Flat energy director
Composite adherend
16
(a)
(b)
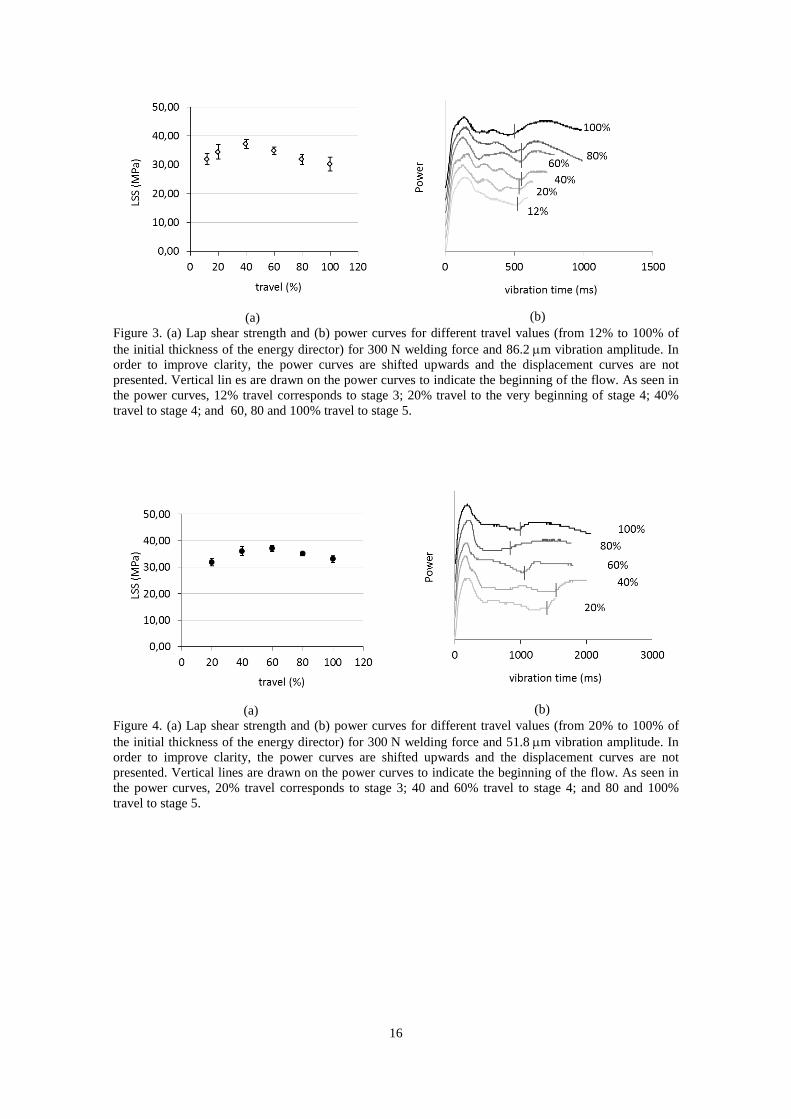
Figure 3. (a) Lap shear strength and (b) power curves for different travel values (from 12% to 100% of the initial thickness of the energy director) for 300 N welding force and 86.2 µm vibration amplitude. In order to improve clarity, the power curves are shifted upwards and the displacement curves are not presented. Vertical lin es are drawn on the power curves to indicate the beginning of the flow. As seen in the power curves, 12% travel corresponds to stage 3; 20% travel to the very beginning of stage 4; 40% travel to stage 4; and 60, 80 and 100% travel to stage 5.
(a)
(b)
Figure 4. (a) Lap shear strength and (b) power curves for different travel values (from 20% to 100% of the initial thickness of the energy director) for 300 N welding force and 51.8 µm vibration amplitude. In order to improve clarity, the power curves are shifted upwards and the displacement curves are not presented. Vertical lines are drawn on the power curves to indicate the beginning of the flow. As seen in the power curves, 20% travel corresponds to stage 3; 40 and 60% travel to stage 4; and 80 and 100% travel to stage 5.

17
(a)
(b)
Figure 5. (a) Lap shear strength and (b) power curves for different travel values (from 20% to 100% of the initial thickness of the energy director) for 1500 N welding force and 86.2 µm vibration amplitude. In order to improve clarity, the power curves are shifted upwards and the displacement curves are not presented. Vertical lines are drawn on the power curves to indicate the beginning of the flow. As seen in the power curves, 20 and 40% travel correspond to stage 3; 60 and 80% travel to stage 4; and 100% travel corresponds to stage 5.
Figure 6. Power curves (shifted upwards) for different samples welded at 20% travel (left) and 80% travel (right), 300 N welding force and 86.2 µm vibration amplitude. The vertical lines indicate the beginning of the flow of the energy director as defined by the simultaneous increase of power and displacement.

18
Figure 7. Cross-section micrographs (centre of the overlap) for 20% travel (left) and 40% travel (right) at 300 N welding force and 86.2 µm. Arrows indicating the position of the weldline.
Figure 8. Fracture surface (left) and SEM detail (right) for 300 N, 86.2 µm and 12% travel. The circle indicates the approximate location of the detail. Fibre imprints are mostly observed on the surface of the post-welded energy director together with a patch of intact energy director.
Intact energy director Fibre imprints on post-welded energy director
19
Figure 9. Fracture surface (left) and SEM detail (right) for 300 N, 86.2 µm and 20% travel. The circle indicates the approximate location of the detail. Deep fibre imprints are observed on the post-welded energy director. Absence of patches of intact energy director.
Figure 10. Fracture surface (left) and SEM detail (right) for 300 N, 86.2 µm and 40% travel. The circle indicates the approximate location of the detail. Broken fibre bundles can be observed on the fracture surface.
Deep fibre imprints on post-welded energy director
Broken fibre bundles

20
Figure 11. Representative fracture surfaces showing fibre-bundle deformation for samples welded at 300 N force, 86.2 µm amplitude and 100% travel (left) and 300 N force, 51.8 µm amplitude and 100% travel (right).
Figure 12. Cross-section micrographs (edge of the overlap) for 60% travel (left) and 80% travel (right) at 300 N welding force and 86.2 µm vibration amplitude showing resin flash and kinking of the uppermost layers of the lower substrate at the edge of the overlap (highlighted with a dashed white line) and associated porosity.
Resin flash
Porosity in adherend
Resin flash
Porosity in adherend
21
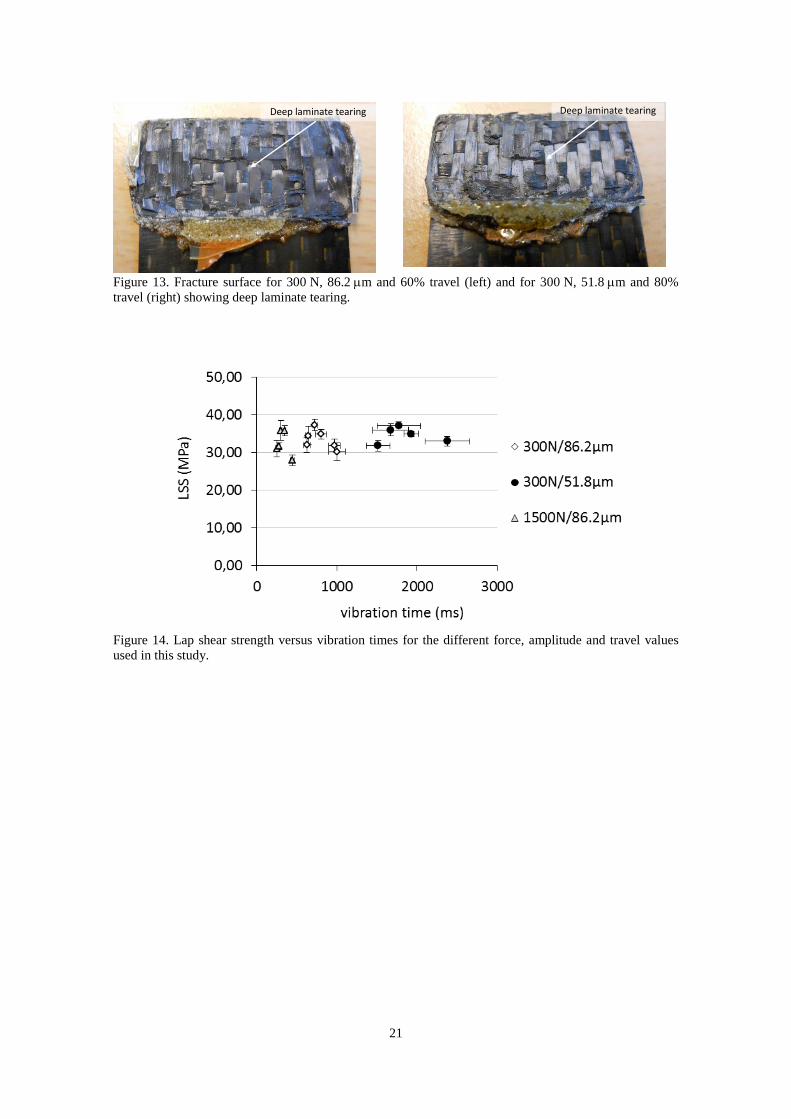
Figure 13. Fracture surface for 300 N, 86.2 µm and 60% travel (left) and for 300 N, 51.8 µm and 80% travel (right) showing deep laminate tearing.
Figure 14. Lap shear strength versus vibration times for the different force, amplitude and travel values used in this study.
Deep laminate tearing Deep laminate tearing
22
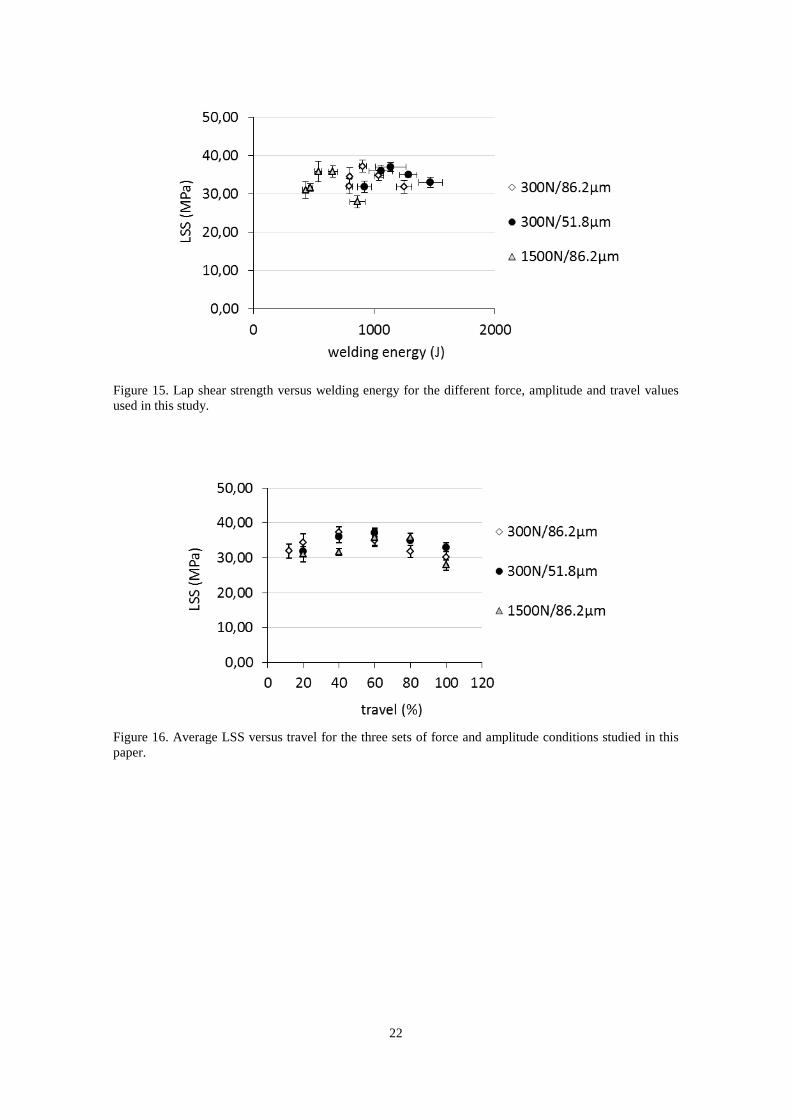
Figure 15. Lap shear strength versus welding energy for the different force, amplitude and travel values used in this study.
Figure 16. Average LSS versus travel for the three sets of force and amplitude conditions studied in this paper.

23
Figure 17. Representative power curves for 1.92 mm-thick adherends (black) and for 3.84-thick adherends (grey). The welding conditions are 300 N/86.2 µm and 40% travel in both cases. The beginning of the flow of the energy director is indicated by vertical lines.
Figure 18. Representative 100%-travel power curves for three combinations of welding parameters in this study, namely 300 N/86.2 µm, 300 N/51.8 µm, and 1500 N/86.2 µm. The onset of the flow of the energy director is depicted as a vertical line on each power curve. The power is computed as a percentage of the maximum available power, 3000W.

24
Figure 19. Cross-section micrographs of samples that did not undergo consolidation after the vibration phase of the process. Deconsolidation voids indicate the extent of the heat affected zone. The processing conditions are: 300 N, 86.2 µm and 100% travel (top-left); 300 N, 51.8 µm and 100% travel (top-right) and 1500 N, 82.6 µm and 100% travel (bottom).

25
Table 1. Relationship between travel and LSS for all three different welding conditions studied in this research, LSS (MPa) [coefficient of variation, c.o.v., %]
Travel (%) Welding conditions (welding force and welding amplitude) 300 N/86.2 µm 1500 N/86.2 µm 300 N/51.8 µm
12 32.0±2.0 [6.2] - - 20 34.5±2.5 [7.0] 31.0±2.2 [7.0] 31.9±1.4 [4.5] 40 37.3±1.6 [4.2] 31.7±1.0 [3.2] 36.0±1.6 [4.5] 60 34.9±1.3 [3.8] 35.9±2.6 [7.3] 37.1±1.1 [3.1] 80 31.9±1.7 [5.2] 35.8±1.5 [4.1] 35.0±0.7 [1.9]
100 30.3±2.4 [7.8] 28.0±1.6 [5.6] 33.0±1.3 [3.9]

26
Table 2. Maximum power, vibration time and energy for all the different force, vibration and travel combinations considered in this study. Power is presented as percentage of the maximum available power, 3000 W.
300 N/86.2 µm
Travel (%) Maximum power (%) [c.o.v., %]
Vibration time (ms) [c.o.v., %]
Energy (J) [c.o.v., %]
12 58±2 [4.0] 622±40 [6.4] 795±35 [4.4] 20 55±3 [4.9] 645±31 [4.8] 800±46 [5.8] 40 56±3 [4.8] 724±32 [4.4] 906±49 [5.4] 60 55±5 [8.7] 803.6±72 [9] 1040±60 [5.8] 80 59±3 [4.9] 967±70 [7.2] 1248±79 [6.4]
100 56±1 [1.8] 1001±103 [10.3] 1384±96 [6.9] 1500 N/86.2 µm
Travel (%) Maximum power (%) [c.o.v., %]
Vibration time (ms) [c.o.v., %]
Energy (J) [c.o.v., %]
20 81±1 [1.7] 250±13 [5.1] 433±24 [5.7] 40 78±2 [2.5] 278±15 [5.5] 473±18 [3.9] 60 82±2 [2.7] 301±15 [5.1] 540±30 [5.5] 80 83±4 [4.3] 349±25 [7.2] 660±64 [9.8]
100 82±1 [1.3] 442±22 [5.0] 862±48 [5.6] 300 N/51.6 µm
Travel (%) Maximum power (%) [c.o.v., %]
Vibration time (ms) [c.o.v., %]
Welding energy (J) [c.o.v., %]
20 31±3 [8.9] 1514±147 [9.7] 921±58 [6.3] 40 34±3 [7.7] 1672±223 [13.0] 1057±99 [9.4] 60 34±2 [5.7] 1770±271 [1.05] 1139±126 [11.1] 80 34±2 [4.5] 1928±91 [4.7] 1285±71 [5.5]
100 33±2 [6.7] 2377±278 [11.7] 1466±98 [6.7]

27
Table 3. Strength and output of the ultrasonic welder, namely maximum power, vibration time and energy, for different thickness samples welded at 300 N, 86.2 µm and 40% travel. Power is presented as percentage of the maximum available power, 3000 W.
Thickness of the adherends (mm) 1.92 3.84 LSS (MPa) [c.o.v., %] 37.3±1.6 [4.2] 46.8±2.5 [5.4]a
Maximum power (%) [c.o.v., %] 56±3 [4.8] 60±2 [3.9] Vibration time (ms) [c.o.v., %] 724±32 [4.4] 720±63 [8.8]
Energy (J) [c.o.v., %] 906±49 [5.4] 1060±71 [6.7] aLSS is higher when thicker adherends are used as a result of the higher bending stiffness of the samples and hence, reduced bending moments at the edges of the overlap [22].