StreetInfo 9.0 Product Guide - Pitney...
145
StreetInfo ® Version 9.0 PRODUCT GUIDE
Transcript of StreetInfo 9.0 Product Guide - Pitney...

StreetInfo®
Version 9.0
PRODUCT GUIDE

Information in this document is subject to change without notice and does not represent a commitment on the part of the vendor or its representatives. No part of this document may be reproduced or transmitted in any form or by any means, electronic or mechanical, including photocopying, without the written permission of MapInfo Corporation, One Global View, Troy, New York 12180-8399.© 2007 MapInfo Corporation. All rights reserved. MapInfo, the MapInfo logo and StreetInfo are trademarks of MapInfo Corporation and/or its affiliates. MapInfo Corporate Headquarters:Voice: (518) 285-6000Fax: (518) 285-6070Sales Info Hotline: (800) 327-8627Government Sales Hotline: (800) 619-2333Technical Support Hotline: (518) 285-7283Technical Support Fax: (518) 285-6080Contact information for all MapInfo offices is located at: http://www.mapinfo.com/contactus.Adobe Acrobat® is a registered trademark of Adobe Systems Incorporated in the United States.Products named herein may be trademarks of their respective manufacturers and are hereby recognized. Trademarked names are used editorially, to the benefit of the trademark owner, with no intent to infringe on the trademark.March 2007

Table of Contents
Chapter 1: Introduction to StreetInfo. . . . . . . . . . . . . . . . . . . . . . . . . . . . . . . . . . . . 7What Is StreetInfo Data?. . . . . . . . . . . . . . . . . . . . . . . . . . . . . . . . . . . . . . . . . . . . . . . . . . .8New Features in StreetInfo 9.0 . . . . . . . . . . . . . . . . . . . . . . . . . . . . . . . . . . . . . . . . . . . . . .9When Should I Buy StreetPro instead of StreetInfo? . . . . . . . . . . . . . . . . . . . . . . . . . . .9Documentation Updates . . . . . . . . . . . . . . . . . . . . . . . . . . . . . . . . . . . . . . . . . . . . . . . . . .10
Chapter 2: Getting Started . . . . . . . . . . . . . . . . . . . . . . . . . . . . . . . . . . . . . . . . . . . 11Installation Considerations . . . . . . . . . . . . . . . . . . . . . . . . . . . . . . . . . . . . . . . . . . . . . . .12Installing StreetInfo. . . . . . . . . . . . . . . . . . . . . . . . . . . . . . . . . . . . . . . . . . . . . . . . . . . . . .12Opening StreetInfo Features Layers . . . . . . . . . . . . . . . . . . . . . . . . . . . . . . . . . . . . . . . .14Using Workspaces . . . . . . . . . . . . . . . . . . . . . . . . . . . . . . . . . . . . . . . . . . . . . . . . . . . . . .14Running the StreetInfo Autoloader . . . . . . . . . . . . . . . . . . . . . . . . . . . . . . . . . . . . . . . . .16A Closer Look at the Autoloader Menu . . . . . . . . . . . . . . . . . . . . . . . . . . . . . . . . . . . . . .23
Chapter 3: StreetInfo Layer Descriptions . . . . . . . . . . . . . . . . . . . . . . . . . . . . . . . 29Streets Layer Description. . . . . . . . . . . . . . . . . . . . . . . . . . . . . . . . . . . . . . . . . . . . . . . . .30Highways Layer Description . . . . . . . . . . . . . . . . . . . . . . . . . . . . . . . . . . . . . . . . . . . . . .30Highway Shields Layer Description . . . . . . . . . . . . . . . . . . . . . . . . . . . . . . . . . . . . . . . .31Railroads Layer Description. . . . . . . . . . . . . . . . . . . . . . . . . . . . . . . . . . . . . . . . . . . . . . .31Municipal Points Layer Description . . . . . . . . . . . . . . . . . . . . . . . . . . . . . . . . . . . . . . . .32Cultural Point Locations Layer Description . . . . . . . . . . . . . . . . . . . . . . . . . . . . . . . . . .33Natural Point Locations Layer Description. . . . . . . . . . . . . . . . . . . . . . . . . . . . . . . . . . .34City Boundaries Layer Description . . . . . . . . . . . . . . . . . . . . . . . . . . . . . . . . . . . . . . . . .34MCD Boundaries Layer Description . . . . . . . . . . . . . . . . . . . . . . . . . . . . . . . . . . . . . . . .35Area Landmarks Layer Description. . . . . . . . . . . . . . . . . . . . . . . . . . . . . . . . . . . . . . . . .37Geocoding Boundaries Layer Description . . . . . . . . . . . . . . . . . . . . . . . . . . . . . . . . . . .37Water Bodies Layer Description . . . . . . . . . . . . . . . . . . . . . . . . . . . . . . . . . . . . . . . . . . .38Water Rivers Layer Description . . . . . . . . . . . . . . . . . . . . . . . . . . . . . . . . . . . . . . . . . . . .38School District Boundaries Layer Description. . . . . . . . . . . . . . . . . . . . . . . . . . . . . . . .39Voting District Boundaries Layer Description . . . . . . . . . . . . . . . . . . . . . . . . . . . . . . . .40Native American Lands Layer Description . . . . . . . . . . . . . . . . . . . . . . . . . . . . . . . . . . .41Elevation Contours Layer Description . . . . . . . . . . . . . . . . . . . . . . . . . . . . . . . . . . . . . .42Data Catalog . . . . . . . . . . . . . . . . . . . . . . . . . . . . . . . . . . . . . . . . . . . . . . . . . . . . . . . . . . .43

Table of Contents
Chapter 4: Mapping Basics . . . . . . . . . . . . . . . . . . . . . . . . . . . . . . . . . . . . . . . . . . . 45Displaying StreetInfo Tables . . . . . . . . . . . . . . . . . . . . . . . . . . . . . . . . . . . . . . . . . . . . . . 46Labeling StreetInfo Features . . . . . . . . . . . . . . . . . . . . . . . . . . . . . . . . . . . . . . . . . . . . . . 46Finding Information . . . . . . . . . . . . . . . . . . . . . . . . . . . . . . . . . . . . . . . . . . . . . . . . . . . . . 48
Chapter 5: Working with StreetInfo Seamless Maps. . . . . . . . . . . . . . . . . . . . . . . 49Moving Seamless Map Data to Your Hard Drive . . . . . . . . . . . . . . . . . . . . . . . . . . . . . . 50Using Seamless Maps . . . . . . . . . . . . . . . . . . . . . . . . . . . . . . . . . . . . . . . . . . . . . . . . . . . 51Seamless Map Data Descriptions . . . . . . . . . . . . . . . . . . . . . . . . . . . . . . . . . . . . . . . . . . 54
Chapter 6: Appending Tables . . . . . . . . . . . . . . . . . . . . . . . . . . . . . . . . . . . . . . . . . 57About Street Append . . . . . . . . . . . . . . . . . . . . . . . . . . . . . . . . . . . . . . . . . . . . . . . . . . . . 58When Do I Append Tables/Use Seamless Maps? . . . . . . . . . . . . . . . . . . . . . . . . . . . . . 58Using Street Append. . . . . . . . . . . . . . . . . . . . . . . . . . . . . . . . . . . . . . . . . . . . . . . . . . . . . 59
Chapter 7: Using the Highway Shields Manager . . . . . . . . . . . . . . . . . . . . . . . . . . 63Understanding Highway Shields . . . . . . . . . . . . . . . . . . . . . . . . . . . . . . . . . . . . . . . . . . . 64Using the Highway Shield Manager . . . . . . . . . . . . . . . . . . . . . . . . . . . . . . . . . . . . . . . . 65
Chapter 8: Geocoding . . . . . . . . . . . . . . . . . . . . . . . . . . . . . . . . . . . . . . . . . . . . . . . 71General Procedures for Geocoding . . . . . . . . . . . . . . . . . . . . . . . . . . . . . . . . . . . . . . . . 72Geocoding with StreetInfo’s Geocoding Boundaries Layer . . . . . . . . . . . . . . . . . . . . . 73The Geocode Dialog Box Explained . . . . . . . . . . . . . . . . . . . . . . . . . . . . . . . . . . . . . . . . 74
Chapter 9: Editing StreetInfo Layers . . . . . . . . . . . . . . . . . . . . . . . . . . . . . . . . . . . 77Editing Streets Layers . . . . . . . . . . . . . . . . . . . . . . . . . . . . . . . . . . . . . . . . . . . . . . . . . . . 78Editing Non-Street Layers . . . . . . . . . . . . . . . . . . . . . . . . . . . . . . . . . . . . . . . . . . . . . . . . 83
Chapter 10: Selecting Features with SIFTER. . . . . . . . . . . . . . . . . . . . . . . . . . . . . 87About SIFTER . . . . . . . . . . . . . . . . . . . . . . . . . . . . . . . . . . . . . . . . . . . . . . . . . . . . . . . . . . 88Using SIFTER . . . . . . . . . . . . . . . . . . . . . . . . . . . . . . . . . . . . . . . . . . . . . . . . . . . . . . . . . . 88
Chapter 11: Using MapInfo Workspace Files. . . . . . . . . . . . . . . . . . . . . . . . . . . . . 91Understanding MWS Workspaces. . . . . . . . . . . . . . . . . . . . . . . . . . . . . . . . . . . . . . . . . . 92Comparing MWS Files to GST Files . . . . . . . . . . . . . . . . . . . . . . . . . . . . . . . . . . . . . . . . 92
Appendix A: Data Descriptions . . . . . . . . . . . . . . . . . . . . . . . . . . . . . . . . . . . . . . . . 98Overview of Data Descriptions . . . . . . . . . . . . . . . . . . . . . . . . . . . . . . . . . . . . . . . . . . . . 99Display Streets Data Descriptions. . . . . . . . . . . . . . . . . . . . . . . . . . . . . . . . . . . . . . . . . . 99Highways . . . . . . . . . . . . . . . . . . . . . . . . . . . . . . . . . . . . . . . . . . . . . . . . . . . . . . . . . . . . . 104Highway Shields . . . . . . . . . . . . . . . . . . . . . . . . . . . . . . . . . . . . . . . . . . . . . . . . . . . . . . . 105Railroads . . . . . . . . . . . . . . . . . . . . . . . . . . . . . . . . . . . . . . . . . . . . . . . . . . . . . . . . . . . . . 109Municipal Points . . . . . . . . . . . . . . . . . . . . . . . . . . . . . . . . . . . . . . . . . . . . . . . . . . . . . . . 111Cultural Point Locations. . . . . . . . . . . . . . . . . . . . . . . . . . . . . . . . . . . . . . . . . . . . . . . . . 112
4 StreetInfo 9.0© 2007 MapInfo Corporation. All rights reserved.

Table of Contents
Natural Point Locations . . . . . . . . . . . . . . . . . . . . . . . . . . . . . . . . . . . . . . . . . . . . . . . . .114City Boundaries. . . . . . . . . . . . . . . . . . . . . . . . . . . . . . . . . . . . . . . . . . . . . . . . . . . . . . . .115County Boundaries . . . . . . . . . . . . . . . . . . . . . . . . . . . . . . . . . . . . . . . . . . . . . . . . . . . . .117Minor Civil Divisions (MCD) Boundaries. . . . . . . . . . . . . . . . . . . . . . . . . . . . . . . . . . . .118Sub-MCD Boundaries . . . . . . . . . . . . . . . . . . . . . . . . . . . . . . . . . . . . . . . . . . . . . . . . . . .118Area Landmarks . . . . . . . . . . . . . . . . . . . . . . . . . . . . . . . . . . . . . . . . . . . . . . . . . . . . . . .119Geocoding Boundaries. . . . . . . . . . . . . . . . . . . . . . . . . . . . . . . . . . . . . . . . . . . . . . . . . .122Water Boundaries . . . . . . . . . . . . . . . . . . . . . . . . . . . . . . . . . . . . . . . . . . . . . . . . . . . . . .123Rivers . . . . . . . . . . . . . . . . . . . . . . . . . . . . . . . . . . . . . . . . . . . . . . . . . . . . . . . . . . . . . . . .124School District Boundaries . . . . . . . . . . . . . . . . . . . . . . . . . . . . . . . . . . . . . . . . . . . . . .126Voting District Boundaries . . . . . . . . . . . . . . . . . . . . . . . . . . . . . . . . . . . . . . . . . . . . . . .127Native American Lands. . . . . . . . . . . . . . . . . . . . . . . . . . . . . . . . . . . . . . . . . . . . . . . . . .128Elevation Contours . . . . . . . . . . . . . . . . . . . . . . . . . . . . . . . . . . . . . . . . . . . . . . . . . . . . .130
Appendix B: StreetInfo Geographic Improvements by County. . . . . . . . . . . . . 132Geographic Improvements in StreetInfo 9.0. . . . . . . . . . . . . . . . . . . . . . . . . . . . . . . . .133Geographic Improvements in StreetInfo 8.0. . . . . . . . . . . . . . . . . . . . . . . . . . . . . . . . .136
Appendix C: History of StreetInfo Changes . . . . . . . . . . . . . . . . . . . . . . . . . . . . 141Changes in StreetInfo 8.0 . . . . . . . . . . . . . . . . . . . . . . . . . . . . . . . . . . . . . . . . . . . . . . . .142Changes in StreetInfo 7.0 . . . . . . . . . . . . . . . . . . . . . . . . . . . . . . . . . . . . . . . . . . . . . . . .142
Index . . . . . . . . . . . . . . . . . . . . . . . . . . . . . . . . . . . . . . . . . . . . . . . . . . . . . . . . . . . . 144
Product Guide 5© 2007 MapInfo Corporation. All rights reserved.

Table of Contents
6 StreetInfo 9.0© 2007 MapInfo Corporation. All rights reserved.

1
Introduction to StreetInfoIn this Chapter:
What Is StreetInfo Data? . . . . . . . . . . . . . . . . . . . . . . . . . . . . . . . . . .8New Features in StreetInfo 9.0 . . . . . . . . . . . . . . . . . . . . . . . . . . . . .9When Should I Buy StreetPro instead of StreetInfo? . . . . . . . . . . .9Documentation Updates . . . . . . . . . . . . . . . . . . . . . . . . . . . . . . . . .10

What Is StreetInfo Data?
What Is StreetInfo Data?Welcome to StreetInfo Version 9.0! This street product from MapInfo is newly revised and updated to provide you with the latest street data and reference information from the U.S. Census Bureau’s TIGER 2006 First Edition files and other current sources of information.
Among the enhancements are additional data layers of school districts, voting districts, Native American lands, and elevation contours for the entire U.S. The streets and highways display better than ever. Each are contained in their own layer for maximum flexibility. The new Highway Shields layers and Shield Manager tool allow you to display highway shields over any U.S. Interstate, route highway as an alternative to normal street style labeling. The Shield Manager helps you open, close and customize the look of the shields.
Figure: Typical Workspace
StreetInfo still contains the most data for the dollar. Nineteen layers in all, including three point layers for municipalities, cultural and natural locations. The updated Autoloader allows you to open and close multiple layers in more than one county at a time. And, as you probably like to open the same layers each time you create a new map, the Autoloader remembers your criteria so you can just choose the counties and go.
In addition, the latest release of the Autoloader provides display templates to help you open and display the StreetInfo layers the way you want. Choose from a default view, small font display, rural view or highway overview. You can modify any template to suit your needs and save the changes to a new template.
So get to know the latest version of StreetInfo. There’s a lot to like and a lot to help you create great looking maps.
8 StreetInfo 9.0© 2007 MapInfo Corporation. All rights reserved.

Chapter 1: Introduction to StreetInfo
New Features in StreetInfo 9.0StreetInfo 9.0 data is based on the First Edition of the 2006 TIGER/Line files. These files are compiled by county or statistically equivalent entity based on the latest available governmental unit boundaries, and include all counties, parishes, boroughs, census areas and equivalent entities for each state in the United States, the District of Columbia, Puerto Rico, and the Island Areas. The Census Bureau recently began a new project, the MAF/TIGER Accuracy Improvement Project, to update and improve the accuracy of their TIGER files. This has resulted in more realigned street feature coordinates, which will improve the accuracy of your maps. Every new version of TIGER data contains additional counties that have had MAF-related improvements done on them. Between StreetInfo 8.0 and 9.0, an additional 994 counties will show MAF-related improvement. See Geographic Improvements in StreetInfo 9.0 on page 133.
When Should I Buy StreetPro instead of StreetInfo?StreetInfo data is designed to provide a background to street-based data to give viewers a way to visualize data on a very broad scale. This data is targeted to organizations that are not concerned with pin point accuracy as much as a general picture of the location of their data.
StreetPro is a very detailed, highly accurate data product for organizations requiring precise geographic measurements for defining boundaries and to assist in routing. This figure shows the difference between the StreetPro (in green) and StreetInfo (version 7 in black, version 8 in red) data. This data has been placed over aerial imagery.
Product Guide 9© 2007 MapInfo Corporation. All rights reserved.

Documentation Updates
Figure: Providence, RI
In general, you would use StreetPro whenever the accuracy of your geocoding or routing results are crucial to your business need. For example, you would use StreetPro with the MapMarker or TargetPro applications. MapInfo Professional and MapXtreme Java 4.7 can use either StreetPro or StreetInfo data.
Note: This product documentation is for use with both StreetInfo Display 9.0 (released in March 2007) and the yet-to-be-released StreetInfo 9.0 Enhanced Address Layer product.
Documentation UpdatesLook for the most current documentation on the MapInfo Web site. Click this link to go to this web page.
http://reference.mapinfo.com
10 StreetInfo 9.0© 2007 MapInfo Corporation. All rights reserved.

2
Getting StartedThis chapter provides the instructions for installing StreetInfo, and then opening it in MapInfo Professional.
StreetInfo is organized into county files that can be installed locally or run from the StreetInfo CD-ROM or DVD. Use the StreetInfo’s Autoloader to control how much of the data you want to open and display in a Map window at one time. Or view the most common tables in a single county via its workspace.
In this Chapter:
Installation Considerations . . . . . . . . . . . . . . . . . . . . . . . . . . . . . . .12Installing StreetInfo . . . . . . . . . . . . . . . . . . . . . . . . . . . . . . . . . . . . .12Opening StreetInfo Features Layers . . . . . . . . . . . . . . . . . . . . . . .14Using Workspaces . . . . . . . . . . . . . . . . . . . . . . . . . . . . . . . . . . . . . .14Running the StreetInfo Autoloader. . . . . . . . . . . . . . . . . . . . . . . . .16A Closer Look at the Autoloader Menu . . . . . . . . . . . . . . . . . . . . .23

Installation Considerations
Installation Considerations
Fonts for Highway ShieldsSeveral True Type fonts are installed with StreetInfo that are designed to optimize the display of the Highway Shields. They are Montype’s Century Gothic and Century Gothic Bold, and MapInfo Shields. The files are copied to your \Windows\System folder during installation.
MapInfo Abbreviation FileThe installer places the MapInfow.abb file on your system during installation. If you have an older version of the abbreviation file, it will be renamed to MapInfow.abr.
StreetInfo UtilitiesSeveral utility programs are included with StreetInfo, including shldmgr.mbx, the Highway Shield Manager, and sifter.mbx, a tool for selecting features using natural language. Both programs are installed into a folder called MapInfo/Utils. The Autoloader, autoload.mbx, is copied to the MapInfo folder.
Installing StreetInfoTo install StreetInfo:
1. Put the StreetInfo CD-ROM or DVD in the media drive and do one of the following:
• From the Windows NT 4.0 or Windows XP Start menu, choose Run.
• From Windows NT 3.51 Program Manager, choose File > Run.
2. Do one of the following:
• Enter drive:\setup in the Command line, where drive represents the drive letter of your CD-ROM or DVD drive. Press Enter. The Data Installer loads.
• Click the Browse button and locate SETUP.EXE on the StreetInfo CD. Click OK. The Data Installer loads.
3. Choose Install Products from the Data Installer screen.
4. At the License Agreement dialog box, choose Yes to proceed.
5. At the Products Available dialog box, choose StreetInfo EAL Ver.9.0 or StreetInfo Display Ver.9.0 (depending on the product) and click Next.
6. At the Select Data dialog box, choose the data you want to install.
• To install all the counties for a state, highlight the state(s) in the States list and click the Add State(s) button. The counties automatically appear in the Data Selected list on the right.
12 StreetInfo 9.0

Chapter 2: Getting Started
• To install individual counties, click on the state name, followed by the counties that appear.To select consecutive counties, use Shift-click.To select non-consecutive counties, use Control-click.
Click the Add Selected Item(s) button. The counties appear in the Data Selected list.
To remove any unwanted counties, highlight the name on the Data Selected list and click the Delete Items from List button. Click Next to continue.
Note The county list also shows the name of the major city in the county in parentheses. The major city is not listed if it is the same name as the county.
7. Choose the target mapping product for displaying StreetInfo, either MapInfo Professional/Desktop or MapX. Click Next.
8. At the Installation Options dialog box, choose from:
• Maintain directory structure during file transfer.• Use data from CD-ROM
Note Access time will be slower when you use the CD-ROM option.[
p
Product Guide 13

Opening StreetInfo Features Layers
9. If you selected the Maintain Directory Structure option, the Data Destination dialog box displays. Choose the location for the StreetInfo files.
By default the Data Installer creates a folder under MapInfo Professional called \SIEV9 (for StreetInfo EAL) or \SIDV9 (for StreetInfo Display). To change the folder, click the Browse button and browse to the new location.
10. Click Next to continue. The Check Setup Information dialog box displays.
11. Click Next to continue the installation to completion.
Installing StreetInfo on a NetworkFor a network installation, create a “virtual CD-ROM” on a network drive by copying the contents of the StreetInfo CD-ROM(s) verbatim. Map a drive to the virtual CD root folder. Have the user run SETUP.EXE from that network drive, following the steps above. At the Set Options dialog box, select the Use Data from CD-ROM check box to access the data from the network.
Opening StreetInfo Features LayersThere are a number of ways to open and display your StreetInfo maps in MapInfo Professional:
• From the File menu, click Open Table to open each map layer individually. This is handy for opening one or two tables, but tedious to open multiple layers in different counties.
• From the Tools menu, select the Autoloader utility to open multiple layers for multiple counties simultaneously. A dialog box helps you through your choices.
• From the File menu, click Open Workspace or Open Table to open seamless map layers for an entire state.
• From the File menu, click Open Workspace to open county-level workspaces.• From the Tools menu, select Shield Manager and Open Shield Layer to open Interstate or
State Route Highway Shields layers.
Of these methods, the Autoloader provides you with the most control and options. The section, Running the StreetInfo Autoloader in Chapter 2 on page 16 and A Closer Look at the Autoloader Menu in Chapter 2 on page 23 discuss the Autoloader in more detail.
For more information on File > Open Table options, see the MapInfo Professional documentation set. For more on seamless maps, see Working with StreetInfo Seamless Maps in Chapter 5 on page 49. For a discussion on the Using the Highway Shields Manager in Chapter 7 on page 63.
Using WorkspacesIncluded in StreetInfo are county-level workspaces that will help you get up and running with StreetInfo much faster. Use these instead of opening files with the Autoloader when you want to display the most common layers with their default zoom layer and label settings. Be sure, however, that you have run the data installer on your system at least once to install the necessary font and symbol files that are used by the workspace.
14 StreetInfo 9.0

Chapter 2: Getting Started
The file naming convention for the workspace files follows this format:
SSCCCC.wor - where SS = 2–letter state abbreviation and CCCC = 3 or 4 letter county abbreviation. For example, the county–level workspace file for Clarke County, Georgia, is GACLAR.wor.
These files are installed when you install the rest of the StreetInfo data. If you are running StreetInfo from the CD-ROM, find the county workspace in the appropriate county folder.
The table below describes key information about the layers in the workspaces. These settings may or may not be the same as the individual county-level file that you open with the Autoloader.
Note Voting District, Native American Lands, Sub-MCD, and the State level tables (school districts and elevation contours) are not opened by the workspaces.
Zoom Label Zoom
Layer Opens As ... Min Max Label Details Min Max
Route/Highway Shield Top
~RtHwy010_Top 0 10 Black 8 Pt Century Gothic Bold
0 0
Route/Highway Shield Bottom
~RtHwy010_Bot 0 10 0 0
Interstate Shield (10)
~IntShld010 0 10 White 8 Pt Century Gothic Bold
0 0
Interstate Shield (40)
~IntShld1040 10 40 White 8 Pt Century Gothic Bold
0 0
Cultural Points ~PtsCultural 0 5 Black Haloed, 6 Pt Arial 0 4
Natural Points ~PtsNatural 0 5 Black Haloed, 6 Pt Arial 0 4
Municipal Points ~PtsMunic 0 5 Black Haloed, 6 Pt Arial 0 4
Railroads ~Railroads 0 15 0 0
Highways ~Highways 0 200 Black Haloed, 7 Pt Arial 4 6
Streets ~Streets 0 15 Black Haloed, 7 Pt Arial 0 4
Rivers ~WaterRivers 0 20 0 0
Waterbodies ~WaterBodies 0 200 Blue Italic 7 Pt Univers 0 30
Landmarks ~LandMarks 0 30 Green Haloed 7 Pt Arial 0 15
City Boundaries ~CityBdy 0 200 Red 12 Pt Arial 0 100
Product Guide 15

Running the StreetInfo Autoloader
Running the StreetInfo AutoloaderThis Autoloader in the \Extras folder on your installation CD is specifically designed for StreetInfo. You cannot open StreetWorks or StreetPro maps using this dialog box.
To run the StreetInfo Autoloader:
1. Start MapInfo Professional.
2. From the TOOLS menu, choose Run MapBasic Program. MapInfo Professional displays the Run MapBasic Program dialog box.
3. Choose AUTOLOAD.MBX from the MapInfo Professional program folder and click OK. The application creates a new menu called Autoloader in the menu bar.
Note If you already have StreetPro or StreetWorks data installed on your computer, you may need to open a new instance of MapInfo Professional and access the new Autoload.mbx from the CD.
4. Choose Autoloader > Open. The Select Among Installed Products dialog box displays.
Figure: Select Among Installed Products
5. Select your purchased StreetInfo product: StreetInfo Display v9.0 or StreetInfo EAL v9.0 and click OK. The Select Geographies to Open dialog box displays.
MCDs ~MinorCivDiv 0 100 0 0
County Boundaries
~County 0 1000 0 0
Zoom Label Zoom
Layer Opens As ... Min Max Label Details Min Max
16 StreetInfo 9.0

Chapter 2: Getting Started
Figure: Select Geographies to Open
You can use the FILTER buttons to restrict your view of the geography list. You can also choose a sort order to further customize your view. Highlight the county by clicking the name.
6. Highlight the geographies you want to open and click OK. Click and drag to highlight consecutive county names or Control-click to select non-consecutive counties. The Choose Layer Options dialog box displays.
Figure: Choose Layer Options
7. Choose the appropriate settings and click OK. The tables that match your criteria will open and display in a Map window. This dialog box allows you to select from several supplied templates
Product Guide 17

Running the StreetInfo Autoloader
that have different settings for layer display, label and zoom levels. You may also set your own layer options and create a new template. Refer to the next section for an explanation of the layer options in this dialog box.
Choose Layer Options Dialog Box ExplainedThis dialog box provides a variety of settings and options that enable you to create the map you want. Each part of the dialog box is explained below.
Layers List Box: The Layer list box shows the available StreetInfo layers for the selected geography. The Open and Label check boxes indicate which layers will be opened and labeled and are controlled by the template that is in effect. (Templates are discussed later.)
Display button: To change the display mode and zoom level for a layer, highlight the layer and click the Display button. The Current Display Options dialog box displays.
Figure: Current Display Options
Select the Style Override button to change the display characteristics. The buttons that display in this dialog box depend upon the features in the layer. If the layer you selected is a point layer, you can select new symbol options. If you select a region layer, as in the figure above, you can set region and border options. Additionally, you can set new minimum and maximum zoom settings, which determine the zoom at which the features you are displaying show. You can turn off zoom layering by clearing the Display Within Zoom Range check box.
Label button: To change the label settings for a layer, click the Label button. The Current Label Options dialog box displays.
18 StreetInfo 9.0

Chapter 2: Getting Started
Figure: Current Label Options
Change settings such as the label content, style, and position. A number of layers include a SmartLabel field that will display a two-line label when the information about the map object is lengthy. For more about labeling, see Mapping Basics in Chapter 4 on page 45.
Templates: The Choose Layer Options dialog box lists the name of the current template and provides buttons to access template information, save changes to the current template or change to another template. StreetInfo ships with five templates that offer a variety of layer display settings:
• Default template – Settings are optimized for display settings of 800x600 screen size, large fonts, and 65,000 colors or more.
Product Guide 19

Running the StreetInfo Autoloader
Figure: Default Template
• Small Font template – Similar to the Default template but label settings are optimized for small font display.
Figure: Small Font Template Example
• Highway Overview template – Opens the highway network and shield layers only. Use this to get an overview of a county’s transportation features.
20 StreetInfo 9.0

Chapter 2: Getting Started
Figure: Highway Overview Template Example
• Rural template – Display settings are similar to the Default template but has zoom layering optimized for non-urban counties that have less content.
Figure: Rural Template Example
• Rural Small Font template – Similar to the Rural template but is optimized for computers with small font display settings.
Product Guide 21

Running the StreetInfo Autoloader
Figure: Rural Small Font Template Example
Template Information button: Click here to view a description of the current template.
Figure: Current Template Information
Save Template button: Click here when you have changed or plan to change any layer settings and want to retain them for future use. A subsequent dialog box will prompt you to save the changes to the existing template or to a new one.
Load Template button: Click here to bring up a different template. A dialog box will display all installed templates and a description of each.
22 StreetInfo 9.0

Chapter 2: Getting Started
Figure: Choose Template
Templates are installed in the MapInfo Professional program folder when you install StreetInfo. They are identified by the file extension .slt. If you change a template and wish to revert to the original settings, simply copy the template file from the product CD to the MapInfo Professional folder. See Manage Templates on page 25 later in this chapter for more on templates.
Map Options: Choose to open the layers in a new Mapper or in a current Map window by choosing from the drop-down list.
Figure: Map Options
A Closer Look at the Autoloader MenuWhen you open StreetInfo tables with the Autoloader, an Autoloader menu is added to the MapInfo Professional menu bar. From there you can access your installed data files directly. You do not need to run the Autoloader again during the session if you wish to open additional tables. You will, however, need to run autoload.mbx during each mapping session to place the Autoloader menu on MapInfo Professional’s menu bar.
Product Guide 23

A Closer Look at the Autoloader Menu
Figure: Autoloader Menu
A number of commands are available in the Autoloader menu. Each is explained below.
OpenThe Open command allows you to control how much data you want to open and display in a Map window. Use Open to open one or more counties and layers with the display, label and zoom settings you want.
The Open command activates dialog boxes where you choose the geographies to open, followed by the layers. In the Choose Layer Options dialog box, you may control every aspect of the layer display. See Choose Layer Options Dialog Box Explained on page 18. To customize your map display, StreetInfo provides five templates with settings optimized for various displays, including a default, default small font, highway overview, rural view, and rural for small font display. Use one as is or modify them to create a new template. See Manage Templates on page 25 for more about working with templates.
CloseThis command displays the Close Counties and Layers dialog box. Here you may close multiple counties and/or layers from your StreetInfo maps at one time. The actions in this dialog box are exclusive, meaning the choices you make in the left “close county” list do not affect the choices in the right “close layers” list, but they can be carried out at the same time.
24 StreetInfo 9.0

Chapter 2: Getting Started
Figure: Close Counties and Layers
• To close all layers in one or more counties, highlight the counties in the left list box and click OK. Do not select any layer names.
• To close certain layers in all counties, highlight the layer(s) in the right list box and click OK. Do not select any county names.
• To close all of some counties and all of some layers, highlight the appropriate county and layer names in each list box and click OK.
• To change any settings in the dialog box, click the Clear button and re-select.
In the illustration below, all layers for Adair County, KY, will close and the three water layers for the seven listed counties will close, as well.
Figure: DATACAT Browser
Manage TemplatesThis command displays the Manage Template dialog box that lists the templates that are available for use, including user-created templates. The templates that ship with StreetInfo can be found in the MapInfo Professional program folder. The file names follow this convention:
Product Guide 25

A Closer Look at the Autoloader Menu
If you have templates that you wish to remove from your system, highlight its name in the top box and click Delete Selected Template. You may only remove one template at a time.
To recover a deleted StreetInfo template, copy the .slt file from the product media.
Browse Data CatalogThis command allows you to display the Data Catalog table in a Browser window. The catalog table is a non-mappable table that lists all of the installed street geographies and their folder paths. If you change the folder path of a StreetInfo file through this Browser window, you must also change the folder at the operating system level and vice versa.
Verify Data CatalogThis command determines if the Data Catalog contains entries that are no longer valid, such as files that have been deleted or moved to another location. Keep your Data Catalog up to date by running Verify Data Catalog. It automatically determines which entries are invalid and displays a list for you to choose which items to delete from the Data Catalog. This process only deletes the entry from the Data Catalog. It does not delete any files from your system.
Figure: Verify Data Catalog
ExitThis command allows you to exit the Autoloader and remove the Autoloader menu from the MapInfo Professional menu bar. Exiting the application does not close any of the open StreetInfo files or Map windows. You can still add or remove files to your Map window through the File > Open Table, File > Close Table, or Map > Layer Control commands.
About AutoloaderThis command displays the About Box identifying the version of the Autoloader.
File Template Description
siev9.slt Default
siev9a.slt Small Font
siev9b.slt Highway Overview
siev9c.slt Rural
siev9d.slt Rural Small Font
26 StreetInfo 9.0

Chapter 2: Getting Started
OptionsThis command displays the Autoloader Options dialog box. Check either or both boxes if you want the Autoloader to display warning messages or to automatically activate the Open command when the Autoloader is loaded (Show Open dialog box on Startup).
Figure: Autoloader Options
Choose the order in which you want the Autoloader to open the StreetInfo tables, either by Layer or Geography. The default is by Layer. This means that regardless of the number of counties you are opening, the Autoloader loads all the tables for one layer before loading another layer. The layers display in the Layer Control grouped by layer.
To keep all the layers for a geography together in the Layer Control, choose the option Open Geography by Geography.
Figure:
Product Guide 27

A Closer Look at the Autoloader Menu
28 StreetInfo 9.0

3
StreetInfo Layer DescriptionsThis section provides a brief description of each feature layer in StreetInfo. See Data Descriptions in Appendix A on page 98 for complete specifications for display characteristics, table structure and file naming conventions and other useful information for each layer.
This chapter concludes with a discussion of the Data Catalog, the non–displaying table that is created or updated during installation to contain file and path names for all installed StreetInfo data files. The Data Catalog is an integral part of the Autoloader that allows you open and close multiple layers simultaneously.
In this Chapter:
Streets Layer Description . . . . . . . . . . . . . . . . . . . . . . . . . . . . . . . .30Highways Layer Description . . . . . . . . . . . . . . . . . . . . . . . . . . . . . .30Highway Shields Layer Description . . . . . . . . . . . . . . . . . . . . . . . .31Railroads Layer Description . . . . . . . . . . . . . . . . . . . . . . . . . . . . . .31Municipal Points Layer Description . . . . . . . . . . . . . . . . . . . . . . . .32Cultural Point Locations Layer Description . . . . . . . . . . . . . . . . .33Natural Point Locations Layer Description . . . . . . . . . . . . . . . . . .34City Boundaries Layer Description . . . . . . . . . . . . . . . . . . . . . . . .34MCD Boundaries Layer Description . . . . . . . . . . . . . . . . . . . . . . . .35Area Landmarks Layer Description . . . . . . . . . . . . . . . . . . . . . . . .37Geocoding Boundaries Layer Description . . . . . . . . . . . . . . . . . .37Water Bodies Layer Description . . . . . . . . . . . . . . . . . . . . . . . . . . .38Water Rivers Layer Description . . . . . . . . . . . . . . . . . . . . . . . . . . .38School District Boundaries Layer Description . . . . . . . . . . . . . . .39Voting District Boundaries Layer Description. . . . . . . . . . . . . . . .40Native American Lands Layer Description . . . . . . . . . . . . . . . . . .41Elevation Contours Layer Description . . . . . . . . . . . . . . . . . . . . . .42Data Catalog . . . . . . . . . . . . . . . . . . . . . . . . . . . . . . . . . . . . . . . . . . .43

Streets Layer Description
Streets Layer DescriptionThe Streets table contains all levels of U.S. streets with any existing address ranges. All alternate names for roads are included. All highways with A1 CFCC display as thick red lines. All A2 highways have thick green lines. Roads with an A5 classification display as dashed black lines. All other roads in this layer display with thin black lines. Data descriptions for this layer are available in Display Streets Data Descriptions in Appendix A on page 99.
Figure: Streets Layer
Highways Layer DescriptionThe Highways Layer contains polylines that represent primary and secondary U.S. highways. These represent the same highways that are provided in the Streets layer (thick red lines for primary highways and thick green lines for secondary highways). Data descriptions for this layer are available in Highways in Appendix A on page 104.
Figure: Highways Layer
30 StreetInfo 9.0

Chapter 3: StreetInfo Layer Descriptions
Highway Shields Layer DescriptionThe Highway Shields layer contains Interstate highway or State Route highway shields for display on top of a Highways layer to identify the route number. The Interstate and State Route shields are each contained in their own county-level tables. Data descriptions for this layer are available in Highway Shields in Appendix A on page 105.
The Shield layers should be opened with the Shield Manager, Autoloader or through the provided workspaces. This will ensure that the shields are positioned and labeled properly. Once opened, the Shields layers act like other StreetInfo layers of map objects. You can add, move or delete objects from them. Be sure that the order of layers in the Map window lists the Shields layer above the Highways layer.
Figure: Highway Shield Layer
Highway shields can be customized to meet your mapping needs. StreetInfo’s Highway Shields Manager allows you to easily open and close shield layers, create new shields and shield layers, and change the display, label content and position. See Chapter 7: Using the Highway Shields Manager for more on the Highway Shields Manager.
Note In order to take advantage of the default labeling of highway shields, you must run the installer to install the necessary font files (Century Gothic and Century Gothic Bold). Otherwise you will only see blue boxes for the shield points. These fonts are installed automatically with the rest of StreetInfo.
Railroads Layer DescriptionThe Railroads layer consists of line and polyline objects representing railroad networks for the U.S. The railroads display as thin, black, hatched lines. The data associated with the railroads include railroad name and/or owner and a Census Feature Class Code to differentiate among the six categories of railroads. For more about the data descriptions for this layer see Railroads in Appendix A on page 109.
Product Guide 31

Municipal Points Layer Description
Figure: Railroad Layer
Municipal Points Layer DescriptionThe Municipal Points layer contains over 302,000 point locations that represent U.S. municipalities. These points are defined by the U.S. Geological Survey in cooperation with the U.S. Board on Geographic Names (GNIS database). Three types of municipal points are represented in this layer:
• Civil point locations – political divisions formed for administrative purposes (e.g., borough, county, town, township)
• Populated places – place or area with clustered or scattered buildings and a permanent human population (e.g., city, town, village)
• Locales – places at which there is or was human activity but do not include populated places, mines or dams (e.g., battlefield, camp, farm, ruins, station)
Each municipal point includes the name of the feature, type and elevation. Civil points are represented by 10 point red unfilled circles; populated places by gray stars, and locales by small black unfilled diamonds.
The Municipal Points layer is present for all U.S. counties except two, and is not present for any outlying territory. Data descriptions for this layer are available in Municipal Points in Appendix A on page 111.
32 StreetInfo 9.0

Chapter 3: StreetInfo Layer Descriptions
Figure: Municipal Points Layer
Cultural Point Locations Layer DescriptionThe Cultural Point Locations layer contains more than 493,000 point objects nationwide that represent cultural or man-made point locations. These include airports, schools, churches, office buildings and parks, to name a few.
Each type of cultural location is represented by a symbol that readily identifies it. For example, airports are represented by airplane symbols, church locations by church building symbols. Each point includes the feature name, classification and elevation.
This layer is present for all but three U.S. counties. Data descriptions for this layer are available in Cultural Point Locations in Appendix A on page 112.
Figure: Cultural Points Layer
Product Guide 33

Natural Point Locations Layer Description
Natural Point Locations Layer DescriptionThe Natural Point Locations layer contains over 80,000 point objects that represent natural point locations across the U.S. These include forests, trails, beaches and summits. Like the cultural points, the natural point features are represented by symbols that make identification easier. Symbols include mountain peaks to represent summit locations, and clustered trees to represent forests. Associated information for each point includes the feature name, type of feature and elevation.
There are approximately 750 counties that do not include a Natural Point Locations layer. Data descriptions for this layer are available in Natural Point Locations in Appendix A on page 114.
Figure: Natural Points Layer
City Boundaries Layer DescriptionThis layer contains more than 27,000 boundaries that represent Populated Places, as defined by the U.S. Census Bureau. These include any city boundaries that fall within a county. The City Boundaries layer also includes a Federal Information Processing Standards (FIPS) code that uniquely identifies each city and a Class code that identifies the type of Populated Place. These city boundaries display as light yellow filled regions with hashed borders. There are 30 counties in this release of StreetInfo that do not include a City Boundaries layer. Data descriptions for this layer are available in City Boundaries in Appendix A on page 115.
34 StreetInfo 9.0

Chapter 3: StreetInfo Layer Descriptions
Figure: City Boundaries Layer
MCD Boundaries Layer DescriptionThis layer contains Minor Civil Divisions (MCDs) as defined by the U.S. Census Bureau. The more than 36,000 boundaries include any township boundaries that fall within a county. The MCD layer also includes a Federal Information Processing Standards (FIPS) code that uniquely identifies each town and a class code that identifies its type. The MCD regions display as unfilled polygons with hashed borders.
The MCD layer includes boundaries that coincide with boundaries in the City Boundaries layer. For example, an incorporated place in the City Boundaries table can also serve as the primary county division as an MCD. The Census Bureau has identified both boundaries with the same class code. For more information about the data descriptions for this layer see Minor Civil Divisions (MCD) Boundaries in Appendix A on page 118.
Product Guide 35

MCD Boundaries Layer Description
Figure: Minor Civil Divisions Layer
Sub-MCD Boundaries Layer DescriptionSub-MCDs are legally defined subdivisions of a Minor Civil Division (MCD). Called sub-barrios, they are found only in Puerto Rico. Each sub-MCD is a subsection of a regular MCD. A group of sub-MCDs will fall entirely within a Puerto Rican MCD. There are 23 counties in Puerto Rico that have sub-MCDs.
Sub-MCD boundaries display as light green bordered, unfilled regions. Data associated with these boundaries include the name of the sub-MCD, a 15-character FIPS code, and a class code of Z6. Data descriptions for this layer are available in Sub-MCD Boundaries in Appendix A on page 118.
Figure: Sub-Minor Civil Divisions Layer
36 StreetInfo 9.0

Chapter 3: StreetInfo Layer Descriptions
Area Landmarks Layer DescriptionThe Area Landmarks layer consists of region objects that represent larger landmarks of local interest. These include locations that are better displayed as boundaries than point locations, for example, airports, parks, military installations, cemeteries, etc. Each feature in the Area Landmarks layer has a Census Feature Class Code (CFCC) of class D, as defined by the Census Bureau. This layer is not present for every county.
Area landmark boundaries display as filled polygons in a variety of colors to differentiate the feature types. For example, parks and golf courses display as dark green objects. Federal facilities show as light gray regions. Approximately 100 counties do not include this layer. Data descriptions for this layer are available in Area Landmarks in Appendix A on page 119.
Figure: Area Landmarks Layer
Geocoding Boundaries Layer DescriptionThe Geocoding Boundaries layer includes tables of addressable towns and cities that are located within the county boundary. Each of these boundaries has a name in the City column. Use these boundaries during geocoding to refine your search and improve your geocoding hit rate. The Geocoding Boundaries are only available when you purchase the EAL (Enhanced Address Layer) version of StreetInfo.
More information about geocoding can be found in Geocoding in Chapter 8 on page 71. Data descriptions for this layer are available in Geocoding Boundaries in Appendix A on page 122.
Product Guide 37

Water Bodies Layer Description
Figure: Geocoding Boundaries Layer
Water Bodies Layer DescriptionThe Water Bodies layer consists of region objects that represent water bodies such as lakes, ponds, oceans, and reservoirs. Each water feature is categorized by class as described in the CFCC Classification chart in Appendix A. These objects display as blue filled regions. There are 23 counties without the Water Boundaries layer. Data descriptions for this layer are available in Water Boundaries in Appendix A on page 123.
Figure: Water Boundaries Layer
Water Rivers Layer DescriptionThe Water Rivers Layer consists of polyline objects that represent water bodies such as rivers, streams, and canals. Each water feature is categorized by class as described in the CFCC Classification chart in Appendix A. These objects display as blue lines and polylines. Two U.S. counties do not contain the Water Rivers layer. Data descriptions for this layer are available in Rivers in Appendix A on page 124.
38 StreetInfo 9.0
Chapter 3: StreetInfo Layer Descriptions
Figure: Water Rivers Layer
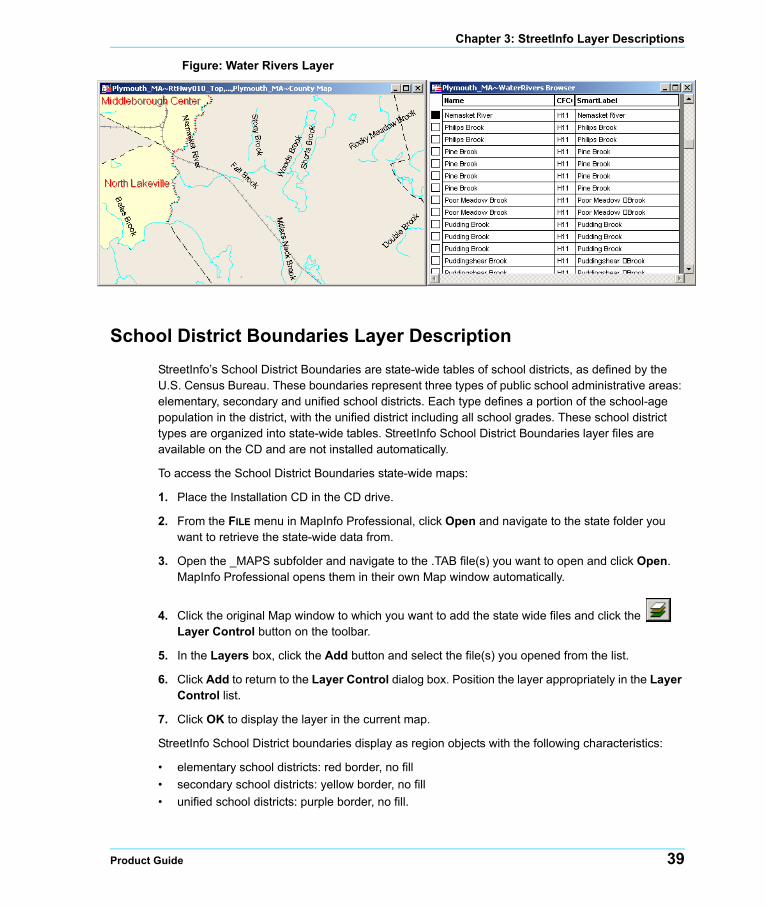
School District Boundaries Layer DescriptionStreetInfo’s School District Boundaries are state-wide tables of school districts, as defined by the U.S. Census Bureau. These boundaries represent three types of public school administrative areas: elementary, secondary and unified school districts. Each type defines a portion of the school-age population in the district, with the unified district including all school grades. These school district types are organized into state-wide tables. StreetInfo School District Boundaries layer files are available on the CD and are not installed automatically.
To access the School District Boundaries state-wide maps:
1. Place the Installation CD in the CD drive.
2. From the FILE menu in MapInfo Professional, click Open and navigate to the state folder you want to retrieve the state-wide data from.
3. Open the _MAPS subfolder and navigate to the .TAB file(s) you want to open and click Open. MapInfo Professional opens them in their own Map window automatically.
4. Click the original Map window to which you want to add the state wide files and click the Layer Control button on the toolbar.
5. In the Layers box, click the Add button and select the file(s) you opened from the list.
6. Click Add to return to the Layer Control dialog box. Position the layer appropriately in the Layer Control list.
7. Click OK to display the layer in the current map.
StreetInfo School District boundaries display as region objects with the following characteristics:
• elementary school districts: red border, no fill• secondary school districts: yellow border, no fill• unified school districts: purple border, no fill.
Product Guide 39

Voting District Boundaries Layer Description
Associated attributes for each district include an identifying district code and school district name, the total number of students, as well as a breakdown of students by ethnic group. Data descriptions for this layer are available in School District Boundaries in Appendix A on page 126.
Figure: School District Boundaries Layer
Voting District Boundaries Layer DescriptionThe StreetInfo Voting District Boundaries are state-wide tables of voting districts as defined by the U.S. Census Bureau. These districts encompass a variety of areas defined by state and local governments for the purpose of conducting elections, including election districts, precincts, legislative districts and wards. The StreetInfo Voting District Boundaries layer file is available on the CD and are not installed automatically.
To access the Voting District Boundaries state-wide maps:
1. Place the Installation CD in the CD drive.
2. From the FILE menu in MapInfo Professional, click Open and navigate to the state folder you want to retrieve the state-wide data from.
3. Open the _SEAM subfolder and navigate to the SS_VOTE.TAB file and click Open. The voting district boundaries display in the open map.
Note SS indicates the two-letter state abbreviation.
The boundaries in the StreetInfo Voting District layer are represented by region objects that display with a thin green border and no fill. The associated data includes the name of the district, a district FIPS code and ID. Data descriptions for this layer are available in Voting District Boundaries in Appendix A on page 127.
40 StreetInfo 9.0

Chapter 3: StreetInfo Layer Descriptions
Figure: Voting District Boundaries Layer
Note The following states do not participate in the Census Bureau's Voting District collection program from which the StreetInfo Voting District layer is derived: California, Florida, Kentucky, Montana. Other states may have incomplete coverage.
Native American Lands Layer DescriptionThe StreetInfo Native American Lands layer contains boundaries that represent American Indian reservation and trust lands, and Alaska Native areas, as defined by the U.S. Census Bureau. These boundaries display as a solid brown filled region.
The StreetInfo Native American Lands Boundaries layer file is available on the CD and are not installed automatically.
To access the Native American Lands Boundaries state-wide maps:
1. Place the Installation CD in the CD drive.
2. From the FILE menu in MapInfo Professional, click OPEN and navigate to the state folder you want to retrieve the state-wide data from.
3. Open the _SEAM subfolder and navigate to the SS_NATAM.TAB file and click OPEN. The voting district boundaries display in the open map.
Note SS indicates the two-letter state abbreviation.
Data descriptions for this layer are available in Native American Lands in Appendix A on page 128.
Note This layer is not present for every county.
Product Guide 41

Elevation Contours Layer Description
Figure: Native American Lands Layer
Elevation Contours Layer DescriptionThe Elevation Contours layer is a low-resolution layer of elevation contour lines for the continental U.S., Alaska and Hawaii. Also included is a legend table for identifying the contour ranges. This layer can be used as a background for presentation or web-based maps, as well as for a low-resolution study at the national, state or local level. This layer provides an interesting and informative view of why rivers, roadways and municipalities follow a certain path or are laid out in a certain fashion.
The StreetInfo Elevation Contours Legend layer file is available on the CD and are not installed automatically.
To access the elevation state-wide maps:
1. Place the Installation CD in the CD drive.
2. From the File menu in MapInfo Professional, click Open and navigate to the state folder you want to retrieve the state-wide data from.
3. Open the _MAPS subfolder and navigate to the SSEL_C.TAB file you want to open and click Open. MapInfo Professional opens the file in the current Map window automatically.
Note SS indicates the two-letter state abbreviation.
The state-wide tables in this layer contain up to 22 contour gradations of 1,000 feet to cover the range of elevations across the U.S. Each contour level is represented by a region polygon with a lower and upper range elevation value as its associated data. It was developed by MapInfo Corporation from over 400,000 feature GNIS points containing elevation information. The boundaries were created using Vertical Mapper, a product of Northwood Geoscience. Data descriptions for this layer are available in Elevation Contours in Appendix A on page 130.
42 StreetInfo 9.0

Chapter 3: StreetInfo Layer Descriptions
Figure: Elevation Contours Layer
We also provide a legend for the Elevation Contour layers in the _MAPS folder.
To display the Elevation Contour Legend:
1. From File menu, select Open and navigate to the _MAPS folder of the state you are displaying.
2. Select the ELEVLGND.TAB file from the list and click Open. MapInfo Professional displays the legend in a new window.
Figure: Elevation Legend
Data CatalogThe Data Catalog is a non-mappable table that lists all of the MapInfo street product files installed on your system. MapInfo Professional uses this table to locate StreetInfo files when you want to open multiple files at one time using the Autoloader. The Data Catalog identifies the geography and path where each file is located, whether you keep the files on CD-ROM or copy them to your hard drive.
The Data Catalog is created or updated when you run the install program. It must be located in the same folder as your copy of the MapInfo Professional software.
Product Guide 43

Data Catalog
You can open the Data Catalog just like any other table using File > Open. If, however, you run the Autoloader, the table is automatically opened (although not displayed). You can then choose Browse Data Catalog from the Autoloader menu to display the catalog. For more on the Running the StreetInfo Autoloader in Appendix 2 on page 16.
44 StreetInfo 9.0

4
Mapping BasicsThis chapter provides instruction on several basic tasks you are likely to perform with StreetInfo data, including how to display and label map layers and use the Info Tool. These topics are also treated in the MapInfo Professional documentation set.
In this Chapter:
Displaying StreetInfo Tables . . . . . . . . . . . . . . . . . . . . . . . . . . . . . .46Labeling StreetInfo Features. . . . . . . . . . . . . . . . . . . . . . . . . . . . . .46Finding Information . . . . . . . . . . . . . . . . . . . . . . . . . . . . . . . . . . . . .48
Displaying StreetInfo Tables
Displaying StreetInfo TablesIn Chapter 2: Running the StreetInfo Autoloader you learned how to open multiple StreetInfo tables automatically with the Autoloader. You now have your tables displaying in one or more Map windows. Each table you opened displays as a separate layer in the Map window. For example, streets display in a layer called sometable~Streets and point objects that represent cultural points display in a layer called sometable~PtsCultural.
Use Map > Layer Control to manage the layers in the Map window. Every layer that displays in the Map window is listed in the Layer Control dialog box. From this dialog box you can:
• Turn off the display of some layers without removing the layer from the map• Change how the layers look while they are displayed in the Map window• Set the labeling conditions for each layer• Set whether a layer is editable, selectable, or visible• Set the zoom level so that local features display only when you are in close enough to see the
detail• Reorder the layers to hide or expose other map features• Remove from or add other layers to the window
The Layer Control dialog box is the central location for controlling what you can do and see in the Map window. The MapInfo Professional documentation set (User Guide and Online Help) provides thorough discussions of working with Layer Control. Refer to them often.
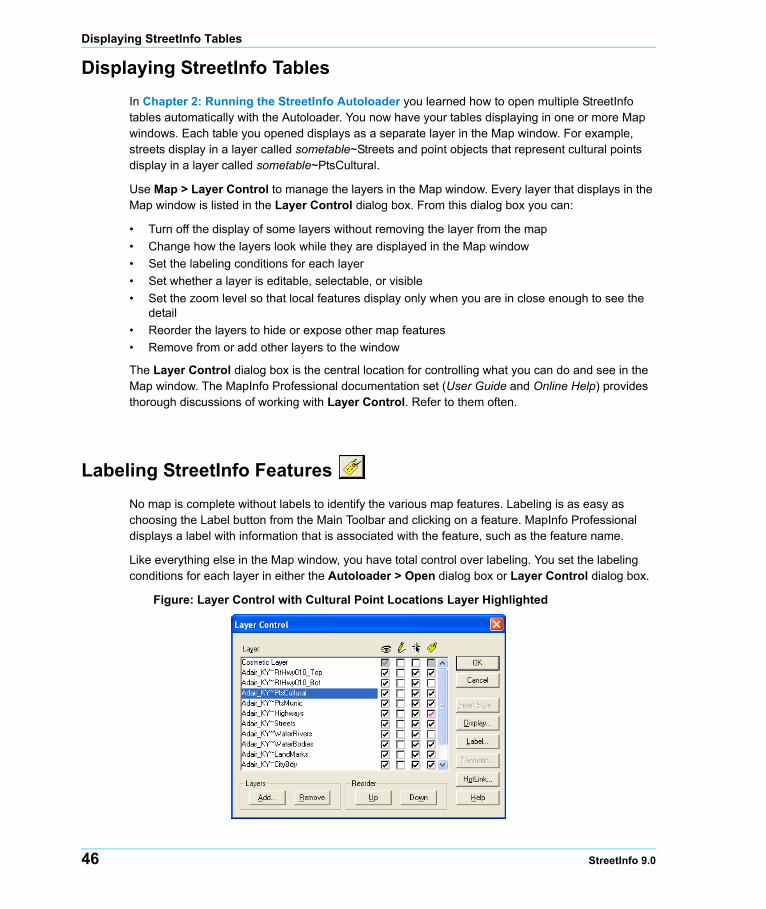
Labeling StreetInfo Features No map is complete without labels to identify the various map features. Labeling is as easy as choosing the Label button from the Main Toolbar and clicking on a feature. MapInfo Professional displays a label with information that is associated with the feature, such as the feature name.
Like everything else in the Map window, you have total control over labeling. You set the labeling conditions for each layer in either the Autoloader > Open dialog box or Layer Control dialog box.
Figure: Layer Control with Cultural Point Locations Layer Highlighted
46 StreetInfo 9.0
Chapter 4: Mapping Basics
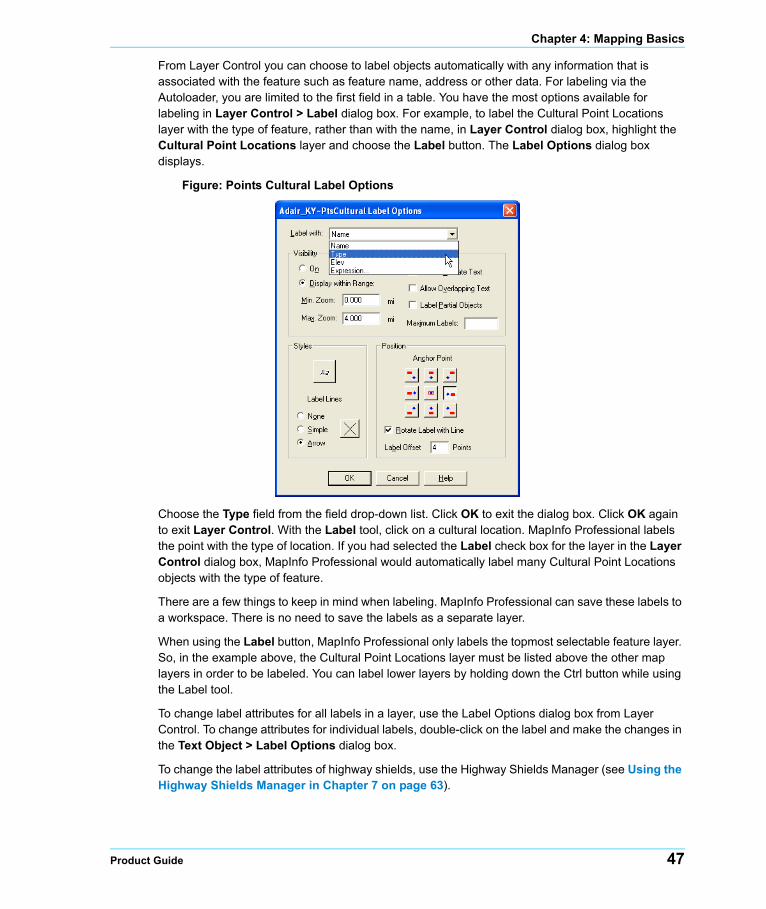
From Layer Control you can choose to label objects automatically with any information that is associated with the feature such as feature name, address or other data. For labeling via the Autoloader, you are limited to the first field in a table. You have the most options available for labeling in Layer Control > Label dialog box. For example, to label the Cultural Point Locations layer with the type of feature, rather than with the name, in Layer Control dialog box, highlight the Cultural Point Locations layer and choose the Label button. The Label Options dialog box displays.
Figure: Points Cultural Label Options
Choose the Type field from the field drop-down list. Click OK to exit the dialog box. Click OK again to exit Layer Control. With the Label tool, click on a cultural location. MapInfo Professional labels the point with the type of location. If you had selected the Label check box for the layer in the Layer Control dialog box, MapInfo Professional would automatically label many Cultural Point Locations objects with the type of feature.
There are a few things to keep in mind when labeling. MapInfo Professional can save these labels to a workspace. There is no need to save the labels as a separate layer.
When using the Label button, MapInfo Professional only labels the topmost selectable feature layer. So, in the example above, the Cultural Point Locations layer must be listed above the other map layers in order to be labeled. You can label lower layers by holding down the Ctrl button while using the Label tool.
To change label attributes for all labels in a layer, use the Label Options dialog box from Layer Control. To change attributes for individual labels, double-click on the label and make the changes in the Text Object > Label Options dialog box.
To change the label attributes of highway shields, use the Highway Shields Manager (see Using the Highway Shields Manager in Chapter 7 on page 63).
Product Guide 47

Finding Information
Finding Information Another basic function of creating and displaying computerized maps is the ability to find information about a map feature. The easiest way to do this is to use the Info tool. Simply click on the Info button in the Main toolbar and click a map object. Information about every map object at that point displays in the Info Tool window. If there is more than one object listed in the window, click on the name of the feature in the window to expand the data associated with an object.
48 StreetInfo 9.0

5
Working with StreetInfo Seamless MapsIf you need to base your data on statewide maps, you can use the statewide Seamless Maps on the StreetInfo media. Individual county maps some times do not line up precisely, which can cause gaps in your maps. Seamless maps allow you to open all StreetInfo layers for an entire state as you choose them.
Seamless maps are organized by state on the StreetInfo media under the state abbreviation\_seam folder (for example, \ny\_seam). These files are designed to run from the media and are not installed to your hard drive with the rest of StreetInfo.
Seamless maps are only available when you purchase StreetInfo by state, six-state pak or the entire United States. Seamless maps are not available for county purchases.
In this Chapter:
Moving Seamless Map Data to Your Hard Drive . . . . . . . . . . . . . .50Using Seamless Maps . . . . . . . . . . . . . . . . . . . . . . . . . . . . . . . . . . .51Seamless Map Data Descriptions . . . . . . . . . . . . . . . . . . . . . . . . . .54

Moving Seamless Map Data to Your Hard Drive
Moving Seamless Map Data to Your Hard DriveThe StreetInfo seamless maps are designed to run directly from the media. They are not installed along with the rest of StreetInfo. You can, however, move the data to your hard drive for faster map drawing. Copy the top level state folder to your hard drive. This will bring over all county directories and the _seam subfolder.
For example, to run the seamless maps for New York from your local machine, copy \ny locally. Open the ny_map.wor and all seamless layers for New York display in a Map window.
Using a Workspace instead of a Seamless MapThere are times when it may make sense to use a workspace rather than a seamless map, particularly if you are trying to show more than one kind of data at the same time.
To open all layers for a state or territory, it’s best to open a workspace.
1. Click File > Open command and select Workspace (.wor) from the Files of type drop-down list.
2. From the Look in field, go to the folder that contains the state you want to display and find the SS_MAP.WOR file where SS represents the two-letter state/territory abbreviation.
For example, to open all the StreetInfo maps for Connecticut, choose CT_map.wor.
3. Click Open to display all StreetInfo layers for the state open and zoom to the pre-set default, which is the state capital. In this case, the map would be centered around Hartford, the capital of Connecticut.
Zoom Settings for Seamless MapsThe default zoom settings for seamless maps opened as a workspace vary slightly from the zoom settings for county-level tables opened with the Autoloader. These settings are more appropriate for a statewide view.
Below is a comparison of zoom settings for the statewide seamless maps opened as a workspace and county level maps opened via the Autoloader. Some of the less commonly used tables are not displayed in the workspaces by default.
StreetInfo LayerWorkspace Seamless Map
Zoom SettingAutoloader County Map Zoom
Setting
Streets 0–10 miles 0–10 miles
Highways 1 10–200 miles 10–100 miles
Railroads 0–10 miles 0–10 miles
Municipal Point Locations 0–4 miles 0–4 miles
Cultural Point Locations 0–8 miles 0–8 miles
50 StreetInfo 9.0

Chapter 5: Working with StreetInfo Seamless Maps
1Note: Highways are visible at all distances since they are included in the Streets layer.
1Note: Highways are visible at all distances since they are included in the Streets layer.
Using Seamless MapsThere are three ways to open multi-county maps in MapInfo Professional. You can open state-wide Maps as workspaces, as seamless maps, and as appended maps. For more about appended maps and why you would use Seamless or Appended maps, see When Do I Append Tables/Use Seamless Maps? in Chapter 6 on page 58.
Opening a State-Wide Map LayerTo open a single layer for the entire state, use File > Open and choose the appropriate seamless layer under the \state subfolder from the installation media. For example, to view all the highways for Florida, choose File > Open, go to the \fl\_seam folder and select Fl_hiway.tab.
Natural Point Locations 0–8 miles 0–8 miles
Area Landmarks 0–30 miles 0–30 miles
MCD 0–1000 miles 0–100 miles
City Boundaries 0–300 miles 0–100 miles
StreetInfo LayerWorkspace Seamless Map
Zoom SettingAutoloader County Map Zoom
Setting
StreetInfo LayerWorkspace Seamless Map
Zoom SettingAutoloader County Map Zoom
Setting
Sub-MCD Boundaries not displayed not displayed
Voting Districts not displayed 0–10 miles
Native American Lands not displayed 0–10 miles
Rivers 0–30 miles 0–30 miles
Water Boundaries 0–300 miles 0–100 miles
Geocoding Boundaries no seamless map 0–1 miles
All Highway Shield Layers 0– miles 0–10 miles
Product Guide 51

Using Seamless Maps
Selecting Objects in Seamless MapsBecause seamless maps are made up of a collection of county-level base tables, it is not possible to select objects directly in MapInfo Professional or MapX. You can, however, query the appropriate county base table, add the query to the Map window and perform Query > Find Selection.
To select objects from seamless map layers:
1. Open a map to which you want to add seamless tables.
2. From the Window menu, click New Browser Window to browse the appropriate layer for the seamless map. For example, choose VI_Highways to browse any of the highway layers for the Virgin Islands.
3. In the Select Base Table dialog box, enter the layer name and click OK.
Figure: Select Base Table
You can also click directly on OK to bring up a list of county names for the seamless map. Move through the list using the Up and Down buttons until you have highlighted the county you want. Click OK. A Browser window of the county-level layer displays.
52 StreetInfo 9.0

Chapter 5: Working with StreetInfo Seamless Maps
Figure: Browser Window (VISTCRH)
Note The Browser shows the eight-character root file name in the title bar (for example, VISTCRh), not in county, state abbreviation format.
4. Choose Query > Select to select certain records from the base table and click OK. For example, to select all segments of Interstate 84 from the VISTCRh table, your query expression should read Highway = “Route 63.”
Figure: Select (VISTCRh)
The selection list displays in browser form.
Figure: Query1 Browser
5. Click the Map window to make it active and display the Layer Control dialog box.
Product Guide 53

Seamless Map Data Descriptions
6. Click the Add button in the Layers box to add the query to the map.
7. Choose Query > Find Selection to select all segments in the Map window that match your query criteria. In our example, all segments for I-84 are selected.
Note If you are concerned about the map drawing speed after you have added the query to your map, you can make the query layer invisible by clearing the Visible check box for that layer in Layer Control. The objects can still be selected, but the map will only draw the objects once instead of twice.
Seamless Map Data Descriptions
Display CharacteristicsThe Seamless map layers have the same display characteristics as the county-level map layers. Refer to the individual layer descriptions in Data Descriptions in Appendix A on page 98 for more information.
Table StructureThe table structure for the each seamless map layer contains the path and file name information that MapInfo Professional and MapX need to create the seamless map. Think of this table structure as a series of pointers to the county-level map layer where the actual map object information is stored. This table is internal to MapInfo Professional and MapX.
File Naming ConventionThe file naming convention for seamless maps is as follows:
Fields Description Type(Width) Indexed
Table File name and path for each county (e.g., ..\ca\caalam\caalams.tab; ..\wa\waking\wakingh.tab).
char(100) no
Description Description of the table referred to in the Table column (e.g., Alameda, CA Streets; King, WA Highways).
char(40) no
StreetInfo Layer Convention Example
Streets Two-letter state abbreviation + _strts tx_strts.tab
Highways Two-letter state abbreviation + _hiway tx_hiway.tab
54 StreetInfo 9.0

Chapter 5: Working with StreetInfo Seamless Maps
1 Sub MCD boundaries are for Puerto Rico only.
The file naming convention for the statewide seamless workspace is ss_map.wor, where ss is the two-letter state abbreviation. For example, the workspace for Kentucky is ky_map.wor.
The files for the seamless maps are found on the StreetInfo CD-ROM under the \state abbreviation\_seam folder.
Railroads Two-letter state abbreviation + _rail tx_rail.tab
City Boundaries Two-letter state abbreviation + _poppl tx_poppl.tab
MCD Boundaries Two-letter state abbreviation + _mcd tx_mcd.tab
Sub-MCD Boundaries Two-letter state abbreviation1 + _submc pr_submc.tab
Native American Lands Two-letter state abbreviation + _natam tx_natam.tab
Voting Districts Two-letter state abbreviation + _vote tx_vote.tab
Cultural Points Two-letter state abbreviation + _ptcul tx_ptcul.tab
Municipal Points Two-letter state abbreviation + _ptmun tx_ptmun.tab
Natural Point Locations Two-letter state abbreviation + _ptnat tx_ptnat.tab
Area Landmarks Two-letter state abbreviation + _areas tx_areas.tab
Rivers Two-letter state abbreviation + _watrv tx_watrv.tab
Water Boundaries Two-letter state abbreviation + _watbd tx_watbd.tab
Interstate Shields Two-letter state abbreviation + _ishld tx_watbd.tab
State Route Shields Top Two-letter state abbreviation + _rhtsh tx_rhtsh.tab
State Route Shields Bottom Two-letter state abbreviation + _rhbsh tx_rhbsh.tab
StreetInfo Layer Convention Example
Product Guide 55

Seamless Map Data Descriptions
56 StreetInfo 9.0

6
Appending TablesStreet Append is a StreetInfo utility program that combines layers of data or creates seamless maps from two or more counties.
In this Chapter:
About Street Append . . . . . . . . . . . . . . . . . . . . . . . . . . . . . . . . . . . .58When Do I Append Tables/Use Seamless Maps? . . . . . . . . . . . . .58Using Street Append . . . . . . . . . . . . . . . . . . . . . . . . . . . . . . . . . . . .59

About Street Append
About Street AppendIncluded with StreetInfo is a MapBasic application that enables you to combine counties of data for easier usage. With it you can either append tables together or create seamless maps. Each operation results in one table for each layer for the counties you select.
Use Street Append if you routinely work with multiple counties of data and don’t want the extra work of opening and displaying data by county. For example, to change the display for a layer across multiple counties, append the layers of the desired counties and apply the display change to the new table.
Street Append runs from MapInfo Professional’s Tools menu. It works for all layers of StreetInfo.
When Do I Append Tables/Use Seamless Maps?Since Street Append gives you a choice of appending tables or making seamless maps, you need to decide which end result is best for you. Make your decision based on how you expect to use the data.
Create appended tables with Street Append when you want to create subsets of data for easier portability. For example, you need to distribute regional street data to sales reps in the field. By combining all the counties for each region, you only have to send one table per layer to the field for their region instead of multiple county tables. The file size of the appended table is about the same as the original county tables.
Appended tables work exactly like other tables in MapInfo Professional. You can browse the appended table in a single Browser window. You may directly access the data through the Query menu.
With seamless maps the Browse and Query features are not available. You can, however, query the base table and add the query to your map. For more on working with seamless maps see Working with StreetInfo Seamless Maps in Chapter 5 on page 49.
Unlike appending tables, when you create a seamless map, you are not making a complete copy of the data. You are creating a table that stores information about what tables make up the seamless map and where they are located.
Seamless maps are useful when you want to access multiple counties as a unit without the need to store the data locally and create appended tables.
58 StreetInfo 9.0

Chapter 6: Appending Tables
Using Street AppendTo run the StreetInfo Append utility, follow the procedure below:
1. Start MapInfo Professional.
2. Choose Run MapBasic Program from the File menu. MapInfo Professional displays the Run MapBasic Program dialog box.
Figure: Run MapBasic Program (STRTAPND.MBX)
3. Choose STRTAPND.MBX from the \MapInfo\Utils folder and click Open. The application is added to the MapInfo Professional Tools menu.
4. Choose Tools > Street Append > Append Street Layers. The Select Counties to Append or Make Seamless dialog box displays.
Product Guide 59

Using Street Append
Figure: Select Counties to Append or Make Seamless
5. Choose at least two counties that you want to combine. Shift-click to highlight consecutive counties or Control-click to choose non-consecutive counties. Click Next.
The Select Layers to Append or Make Seamless dialog box displays.
Figure: Select Layers to Append or Make Seamless
6. Choose one or more layers for which you want new tables. Under the Options group choose Append Selected Layers or Make Seamless Map from Selected Layers. Provide a base name in the box labeled Base Name for New Tables. Specify
60 StreetInfo 9.0

Chapter 6: Appending Tables
the folder in which the new table(s) will be stored. Street Append will create the folder if it does not exist. Click OK. The operation proceeds to completion.
At the conclusion of the append process, you will find in the folder one table for each layer you appended or made seamless. The files use the same naming convention as county-level tables: a one- or two-character layer identifier added to the table’s base name. For example, the new table for the Highways layer is drive:\folder\basenameH.tab, where H is the layer identifier for the Highways layer. For more on the file naming convention, see Highway Layer File Naming Convention in Chapter A on page 104.
Product Guide 61

Using Street Append
62 StreetInfo 9.0

7
Using the Highway Shields ManagerThe Highway Shields Manager is a MapBasic application that allows you to open and close the Highway Shields layers included in StreetInfo and to create new shields and layers according to your own needs.
In this Chapter:
Understanding Highway Shields. . . . . . . . . . . . . . . . . . . . . . . . . . .64Using the Highway Shield Manager . . . . . . . . . . . . . . . . . . . . . . . .65

Understanding Highway Shields
Understanding Highway ShieldsStreetInfo contains two types of highway shield layers: Interstate Shield layer and Routes/ Highway Shield layer. Each type is contained in separate tables, organized by county. (Table specifications are discussed in Data Descriptions in Appendix A on page 98.)
Contained in the shield layers are fixed-point shields. When the layer is added to a Map window, the shields display on top of the appropriate Interstate or highway to identify its route number.
Figure: Shields Layer with Shields Displaying
The Interstate shields are contained in a single table per county. The default display is a 22 point shield consisting of a red top, dark blue bottom and a white label. The label is Century Gothic Bold, a True Type font that is installed on your system along with the rest of StreetInfo when you run the installer.
The default Route/Highways shields consist of graphic objects found in two tables per county: a black shield outline in one table and white background in another. The two-table arrangement is necessary to ensure that the outline and background draw in the proper order in a Map window. The Shield Manager treats the Route/Highway shield tables as one to make creating and modifying layers easier. The default display is a 22 point shield with black outline and black label using 8 point Century Gothic with a white background. The complete display details are included in Data Descriptions in Appendix A on page 98.
64 StreetInfo 9.0

Chapter 7: Using the Highway Shields Manager
Using the Highway Shield ManagerThe Shield Manager makes the task of displaying and creating shields more manageable. It’s particularly important to use it for proper placement of shield objects. The Shield Manager is installed in the MapInfo/Utils folder on your system when you install StreetInfo.
With the Shield Manager you can:
• Open and close shield layers• Change shield styles for a layer• Add/remove shield layers from a Map window• Create a new shield layer• Delete a shield layer• Create, move or delete shield objects
All changes that you make to a shield or shield layer are saved to the table at the time you make the change.
To start the Shield Manager:
1. In MapInfo Professional, from File > Run MapBasic Application, choose shldmgr.mbx from the MapInfo/Utils folder. This adds the Shields Manager to the Tools menu and creates a Shields Toolbar with three tools (New, Move and Delete).
Figure: Shields Toolbar
2. Choose the task you want to perform from the Shields Manager menu. The tasks and dialogs are explained below.
Note Shield layers are always editable. When making any changes to a shield layer the changes are permanent as soon as you make them. There is no undo functionality. To restore any pre-installed StreetInfo shield layers to original condition, copy the files from the StreetInfo CD-ROM.
Product Guide 65

Using the Highway Shield Manager
Using the New Shield Tool The New Shield tool allows you to create new shield objects and place them exactly where you want them. The New Shield tool is active only when the Map window is active.
To create a new shield:
1. Click the New Shield button on the Shield Toolbar and click the location on the highway where you want to place the shield label. The Create New Shield dialog box displays.
Figure: Create New Shield
2. Choose the highway you want to label from the list provided. If the highway has a route number, the dialog box automatically updates the label text box with the number.
3. Choose the layer that will contain the new shield. The dialog box updates with the type of shield it will create (Interstate or Route/Highways), depending on the layer you selected.
4. Choose the width of the shield and click Create.
• Automatic (adjusts the shield shape to fit a label of up to 4 characters),
• Narrow (1 character),
• Medium (2 characters),
• Medium-Wide (3 characters)
• Wide (4 characters).
The new shield displays on the highway.
Note You can only place Interstate shields in an Interstate layer and state route shields in a Route/Highways Shield layer. In order to get the expected shield style, be sure to double-check the type of layer you are adding the shield to.
Also check that your Map window projection is Longitude/Latitude NAD 83. The Shield Manager will only place shields on a map that uses that coordinate system. Use Map > Options to change the projection of your map, if necessary.
66 StreetInfo 9.0

Chapter 7: Using the Highway Shields Manager
Using the Move Shield Tool The Move Shield tool allows you to move a shield in a Map window.
1. Click the center of the shield. To make it easy to find the center, turn on Snap Mode (press the S key). When the cursor hovers over the center point a cross-hair appears.
2. Drag the shield to the new location and release the mouse button.
3. Turn Snap Mode off (press the S key).
The Move Shield tool is active only when the Map window is active.
Using the Delete Shield Tool This tool allows you to delete a shield from a layer.
1. Click the Delete button on the Shields toolbar.
2. In the Map window, click on the center of the shield you want to remove. Use Snap Mode to locate the center of the shield. There is no confirmation prompt.
Open Shield Layer CommandThe Open Shield Layer command displays the Open Shield Layer dialog box where you can choose which shield table to open from the current folder.
To open a shield layer:
1. From the Tools menu, select ShieldManager > Open Shield Layer to display the Open Shield Layer dialog box.
Figure: Open Shield Layer
Product Guide 67

Using the Highway Shield Manager
2. In the Current Directory box, locate the folder that contains the shield layer you want to open. To change to another drive, choose the drive from the Drives drop-down list. Double-click the Ellipsis button ... to move up the folder structure.
3. Choose the shield layer from the List of Shield Layers. When you highlight a shield name, the dialog box updates to show the type of shield layer (Interstate or Route/Highway), shield component table name(s), zoom layer settings and whether the layer is added to the current Map window or a new window.
4. Click OK to open the layer.
Create New Shield Layer CommandUse this command to create a new shield layer for Interstate or Route/Highway shields.
To create a new shield layer:
1. From the Tools menu, select ShieldManager > Create New Shield Layer to display the Create New Shield Layer dialog box.
Figure: Create New Shield Layer
2. Type the name of the new layer in the Shield Layer Name field.
The List of Existing Shield Layers shows you the names of layers that already exist in the folder.
3. In the New Shield Layer Properties box, choose the layer type (Interstate or Route and Highway or TransCanada), and zoom, color and shield size settings.
Note The new layer is added to the current Map window unless you specify New Mapper in the Mapping Actions box.
68 StreetInfo 9.0

Chapter 7: Using the Highway Shields Manager
4. When you have completed your selections and entries, click OK. The new layer is created.
MapInfo Professional creates a single .tab file for each new Interstate layer. For each Route/Highways layer, two .tab files are created.
Note The new layer does not contain any shields. See Using the New Shield Tool on page 66 for instructions on creating new shields.
Shield Layer ControlThis command allows you to control which shield layers are in the current Map window. Highlight the layer in the left list and click the Remove button to remove the layer from the map. Highlight the layer in the right list and click Add to display the layer in the Map window.
Change Styles of Shield Layer CommandThis command displays the Change Styles of Shield Layer dialog box where you can change the style attributes of the Interstate and Route/Highways layers.
To change shield layer styles:
1. From the Tools menu, select ShieldManager > Change Styles of Shield Layer to display the Change Styles of Shield Layer dialog box.
Figure: Change Styles of Shield Layer
2. From the drop-down list, choose the shield layer that you want to change. The dialog box automatically updates with the type of shield layer and displays the current color settings, shield size and font settings.
3. Make the changes you want and click Apply. For Interstates, you can change the top and bottom color of the shield. For the Route and Highways shields, change the shield outline and/or the background.
Product Guide 69

Using the Highway Shield Manager
You have a lot of control over how the shields will display. Here are a few things to keep in mind when changing the look of shields.
• Any changes you make here will be applied to all shields in the layer. For example, if you change the bottom portion of the Interstate shield to green, all Interstate shield bottoms will display in green. If you want to change only a few of the shields, create a new layer, create new shields and set the style options for that layer.
• The shield layers are always editable, regardless of the setting in Layer Control. As soon as you apply the changes to the layer, they are permanent. There is no need to save the table before you close it.
• Adjusting the shield point size will allow you to accommodate a label of up to four characters, the maximum label size allowed. The default size is 22 points.
Close Shield Layer CommandThe Close Shield Layer dialog box allows you to close a shield layer.
To close a shield layer:
1. From the Tools menu, select ShieldManager > Close Shield Layer to display the Close Shield Layer dialog box.
2. Choose the layer you want to close from the list and click Close. The layer is removed from the Map window and the layer is closed.
Delete Shield Layer CommandThe Delete Shield Layer command allows you to delete the table from your system.
1. From the Tools menu, select ShieldManager > Delete Shield Layer to display the Delete Shield Layer dialog box.
2. Choose the layer you want to delete from the list and click Delete. You are prompted to confirm this action. Click OK to delete the layer from the map.
About Shield ManagerThis command displays the About Box with the current version number. Click the Auto-Load button if you want the Shield Manager to be placed on the MapInfo Professional menu bar each time you start MapInfo Professional.
Using Shield Manager ToolsChoose this command to display brief instructions on how to use the three Shield Manager tools.
ExitUse this to close the Shield Manager and remove it from the Tools menu.
70 StreetInfo 9.0

8
GeocodingIt’s likely that you have your own data that you want to display on a map with StreetInfo to learn about its distribution, trends, and patterns that you couldn’t from traditional spreadsheet displays. Before you can put your data on a map, you must first assign X and Y coordinates to each record, a process known as geocoding. MapInfo Professional assigns these coordinates by matching geographic information in your data to the geographic information in the StreetInfo map (which already has X and Y coordinates associated with its records).
For example, you want to assign X and Y coordinates to a customer record whose address is 127 Exchange Street. During geocoding MapInfo Professional reads the address and looks for a matching address in the appropriate StreetInfo Streets table. When MapInfo Professional matches 127 Exchange Street in your customer table to 127 Exchange Street in the StreetInfo table, it assigns the corresponding X and Y coordinates to your customer record. You can then view the geocoded record by mapping your customer table.
In this Chapter:
General Procedures for Geocoding . . . . . . . . . . . . . . . . . . . . . . . .72Geocoding with StreetInfo’s Geocoding Boundaries Layer. . . . .73The Geocode Dialog Box Explained. . . . . . . . . . . . . . . . . . . . . . . .74

General Procedures for Geocoding
General Procedures for GeocodingFollow the geocoding procedure below to geocode against the Streets table. StreetInfo includes a Geocoding Boundary layer to help you refine the search and increase the rate of successful matches.
Note Even though MapInfo Professional assigns X and Y coordinates to each record in your database, you cannot view these coordinates in a Browser. They are kept internal to the database.
To geocode your database:
1. In MapInfo Professional, choose File > Open Table. The Open Table dialog box displays.
Figure: Open
MapInfo Professional can directly read files formatted in dBASE, Lotus 1-2-3, Microsoft Excel, Microsoft Access, CSV, ESRI Shapefiles, and Delimited ASCII. If your file is in a different format, save the file into Delimited ASCII format and open it specifying that format. For more information on the Open dialog box, refer to the MapInfo Professional Help System.
2. Open the appropriate county Streets table. For example, to geocode your records in Monroe County, Ohio, open the Streets (OHMONRD.TAB) table for that county. The Streets table does not need to display in a Map window.
3. Open the Geocoding Boundary table (OHMONRG.TAB) for the same county. It, too, does not have to be displayed in a Map window. This layer contains the addressable boundaries for each city and town. You use this table to refine your geocoding to increase the number of successful matches. The Geocoding Boundary layer is discussed Geocoding Boundaries Layer Description on page 37.
4. Choose Table > Geocode. The Geocode dialog box displays.
72 StreetInfo 9.0

Chapter 8: Geocoding
Figure: Geocode
5. The dialog box is pre-filled with your current selections. If you have more tables open, select the appropriate tables from the drop down lists and click OK.
MapInfo Professional attempts to match the addresses in your database with the addresses in the StreetInfo table and assigns the corresponding X and Y coordinates to your records.
6. To display your geocoded records, choose Map > Layer Control and click the Add button to add your database to the Map window.
Geocoding with StreetInfo’s Geocoding Boundaries LayerThe Geocoding Boundaries layer is used to zero-in on a match for a record. For example, you want to geocode your Cook County, Illinois, customer database. One record’s address reads 112 2nd Street. Cook County contains eight towns, four of which have a 2nd Street. Your record also includes a town. Now MapInfo Professional will look for 2nd Street only inside that town boundary in the Geocoding Boundary Layer. Without the Geocoding Boundary layer, your customer record would have been geocoded to the first 2nd Street that MapInfo Professional found in the Streets file.
Alternatively, you can use the MCD boundary layer for this refining procedure.
Product Guide 73

The Geocode Dialog Box Explained
The Geocode Dialog Box ExplainedFigure: Geocode
Geocode table: Use the drop-down list to select the name of your database table.
Using column: Use the drop-down list to select the column name in your database that contains the street addresses.
Boundary column: To refine your address matching, use the drop-down list to select the column in your database that contains the city or town information.
Note You cannot choose a column to refine your search until you specify the Geocoding Boundary table in the Optional box.
Search table: Use this drop-down list to select the StreetInfo table that contains the street addresses.
For objects in column: Use this drop-down list to select the column in the StreetInfo table that contains the street information (the column called Street).
Options Refine search with table: Use the drop-down list to select the Geocoding Boundary table (root file name ends with “g” or “mc” if you want to use the MCD layer).
Using boundary column name: Use this drop-down list to select the column from the StreetInfo table that contains the geocoding boundary name (the column called CITY).
Geocoding ModeThe Geocode dialog box offers you the choice of geocoding your data automatically or interactively. When you geocode a table automatically, MapInfo Professional geocodes exact matches only and ignores all other records. This is the faster method since MapInfo Professional requires no user interaction once the geocoding process begins. When you geocode interactively, MapInfo Professional pauses when it fails to match a record and lets you select from a list of close matches. You should geocode your table using the automatic mode first and then go back and geocode interactively to match the remaining records.
74 StreetInfo 9.0

Chapter 8: Geocoding
For best geocoding results, perform one geocoding pass with the “Try Substitutions from MapInfow. abb” turned on (box is checked) and another pass with it turned off.
Note The StreetInfo installer updates the MapInfow.abb file on your system to include new abbreviation information for the street suffix Avenue. Your old MapInfow.abb has been renamed to MapInfow.abr. Both files are found in the MapInfo Professional program folder. Be sure that you are using the updated file for best geocoding results.
Other geocoding options are accessed through the Options button. See the MapInfo Professional User Guide for more information on these options.
Product Guide 75

The Geocode Dialog Box Explained
76 StreetInfo 9.0

9
Editing StreetInfo LayersWhether you want to change the line style of state highways, add or delete streets, or add landmarks to your map, you are altering, or editing, a map layer. This chapter describes two types of editing procedures: one for editing Street tables and one for editing other StreetInfo layers. You can only edit one map layer at a time.
Before you begin, be sure that you have read/write access to the tables. If you are running StreetInfo from the CD-ROM, you must first copy the files locally to edit them.
In this Chapter:
Editing Streets Layers . . . . . . . . . . . . . . . . . . . . . . . . . . . . . . . . . . .78Editing Non-Street Layers . . . . . . . . . . . . . . . . . . . . . . . . . . . . . . . .83

Editing Streets Layers
Editing Streets LayersIn the Enhanced Address Layer version of the StreetInfo product, the Streets layer is made up of three tables, two of which are editable. To edit the Streets layer, you make changes to the two component tables, which will be reflected in the main Streets table.
The associated tables for the Streets layer are called the Segments table and the Names table. The segments table contains graphic information including street segments, address ranges and class codes. The names table contains street names. You can display the segments table in a Browser, just like any other StreetInfo map. The names table must be displayed in a Browser since it does not contain any graphic information.
Both the Segments table and the Name table include a column called mi_refnum that allows you to associate street names with street segments and address ranges. This column contains MapInfo reference numbers that are common to the three component Streets tables.
In the Open dialog box, see the three Streets tables (designated by the letter ‘s’ as the seventh character) for Albany County, New York. The first table, nyalbas.tab, is the Streets map that contains both the street segments and the street names, as well as address ranges, class codes and TIGER Reference numbers. This table is loaded when opening tables through the Autoloader.
The second table, nyalbas1, contains street segments, address ranges, class codes, TIGER Reference and MapInfo reference numbers. The third table, nyalbas2, contains street names and MapInfo reference numbers. Neither the segments table nor the names table can be opened with the autoloader application. You must open these tables separately using File > Open Table.
The figures below display the nyalbas1 and nyalbas2 tables in Browsers.
Figure: Segments Table (NYALBAS1.TAB)
78 StreetInfo 9.0

Chapter 9: Editing StreetInfo Layers
Figure: Name Table (NYALBAS2.TAB)
Notice that, while there is one unique mi_refnum for each street name, different address ranges can have the same reference number. This is because each address range does not represent one street, but merely a segment of that street.
For example, the following Map window a segment of a highway is highlighted. Although this road is made up of many segments, they each have their own address ranges. Therefore, each segment has its own record. Since the segments have the same street name, they share a common MapInfo reference number.
Figure: Segments Example
It is common for two non-contiguous streets in the same county to have the same name. In some counties there may be two, three, or even more Main Streets, each in a different town or city. These street segments also share a common reference number, even though the streets may be in different towns.
Product Guide 79

Editing Streets Layers
Adding a Street to a Streets Map
Consider the case in which you want to add a new street segment to your Streets map. Since the street segment is new, you will have to add the graphic object (the line segment or polyline) and address ranges to the segments table. If the name of the street does not currently exist in the names table, you will have to add the new name to the names table.
1. Choose File > Open, and open the segments table (the s1 table) as a Map window.
2. Open the names table (the s2 table) as a Browser. Click on its title bar to make it the active window.
3. Determine if the new street segment’s name already exists in the names table. This can be done using Query > Select. Select all records from the names table where Street = “your street”.
• If no records are selected then you have to add a new record in the names table. Proceed to the next step.
• If the street name is found in the Browser, note the MI_Refnum. This is the MI_Refnum you use for the new record in the segments table. Skip to step 6.
4. Make the names Browser active by clicking on its title bar. Choose Edit > New Row from the menu. MapInfo Professional appends an empty record to the end of the Browser.
5. Type the new street name into this empty record. The new street name needs a corresponding MapInfo reference number to associate it with the street segment. It is suggested that you start labeling new names with reference numbers beginning with 100000. If you start with a large number like 100000 you can easily differentiate between the new and original reference numbers. Make any additional reference numbers sequential by adding 1 to the next new MI_Refnum. Use this number as the mi_refnum for your new street segment.
6. Make the Map window active, and choose Map > Layer Control. Make the segments layer editable.
7. Draw the new street segment in the Map window (for more information on using MapInfo Professional’s drawing tools, refer to the MapInfo Professional Online Help).
8. Click the new segment with the INFO tool. MapInfo Professional displays an Info Tool box for the segment. Type the appropriate textual information into the record’s fields: address ranges, class, and the MapInfo reference number.
• Use the MI_Refnum determined in step 3 if the street already existed in the names table;
• Otherwise, use the new MI_Refnum that you created in step 5.
9. Repeat steps 7 and 8 for each additional new segment with the same name.
Deleting a Street From a Streets MapSince deleting a street only requires deleting its graphic object, you do not have to open the names table. You only have to make the changes to the segments table.
1. Open the segments table (the s1 table) as a Map window.
2. Choose Map > Layer Control and make the segments layer editable.
80 StreetInfo 9.0

Chapter 9: Editing StreetInfo Layers
3. Using the Select tool, click the segment that you want to delete from the Map window.
4. Press the Delete key or choose Edit > Clear.
5. Repeat the process for each additional segment that you want to delete.
Reshaping a Street in a Streets MapYou may want to reshape a street in the Streets file. This may happen when StreetInfo’s source data does not reflect recent changes in a street. Since the existing segment already has a name you only have to edit the segments file.
1. Choose File > Open, and open the segments table (the s1 table) as a Map window.
2. Choose Map > Layer Control and make the segments layer editable.
3. Zoom to the location of the street that you want to reshape.
4. Click on the street that you want to reshape with the Select tool.
5. To reshape a segment, click on an endpoint, hold the mouse button down, and drag the endpoint to a new position. If the street is a polyline, choose Edit > Reshape. To reshape the polyline, follow the directions in the Reshape section of the MapInfo Professional Help.
6. Repeat the steps 3–5 for each street that you want to reshape. When you are done, save the segments table.
Editing the Name of an Existing StreetThere are two types of corrections that you might make to the street names:
• Edit the street name for all occurrences of the street. For example, when all streets that are named Elm St should actually be named Elm Av.
• Edit the street name for some occurrences of the street. For example, several streets that are currently called Unknown St should be named Oak St.
Editing the Street Name for All Occurrences of a StreetTo edit a street name for all occurrences of a street (the Elm St example above), do the following:
1. Open the names table (the s2 table) as a Browser.
2. Find the name of the street. This can be done by choosing Query > Select from the menu. Select records from your names table that satisfy Street = “your street name”.
3. In the query Browser that displays, type in the correct name of the street. The new information will be automatically updated in the names table.
4. Choose File > Save to save the changes.
Product Guide 81

Editing Streets Layers
Editing the Street Name for Some Occurrences of a StreetThere are situations where you might want to change the name of some streets that share the same name (the Unknown St example above). To rename segments like this, change the reference number of the segments you want to reflect the new name:
1. Open the names table (the s2 table) as a Browser and the segments table (the s1 table) as a Map window.
2. Determine if the new name for the group of streets already exists in the names table. This can be done using Query > Select. Select all records from the names table where Street = “your street”.
• If no records are selected then you must add a new record in the names table. Go to step 3.
• If a record is selected, note the MI_Refnum. Use this MI_Refnum for the group of streets that you select later. Skip to step 5.
3. Click the title bar of the names Browser to make it active. Add a new record to the names table using Edit > New Row.
4. Type the new street name into this empty record. The new street name needs a corresponding MapInfo reference number to associate it with the street segments. We recommend that you start labeling new names with reference numbers beginning with 100000. If you start with a large number like 100000 you can easily differentiate between the new and original reference numbers. Make any additional reference numbers sequential by adding 1 to the next new MI_Refnum. Use this number as the mi_refnum for the street segments in the next step.
5. Click the title bar of the segments Map window to make it active. Using the Select tool, click on all of the segments that you want to rename.
6. Choose Window > New Browse Window, and open a Browser for the Selection table.
7. Click the title bar of the selection Browser. Click in the MI_Refnum column of each selected record and change the MapInfo reference number to the MI_Refnum that you determined in step 2 or the MI_Refnum that you added in step 4.
8. With the names Browser active, choose File > Save to retain your changes.
Editing Street Line Styles and ColorsYou can also change the line styles and color of streets in a Streets map. For instance, you might want to indicate that a particular street segment is under repair or that a group of streets constitutes a sanitation pickup route.
1. Open nybrons1 (the segments table) as a Map window.
2. Choose Map > Layer Control. Make the nybrons1 layer editable.
3. Select all the streets that you want to change.
4. Choose Options > Line Style. The Line Style menu displays. Select a line style, color and width and click OK.
5. MapInfo Professional applies the styles you have chosen to the selected streets. To save your changes, choose the Save Table option from the File menu.
82 StreetInfo 9.0

Chapter 9: Editing StreetInfo Layers
Alternatively, you can make temporary style changes when you first open a layer with the Autoloader. From the Autoloader Open dialog box, choose the Default Display Options button to access the Options dialog box. Check the Display Style Override box and make changes to any or all of the available style pickers.
You can use any one or a combination of methods to select streets depending on the nature of your task. Use the Select tool to select segments one by one, or the Radius Select or Boundary Select tools to select many streets. You can also use Sifter.mbx, a StreetInfo application that allows you to select features by their type. Sifter is explained later in Selecting Features with SIFTER in Chapter 10 on page 87.
Editing Non-Street LayersEditing non-Street layers in StreetInfo does not involve making changes to component tables, like you do for the Streets layer. The non-Street layers consist of one table per layer (per county) instead of three, so your changes are created and saved directly to the table.
Below are general editing procedures that apply to all non-Street layers. This is followed by instructions for several common editing situations, including changing the boundary color/fill, reshaping boundaries, and changing point symbols.
General Editing ProcedureTo edit a non-Street layer:
1. Make the layer editable by choosing Map > Layer Control. The Layer Control dialog box displays.
Figure: Layer Control
2. In the Layer list, select the Editable check box (pencil icon) of the layer you want to edit.
3. Click OK. The Drawing Tools in the Toolbar become active and you are ready to make changes to the layer.
For more information on using the editing tools, refer to your MapInfo Professional Online Help.
Product Guide 83

Editing Non-Street Layers
Changing the Fill Patterns of BoundariesTo permanently change the color or fill pattern of a boundary:
1. Select the boundary using one of the selection methods discussed previously.
2. Choose Options > Region Style. The Region Style dialog box displays.
Figure: Region Style
3. Scroll through the fill and color palettes to choose the desired color/fill. Click OK to apply the changes.
To change the fill for all boundaries in the layer of a certain type, run Sifter.mbx to first select the feature and follow from step 2 above. The Sifter application is covered in Selecting Features with SIFTER in Chapter 10 on page 87.
To temporarily change the fill pattern for the entire layer, use the Autoloader to set the display before opening the layer in a Map window. If the layer is already open, in Layer Control, choose the Display button and make the changes by overriding the current style (See Changing the Display with Style Override).
Reshaping BoundariesTo reshape a boundary:
1. Select the boundary and choose Edit > Reshape. MapInfo Professional places nodes (small boxes) at every juncture where two boundary segments meet.
2. Move or delete existing nodes or add new nodes.
This is very useful if, for example, school districts or voting districts change over time. You can simply move, delete or add nodes to update the boundary. For more information on reshaping boundaries, refer to the MapInfo Professional Online Help.
84 StreetInfo 9.0

Chapter 9: Editing StreetInfo Layers
Changing Point Landmark SymbolsTo change the symbol of point landmarks:
1. Select the point(s) and choose Options > Symbol Style. Use Sifter.mbx to change all symbols of a particular feature type.
Figure: Symbol Style
2. Scroll through the symbol and color palettes and choose the desired color/symbol. Click OK to apply the changes.
Changing the Display with Style OverrideInstead of editing your map objects to make permanent changes to your StreetInfo tables, you may only need to change the way the objects display on the screen. For example, you may want to change the color of the StreetInfo water features to better match other layers in your Map window or for better printed output. Follow the instructions below to override the display style of any StreetInfo map layer.
Product Guide 85

Editing Non-Street Layers
To override the display attributes:
1. From Map > Layer Control, highlight a StreetInfo layer and click on the Display button. The Display Options dialog box displays.
Figure: Display Options
2. Check the Style Override button in the Display Mode box and click the button that represents the object’s style picker. The button or buttons that display here depend upon the type of layer you chose.
• If you select a region layer, the Region Style box displays.
• If you select a point layer, the Symbol Style box displays.
• If you select a line layer, the Line Style box displays.
3. Make the desired style changes. Click OK to return to Layer Control. Click OK again to return to the Map window. The layer re-displays using the new style attributes.
You can also override the styles for a layer when you open it via the Autoloader. See the Autoloader Open dialog box discussion for details.
86 StreetInfo 9.0

10
Selecting Features with SIFTERThere are many ways to select objects (individually, using selecting tools, using Select and SQL statements) and many reasons to do so (to create subsets of objects for further analysis or to change their display). This section covers a StreetInfo utility program, called SIFTER (StreetInfo FeaTure PickER), that allows you to choose features by natural language type instead of querying with a cryptic code.
In this Chapter:
About SIFTER . . . . . . . . . . . . . . . . . . . . . . . . . . . . . . . . . . . . . . . . . .88Using SIFTER . . . . . . . . . . . . . . . . . . . . . . . . . . . . . . . . . . . . . . . . . .88

About SIFTER
About SIFTERNearly every layer in StreetInfo can be queried using SIFTER. The exceptions are the Voting Districts, School Districts, Elevation Contours and Sub-MCDs. SIFTER reads the field that describes the type of feature for each record. Many of the layers contain a Census Feature Class Code (CFCC) that SIFTER searches. Other layers contain a Type field to explain the feature subsets in a layer. In the case of the Highways layer, SIFTER uses the pen/brush types to differentiate among the several types of highways.
SIFTER allows you to specify what feature you want to select. It then searches the table(s) and matches your criteria to the CFCC table. SIFTER returns the results by displaying the selection in a Map window, Browser, or neither. You can also save the selection as a new table, if you choose.
SIFTER can search more than one county for the same feature. It is limited to searching for features contained in the same layer, however. For example, you can search for all schools and churches in multiple counties in a single pass since they both reside in the Cultural Points layer. You cannot, however, search for schools and MCDs at the same time.
Using SIFTERTo select features with SIFTER:
1. From File > Run MapBasic Program, choose sifter.mbx from the MapInfo/Utils folder. The SIFTER program is added to the MapInfo Professional menu.
2. With StreetInfo tables open, choose Tools > Sifter > Pick Features. The Feature Picker Step 1 of 2 dialog box displays.
Figure: Feature Picker Step 1 of 2
3. At the Table Type drop-down list, choose the type of table from which you want to select feature.
4. In the Counties list, highlight one or more county names that you want the SIFTER to search and click the Next button. The Feature Picker Step 2 of 2 dialog box displays.
88 StreetInfo 9.0

Chapter 10: Selecting Features with SIFTER
Figure: Feature Picker Step 2 of 2
5. From the Feature Type drop-down list, choose the feature type you want to search. You are limited to one feature category. The Feature list box updates with the sub-categories of the Feature Type you specified.
6. Choose one or more feature(s) that you want the SIFTER to search for.
7. Set the Preferred View for your selection: Mapper, Browser or No View.
8. Choose whether you want to save the selection Now (default) or Later.
If you are saving features now from multiple counties, specify whether you want to save as:
• One Table. This option saves the selected features as one table.
• Separate Tables. If you select this option, choose whether you want to Type-in Table Names (for example, SchoolsNY, SchoolsMA, SchoolsCT), or whether you want the SIFTER to Auto-increment Table Names to provide generated table names that build on the initial file name you supply. For example, the county selections would be named Schools_1, Schools_2, Schools_3.
9. Click OK. SIFTER searches the county tables for the requested features.
10. To save your selection at a later time, choose Tools > Sifter > Save Subsets and select the appropriate subset from the list.
11. To exit SIFTER, choose Tools > Sifter > Exit Program. SIFTER closes and the program is removed from the menu bar.
Product Guide 89

Using SIFTER
90 StreetInfo 9.0
11
Using MapInfo Workspace FilesThis chapter discusses the MapInfo Workspace (MWS) file format. If you have further questions about the topic discussed in this section, we suggest you discuss them with the MapInfo Technical Support personnel in your geography.
In this section:
Understanding MWS Workspaces . . . . . . . . . . . . . . . . . . . . . . . . .92Comparing MWS Files to GST Files . . . . . . . . . . . . . . . . . . . . . . . .92

Understanding MWS Workspaces
Understanding MWS WorkspacesIn response to many users’ requests, we at the MapInfo Corporation have created a file format that will eventually allow all users of MapInfo products, regardless of platform (mainframe, client/server, etc.) or operating system (Windows, Unix, Linux, etc.) to share their maps. Using MapXtreme 2004, you can store map content and settings in an XML-based workspace (with a .MWS extension) and will be able to share them with a wide variety of users using MapInfo products. In StreetInfo U.S. every geography contains an XML-based workspace to use your data within MapXtreme 2004.
MWS files can also contain settings for browser and layout windows, graphs, legends, and sometimes even printer settings.
Our XML documents use textual identifiers, and, where possible, we have used identifiers defined by XML standards organizations. However, XML allows for identifiers to be added by any document author to clarify the meaning of the data used in the document. To ensure that these identifiers are clearly labelled as defined by MapInfo Corporation, we specify them in what we call the MapInfo Codespace.
Note You can create MWS files for your StreetInfo U.S. based maps in MapInfo Professional 7.8 or later, but you cannot display them there. Use MapXtreme 2004 or later to display maps in the MWS format.
To open an XML-based MWS file in MapXtreme 2004:
1. Open the Workspace Manager.
2. Choose one of the following:
• Click the Open icon on the Button Bar.
• From the File menu, select Open.
and select the MWS file you want to open from your data folder.
Comparing MWS Files to GST FilesMany users of StreetInfo data may be familiar with the geoset format used for MapX applications. This text file contains the parameters of map and its requisite layers.
The XML-based workspace format contains the same information and allows for more flexibility. For more information about MWS files, see the MapXtreme 2004 Developer Guide.
Both MapXtreme 2004 and MapX have project files that can display the following map of an area just south of Providence, Rhode Island. The following example is drawn from StreetPro but applies to StreetInfo as well.
92 StreetInfo 9.0

Chapter 11: Using MapInfo Workspace Files
Each project file (*.MWS for MapXtreme 2004 and *.GST for MapX) contains important differences in how the information is stored, the nomenclature that is used, and where the information is found.
Below is a table that indicates the general location and syntax of each important section of information in the GST or MWS file. Note that in the example below we use the Rhode Island Area Landmarks table (RIAL.TAB) as an example.
Product Guide 93

Comparing MWS Files to GST Files
.
Information Rhode Island Geoset (GST) Rhode Island MapInfo Workspace (MWS)
General Map Settings (Zoom, Coordsys)
Found at the top of the file in the header:
"\GEOSET\NAME" = "Rhode_Island""\GEOSET\PROJECTION" = "1,33""\GEOSET\ZOOMLEVEL" = "10""\GEOSET\AUTOLAYER" = "FALSE""\GEOSET\CENTER"
= "-71.4192,41.8219""\GEOSET\MBR\LOWERLEFT" = "0,0""\GEOSET\MBR\UPPERRIGHT" = "0,0"
Found underneath <MapDefinitionSet> partway down the file:.
<MapDefinition id="id43"name="RIMAP" alias="rimap">
<DisplayConditions><MapSize uom="mapinfo:imagesize pixel">
<ImageWidth>348</ImageWidth><ImageHeight>180</ImageHeight>
</MapSize><ZoomAndCenter>
<MapZoom uom="mapinfo:length mi">123.291203
</MapZoom><gml:Point
srsName="mapinfo:coordsys 1,33">
<gml:coordinates>-71.497913,41.557321000468278</gml:coordinates></gml:Point>
</ZoomAndCenter><DisplayCoordSys><SRSName>mapinfo:coordsys 1,33</SRSName></DisplayCoordSys>...
Data source(table location)
Each table has its own section that completely describes all information about it, including location:
"\TABLE\47\FILE" = "rial.tab""\TABLE\47\ISVISIBLE" = "TRUE"
The section of the geoset where this information is found is dependent upon where the layer is found in the map. Because the layer is found at the bottom of the map the layer's information is found at the end of the GST file.
The datasource information for each layer is found at the beginning of the MWS file in the <DataSourceDefinitionSet> section
<DataSourceDefinitionSet><TABFileDataSourceDefinition
id="id1" readOnly="false"><DataSourceName>rial</DataSourceName><FileName>rial.tab</FileName>
</TABFileDataSourceDefinition>
Note the "id1" information above. All later references to this datasource (in labeling or feature display) are based on this identifier.
94 StreetInfo 9.0

Chapter 11: Using MapInfo Workspace Files
Label Information
Label information is found in the self-contained section for each layer.
"\TABLE\47\FILE" = "rial.tab""\TABLE\47\ISVISIBLE" = "TRUE""\TABLE\47\ZOOM\MIN" = "0""\TABLE\47\ZOOM\MAX" = "30""\TABLE\47\AUTOLABEL" = "TRUE""\TABLE\47\LABEL\DUPLICATE"
= "FALSE""\TABLE\47\LABEL\OVERLAP"
= "FALSE""\TABLE\47\LABEL\PARALLEL"
= "TRUE""\TABLE\47\LABEL\ALONG" = "1""\TABLE\47\LABEL\POSITION" = "0""\TABLE\47\LABEL\OFFSET" = "0""\TABLE\47\LABEL\ZOOM\MIN" = "0""\TABLE\47\LABEL\ZOOM\MAX" = "10""\TABLE\47\LABEL\FONT\STYLE"
= "0""\TABLE\47\LABEL\FONT\EXTSTYLE"
= "1""\TABLE\47\LABEL\FONT\DESCRIPTION"
= "Arial""\TABLE\47\LABEL\FONT\SIZE"
= "8""\TABLE\47\LABEL\FONT\FORECOLOR"
= "0""\TABLE\47\LABEL\FONT\BACKCOLOR"
= "16777215""\TABLE\47\LABEL\PARTIALSEGMENTS"
= "FALSE"...
Label information is found in a "label layer".
<LabelSourcemaxLabels="2147483647" name="ri~ areas">
<Visibility visible="true"><VisibleRange
enabled="true"><ZoomRange uom="mapinfo:length mi"minInclusive="true"maxInclusive="false">0 13</ZoomRange>
</VisibleRange></Visibility><DataSourceRef ref="id1" /><BaseLabelProperties><LabelProperties><LabelVisibility
visible="true"/>...
Information Rhode Island Geoset (GST) Rhode Island MapInfo Workspace (MWS)
Product Guide 95

Comparing MWS Files to GST Files
Feature (geographic object) Display Information
Feature Display information is found in the self-contained section for each layer:
"\TABLE\47\FILE" = "rial.tab""\TABLE\47\ISVISIBLE" = "TRUE""\TABLE\47\ZOOM\MIN" = "0""\TABLE\47\ZOOM\MAX" = "30”
Geographic display properties (zoom constraints, display themes, etc.) for the area landmarks are found in a FeatureLayer. Note the user of "id1" as a reference to the data source..
<FeatureLayer id="id104" name="ri~ areas" alias="rial"volatile="unknown">
<Visibility visible="true"><VisibleRange enabled="true"><ZoomRange uom="mapinfo:length
mi"minInclusive="true"maxInclusive="true">0 30
</ZoomRange></VisibleRange></Visibility><DataSourceRef ref="id1" />
</FeatureLayer>
Information Rhode Island Geoset (GST) Rhode Island MapInfo Workspace (MWS)
96 StreetInfo 9.0

Chapter 11: Using MapInfo Workspace Files
Product Guide 97

A
Data DescriptionsThis appendix provides a data reference to all the feature layers included with StreetInfo. The information includes display characteristics, table structure, file naming convention and other feature-specific information.
The data for StreetInfo was derived from U.S. Census Bureau TIGER 2006 files which uses a coordinate system of Longitude/Latitude NAD 83. Other sources of information were used for some layers, and are noted in the discussions that follow.
In this Appendix:
Overview of Data Descriptions . . . . . . . . . . . . . . . . . . . . . . . . . . . .99Display Streets Data Descriptions . . . . . . . . . . . . . . . . . . . . . . . . .99Highways. . . . . . . . . . . . . . . . . . . . . . . . . . . . . . . . . . . . . . . . . . . . .104Highway Shields. . . . . . . . . . . . . . . . . . . . . . . . . . . . . . . . . . . . . . .105Railroads . . . . . . . . . . . . . . . . . . . . . . . . . . . . . . . . . . . . . . . . . . . . .109Municipal Points . . . . . . . . . . . . . . . . . . . . . . . . . . . . . . . . . . . . . . . 111Cultural Point Locations . . . . . . . . . . . . . . . . . . . . . . . . . . . . . . . .112Natural Point Locations . . . . . . . . . . . . . . . . . . . . . . . . . . . . . . . . .114City Boundaries . . . . . . . . . . . . . . . . . . . . . . . . . . . . . . . . . . . . . . .115County Boundaries . . . . . . . . . . . . . . . . . . . . . . . . . . . . . . . . . . . .117Minor Civil Divisions (MCD) Boundaries . . . . . . . . . . . . . . . . . . .118Sub-MCD Boundaries . . . . . . . . . . . . . . . . . . . . . . . . . . . . . . . . . .118Area Landmarks . . . . . . . . . . . . . . . . . . . . . . . . . . . . . . . . . . . . . . .119Geocoding Boundaries . . . . . . . . . . . . . . . . . . . . . . . . . . . . . . . . .122Water Boundaries. . . . . . . . . . . . . . . . . . . . . . . . . . . . . . . . . . . . . .123Rivers . . . . . . . . . . . . . . . . . . . . . . . . . . . . . . . . . . . . . . . . . . . . . . .124School District Boundaries . . . . . . . . . . . . . . . . . . . . . . . . . . . . . .126Voting District Boundaries . . . . . . . . . . . . . . . . . . . . . . . . . . . . . .127Native American Lands . . . . . . . . . . . . . . . . . . . . . . . . . . . . . . . . .128Elevation Contours . . . . . . . . . . . . . . . . . . . . . . . . . . . . . . . . . . . .130

Appendix A: Data Descriptions
Overview of Data DescriptionsStreetInfo covers the United States, including all 50 states, District of Columbia, Puerto Rico, Virgin Islands, and Guam. It is available for purchase for the entire United States, by state, county or six-state packs.
Two items are common to all of the tables in StreetInfo: metadata and cartographic legend support.
• Metadata – All tables contain metadata that describes aspects of the content including spatial data information (bounding coordinates, number and type of objects), and keyword verbiage (keywords for the geography and type of content). This data is stored in the .tab file and can be access in one of two ways. The first is to open up the .tab file in a text editor. The .tab file is simple ASCII text and the metadata can be found at the bottom of this text, displayed in a "<key name>"="<key value>" format. The second method to access this metadata is through the MapInfo Professional Tool "Table Manager" which is accessible through Tools > Tool Manager > Table Manager.
• Cartographic Legend Support – In MapInfo Professional a user has the ability to create a Cartographic Legend for any Map Window. For map windows containing StreetInfo data (opened through the Autoloader, Workspaces or File>Open) choose Map > Create Legend to create a bilingual cartographic legend. For further information on Cartographic Legends (including information on user options, using, and editing), please see the MapInfo Professional documentation.
Display Streets Data Descriptions
Streets Layer Display Characteristics
Type of Information Description of Object Graphic Object Details
Primary Highways Dark red, double pixel, solid line Pen(2, 2, 16711680)
Secondary Highways Dark green, double pixel, solid line Pen(2, 2, 32768)
Roads Dark grey, single pixel, solid line Pen(1, 2, 8421504)
Trails Dark grey, single pixel, dashed line Pen(1, 6, 8421504)
Product Guide 99© 2007 MapInfo Corporation. All rights reserved.

Display Streets Data Descriptions
Streets Layer Table Structure
Addressed Streets (Enhanced Address Layer Product Only)
Field Contents Type(length) Indexed
Street Street name char(40) yes
Class General classification of road segment:1 = street, local road2 = primary highway3 = secondary highway4 = trail
integer no
Table StructureField Contents Type(length) Indexed
Street Street name Char(40) yes
FromLeft Starting address range on the left side of street
integer no
ToLeft Ending address range on the left side of street integer no
FromRight Starting address range on the right side of street
integer no
ToRight Ending address range on the right side of street
integer no
TIGER_Refnum TIGER Line ID. A unique reference number for each segment
char(10) no
ZIP_Left 5-digit ZIP Code on left side of the street segment
char(5) no
ZIP_Right 5-digit ZIP Code on right side of the street segment
char(5) no
Class Census Feature Class Code (CFCC). See below for values and definitions
char(3) no
100 StreetInfo 9.0© 2007 MapInfo Corporation. All rights reserved.

Appendix A: Data Descriptions
Streets Layer Census Feature Class Code
Class Description
A1 Class: Primary Highway With Limited Access Interstate highways and some toll highways are in this category and are distinguished by the presence of interchanges. These highways are accessed by way of ramps and have multiple lanes of traffic. The opposing traffic lanes are divided by a median strip. The TIGER/Line ® files may depict these opposing traffic lanes as two distinct lines in which case, the road is called separated.
A11 Primary road with limited access or interstate highway, unseparated.
A12 Primary road with limited access or interstate highway, unseparated, in tunnel.
A13 Primary road with limited access or interstate highway, unseparated, underpassing.
A14 Primary road with limited access or interstate highway, unseparated, with rail line in center.
A15 Primary road with limited access or interstate highway, separated.
A16 Primary road with limited access or interstate highway, separated, in tunnel.
A17 Primary road with limited access or interstate highway, separated, underpassing.
A18 Primary road with limited access or interstate highway, separated, with rail line in center.
A2 Class: Primary Road Without Limited Access This category includes nationally and regionally important highways that do not have limited access as required by category A1. It consists mainly of US highways, but may include some state highways and county highways that connect cities and larger towns. A road in this category must be hardsurface (concrete or asphalt). It has intersections with other roads, may be divided or undivided, and have multilane or single-lane characteristics.
A21 Primary road without limited access, U.S. highways, unseparated.
A22 Primary road without limited access, U.S. highways, unseparated, in tunnel.
A23 Primary road without limited access, U.S. highways, unseparated, underpassing.
A24 Primary road without limited access, U.S. highways, unseparated, with rail line in center.
A25 Primary road without limited access, U.S. highways, separated.
A26 Primary road without limited access, U.S. highways, separated, in tunnel.
A27 Primary road without limited access, U.S. highways, separated, underpassing.
Product Guide 101© 2007 MapInfo Corporation. All rights reserved.

Display Streets Data Descriptions
A28 Primary road without limited access, U.S. highways, separated, with rail line in center.
A3 Class: Secondary and Connecting Road This category includes mostly state highways, but may include some county highways that connect smaller towns, subdivisions, and neighborhoods. The roads in this category are smaller than roads in Category A2, must be hard surface (concrete or asphalt), and are usually undivided with single lane characteristics. These roads usually have a local name along with a route number and intersect with many other roads and driveways.
A31 Secondary and connecting road, state highways, unseparated.
A32 Secondary and connecting road, state highways, unseparated, in tunnel.
A33 Secondary and connecting road, state highways, unseparated, underpassing.
A34 Secondary and connecting road, state highways, unseparated, with rail line in center.
A35 Secondary and connecting road, state highways, separated.
A36 Secondary and connecting road, state highways, separated, in tunnel.
A37 Secondary and connecting road, state and county highways, separated, underpassing.
A38 Secondary and connecting road, state and county highway, separated, with rail line in center.
A4 Class: Local, Neighborhood, and Rural Road A road in this category is used for local traffic and usually has a single lane of traffic in each direction. In an urban area, this is a neighborhood road and street that is not a thoroughfare belonging in categories A2 or A3. In a rural area, this is a short-distance road connecting the smallest towns; the road may or may not have a state or county route number. Scenic park roads, unimproved or unpaved roads, and industrial roads are included in this category. Most roads in the Nation are classified as A4 roads.
A41 Local, neighborhood, and rural road, city street, unseparated.
A42 Local, neighborhood, and rural road, city street, unseparated, in tunnel.
A43 Local, neighborhood, and rural road, city street, unseparated, underpassing.
A44 Local, neighborhood, and rural road, city street, unseparated, with rail line in center.
A45 Local, neighborhood, and rural road, city street, separated.
A46 Local, neighborhood, and rural road, city street, separated, in tunnel.
A47 Local, neighborhood, and rural road, city street, separated, underpassing.
Class Description
102 StreetInfo 9.0© 2007 MapInfo Corporation. All rights reserved.

Appendix A: Data Descriptions
A48 Local, neighborhood, and rural road, city street, separated, with rail line in center.
A5 Class: Vehicular Trail A road in this category is usable only by four-wheel drive vehicles, is usually a one lane dirt trail, and is found almost exclusively in very rural areas. Sometimes the road is called a fire road or logging road and may include an abandoned railroad grade where the tracks have been removed. Minor, unpaved roads usable by ordinary cars and trucks belong in category A4, not A5.
A51 Vehicular trail, road passable only by 4WD vehicle, unseparated.
A52 Vehicular trail, road passable only by 4WD vehicle, unseparated, in tunnel.
A53 Vehicular trail, road passable only by 4WD vehicle, unseparated, underpassing.
A6 Class: Road with Special Characteristics This category includes roads, portions of a road, intersections of a road, or the ends of a road that are parts of the vehicular highway system and have separately identifiable characteristics.
A61 Cul-de-sac, the closed end of a road that forms a loop or turnaround.
A62 Traffic circle, the portion of a road or intersection of roads forming a roundabout.
A63 Access ramp, the portion of a road that forms a cloverleaf or limited access interchange.
A64 Service drive, the road or portion of a road that provides access to businesses, facilities, and rest areas along a limited access highway; this frontage road may intersect other roads and be named.
A65 Ferry crossing, the representation of a route over water that connects roads on opposite shores; used by ships carrying automobiles or people.
A7 Class: Road as Other Thoroughfare A road in this category is not part of the vehicular highway system. It is used by bicyclists or pedestrians, and is typically inaccessible to mainstream motor traffic except for private owner and service vehicles. This category includes foot and hiking trails located on park and forest land, as well as stairs or walkways that follow a road right-of-way and have names similar to road names.
A71 Walkway or trail for pedestrians, usually unnamed.
A72 Stairway, stepped road for pedestrians, usually unnamed.
A73 Alley, road for service vehicles, usually unnamed, located at the rear of buildings and property.
A74 Driveway or service road, usually privately owned and unnamed, used as access to residences, trailer parks, and apartment complexes, or as access to logging areas, oil rigs, ranches, farms, and park lands.
Class Description
Product Guide 103© 2007 MapInfo Corporation. All rights reserved.

Highways
Streets Layer File Naming Convention
SSCCCCd.tab, where SS equals the two-letter state abbreviation, CCCC represents the three or four-letter county abbreviation, and D is the display streets layer identifier. For example, the Display Streets file name for Maricopa County, Arizona, is AZMARID.tab.
The Streets layer is a relational database containing three tables: a map object table, a streets address range table and a street names table. The file naming convention for the address range and names tables use the identifiers S1 and S2, respectively.
Highways
Highway Layer Display CharacteristicsThe chart below shows the display for each type of feature in the Highways table.
Highway Layer Table StructureThe chart below shows the data fields and contents that are part of each Highways table.
Highway Layer File Naming ConventionSSCCCCH.tab, where SS equals the two-letter state abbreviation, CCCC represents the three or four-letter county abbreviation, and H as the highway layer identifier. For example, the Highways file name for Maricopa County, Arizona, is AZMARIH.tab.
Feature Description of Object Graphic Object Details
Primary Highways Red, straight, three-pixel lines
Pen(3, 2, 16711680)
Secondary Highways Green, straight, two-pixel lines
Pen(2, 2, 32768)
Field Description Type(Width) Indexed
Highway Highway Name char(40) yes
104 StreetInfo 9.0© 2007 MapInfo Corporation. All rights reserved.

Appendix A: Data Descriptions
Highway Shields
Highway Shield Layer Display Characteristics
Highway Shield Layer Table Structure
Highway Shield Layer File Naming ConventionThe Highway Shields tables are organized by county and type of shield, either Interstate or Route/Highway shields. The Interstate shield table includes a single .tab file for each county. The file naming convention is as follows:
SSCCCCX1.tab where SS = two-letter state abbreviation, CCCC = up to four-letter county abbreviation, and X1 = Interstate.
For example, the file name for the Cook County, Illinois, Interstate table is ILCOOKX1.tab.
The Route/Highway shields table consists of two .tab files for each county. One .tab file contains the shield outline and label text, which is used to autolabel, while the second .tab file holds the shield background. The two-file arrangement is necessary to ensure that MapInfo Professional will draw the state shield in the proper order (shield outline and text on top of the background).
Feature Description of Object Display Details
Interstate Highway Interstate Highway shield symbol with red top, dark blue bottom, white text
Graphic objects: Red top MapInfo Shields (22, 16711680); blue bottom MapInfo Shields (22, 255);Autolabel setting: Century Gothic (1, 8, 16777215), offset position center, allow text overlap, allow duplicate labels
State Route Highway State Route Highway shield with black outline and text
Graphic objects:MapInfo Shields (22, 0, 16777215); Autolabel setting: Century Gothic, (1, 8, 0), offset position center, allow text overlap, allow duplicate labels
Field Description Type(Width) Indexed
HwyNumber Text for labeling char(10) no
Highway field currently not used char(30) no
HighwayType field currently not used char(20) no
Product Guide 105© 2007 MapInfo Corporation. All rights reserved.

Highway Shields
The naming convention for the Route /Highway files are:
SSCCCCY1.tab and SSCCCCY2.tab, where SS = two–letter state abbreviation, CCCC = up to four-letter county abbreviation, Y1 = Route/Highway shield outline/text and Y2 = Route/Highway shield background.
For the Cook County, Illinois, example, the Route/Highway file names are: ILCOOKY1.tab and ILCOOKY2.tab, for the outline and background, respectively.
The Shields tables are further identified by display names that appear in dialog boxes whenever the table is open. The display name is contained in the table’s metadata under the key name \Shields\LogicalName. MapInfo Professional reads the metadata when the table is opened with the Shield Manager and uses that name in Map window title bars and dialog boxes. To differentiate between the Route/Highways outline and background tables, the display name is further identified by logicalname_Top and logicalname_Bot.
When you create new shield layers using the Shield Manager, you may give the layer any name you wish. From that name, MapInfo Professional creates a .tab file name by truncating it to the first six characters and adding an X1, Y1, or Y2, for Interstate, Route/Highway shield outline, or Route/Highway shield background, respectively.
If the table name already exists, the Shield Manager will increase the X and Y designators by one or more to create a unique file name. For Interstate tables, the physical file name would be SSCCCCX2.tab, and so on. In the case of Route/Highway tables, the outline and background pair would be SSCCCCY3.tab and SSCCCCY4.tab, or SSCCCCY5.tab and SSCCCCY6.tab, etc.
Figure: Shields .TAB File in Notepad
The table’s metadata stores display name and the .tab file name, along with other helpful information. To view it, open the .tab file in any text editor or run tablemgr.mbx, found in the MapInfo Professional Tools folder.
The metadata keys and values are explained below.
106 StreetInfo 9.0© 2007 MapInfo Corporation. All rights reserved.

Appendix A: Data Descriptions
Frequently Asked Questions about Highway Shields
I cannot place shields in my map
The Shield manager will only place shields on a map that is in the Longitude/Latitude (NAD 83). Select Map > Options, click the projection button and set the projection Category to Longitude/Latitude, set the Category Members to Longitude/Latitude (NAD 83).
Shields disappear from map
The shield layer that is shipped with StreetInfo is zoom layered from 0 to 10 miles. This means that when the zoom of your map (lower left corner of your screen shows zoom) is greater than 10 miles, the shields do not display. You will need to zoom in or use Tools > ShieldManager > Change Styles of Shield Layer, where the zoom layering is controlled.
Key Name Description Value
Keyname Description Values
\Shields\Type Type of shields in table 1 for interstate, 2 for route/highway
\Shields\LogicalName Name that displays in Map window title bars, and dialog boxes. Name will only appear when using menu options in Shield Manager.
30 character limit
\Shields\PhysicalName1 Actual file name of layer 30 character limit.
\Shields\PhysicalName2 Name of other layer file 30 character limit
\Shields\label Default label style Font description
\Shields\ZoomMin Minimum display zoom Number in quotes default miles as unit
\Shields\ZoomMax Maximum display zoom Number within quotes, the unit defaults to miles
\Shields\Color1 Top color RGB for interstate or outline for route/highway
RGB integer
\Shields\Color2 Bottom color RGB for interstate or background for route/highway
RGB integer
\Shields\PointSize Point size for shields in table Point size
\IsReadOnly Whether the table is read only TRUE OR FALSE
Product Guide 107© 2007 MapInfo Corporation. All rights reserved.

Highway Shields
The shield I created does not display on screen as I zoom out
Check Tools > ShieldManager > Change Styles of Shield Layer, where the zoom layering is controlled. Set the Default max zoom for each layer in the map to a value greater than or equal to the zoom at which you are viewing your map.
My text does not fit in a shield
Use Tools > ShieldManager > Change Styles of Shield Layer and set the Shield Point Size to a larger number.
Shields do not appear with text in my map
Make sure you use Tools > ShieldManager > Open Shield Layer to open the shield layer. If you use File > Open Table, the shields will not have their labels set correctly.
I deleted/moved/created a shield I did not want
The Shield Manager does not have an undo. If you delete a shield, use the New Shield tool to create a new one with the same text in the same layer. If you move one, move it back to the old location. If you add a shield to a layer and you want it in a different layer, delete it and create it in the other layer.
My Shield layer closed when I used Close All from the File menu
Reopen the shield layer by using Tools > ShieldManager > Open Shield Layer.
How do I reorder the Shield layers in my map
Use Map > Layer Control, just like reordering other StreetInfo layers. Use the Up and Down buttons to position the layers. The Route/Highway layer consists of a top and bottom table. Be sure that the top table remains above the bottom table.
How to add a shield layer to a map
Use Tool > Shield Manager>Shield Layer Control. Click the layer you want to add on the left and click the Add button. If the shield layer is not open use Use Tools > ShieldManager > Open Shield Layer to Open it.
How to remove a shield layer from a map
Use Tool > ShieldManager > Shield Layer Control. Click the layer you want to remove on the right and click the REMOVE button.
Problems opening a shield layer
Make sure the shield layer is not in use by another person, or open in another application.
108 StreetInfo 9.0© 2007 MapInfo Corporation. All rights reserved.

Appendix A: Data Descriptions
Railroads
Railroad Layer Display Characteristics
Railroad Layer Table Structure
Railroad Layer CFCC Class Descriptions
Type of Information Description of Object Graphic Object Details
Railroads Dark grey, single pixel, hatched line Pen(1, 26, 8421504)
Field Description Type(Width) Indexed
Railroad Rail Name, Owner, Description char(30) no
CFCC Census Feature Class Code for Rail line (see descriptions below)
char(3) no
Class Description
Railroad With Major Category Unknown Source materials do not allow determination of the major railroad category. Major Category Unknown should not, under most circumstances, be used since the source materials usually provide enough information to determine the major category.
B01 Railroad track, not in tunnel or underpassing; major category used alone when the minor category could not be determined.
B02 Railroad track, in tunnel.
B03 Railroad track, underpassing.
Railroad Main Line A railroad in this category is the primary track that provides service between destinations. A main line track often carries the name of the owning and operating railroad company.
B11 Railroad main track, not in tunnel or underpassing.
B12 Railroad main track, in tunnel.
B13 Railroad main track, underpassing.
Railroad Spur A railroad in this category is the track that leaves the main track, ending in an industrial park, factory, or warehouse area, or forming a siding along the main track.
B21 Railroad spur track, not in tunnel or underpassing.
Product Guide 109© 2007 MapInfo Corporation. All rights reserved.

Railroads
Railroad Layer File Naming ConventionSSCCCCR.tab, where SS equals the two-letter state abbreviation, CCCC represents the three or four-letter county abbreviation, and R is the railroad layer identifier. For example, the file name for Maricopa County, Arizona, is AZMARIR.tab.
B22 Railroad spur track, in tunnel.
B23 Railroad spur track, underpassing.
Railroad Yard A railroad yard track has parallel tracks that form a working area for the railroad company. Train cars and engines are repaired, switched, and dispatched from a yard.
B31 Railroad yard track, not in tunnel or underpassing.
B32 Railroad yard track, in tunnel.
B33 Railroad yard track, underpassing.
Railroad with Special Characteristics A railroad or portions of a rail-road track that are parts of the railroad system and have separately identifiable characteristics.
B40 Railroad ferry crossing, the representation of a route over water used by ships carrying train cars to connecting railroads on opposite shores. These are primarily located on the Great Lakes.
Railroad as Other Thoroughfare A railroad that is not part of the rail-road system. This category is for a specialized rail line or railway that is typically inaccessible to mainstream railroad traffic.
B50 Other rail line; major category used alone when the minor category could not be determined.
B51 Carline, a track for street cars, trolleys, and other mass transit rail systems; used when the carline is not part of the road right-of-way.
B52 Cog railroad, incline railway, or logging tram.
Class Description
110 StreetInfo 9.0© 2007 MapInfo Corporation. All rights reserved.

Appendix A: Data Descriptions
Municipal Points
Municipal Points Layer Display Characteristics
Municipal Points Layer Table Structure
Municipal Points Layer File Naming ConventionSSCCCCPM.tab, where SS equals the two-letter state abbreviation, CCCC represents the three or four-letter county abbreviation, and PM is the municipal point locations layer identifier. For example, the file name for Maricopa County, Arizona, is AZMARIPM.tab.
Feature Description of Object Graphic Object Details
Municipal locations Point symbols:Civil: large red open circlePPL: small gray starLocale: small black open diamond
Symbol (66, 16711680, 12, MapInfo Cartographic, 0, 0)Symbol (35, 16776960, 12)Symbol (40, 0, 10, MapInfo Symbols, 0, 0)
Field Description Type(Width) Indexed
Name Name of Municipality char(100) no
Type Point classification:Civil: political subdivision formed for administrative purposes (borough, county, municipio, parish, town, township)PPL (Populated Place): place or area with clustered or scattered buildings and a permanent human population (city, settlement, town, village)Locale: place at which there is or was human activity; it does not include populated places, mines and dams (battlefield, crossroad, camp, farm, ghost town, landing,railroad siding, ranch, ruins, site, station, windmill)
char(9) no
Elev Point feature elevation in feet integer no
SmartLabel Contains an optional labeling field that has a carriage return in it (for long names) that will spread the label over two lines
char(35) no
Product Guide 111© 2007 MapInfo Corporation. All rights reserved.

Cultural Point Locations
Cultural Point Locations
Cultural Points Layer Display Characteristics
Cultural Points Layer Table Structure
Cultural Points Layer Classification and Symbol Description
Feature Description of Object Graphic Object Details
Point features representing cultural/man-made features
Points Symbol – various (see below)
Field Description Type(Width) Indexed
Name Name of cultural feature char(100) no
Type Point classification type (see below) char(9) no
Elev Point feature elevation in feet integer no
SmartLabel Contains an optional labeling field that has a carriage return in it (for long names) that will spread the label over two lines
char(35) no
Class Type Description Graphic Graphic Object Details
Airport Man-made facility maintained for the use of aircraft (airfield, airstrip, landing field, landing strip).
Symbol (72,8388736, 12 “Real
Estate”, 0,0)
Building A man-made structure with walls and a roof for protection of people and (or) materials, but not including church, hospital, or school.
Symbol (66,12)
Church Building used for religious worship (chapel, mosque, synagogue, tabernacle, temple).
Symbol (65, 12)
112 StreetInfo 9.0© 2007 MapInfo Corporation. All rights reserved.

Appendix A: Data Descriptions
Cultural Points Layer File Naming ConventionSSCCCCPC.tab, where SS equals the two-letter state abbreviation, CCCC represents the three or four-letter county abbreviation, and PC is the cultural point locations layer identifier. For example, the file name for Maricopa County, Arizona, is AZMARIPC.tab.
Crossing A place where two or more routes of transportation form a junction or intersection (overpass, underpass).
Symbol (65, 12595200, 1
Transportation,0,0)
Hospital Building where the sick or injured may receive medical or surgical attention (infirmary).
Symbol (55,25)
Park Place or area set aside for recreation or preservation of a cultural or natural resource and under some form of government administration; not including National or State forests or Reserves (national historical landmark, national park, State park, wilderness area).
Symbol (32, 10)
School Building or group of buildings used as an institution for study, teaching, and learning (academy, college, high school, university).
Symbol (38,8421504, 12,
“MapInfo Real Estate”, 0, 0)
Tunnel Linear underground passageway open at both ends.
Symbol (76,0,1, “MapInfo Cartographic”, 0,0)
Area Any one of several extensive natural features not included in other categories (badlands, barren, delta, fan, garden).
Symbol (42,0,1 “MapInfo Cartographic”, 0,0,)
Bridge Man-made structure carrying a trail, road, or other transportation system across a body of water or depression (causeway, overpass, trestle).
Symbol (74,0,1, “MapInfo Cartographic” 0,0)
Cemetery A place or area for burying the dead (burial, burying ground, grave, memorial garden).
Symbol (71,0,1 “MapInfo RealEstate”, 0,0)
Product Guide 113© 2007 MapInfo Corporation. All rights reserved.

Natural Point Locations
Natural Point Locations
Natural Point Layer Display Characteristics
Natural Point Layer Table Structure
Feature Description Graphic Object Details
Point features representing naturally occurring features
Points Symbol – various (see below)
Field Description Type(Width) Indexed
Name Name of natural feature char(100) no
Type Point classification type (see below) char(9) no
Elev Point feature elevation in feet integer no
SmartLabel Contains an optional labeling field that has a carriage return in it (for long names) that will spread the label over two lines
char(35) no
Class Type Description Graphic Graphic Object Details
Summit Prominent elevation rising above the surrounding level of the Earth’s surface; does not include pillars, ridges, or ranges (ahu, berg, bald, butte, cerro, colina, cone, cumbre, dome, head, hill, horn, knob, knoll, mauna, mesa, mesita, mound, mount, mountain, peak, puu, rock, sugarloaf, table, volcano).
Symbol (95, 8388608, 12, “MapInfo Cartographic”, 0,0)
Beach The sloping shore along a body of water that is washed by waves or tides and is usually covered by sand or gravel (coast, shore, strand).
Symbol (94, 25, “MapInfo
Cartographic”, 0,0)
Trail Route for passage from one point to another; no roads or highways (jeep trail, path, ski trail).
Symbol (34,0, “MapInfo
Arrows”, 0,0)
114 StreetInfo 9.0© 2007 MapInfo Corporation. All rights reserved.

Appendix A: Data Descriptions
Natural Point Layer File Naming ConventionSSCCCCPN.tab, where SS equals the two-letter state abbreviation, CCCC represents the three or four-letter county abbreviation, and PN is the natural point locations layer identifier. For example, the file name for Maricopa County, Arizona, is AZMARIPN.tab.
City Boundaries
City Boundaries Layer Display Characteristics
City Boundaries Layer Table Structure
Forest Bounded area of woods, forest, or grassland under the administration of a political agency (see woods) (national forest, national grasslands, State forest).
Symbol (63,405, “MapInfoCartographic”, 0,0)
Woods Small area covered with a dense growth of trees; does not include an area of trees under the administration of a political agency (see forest).
Symbol (108,32832,12, “MapInfo Cartographic”, 0,0)
Type of Information Description of Object Graphic Object Details
City Boundaries light yellow filled, hashed, single-pixel border
Pen(1, 12, 0)Brush(2, 16777168, 16777215)
Field Description Type(Width) Indexed
City Name of City (Populated Place) char(45) yes
FIPS FIPS code comprised of a two-character state FIPS code and five-character city code (Census Populated Place)
char(7) no
FIPSCC FIPS Class code – differentiates the many types of Census Bureau–recognized cities that may be in the CB and MC layers (table below)
char(2) no
Product Guide 115© 2007 MapInfo Corporation. All rights reserved.

City Boundaries
City Boundaries Layer Census Feature Class Code (CFCC) Descriptions
Class Description
C1 An active incorporated place that is not also recognized as an Alaska Native village statistical area (ANVSA), and does not serve as a primary county division equivalent.
C2 Incorporated place that also serves as a primary county division because, although the place is coextensive with an MCD, the Census Bureau, in agreement with state officials, does not recognize that MCD for presenting census data because the MCD is a non functioning entity (applies to Iowa and Ohio only).
C3 Consolidated city
C5 Incorporated place that also serves as a primary county division; that is, it is not included in any adjacent primary county division of Class T or Z.
C6 Incorporated place that is coincident with, or approximates, an Alaska Native village statistical area
C7 Independent city; that is, an incorporated place that also serves as a county equivalent.
C8 The portion (remainder) of a consolidated city that is not within another incorporated place.
C9 An inactive or non functioning incorporated place
T1 Governmentally active MCD that is not coextensive with an incorporated place.
T5 Governmentally active MCD that is coextensive with an incorporated place.
U1 CDP with a name that is commonly recognized for the populated area.
U2 CDP with a name that is not commonly recognized for the populated area (e.g., a combination of the names of two or three commonly recognized communities, or a name that identifies the location of the CDP in relation to an adjacent incorporated place).
U9 CDP that coincides with, or approximates, an ANVSA.
Z1 Inactive or non functioning MCD recognized as a primary county division by the Census Bureau.
Z3 Unorganized territory established as an MCD equivalent by the Census Bureau.
Z5 Census county division (CCD), census subarea (Alaska), or census subdistrict (U.S. Virgin Islands).
116 StreetInfo 9.0© 2007 MapInfo Corporation. All rights reserved.
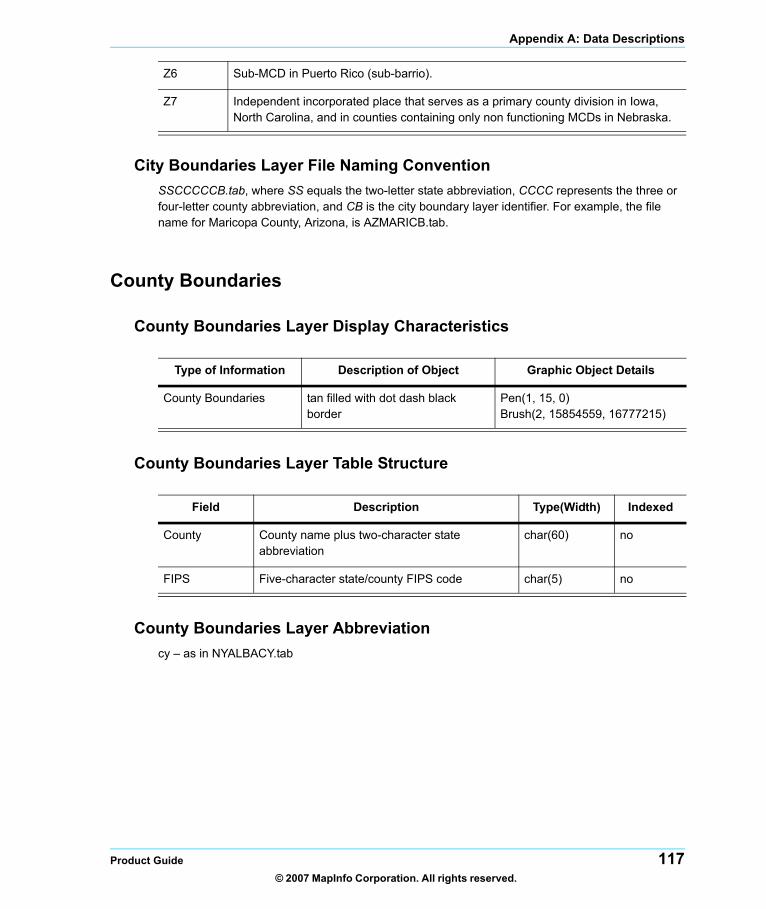
Appendix A: Data Descriptions
City Boundaries Layer File Naming ConventionSSCCCCCB.tab, where SS equals the two-letter state abbreviation, CCCC represents the three or four-letter county abbreviation, and CB is the city boundary layer identifier. For example, the file name for Maricopa County, Arizona, is AZMARICB.tab.
County Boundaries
County Boundaries Layer Display Characteristics
County Boundaries Layer Table Structure
County Boundaries Layer Abbreviationcy – as in NYALBACY.tab
Z6 Sub-MCD in Puerto Rico (sub-barrio).
Z7 Independent incorporated place that serves as a primary county division in Iowa, North Carolina, and in counties containing only non functioning MCDs in Nebraska.
Type of Information Description of Object Graphic Object Details
County Boundaries tan filled with dot dash black border
Pen(1, 15, 0)Brush(2, 15854559, 16777215)
Field Description Type(Width) Indexed
County County name plus two-character state abbreviation
char(60) no
FIPS Five-character state/county FIPS code char(5) no
Product Guide 117© 2007 MapInfo Corporation. All rights reserved.

Minor Civil Divisions (MCD) Boundaries
Minor Civil Divisions (MCD) Boundaries
Minor Civil Divisions Layer Display Characteristics
Minor Civil Divisions Layer Table Structure
Minor Civil Divisions Layer File Naming ConventionSSCCCCMC.tab, where SS equals the two-letter state abbreviation, CCCC represents the three or four-letter county abbreviation, and MC is the township layer identifier. For example, the file name for Maricopa County, Arizona, is AZMARIMC.tab.
Sub-MCD Boundaries
Sub-Minor Civil Divisions Layer Display Characteristics
Feature Description of Object Graphic Object Details
MCD regions Regions, no fill, hashed borders Pen(1, 12, 0)Brush(1, 0, 16777215)
Field Description Type(Width) Indexed
MCD MCD name char(45) no
FIPS Federal Information Processing Standard (FIPS) code for MCD
char(10) no
FIPSCC FIPS Class Code – Class code that differentiates types of cities [see City Boundaries Layer Census Feature Class Code (CFCC) Descriptions]
char(2) no
Feature Description of Object Graphic Object Details
Sub-MCD boundaries Light green borders, no fill Pen(1, 2, 65280)Brush(1, 0, 16777215)
118 StreetInfo 9.0© 2007 MapInfo Corporation. All rights reserved.

Appendix A: Data Descriptions
Sub-Minor Civil Divisions Layer Table Structure
Sub-Minor Civil Divisions Layer File Naming ConventionSSCCCCSM.tab, where SS equals the two-letter state abbreviation, CCCC represents the three or four-letter county abbreviation, and SM is the sub-MCD boundary layer identifier. For example, the file name for San Juan, Puerto Rico, is PRSANJSM.tab.
Area Landmarks
Area Landmarks Layer Table Structure
Field Description Type(Width) Indexed
SubMCD Name of the sub-Minor Civil Division char(45) no
FIPS 15 character sub-MCD code:char 1–5 correspond to state/county FIPS codechar 6–10 correspond to the MCD that encloses the sub-MCD char 11–15 correspond to unique sub-MCD code
char(15) no
FIPSCC FIPS Classification Code. All entries will be Z6. (For Z6 definition, see the Class code table under the CIty Boundaries Layer discussion)
char(2) no
Field Names Contents Type(length) Indexed
Name Landmark Name char(30) no
Class CFCC Code char(3) no
SmartLabel Contains an optional labeling field that has a carriage return in it (for long names) that will spread the label over two lines
char(35) no
DisplayClass Numeric code that corresponds to the Display style (Pen and Brush) for the object — the codes range from 1 to 9
smallint no
Product Guide 119© 2007 MapInfo Corporation. All rights reserved.

Area Landmarks
Area Landmarks Layer Display Characteristics
Name Class Code Graphic Object Details Description
Landmark, Category Unknown
D00 Pen (1, 1, 0) Brush (2, 12632256, 8224125)
Grey Filled Region w/ No Border
Military installation or reservation
D10 Pen (1, 1, 0) Brush (2, 12632256, 8224125)
Grey Filled Region w/ No Border
County home or poor farm
D34 Pen (1, 1, 0) Brush (2, 12632256, 8224125)
Grey Filled Region w/ No Border
Orphanage D35 Pen (1, 1, 0) Brush (2, 12632256, 8224125)
Grey Filled Region w/ No Border
Jail or detention center
D36 Pen (1, 1, 0) Brush (2, 12632256, 8224125)
Grey Filled Region w/ No Border
Federal penitentiary, state prison, or prison farm
D37 Pen (1, 1, 0) Brush (2, 12632256, 8224125)
Grey Filled Region w/ No Border
Cemetery D82 Pen (1, 1, 0) Brush (2, 12632256, 8224125)
Grey Filled Region w/ No Border
Marina D24 Pen (1, 1, 0) Brush (2, 10535167, 16777215)
Light Blue Boundary, No Border
Custodial Facility D30 Pen (1, 1, 0) Brush (2, 10535167, 16777215)
Light Blue Boundary, No Border
Hospital D31 Pen (1, 1, 0) Brush (2, 10535167, 16777215)
Light Blue Boundary, No Border
Nursing home, retirement home, or home for the aged
D33 Pen (1, 1, 0) Brush (2, 10535167, 16777215)
Light Blue Boundary, No Border
Multi household or Transient Quarters
D20 Pen (1, 1, 0) Brush (2, 16760960, 16777215)
Light Orange Boundary, No Border
Apartment Building or Complex
D21 Pen (1, 1, 0) Brush (2, 16760960, 16777215)
Light Orange Boundary, No Border
120 StreetInfo 9.0© 2007 MapInfo Corporation. All rights reserved.

Appendix A: Data Descriptions
Trailer court or mobile home park
D23 Pen (1, 1, 0) Brush (2, 16760960, 16777215)
Light Orange Boundary, No Border
Campground D28 Pen (1, 1, 0) Brush (2, 16760960, 16777215)
Light Orange Boundary, No Border
Educational or Religious Institution
D40 Pen (1, 1, 0) Brush (2, 16765183, 16711215)
Light Pink Region w/ No Border
Convent or monastery D42 Pen (1, 1, 0) Brush (2, 16765183, 16711215)
Light Pink Region w/ No Border
Religious institution, including church, synagogue, seminary, temple, and mosque
D44 Pen (1, 1, 0) Brush (2, 16765183, 16711215)
Light Pink Region w/ No Border
Shopping center or major retail center
D61 Pen (1, 2, 0) Brush (2, 16760960, 8224125)
Orange Filled Region, No Border
Industrial building or industrial park
D62 Pen (1, 2, 0) Brush (2, 16760960, 8224125)
Orange Filled Region, No Border
Office building or office park
D63 Pen (1, 2, 0) Brush (2, 16760960, 8224125)
Orange Filled Region, No Border
Amusement center D64 Pen (1, 2, 0) Brush (2, 16760960, 8224125)
Orange Filled Region, No Border
Government center D65 Pen (1, 2, 0) Brush (2, 16760960, 8224125)
Orange Filled Region, No Border
Golf Course D81 Pen (1,2,32768) Brush (2,6356832,8224125)
Region with bright green fill and dark green border
National Park Service land
D83 Pen (1,2,32768) Brush (2,10551200,8224125)
Region with dark green fill, dark green border
National forest or other Federal land
D84 Pen (1,2,32768) Brush (2,10551200,8224125)
Region with dark green fill, dark green border
Name Class Code Graphic Object Details Description
Product Guide 121© 2007 MapInfo Corporation. All rights reserved.

Geocoding Boundaries
Area Landmarks Layer File Naming ConventionSSCCCCLM.tab, where SS equals the two-letter state abbreviation, CCCC represents the three or four-letter county abbreviation, and LM is the area landmark layer identifier. For example, the file name for Maricopa County, Arizona, is AZMARILM.tab.
Geocoding BoundariesThe Geocoding Boundaries layer is only available in the enhanced address layer version of StreetInfo.
State or local park or forest
D85 Pen (1,2,32768) Brush (2,10551200,8224125)
Region with dark green fill, dark green border
Marine Terminal D54 Pen (1,2,12632256) Brush (2,12632256,8224125)
Region with Light Grey Fill, No Border
Seaplane Anchorage D55 Pen (1,2,12632256) Brush (2,12632256,8224125)
Region with Light Grey Fill, No Border
Transportation terminal
D50 Pen (1,2,12632256)Brush (2,12632256,8224125)
Region with Light Grey Fill, No Border
Airport or airfield D51 Pen (1,2,12632256)Brush (2,12632256,8224125)
Region with Light Grey Fill, No Border
Open space D80 Pen(1,1,0) Brush (2,14786522,8224125)
Region with Light Purple Fill, No Border
Educational institution, including academy, school, college, and university
D43 Pen (1,1,16711680) Brush (2,16744576,8224125)
Region with Light Red Fill, No Border
Name Class Code Graphic Object Details Description
122 StreetInfo 9.0© 2007 MapInfo Corporation. All rights reserved.

Appendix A: Data Descriptions
Geocoding Boundaries Layer Display Characteristics
Geocoding Boundaries Layer Table Structure
Geocoding Boundaries Layer File Naming ConventionSSCCCCG.tab, where SS equals the two-letter state abbreviation, CCCC represents the three or four-letter county abbreviation, and G is the geocoding boundary layer identifier. For example, the file name for Maricopa County, Arizona, is AZMARIG.tab.
Water Boundaries
Water Boundaries Layer Display Characteristics
Water Boundaries Layer Table Structure
Feature Description of Object Graphic Object Details
Geocoding Boundaries Dotted black boundary, no fill Pen(1,3,0)
Field Description Type(Width) Indexed
City Name of city char(40) yes
Type of Information Description of Object Graphic Object Details
Water regions Regions, lt. blue fill, no border Pen(1, 2, 255)Brush(2, 10551295, 8224125)
Field Names Contents Type(length) Indexed
Name Name of water boundary character(30) no
CFCC CFCC code character(3) no
SmartLabel Contains an optional labeling field that has a carriage return in it (for long names) that will spread the label over two lines
character(35) no
Product Guide 123© 2007 MapInfo Corporation. All rights reserved.

Rivers
Water Boundaries Layer File Naming ConventionSSCCCWB.tab, where SS equals the two-letter state abbreviation, CCCC represents the three or four-letter county abbreviation, and WB is the Water Boundaries layer identifier. For example, the Water Boundaries file name for Maricopa County, Arizona, is AZMARIWB.tab.
Rivers
Rivers Layer Display Characteristics
Rivers Layer Table Structure
Rivers Layer File Naming ConventionThe file naming convention for the Rivers Layer is as follows:
SSCCCWR.tab, where SS equals the two-letter state abbreviation, CCCC represents the three or four-letter county abbreviation, and WR is the Rivers layer identifier. For example, the Rivers file name for Maricopa County, Arizona, is AZMARIWR.tab.
Rivers Layer Census Feature Class Code (CFCC) Descriptions
Type of Information Description of Object Graphic Object Details
Water rivers Cyan polylines Pen(1, 2, 65535)
Field Names Contents Type(length) Indexed
Name Name of water boundary character(30) no
CFCC CFCC code character(3) no
SmartLabel Contains an optional labeling field that has a carriage return in it (for long names) that will spread the label over two lines
character(35) no
Class Description
H00 Water Feature, Classification Unknown or Not Elsewhere Classified
H01 Shoreline of perennial water feature
H02 Shoreline of intermittent water feature
124 StreetInfo 9.0© 2007 MapInfo Corporation. All rights reserved.

Appendix A: Data Descriptions
H10 Stream
H11 Perennial stream
H12 Intermittent stream or wash
H13 Braided stream
H20 Canal, Ditch, or Aqueduct
H21 Perennial canal, ditch, or aqueduct
H22 Intermittent canal, ditch, or aqueduct
H30 Lake or pond
H31 Perennial lake or pond
H32 Intermittent lake or pond
H40 Reservoir
H41 Perennial reservoir
H42 Intermittent reservoir
H50 Bay, Estuary, Gulf, Sound, Sea, or Ocean
H51 Bay, estuary, gulf, or sound
H53 Sea or ocean
H60 Gravel Pit or Quarry Filled with Water
H70 Non-visible Water Area Definition Boundary
H71 USGS closure line
H72 Census computed center line
H73 Census int’l water boundary, 10-mile limit, area measurement line
H74 Census water boundary, inland or coastal or Great Lakes
H75 three-mile limit water boundary
H80 Special Water Feature
H81 Glacier
Class Description
Product Guide 125© 2007 MapInfo Corporation. All rights reserved.

School District Boundaries
School District Boundaries
School District Boundaries Layer Display Characteristics
School District Boundaries Layer Table Structure
School District Boundaries Layer File Naming ConventionNote: The files in the School District layer are state-wide only.
Elementary School District name: SSELM, where SS is the two-letter state abbreviation and ELM is the layer designator. Example NYELM.tab
Secondary School District name: SSSEC, where SS is the two-letter state abbreviation and SEC is the layer designator. Example NYSEC.tab
Unified School District name: SSUNI, where SS is the two-letter state abbreviation and UNI is the layer designator. Example NYUNI.tab
Notes about StreetInfo School District BoundariesThe elementary and secondary school district tables can overlap each other since they represent different segments of the school-age population. Not every state will contain all three school district types. Each state decides independently if a school district is elementary, secondary or unified. For example, the entire state of Hawaii and the five boroughs of New York City are each single school districts. The boundaries for the School Districts layer were compiled from individual state paper
Feature Description of Object Graphic Object Details
Elementary School District in *elm.tab
Secondary School District in *sec.tab
Unified School District in *uni.tab
Thin, red border, no fill
Thin, yellow border, no fill
Thin, purple border, no fill
All school district typesBrush (1, 0, 16777215)
ElementaryPen (1,2,16711680)
SecondaryPen (1,2,16776960)
UnifiedPen (1,2,8388736)
Field Description Type(Width)
Name Name of District char(60)
District District code char(5)
Enrollment Pupil enrollment integer
126 StreetInfo 9.0© 2007 MapInfo Corporation. All rights reserved.

Appendix A: Data Descriptions
maps and digitized into the Census Bureau TIGER system. These district boundaries were provided to the Census Bureau by the state educational agencies that oversee the individual school districts. The boundaries in this version of StreetInfo include any school district changes that were reported by the Census Bureau in the TIGER 2000 files.
Voting District Boundaries
Voting District Boundaries Layer Display Characteristics
Voting District Boundaries Layer Table Structure
Voting District Boundaries Layer File Naming ConventionSSCCCVD.tab, where SS equals the two-letter state abbreviation, CCCC represents the three or four-letter county abbreviation, and VD is the Voting District layer identifier. For example, the file name for Maricopa County, Arizona, is AZMARIVD.tab.
Notes about Voting District BoundariesThe boundaries as recorded in the TIGER 2000 data files are representations of voting districts along census block lines, not necessarily the actual area of the voting districts. States were required to submit voting districts that followed census block boundaries and may have relocated some boundaries for that purpose.
Feature Description of Object Graphic Object Details
Voting District Region object, thin, green border, no fill Pen(1, 2, 65280) Brush(1, 0, 16777215)
Field Description Type(Width) Indexed
VotingDistrict Name of District char(45) no
VTD District FIPS code — unique within a county
char(4) no
ID State and county FIPS code + VTD char(9) no
Product Guide 127© 2007 MapInfo Corporation. All rights reserved.

Native American Lands
Native American Lands
Native American Lands Layer Display Characteristics
Native American Lands Layer Table Structure
Native American Lands Layer Census Feature Class Codes
Feature Description of Object Graphic Object Details
Native American reservations Region object, brown filled and bordered
Pen(1,2,8388608)Brush(1,0,16777215)
Field Description Type(Width) Indexed
FIPS Federal Information Processing Code char(5) no
FIPSCC Class Code char(7) no
Name Name of Native American Land no
Class Description
E Class: Alaska Native Village Statistical Areas (ANVSAs)
E1 ANVSA that does not coincide with, or approximate, an incorporated place or census designated place (CDP).
E2 ANVSA that coincides with, or approximates, a CDP
E6 ANVSA that coincides with, or approximates, an incorporated place.
D Class: American Indian Reservations (AIRs)
D1 Federally recognized American Indian reservation and its associated trust land that does not also serve as a primary county division.
D2 Federally recognized American Indian reservation that exists in a single county and also serves as a primary county division.
D3 Federally recognized American Indian tribal government that holds off-reservation property in trust [trust land] for a tribe or individual member(s) of the tribe, and the trust land is not associated with a specific American Indian reservation.
D4 State-recognized American Indian reservation that does not serve as a primary county division.
128 StreetInfo 9.0© 2007 MapInfo Corporation. All rights reserved.

Appendix A: Data Descriptions
Native American Lands Layer File Naming ConventionSSCCCNA.tab, where SS equals the two-letter state abbreviation, CCCC represents the three or four-letter county abbreviation, and NA is the Native Lands layer identifier. For example, the file name for Maricopa County, Arizona, is AZMARINA.tab.
Notes about Native American LandsThe following defines the areas that make up the Native American Lands layer:
Alaska Native Regional Corporations (ANRCs) are corporate entities organized to conduct both business and nonprofit affairs for Alaska Natives pursuant to the Alaska Native Claims Settlement Act of 1972 (Public Law 92-203). Twelve ANRCs are geographic entities that cover most of the state of Alaska (the Annette Islands Reserve, an American Indian reservation, is excluded from any ANRC).
American Indian reservations Federal (federal AIRs) are areas that have been set aside by the United States for the use of tribes, the exterior boundaries of which are more particularly defined in the final tribal treaties, agreements, executive orders, federal statutes, secretarial orders, or judicial determinations. The U.S. Census Bureau recognizes federal reservations as territory over which American Indian tribes have primary governmental authority.
American Indian reservations State (state AIRs) are reservations established by some state governments for tribes recognized by the state.
American Indian tribal subdivisions are administrative subdivisions of federally recognized American Indian reservations, off-reservation trust land, or Oklahoma tribal statistical areas (OTSAs). Tribal subdivisions are known as areas, chapters, communities, or districts. These entities are internal units of self-government or administration that serve social, cultural, and/or economic purposes for the American Indians on the reservations, off-reservation trust lands, or OTSAs.
American Indian trust lands are areas for which the United States holds title in trust for the benefit of a tribe (tribal trust land) or for an individual Indian (individual trust land). Trust lands can be alienated or encumbered only by the owner with the approval of the Secretary of the Interior or his/her authorized representative. Trust lands may be located on or off a reservation.
Tribal designated statistical areas (TDSAs) are statistical entities identified and delineated for the U.S. Census Bureau by federally recognized American Indian tribes that do not currently have a federally recognized land base (reservation or off-reservation trust land). A TDSA generally
D5 State-recognized American Indian reservation that exists in a single county and also serves as a primary county division.
D6 Identifies a statistical entity delineated for the Census Bureau to delimit an area containing American Indian population over which a federally or state-recognized American Indian tribe not having a reservation has jurisdiction (tribal jurisdiction statistical area [TJSA] in Oklahoma) and/or provides benefits and services to its members (tribal designated statistical area [TDSA] in other states).
Class Description
Product Guide 129© 2007 MapInfo Corporation. All rights reserved.

Elevation Contours
encompasses a compact and contiguous area that contains a concentration of individuals who identify with a federally recognized American Indian tribe and in which there is structured or organized tribal activity.
Elevation Contours
Elevation Contours Layer Display Characteristics
Elevation Range Description of Object Graphic Object Details
Elevation contours thin line, elevation in feet see elevation ranges below
-1000–0 (below sea level) filled region object Brush (2, 8421504, 16777215)
0–1000 filled region object Brush (2, 65280, 16777215)
1000–2000 filled region object Brush (2, 7585792, 16777215)
2000–3000 filled region object Brush (2, 5672960, 16777215)
3000–4000 filled region object Brush (2, 14737408, 16777215)
4000–5000 filled region object Brush (2, 16776960, 16777215)
5000–6000 filled region object Brush (2, 16770192, 16777215)
6000–7000 filled region object Brush (2, 13671424, 16777215)
7000–8000 filled region object Brush (2, 16754768, 16777215)
8000–9000 filled region object Brush (2, 16711680, 16777215)
9000–10000 filled region object Brush (2, 16720016, 16777215)
10000–11000 filled region object Brush (2, 13904426, 16777215)
11000–12000 filled region object Brush (2, 12533567, 16777215)
12000–13000 filled region object Brush (2, 11162965, 16777215)
13000–14000 filled region object Brush (2, 9726570, 16777215)
14000–15000 filled region object Brush (2, 8355711, 16777215)
15000–16000 filled region object Brush (2, 6984852, 16777215)
16000–17000 filled region object Brush (2, 5614250, 16777215)
17000–18000 filled region object Brush (2, 4177855, 16777215)
130 StreetInfo 9.0© 2007 MapInfo Corporation. All rights reserved.

Appendix A: Data Descriptions
Elevation Contours Layer Table Structure
Elevation Contours Layer File Naming ConventionSSel_c.tab, where SS equals the two-letter state abbreviation and el_c represents the Elevation layer identifier. For example, the file name for Arizona is AZEL_C.TAB
Note: The files in the Elevation layer are state-wide only.
18000–19000 filled region object Brush (2, 2806996, 16777215)
19000–20000 filled region object Brush (2, 1436137, 16777215)
20000 + filled region object Brush (2, 65535, 16777215)
Field Description Type(Width) Indexed
Lower Lower range of elevation contour (in feet) float no
Upper Upper range of elevation contour (in feet) float no
Product Guide 131© 2007 MapInfo Corporation. All rights reserved.

B
StreetInfo Geographic Improvements by CountyThis section contains a catalog of the counties that have been geographically improved by the Census Bureau and that will be more geographically accurate in StreetInfo.
In this Appendix:
Geographic Improvements in StreetInfo 9.0 . . . . . . . . . . . . . . . .133Geographic Improvements in StreetInfo 8.0 . . . . . . . . . . . . . . . .136

Appendix B: StreetInfo Geographic Improvements by County
Geographic Improvements in StreetInfo 9.0This section contains a catalog of the counties that have been geographically improved by the Census Bureau and that will be more geographically accurate in StreetInfo version 9.0.
State Counties
AL Autauga, Baldwin, Barbour, Bibb, Blount, Bullock, Butler, Calhoun, Chambers, Chilton, Choctaw, Clarke, Clay, Cleburne, Coffee, Colbert, Conecuh, Coosa, Covington, Crenshaw, Cullman, Dale, Dallas, DeKalb, Elmore, Escambia, Fayette, Geneva, Greene, Hale, Henry, Houston, Jackson, Lamar, Lauderdale, Lawrence, Lee, Limestone, Lowndes, Macon, Marengo, Marion, Marshall, Monroe, Montgomery, Morgan, Perry, Pickens, Randolph, Russell, Shelby, St. Clair, Sumter, Talladega, Tallapoosa, Tuscaloosa, Walker, Washington, Wilcox, Winston
AR Boone, Bradley, Craighead, Hempstead, Jefferson, Johnson, Logan, Marion, Montgomery, Nevada, Pike, Sebastian, Sevier, Van Buren
CA Calaveras, Merced, Modoc, Monterey, Sacramento, San Joaquin, Solano, Stanislaus, Tuolumne
CO Adams, Boulder, Chaffee, Cheyenne, Clear Creek, Kit Carson, Lake, Larimer, Lincoln, Morgan, Phillips, Sedgwick, Washington
FL Alachua, Hillsborough, Holmes, Okaloosa, Palm Beach, Polk, Sarasota, Union
GA Barrow, Bleckley, Burke, Candler, Carroll, Chattahoochee, Cherokee, Clay, Cobb, Crisp, DeKalb, Dodge, Echols, Emanuel, Evans, Floyd, Fulton, Gwinnett, Hancock, Harris, Hart, Heard, Jeff Davis, Jenkins, Johnson, Lamar, Laurens, Lincoln, Macon, Marion, McDuffie, Morgan, Paulding, Peach, Polk, Quitman, Randolph, Screven, Stewart, Talbot, Taliaferro, Taylor, Telfair, Toombs, Treutlen, Turner, Wayne, Wheeler, Wilcox, Wilkes
IA Adair, Adams, Audubon, Benton, Boone, Buchanan, Calhoun, Cass, Cedar, Cherokee, Chickasaw, Clarke, Crawford, Decatur, Emmet, Floyd, Franklin, Fremont, Guthrie, Henry, Howard, Humboldt, Ida, Iowa, Jasper, Jefferson, Jones, Kossuth, Louisa, Madison, Mills, Montgomery, O'Brien, Osceola, Page, Palo Alto, Pocahontas, Polk, Ringgold, Scott, Shelby, Story, Taylor, Union, Wapello, Wayne, Webster, Woodbury, Worth
ID Ada, Adams, Bear Lake, Boise, Bonneville, Butte, Camas, Canyon, Caribou, Cassia, Clark, Elmore, Fremont, Gem, Jefferson, Jerome, Kootenai, Latah, Lewis, Madison, Payette, Power, Twin Falls, Valley, Washington
IL Bond, Boone, Brown, Bureau, Calhoun, Cass, Clay, Coles, De Witt, DuPage, Edgar, Fayette, Franklin, Fulton, Greene, Grundy, Hamilton, Hancock, Henderson, Iroquois, Jackson, Kane, Lawrence, Logan, Macoupin, Marion, Mason, Massac, Monroe, Montgomery, Pulaski, Randolph, Richland, Scott, Wabash, White
Product Guide 133© 2007 MapInfo Corporation. All rights reserved.

Geographic Improvements in StreetInfo 9.0
IN Adams, Blackford, Carroll, Cass, Clark, Daviess, Dearborn, Delaware, Franklin, Fulton, Gibson, LaGrange, Madison, Martin, Montgomery, Morgan, Noble, Ohio, Orange, Parke, Posey, Pulaski, Randolph, Ripley, Scott, Shelby, Switzerland, Wabash
KS Anderson, Barber, Barton, Chase, Chautauqua, Cheyenne, Clark, Clay, Coffey, Comanche, Crawford, Decatur, Dickinson, Edwards, Elk, Ellsworth, Franklin, Geary, Grant, Gray, Greeley, Hamilton, Harper, Haskell, Hodgeman, Jefferson, Jewell, Kearny, Kingman, Kiowa, Labette, Lane, Lincoln, Linn, Logan, Lyon, Marion, Marshall, McPherson, Meade, Miami, Morris, Morton, Nemaha, Norton, Osborne, Phillips, Pottawatomie, Rawlins, Republic, Rice, Rooks, Rush, Scott, Seward, Sheridan, Sherman, Smith, Stafford, Stanton, Stevens, Sumner, Thomas, Trego, Wabaunsee, Washington, Wichita, Wilson, Woodson
KY Adair, Boone, Boyd, Breckinridge, Carter, Clark, Clinton, Estill, Fayette, Floyd, Garrard, Grayson, Green, Greenup, Harlan, Harrison, Hopkins, Jefferson, Knott, Knox, Lawrence, Lee, Leslie, Letcher, Magoffin, Martin, McCreary, Menifee, Montgomery, Morgan, Nicholas, Ohio, Pendleton, Powell, Pulaski, Rockcastle, Rowan, Taylor, Wayne, Wolfe
LA Beauregard Parish, De Soto Parish, Natchitoches Parish, St. Martin Parish, Vernon Parish, Webster Parish, West Carroll Parish, West Feliciana Parish
MA Berkshire, Middlesex
ME Androscoggin, Cumberland, Piscataquis, York
MN Chippewa, Chisago, Freeborn, Goodhue, Lincoln, Nobles, Ri
MO Bates, Benton, Bollinger, Butler, Callaway, Carter, Cedar, Christian, Clark, DeKalb, Dent, Douglas, Dunklin, Gasconade, Grundy, Hickory, Holt, Knox, Laclede, Lafayette, Lawrence, Lincoln, Maries, Marion, Mississippi, Monroe, Montgomery, New Madrid, Newton, Pemiscot, Pettis, Phelps, Polk, Pulaski, Ralls, Schuyler, Scotland, Scott, St. Clair, Ste. Genevieve, Stoddard, Stone, Sullivan, Texas, Wayne, Webster, Wright
MS Bolivar, Choctaw, Coahoma, Hancock, Harrison, Humphreys, Issaquena, Lamar, Leflore, Quitman, Sharkey, Sunflower, Tunica, Washington, Webster
MT Gallatin
NC Alamance, Brunswick, Camden, Carteret, Cleveland, Cumberland, Currituck, Davie, Durham, Gaston, Guilford, Halifax, Harnett, Henderson, Hoke, Iredell, Mecklenburg, Montgomery, Moore, New Hanover, Pasquotank, Perquimans, Richmond, Scotland, Stanly, Surry, Warren, Washington, Wilson, Yadkin
ND Grand Forks
State Counties
134 StreetInfo 9.0© 2007 MapInfo Corporation. All rights reserved.

Appendix B: StreetInfo Geographic Improvements by County
NE Antelope, Arthur, Blaine, Boone, Box Butte, Boyd, Brown, Cedar, Chase, Cherry, Cuming, Custer, Dakota, Dawes, Dixon, Dodge, Dundy, Fillmore, Gage, Garfield, Grant, Greeley, Hall, Hamilton, Hayes, Hitchcock, Holt, Hooker, Howard, Jefferson, Kearney, Keith, Keya Paha, Knox, Lincoln, Logan, Loup, Madison, McPherson, Merrick, Nuckolls, Perkins, Pierce, Platte, Red Willow, Rock, Saline, Saunders, Scotts Bluff, Seward, Sheridan, Sherman, Sioux, Stanton, Thayer, Thomas, Wayne, Webster, Wheeler
NH Belknap, Carroll, Cheshire, Coos, Grafton, Hillsborough, Merrimack, Rockingham, Strafford, Sullivan
NJ Bergen, Camden, Cape May, Hudson, Mercer, Middlesex, Monmouth, Morris, Ocean, Somerset
NM Eddy, Lea, Los Alamos, Otero
NV Carson City
OH Adams, Belmont, Franklin, Hardin, Hocking, Lawrence, Mahoning, Morgan, Noble, Paulding, Perry, Pike, Sandusky, Vinton, Washington, Wood
OK Adair, Alfalfa, Beckham, Bryan, Caddo, Choctaw, Cimarron, Comanche, Custer, Dewey, Grady, Greer, Harper, Haskell, Hughes, Jackson, Jefferson, Kingfisher, Kiowa, Latimer, Lincoln, Major, McIntosh, Muskogee, Noble, Okfuskee, Payne, Roger Mills, Texas, Washita, Woods
OR Jackson, Multnomah
PA Bedford, Bradford, Bucks, Cameron, Cumberland, Jefferson, Lawrence, McKean, Montour
PR Adjuntas, Aguada, Aguadilla, Aguas Buenas, Aibonito, A¤asco, Arecibo, Arroyo, Barceloneta, Barranquitas, Bayam¢n, Cabo Rojo, Caguas, Camuy, Can¢vanas, Carolina, Cata¤o, Cayey, Ceiba, Ciales, Cidra, Coamo, Comer¡o, Corozal, Culebra, Dorado, Fajardo, Florida, Gu nica, Guayama, Guayanilla, Guaynabo, Gurabo, Hatillo, Hormigueros, Humacao, Isabela, Jayuya, Juana D¡az, Juncos, Lares, Las Piedras, Lo¡za, Luquillo, Manat¡, Maricao, Maunabo, Mayagez, Moca, Morovis, Naranjito, Orocovis, Patillas, Ponce, Quebradillas, Rinc¢n, R¡o Grande, Sabana Grande, Salinas, San Germ n, San Juan, San Lorenzo, San Sebasti n, Santa Isabel, Toa Alta, Toa Baja, Trujillo Alto, Utuado, Vega Alta, Vega Baja, Vieques, Villalba, Yabucoa
SC Abbeville, Allendale, Barnwell, Darlington, Dorchester, Edgefield, Florence, Kershaw, Marlboro, Oconee, Sumter
SD Day, Deuel
State Counties
Product Guide 135© 2007 MapInfo Corporation. All rights reserved.

Geographic Improvements in StreetInfo 8.0
Geographic Improvements in StreetInfo 8.0For your reference, this section contains a catalog of the counties that have been geographically improved by the Census Bureau and included in StreetInfo 8.0. Note that these county improvements also appear in StreetInfo 9.0.
TX Armstrong, Bandera, Blanco, Calhoun, Carson, Collingsworth, Colorado, Dallam, Deaf Smith, Dickens, Dimmit, Donley, Edwards, Fort Bend, Gray, Hansford, Hardin, Hartley, Hemphill, Hutchinson, Jefferson, Johnson, King, Kinney, La Salle, Lipscomb, Madison, Matagorda, Medina, Moore, Ochiltree, Oldham, Potter, Randall, Real, Roberts, Sherman, Uvalde, Val Verde, Washington, Wharton, Wheeler, Williamson, Zavala
UT Davis, Utah
VA Accomack, Albemarle, Amelia, Amherst, Appomattox, Bedford City, Bland, Bristol City, Brunswick, Buchanan, Buckingham, Campbell, Caroline, Carroll, Charles City, Charlotte, Charlottesville City, Chesapeake City, Chesterfield, Clarke, Culpeper, Cumberland, Danville City, Emporia City, Falls Church City, Fauquier, Floyd, Fluvanna, Franklin, Franklin City, Fredericksburg City, Galax City, Giles, Grayson, Halifax, Hanover, Henrico, Henry, Isle of Wight, James City, Lee, Loudoun, Louisa, Lunenburg, Manassas City, Manassas Park City, Martinsville City, Mecklenburg, Nelson, Newport News City, Norfolk City, Northampton, Nottoway, Page, Patrick, Pittsylvania, Portsmouth City, Prince Edward, Pulaski, Radford City, Russell, Scott, Shenandoah, Smyth, Southampton, Spotsylvania, Stafford, Suffolk City, Tazewell, Virginia Beach City, Warren, Washington, Wise, Wythe, York
VT Addison, Bennington, Grand Isle, Orange, Rutland, Washington, Windham, Windsor
WA Island, Kitsap, Lewis
WI Calumet, Chippewa, Columbia, Dane, Dodge, Kewaunee, Lafayette, Marathon, Menominee, Oneida, Portage, Richland, Rock, Sauk, Sheboygan, Trempealeau, Winnebago
WY Johnson
State Counties
State Counties
AL Jefferson
AR Conway, Pulaski, Scott
136 StreetInfo 9.0© 2007 MapInfo Corporation. All rights reserved.

Appendix B: StreetInfo Geographic Improvements by County
CA Butte, Colusa, Del Norte, Glenn, Humboldt, Inyo, Kings, Lake, Lassen, Mariposa, Medocino, Mono, San Benito, San Diego, San Francisco, Shasta, Sierra, Tehama
CO Arapahoe, Baca, Bent, Crowley, Delta, Kiowa, Prowers, Weld
DC District of Columbia
FL Bay, Charlotte, Duval, Leon, Manatee, Miami-Dade, Pinellas, St. Johns, Walton, Washington
GA Appling, Atkinson, Bacon, Baker, Banks, Ben Hill, Berrien, Bibb, Brantley, Brooks, Bryan, Bullock, Camden, Charlton, Chatham, Clarke, Clayton, Clinch, Coffee, Colquitt, Cook, Coweta, Dade, Dawson, Dooly, Douglas, Effingham, Elbert, Fayette, Forsyth, Franklin, Glascock, Glynn, Grady, Greene, Habersham, Hall, Houston, Irwin, Jackson, Jasper, Jefferson, Lanier, Liberty, Long, Lumpkin, Madison, McIn-tosh, Meriwether, Miller, Muscogee, Oconee, Oglethorpe, Pierce, Pike, Rabun, Rockdale, Seminole, Spalding, Stephens, Tattnall, Towns, Troup, Union, Upson, Walker, Walton, Ware, Warren, Washington, Webster, White
IA Black Hawk, Clay, Dallas, Davis, Fayette, Grundy, Harrison, Linn, Pottawattamie, Poweshiek, Warren, Winneshiek
ID Franklin, Gooding, Lincoln, Minidoka, Oneida, Teton
IL Crawford, Cumberland, DeKalb, Edwards, Gallatin, Hardin, Johnson, Lake, Pope, Saline, Stark, Union, Warren, Wayne,
IN Dubois, Hamilton, Hancock, Huntington, Kosciusko, Marion, Pike, St. Joseph, Wells
KS Douglas, Finney, Johnson, Leavenworth, Sedgwick, Wyandotte
KY Allen, Anderson, Ballard, Barren, Bath, Bell, Bourbon, Boyle, Bracken, Breathitt, Bullitt, Butler, Caldwell, Calloway, Campbell, Carlisle, Carroll, Casey, Christian, Clay, Crittenden, Cumberland, Daviess, Edmonson, Elliott, Fleming, Franklin, Ful-ton, Gallatin, Grant, Graves, Hancock, Hardin, Hart, Henderson, Henry, Hickman, Jackson, Jessamine, Johnson, Kenton, Larue, Laurel, Lewis, Lincoln, Livingston, Logan, Lyon, Madison, Marion, Marshall, Mason, McCracken, McLean, Meade, Mercer, Metcalfe, Monroe, Muhlenberg, Nelson, Oldham, Owen, Owsley, Perry, Robertson, Russell, Scott, Shelby, Simpson, Spencer, Todd, Trigg, Trimble, Union, Warren, Washington, Webster, Whitley, Woodford
State Counties
Product Guide 137© 2007 MapInfo Corporation. All rights reserved.

Geographic Improvements in StreetInfo 8.0
LA Acadia Parish, Allen Parish, Assumption Parish, Caddo Parish, Calcasieu Parish, Caldwell Parish, Cameron Parish, Concordia Parish, East Carroll Parish, East Feliciana Par-ish, Evangeline Parish, Franklin Parish, Grant Parish, Iberia Parish, Iberville Parish, Jackson Parish, Jefferson Davis Parish, Jefferson Parish, La Salle Parish, Lafayette Parish, Madison Parish, Orleans Parish, Pointe Coupee Parish, Red River Parish, Richland Parish, St. Bernard Parish, St. Charles Parish, St. Helena Parish, St. James Parish, St. John the Baptist Parish, St. Landry Parish, St. Mary Parish, Tensas Parish, Terrebonne Parish, Vermilion Parish, Wash-ington Parish
MA Nantucket
MD Baltimore, Baltimore City, Calvert, Caroline, Cecil, Charles, Dorchester, Howard, Montgomery, Prince George’s, Somerset, St. Mary’s, Worcester,
MI Alger, Allegan, Alpena, Antrim, Arenac, Baraga, Barry, Bay, Benzie, Berrien, Branch, Calhoun, Cass, Charlevoix, Cheboygan, Clare, Clinton, Crawford, Dickin-son, Eaton, Emmet, Genesee, Gladwin, Grand Traverse, Gratiot, Hillsdale, Hough-ton, Huron, Ingham, Ionia, Isabella, Jackson, Kalamazoo, Kalkaska, Kent, Keweenaw, Lapeer, Leelanau, Lenawee, Livingston, Luce, Macomb, Manistee, Marquette, Mecosts, Midland, Missaukee, Monroe, Montcalm, Montmorency, Muskegon, Newaygo, Oakland, Oceana, Ogemaw, Otsego, Ottawa, Presque Isle, Roscommon, Saginaw, Sanilac, Schoolcraft, Shiawassee, St. Clair, St. Joseph, Tus-cola, Van Buren, Washtenaw, Wayne
MN Cook, Dakota, Otter Tail, Ramsey, Sherburne
MO Andrew, Audrain, Barry, Barton, Buchanan, Caldwelll, Cass, Chariton, Clay, Dade, Dallas, Daviess, Gentry, Harrison, Howard, Howell, Jackson, Jasper, Johnson, Linn, Livingston, Macon, Mercer, Moniteau, Oregon, Pike, Platte, Putnam, Ray, Saline, Taney, Vernon, Warren, Worth
MS Covington, DeSoto, Jackson, Jefferson Davis, Lawrence, Marion, Pearl River
MT Lewis and Clark
NC Alleghany, Ashe, Cabarrus, Catawba, Chatham, Duplin, Forsyth, Franklin, Hyde, Lee, Lenoir, Lincoln, Orange, Pender, Randolph, Rockingham, Stokes, Tyrrell, Union, Wake
ND Adams, Barnes, Benson, Billings, Bottineau, Bowman, Burke, Burleigh, Cass, Cav-alier, Dickey, Divide, Dunne, Eddy, Emmons, Foster, Golden Valley, Grant, Griggs, Hettinger, Kidder, LaMoure, Logan, McHenry, McIntosh, McKenzie, McLean, Mer-cer, Morton, Mountrail, Nelson, Oliver, Pembina, Pierce, Ramsey, Ransom, Renville, Richland, Rolette, Sargent, Sheridan, Sioux, Slope, Stark, Steele, Stutsman, Towner, Traill, Walsh, Ward, Wells, Williams
State Counties
138 StreetInfo 9.0© 2007 MapInfo Corporation. All rights reserved.

Appendix B: StreetInfo Geographic Improvements by County
NE Adams, Banner, Buffalo, Burt, Butler, Cass, Cheyenne, Clay, Colfax, Dawson, Deuel, Douglas, Franklin, Frontier, Furnas, Garden, Gosper, Harlan, Johnson, Kim-ball, Morrill, Nance, Nemaha, Otoe, Pawnee, Phelps, Polk, Richardson, Sarpy, Thurston, Valley, Washington, York
NJ Atlantic, Burlington, Gloucester, Hunterdon,
NM Bernalillo, De Baca, Grant, Hidalgo, Sierra, Valencia
NV Esmeralda, Eureka, Mineral, Pershing, Storey, Washoe, White Pine
NY Bronx, Cayuga, Erie, Kings, Monroe, Montgomery, Nassau, New York, Queens, Richmond, Schenectady, Suffolk
OH Allen, Ashland, Ashtabula, Athens, Auglaize, Clark, Clermont, Clinton, Coshocton, Crawford, Darke, Defiance, Delaware, Fairfield, Fayette, Fulton, Geauga, Hamilton, Hancock, Henry, Highland, Jackson, Logan, Lucas, Madison, Mercer, Miami, Morrow, Pickaway, Por-tage, Preble, Putnam, Richland, Shelby, Summit, Trumbull, Union, Van Wert, War-ren, Wayne, Williams, Wyandot,
OK Tulsa
OR Clatsop
PA Adams, Berks, Centre, Chester, Clarion, Clearfield, Clinton, Columbia, Erie, Fulton, Greene, Indiana, Lancaster, Lehigh, Lycoming, Mifflin, Northampton, Northumberland, Perry, Philadelphia, Snyder, Union,
RI Bristol, Kent, Newport, Providence, Washington
SC Cherokee, Dillon, Greenwood, Hampton, Laurens, Lexington, Pickens
SD Aurora, Beadle, Bennett, Bon Homme, Brookings, Brule, Buffalo, Butte, Campbell, Charles Mix, Clark, Clay, Codington, Corson, Custer, Davison, Dewey, Douglas, Grant, Gregory, Haakon, Hamlin, Hanson, Hughes, Hutchinson, Hyde, Jackson, Jerauld, Jones, Kingsbury, Lake, Lawrence, Lincoln, Marshall, McCook, McPher-son, Meade, Mellette, Miner, Moody, Potter, Roberts, Sanborn, Spink, Stanley, Sully, Tripp, Turner, Union, Yankton, Ziebach
TX Archer, Bastrop, Baylor, Bowie, Brazoria, Brazos, Briscoe, Burnet, Caldwell, Cass, Castro, Childress, Clay, Collin, Cottle, Dallas, Delta, Denton, DeWitt, El Paso, Ellis, Erath, Fayette, Foard, Franklin, Galveston, Goliad, Gonzales, Gregg, Hall, Harde-man, Hays, Hood, Hopkins, Hunt, Jack, Jackson, Kaufman, Kerr, Lamar, Lavaca, Lee, Llano, McLennan, Midland, Montgomery, Morris, Navarro, Orange, Palo Pinto, Parmer, Red River, Rockwall, Somervell, Swisher, Tarrant, Taylor, Titus, Travis, Vic-toria, Wichita, Wilbarger, Young
State Counties
Product Guide 139© 2007 MapInfo Corporation. All rights reserved.

Geographic Improvements in StreetInfo 8.0
VA Alexandria City, Alleghany, Augusta, Bath, Botetourt, Buena Vista City, Colonial Heights City, Covington City, Craig, Dickenson, Dinwiddle, Essex, Fairfax, Fairfax City, Gloucester, Goochland, Greensville, Harrisonburg City, Highland, Hopewell City, King and Queen, King William, Lancaster, Lexington City, Mathews, Middlesex, Northumberland, Orange, Peters-burg City, Powhatan, Prince George, Richmond, Roanoke, Roanoke City, Rock-bridge, Rockingham, Salem City, Staunton City, Surry, Sussex, Waynesboro City, Westmoreland
WA Thurston
WI Door, Fond du Lac, Green Lake, Lincoln, Marinette, Vilas, Waukesha
WV Brooke, Cabell, Hancock
State Counties
140 StreetInfo 9.0© 2007 MapInfo Corporation. All rights reserved.

C
History of StreetInfo ChangesIn this Appendix:
Changes in StreetInfo 8.0 . . . . . . . . . . . . . . . . . . . . . . . . . . . . . . .142Changes in StreetInfo 7.0 . . . . . . . . . . . . . . . . . . . . . . . . . . . . . . .142

Changes in StreetInfo 8.0
Changes in StreetInfo 8.0This section contains the changes for StreetInfo version 8.0
New Layer Information AddedFor StreetInfo version 8.0 we added new SmartLabel metadata to the following point layers using the same methodology as we did for version 7. You can find these entries in Data Descriptions in Appendix A on page 98 of this product guide.
• Points Cultural• Points Natural• Points Municipal
Installation Media ChangesTo make installation easier for U.S.-wide purchasers, we have distributed the StreetInfo U.S. Enhanced Address Layer product on four DVDs and the StreetInfo U.S. Display product on 2 DVDs. State and county purchasers will receive CD-ROM media for installation.
MWS - An XML Format - SupportedThere is a new set of files on your installation disks that contain XML versions of the StreetInfo maps. These MWS files are preset workspaces that are in XML format to make it easier for you to share with users who are working on different platforms. For more information about this new platform, see Using MapInfo Workspace Files in Chapter 11 on page 91.
MapXtreme Java 4.7 SupportedYou can now use your StreetInfo 8.0 data with our MapXtreme Java 4.7 product.
Changes in StreetInfo 7.0This section contains the changes added for StreetInfo version 7.0.
Census 2000 InformationIn StreetInfo 7.0, the following layers now contain Census 2000 definitions of the entities in the layer: Counties, Minor Civil Divisions (MCDs), and Populated Places. All FIPS Code, FIPS Classification Code, and Naming is based on Census 2000 information (as found in TIGER/Line 2000) in addition to the actual object.
142 StreetInfo 9.0© 2007 MapInfo Corporation. All rights reserved.

Appendix C: History of StreetInfo Changes
County Roster ChangesThe Census Bureau has made several changes to their official county roster; this roster is their definition of the counties that exist in the United States. These changes, some of which are recent are reflected in StreetInfo 7.
MapXtreme Java SupportAll counties of StreetInfo now come with a Map Definition File (MDF) for using the data within MapXtreme Java. The MDF is a project file, similar to a workspace, that allows the MapXtreme Java user either through the Map Definition Manager, or through the MXTJ program interface, to open all of the content for a county in an appropriate manner.
Change Type of Change
Old Info (if relevant) county/state/fips/standard county
abbrev
New Info (if relevant) county/state/fips/standard county
abbrev
Dade, FL Name change Dade, FL, 12025, fldade Miami-Dade, FL, 12086, flmiam
Denali, AK New county Denali, AK, 02068, akdena
Skagway - Yakatut, AK
Multi-county change Old County definitionsSkagway-Yakutat-Angoon, AK, 02231, akskag
New County DefsSkagway-Hoonah-Angoon, AK, 02232, akskagYakutat, AK, 02282, akyaku
South Boston, VA County Removal South Boston, VA, 51780, vasbos
Yellowstone National Park, MT
County Removal Yellowstone National Park, MT, 30113, mtyelo
Luquillo, Puerto Rico
County abbreviation change (note that this is not a Census 2000 change but a GDT change)
Luquillo PR PRLOQU 72089
Luquillo PR PRLUQU 72089
Product Guide 143© 2007 MapInfo Corporation. All rights reserved.

Index
Aappending tables 58–61Area Landmarks layer 37, 119–122Autoloader
layer settings 18–25menu commands 23–27running 16–18
Ccartographic legend support 99City Boundaries layer 34–35, 115–117closing a highway shield layer 70closing layers 24–25Country Boundaries layer 117creating highway shield layers 68Cultural Point Locations layer 33, 112–113
DData Catalog table 26, 43–44data descriptions
Area Landmarks layer 119–122City Boundaries layer 115–117Country Boundaries layer 117Cultural Point Locations layer 112–113Elevation Contours layer 130–131Geocoding Boundaries layer 122–123Highway Shields layers 105–107Highways layer 104MCD Boundaries layer 118Municipal Points layer 111Native American Lands layer 128–130Natural Point Locations layer 114–115Railroads layer 109–110Rivers layer 124–125School District Boundaries layer 126–127seamless map layers 54–55Streets layer 99–104sub-MCD Boundaries layer 118–119Voting District Boundaries layer 127Water Boundaries layer 123–124
Delete Shield tool 67deleting a highway shield layer 70
Eediting Streets layer 78–83Elevation Contours layer 42–43, 130–131
Ffeature history by version 142–143finding map object information 48
GGeocoding Boundaries layer 37–38, 73, 122–123geocoding tables 72–75geosets 92–96
HHighway Shield Manager 65–70Highway Shields layers 31
common questions 107–108controlling display 69data description 105–107types 64
Highways layer 30, 104history of feature changes 142–143
Iinstallation 12–14Interstate Shield layer 64
Llabel settings
Autoloader 18–19layer control 46–47
layer settingsAutoloader 18–25highway shield layers 69–70layer control 46, 83–86

Index
MMapInfo Professional
Autoloader menu 23–27running Autoloader 16–18
MCD Boundaries layer 35–36, 118metadata 99Move Shield tool 67Municipal Points layer 32, 111MWS workspaces 91–96
NNative American Lands layer 41–42, 128–130Natural Point Locations layer 34, 114–115network installation 14New Shield tool 66
Oopening layers
Autoloader 24Highway Shield layers 67list of methods 14seamless maps 51
RRailroad layer 31Railroads layer 109–110reshaping boundaries 84Rivers layer 124–125Routes/Highway Shield layer 64running Autoloader 16–18
SSchool District Boundaries layer 39–40, 126–127seamless map layers 50–55selecting objects
seamless map layers 52–53SIFTER utility 87–89
SIFTER utility 87–89Street Append utility 58–61Streets layer 30
data description 99–104editing 78–83
stylesboundaries 84highway shields 69Point Landmark symbols 85Streets layer 82–83using style override 18, 85–86
sub-MCD Boundaries layer 36, 118–119
Ttemplates
layer display settings 19–23using 25–26
VVoting District Boundaries layer 40–41, 127
WWater Bodies layer 38Water Boundaries layer 123–124Water Rivers layer 38–39workspaces 14–15, 50
Zzoom settings
Autoloader 18seamless map layers 50–51
the guide title 145© 2007 MapInfo Corporation. All rights reserved. filename.pdf