STREET NEEDS ASSESSMENT - City of Toronto · Street Needs Assessment 2013 3 1. INTRODUCTION AND...
48
STREET NEEDS ASSESSMENT 2013 RESULTS
Transcript of STREET NEEDS ASSESSMENT - City of Toronto · Street Needs Assessment 2013 3 1. INTRODUCTION AND...

STREET NEEDS ASSESSMENT2013
RESULTS

Street Needs Assessment 2013
1
TABLE OF CONTENTS
1. Introduction and Highlights .............................................................................................. 3
1.1. 2013 Street Needs Assessment .................................................................................. 3
1.2. Highlights ..................................................................................................................... 3
2. Background & Methodology ............................................................................................. 6
2.1. Purpose and Objectives ............................................................................................... 6
2.2. Definition of Homelessness ......................................................................................... 6
2.3. Implementation ............................................................................................................ 7
2.4. Community Participation .............................................................................................. 7
2.5. Methodology ................................................................................................................ 8
2.6. Point-in-Time Count ..................................................................................................... 8
2.7. Survey ....................................................................................................................... 10
2.8. Improvements for 2013 .............................................................................................. 11
2.9. Costs ......................................................................................................................... 11
3. Estimate of Toronto's Homeless Population ................................................................. 13
3.1. Summary ................................................................................................................... 13
3.2. Outdoor Population .................................................................................................... 13
3.3. Indoor Sites ............................................................................................................... 14
3.4. Comparison to Other Jurisdictions ............................................................................. 16
4. Profile of Toronto's Homeless Population ..................................................................... 17
4.1. Duration of Homelessness ......................................................................................... 17
4.2. Age ............................................................................................................................ 18
4.3. Family Households .................................................................................................... 20
4.4. Gender ...................................................................................................................... 21
4.5. Aboriginal Identity ...................................................................................................... 22
4.6. LGBTQ Status ........................................................................................................... 24
4.7. Veterans .................................................................................................................... 24
4.8. Residency in Toronto ................................................................................................. 25
4.9. Income & Employment ............................................................................................... 26
4.10. Interactions with Police & the Correctional System .................................................... 28
5. People Experiencing Homelessness Want Housing ..................................................... 29
6. Service Needs of Toronto's Homeless Population ....................................................... 30
6.1. Overview of Service Needs........................................................................................ 30
6.2. Overview of Services Used ........................................................................................ 31
6.3. Waiting list for Subsidized Housing ............................................................................ 32
6.4. Housing & Homelessness Services ........................................................................... 33
6.5. Health & Treatment Services ..................................................................................... 35
6.6. Services that Help with Non-Housing Specific Needs ................................................ 37
7. Conclusions ..................................................................................................................... 40

Street Needs Assessment 2013
2
FIGURES
Figure 1 Comparison of outdoor homeless populations among major urban centres ................16
Figure 2 Distribution of respondents, by duration of homelessness ...........................................18
Figure 3 Trends in distribution of respondents by age group, 2006 to 2013 ..............................19
Figure 4 Share of respondents with non-adult dependents in shelters ......................................20
Figure 5 Trends in respondents identifying as Aboriginal ..........................................................23
Figure 6 Distribution of Aboriginal versus Non-Aboriginal respondents, by age .........................23
Figure 7 Trends in selected sources of income indicated by respondents .................................28
Figure 8 Trends in need for housing & homelessness services .................................................33
Figure 9 Trends in use of housing & homelessness services ....................................................34
Figure 10 Trends in need For health and treatment services .....................................................36
Figure 11 Trends in use of health and treatment services .........................................................37
Figure 12 Trends in need for non-housing specific services ......................................................38
Figure 13 Trends in use of non-housing specific services .........................................................39
TABLES
Table 1 Response rate for surveyed groups, with prior year comparisons .................................11
Table 2 Total estimated homeless population ...........................................................................13
Table 3 Outdoor Homeless population estimate, by Community Council District .......................13
Table 4 Respondents who had slept outdoors at least once during the past six months ...........14
Table 5 Homeless counts for indoor sites on April 17, 2013 ......................................................15
Table 6 Trends in average duration of homelessness (in years per respondent) .......................17
Table 7 Trends in average age of respondents .........................................................................19
Table 8 Distribution of respondents by age group .....................................................................20
Table 9 Self-identified gender of respondents ...........................................................................21
Table 10 Respondents identifying as Aboriginal ........................................................................22
Table 11 Respondents identifying with the LGBTQ community .................................................24
Table 12 Respondents indicating military service in the Canadian Forces ................................25
Table 13 Location of residence for respondents, one year prior to the survey ...........................25
Table 14 Sources of income reported by respondents ..............................................................26
Table 15 Top-5 sources of income, by surveyed groups ...........................................................27
Table 16 Interactions between respondents and police and the correctional system .................28
Table 17 Respondents who want permanent housing ...............................................................29
Table 18 Reasons provided by respondents who do not want permanent housing ...................29
Table 19 Service needs of respondents to get housing .............................................................30
Table 20 Services used by respondents during the 6 months preceding the 2013 SNA ............31
Table 21 Respondents on a subsidized housing waiting list ......................................................32
APPENDIX A
Sample of 2013 Street Needs Assessment Survey conducted with outdoor population

Street Needs Assessment 2013
3
1. INTRODUCTION AND HIGHLIGHTS
1.1. 2013 Street Needs Assessment
On April 17, 2013, the City of Toronto conducted the third Street Needs Assessment (SNA).
Previous surveys were completed in 2006 and 2009. The 2013 SNA was done in partnership
with more than 500 trained volunteers and team leaders from the community.
Almost two thousand 13-question surveys were successfully completed with individuals
experiencing homelessness in Toronto. Surveys were conducted outdoors, in the shelter system
(including City-administered shelters and those serving victims of domestic violence), hospitals
and treatment centres, and correctional facilities.
The survey results provide a unique and valuable source of information about the service needs
of some of Toronto's most vulnerable residents. Torontonians can use these insights as a way
to better understand the experience of homelessness in their city and engage in the dialogue
surrounding these issues.
This information is used to evaluate and improve the housing and homelessness support
programs provided by the City of Toronto and its partners, and ultimately to move us closer to
our end goal: closing the door on homelessness.
1.2. Highlights
The total homeless population in Toronto has remained stable since 2009 while the number of people sleeping outdoors has increased
There were an estimated 5,253 people who were homeless in Toronto on the night of April 17,
including both those with and without shelter. This is 1.6% higher than the estimate for 2009
(5,169).
Any rise in homelessness is undesirable – but because it was below the projected population
growth rate in Toronto during the same time period (4-5%), it is reasonable to consider the
overall homeless count in 2013 as "stable" with that of 2009.
447 individuals, or 9% of Toronto's homeless population, are estimated to have been sleeping
outdoors on the night of April17. This is 24% higher than 2009, but remains 39% below the
street population observed in 2006.
The vast majority of people experiencing homelessness want housing
93% of those experiencing homelessness indicated a desire to get into permanent housing and
this number has consistently increased since 2006. The relatively small number of respondents
who say that they do not want housing were most likely to state that it is because either they
intend to leave Toronto or that they have a specific challenge that keeps them from housing
(such as a health problem or a legal issue.)
For the vast majority of respondents, homelessness is not a matter of choice.

Street Needs Assessment 2013
4
The most important services to help the homeless get housing are those that address housing affordability
Clearly evident from the 2013 Street Needs Assessment is that 1) most homeless respondents
want housing and 2) above all else, it is a lack of affordable housing that stands in their way. To
the question "what is the one most important thing that would help you get housing," almost two-
thirds of respondents provided responses related to housing affordability – 29% said "more
money from OW/ODSP," 20% said "subsidized housing or a housing allowance", and 15%
indicated "help finding an affordable place."
Panhandling among the homeless has decreased to roughly a third of what it was in 2006
When asked what sources of income they have, the share of respondents who reported
panhandling was 6%, which is down from 10% in 2009 and 17% in 2006.
The most commonly cited sources of income in the 2013 Street Needs Assessment are some
form of government transfer (indicated by 71% of respondents), with 37% receiving Ontario
Works (OW) and 29% receiving Ontario Disability Support Program (ODSP). The share of
respondents with employment-related income decreased between 2009 and 2013, from 29% to
20%. 11% of respondents stated that they have no source of income whatsoever.
The share of homeless seniors has more than doubled in the past 4 years
A concerning trend observed in the 2013 SNA results was the dramatic increase in the share of
seniors in Toronto's homeless population. The share of respondents who indicated that they
were aged 61 and older increased from 5% to 10% between 2009 and 2013.
Further indication of the trend towards an older homeless population is the change in
respondents aged 51 and above, 29% of the homeless population in 2013 compared to 20%
four years ago. Although this trend is consistent with the aging trend in the general population,
the 2013 results point to a more rapid shift occurring in the homeless population.
Aboriginal people continue to be overrepresented in the homeless population, especially those sleeping outdoors and in younger age groups
Since the first Street Needs Assessment in 2006, the results have indicated mixed success in
addressing homelessness among those self-identifying as Aboriginal. While the absolute
number of those sleeping outdoors has decreased since 2006, the Aboriginal share of the total
homeless population has remained persistently high.
People identifying as Aboriginal represent about 1% of the general population in Toronto, and
16% of its homeless population. This is roughly consistent with results from 2006 and 2009.
The disproportionate level of Aboriginal homeless is even more apparent among those sleeping
rough on April 17, with one-third of outdoor respondents identifying as Aboriginal, a proportional
increase of 4% since 2009. The Aboriginal homeless population also tends to be younger, with
52% under the age of 41 compared to 46% among non-Aboriginals respondents.
One in five homeless youth identify as LGBTQ
For the first time in a Street Needs Assessment, respondents were asked about their sexual
identity. 21% of respondents in youth shelters identify as a part of the Lesbian, Gay, Bisexual,

Street Needs Assessment 2013
5
Transgendered, Transsexual, Two-spirited, Queer (LGBTQ) community, more than twice the
overall rate for the total homeless population. The rate of identification with the LGBTQ
community is higher among the female homeless population (11%) than the male population
(7%).
Emergency health care services are the most commonly used services by homeless people in Toronto
69% of respondents in the 2013 Street Needs Assessment indicated they had accessed health
and treatment services during the six months prior to the survey, more than any other type of
services. These respondents frequently made use of emergency health services. For example,
almost half of respondents (46%) indicating that they had visited a hospital/emergency room
and more than one in four said they had contact with an ambulance during the last six months.
In part, this result points to the negative health effects of homelessness – effects which are
diminished, if not entirely resolved, once housing stability is achieved. It should also be
interpreted in terms of the considerable cost difference between providing housing responses
(such as housing subsidies) versus more expensive emergency responses, as previously
described in the 2009 SNA report.
Substantial health benefits and cost savings can be achieved when people have housing.
Homelessness among Canadian Veterans is evident within Toronto
Street Needs Assessment respondents were asked about military service for the first time in
2013. 7% of the overall homeless population indicated that they had some experience in the
Canadian Forces. Data behind this result is limited (respondents were not asked about length or
type of service).
There has been little to no research conducted to understand the prevalence of homelessness
among veterans in Canada. However, studies in the United States show that roughly 7% of the
country's homeless population are veterans, while in the United Kingdom it is 6%.
Homelessness in Toronto is a challenge faced by both long-term residents as well as newcomers
When asked where they were living one year before the 2013 Street Needs Assessment, 81%
of respondents said Toronto. The notable exception, as previously described in detail in the
2009 Street Needs Assessment report, are those encountered in the City's family shelter
system, where roughly 30% indicated recent arrival from another country.

Street Needs Assessment 2013
6
2. BACKGROUND & METHODOLOGY
2.1. Purpose and Objectives
The first Street Needs Assessment (SNA) was conducted in 2006 at the direction of City
Council. The Street Outreach Steering Committee, an advisory group that included members
from community agencies, shelters, supportive housing providers, business associations,
private sector landlords, and City staff established five aims for the SNA, which were later
approved by Council. These continue to guide the SNA and are as follows:
1. The purpose of the initiative is to determine the services that people who are homeless
need in order to help them find and keep permanent housing, and to assist the City,
community agencies and others with service co-ordination, service planning and
advocacy. The number of people who are living on Toronto’s streets and in its public
spaces will be determined for the purpose of assessing the location, scale and
dimension of service needs, and in planning appropriate program responses.
2. Community agencies, volunteers and the City can work collaboratively to determine the
service needs of people who are homeless and living on the streets and in its public
spaces.
3. The manner in which the Street Needs Assessment initiative is conducted will be
respectful of homeless persons and the community agencies that serve them – it will use
existing expertise that local agencies have, and it will not be used to “out” homeless
persons in hiding, create a record of every individual unsheltered, or provide information
to law enforcement.
4. There are differences in homeless populations and their circumstances (e.g. people
living in ravines compared to those living on streets; people living alone compared to
those living in groups), and these differences will be respected when demonstrating the
service needs of people who are homeless and living on the streets and in public spaces
across the entire City.
5. The methods used should be applied consistently across the City, even if the level of
application is different, with sufficient techniques and measures for quality assurance
and continuous learning integrated into the methodology, and recognizing that the
results produced will likely understate the scale of need.
2.2. Definition of Homelessness
For the purposes of the Street Need Assessment, homelessness is defined as any individual
sleeping outdoors on the night of the survey, as well as those staying in emergency shelters, in
Violence Against Women (VAW) shelters, individuals in health or treatment facilities with no
permanent address, as well as those in correctional facilities who are registered in a Toronto
court as having no fixed address or a shelter address. Owing to limitations in the methodology,
this definition of homelessness excludes the so-called “hidden” homeless (e.g., couch surfers).

Street Needs Assessment 2013
7
2.3. Implementation
This year, the SNA was conducted on Wednesday, April 17 – consistent with both time of year
and day of the week of the two previous surveys in 2006 and 2009. Most surveys were
conducted between 7pm and 1am. Surveys in VAW shelters and correctional facilities were
completed throughout the day on April 17.
2.4. Community Participation
As in previous years, the Street Needs Assessment received critical support from interested
community members. 327 volunteers were recruited from across Toronto, along with 254 team
leaders from community agencies and City staff. Volunteers were able to register for
participation either online or by calling 311. Although the majority of volunteers registered
online, 311 provided valuable assistance and information to participants and members of the
public. Where participants required assistance in signing up, 311 customer service
representatives completed the form on their behalf.
There were two key challenges with respect to volunteer enrollment in 2013. The first was lower
than anticipated volunteer enrollment for field offices in outlying areas. As a result, mobile staff
teams from the Streets to Homes program were deployed to supplement the coverage of some
study areas. An additional challenge was the gap between the number of volunteers who signed
up online (569) versus the number that actually showed up at field offices to participate on April
17 (327).
Team leaders generally had experience working with homeless and/or marginally housed
individuals. Volunteers were not required to have any previous experience, but were always
under the direction of team leaders. Team leaders received training during one evening the
week before April 17 and received an honorarium of $125 in the form of a grocery card upon
completion of all their responsibilities.
Volunteers were provided with an online training program. Before deployment on the night of
April 17, volunteers were provided with refresher training on enumeration methods and on how
to interact in a sensitive manner with homeless individuals.
TEAM LEADER AND VOLUNTEER FEEDBACK
At the end of the evening, volunteers and team leaders were asked to complete a feedback
form to rate various aspects of the Street Needs Assessment and offer suggestions for future
improvements. Overall, satisfaction among participants for both the training and overall
organization of SNA improved significantly from 2009.
Of those who responded, 91% of volunteers, 93% of team leaders and 100% of partner
agencies rated their overall experience during the 2013 SNA as "good" or "very good." The
effectiveness of the training was rated as "very good" or "good" by 95% of team leaders for their
advance training and 82% of volunteers for their refresher training. The organization of the 2013
SNA was described as "very good" or "good" by 81% of volunteers, 89% of team leaders and
95% of partner agencies. 95%of volunteers said they would recommend participation in a future
SNA to others.

Street Needs Assessment 2013
8
2.5. Methodology
To ensure comparability of results, the 2013 SNA employed a consistent methodology to those
used in 2006 and 2009. The Street Needs Assessment includes both a point-in-time count, used
to enumerate the number of individuals experiencing homelessness on April 17, and a survey.
Both components were developed in 2006 through extensive research and consultation with
experts from other jurisdictions, as well as a range of local stakeholders.
2.6. Point-in-Time Count
The methodology for the point-in-time count is based on a model recommended by the United
States Government’s Department of Housing and Urban Development and is used in major
urban centres across the United States and Canada (including Vancouver, Edmonton and
Calgary). In addition, the City of Toronto employs quality assurance measures based on those
used in New York City’s Homeless Outreach Population Estimate.
The point-in-time count for 2013 includes an enumeration of individuals staying in indoor sites,
based on occupancy reports provided by City shelters, VAW shelters (provided by the provincial
Ministry of Community and Social Services), health and treatment facilities (provided by staff
contacts in each facility) and correctional facilities (provided by the provincial Ministry of
Community Safety and Correctional Services). The point-in-time count also includes an estimate
of the outdoor homeless population described below.
This methodology reflects the number of homeless captured during a specific interval of time (in
this case, on April 17). From available shelter statistics, we know that there is a certain degree
of instability within homeless population group, and some individuals will cycle in and out of
homelessness more than once during the course of a year. For example, while there may be
roughly 4,000 people staying in Toronto shelters on a given night, over the course of a year
more than 27,000 different individuals will use the shelter system. Therefore, the point-in-time
count should be recognized as a snapshot view of Toronto's homeless population.
ESTIMATING THE OUTDOOR HOMELESS POPULATION
In order to facilitate the point-in-time count for the outdoor homeless population, the city was
divided into 544 study areas, based on 2011 Statistics Canada census tracts. 295 study areas
were selected to be surveyed on the night of the SNA. 91 study areas were surveyed in the
downtown core, representing full coverage of the area. A further 36 study areas outside the core
were identified by community partners as areas where homeless individuals were known to be
staying. 168 study areas outside the downtown core were randomly selected to be surveyed. A
total of 55% of Toronto's study areas were actually surveyed representing 52% of the surface
area of Toronto.
Volunteer teams were assigned to roughly equal sized study areas (or groups of study areas)
and instructed to survey all public spaces within those study area systematically, so that every
location was covered only once. Public spaces included all streets, laneways, and public
squares.
Special teams of City staff were deployed to hard-to-reach areas, such as ravines, parks,
valleys and areas surrounding expressways (such as onramps and viaducts) with known

Street Needs Assessment 2013
9
homeless encampments, as well as to any locations within survey areas not covered by regular
teams for logistical or safety reasons.
At the end of the night, the study teams (both volunteer and City staff) provided either full or
abbreviated survey forms for each for each individual they encountered who was experiencing
homelessness. Once reviewed for validity, these forms were used to derive the count of
'encountered' homeless individuals for each study area.
CONTROL GROUPS, QUALITY ASSURANCE & CALCULATED ADJUSTMENT
Once the counts of encountered individuals experiencing homelessness are completed for each
study area, a calculated adjustment is made to account for those individuals not encountered
but experiencing homelessness on the night of April 17.
In part this calculated adjustment is made to account for the degree to which all individuals
experiencing homelessness were visited and surveyed within the study areas. These "capture"
rates were calculated using control groups dispatched to specific locations in outdoor study
areas across Toronto. Control groups were instructed to remain in their designated locations for
the entirety of the survey period (from 7pm to 12pm) and report back at the end of the night
whether they were visited and/or surveyed by a study team. In a few cases, control group
members were dismissed prior to completion of the survey.
Members of the SNA 2013 control groups were recruited from employment programs across the
city as well as from colleges and universities. They received training on the afternoon of April 17
and on completion of their duties on April 17 they received a grocery card worth $100. The
number of control group members that participated in 2013 (50) was comparable to previous
years, 45 in 2009 and 49 in 2006. While all who completed feedback forms rated their SNA
experience as "good" or "very good," many members found it challenging to remain at their
outside location in cold and wet weather for several hours. The training received was rated
overwhelmingly as "good" or "very good."
In addition to the calculated adjustment for the capture rates, a further adjustment is made to
the estimate to account for 249 study areas of Toronto that were not surveyed by study teams
on April 17.
The calculation for the outdoor estimate has been revised for the 2013 SNA to exclude the
"Adjustment for Non-Sampled Areas." After consultation with subject matter experts, it was
determined that this adjustment, which is explained in further detail in the 2009 Street Needs
Assessment report, was unnecessary. The outdoor estimate figures for 2006 and 2009 cited in
this report have been updated to ensure consistency with the 2013 estimate.
WEATHER
Between 7pm on April 17 and 1am on April 18, the period during which the survey was
completed, the mean temperature was 7.5 degrees with periodic rain showers beginning at
11:00 pm. Weather does not appear to have affected the results of the 2013 Street Needs
Assessment, as compared to previous years.
Street Needs Assessment 2013
10
2.7. Survey
In addition to thorough research on practices in other jurisdictions, Toronto’s survey was
adapted to meet local needs through review by the Street Outreach Steering Committee, which
provided direct input into the original design of the survey tool in 2006. When it was developed
in 2006, the survey was also refined through focus groups and pre-testing with homeless and
formerly homeless persons. The survey used in 2013 was consistent with the survey used in
2009, with three additional questions respecting residency in Toronto; LGBTQ status; and self-
identified military service in the Canadian Forces.
A sample copy of the survey administered to the outdoor population is attached as Appendix A.
ADMINISTERING THE SURVEY OUTDOORS
Study teams were instructed to stop everyone they encountered to ask screening questions
which established housing status and whether the individual had already been surveyed. Teams
were instructed not to wake anyone found sleeping. For those who refused or were unable to
complete the survey, team leaders, based on their experience, made the determination to
include the individual as being homeless and recorded their estimated age and gender. These
assessments were recorded in an abbreviated survey form and reviewed by staff.
For those who agreed to complete the survey, a series of 13 questions were asked regarding
the length of time they had been homeless, their income sources, emergency and social
services they may have used, and what they felt they need in order to obtain permanent
housing. Upon completion of the survey, participants were given a gift card. Survey teams also
asked individuals if they needed assistance in finding shelter for the evening, and street
outreach vans were on call to transport individuals to shelters if requested.
ADMINISTERING THE SURVEY IN INDOOR FACILITIES
Surveys were also conducted at all City-administered shelter facilities, provincial Violence
Against Women (VAW) shelters, health and treatment facilities and correctional facilities.
In addition to homeless people living outdoors and in City-administered shelters, other locations
where homeless people may be staying are included in the Street Needs Assessment to provide
a more complete understanding of homelessness in Toronto. However, because these locations
are facilities not directly administered by the City, their participation in the Street Needs
Assessment relies on the continued partnership of the Province and their agency partners.
The support and partnership of the Ministry of Community and Social Services, the Ministry of
Corrections and Community Safety, the John Howard Society and Elizabeth Fry Society in
conducting the Street Needs Assessment is greatly appreciated.
RESPONSE RATE
As shown in Table 1, the overall response rate for the 2013 SNA survey (40%), as well as those
conducted outdoors, in City shelters and in health and treatment facilities are largely consistent
with previous years. The decline in response rates for VAW shelters and Correctional facilities
was due in part to uneven participation among specific sites. Improvements will be sought to
support more consistent participation across all sites in the future.

Street Needs Assessment 2013
11
The large number of surveys completed (1,981 compared to 1,888 in 2009) demonstrates that
once again homeless people wanted to participate in the survey and have a direct voice in
identifying their needs. The total sample size provides a strong level of confidence in the
integrity of the results.
TABLE 1 RESPONSE RATE FOR SURVEYED GROUPS, WITH PRIOR YEAR COMPARISONS
Surveyed Groups 2006 2009 2013
Outdoors 51% 54% 55%
City-Administered Shelters 40% 34% 37%
VAW Shelters N/A 57% 40%
Health & Treatment Facilities 47% 62% 69%
Correctional Facilities 53% 65% 43%
Total 42% 39% 40%
2.8. Improvements for 2013
Each successive SNA involves gathering and sharing lessons to assist in planning the next
initiative. Improvements made for the 2013 SNA included:
• Three new survey questions added: lived in Toronto for more than one year; self-identify
as LGBTQ; self-identify as military service in Canadian Forces
• 311 becomes the "public face" of SNA, responding to enquiries and registering
volunteers who did not have access to a computer
• Volunteers receive confirmation of field office within two weeks of registration, as well as
biweekly updates and online training
• A new centralized database assists in managing all persons involved in SNA
• Online registration shuts down 48 hours prior to SNA day to make final adjustments to
assignments. Within the last 48 hours, any new volunteers are asked to show up at field
offices that still require support
• Training for field office staff and team leaders is provided one week prior to SNA day at
each respective field office
• All maps are redesigned to make them more user-friendly
• The implementation model is similar to the City Elections model, i.e. districts, each with a
coordinator who is responsible for the field offices in her/his district
• Increased number of field offices, separated for outdoors and indoors
• Field offices are staffed as of noon on SNA day to receive materials and set up
• Volunteers are assigned to teams as they arrive at their field office (i.e. not in advance)
2.9. Costs
Direct costs of the 2013 Street Needs Assessment were $66,213, representing a 44% decrease
from the 2009 budget. Contributing factors included lower expenditures on honoraria for team
leaders, equipment, space rental and printing.
As in 2009, the 2013 Street Needs Assessment was funded entirely from the Government of
Canada's Homelessness Partnering Strategy (HPS).

Street Needs Assessment 2013
12
The funding for the Street Needs Assessment covered all project supplies, $7.50 gift certificates
for individuals who completed the survey, advertisements, honoraria for team leaders from
community agencies, honoraria for members of the control group, printing, TTC tokens to and
from study areas as necessary, and costs associated with training and field offices, including
delivery of supplies.
As in previous years, the budget was not intended to cover City staff time associated with the
project. SNA is an integral part of the sponsoring City division's work plan involving a number of
SSHA staff. Furthermore, other City staff were invited to support SNA by their own involvement
on April 17.

Street Needs Assessment 2013
13
3. ESTIMATE OF TORONTO'S HOMELESS POPULATION
3.1. Summary
Based on the 2013 SNA, it is estimated that there were 5,253 people experiencing
homelessness outdoors, in emergency and transitional shelters, in health and treatment
facilities, and incarcerated in Toronto-area detention centres from a Toronto court on April 17.
This represents a 1.6% overall increase from 2009.
TABLE 2 TOTAL ESTIMATED HOMELESS POPULATION
2006 2009 2013
Surveyed Groups Count Share of
Total Count
Share of Total
Count Share of
Total
Outdoors 735 15% 362 7% 447 9%
City-Administered Shelters 3,649 73% 3,990 77% 3,970 76%
VAW Shelters 171 3% 306 6% 356 7%
Health & Treatment Facilities 275 6% 223 4% 236 4%
Correctional Facilities 139 3% 288 6% 244 5%
Total 4,969 100% 5,169 100% 5,253 100%
3.2. Outdoor Population
The number of homeless individuals sleeping outdoors on April 17 is estimated at 447. This is a
24% increase from the 2009 estimate, but remains well below the number observed in 2006. In
2013, those sleeping outdoors represent 9% of the total homeless population, compared to 15%
in 2006.
As described in the methodology section above, the outdoor estimate has two components, 1) a
count of individuals encountered and identified as homeless and 2) an estimated count of
individuals not encountered, based on extrapolation for non-surveyed study areas and
probability rates for visits and surveys conducted with respondents. The probabilities are
calculated based using the quality control groups.
Full results by Community Council District are presented in Table 3 below.
TABLE 3 OUTDOOR HOMELESS POPULATION ESTIMATE, BY COMMUNITY COUNCIL DISTRICT
Community Council District
Total Study Areas
Study Areas Surveyed
Outdoor Homeless Population
Encountered (Counted)
Not Encountered (Calculated)
Total
Etobicoke-York 155 117 8 16 24
North York 125 57 4 12 16
Scarborough 141 67 12 33 45
Toronto-East York 123 54 176 187 363
Total 544 295 200 247 447
In all, 200 individuals were actually encountered by study teams in the 295 study areas
surveyed. Extrapolation to the remaining 249 unsurveyed areas as well as the probability-based
Street Needs Assessment 2013
14
adjustments yields an estimate of 247 individuals not encountered but sleeping outdoors in April
17. This provides a total estimate of 447 individuals staying outdoors on the night of the survey.
MOVEMENT BETWEEN INDOOR AND OUTDOOR SITES
When calculating the share of the total homeless population sleeping outdoors it is important to
remember that the circumstances of many respondents are unstable, even on a night-to-night
basis. Therefore while a respondent may be sleeping outdoors the night of April 17, that
respondent may use a shelter bed the following night.
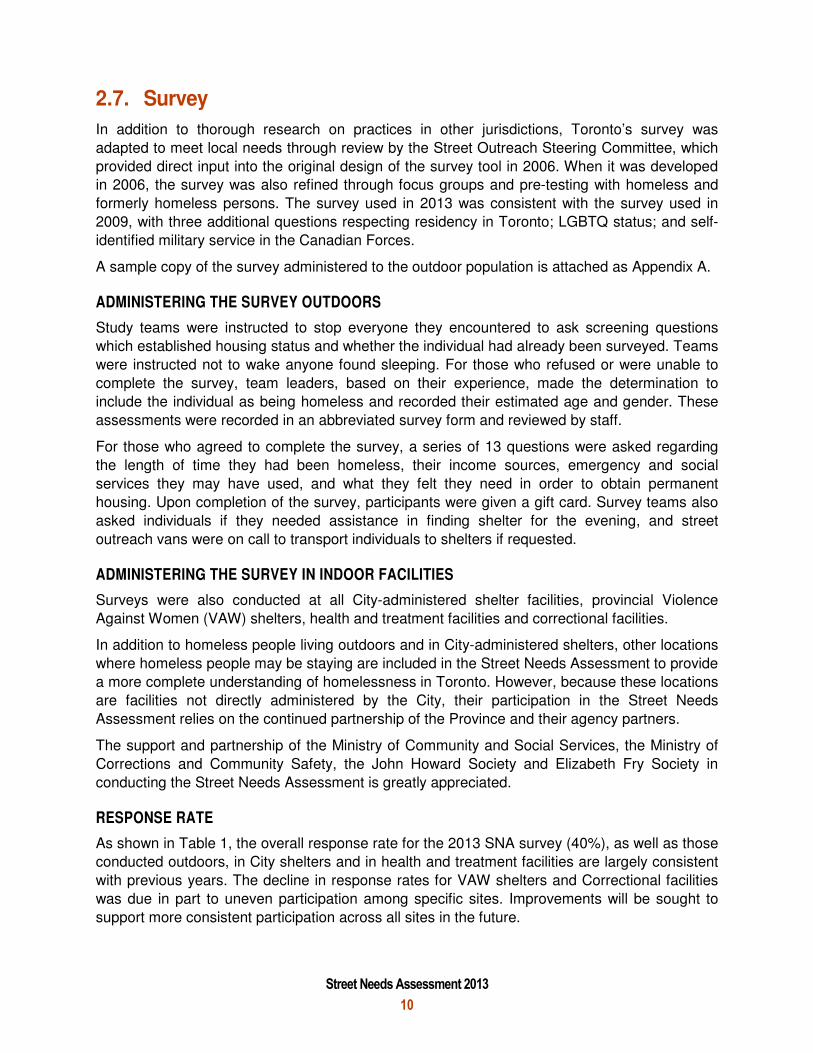
Consider the following: 9% of the total homeless population was estimated to be sleeping
outdoors on the night of April 17. However, 39% of all respondents to the 2013 Street Needs
Assessment survey (including those indoors) indicated that they had spent at least one night
outdoors during the preceding 6 months.1 This result (which is comparable to 2006 and 2009)
implies that the point-in-time outdoor homeless estimate captures, at most, a quarter of the total
number of individuals that experienced outdoor homelessness in Toronto over a six-month
period. As such, it is reasonable to expect that the actual outdoor population will vary due to
periodic and irregular movements between indoor facilities and outdoor sites and, therefore, the
variance observed between 2009 and 2013 may be a result of this movement as well longer
term trends.
TABLE 4 RESPONDENTS WHO HAD SLEPT OUTDOORS AT LEAST ONCE DURING THE PAST SIX MONTHS
Surveyed Groups Slept Outdoors Had Not Slept Outdoors No Answer
Outdoors 100% 0% 0%
City-Administered Shelters 35% 65% 0%
Family 12% 88% 0%
Youth 41% 59% 0%
Mixed Adult 42% 58% 0%
Men's 40% 60% 0%
Women's 28% 72% 0%
VAW Shelters 10% 88% 1%
Health & Treatment Facilities 41% 57% 2%
Correctional Facilities 68% 32% 0%
All Respondents 39% 61% 0%
3.3. Indoor Sites
CITY-ADMINISTERED SHELTERS
As in previous years, surveys and counts were conducted in all City-funded shelters, including
those that are operated directly by the City and through community partner agencies. The
number of homeless individuals staying in the shelter system on April 17 was relatively stable
with the results from 2009 (-0.5%). There was a decline in the family system (from 1,093 in 2009
to 943 in 2013) and in the youth shelter system (from 489 to 447). However, there was an
1 Conversely, more than a third of those sleeping outdoors (37%) indicated that they had used the shelter
system during that time.

Street Needs Assessment 2013
15
increase in the number of occupants in the single adult system (i.e., men's, women's and mixed
adult shelters), where occupancy increased from 2,408 to 2,580.
VIOLENCE AGAINST WOMEN (VAW) SHELTERS
The number of homeless women and children staying in provincially-administered Violence
Against Women (VAW) shelters increased by 16% from 2009. The VAW shelter system is
directly funded and administered by the Province. Occupancy counts are provided from the
Ministry of Community and Social Services.
The estimated count for VAW shelters in 2009 has been retroactively adjusted upwards (from
185 to 306) to account for shelter sites that were not included in the previous year's count. In
addition, one shelter site has been added to the system since 2009, creating additional capacity.
HEALTH & TREATMENT FACILITIES
On the night of April 17, City staff worked with representatives at 25 health and treatment
facilities in Toronto to count the number of intake patients that were identified as homeless. The
number of homeless individuals staying in health and treatment facilities was 236, which
represents an increase of 6% compared to the 2009 results.
CORRECTIONAL FACILITIES
Correctional facilities in Toronto are administered by the provincial Ministry of Community Safety
and Correctional Services (MCSCS). MCSS staff provide the City with a count of offenders from
a Toronto Court who list their previous residence as "No Fixed Address" (NFA) or a known
shelter location.
In 2006, only NFA addresses and not shelter addresses were collected and to ensure a more
consistent comparison, only individuals with NFA addresses were included in the results for
2009.
In 2013, shelter addresses were included along with NFA in the correctional facilities count.
Despite this broader definition of homelessness, the count of homeless individuals staying in
area correctional facilities actually declined between 2013 compared with 2009 by 18%.
TABLE 5 HOMELESS COUNTS FOR INDOOR SITES ON APRIL 17, 2013
Indoor Sites Occupancy Count
City-Administered Shelters 3,970
Family 943
Youth 447
Mixed Adult 375
Men's 1,602
Women's 603
VAW Shelters 356
Health & Treatment Facilities 236
Correctional Facilities 244
Total for Indoor Sites 4,806

Street Needs Assessment 2013
16
3.4. Comparison to Other Jurisdictions
Although the methods and definitions used to conduct homeless enumerations in other
jurisdictions are somewhat different than those used in Toronto, and are therefore not directly
comparable in absolute numbers, a comparison of general trends can provide some context to
the results from Toronto's 2013 Street Needs Assessment.
Figure 1 illustrates the findings for outdoor homeless population counts, available for Toronto
and other major North American urban centres that have conducted recent enumerations of
homelessness.2
FIGURE 1 COMPARISON OF OUTDOOR HOMELESS POPULATIONS AMONG MAJOR URBAN CENTRES
2 Results for Calgary accessed from the Calgary Homeless Foundation Point-in-time report (2012)
accessed from http://calgaryhomeless.com/assets/research/Winter2012-PIT-Final-Report.pdf.
Results for Vancouver accessed from the 2012 Vancouver Homeless Count Executive Summary
accessed from http://vancouver.ca/files/cov/summary-vancouver-homeless-count-2012.pdf.
Results for all US cities calculated from the results of New York City's 2013 Homeless Outreach
Population Estimate (2013) accessed from
http://www.nyc.gov/html/dhs/downloads/pdf/hope_2013_web_presentation.pdf.
Street Needs Assessment 2013
17
4. PROFILE OF TORONTO'S HOMELESS POPULATION
The primary objective of the Street Needs Assessment is not simply to provide a count of
homelessness, but also to gather information about trends and characteristics of those
experiencing homelessness in Toronto, in order to better understand their service needs. This
information is used by the City, community agencies and other groups to support service
coordination, planning and advocacy. A total of 1,981 surveys were collected and determined as
valid for the purposes of this analysis.
4.1. Duration of Homelessness
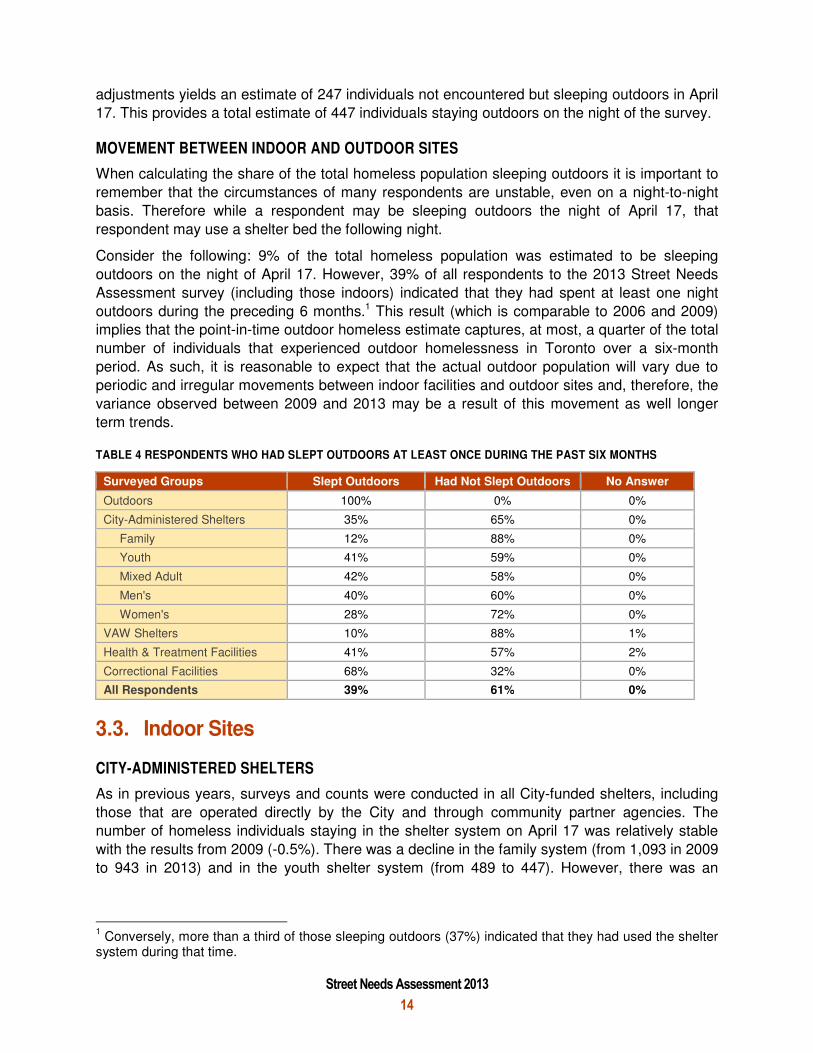
ON AVERAGE, RESPONDENTS HAVE EXPERIENCED 3 YEARS OF HOMELESSNESS
On average, respondents said that they had been homeless for 3 years, although this ranges
widely depending on the group being surveyed. For example, outdoor respondents indicated
longer experiences of homelessness (approaching 8 years on average), while those in the
shelter system typically indicated shorter experiences of homelessness. Respondents in family
and VAW shelters indicated less than 6 months on average.
Overall, there was not much change in the average duration of homelessness between 2009
and 2013 for most groups, with the exception of the outdoor population (+1.8 years) which was
driven by a few respondents reporting unusually long experiences of homelessness, and mixed
adult shelters (+2.2) years, which saw a return to a value more consistent with 2006 (Table 6).
TABLE 6 TRENDS IN AVERAGE DURATION OF HOMELESSNESS (IN YEARS PER RESPONDENT)
Surveyed Groups 2006 2009 2013
Outdoors 6 6.1 7.9
City-Administered Shelters 3 2.5 2.8
Family 0.6 0.5 0.4
Youth 1.2 1.2 1.4
Mixed Adult 3.8 2 4.1
Men's 4.1 3.6 3.5
Women's 2.1 2.7 2.4
VAW Shelters N/A 0.4 0.5
Health & Treatment Facilities 4.2 4.2 4.0
Correctional Facilities 4.5 4.7 4.4
All Respondents 3.4 2.9 3.0
MORE THAN A THIRD OF RESPONDENTS HAVE BEEN HOMELESS FOR AT LEAST 2 YEARS
35% of all respondents have been homeless for more than 2 years, compared to 28% in 2009
and 34% in 2006. Among those sleeping outdoors, there has been a considerable increase in
the share of respondents indicating long-term homelessness (i.e., 2 years or more) – 68% have
been homeless more than two years compared to 51% in 2009. Even more startling is the fact
that over one third of the outdoor homeless indicated that they had been homeless for at least
10 years – the share of all respondents answering the same was closer to 10%. Figure 2
illustrates the distribution of respondents by duration of homelessness.

Street Needs Assessment 2013
18
FIGURE 2 DISTRIBUTION OF RESPONDENTS, BY DURATION OF HOMELESSNESS
OLDER RESPONDENTS HAVE LONGER EXPERIENCES OF HOMELESSNESS
It is not surprising to find that there is a correlation between the age of respondents and
reported duration of homelessness: the older the age of the respondent; the longer their
reported duration of homelessness. For example, respondents under the age of 30 have
typically been homeless for less than 1½ years, while those over the age of 65 reported an
average of 7 years of homelessness (up from 6 years in 2009).
4.2. Age
THE AVERAGE AGE OF RESPONDENTS CONTINUES TO INCREASE WITH EACH SNA
The average age of respondents has continuously increased through all three Street Needs
Assessments, from 38 years in 2006 to 42 years in 2013.3 In particular, there have been
increases in the average age of respondents in the single men's shelter system, increasing from
44 in 2006 to 49 years in 2013, and health and treatment facilities where the average has
climbed from 37 to 45 during the past 7 years (Table 7). The average age for female
respondents is 37 and for male respondents it is 44.
3 Consistent with previous years, only heads of household for families with dependents were included for
the purposes of calculating age distributions.

Street Needs Assessment 2013
19
TABLE 7 TRENDS IN AVERAGE AGE OF RESPONDENTS
Surveyed Groups 2006 2009 2013
Outdoors 37 41 41
City-Administered Shelters 39 39 42
Family 35 35 34
Youth 20 20 21
Mixed Adult 41 41 44
Men's 44 46 49
Women's 42 44 44
VAW Shelters 33 35 33
Health & Treatment Facilities 37 40 45
Correctional Facilities 36 36 37
All Respondents 38 39 42
SHARE OF SENIORS IN THE HOMELESS POPULATION HAS DOUBLED SINCE 2009
Although the share of seniors in the homeless population is lower than that of the general
population, trends point to the increasing prevalence of seniors homelessness since 2006. The
share of respondents who indicated that they were aged 61 and older increased from 5% to
10% between 2009 and 2013. Further indication of the trend towards an older homeless
population is the increase in respondents aged 51 and above, 29% of the homeless population
in 2013 compared to 20% four years ago. Although this trend is consistent with the aging trend
in the general population, the 2013 results point to a more rapid shift occurring in the homeless
population. Refer to Figure 3 for an illustration of changes in age group distribution between
2006 and 2013 and Table 8 for a full breakdown of age groups for 2013.
FIGURE 3 TRENDS IN DISTRIBUTION OF RESPONDENTS BY AGE GROUP, 2006 TO 2013

Street Needs Assessment 2013
20
TABLE 8 DISTRIBUTION OF RESPONDENTS BY AGE GROUP
Surveyed Groups Under 21 21 to 30 31 to 40 41 to 50 51 to 60 61 to 65 Over 65
Outdoors 7% 22% 17% 29% 19% 1% 5%
City-Administered Shelters 7% 19% 18% 24% 21% 6% 5%
Family 8% 37% 28% 18% 8% 1% 1%
Youth 47% 52% 1% 0% 0% 0% 0%
Mixed Adult 2% 12% 26% 28% 25% 4% 3%
Men's 0% 8% 17% 30% 27% 9% 8%
Women's 3% 16% 20% 27% 24% 6% 5%
VAW Shelters 5% 36% 43% 12% 5% 0% 0%
Health & Treatment Facilities 1% 16% 22% 22% 22% 11% 5%
Correctional Facilities 3% 26% 28% 33% 8% 1% 0%
All Respondents 6% 20% 20% 24% 19% 5% 5%
4.3. Family households
As in previous years, respondents in family and Violence Against Women shelters were asked
about the number of dependents that were staying with them in the shelter system. The results
for families with non-adult dependents in the shelter system are shown in Figure 4. 14% of
respondents were accompanied by their children and/or other dependents. Of these
households, more than half had either one or two dependents, while over a quarter had at least
three dependents.
FIGURE 4 SHARE OF RESPONDENTS WITH NON-ADULT DEPENDENTS IN SHELTERS

Street Needs Assessment 2013
21
4.4. Gender
Consistent with previous years, respondents identifying as male represent almost two-thirds of
the homeless population in Toronto (65%). Individuals identifying as female represent a third
and transgender and transsexual identified individuals represent 1% of the homeless population
(Table 9).
The gender imbalance is more pronounced among the outdoor population (85% identifying as
male) and correctional facilities (93%). The gender distribution for surveyed groups reported for
the shelter system (including both City and VAW shelters) is largely determined by shelter-level
program criteria (e.g., men's versus women's shelters).
Although still underrepresented in the overall homeless population, the proportion of
respondents identifying as female has increased by roughly 7% since 2006.
TABLE 9 SELF-IDENTIFIED GENDER OF RESPONDENTS
Surveyed Groups Female Male Transgender / Transsexual
Other No
Answer
Outdoors 15% 85% 0% 0% 0%
City-Administered Shelters 31% 68% 1% 0% 0%
Family 75% 25% 0% 0% 1%
Youth 28% 69% 2% 1% 0%
Mixed Adult 31% 67% 2% 0% 0%
Men's 0% 99% 1% 0% 0%
Women's 97% 0% 3% 0% 0%
VAW Shelters 99% 0% 1% 0% 0%
Health & Treatment Facilities 31% 69% 1% 0% 1%
Correctional Facilities 5% 93% 2% 0% 0%
All Respondents 33% 65% 1% 0% 0%

Street Needs Assessment 2013
22
4.5. Aboriginal Identity
In 2013, 16% of survey respondents responded yes to the question, "Would you identify
yourself as being Aboriginal?" (Refer to Table 10.) The response rate is consistent with previous
years. As in 2006 and 2009, individuals self-identifying as Aboriginal are vastly overrepresented
among Toronto's homeless when compared to their share of the general population. According
to the latest data available through Statistics Canada, 1.2% of residents in the Greater Toronto
Area have Aboriginal ancestry.4
TABLE 10 RESPONDENTS IDENTIFYING AS ABORIGINAL
Surveyed Groups Aboriginal Non-Aboriginal No Answer
Outdoors 33% 66% 1%
City-Administered Shelters 14% 85% 1%
Family 9% 89% 1%
Youth 16% 84% 1%
Mixed Adult 19% 80% 1%
Men's 14% 85% 1%
Women's 14% 83% 3%
VAW Shelters 8% 88% 4%
Health & Treatment Facilities 17% 81% 2%
Correctional Facilities 29% 71% 0%
All Respondents 16% 83% 1%
A THIRD OF THE OUTDOOR HOMELESS POPULATION IDENTIFIES AS ABORIGINAL
The incidence of Aboriginal-identified homelessness is even more apparent among the outdoor
population, where fully one third of respondents identify as Aboriginal. The actual number of
self-identified Aboriginals among the outdoor homeless population remains lower than in 2006 –
estimated at approximately 150 individuals in 2013, compared to 190 in 2006. However, the
self-identified Aboriginal population has represented a consistently larger share of the street
involved population – up from 9% in 2009 and 26% in 2006. Aboriginal-identified respondents
were also more likely to indicate at least one night spent outdoors during the six months
preceding the survey (with 61% indicating that they had done so), compared to 40% among
Non-Aboriginals. What these result seems to indicate is that while there has been some
measure of success in reducing the overall experience of outdoor homelessness since 2006,
those gains have been uneven between Aboriginal and non-Aboriginal populations.
THE ABORIGINAL HOMELESS POPULATION IS YOUNGER ON AVERAGE
The average age of Aboriginal-identified respondents is 39, compared to 42 for those that do
not identify as Aboriginal. As shown in Figure 6, Aboriginal-identified respondents are more
likely to be found among younger age groups.
4 From the 2011 National Household Survey, Catalogue Number 99-011-X2011029.

Street Needs Assessment 2013
23
FIGURE 5 TRENDS IN RESPONDENTS IDENTIFYING AS ABORIGINAL
FIGURE 6 DISTRIBUTION OF ABORIGINAL VERSUS NON-ABORIGINAL RESPONDENTS, BY AGE

Street Needs Assessment 2013
24
4.6. LGBTQ Status
MORE THAN 1 IN 5 YOUTH SHELTER RESPONDENTS IDENTIFY AS LGBTQ
For the first time in 2013, respondents were asked whether they identify as part of the Lesbian,
Gay, Bisexual, Transgendered, Transsexual, Two-spirited, Queer (LGBTQ) community. As
shown in Table 11, the overall identification rate is 9%, but varies according to the surveyed
groups. The rate of identification is highest in the youth shelter system, where 21% of
respondents indicated they were LGBTQ, more than twice the rate for all respondents. And,
overall, younger respondents across all surveyed group were generally more likely to identify as
LGBTQ than older respondents.
The contrast in identification rates between the single men's (6%) and women's (14%) shelter
systems is also worth noting. This variance is partially attributable to an overall imbalance in
identification with the LGBTQ community among all male (7%) versus all female respondents
(11%).
TABLE 11 RESPONDENTS IDENTIFYING WITH THE LGBTQ COMMUNITY
Surveyed Groups Identify as LGBTQ Do not identify as
LGBTQ No Answer
Outdoors 8% 86% 6%
City-Administered Shelters 10% 89% 1%
Family 5% 94% 2%
Youth 21% 78% 1%
Mixed Adult 14% 85% 1%
Men's 6% 93% 1%
Women's 14% 83% 3%
VAW Shelters 6% 89% 5%
Health & Treatment Facilities 10% 87% 3%
Correctional Facilities 11% 87% 2%
All Respondents 9% 89% 2%
4.7. Veterans
7% OF RESPONDENTS INDICATED MILITARY SERVICE IN THE CANADIAN FORCES
Street Needs Assessment survey respondents were asked about military service for the first
time in 2013. 7% of the overall homeless population said they had some experience in the
Canadian Forces (Table 12). Data behind this result is limited (respondents were not asked
about length or type of service). There has been little to no research conducted to understand
the prevalence of homelessness among Veterans in Canada, however, studies in the United
States indicate that roughly 7% of the country's homeless population are Veterans, while in the
United Kingdom it is 6%.

Street Needs Assessment 2013
25
TABLE 12 RESPONDENTS INDICATING MILITARY SERVICE IN THE CANADIAN FORCES
Surveyed Groups Has Military
Service No Military
Service No Answer
Outdoors 11% 87% 2%
City-Administered Shelters 7% 92% 1%
Family 2% 98% 0%
Youth 4% 95% 2%
Mixed Adult 12% 88% 0%
Men's 8% 91% 1%
Women's 5% 93% 2%
VAW Shelters 1% 99% 1%
Health & Treatment Facilities 8% 91% 1%
Correctional Facilities 3% 97% 0%
All Respondents 7% 93% 1%
4.8. Residency in Toronto
When asked where they were living one year prior to the 2013 SNA, more than four out of five
respondents indicated that they had resided in Toronto (Table 13). Some surveyed groups were
more likely than others to have resided in Toronto for less than a year. 26% of youth (ages 25
and under) surveyed indicated that they had lived in Toronto for less than a year. Of those, 43%
had arrived from elsewhere in Ontario, 20% from another province and 37% from another
country altogether.
Respondents aged 51 and over were the least likely to be newcomers – only 13% indicated that
they had arrived from elsewhere (87% had lived in Toronto for more than a year). Almost a third
of family shelter occupants have arrived from another country.
TABLE 13 LOCATION OF RESIDENCE FOR RESPONDENTS, ONE YEAR PRIOR TO THE SURVEY
Surveyed Groups City of
Toronto Elsewhere in Ontario
Another Province
Out of Country
Elsewhere - Not
Specified
No Answer
Outdoors 90% 1% 7% 2% 0% 0%
City-Administered Shelters 79% 9% 3% 7% 1% 0%
Family 60% 3% 5% 30% 2% 0%
Youth 78% 13% 4% 4% 1% 0%
Mixed Adult 84% 3% 2% 8% 2% 0%
Men's 83% 11% 3% 3% 0% 0%
Women's 82% 12% 4% 2% 1% 0%
VAW Shelters 82% 8% 3% 7% 0% 0%
Health & Treatment Facilities 84% 12% 3% 1% 1% 1%
Correctional Facilities 93% 4% 1% 0% 2% 0%
All Respondents 81% 9% 3% 6% 1% 0%

Street Needs Assessment 2013
26
4.9. Income & Employment
Table 14 shows the various sources of income identified by respondents in the 2013 SNA. Once
again, the most commonly cited sources of income for respondents were social assistance
programs, 37% of respondents reported receiving Ontario Works (OW) and 29% Ontario
Disability Support Program (ODSP). It is worth noting that of those not currently receiving
ODSP, 35% believed they were eligible to receive the benefit (almost exactly the same as in
2009). Of those who believed they were eligible for ODSP, 21% reported that they were in the
process of applying, while 28% had applied in the past. 11% of respondents stated that they
have no source of income whatsoever.
TABLE 14 SOURCES OF INCOME REPORTED BY RESPONDENTS5
Source of Income Share
Respondents with Employment Income 20%
Full-Time Employment 5%
Part-Time/Casual/Seasonal Employment 12%
Informal Employment 6%
Respondents receiving Government Transfers 71%
Ontario Disability Support Program (ODSP) 29%
Ontario Works (OW) 37%
OAS/GIS/CPP 10%
Employment Insurance (EI) 2%
Canada Child Tax Benefit (CCTB) 2%
Other
Support from Friends or Family 9%
Pension or Investment Income 3%
Panhandling 6%
Ontario Student Assistance Program (OSAP) 1%
Other 11%
No Income 11%
No Answer 2%
The primary sources of income reported by respondents vary considerably across different
groups surveyed (Table 15). For example, while the primary source of income for respondents
in the women's shelter system is ODSP, only a small portion (10%) of VAW respondents
reported receiving it. Panhandling is a relatively common income source among the outdoor
homeless population; however, it does not rank in the top-5 among any other group. And more
than any other group, youth shelter respondents are likely to be engaged in some form of full-
time (11%) or part-time employment (24%) but are still unable to secure housing.
5 Respondents had the opportunity to indicate multiple sources of income to question 13d) of the
questionnaire. The share values indicated above for each income source are calculated as a percentage of total respondents to the income question and, as such, the sum total of these values do not have to equal 100%.

Street Needs Assessment 2013
27
TABLE 15 TOP-5 SOURCES OF INCOME, BY SURVEYED GROUPS
Outdoor Rank Family Shelters Rank Youth Shelters Rank Panhandling 1 (41%) OW 1 (62%) OW 1 (45%) ODSP 2 (35%) CCTB 2 (20%) Part-Time Employment 2 (24%) OW 3 (27%) Other 3 (11%) Friends/Family 3 (16%) Other 4 (18%) Part-Time Employment 4 (9%) Full-Time Employment 4 (11%) Informal Employment 5 (8%) Friends/Family 5 (8%) Other 5 (9%) No Income 11% No Income 11% No Income 16%
Mixed Adult Shelters Rank Men's Shelters Rank Women's Shelters Rank
ODSP 1 (45%) OW 1 (33%) ODSP 1 (35%) OW 2 (30%) ODSP 2 (31%) OW 2 (27%) Other 3 (14%) OAS/GIS/CPP 3 (17%) OAS/GIS/CPP 3 (12%) Friends/Family 4 (12%) Part-Time Employment 4 (13%) Other 4 (11%) Informal Employment 5 (10%) Informal Employment 5 (8%) Part-Time Employment 5 (8%) No Income 8% No Income 10% No Income 13%
VAW Shelters Rank Health & Treatment Rank Corrections Rank
OW 1 (51%) ODSP 1 (55%) OW 1 (42%) Part-Time Employment 2 (11%) OW 2 (19%) ODSP 2 (34%) ODSP 3 (10%) OAS/GIS/CPP 3 (18%) Other 3 (32%) Other 4 (6%) Other 4 (13%) Friends/Family 4 (17%) Friends/Family 5 (6%) Friends/Family 5 (12%) Part-Time Employment 5 (16%) No Income 14% No Income 3% No Income 9%
FEWER RESPONDENTS HAVE EMPLOYMENT-RELATED INCOME THAN IN 2009
In 2013, one-fifth of respondents indicated an employment-related source of income: 5% of
those surveyed reported having full-time employment, 12% had part-time employment and 6%
reported informal employment (In some cases, respondents indicated multiple employment-
related sources of income).
As shown in Figure 7, the share of all respondents indicating employment-related income
declined by 9% from 2009 – attributable to a 4% decrease in full-time, a 5% decrease in part-
time and a 6% decrease in informal employment.
Among the individually surveyed groups, the decrease in total employment was most extreme
among the outdoor homeless population (from 25% in 2009 to 15% in 2013), and those
surveyed in both the men's (from 37% to 23%) and the mixed adult shelter systems (from 35%
to 19%). In almost all cases, there was a simultaneous increase in the share of respondents
who indicated they were now receiving either OW or ODSP. Employment among youth shelter
respondents appeared to be more resilient, as there was not as dramatic a decline in the share
of respondents receiving employment income between 2009 (37%) and 2013 (35%)
PANHANDLING HAS CONSISTENTLY DECREASED SINCE 2006
The share of respondents who reported panhandling was 6%, which was down from 10% in
2009 and 17% in 2006.
As in previous years, panhandling income was reported more frequently by those living
outdoors (41%), although the rate of panhandling among the outdoor population decreased by
almost 10% from 2009. (See Figure 7 above for a breakdown of primary sources of income, by
surveyed group.)

Street Needs Assessment 2013
28
FIGURE 7 TRENDS IN SELECTED SOURCES OF INCOME INDICATED BY RESPONDENTS
4.10. Interactions with Police & the Correctional System
As in previous years, the 2013 SNA included a question regarding respondents' interaction with
police and the correctional system during the six months preceding the survey. (It should be
noted that the question simply asked whether the respondent had "contact," not the nature of
those interactions.) The results for interactions with police, jail and probation, with comparisons
to prior years, are presented in Table 16. In each case, interactions have increased since 2009,
albeit modestly. (Respondents from correctional facilities are not asked this question.)
There is a range of reasons why respondents will have contact with police services and/or the
correctional system – for example, the high incidence of interaction among respondents in
Violence Against Women shelters versus the outdoor homeless population is likely due to
disparate causes. In some cases, these interactions are related to a cause of homelessness
(e.g., domestic violence), while in other instances they are an effect of homelessness (e.g.,
disobedience of laws and bylaws pertaining to loitering). As a result, caution should be used
when interpreting trends in these results. That being said, no matter what the reason behind
them, these interactions are costly and, in many cases, signal hardship for respondent involved.
TABLE 16 INTERACTIONS BETWEEN RESPONDENTS AND POLICE AND THE CORRECTIONAL SYSTEM
Surveyed Groups Police Jail Probation
2006 2009 2013 2006 2009 2013 2006 2009 2013
Outdoor 51% 58% 61% 22% 22% 22% 19% 16% 12%
City-Administered Shelters 37% 33% 35% 17% 13% 14% 16% 14% 15%
VAW Shelters N/A 50% 48% N/A 4% 3% N/A 4% 4%
Health & Treatment Facilities 30% 33% 45% 20% 21% 24% 14% 18% 24%
All Respondents 37% 32% 38% 18% 12% 14% 16% 13% 14%

Street Needs Assessment 2013
29
5. PEOPLE EXPERIENCING HOMELESSNESS WANT HOUSING
The Street Needs Assessment once again demonstrates that, overwhelmingly, homeless
people want a place to call home. More than 9 out of every 10 people surveyed said they
wanted to get into permanent housing (Table 17).
TABLE 17 RESPONDENTS WHO WANT PERMANENT HOUSING
Surveyed Groups 2006 2009 2013
Outdoors 86% 82% 88%
City-Administered Shelters 87% 89% 93%
Family 97% 97% 97%
Youth 86% 91% 92%
Mixed Adult 88% 96% 95%
Men's 84% 87% 92%
Women's 91% 86% 94%
VAW Shelters N/A 93% 96%
Health & Treatment Facilities 90% 86% 91%
Correctional Facilities 96% 92% 99%
All Respondents 86% 89% 93%
REASONS FOR NOT WANTING HOUSING ARE TEMPORARY OR RESOLVABLE
In those instances where respondents indicated that they did not want housing, there were a
range of reasons provided (Table 18). About 20% said they did not intend to stay in Toronto
long enough to make finding permanent housing worthwhile. Some responses (23%) indicate
either a preference for a current living situation (in most cases, a shelter), or homelessness in
general. However most reasons provided by those saying they did not want housing, referred to
specific, temporary and/or resolvable challenges – i.e., negative perceptions of social housing or
the shelter system, a barrier such as lack of ID or legal issues, health challenges or a perception
of not being "ready for housing."
TABLE 18 REASONS PROVIDED BY RESPONDENTS WHO DO NOT WANT PERMANENT HOUSING
Reasons Count Share
Transient - Intends to leave Toronto 17 21%
Prefers current living situation 16 20%
Other/Unclear 11 14%
Negative perception of housing options 9 11%
Faces a specific barrier to housing (e.g., domestic issues, legal issues, age, ID)
7 9%
Health issues 7 9%
Not ready for housing 5 6%
Prefers a group environment 3 4%
Does not want government assistance 2 3%
Prefers being homeless 2 3%
The waiting list for housing is too long 1 1%

Street Needs Assessment 2013
30
6. SERVICE NEEDS OF TORONTO'S HOMELESS POPULATION
One of the most valuable aspects of conducting a regular Street Needs Assessment is that it
gives us the ability to describe and analyze the nature of service needs within the homeless
population (both met and unmet), and how those service needs are changing over time. The
following section provides a summary of service-related responses from the 2013 SNA,
including service needs indicated by respondents, services used by respondents during the 6
months preceding the survey and trends in both, over time and by surveyed groups identified in
earlier sections.
6.1. Overview of Service Needs
For the 2013 SNA, respondents were asked to indicate what services they felt would help them
to find housing, and then specify which of these they felt to be most important. The results,
ranked by the number of responses indicating them as "most important" are shown in Table 19.
TABLE 19 SERVICE NEEDS OF RESPONDENTS TO GET HOUSING
Services (ranked by most important responses) Share who indicated the service was most
important
Share who indicated the service would
help
More money from Ontario Works (OW) or the Ontario Disability Support Program (ODSP)
29% 71%
Subsidized housing or a housing allowance 20% 80%
Help finding an affordable place 15% 80%
Help finding employment or job training 10% 54%
Something else 4% 10%
Help to keep housing once you have it (e.g. housing supports/housing worker)
3% 65%
Help with housing applications 3% 58%
Transportation to see apartments 2% 67%
Mental health supports 2% 32%
Help with immigration issues 2% 14%
Help getting ID (e.g., a health card or birth certificate) 2% 40%
Help addressing your health needs 1% 43%
Services in a language other than English 1% 16%
Help getting alcohol or drug treatment 1% 21%
Help getting detox services 0.3% 16%
Cultural supports 0.2% 23%
Harm reduction supports (e.g. methadone, safer crack kit, needle exchange)
0.2% 18%
These results indicate that, above all else, most respondents (74%) indicated a need for
services that help to address housing affordability challenges, directly or indirectly. Direct
supports for housing affordability include more money from OW/ODSP, through increased
shelter rates (29%); subsidized housing (i.e. rent-geared-to-income) or a housing allowance
(20%), and help finding an affordable place (15%). Indirect supports to address affordability
challenges are job-related services provided to clients aimed at increasing their income earning
potential among other benefits, i.e., help finding employment or job training (10%).

Street Needs Assessment 2013
31
Respondents also place significant importance on other services that help households with the
specific challenges related to finding and maintaining housing – help to keep housing, help with
housing applications, and transportation to view apartments – with at least 60% of respondents
indicating that these would help.
Other services (such as health and treatment and non-housing specific services) were often
indicated as helpful, if not the most important service need for respondents in getting housing. In
some cases these services were cited more frequently by specific subgroups within Toronto's
homeless population, such as those with short-term versus long-term experiences of
homelessness, location in which they were surveyed (e.g., shelters versus outdoors) and
others. Further details are provided below.
6.2. Overview of Services Used
As a part of the 2103 SNA, respondents were also provided a list of services and asked whether
they had used any of these services during the 6 months preceding the survey. (In the case of
ambulance, respondents were simply asked if they had "contact" with the service.)
TABLE 20 SERVICES USED BY RESPONDENTS DURING THE 6 MONTHS PRECEDING THE 2013 SNA
Services Share
Housing and Homelessness Services 63%
Drop-ins 44%
Assessment and Referral Centre (129 Peter Street) 26%
Out of the Cold meals 25%
Housing Help Centre 24%
Street Outreach/Streets to Homes 20%
Out of the Cold beds 18%
Health and Treatment Services 69%
Hospital/ Emergency Room 46%
Health Clinics 43%
Ambulance 26%
Harm reduction supports 15%
Detox 13%
Non-Housing Specific Services 66%
Services that help you get ID 38%
Food bank or community kitchen 33%
Job training/Job supports 23%
Legal Clinics 20%
Other 7%
Used none of the above 7%
Refused/No Answer 2%
Table 20 describes the share of respondents indicating use of each service, grouped into 3
categories: direct housing and homelessness-related services (i.e., "services that help the
homeless to get off the street"), services that help with health and treatment and other services
that, although very important within the continuum of support for homeless and at-risk clients,
Street Needs Assessment 2013
32
ostensibly help with a wide-variety of service needs (i.e., non-housing specific services).
Percentages for these service categories are assigned where the respondent indicated use of at
least one of the related services.
The results shown in Table 20 are not directly comparable to the service needs results shown in
Table 19 as 1) respondents were not asked to indicate services used solely for the purposes of
"getting housing" and 2) some of the service needs indicated in Table 20 are related to services
which are not immediately accessible to all individuals, such as subsidized housing. (The
waiting list for subsidized housing is discussed separately in Section 21.)
Notwithstanding these notes of caution, a few points can be made about the patterns in both
tables. First, although indicated as the most important service needs for getting housing, in
many cases, use of services that help the homeless to get off the street (and, ideally, transition
to housing) has declined somewhat since 2009. And second, the most frequently used services
by homeless respondents in the 2013 SNA were those that help with health and treatment,
although many respondents did not necessarily recognize such services as critically important in
getting housing.
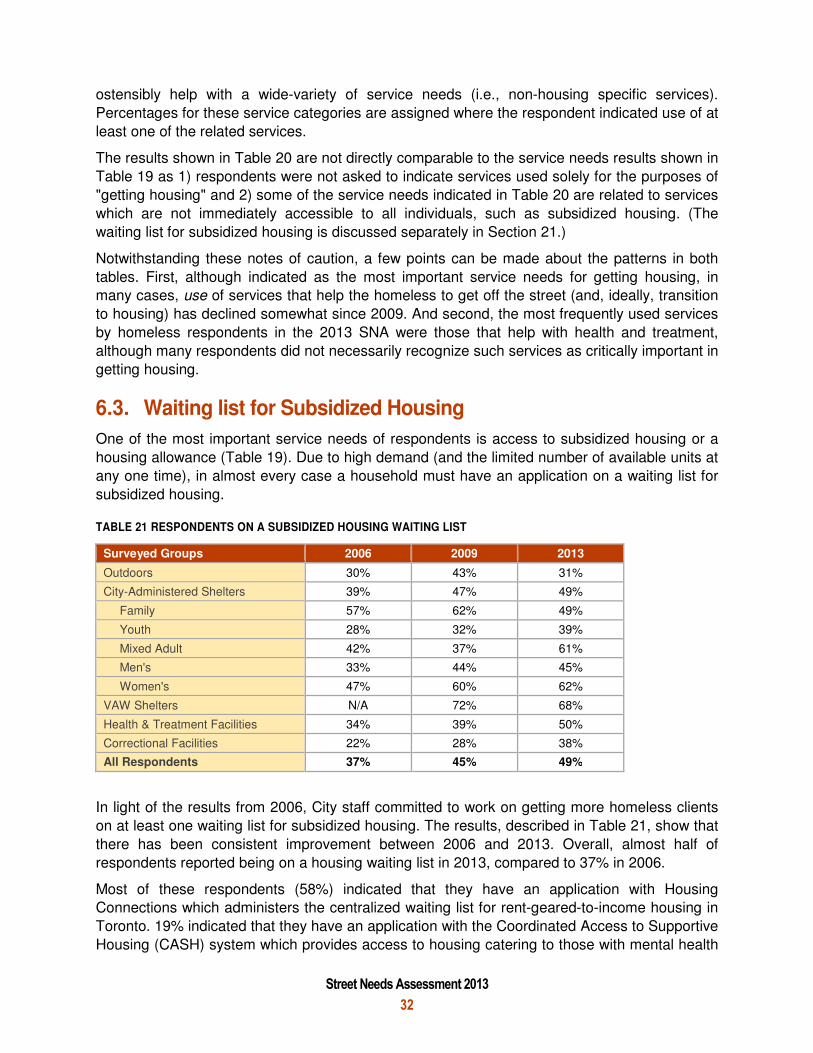
6.3. Waiting list for Subsidized Housing
One of the most important service needs of respondents is access to subsidized housing or a
housing allowance (Table 19). Due to high demand (and the limited number of available units at
any one time), in almost every case a household must have an application on a waiting list for
subsidized housing.
TABLE 21 RESPONDENTS ON A SUBSIDIZED HOUSING WAITING LIST
Surveyed Groups 2006 2009 2013
Outdoors 30% 43% 31%
City-Administered Shelters 39% 47% 49%
Family 57% 62% 49%
Youth 28% 32% 39%
Mixed Adult 42% 37% 61%
Men's 33% 44% 45%
Women's 47% 60% 62%
VAW Shelters N/A 72% 68%
Health & Treatment Facilities 34% 39% 50%
Correctional Facilities 22% 28% 38%
All Respondents 37% 45% 49%
In light of the results from 2006, City staff committed to work on getting more homeless clients
on at least one waiting list for subsidized housing. The results, described in Table 21, show that
there has been consistent improvement between 2006 and 2013. Overall, almost half of
respondents reported being on a housing waiting list in 2013, compared to 37% in 2006.
Most of these respondents (58%) indicated that they have an application with Housing
Connections which administers the centralized waiting list for rent-geared-to-income housing in
Toronto. 19% indicated that they have an application with the Coordinated Access to Supportive
Housing (CASH) system which provides access to housing catering to those with mental health

Street Needs Assessment 2013
33
and related support needs. 5% indicated having an application on a waiting list, outside Toronto
and 14% indicated another waiting list altogether (such as with an individual housing provider).
6.4. Housing & Homelessness Services
NEED FOR HOUSING & HOMELESSNESS SERVICES REMAINS HIGH
As noted above, respondents have consistently indicated a desire for services that directly
support them in getting off the street and into housing. Figure 8 displays the trends in service
need responses for these services.
Although there was a slight decrease in the share of respondents indicating "help finding an
affordable place" and "more money from OW/ODSP" between 2009 and 2013 that is likely
attributable to a slight change in wording of the latter question from just "more money" and the
fact that an additional category was added: "subsidized housing or a housing allowance." In
each case, at least 7 out of 10 respondents indicated these services would help.
Those who had been homeless for longer than 2 years were somewhat less likely to indicate
that affordability services would help them to find permanent housing. (As indicated in the next
section, these respondents were more likely to indicate health and treatment services.)
FIGURE 8 TRENDS IN NEED FOR HOUSING & HOMELESSNESS SERVICES
Those sleeping outdoors were less likely to indicate a need for more money (-8% compared to
the average for all respondents), employment or job training (-13%), housing subsidy (-23%),
help finding an affordable place (-20%). Of course this is not to suggest that these services are
not required by outdoor recipients –they almost certainly are. And, as indicated earlier, the

Street Needs Assessment 2013
34
outdoor population indicates a desire for housing by a large margin (although at rate slightly less
than overall homeless population). Rather it points to a complex set of issues related to
motivation and trust when providing housing supports to those living outdoors.
Responses provided by youth shelter system users were largely consistent with those provided
by all respondents, although by a considerable margin they were the most likely group to
indicate employment or job training (+26% compared to all respondents). They were also more
likely than other respondents to indicate "transportation to see apartments" (+11%).
USE OF MOBILE STREET OUTREACH HAS DECLINED BUT OVERALL CONTACT WITH OUTREACH SERVICES (INCLUDING 129 PETER ST) HAS RISEN
Although the stated need for services that help the homeless to get off the street and into
housing remains high, reported use of related services, which are available to all homeless
individuals that meet basic eligibility criteria, remains modest. For example, consistently, only a
quarter of all respondents indicated accessing housing help services. Housing help services can
be accessed in most shelters and across the City. Housing help staff work with clients by
providing information on available affordable housing, liaising with landlords, advising on
housing issues and income support programs and helping people complete applications for
social housing.
FIGURE 9 TRENDS IN USE OF HOUSING & HOMELESSNESS SERVICES
As shown in Figure 9, there has been an apparent decrease in the use of street outreach
services since 2009. That is partially offset by the establishment of the Assessment and Referral
Centre at 129 Peter Street in 2010, which provides a unique mix of housing assistance, referral
to shelters, street respite and transition to housing beds to street involved clients. Collectively,

Street Needs Assessment 2013
35
35% of all respondents (60% of outdoor respondents) have had contact with street outreach
services and/or the Assessment and Referral Centre during the past 6 months. This represents
an increase over use of all outreach and referral-related services that were included in the 2009
SNA.
The outdoor homeless population was most likely to indicate use of any services that help the
homeless to get off the street (including those that help with temporary shelter or respite needs);
with 79% indicating they had done so during the past 6 months compared to 63% of the total
homeless population. Long-term homeless respondents were more likely to indicate use of
housing services than those with short-term experiences of homelessness (+17%). In particular
they were twice as likely to have had contact with street outreach services provided by Streets
to Homes (30% compared to 15%) and 23% more likely to have used a drop-in service.
6.5. Health & Treatment Services
NEED FOR HEALTH & TREATMENT SERVICES HAS INCREASED SINCE 2009
In the 2013 SNA, respondents were less likely to indicate that health and treatment services
were the key to finding housing than the housing/homeless services described in the previous
section. Cumulatively, about 4.5% of respondents indicated this category of services was most
important to finding housing.
However, a significant portion of respondents indicated that health and treatment services would
help them in establishing stable housing. 43% indicated help addressing health needs was
important. And, as shown in Figure 10, in every case the expressed need for health and
treatment services has increased since 2009 – especially the need for mental health services,
from 24% to 32%. There was also a greater likelihood of long-term homeless respondents
indicating this service category was most important to them in finding housing – 6% compared
to 3%.
Respondents experiencing long-term homelessness (at least 2 years) were more likely than
those with less than 2 years to indicate specific health and treatment services as important in
getting housing (i.e., +6% for harm reduction support, +5% for mental health services, +4% for
alcohol/drug treatment). There was also a greater likelihood of long-term homeless respondents
indicating this service category was most important to them in finding housing – 6% compared
to 3%.
Respondents in VAW shelters were the most likely to identify the importance of health and
treatment services. 80% of VAW shelter respondents indicated "help addressing your health
needs" as being important, compared to 43% of all respondents. VAW shelter respondents were
also more likely to indicate detox services (+20%), alcohol/drug treatment (+16%), mental health
supports (+8%) and harm reduction supports (+18%).

Street Needs Assessment 2013
36
FIGURE 10 TRENDS IN NEED FOR HEALTH AND TREATMENT SERVICES
USE OF HEALTH & TREATMENT SERVICES AMONG THE HOMELESS REMAINS HIGH
Consistent with 2009 findings, the 2013 SNA shows that homeless people are frequent users of
health and treatment services, including costly and intensive emergency health services such as
hospitals and ambulatory care. A comparison of the costs of housing and emergency services
used by homeless people, conducted in 2009, demonstrates that the use of these emergency
services is substantially more expensive than housing-based responses to homelessness.
69% of all respondents in the 2013 SNA indicated they had accessed health and treatment
services during the 6 months prior to the survey. This makes health and treatment services the
most used of any service category. These respondents frequently made use of emergency
health services, with 46% indicating that they had visited a hospital/emergency room and more
than 1 in 4 indicated they had contact with an ambulance. In part, this result points to the
negative health effects of homelessness – effects which are diminished, if not resolved, once
housing is achieved.
Consistent with the expressed need for health and treatment services, long-term homeless
individuals were more likely to have used health services than those with short-term
experiences of homelessness (+9%).
There have been modest reductions in visits to health clinics and hospital emergency rooms
since 2009, however use of these services remains relatively high – almost half of the homeless
population has visited a hospital during the past 6 months. (Those experiencing long-term
homelessness were 7% more likely to have visited an emergency room.) The percentage of
respondents who had an interaction with an ambulance at least once in the past six months
increased significantly, from 17% in 2009 to 26% in 2013.

Street Needs Assessment 2013
37
FIGURE 11 TRENDS IN USE OF HEALTH AND TREATMENT SERVICES
6.6. Services that Help With Non-Housing Specific Needs
OTHER BASIC SERVICES, SUCH AS HELP GETTING ID, CAN MAKE THE DIFFERENCE
Homelessness is a complex issue, with many contributing factors. As such, it is critical that
those experiencing or at-risk of homelessness have access to a wide range of supports that can
directly or indirectly improve their circumstances and ultimately lead to better housing outcomes.
These services include employability services, food banks/community kitchens, services that
help with securing ID (a requirement to qualify for many housing programs), support with
immigration issues, legal services, translation/language services, and cultural supports. Figure
12 illustrates the trends in expressed need for a number of these services.
The City provides a variety of employment services targeted directly to people living in a shelter
or at-risk of homelessness. These services often include skills assessments, focused plans of
action, referral to appropriate support services within the local community, as well as ongoing
pre- and post-employment support. In 2013, over half of respondents (54%) indicated that help
finding employment or job training was important. Although respondents in 2006 and 2009 were
not asked about their need for employability services, the declining trend in respondents with
employment-related income between 2009 and 2013 (and greater reliance on income support
programs) indicates that this area of support has almost certainly increased in importance over
the past 4 years.
Help getting ID remains a critical service for respondents. For example, although the
documentation requirements to get on the subsidized housing waiting list maintained by

Street Needs Assessment 2013
38
Housing Connections are modest, all applicants must show ID. As with everyone else, those
experiencing homelessness need to go through a government office if they need to get or
replace identification such as a passport, driver's license or health card. However, there are a
number of services available to vulnerable residents of Toronto that can help with identifying ID
need, going through the application process for new/replacement ID, as well as providing a safe
place to store ID information if needed. 40% of respondents for the 2013 SNA indicated that this
would help them to secure housing.
Cultural supports and services in languages other than English are important, particularly in the
family shelter system, where in each case more than a third of respondents indicated that this
would help to find housing. This is not is not a surprising result considering the disproportionate
number of family shelter occupants that have recently arrived in Toronto from another country.
Also notable is the fact that Aboriginal-identified respondents were twice as likely as non-
Aboriginal respondents to indicate the importance of cultural supports (40% to 20%).
FIGURE 12 TRENDS IN NEED FOR NON-HOUSING SPECIFIC SERVICES
OPPORTUNITY EXISTS TO INCREASE USE OF EMPLOYABILITY SERVICES & JOB TRAINING
Respondents indicated use of a range of different non-housing services during the 6 months
preceding survey (shown in Figure 13), including a third who accessed food bank or community
kitchen, and one-fifth using legal clinics. There has been an observed decline in the use of food
banks between 2006 and 2013. Use of legal clinics, which provide a range of legal services to
homeless clients, remained relatively constant during the same time period.

Street Needs Assessment 2013
39
Use of services that help with securing ID during the past 6 months (38%) was relatively
consistent with expressed need for these services (40%) in 2013, although in both cases rates
were lower than observed in 2009.
For the first time, respondents to the 2013 SNA survey were asked to what extent help finding
employment or job training would assist them to get housing. More than half of homeless
respondents (54%) indicated that this was important and, among those, 10% indicated this was
the most important support that could be provided, over other forms of direct and indirect
housing support.
Despite high levels of expressed need for employability supports, the rate of use of job training
and job support services has actually decreased since 2009. As a result, less than a quarter of
all respondents indicated that they had accessed employability services during the 6 months
preceding the survey. This is particularly troubling considering the simultaneous decline in
respondents who were receiving employment related income, indicated earlier in the report.
FIGURE 13 TRENDS IN USE OF NON-HOUSING SPECIFIC SERVICES

Street Needs Assessment 2013
40
7. CONCLUSIONS
The 2013 Street Needs Assessment produced a uniquely detailed profile of homelessness in
Toronto. This data both strengthens findings from the two previous SNAs and indicates
important trends in who is experiencing homelessness and the nature of their service needs.
As in previous years, the implementation of the Street Needs Assessment was the result of the
collaborative efforts of City staff, community agencies, provincial ministries, and volunteers. The
City thanks those who contributed to this effort to better understand the needs of homeless
people.
The methodology used in the Street Needs Assessment is recognized as the standard for
statistically valid surveying of outdoor homeless populations. The methodology used for
Toronto’s 2013 Street Needs Assessment was consistent with the method used in previous
years and thus the results are comparable.
In 2009, the results of the Street Needs Assessment indicated significant progress in reducing
street homelessness, as the outdoor population was reduced by half. As evident in the most
recent SNA results, the momentum towards ending street homelessness slowed between 2009
and 2013.
There are a number of reasons for this, including the complex service needs of individuals with
long-term street involvement – the outdoor homeless population has experienced an average of
8 years of homelessness, more than double the duration of any other homeless group surveyed.
It is also a matter of the high number of homeless individuals that move between indoor and
outdoor sites depending on a range of circumstances. In response to the 2013 SNA, we need to
look at how our service model is oriented towards those with complex needs to ensure that they
have access to housing and as well as the supports they may require to maintain housing over
the long-term.
The 2013 Street Needs Assessment also revealed important findings about who is experiencing
homelessness in Toronto. Perhaps the most compelling trend was the doubling of the number of
seniors as a share of the homeless population in just 4 years. Although those aged 61 and older
still represent a smaller proportion of the total homeless population (roughly 10%), when
combined with trends in other age groups, there is clear evidence of that one of Toronto's
already most vulnerable populations is aging.
The 2013 Street Needs Assessment provided first-time information about specific groups
experiencing homeless: members of the LGBTQ community, who represent 9% of the homeless
population but 21% of youth shelter users and Veterans, who constitute 7% of the homeless
population.
And once again, the Street Needs Assessment indicated persistently high representation of
Aboriginal-identified individuals among the homeless population (especially those sleeping
outdoors).
In all cases, when it comes to designing and delivering services to homeless residents of
Toronto, we have to be sensitive and responsive to the experiences and needs of this highly
diverse population. And as the nature of homelessness changes, we need to constantly
reassess the value and effectiveness of our service model to ensure that, to the greatest extent
possible, service needs are being met and everyone has the opportunity to access housing.

APPENDIX A
Sample of 2013 Street Needs Assessment Survey, conducted with outdoor population