
The Streamlined Sales Tax Scott Peterson Streamlined Sales Tax Governing Board.
Upload
truongkhanhCategory
view
224download
3
Streamlined PCM Technical Report Version 2.1 ___________________________________________________
Report for Department for Environment, Food & Rural Affairs (project AQ0959)
ED 60017002 | Issue Number 1 | Date 24/11/2015

Ricardo Energy & Environment Streamlined PCM Technical Report | i
Ref: Ricardo/ED60017002/Issue Number 1
Customer: Contact:
Department for Environment, Food & Rural Affairs
Michel Vedrenne Ricardo Energy & Environment 30 Eastbourne Terrace, London W2 6LF, UK
t: +44 (0) 1235 75 3062
Ricardo-AEA Ltd is certificated to ISO9001 and ISO14001
Customer reference:
DEFRA
Confidentiality, copyright & reproduction:
This report is the Copyright of DEFRA and has been prepared by Ricardo-AEA Ltd under contract AQ0959 to DEFRA. The contents of this report may not be reproduced in whole or in part, nor passed to any organisation or person without the specific prior written permission of DEFRA. Ricardo-AEA Ltd accepts no liability whatsoever to any third party for any loss or damage arising from any interpretation or use of the information contained in this report, or reliance on any views expressed therein. Disclaimer The views in this report are the authors’ own and do not necessarily reflect those of the Department for Environment, Food and Rural Affairs (Defra).
Author:
Michel Vedrenne, Sally Cooke, John R. Stedman, Andrew J. Kent
Approved By:
Beth Conlan
Date:
24 November 2015
Ricardo Energy & Environment reference:
Ref: ED60017002- Issue Number 1

Ricardo Energy & Environment Streamlined PCM Technical Report | ii
Ref: Ricardo/ED60017002/Issue Number 1
Table of contents
1 Introduction ................................................................................................................. 1 1.1 Background and Model Purpose ........................................................................................ 1 1.2 Design principles of the Model ................................................................................................. 2 1.3 Comparison with full PCM calculations .............................................................................. 4
2 Model Structure........................................................................................................... 8 2.1 Emission Factors. ............................................................................................................... 9 2.2 Composition variables ...................................................................................................... 13
2.2.1 Euro standard split in the vehicle fleet .................................................................... 13 2.2.2 Annual vehicle-kilometres ....................................................................................... 13
2.3 Activity variables ............................................................................................................... 16 2.4 Concentration variables .................................................................................................... 18 2.5 Geographic variables ....................................................................................................... 20
3 Quality assurance ..................................................................................................... 21
4 Future development opportunities .......................................................................... 22
5 Final remarks ............................................................................................................ 22
6 References ................................................................................................................ 23
Appendices
Appendix 1 Clean Air Zone (CAZ) type scenarios
Appendix 2 UK air quality management zones

Ricardo Energy & Environment Streamlined PCM Technical Report | 1
Ref: Ricardo/ED60017002/Issue Number 1
1 Introduction
This report outlines the purpose and design of the streamlined PCM model, including uncertainties, and opportunities for further development. The streamlined PCM tool has been developed to model the effect of changes in fleet composition on NOX emissions and NO2 concentrations.
1.1 Background and Model Purpose
The assessment of the effectiveness of emission abatement measures is essential for informing policy making and efficiently allocating efforts and resources to those that exhibit the highest mitigation potential at the lowest possible cost, in order to improve air quality and human health. The full Pollution Climate Mapping (PCM) model
1 is designed to do so; however it requires several weeks
to carry out the full emissions calculations, emissions mapping and concentration modelling required to test the effect that changes in fleet composition could have on emissions and concentrations scenarios. Therefore in order to make well-informed decisions Defra required a streamlined version of the PCM to model a range of scenarios within a shorter timeframe.
The Streamlined PCM has been built as an approximation of the full PCM model, and it is consistent with the National Atmospheric Emissions Inventory (NAEI). Due to the fact that it is an approximation of the full PCM model, it has a number of limitations and it is not intended as a substitute. Despite this, its results do provide a base which is consistent with the compliance assessment and baseline projections of the full PCM model.
The Streamlined PCM is a tool that enables the quantification of the effect of measures applied to different aspects of road traffic on the emissions of nitrogen oxides (NOx) and on the annual mean concentration of nitrogen dioxide (NO2) at numerous road receptors in the United Kingdom. It has been developed to support the assessment of abatement measures by providing evidence on how effective these measures may be in improving air quality, which impacts on human health. The Streamlined PCM tool has the capacity to model NO2 changes at the various spatial scales including the national, local authority, defined geographic area and road level after the variation in NOx emissions produced by the measure under consideration is quantified. The Streamlined PCM combines a simplified road traffic emissions model that relies on the National Atmospheric Emission Inventory (NAEI) for emissions and a parameterisation of the Pollution and Climate Mapping model, for ambient concentrations both developed and operated by Ricardo Energy & Environment.
According to the specific abatement measures; the relevant activity variables, fleet compositions and emission factors are combined to calculate emissions and variation ratios with respect of a reference scenario for 18,346 road links in 406 local authorities of the United Kingdom and NO2 annual mean concentrations for 9,336 of these links. These 9,336 roads correspond to urban major roads for which compliance with the annual limit value for NO2 from the Ambient Air Quality Directive (AAQD) is assessed. The modelling framework of the tool can accommodate the appraisal of any abatement measure that focuses on road traffic, such as speed restrictions, fleet renewal schemes, or restricted zones. These abatement measures can concentrate on passenger cars, all types of light goods vehicles (LGVs), urban buses, articulated and rigid heavy goods vehicles, mopeds and motorcycles, for diesel and petrol fuel types and for all the existing Euro standards.
The model users define the level of fleet adjustment attributable to the policy they are appraising. This is input into the streamlined PCM, providing a set of projections of NOx emissions and NO2
1 The PCM model is run and maintained by Ricardo Energy & Environment at Defra’s request. http://uk-
air.defra.gov.uk/assets/documents/reports/cat09/1312231525_AQD_DD4_2012mapsrepv0.pdf

Ricardo Energy & Environment Streamlined PCM Technical Report | 2
Ref: Ricardo/ED60017002/Issue Number 1
concentrations. This is then compared to the baseline emissions and concentrations which has been developed from the full PCM model run.
As it can be challenging to estimate this change in composition of the fleet, a second tool has been developed as an additional interface to the streamlined PCM model. This interface (the ‘Translation Tool’) is a spreadsheet which quantifies the potential effect of changes in upfront or running costs of vehicles on different aspects of road transportation which in turn affect NOx and annual mean NO2 concentration at numerous receptors in the UK. It simplifies the user input needed for vehicle costs variables and processes these inputs using response functions to estimate the change in road traffic. The response functions were developed via an expert elicitation exercise. Figure 1 below illustrates the differences between the two policy modelling options.
Figure 1. Differences between the Streamlined PCM and Translation Tool.
The Streamlined PCM considers several vehicle types (passenger cars, LGVs, urban buses, coaches, articulated, rigid HGVs, motorcycles and mopeds). In order to assess the additional detail of the response functions that were developed with respect to unconventional propulsion technologies, the Translation Tool can additionally take into account petrol hybrid, diesel hybrid, plug-in hybrid electric and battery electric cars, which are not considered in the Streamlined PCM. Both the Streamlined PCM and the Translation Tool estimate emissions for a baseline scenario and a policy scenario for 18,346 road links (major roads) in 406 local authorities in the UK and NO2 annual mean concentrations for 9,336 of those links. The translation tool is appropriate for analysing the effect of applying a number of changes in upfront or running costs of vehicles.
An overview of the technical aspects of the Streamlined PCM and the Translation Tool is given in the following sections.
1.2 Design principles of the Model
The model arose from Defra’s request to assess the potential effect of possible road transport policy measures that could improve the general air quality in zones throughout the United Kingdom and enable compliance with the limit values included in European legislation. For the purposes of this project, the term “measure” is being used to indicate any type of action that is intended to reduce emissions of nitrogen oxides (NOx) caused by road-traffic.
The Streamlined PCM tools allow the effect of NO2 abatement measures to be assessed by comparing a scenario against a baseline. The baseline will always correspond to any fully-characterised reference situation of emissions and measures. Any additional measure or set of measures beyond those already included in the baseline will correspond to a scenario.
Ricardo Energy & Environment Streamlined PCM Technical Report | 3
Ref: Ricardo/ED60017002/Issue Number 1
Defining each of the measures that constitutes a scenario in the Streamlined PCM is carried out through the concept of an adjustment factor (fi), which is a coefficient that describes the degree of difference of the scenario with respect to the baseline. These adjustment factors need to be applied to each variable (Vi) that is likely to change as a result of the application of the measure. For example, if a given measure focuses on restricting traffic flows on a specific road, the adjustment factor should be applied to vehicle flows. Similarly, if a measure seeks to reduce the average circulation speed in a group of roads, the adjustment factor needs to be applied to speeds. The generic definition of an adjustment factor within this framework is shown in Equation 1.
𝑓𝑖 = 𝑉𝑆𝑐𝑒𝑛𝑎𝑟𝑖𝑜 − 𝑉𝐵𝑎𝑠𝑒𝑙𝑖𝑛𝑒
𝑉𝐵𝑎𝑠𝑒𝑙𝑖𝑛𝑒
The formulation of the adjustment factors within the framework of the Streamlined PCM is such that measures that seek to reduce the impact of the relevant variables are negative, while those that aim to increase them are positive. Translating a measure in terms of a set of adjustment factors is a task that requires careful identification of the variables that are likely to be affected and quantification of the degree to which these change. An incorrect mapping of the variables affected by the measure will result in inaccurate results.
As mentioned before, while some measures are simple to model, there are other measures that involve a certain behavioural response that cannot be captured by the Streamlined PCM spreadsheet (e.g. the change in fleet compositions after a change in costs e.g. fuel costs or parking charges). In this respect, a behavioural response is the observed change in a behaviour pattern of a given population due to the application of a measure and it is correlated with other factors such as economic standards, subjective perceptions, or level of education of its individuals. In order to fill this gap, the Translation Tool was developed as an adapted version of the Streamlined PCM spreadsheet that has an additional module that takes account of this behavioural response through a set of response functions. To inform these response functions, Ricardo Energy & Environment carried out a literature review and liaised with national experts and academics. The response functions that were developed quantify for a given upfront or running cost change, how road traffic may be impacted in 2020 in terms of vehicle flows (km driven), the mix of each vehicle category (fleet composition) and the shifts between modes (e.g. from private to public transport). All these effects were translated into mathematical functions which depend on an economic variable (e.g. upfront costs) through the application of polynomial regressions to the data extracted from the evidence review and expert recommendations. This whole exercise enabled the development of response functions for 20 different types of measures affecting different vehicle types which could be applied across large areas (e.g. UK) or within restricted zones. Further details of how these response functions were developed, the underlying assumptions and the affected variables will be outlined in the forthcoming final project report.
Both the Streamlined PCM and the Translation Tool share the same structure and incorporate the same type of data. The difference between the Streamlined PCM spreadsheet and the Translation Tool lies in the fact that the latter considers 20 measures whose effect is underpinned by the mathematical equations of the response functions and their associated assumptions and limitations. In general, all of these functions are incorporated into the Translation Tool as an additional step that takes place at the beginning of the calculation stream. Once the user has defined the change in any of the economic variables specified by each of the 20 developed measures, this variation will allow estimating changes in the Streamlined PCM variables (e.g. composition, traffic flows) which in turn are used to quantify changes in NOx emissions. Alternative vehicle technologies such as hybrids, plug-in hybrids and electric vehicles are treated in the same way as Euro emission standards by the model, which are defined by a composition value from the NAEI.
(1)
Ricardo Energy & Environment Streamlined PCM Technical Report | 4
Ref: Ricardo/ED60017002/Issue Number 1
The Streamlined PCM and the Translation Tool were developed as standalone, self-contained spreadsheets running in Microsoft Excel ®. Building the Streamlined PCM and the Translation tools as spreadsheets allowed presenting information from different sources in a separate and tabular manner, facilitating the identification of the different variables that are used in the calculation of NOx emissions in a user-friendly interface. Additionally, Microsoft Excel ® is a common desktop software with a widespread acceptance for numeric applications. Schematic flowcharts depicting the functioning of the Streamlined PCM and the Translation Tools are shown in Figures 2 and 3.
1.3 Comparison with full PCM calculations
The Streamlined PCM was built to approximate the results of the full PCM model (including NAEI emissions calculations and emissions mapping and PCM concentration calculations) and to run scenarios considerably more quickly in order to meet the immediate needs of Defra for policy support. The Streamlined PCM provides these substantially faster run times because it relies on information previously prepared for and by the full PCM model and does not require dispersion modelling for each scenario. As this tool is an approximation of the full PCM model, it is important to understand the simplifications involved and the impact that these simplifications may have on the results.
Within a full PCM calculation the impact of a measure on local major road emissions, gridded major road emissions, gridded minor road emissions and cold start emissions are all calculated and mapped separately for each scenario. Being a simplified version of the full PCM, the Streamlined PCM can only consider changes in emissions for local major road-traffic sources. Within the Streamlined PCM the changes in gridded major road, minor road and cold start emissions are all assumed to scale in exactly the same way as the emissions on the local major road.
The full PCM model can estimate the impact of changes in emissions from a range of sources, such as large and small point sources (e.g. power stations, airports), and area sources (such as domestic combustion, in addition to transport. It quantifies compliance for other pollutants such as PM10 and PM2.5, as well as NO2. The Streamlined PCM focuses purely on transport emissions, estimating the impact of changes in exhaust NOx emissions for major roads in the UK. The streamlined PCM could be further expanded in the future to cover other sources and pollutants.
The Streamlined PCM tool relies on a baseline for a specific year, which is obtained from a full run of the PCM model. It calculates roadside concentrations only; these are likely to determine compliance with the Directive 2008/50/EC annual mean NO2 limit value. The full PCM model calculates both roadside and background (1 km x 1 km gridded) concentrations. It can take into account the specific impact of changes in emissions on minor roads and cold start emissions on these background concentrations. The contribution of non-roadside sources remains unchanged with respect to the baseline, as the Streamlined PCM does not consider any non-traffic sources.
The Translation Tool is based on a set of response functions developed via an expert elicitation exercise. The evidence base drawn on to construct the response functions was in many cases sparse, with some response functions informed by single sources of evidence and expert judgement. Primary research and modelling were not carried out to inform these functions. In some cases, site-specific studies (i.e. referring to other countries and cities in Europe) were applied and adapted to the UK in the absence of other evidence. The current version of the translation tool is not able to consider the possible effects of changing costs of diesel independently of petrol, and does not take time lags in behavioural responses into account. The estimated cost impacts are a national average and do not reflect regional variations of any kind. At present, the translation tool can only assess measures that can be represented as vehicle cost changes, with 2020 as the target year.

Ricardo Energy & Environment Streamlined PCM Technical Report | 5
Ref: Ricardo/ED60017002/Issue Number 1
Figure 2. Schematic flowchart of the Streamlined PCM2.
2 In the expression CNO2 = f(ENO2) the term “f” is a shorthand for ‘is a function of’ and is not the adjustment factor.

Ricardo Energy & Environment Streamlined PCM Technical Report | 6
Ref: Ricardo/ED60017002/Issue Number 1
Figure 3. Schematic flowchart of the Translation Tool.
Ricardo Energy & Environment Streamlined PCM Technical Report | 7
Ref: Ricardo/ED60017002/Issue Number 1
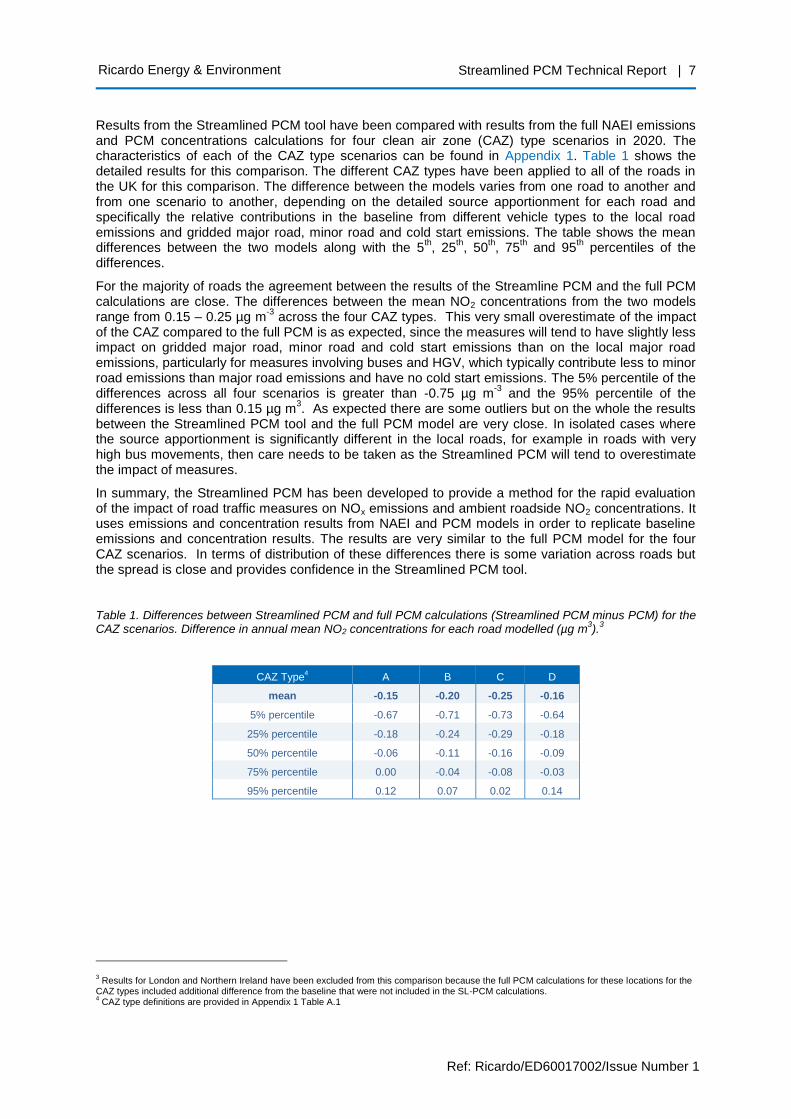
Results from the Streamlined PCM tool have been compared with results from the full NAEI emissions and PCM concentrations calculations for four clean air zone (CAZ) type scenarios in 2020. The characteristics of each of the CAZ type scenarios can be found in Appendix 1. Table 1 shows the detailed results for this comparison. The different CAZ types have been applied to all of the roads in the UK for this comparison. The difference between the models varies from one road to another and from one scenario to another, depending on the detailed source apportionment for each road and specifically the relative contributions in the baseline from different vehicle types to the local road emissions and gridded major road, minor road and cold start emissions. The table shows the mean differences between the two models along with the 5
th, 25
th, 50
th, 75
th and 95
th percentiles of the
differences.
For the majority of roads the agreement between the results of the Streamline PCM and the full PCM calculations are close. The differences between the mean NO2 concentrations from the two models range from 0.15 – 0.25 µg m
-3 across the four CAZ types. This very small overestimate of the impact
of the CAZ compared to the full PCM is as expected, since the measures will tend to have slightly less impact on gridded major road, minor road and cold start emissions than on the local major road emissions, particularly for measures involving buses and HGV, which typically contribute less to minor road emissions than major road emissions and have no cold start emissions. The 5% percentile of the differences across all four scenarios is greater than -0.75 µg m
-3 and the 95% percentile of the
differences is less than 0.15 µg m3. As expected there are some outliers but on the whole the results
between the Streamlined PCM tool and the full PCM model are very close. In isolated cases where the source apportionment is significantly different in the local roads, for example in roads with very high bus movements, then care needs to be taken as the Streamlined PCM will tend to overestimate the impact of measures.
In summary, the Streamlined PCM has been developed to provide a method for the rapid evaluation of the impact of road traffic measures on NOx emissions and ambient roadside NO2 concentrations. It uses emissions and concentration results from NAEI and PCM models in order to replicate baseline emissions and concentration results. The results are very similar to the full PCM model for the four CAZ scenarios. In terms of distribution of these differences there is some variation across roads but the spread is close and provides confidence in the Streamlined PCM tool.
Table 1. Differences between Streamlined PCM and full PCM calculations (Streamlined PCM minus PCM) for the CAZ scenarios. Difference in annual mean NO2 concentrations for each road modelled (µg m
3).
3
CAZ Type4 A B C D
mean -0.15 -0.20 -0.25 -0.16
5% percentile -0.67 -0.71 -0.73 -0.64
25% percentile -0.18 -0.24 -0.29 -0.18
50% percentile -0.06 -0.11 -0.16 -0.09
75% percentile 0.00 -0.04 -0.08 -0.03
95% percentile 0.12 0.07 0.02 0.14
3 Results for London and Northern Ireland have been excluded from this comparison because the full PCM calculations for these locations for the
CAZ types included additional difference from the baseline that were not included in the SL-PCM calculations. 4 CAZ type definitions are provided in Appendix 1 Table A.1

Ricardo Energy & Environment Streamlined PCM Technical Report | 8
Ref: Ricardo/ED60017002/Issue Number 1
2 Model Structure
The Streamlined PCM consists of two separate Microsoft Excel ® spreadsheets: one focusing on NOx and primary NO2 emissions (the Emission Calculation Spreadsheet) and one on NO2 annual mean concentrations and compliance with the annual limit value for NO2 (Directive 2008/50/EC) (the Concentration Calculation Spreadsheet). The essential data is sourced from DEFRA’s National Atmospheric Emissions Inventory (NAEI) for the estimation of NOx emissions and from a full run of the PCM model, which produces the baseline on which the NO2 concentration calculations for the Streamlined PCM and Translation Tool are carried out. The data from the NAEI were directly downloaded from its website (http://naei.defra.gov.uk) and transferred to different tabs within the Emission Calculation Spreadsheet, depending on their type and use stage. In order to produce the baseline for the estimation of concentrations, NO2 levels from a full run of the PCM model are provided for each of the 9,336 urban roads that are included in the full PCM assessment of compliance with the annual mean NO2 limit value of Directive 2008/50/EC. These NO2 concentrations are transferred into the Concentration Calculation Spreadsheet and its format is made consistent with the outputs of the Emission Calculation Spreadsheet.
Both the Streamlined PCM and the Translation Tool contain information on the different road-traffic variables that are likely to be affected by a given abatement measure. The following variables in both tools have been identified and classified according to their nature. Further details on the variables that are considered by the response functions of the Translation Tool will be outlined in the forthcoming final project report.
Emission factor variables, which includes individual emission factors for different vehicle types, fuel types and Euro standards as well as the coefficients for speed-dependent functions for their estimation. This group of variables also includes factors for primary NO2 emissions for different vehicle and fuel types (see section 2.1 for details).
Composition variables, including ratios of Euro standards for different vehicle and fuel types along with information on the total number of vehicle-kilometres by vehicle and road type (see section 2.2 for details).
Activity variables, which refer to annual average daily flows by vehicle type for the major (motorway and A road) 18,346 road links in the United Kingdom. Information on the different characteristics of each of the roads in the model is also available (see section 2.3 for details).
Concentration variables, which correspond to the different concentration values considered by the full PCM model and that enable the estimation of the annual mean concentration of NO2 at those receptors considered as urban major roads (see section 2.4 for details).
Geography variables, which enable the categorisation of the 18,346 road links in terms of their location within 406 local authorities, 20 areas in risk of non-compliance with the annual limit value of Directive 2008/50/EC for NO2 and 12 regions (9 regions in England, the other regions being Scotland, Wales and Northern Ireland) (see section 2.5 for details).
The above mentioned variables have been used to characterise a baseline of NOx emissions and NO2 concentrations. Due to the fact that the Streamlined PCM requires a full run of the PCM model to produce the baseline of NO2 concentrations, all the data incorporated into the Emission Calculation Spreadsheet needs to be fully consistent with the input data used for the full PCM model run. It should be noted that every baseline used in the Streamlined PCM carries a series of assumptions on the following aspects: (i) a target year, (ii) the degree of uptake of new vehicle technologies (e.g. Euro 6), (iii) the conformity degree of a given emission factor with the emission standards, (iv) the potential geographic differences in the application measures, (v) the source of emission factors used, etc.
The final version of the streamlined PCM provides projections for 2020, and it has a base year of 2013, the emission factors are obtained from COPERT 4v11. As part of this we have also developed a version focussing on 2025. This modelling can be updated in the light of new evidence, e.g. updating the base year or reflecting new projections.
Ricardo Energy & Environment Streamlined PCM Technical Report | 9
Ref: Ricardo/ED60017002/Issue Number 1
2.1 Emission Factors.
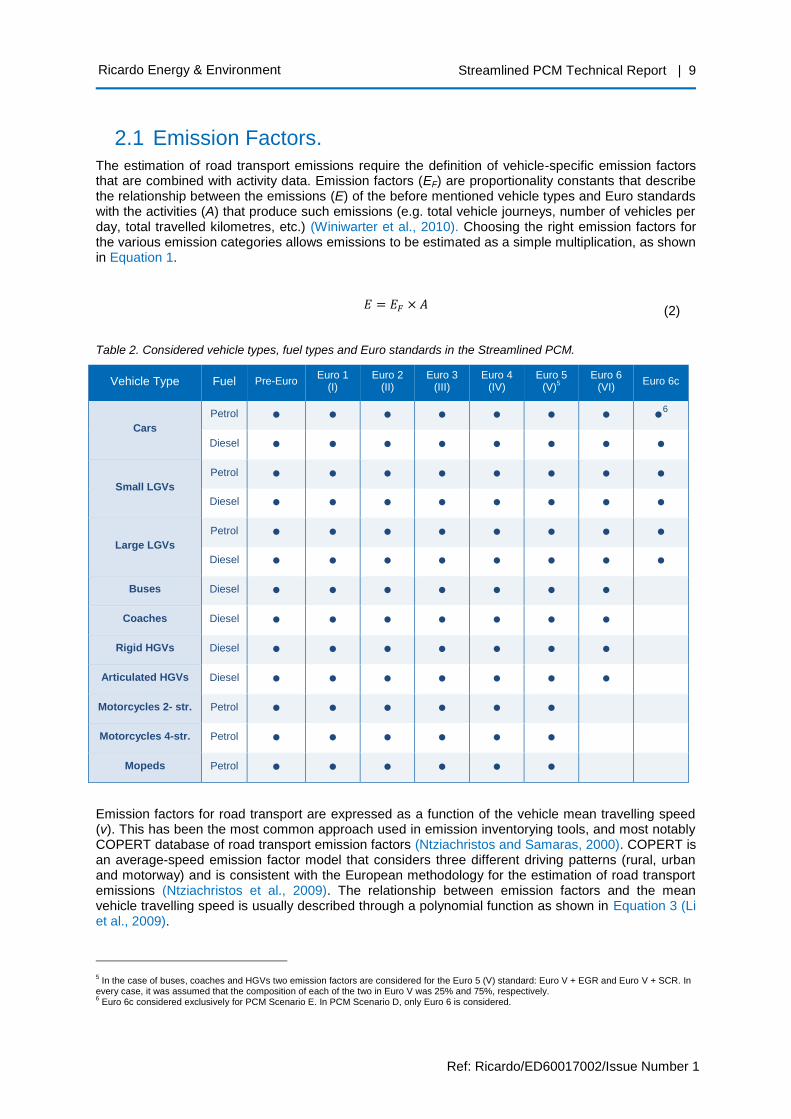
The estimation of road transport emissions require the definition of vehicle-specific emission factors that are combined with activity data. Emission factors (EF) are proportionality constants that describe the relationship between the emissions (E) of the before mentioned vehicle types and Euro standards with the activities (A) that produce such emissions (e.g. total vehicle journeys, number of vehicles per day, total travelled kilometres, etc.) (Winiwarter et al., 2010). Choosing the right emission factors for the various emission categories allows emissions to be estimated as a simple multiplication, as shown in Equation 1.
𝐸 = 𝐸𝐹 × 𝐴
Table 2. Considered vehicle types, fuel types and Euro standards in the Streamlined PCM.
Vehicle Type Fuel Pre-Euro Euro 1
(I) Euro 2
(II) Euro 3
(III) Euro 4
(IV) Euro 5
(V)5
Euro 6 (VI)
Euro 6c
Cars
Petrol ● ● ● ● ● ● ● ●6
Diesel ● ● ● ● ● ● ● ●
Small LGVs
Petrol ● ● ● ● ● ● ● ●
Diesel ● ● ● ● ● ● ● ●
Large LGVs
Petrol ● ● ● ● ● ● ● ●
Diesel ● ● ● ● ● ● ● ●
Buses Diesel ● ● ● ● ● ● ●
Coaches Diesel ● ● ● ● ● ● ●
Rigid HGVs Diesel ● ● ● ● ● ● ●
Articulated HGVs Diesel ● ● ● ● ● ● ●
Motorcycles 2- str. Petrol ● ● ● ● ● ●
Motorcycles 4-str. Petrol ● ● ● ● ● ●
Mopeds Petrol ● ● ● ● ● ●
Emission factors for road transport are expressed as a function of the vehicle mean travelling speed (v). This has been the most common approach used in emission inventorying tools, and most notably COPERT database of road transport emission factors (Ntziachristos and Samaras, 2000). COPERT is an average-speed emission factor model that considers three different driving patterns (rural, urban and motorway) and is consistent with the European methodology for the estimation of road transport emissions (Ntziachristos et al., 2009). The relationship between emission factors and the mean vehicle travelling speed is usually described through a polynomial function as shown in Equation 3 (Li et al., 2009).
5 In the case of buses, coaches and HGVs two emission factors are considered for the Euro 5 (V) standard: Euro V + EGR and Euro V + SCR. In
every case, it was assumed that the composition of each of the two in Euro V was 25% and 75%, respectively. 6 Euro 6c considered exclusively for PCM Scenario E. In PCM Scenario D, only Euro 6 is considered.
(2)
Ricardo Energy & Environment Streamlined PCM Technical Report | 10
Ref: Ricardo/ED60017002/Issue Number 1
𝐸𝐹 = (𝑎0 + 𝑎1 ∙ 𝑣 + 𝑎2 ∙ 𝑣2 + ⋯ + 𝑎6 ∙ 𝑣6)/𝑣
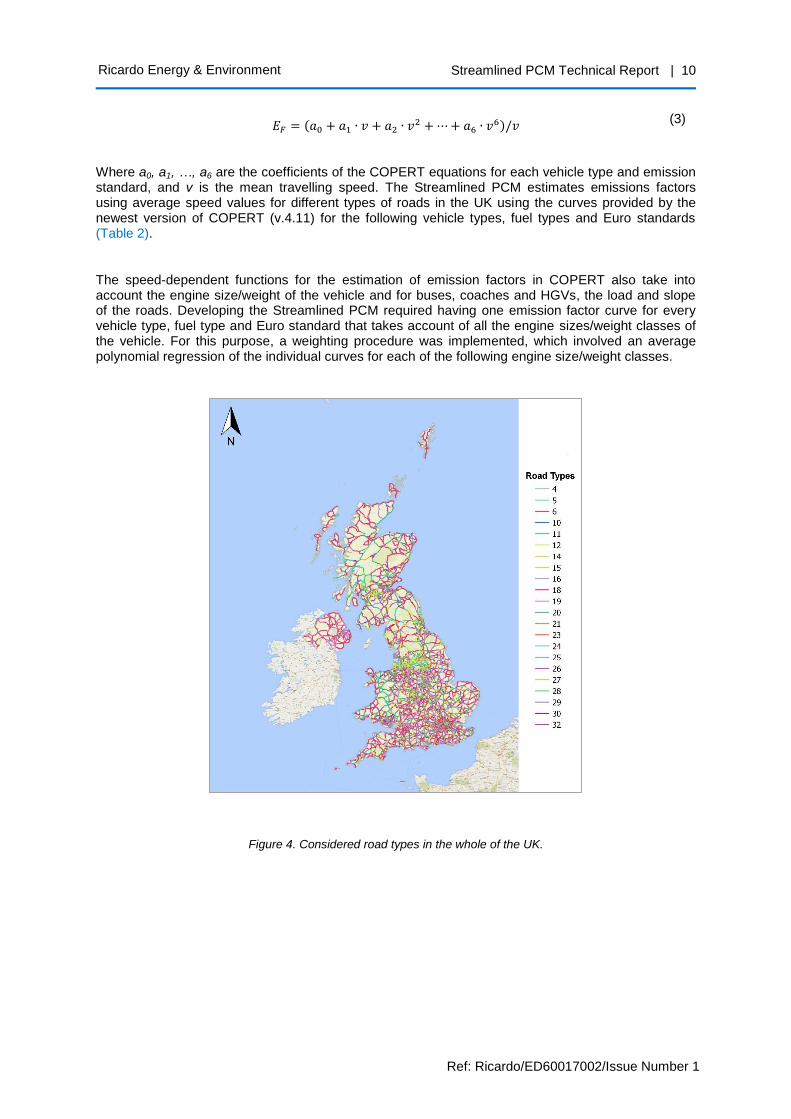
Where a0, a1, …, a6 are the coefficients of the COPERT equations for each vehicle type and emission standard, and v is the mean travelling speed. The Streamlined PCM estimates emissions factors using average speed values for different types of roads in the UK using the curves provided by the newest version of COPERT (v.4.11) for the following vehicle types, fuel types and Euro standards (Table 2).
The speed-dependent functions for the estimation of emission factors in COPERT also take into account the engine size/weight of the vehicle and for buses, coaches and HGVs, the load and slope of the roads. Developing the Streamlined PCM required having one emission factor curve for every vehicle type, fuel type and Euro standard that takes account of all the engine sizes/weight classes of the vehicle. For this purpose, a weighting procedure was implemented, which involved an average polynomial regression of the individual curves for each of the following engine size/weight classes.
Figure 4. Considered road types in the whole of the UK.
(3)

Ricardo Energy & Environment Streamlined PCM Technical Report | 11
Ref: Ricardo/ED60017002/Issue Number 1
Table 3. Characteristics of the road types considered by Streamlined-PCM.
Road ID Road Type Area Type General
Speed (km/h) Speed HGVs
(km/h) Speed Buses
(km/h)
1 Urban Central London 24 24 16
2 Urban Inner London 32 32 24
3 Urban Outer London 46 46 32
4 Urban Central London 16 16 16
5 Urban Inner London 21 21 24
6 Urban Outer London 31 31 32
7 Urban Central London 16 16 16
8 Urban Inner London 20 20 20
9 Urban Outer London 29 29 29
10 Motorway Outer London 108 87 87
11 Urban Conurbation 38 37 24
12 Urban Conurbation 31 31 24
13 Urban Conurbation 30 30 20
14 Motorway Conurbation 97 82 82
15 Urban Urban 53 52 32
16 Urban Urban 36 36 32
17 Urban Urban 35 34 29
18 Rural Rural 77 72 71
19 Rural Rural 111 90 93
20 Rural Rural 77 72 71
21 Rural Rural 111 90 93
22 Rural Rural 61 62 62
23 Motorway Rural 113 90 95
24 Rural Outer London 91 64 80
25 Rural Conurbation 88 64 80
26 Rural Conurbation 107 80 97
27 Rural Urban 93 64 80
28 Rural Urban 108 80 97
29 Urban Rural 67 48 48
30 Urban Rural 90 64 64

Ricardo Energy & Environment Streamlined PCM Technical Report | 12
Ref: Ricardo/ED60017002/Issue Number 1
Passenger cars. Engine sizes: <1400 cc, 1400-2000 cc, and >2000 cc. The composition of each of the engine sizes in 2020 is 42.5%, 45.0% and 12.5% for petrol cars and 8.1%, 62.2% and 29.8% for diesel cars.
LGVs. Sizes: N1(I), N1(II) and N1(III). The composition of each of the sizes in 2020 for petrol LGVs in all of the UK and for diesel LGVs outside London is 6%, 26% and 68% respectively. For diesel LGVs inside London the composition is 23%, 22% and 54% respectively.
Buses. Weights: ≤ 15 t and >15 t. The composition of each of the weights in 2020 is 31.4% and 68.6% for all the UK. It is assumed that buses circulate with a 50% load and a 0% slope.
Coaches. Weights: ≤ 18 t and >18 t, with compositions of 50% and 50% respectively for all the UK. It is assumed that coaches circulate with a 50% load and a 0% slope.
Rigid HGVs. Weights: 3.5-7.5 t, 7.5-12 t, 12-14 t, 14-20 t, 20-26 t, 26-28 t, 28-32 t, and >32 t. The compositions of each of the before mentioned weights in 2020 is 33.4%, 6.1%, 2.4%, 11.6%, 15.9%, 8.8%, 17.5% and 4.4% respectively. It is assumed that rigid HGVs circulate with a 50% load and a 0% slope.
Articulated HGVs. Weights: 14-20 t, 20-28 t, 28-34 t, 34-40 t, and 40-50t. The compositions in 2020 for each of the weights are 2.2%, 3.0%, 2.2%, 16.3% and 76.2%. It is assumed that articulated HGVs circulate with a 50% load and a 0% slope.
Motorcycles (2-strokes) and Mopeds. Engine sizes: ≤ 50 cc (moped) and >50 cc, with compositions exclusively for urban roads of 75% and 25% respectively in 2020.
Motorcycles (4-strokes). Engine sizes: 50-150 cc, 150-250 cc, 250-750 cc, and >750 cc, with compositions for urban and rural roads in 2020 of 27%, 6%, 31%, and 35%.
Individual emission factors are then computed with the speed-dependent functions from COPERT using an average circulation speed, specific for 30 different road types (Figure 4) and vehicle type. The characteristics of the 30 road types considered in Streamlined PCM are presented in Table 3.
Currently, the Streamlined PCM considers different average circulation speeds for buses and coaches, HGVs and the rest of vehicles. Emission factors in the Streamlined PCM are not dealt with individually, but rather combined with composition values to determine an average emission factor for every vehicle type, fuel type and road type combination, as specified in Equation 4.
�̅�𝐹,𝑖,𝑗 = ∑ 𝑣𝑖 ∙ 𝐸𝐹,𝑖,𝑗,𝑘
𝑁
𝑘=1
Where:
ĒF,i,j – average emission factor for vehicle type “i” and road type “j” – [g/km].
vi – composition (in terms of total vehicle-kilometres) of vehicle type “i”.
EF,i,j,k – individual emission factor for vehicle type “I” and road type “j” and Euro standard “k” – [g/km].
Average emission factors for each of the considered vehicle types are then assigned to the specific road links considered in the Streamlined PCM according to their road type (Figure 4). For the purposes of estimating concentrations of nitrogen dioxide (NO2), the fraction of NOx that is emitted as primary NO2 by the different vehicle types is also required. The fractions of primary NO2 that are used in the Streamlined PCM have been derived from COPERT v.4.11 and are shown in Table 4, for 2020 and for the specific vehicle and fuel mix considered by the NAEI.
(4)

Ricardo Energy & Environment Streamlined PCM Technical Report | 13
Ref: Ricardo/ED60017002/Issue Number 1
Table 4. Fraction of primary nitrogen dioxide (NO2) emitted by the different vehicle types in 2020.
Vehicle Type fNO2
Cars, Petrol 0.0237
Cars and London Taxis, Diesel 0.3510
Small LGVs, Petrol 0.0251
Small LGVs, Diesel 0.3378
Large LGVs, Petrol 0.0251
Large LGVs, Diesel 0.3378
Buses 0.1016
Coaches 0.1001
Rigid HGVs 0.1043
Articulated HGVs 0.1043
Motorcycles (2 str.)/Mopeds 0.040
Motorcycles (4 str.) 0.040
2.2 Composition variables
2.2.1 Euro standard split in the vehicle fleet
The PCM model uses NOx emissions that have been derived by the NAEI based on vehicle compositions from NAEI, which are estimated from vehicle sales, survival rates, age-related vehicle mileage and information from Automatic Number Plate Recognition (ANPR) data. The estimation is subject to some uncertainties related to the quality of the underlying modelling assumptions. For the purposes of Streamlined PCM, compositions are defined as the ratio of the total vehicle-kilometres made by vehicles of the different Euro standards over the total vehicle-kilometres made by the entire vehicle class.
The current version of the Streamlined PCM (v.2.1) also considers composition values of the different Euro standards (Table 2) in terms of vehicle-kilometres for the different vehicle types and fuel types. Compositions are available for two types of locations: London and the rest of the UK. Table 5 presents the considered composition in 2020 for the different Euro standards, vehicle types and fuel types for the whole of the UK (excluding London). Euro standard splits in the vehicle fleet are also considered for London for some vehicle and fuel types, due to the fact that specific data has been made available by Transport for London (TfL) on specific vehicle and fuel types. These composition values are presented in Table 6.
2.2.2 Annual vehicle-kilometres
The Streamlined PCM considers values of annual vehicle-kilometres (vkm) that are driven by the different vehicle and fuel types in three different types of road: urban, rural and motorway. The total annual vehicle-kilometres by vehicle type are shown in Table 7, while Figure 5 shows percentage of the annual vehicle-kilometres driven on the different road types for the considered vehicle and fuel types in 2020.

Ricardo Energy & Environment Streamlined PCM Technical Report | 14
Ref: Ricardo/ED60017002/Issue Number 1
Table 5. Composition values7 (in terms of vehicle-kilometres) for the whole of the UK (excluding London) in 2020.
Vehicle Type Fuel Pre-Euro Euro 1 Euro 2 Euro 3 Euro 4 Euro 5 Euro 6
Cars
Petrol 0.000 0.000 0.001 0.027 0.113 0.236 0.621
Diesel 0.000 0.000 0.000 0.015 0.095 0.272 0.617
Small LGVs
Petrol 0.000 0.000 0.024 0.078 0.228 0.259 0.409
Diesel 0.000 0.000 0.001 0.005 0.053 0.253 0.686
Large LGVs
Petrol 0.000 0.000 0.024 0.078 0.228 0.259 0.409
Diesel 0.000 0.000 0.001 0.005 0.053 0.253 0.686
Buses Diesel 0.000 0.000 0.009 0.065 0.049 0.227 0.648
Coaches Diesel 0.000 0.000 0.009 0.065 0.049 0.227 0.648
Rigid HGVs Diesel 0.000 0.000 0.000 0.008 0.032 0.131 0.828
Articulated HGVs Diesel 0.000 0.000 0.000 0.000 0.004 0.053 0.942
Motorcycles 2- str. Petrol 0.000 0.027 0.033 0.429 0.432 0.076 0.000
Motorcycles 4-str. Petrol 0.000 0.067 0.060 0.472 0.343 0.056 0.000
Mopeds Petrol 0.000 0.033 0.032 0.452 0.389 0.091 0.000
Table 6. Composition values (in terms of vehicle-kilometres) for London in 2020.
Vehicle Type Fuel Pre-Euro Euro 1 Euro 2 Euro 3 Euro 4 Euro 5 Euro 6
Cars and London Taxis
Petrol 0.000 0.000 0.001 0.027 0.113 0.236 0.621
Diesel 0.000 0.000 0.000 0.015 0.095 0.272 0.617
Small LGVs
Petrol 0.000 0.000 0.024 0.078 0.228 0.259 0.409
Diesel 0.000 0.000 0.000 0.007 0.074 0.293 0.624
Large LGVs
Petrol 0.000 0.000 0.024 0.078 0.228 0.259 0.409
Diesel 0.000 0.000 0.000 0.007 0.074 0.293 0.624
Buses Diesel 0.000 0.000 0.009 0.065 0.049 0.222 0.647
Coaches Diesel 0.000 0.000 0.009 0.065 0.049 0.227 0.648
Rigid HGVs Diesel 0.000 0.000 0.000 0.003 0.059 0.238 0.698
Articulated HGVs Diesel 0.000 0.000 0.000 0.000 0.010 0.082 0.907
Motorcycles 2- str. Petrol 0.000 0.027 0.033 0.429 0.432 0.076 0.000
Motorcycles 4-str. Petrol 0.000 0.067 0.060 0.472 0.343 0.056 0.000
Mopeds Petrol 0.000 0.033 0.032 0.452 0.389 0.091 0.000
7 Composition values are expressed as a unitary proportion. For composition values as a percentage, values should be multiplied by 100.

Ricardo Energy & Environment Streamlined PCM Technical Report | 15
Ref: Ricardo/ED60017002/Issue Number 1
Figure 5. Percentage of the annual vehicle-kilometres driven on the different road types.

Ricardo Energy & Environment Streamlined PCM Technical Report | 16
Ref: Ricardo/ED60017002/Issue Number 1
Table 7. Total annual vehicle-kilometres by vehicle type (billion) in 2020.
Vehicle Type Annual vkms (billion)
Cars, Petrol 197.48
Cars and London Taxis, Diesel 257.52
Small LGVs, Petrol 0.30
Small LGVs, Diesel 25.18
Large LGVs, Petrol 0.64
Large LGVs, Diesel 53.51
Buses 3.44
Coaches 1.78
Rigid HGVs 16.43
Articulated HGVs 11.81
Motorcycles (2 str.)/Mopeds 0.22
Motorcycles (4 str.) 3.90
2.3 Activity variables
Activity variables are present in the Streamlined PCM as traffic counts in the form of annual average daily flows (ADDFs) for 18,346 road links in the United Kingdom for the considered vehicle and fuel types (Table 2). Traffic counts for Great Britain were provided by the Department for Transport (DfT) and for Northern Ireland were provided by Transport NI for 2012 and projected to 2020 using the projected compositions specified in the NAEI Road Traffic Model. The fuel split on each road is based on the methodology followed by the NAEI (Salisbury et al., 2014). The following vehicle flows are considered in the Streamlined PCM:
Cars, petrol.
Cars, diesel (and London taxis).
Small LGVs, petrol.
Small LGVs, diesel.
Large LGVs, petrol.
Large LGVs, diesel.
Buses.
Coaches.
Rigid HGVs.
Articulated HGVs.
Motorcycles (2 strokes).
Motorcycles (4 strokes).
Mopeds.
Figure 6 shows traffic counts (as AADFs) in the different roads of the United Kingdom for Diesel Cars and Articulated HGVs. It can be seen that most of diesel car flows occur in urban agglomerations (cities), while most of the flows of articulated HGVs occur in ring roads and motorways. Through the combination of average emission factors and the traffic counts for every road, it is possible to estimate the emissions of nitrogen oxides that occur in 2020 for the 18,346 road links considered by the Streamlined PCM (Figure 7).

Ricardo Energy & Environment Streamlined PCM Technical Report | 17
Ref: Ricardo/ED60017002/Issue Number 1
Figure 6. AADF values for a) Diesel Cars and b) Articulated HGVs.

Ricardo Energy & Environment Streamlined PCM Technical Report | 18
Ref: Ricardo/ED60017002/Issue Number 1
If the individual emissions of every vehicle type are combined with the fraction of primary NO2 (Table 4), the emissions of primary NO2 can also be estimated. These emissions can be then exported into the Concentration Calculation Spreadsheet to estimate compliance with the annual limit value for NO2 according to Directive 2008/50/EC. Further information on the emission inventory and mapping methodology can be found in Salisbury et al., (2014) and Tsagatakis et al., (2013).
Figure 7. Emission (green) and concentration (blue) receptors in the Streamlined PCM.
2.4 Concentration variables
To estimate the effect of abatement measures on the annual mean concentration of NO2 at different roadside receptors, the Streamlined PCM relies on a parameterisation of the performance of the full PCM model. This parameterisation estimates annual mean NOx concentration as the sum of the following components:
Background road traffic area source (Brdarea) – NOx concentration (μg m-3
).
Background non-road traffic area source (Bnondrarea) – NOx concentration (μg m-3
).
Background point source (Bpoints) – NOx concentration (μg m-3
).
Background rural (Brural) - NOx concentration (μg m-3
).
Roadside increment NOx concentration (μg m-3
)
Annual mean NO2 concentrations are calculated using a calibrated oxidant partitioning model, using the following variables:
Ricardo Energy & Environment Streamlined PCM Technical Report | 19
Ref: Ricardo/ED60017002/Issue Number 1
Total background (Bnox) - NOx concentration (μg m-3
).
Total roadside (Rnox) - NOx concentration (μg m-3
).
Background local oxidant from road traffic area sources (Brdarealocalox – ppb).
Background local oxidant non-road traffic area sources, point sources and rural (Bnonrdarealocalox – ppb)
Roadside increment local oxidant (Rlocalox) – (pbb).
Regional oxidant (Regionalox) – (ppb).
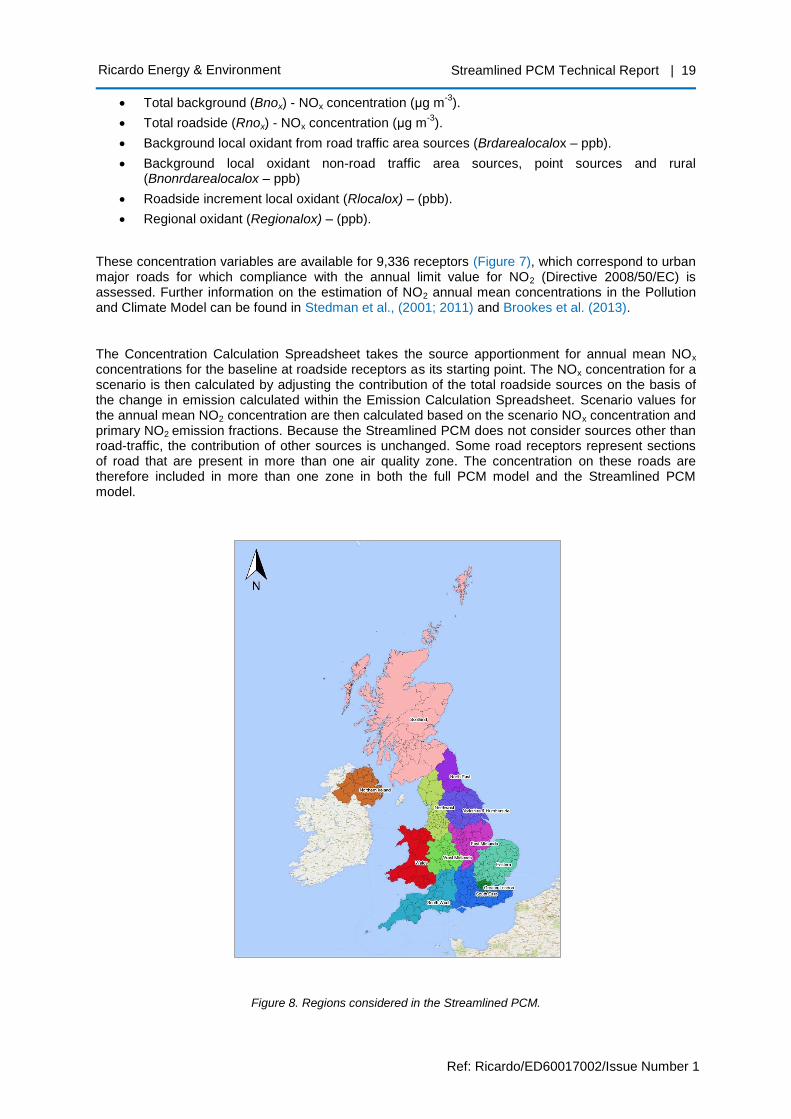
These concentration variables are available for 9,336 receptors (Figure 7), which correspond to urban major roads for which compliance with the annual limit value for NO2 (Directive 2008/50/EC) is assessed. Further information on the estimation of NO2 annual mean concentrations in the Pollution and Climate Model can be found in Stedman et al., (2001; 2011) and Brookes et al. (2013).
The Concentration Calculation Spreadsheet takes the source apportionment for annual mean NOx concentrations for the baseline at roadside receptors as its starting point. The NOx concentration for a scenario is then calculated by adjusting the contribution of the total roadside sources on the basis of the change in emission calculated within the Emission Calculation Spreadsheet. Scenario values for the annual mean NO2 concentration are then calculated based on the scenario NOx concentration and primary NO2 emission fractions. Because the Streamlined PCM does not consider sources other than road-traffic, the contribution of other sources is unchanged. Some road receptors represent sections of road that are present in more than one air quality zone. The concentration on these roads are therefore included in more than one zone in both the full PCM model and the Streamlined PCM model.
Figure 8. Regions considered in the Streamlined PCM.

Ricardo Energy & Environment Streamlined PCM Technical Report | 20
Ref: Ricardo/ED60017002/Issue Number 1
2.5 Geographic variables
In order to facilitate the localisation of measures to a given geographic area, the receptors considered in the Streamlined PCM have been labelled according to their location within 406 local authorities, 20 possible locations of areas in risk of non-compliance with the limit values of Directive 2008/50/EC for NO2, and 12 regions (9 regions in England, the other regions being Scotland, Wales and Northern Ireland). The zones in risk of non-compliance have been defined by DEFRA. The regions that are considered in the Streamlined PCM correspond to those previously known as Government Office Regions (GOR) in England, and are the following (Figure 8):
East Midlands.
Eastern.
Greater London.
North East.
Northwest & Merseyside.
Northern Ireland.
Scotland.
South East.
South West.
Wales.
West Midlands.
Yorkshire & Humberside.
Figure 9. Considered zones in risk of non-compliance with the annual NO2 LV in the Streamlined PCM.

Ricardo Energy & Environment Streamlined PCM Technical Report | 21
Ref: Ricardo/ED60017002/Issue Number 1
The current version of the Streamlined PCM (v.2.1) has the possibility to limit the application of measures to 20 zones in risk of non-compliance with the NO2 annual Limit Value. The considered zones in risk of non-compliance are shown in Figure 9 and for the purposes of this national level screening modelling were based on zones or group of roads that have breached the annual NO2 Limit Value. Most of them are located within city centres and important congestion areas and they have been defined through natural boundaries such as existing ring roads or rivers.
Additionally, the concentration receptors (Figure 7) in the Concentration Calculation Spreadsheet have been labelled according to their geographic location in one of the 43 air quality management zones in which the UK is divided for the purposes of assessing compliance with the limit values of Directive 2008/50/EC. A list with the air quality management zones of the UK and a map are provided in Appendix 2.
3 Quality assurance
The Streamlined PCM tool uses information from the Pollution Climate and Mapping (PCM) model, which for every baseline has been validated against observations recorded by monitoring stations located throughout the UK. Regarding quality assurance (QA), the model is produced under the MAAQ project which is subject to BS EN ISO 9001:2008. It is audited by Lloyds and the Ricardo Energy & Environment internal QA process. The emphasis of these audits is on document control, data tracking and spreadsheet checking. Model QA is based on the recommendations made in the “Review of the air quality assurance framework of the National Atmospheric Emissions Inventory, Pollution Climate Mapping and Impact Pathway Models” report prepared for Defra under Contract 21366 by Hartley McMaster Limited. The general QA process also takes into account the recommendations from The Aqua book: guidance on producing quality analysis for government (HM Treasury, 2015). The general QA process of Streamlined PCM consisted of implementing the following actions:
Spreadsheet Checks. In-built checks were incorporated in the spreadsheets where possible. In many cases, these involved building data in two different ways or from different sources and then performing a “checksum” to highlight differences. Additionally, the original template on which Streamlined PCM is built was fed on two occasions with simple “dummy data” to test for formula and data consistency. In order to bring impartiality to the QA/QC process, checks were carried out by a qualified consultant who was not originally involved in producing/programming the spreadsheets. All checking activities were logged in an independent spreadsheet. The checks confirmed that the spreadsheet mechanics worked as intended. Given the lack of external linkage to input data, checks also focussed on confirming that the input data from the correct versions of the NAEI and PCM sources had been incorporated correctly. All checks were recorded on a separate checking log for each model component. The logs provide evidence of specific checks, the dates on which they occurred, the identity of the qualified checker, explanation of any problems or queries identified and description of remedial action. Any remedial action has been captured and tracked within the log until resolved and the log contains an approval and date that formally flags the tool as fit for policy use.
Spreadsheet Management. Streamlined PCM is a standalone tool which does not need to have linked values from external sources. All datasets were incorporated manually to retain spreadsheet integrity and to allow the data sources to be labelled appropriately. Colour coding was applied to identify the different sheets that compose Streamlined PCM in terms of the level of interaction that these have with the user. For example, red was used for those spreadsheets that require input from the user and green for those that contain the results. The spreadsheet has most of the data hidden to the user to avoid accidental editing.
Ricardo Energy & Environment Streamlined PCM Technical Report | 22
Ref: Ricardo/ED60017002/Issue Number 1
Data Management. Due to the Streamlined PCM using data from the NAEI and from previous runs of the full PCM model, track records of versions, data providers and other considerations were kept in a data log. The use of these data was properly signed-off by the respective project managers and authorised by DEFRA and evidence of this approval has been recorded.
Version control. Governed by file naming conventions that involve using a single filename for the Streamlined PCM files and a date suffixed file name for older versions. Old files are not the results of model changes but of the model building process where a copy is taken to preserve existing work while the live version is modified as the model is built. Each version contains an explanation of its specification to discern between different evolutions of the tool. This explanation exists within each spreadsheet (a separate tab) and within a dedicated version control log file.
Continuous improvement tasks. The tool is inspected to explore potential for improvements such as carrying out size/memory optimisation procedures to facilitate configuration and running, under DEFRA’s request. The inclusion of new functionalities and updated data can also be considered under request from DEFRA.
Succession planning. The knowledge of Streamlined PCM is widespread amongst the maximum number of users as possible. Training and knowledge transfer activities are planned between model developers and potential users. Model documentation provides a technical guide to the model mechanics and there is also a simple, instructional guide designed to let new users pick up the fundamental workings of the tool in an efficient manner
4 Future development opportunities
This section highlights opportunities for expansion of the Streamlined PCM in any future versions (the current version is v.2.1):
Include alternative vehicle technologies such as pure hybrid cars and vans (diesel and petrol) as well as plug-in hybrid and electric vehicles. While these technologies are already included in the Translation Tool, this will be applied to the Streamlined PCM spreadsheet.
Provide taxis as a separate vehicle type, as opposed to considering them part of the diesel passenger car fleet in London.
Provide a functionality that allows changing the conformity factor for specific vehicle types, fuel types and emission standards, including to account for the introduction of real world driving emission tests.
Investigating the potential of extending the Streamlined PCM to other pollutants such as PM10 or PM2.5.
Investigating the potential of extending the Streamlined PCM to consider other sources such as small point sources (e.g. power stations, domestic heating sources).
5 Final remarks
The Streamlined PCM has been designed as a versatile tool for assessing the impact of different measures on NOx emissions and NO2 annual mean concentrations for numerous road links in the UK. Its main advantage is that it allows assessing the effect of emission abatement measures in a very short time. This analysis allows decision makers to identify those measures with the highest reduction potentials and provides sufficient evidence to further investigate the impact of such measures with more complex evaluation resources, such as the full Pollution and Climate Mapping (PCM) model.
Ricardo Energy & Environment Streamlined PCM Technical Report | 23
Ref: Ricardo/ED60017002/Issue Number 1
The Streamlined PCM has been built as an approximation of the full PCM model, and it is consistent with the National Atmospheric Emissions Inventory (NAEI). Due to the fact that it is an approximation of the full PCM model, it has some additional uncertainties as outlined in this report, and it is not intended as a substitute. Despite this, its results do provide a base which is consistent with the compliance assessment and baseline projections of the full PCM model.
6 References
Brookes, D.M., Stedman, J.R., Kent, A.J., Morris, R.J., Cooke, S.L., Lingard, J.J.N., Rose, R.A., Vincent, K. J., Bush, T.J., Abbott, J., 2013. Technical report on UK supplementary assessment under the Air Quality Directive (2008/50/EC), the Air Quality Framework Directive (96/62/EC) and Fourth Daughter Directive (2004/107/EC) for 2012. Report for the Department for Environment, Food and Rural Affairs, Welsh Government, the Scottish Government and the Department of the Environment for Northern Ireland. Available online at: http://uk-air.defra.gov.uk/assets/documents/reports/cat09/1312231525_AQD_DD4_2012mapsrepv0.pdf
European Commission (EC), 2014. Environment: Commission takes action against UK for persistent air pollution problems. Press Release, 20 February 2014.
HM Treasury, 2015. The Aqua Book: guidance on producing quality analysis for government. London, United Kingdom.
Li, Y., Pearson, B., Murrells, T., 2009. Updated vehicle emission curves for use in the National Transport Model. Report to the Department of Transport ED47666 Issue 2. AEA Technology. Available online at: https://www.gov.uk/government/uploads/system/uploads/attachment_data/file/4556/aeat-updated-vehicle-emission-curves.pdf
Ntziachristos, L., Gkatzoflias, D., Kouridis, C., Samaras, Z., 2009. COPERT: a European road transport emission inventory model. In: Athanasiadis, I.N., Mitkas, P.A., Rizzoli, A.E., Marx Gómez, J. (Eds.), Information Technologies in Environmental Engineering. Springer, pp. 491-504.
Ntziachristos, L. and Samaras, Z., 2000. Speed-dependent emission factors for catalyst passenger cars and influencing parameters. Atmospheric Environment 34, 4611-4619.
Salisbury, E., Thistlethwaite, G., Pang, Y., Bailey, R., 2014. Air Quality Pollutant Inventories for England, Scotland, Wales and Northern Ireland: 1990-2012. A report of the National Atmospheric Emissions Inventory. Available online at: http://uk-air.defra.gov.uk/reports/cat07/1410200846_DA_AQPI_1990-2012_Report_Issue2.pdf
Stedman, J., Grice, S., Cooke, S., Brookes, D., 2011. Baseline and LEZ scenario modelling to support the development of UK air quality plan for NO2 compliance. AEA presentation. Available online at: http://aamg-rsc.org/wp-content/uploads/2012/02/JStedman.pdf
Stedman, J., Goodwin, J.W.L., King, K., Murrells, T.P., Bush, T.J., 2001. An empirical model for predicting urban roadside nitrogen dioxide concentrations in the UK. Atmospheric Environment 35 (8), 1451-1463.

Ricardo Energy & Environment Streamlined PCM Technical Report | 24
Ref: Ricardo/ED60017002/Issue Number 1
Tsagatakis, I., Brace, S., Passant, N., Cooke, s., 2013. UK Emission Mapping Methodology 2011. A report of the National Atmospheric Emissions Inventory. Ricardo-AEA/R/3376 ED57422104. Available online at: http://uk-air.defra.gov.uk/reports/cat07/1403100909_UK_Emission_Mapping_Methodology_2011-Issue_1.pdf
Winiwarter, W., Kuhlbusch, T.A.J., Viana, M., Hitzenberger, R., 2010. Quality considerations of European PM Emission Inventories. Atmospheric Environment 43, 3819-3828.

Ricardo Energy & Environment Streamlined PCM Technical Report | 25
Ref: Ricardo/ED60017002/Issue Number 1
Appendix 1 – Clean Air Zone (CAZ) type scenarios
Table A.1. Characteristics of the Clean Air Zone (CAZ) type scenarios.
Vehicle Typea
Fuel CAZ Type A CAZ Type B CAZ Type C CAZ Type D
Cars Petrol - - - Euro 4 at least
b
Diesel - - - Euro 6c
Small LGVs Petrol - - Euro 4 at least
b Euro 4 at least
b
Diesel - - Euro 6 Euro 6
Large LGVs Petrol - - Euro 4 at least
b Euro 4 at least
b
Diesel - - Euro 6 Euro 6
Buses Diesel Euro VI Euro VI Euro VI Euro VI
Coaches Diesel Euro VI Euro VI Euro VI Euro VI
Rigid HGVs Diesel - Euro VI Euro VI Euro VI
Articulated HGVs Diesel - Euro VI Euro VI Euro VI
Motorcycles 2- str. Petrol - - - -
Motorcycles 4-str. Petrol - - - -
Mopeds Petrol - - - -
a A compliance factor (in emissions) of 90% for cars and 95% for HGVs and LGVs was considered.
b All pre-Euro 4 petrol LGVs will be substituted by brand new petrol LGVs (Euro 6).
c Of all pre-Euro 6 petrol cars, 25% of them are substituted by a brand new diesel cars (Euro 6) and 75% are
substituted by a second-hand petrol car (assumed to be Euro 5).

Ricardo Energy & Environment Streamlined PCM Technical Report | 26
Ref: Ricardo/ED60017002/Issue Number 1
Appendix 2 – UK air quality management zones
Figure A.1. Map of the 43 air quality management zones in the United Kingdom.

The Gemini Building Fermi Avenue Harwell Didcot Oxfordshire OX11 0QR United Kingdom
t: +44 (0)1235 753000 e: [email protected]
ee.ricardo.com