STRC 7 Swiss Transport Research Conference · Through a quantitative analysis of travel-time...
27
The Daily Duration of Transportation: An Econometric and Sociological Approach Karl Littlejohn, EPFL Iragaël Joly, LET Conference paper STRC 2007 STRC 7 th Swiss Transport Research Conference Monte Verità / Ascona, September 12. – 14. 2007
-
Upload
truongkhanh -
Category
Documents
-
view
214 -
download
0
Transcript of STRC 7 Swiss Transport Research Conference · Through a quantitative analysis of travel-time...
The Daily Duration of Transportation: An Econometric and Sociological Approach
Karl Littlejohn, EPFL Iragaël Joly, LET
Conference paper STRC 2007
STRC
7 th
Swiss Transport Research Conference
Monte Verità / Ascona, September 12. – 14. 2007


3
The Daily Duration of Transportation: An Econometric and
Sociological Approach
Karl Littlejohn
Urban Sociology Laboratory
(LaSUR)
Lausanne, Switzerland
Iragaël Joly
Economic and Transportation
Laboratory (LET)
Lyon, France
Phone: +41 21 693 80 54
Fax:
email: [email protected]
Phone: +33 4 72 72 64 46
Fax:
email: [email protected]
lyon.cnrs.fr
September 2007

4
Abstract
This paper combines both quantitative and qualitative methods to provide supplemental
information and results that clarify the reasons that individuals devote ample time to travel.
Through a quantitative analysis of travel-time budgets (TTB) in seven cities (Zurich,
Bern, Geneva, Rennes, Lyon, Strasbourg, and Grenoble), the research initially establishes the
relationship between the amount of daily travel time allocated and socio-demographic
characteristics of individuals and households. The application of a duration model method
additionally highlights the influence of diverse types of activities at the destination on TTB.
Our analysis confirms that the overall TTB of individuals has increased over roughly the past
ten years, with Swiss cities possessing higher travel times than French ones. In many cities,
around 20% of our samples also devote excessive amounts of time to travel. The duration
model therefore indicates an atypical individual behavior not explained by the covariates of
the model. Conversely, other dimensions could certainly explain the choices or obligations
that influence these high TTB.
Accordingly, in-depth interviews are given to individuals that travel during the week for
longer than 2 hours a day. Their profiles provide several explanations to the reasons behind
their choice (or obligation) to spend major amounts of time in daily travel. Consequently, the
allocation of travel time of a person is not solely determined by the activities at a destination,
but also by individual aspects. Additionally, travel time is perceived as time when other
activities can be performed simultaneously (ex. working on the train, listening to music, etc.).
Keywords
Travel-time budgets, model duration, perceptions of travel time, societal influences

5
1. Introduction
Transportation time is perceived as a mobility indicator, yet certain attempt to quantify
while others research its qualitative elements. Nonetheless, both undertake questions on the
measurement, the universality, and the perception of time. Consequently, the analysis of
transportation time appears to provide an opportunity to reunite multiple disciplines. This is
notably one of the aspects discussed at the conference “Mobilities and Temporalities” in 2004
from the workgroup “Spatial Mobility and Societal Fluidity” of the AISLF.
Montulet (2005) illustrates how issues of congestion and individual/social time, including
its acceleration, can be articulated through the use of transportation time, showing that one
issue strongly correlates with the other. He also evocates the large complexity of mobility
and temporality relationships that “proposes, illustrating a primary approach, to resort to the
conjugation between social time, the organization of transportation modes, and temporal
attitudes”1. Measuring transportation time is indeed necessary, for example, for the
articulation of monetary costs, in order to better understand mobility behavior or improve our
comprehension of urban dynamics. At the same time, certain challenges and limits often
appear within quantitative operations, which could be complimented by qualitative
dimensions.
From an economic perspective of transportation, the study of transportation time
constitutes a vital tool for the comprehension of mobility behavior with its relationship to a
trip’s finality, or the activities at the destination. This provides our initial point that
demonstrates a greater issue regarding the creation of daily agendas, which appears all more
complex in the current context of “deregulating” social and individual time. Our mobility
analysis first concentrates on transportation time and individual characteristics, then
progresses to related dimensions, such as activities performed at a destination, residential
location, and possible reallocation of transportation time.
Alternatively, the sociological perspective of transportation time attempts to understand
the individual reasons, both intentional and inadvertent, that influence a person to assimilate a
grand portion of time to mobility. This section particularly targets persons possessing high
travel-time budgets (TTB) to identify their opinions on their respective travel time and the
influential factors that condition their perceptions and choices. In this perspective, individuals
not only organize their travel time according to the activities at a destination, but also to
certain supplemental aspects. These are not related to the trip itself, but rather the individual
1 p. 13 from Montulet B., (2005).

6
and their past mobility history, culture, convictions, etc. Research has previously evoked how
an individual formulates their unique mobility through experiences and cognitive allocation of
transportation (Kaufmann and Flamm, 2006). Choices are therefore not made purely on the
satisfaction of a specific need, but take into consideration attitudes and personal attributes
(Redmond and Mokhtarian, 2001).
This double approach attempts to go beyond the usual conceptions of transportation time,
especially from certain economists that strictly relate mobility to monetary costs. The
management of the temporal resource implies complex behavior, since transportation time is
the center of numerous interactions between individual and social choices. This unique role
of transportation time integrates the individual within a space filled with opportunities in
multiple urban contexts. Consequently, managing mobility progressively appears to not be
simply reduced to monetary or temporal costs, independent from other dimensions.
The objective of this article is to explore mobility that implies an atypical organization of
the temporal resource. A sociological and econometric analysis is therefore proposed to
comprehend the influential factors that cause certain individuals to accept their particularly
high TTB. The quantitative approach is based on mobility studies of seven Swiss and French
agglomerations, while the qualitative section uses interviews of individuals working or
residing the Leman basin that possess high TTB.
After a general presentation of mobility and urban contexts of the chosen agglomerations
(section 1), the article will present the implemented sociological and econometric
methodologies (section 2). Section 3 will then present the results that aim to consolidate the
findings of the two methodologies. Finally, the last section (section 4) will restate the
complementarities in terms of results and methods, in order to highlight potential
contributions identified between the two disciplinary fields.
2. Urban contexts and mobility disparities
2.1 Section 1 – Urban contexts and differentiated mobility
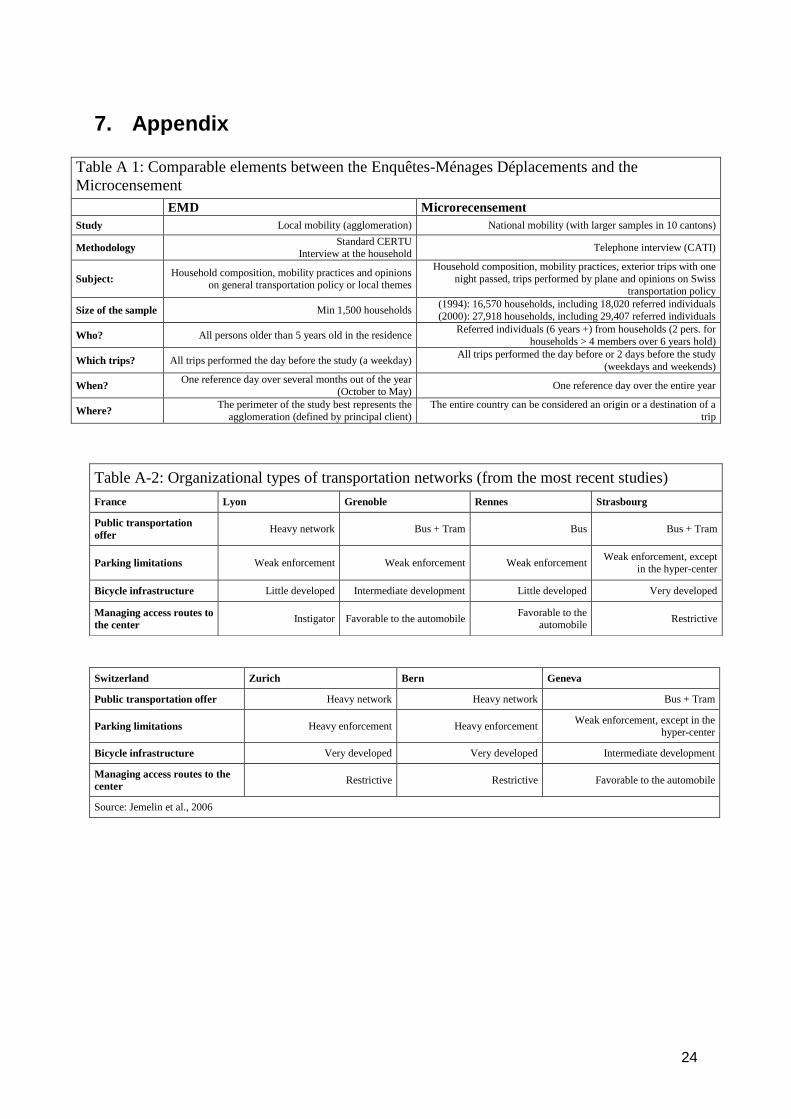
The following is based on mobility studies conducted in France and Switzerland2, with
our respective study concentrating on seven agglomerations: Bern (1994 and 2000), Geneva
(1994 and 2000), Grenoble (1992 and 2001), Lyon (1985 and 1995), Rennes (1991 and 2000),
Strasbourg (1988 and 1997), and Zurich (1994 and 2000). Large-scale studies are regularly
2 Specifically, the studies are the Enquêtes-Ménages-Déplacements in France and the Microrecensement in
Switzerland.
7
performed, allowing the study of two consecutive dates and possible transformations in
mobility practices for each city. The data available for each city offers several advantages,
such as the contemporaneity of the studied periods and the convergence of objectives and
study methodologies. Consequently, the databases constitute an adapted tool to study
mobility at both aggregated and disaggregated levels (see table A-1 in the appendix).
As expected, certain adjustments are necessary for our respective study on urban
mobility. A methodology comparing different databases induces and comprises of several
limitations and inaccuracies. The treatment and homogenization of information necessitates
the choice of certain constraints, yet the information used here principally remains at a
comparable level of traditional mobility analyses.
The observed mobility analyses of various urban contexts permit an identification of
certain conditions that differentiate mobility forms. The choice of the cities was performed
while taking into account availability constraints and the following criteria:
The form and dispersion of the suburbanization process
The level of development for the network of heavy public transportation modes
The urban and transportation policies that target the organization of city center
accessibility
The transportation systems and policies of the Swiss agglomerations are principally
oriented towards public transportation and walking. Contrarily, in the French cities,
transportation policies, such as automobile restriction and parking limitations in city centers,
have only recently appeared compared to Swiss city policies (see table A-2 in the appendix).
Table 1 illustrates the means of TTB and the number of displacements per individual
in each agglomeration. The study of the means reveals that the TTB per individual in French
cities, around 70 minutes, is less than the estimated 80 minutes in Swiss ones.
However, the analyses of the TTB distribution for each city (table A-3 in the
appendix), shown through the results of the duration models, illustrate the asymmetric
distribution of TTB. Consequently, there exists an abnormality within the mean estimation,
resulting in an overestimation of the TTB mean for all cities.
In cases of asymmetric distributions, the median also represents this tendency,
regardless of its responsiveness to rounding. The TTB median is 60 minutes for French cities
and 65 minutes for Swiss ones. Since the median is less sensitive to extreme values of the
distribution, the separation of TTB between the two countries is reduced. The distribution

8
quartiles indicate that the large separation between the average Swiss and French TTB is
partially due to the overrepresentation of the population characterized by particularly high
TTB in Swiss cities. Moreover, an observable effect on agglomeration size is apparent by
comparing the TTB levels of Rennes with Zurich or Lyon. The relative proximity of TTB
medians strongly reduces the separation of TTB between these agglomerations. With the
exception of Rennes and its lower median at 50-55 minutes, the majority of individuals in all
the agglomerations do not have a TTB that exceeds 60-70 minutes. Finally, the TTB median
difference between the two dates for each city is around 5 minutes. Accordingly, the TTB is
characterized between the two dates by an increase in both Swiss and French cities.
Table 1: Mean and median of travel time budgets and number of daily trips
French cities
TTB N
City Mean Median Mean Median
Grenoble 1992 67.20 55 4.26 4
Grenoble 2001 78.92 65 4.72 4
Lyon 1985 67.79 60 4.04 4
Lyon 1995 78.44 65 4.26 4
Rennes 1991 57.44 50 4.04 4
Rennes 2000 70.91 55 4.25 4
Strasbourg 1988 69.94 60 4.67 4
Strasbourg 1997 78.90 65 4.96 4
Swiss cities
TTB N
City Mean Median Mean Median
Bern 1994 74.13 60 3.78 4
Bern 2000 85.41 69 4.05 4
Geneva 1994 83.41 60 3.96 4
Geneva 2000 84.06 65 4.22 4
Zurich 1994 82.11 65 3.75 4
Zurich 2000 87.35 70 3.96 4
Source: Enquêtes-Ménages-Déplacements and the Microrecensement
For each city, the increase in average TTB is notably the result of an increase in
persons with particularly high travel times of over 100 minutes. Figure 1 shows the increase
of the number of people with over 100 minutes of daily travel time between the two
observable dates.

9
Figure 1: Percentage of persons with TTB over 100 minutes
16%17%
11%
17%
27%
29%30%
23%22%
17%
23%
36%35%
38%
0%
5%
10%
15%
20%
25%
30%
35%
40%
Grenoble Lyon Rennes Strasbourg Bern Geneva Zurich
Date 1
Date 2
Source: Enquêtes-Ménages-Déplacements and the Microrecensement
As the results of the duration models show, these individuals with extremely high
daily travel times, or “intense commuters”, do not necessarily distinguish themselves from the
rest of the population by classic socio-economic characteristics or their mobility attributes.
Therefore, the objective of implementing two methodologies is to first clarify this
phenomenon with the use of statistical data, then the use of sociological means, in order to
illustrate the attributes of these intense commuters. The application of an econometric model
on all the chosen cities allows the proposal of conclusions relative to intense commuters and
their atypical organization of the temporal resource allocated to transportation. Conversely,
in-depth interviews propose unique explanations regarding the behavior of intense
commuters. They not only validate sociologically certain econometric results, but also
exemplify certain limits of the quantitative approach.

10
3. Methodologies3
Two different methodologies were incorporated to understand the behavior of intense
commuters. The disaggregated analysis of displacement durations integrates the econometric
tool of duration models, while the sociological aspect utilizes in-depth interviews.
3.1 The duration model applied to travel-time budgets
The duration model aims to produce an analysis of daily transportation durations.
Models such as these are frequently used to analyze activity durations, but their application
strictly refers to non-transportation activities. Two types of results are expected from its
implementation:
1. The demonstration of influential variables through the use of personal and
household socio-economic characteristics, residential location, and certain
attributes on activity and mobility programs. This should clearly illustrate the
relationships between TBB and certain variables.
2. The identification and description of the temporal dynamic that partially
dictates the organizational processes of daily travel time. This temporal
dynamic is analyzed through the variation of apparent effects as the TTB
gradually increases. As in the analysis of activity durations, a temporal
dynamic specific to daily travel time can be identified. Its description will
indicate the rhythm and possible cycles that characterize daily travel time
through the course of the day.
3.2 In-depth interviews of intense commuters
The qualitative research targets individuals with high TBB, in order to understand the
perceptions and experiences of travel time. A general TBB of 100 minutes was set to
establish persons that were considered intense commuters. Certain additional criteria were
imposed in the selection process:
The individual works or lives in the Leman basin.
The individual works or goes to school at least three times during the week.
3 Refer to the appendix for more precise information on the two methodologies.
11
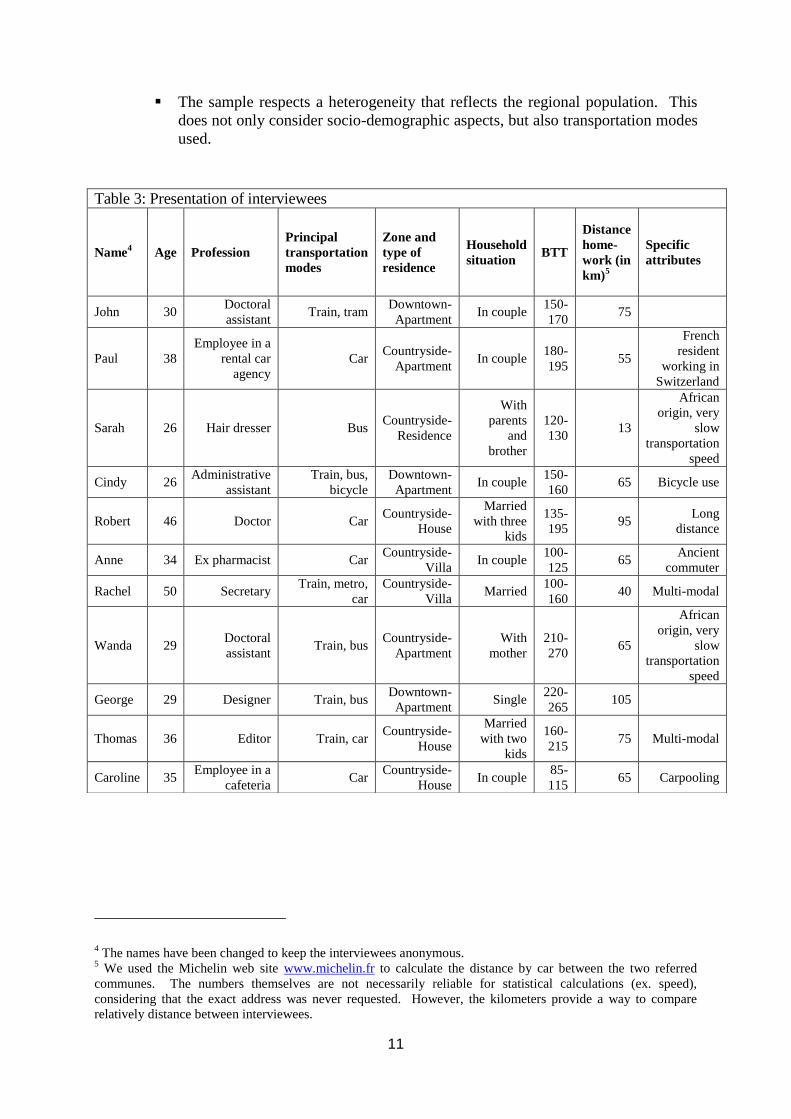
The sample respects a heterogeneity that reflects the regional population. This
does not only consider socio-demographic aspects, but also transportation modes
used.
4 The names have been changed to keep the interviewees anonymous.
5 We used the Michelin web site www.michelin.fr to calculate the distance by car between the two referred
communes. The numbers themselves are not necessarily reliable for statistical calculations (ex. speed),
considering that the exact address was never requested. However, the kilometers provide a way to compare
relatively distance between interviewees.
Table 3: Presentation of interviewees
Name4 Age Profession
Principal
transportation
modes
Zone and
type of
residence
Household
situation BTT
Distance
home-
work (in
km)5
Specific
attributes
John 30 Doctoral
assistant Train, tram
Downtown-
Apartment In couple
150-
170 75
Paul 38
Employee in a
rental car
agency
Car Countryside-
Apartment In couple
180-
195 55
French
resident
working in
Switzerland
Sarah 26 Hair dresser Bus Countryside-
Residence
With
parents
and
brother
120-
130 13
African
origin, very
slow
transportation
speed
Cindy 26 Administrative
assistant
Train, bus,
bicycle
Downtown-
Apartment In couple
150-
160 65 Bicycle use
Robert 46 Doctor Car Countryside-
House
Married
with three
kids
135-
195 95
Long
distance
Anne 34 Ex pharmacist Car Countryside-
Villa In couple
100-
125 65
Ancient
commuter
Rachel 50 Secretary Train, metro,
car
Countryside-
Villa Married
100-
160 40 Multi-modal
Wanda 29 Doctoral
assistant Train, bus
Countryside-
Apartment
With
mother
210-
270 65
African
origin, very
slow
transportation
speed
George 29 Designer Train, bus Downtown-
Apartment Single
220-
265 105
Thomas 36 Editor Train, car Countryside-
House
Married
with two
kids
160-
215 75 Multi-modal
Caroline 35 Employee in a
cafeteria Car
Countryside-
House In couple
85-
115 65 Carpooling

12
4. Comparative results
Two types of results are shown through the use of the two different methodologies:
A. An atypical organization of transportation times
The first result from the duration models of intense commuters is made by the non-
parametric estimation of TTB distributions. The form of the estimated hazard function is
non-monotone and similar for each city6. The conditional probability of the time passed of an
interruption in transportation time allocation first increases until 120 minutes, then decreases
after 120 minutes.
The interpretation of this non-monotone property of the estimated hazard function
becomes relevant when considering the estimated residual survival median (figure 2), or the
transportation time remaining or residual according to the time already devoted to mobility.
The non-monotone, estimated hazard derives from a residual transportation time that first
decreases, then increases. Therefore, according to the estimated hazard for Lyon 1995, during
the process of transportation time allocation, an individual that has already passed 30 minutes
of transportation time has “on average” a remaining transportation time of around 45 minutes.
Accordingly, a person with 60 minutes of transportation time generally still has 30 minutes
remaining.
In an intuitive sense, an individual has a remaining transportation time that decreases
from the beginning of the temporal process, which appears coherent with the hypothesis of
the behavioral reduction of transportation time (from lassitude or saturation of preferences).
However, once greater than 100 minutes, the hazard trend is opposite and the remaining time
increases. In other words, individuals tend to devote greater supplemental time to
transportation after 100 minutes. The resistance to allocate greater time for travel appears to
reduce after 100 minutes. Accordingly, the estimated hazard and residual survival median
level suggests a transition in travel time allocation behavior for a population group with a
TTB of around 100 minutes.
6 Joly et al. (2006) explain this result of the hazard curve, confirmed by the interval curves with a 95%
confidence indicator.

13
Figure 2: Travel time budgets of the estimated residual median in minutes
Source: EMD Lyon 1995
The non-monotone nature could be the result of the non-integration of an important
explicative dimension. Conversely, the parametric analysis of the model, presented in the
following section, was constructed to introduce individual and household characteristics while
testing the different hazard forms. The performed tests that integrated individual attributes
validated the non-monotone nature of the hazard (table 3). Therefore, this could not derive
from an unobserved heterogeneity or non-described elements in the data.
This hazard form contradicts the simplistic economic vision that the reduction of
transportation time, with monetary costs, would be an optimization condition of mobility. In
contrast, the econometric result illustrates a mechanism less direct. Other dimensions appear
to be integrated, which does not represent time allocation behavior by means of travel time
reduction. The change of the estimated hazard form indicates the existence of two phases in
the allocation process of travel time. Intuitively, the increasing conditional probability to
interrupt the process refers to the behavioral reduction of the temporal use of mobility. The
change in the tendency would indicate an irregularity in the mechanism, almost as though
certain individuals cannot, or choose not to reduce their travel times after a certain level.
Those with TTB above 100 minutes may be faced with situations and constraints that do not
allow them to easily reduce their travel time, or quite simply their behavior cannot be
represented by a simplification of temporal use.
14
The acquired non-monotone hazard refers to the economic notion of generalized cost.
This illustrates that the economic objective of an individual is to not reduce each cost, but
rather reduce their integral sum. This concept integrates the possibility to reduce one cost to
the detriment of another.
Personal factors could partially explain this phenomenon in the mobility behavior of
intense commuters. An individual constructs their unique mobility plan with the factors
related to the trip (ex. financial costs, speed, duration) and complementary specific elements,
such as environmental protection, personal space, past history, etc. (Flamm, 2003).
Accordingly, in the analysis of intense commuters, subjective elements that are not associated
with the trip must be taken into account.
The analysis of the in-depth interviews suggests that other dimensions, in addition to
monetary or temporal constraints, could influence the allocation of travel time. Generally,
each individual creates arbitration between travel time and a combination of additional
elements (residential location, modal choice, etc.). Intense commuters distinguish themselves
in their time allocation behavior, due to the lack of optimizing the temporal resource.
However, the difficulty is to test explicative dimensions of these atypical time
allocation behaviors. The second series of results compares quantitative and qualitative
results, in order to deduct similarities or divergences of interpretation.
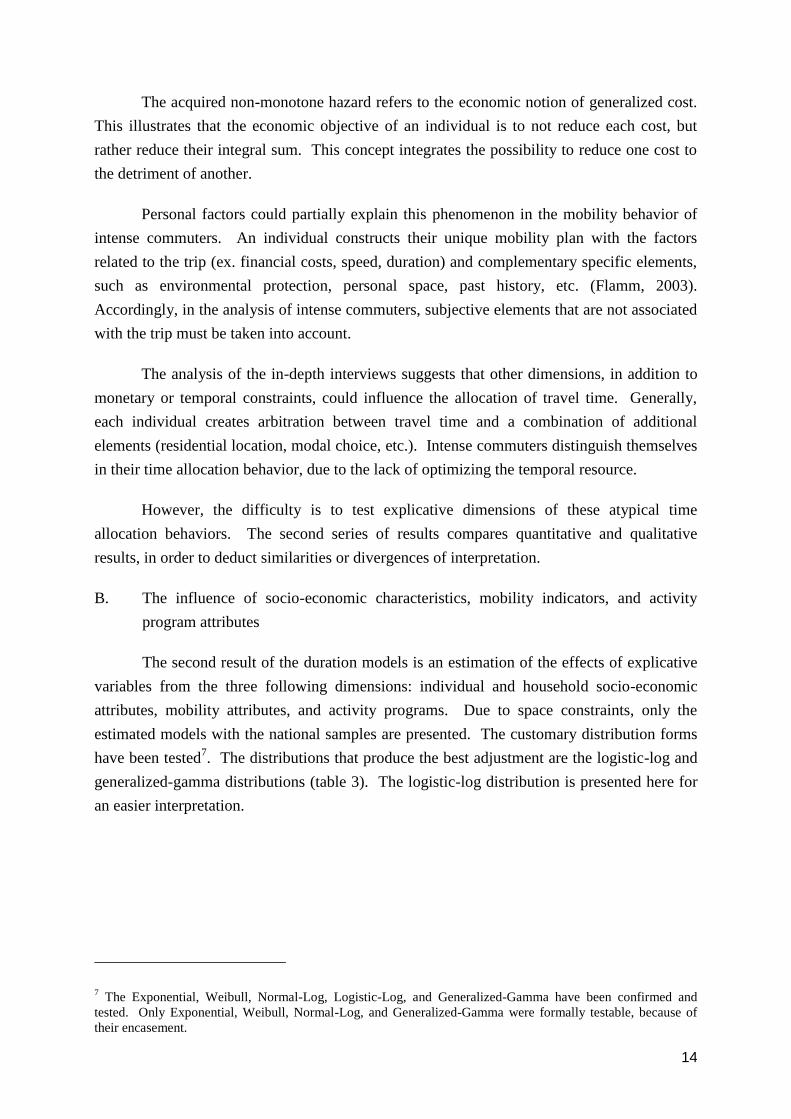
B. The influence of socio-economic characteristics, mobility indicators, and activity
program attributes
The second result of the duration models is an estimation of the effects of explicative
variables from the three following dimensions: individual and household socio-economic
attributes, mobility attributes, and activity programs. Due to space constraints, only the
estimated models with the national samples are presented. The customary distribution forms
have been tested7. The distributions that produce the best adjustment are the logistic-log and
generalized-gamma distributions (table 3). The logistic-log distribution is presented here for
an easier interpretation.
7 The Exponential, Weibull, Normal-Log, Logistic-Log, and Generalized-Gamma have been confirmed and
tested. Only Exponential, Weibull, Normal-Log, and Generalized-Gamma were formally testable, because of
their encasement.

15
Table 3: Probabilities and ratio tests of probabilities of a priori distributions
Distribution Log probability
Swiss Sample French Sample
Weibull -9587,08 -54824,51
Normal Log -9310,61 -51999,94
Generalized Gamma -9269,36 -51858,53
LogLogistic -9164,85 -51648,07
Model 1 vs Model 2 Test Statistic
Swiss Sample French Sample
Weibull vs GG 635,44 *** 5931,96 ***
Log N vs GG 82,5 *** 282,82 ***
Table 4 indicates the effects of explicative variables on TTB. The estimated
coefficients are interpreted after an exponential transformation, such as the travel time
quotient of individuals characterized by the variable and the travel time of other individuals.
For example, the associated coefficient of the professional activity variable is 0.114. The
variable is therefore significant at over 99%, which has a positive effect on TTB. More
precisely, a worker has an average TTB that is estimated at 12% greater than a person
unemployed (e0,114
= 1,12). From the econometric model, the different influential elements in
travel time allocation are discussed simultaneously with the results from the sociological
analysis.

16
Table 4: Parametric log-logistic models for the two national samples French sample Swiss sample
Variables Exp Exp
Constant 43,250 *** 49,452 ***
Travel time budget 1,000 *** 1,000 ***
Shopping time budget 1,002 *** 1,001 ***
Leisure time budget 1,001 *** 1,001 ***
Male 1,097 *** 0,940
Active 1,121 *** 0,993
Center 1,046 *** 0,925 ***
Suburban 1,009 0,933 ***
Monday 0,911 *** 0,888 ***
Tuesday 0,962 *** 0,954 *
Wednesday 0,943 *** 0,893 ***
Couples without children 1,016 0,973
Couples with 1 child 0,936 * 1,111
Couples 2 children 0,927 ** 1,120
Couples 3 or more children 0,986 1,026
Single male without children 0,865 *** 1,218 **
Single male with one child 0,985 1,183 *
Single female without children 0,934 * 1,074
Single female with one child 0,968 1,055
Age < 19 1,014 1,726 ***
18 < Age < 35 1,292 *** 1,181 ***
34 < Age < 50 1,172 *** 1,176 ***
49 < Age < 65 1,112 *** 1,161 ***
Driver’s license 1,061 *** 1,019
High revenue 0,985
Low revenue 0,977
No motorized transportation 1,052 1,022
1 private vehicle 1,045 0,952
2 PV 1,054 0,962
3 PV 1,065 1,027
Bern 94 0,793 ***
Bern 00 0,967
Geneva 00 0,953 *
Geneva 94 0,842 ***
Zurich 94 0,858 ***
Grenoble 01 0,997
Grenoble 92 0,872 ***
Lyon 85 0,924 ***
Lyon 95 1,051 ***
Rennes 00 0,867 ***
Rennes 91 0,796 ***
Strasbourg 88 0,919 ***
Dependant coefficient
Log Probability
These different elements in transport time allocation, from the econometric model, are
discussed at once with the results from the sociological analysis.

17
4.1 Weekly regularity
By retaining the hypothesis that TTB are partially influenced by the activities at a
destination, the multiplicity of these activities, according to the day during the week, would
increase or decrease the travel time. Essentially, the two methodologies show the differences
of TTB in relation to the day of the week, which forms certain regularity in the long term and
creates a weekly cycle.
During the week, many of the interviewees have an increase in their TTB once or
twice a week, due to activities outside the workplace. Frequently, these activities are
premeditated and performed on precise days. For example, John increases his TTB by 20
minutes two times per week for soccer practice. After 50 minutes of travel by train, Thomas
drives 40-50 minutes once a week for band rehearsal. Anne also adds 10 minutes of travel to
drop off and pick up her laundry two times a week.
In addition, the notion of opportunity transportation cost is perceived within the
interviews. The intense commuters often see their “free time” for other activities clearly
reduced. The constraint of “increased scarcity” with time consequently modifies certain
mobility aspects. The first effect relates to the difficulty of returning back home when
supplemental and occasional activities are planned. These supplemental trips are therefore
frequently linked with regular ones to gain time for activities. This also influences the choice
of transportation modes. For example, instead of habitually taking the train to go to work,
Rachel changes transportation modes and travels by car when she has other activities planned
at Lausanne after work, often for plays and musicals.
Another observation is shown through the influence of planning one’s mobility for
other days of the week. John and Thomas, for example, must leave work early to attend their
soccer and band meetings. They then must recuperate the hours lost by working more on the
other days of the week. In this case, secondary activities can even influence TTB for the
entire week.
These daily variations are observed in numerous quantitative studies8. The daily cycle
of a TTB model commonly shows an increase from Monday to Friday. In general, the
analyses of TTB in the seven agglomerations also produce this same daily cycle.
8 Van der Hoorn (1979), Zahavi and Talvitie (1980), Prendregast and Williams (1981), Kumar and Levinson
(1995), Quetelard (1998)
18
4.2 Urban and individual contexts
Two types of contextual dimensions have been identified that can have an influence on
mobility practices and TTB. First, the urban context constitutes a framework where daily
activities are performed. Individual contexts then play a role in mobility behavior, via the
combination of personal, household, and professional spheres.
Generally, the effects of urban spaces produce ambiguous results among the studied
cities. Size and density factors are sometimes contradictory. Joly (2005) presents a rapid
overview of literature of these effects of the urban context. Most often, an inconsistency
between two urban systems appears between spread-out and dispersed cities, depending on
transportation systems that favor automobile use, and concentrated ones that possess a greater
equilibrium among transportation modes. These correspond to two principal profiles, with
French cities commonly characterized by higher TTB in the city center, while lower TTB
levels in Swiss cities.
The qualitative interviews clearly confirm this behavioral change, consistent with
urban contexts and lifestyle, with both dimensions being influential. Compared with the three
interviewees from the city center, individuals residing in the country are noticeably more
stable and oriented towards family life. They also often live with several other people.
According to their testimony, they sacrifice a part of their daily time for the advantages of the
countryside, not only for themselves, but also for the other people in the household (ex. green
and secure areas for children). Arbitration exists between several dimensions, such as
mobility costs (temporal and monetary), residential location and land price, access to property
ownership (Orfeuil and Polacchini, 1999), lifestyle changes (Cao and Mokhtarian, 2005), and
even personal situations of each member of the household (Flamm, 2004).
Contrarily, the three interviewees of the city center prefer the lifestyle of those in the
countryside, yet subsidiary factors restrain them to downtown areas. For example, George
desires to live in the countryside, but he does not have enough money to buy a car. John and
Cindy believe that their lives are too unstable for the moment, since their professional
position is temporary and precarious. In the future, these individuals could presumably look
for a certain lifestyle (ex. life in the countryside, car, family, etc.) after stabilization in their
professional careers, without necessarily attempting to reduce their travel time.
The results presented in table 4 partially illustrate these lifestyle effects, but they are
generally very difficult to quantify. Age, the number of children, household structure, or zone
of residential location are indicators used to assess lifestyle cycles and modes. Frequently,
these attributes of travel time are different according to the level of responsibility of the
members of the household, professional status, or the type of residence.

19
However, cultural influences are difficult to measure quantitatively, yet emerge in the
interviews. Two interviewees noted that their decision to stay at their current residential
location was based on family reasons, resulting in a weak accessibility to public transportation
and a high TTB compared to the distance covered. Both are 30-year old women, dependant
of their parents, and are strongly engaged in daily family affairs. When asked about the
reasons for their acceptance of a high TTB, they believe that their choice is greatly influenced
by their African culture that promotes daily interaction with family members. Consequently,
traditional indicators to indicate lifestyle, such as age or professional position, have a difficult
time to grasp the mobility behavior of individuals strongly influenced by cultural or familial
aspects at greater scales.
4.3 The allocation of travel time
Travel time is not solely used to physically move from an origin to a destination.
Activities can also be performed during the trip. Several questions were asked in the
interviews to first identify the activities during these trips, then understand the perceptions
and experiences of the trip through the use of these activities.
Generally, public transportation users have a greater variety of activities than
automobilists. All interviewees using public transportation read, work, sleep, socialize with
others, or listen to music. Contrarily, automobilists are limited to listening to music or talking
on the phone. In most cases, the interviewees believe that they partially take advantage of the
travel time by simultaneously performing other activities.
However, according to all those interviewed, travel time is nevertheless considered to
be time “lost”. To a degree, activities help to compensate for the lack of free time, but all
interviewees recognize that they could do more activities and be more efficient if they were
not traveling at the same time. For example, certain interviewees have problems working in
the train, due to crowds or the short travel time. Others are too tired for their return trip and
are only productive in the morning. For automobilists interviewed, the concentration needed
for highway travel prohibits them from completely taking advantage of the travel time.
Frequently, this incomplete compensation for travel time is nonetheless valorized in a
different manner when an individual uses the travel time to escape from pressure or stressful
situations. For instance, Caroline listens to the news or music on the radio when she drives
and the activities only partially aid in compensating for lost time. However, instead of
activities, her passion for driving makes the commuter trips pleasurable. Robert, on the
contrary, takes advantage of his travel time differently. He listens to CDs disliked by his
family in his car. The CDs improve his musical knowledge, which creates a personal space
outside social obligations. Lastly, Thomas takes advantage of his time in the train to be away

20
from his children. According to the interviewee, his children are young and require a lot of
attention. The travel time on the train allows him to relax without the worries of familial
responsibilities. In all these examples, the trip not only represents physical travel, but also a
change in mental state.
For the interviewees, the sentiment of lost time in travel is correlated to the execution
of other activities during the trip and the quality of these activities. On the other hand, in the
case of intense commuters, these activities do not appear to completely compensate for the
lack of free time. This mechanism of “reallocating” travel time provides a supplemental
dimension to the trip beyond simple physical movement. To understand the choices behind
transportation, notably the choice in transportation modes, these behavioral notions must be
taken into consideration. In this perspective, the trip cannot be perceived as a simple function
of monetary and temporal cost. In effect, an individual can take advantage of travel time to
do other activities, which is clearly an issue for intense commuters.
To restate the hypothesis of Mokhtarian and Salomon (2001), the utility of
transportation can derive from three sources: the utility at the destination, the intrinsic utility
of the trip, and the utility of the activities performed during the trip. The role of
transportation is not simply attributed to an activity. The conception of travel time is not
perceived merely as a cost (or a component of a generalized cost), but as interstitial time
considered an activity in itself, a period of time devoted to execute another activity, and
naturally the required time to reach a destination. Transportation is therefore an activity with
an intermediary role between an obligated and discretionary activity.
4.4 Personal convictions
Individual convictions emerge as an important role in transportation behavior, notably
in the choice of transportation mode. This is clearly illustrated in two individuals that are
multi-modal. Rachel and Thomas first drive 10 to 15 minutes to a train station, then continue
the rest of the trip by train.
According to the interviewees, the bad public transportation accessibility in their
villages forces them to do part of the trip by car. Both enjoy the tranquility of the countryside
and live in houses outside the city. However, their past transportation experiences were
exclusively with public transportation to commute to work. Neither owned a car before
buying their house, because their prior apartments were always located in areas with dense
public transportation networks. They both consider the car “dangerous” and “bad for the
environment”, while public transportation represents a “calm” and “tranquil” atmosphere.

21
The part of the trip by car is perceived as an obligation for the two interviewees. They
voluntarily sacrifice more of their spare time in their trip with the use of public transportation.
Their reasons, however, are not uniquely related to a better quality of life in the countryside,
but also other personal convictions and preferences. Therefore, in these instances, certain
individual inclinations influence a person to use public transportation, regardless of a possible
increase in temporal or monetary costs compared to the automobile.
5. Conclusion
Beyond the results or trends proposed by the interviews, the mobilization of the two
methods illustrates the complementarities of both approaches and perceptions. Frequently,
the weakness of one method is compensated by the dynamics of the other. The will to
modulate and synthesize, with the supplemental contribution to explain in detail, are perfectly
harmonizing and necessary for one another.
Our study attempts to demonstrate a mixed method, by mobilizing two tools that
address the same subject. This work shows certain complementarities for mixed methods
(Tucci, 2006):
1. The approach by using qualitative interviews aids to identify unobserved
heterogeneities within data and proposes other variables to explain them.
2. The results of a mixed approach can contribute by explaining previously
misunderstood statistical results.
3. Qualitative research can help discover problems in the definitions and measures of
quantitative instruments.
4. The quantitative approach can be used to examine the extent of results from a
qualitative study and provide support for their generalizations.
The disaggregated model identifies a certain number of influential factors in the
durations of daily travel, such as individual and household socio-demographic
characteristics, mobility attributes, and residential localizations. Conjointly, the estimation
by the duration models illustrates the particularity found at an individual level with regards
to transportation time management. Indeed, a significant part of our samples (around 20%)
are characterized by high TTB, which paradoxically counters typical tendencies of
increasing TTB. Despite the integration of certain explicative variables, the qualitative
results compliment the quantitative study. The interviews provide a reminder that multiple
dimensions interact and/or determine mobility behavior. Together, the two methods show
that this specific population with high TTB may not wish, or have a harder capacity to

22
reduce their travel time, proving that other dimensions must be integrated in interpreting
TTB besides temporal and monetary costs.
Therefore, by using a mixed method, this research on TTB demonstrates that one
methodology is not necessarily independent from another. The mutual implementation of
two methods permitted to surpass their respective limits by questioning and developing
them together.
Acknowledgements
This article is based on a study conducted through a PREDIT study on “Questioning
the Increase of Travel Time Budgets: New Approaches”.

23
6. References
ALLISON P.D., (1995), Survival analysis using SAS – A practical guide, Cary, SAS
Publishing, p. 292.
ARE, OFS, (2001), La mobilité en Suisse: Résultats du microrecensement 2000 sur le
comportement de la population en matière de transports, Office federal du développement
territorial.
CERTU, (2002), La mobilité urbaine en France : Les années 90, éditions du CERTU, Lyon.
FLAMM M. et V. KAUFMANN, (2006), « Operationalising the Concept of Motility: A
Qualitative Study », Mobilities, Vol. 1, No. 2, pp. 167-189
FLAMM M., (2004), Comprendre le choix modal. Les déterminants des pratiques modales et
des représentations individuelles des moyens de transport, Thèse n°2897, Lausanne : EPFL.
Dir.: Michel Bassand.
HENSHER D. et F. MANNERING, (1994), « Hazard-based duration models and their application
to transport analysis », Transportation Reviews, 14(1), p. 63-82.
HOSMER D.W. et S. LEMESHOW, (1999), Applied survival analysis, New York, John WILEY et
Sons, p. 386.
HUPKES G., (1982), « The law of constant travel time and trip-rates », Futures, Février, p. 38-
46.
JOLY I., K. LITTLEJOHN et V. KAUFMANN., (2006), La croissance des budget-temps de
transport en question : Nouvelles approches, Rapport PREDIT - Groupe opérationnel no. 1,
232 p.
JOLY I., (2005), L’allocation du temps au transport - De l’observation internationale des
budgets-temps de transport aux modèles de durées, thèse, Université Lumière Lyon 2, 489 p.
KALBFLEISCH J.D. et R.L. PRENTICE, (1980), The statistical analysis of failure time data, New
York, John WILEY et Sons, 439 p.
LAWLESS J.F., (2003), Statistical models and methods for lifetime data, New York, John
WILEY et Sons, 630 p.
MOKHTARIAN P.L. et I. SALOMON, (2001), « How derived is the demand for travel? Some
conceptual and measurement considerations », Transportation Research Part A, 35(8), p.
695-719.
MONTULET B., (2005), Introduction, in « Mobilités et temporalités », dir. B. MONTULET, M.
HUBERT, C. JEMELIN et S. SCHMITZ, Travaux et Recherches, Publications des Facultés
universitaires Saint Louis, Bruxelles, p. 13-18.
MORITA J.G., T.W. LEE et R.T. MOWDAY, (1993), « The regression-analog to survival
analysis : a selected application to turnover research », The Academy of Management Journal,
36(6), p. 1430-1464.
ORFEUIL J.P. et A. POLACCHINI, (1999), « Les dépenses pour le logement et pour les
transports des ménages franciliens », RTS n. 63
REDMOND L. et P.L. MOKHTARIAN, (2001), Modeling Objective Mobility : The Impact of
Travel-Related Attitudes, Personality and Lifestyle on Distance Traveled, eScholarship
Repository, University of California,
TUCCI G., (2006), « Mixed Methods and simulation research designs », International Journal
of Transport Economics, vol.XXXIII, 3, p. 301-311.
24
7. Appendix
Table A 1: Comparable elements between the Enquêtes-Ménages Déplacements and the
Microcensement
EMD Microrecensement
Study Local mobility (agglomeration) National mobility (with larger samples in 10 cantons)
Methodology Standard CERTU
Interview at the household Telephone interview (CATI)
Subject: Household composition, mobility practices and opinions
on general transportation policy or local themes
Household composition, mobility practices, exterior trips with one
night passed, trips performed by plane and opinions on Swiss
transportation policy
Size of the sample Min 1,500 households (1994): 16,570 households, including 18,020 referred individuals
(2000): 27,918 households, including 29,407 referred individuals
Who? All persons older than 5 years old in the residence Referred individuals (6 years +) from households (2 pers. for
households > 4 members over 6 years hold)
Which trips? All trips performed the day before the study (a weekday) All trips performed the day before or 2 days before the study
(weekdays and weekends)
When? One reference day over several months out of the year
(October to May) One reference day over the entire year
Where? The perimeter of the study best represents the
agglomeration (defined by principal client)
The entire country can be considered an origin or a destination of a
trip
Table A-2: Organizational types of transportation networks (from the most recent studies)
France Lyon Grenoble Rennes Strasbourg
Public transportation
offer Heavy network Bus + Tram Bus Bus + Tram
Parking limitations Weak enforcement Weak enforcement Weak enforcement Weak enforcement, except
in the hyper-center
Bicycle infrastructure Little developed Intermediate development Little developed Very developed
Managing access routes to
the center Instigator Favorable to the automobile
Favorable to the automobile
Restrictive
Switzerland Zurich Bern Geneva
Public transportation offer Heavy network Heavy network Bus + Tram
Parking limitations Heavy enforcement Heavy enforcement Weak enforcement, except in the
hyper-center
Bicycle infrastructure Very developed Very developed Intermediate development
Managing access routes to the
center Restrictive Restrictive Favorable to the automobile
Source: Jemelin et al., 2006

25
Table A-3: Indicators of TTB distributions
BTT
Ville Mean CV Q1 Median Q3
Grenoble 1992 67.20 78.32 35.00 55.00 85.00
Grenoble 2001 78.92 81.43 40.00 65.00 100.00
Lyon 1985 67.79 73.41 35.00 60.00 90.00
Lyon 1995 78.44 76.44 40.00 65.00 100.00
Rennes 1991 57.44 72.27 30.00 50.00 75.00
Rennes 2000 70.91 97.00 35.00 55.00 85.00
Strasbourg 1988 69.94 77.80 35.00 60.00 90.00
Strasbourg 1997 78.90 79.27 40.00 65.00 100.00
Bern 1994 74.13 90.27 31.00 60.00 94.00
Bern 2000 85.41 88.21 39.00 69.00 110.00
Geneva 1994 83.41 102.07 39.00 60.00 100.00
Geneva 2000 84.06 90.82 38.00 65.00 108.00
Zurich 1994 82.11 99.72 34.00 65.00 102.00
Zurich 2000 87.35 84.80 40.00 70.00 114.00
7.1 Duration models9
1. Particularities of duration data
The character of duration data10
imposes a certain number of restrictions on the usable
model types. The major problem of applying classic models to duration data is the normality
hypothesis of duration distribution, which is rarely observable. The linear regression is
therefore not vigorous when contradicting the normality hypothesis. In addition, the
statistical inference properties of the estimators are not valid without the normality hypothesis
of the residuals.
2. Modeling the conditional probability of interruption
9 For supplemental notions of other estimation duration methods, refer to Kalbfleich and Prentice (1980), Allison
(1995), Hosmer and Lemeshow (1999), or Lawless (2003).
10 The first particularity of the duration data shows that they are positive variables. In addition, despite not being
the focus of this study, they could be reproached and characterized by explicative variables that change over
time.
26
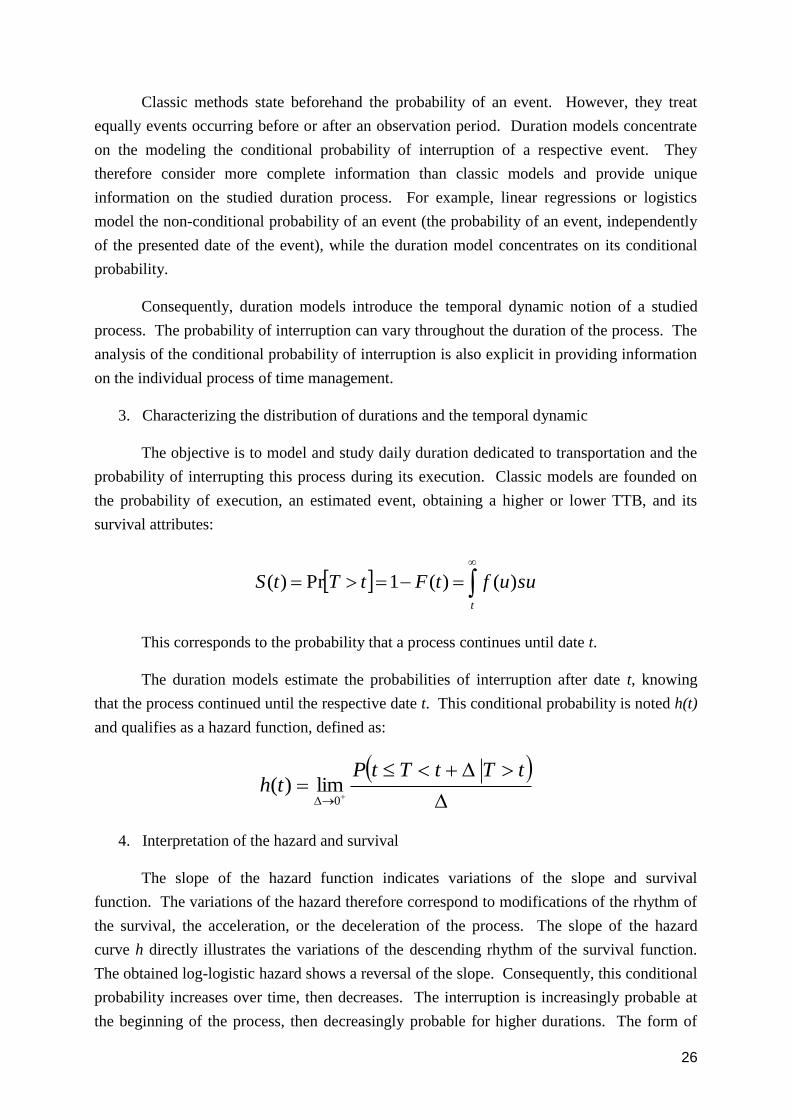
Classic methods state beforehand the probability of an event. However, they treat
equally events occurring before or after an observation period. Duration models concentrate
on the modeling the conditional probability of interruption of a respective event. They
therefore consider more complete information than classic models and provide unique
information on the studied duration process. For example, linear regressions or logistics
model the non-conditional probability of an event (the probability of an event, independently
of the presented date of the event), while the duration model concentrates on its conditional
probability.
Consequently, duration models introduce the temporal dynamic notion of a studied
process. The probability of interruption can vary throughout the duration of the process. The
analysis of the conditional probability of interruption is also explicit in providing information
on the individual process of time management.
3. Characterizing the distribution of durations and the temporal dynamic
The objective is to model and study daily duration dedicated to transportation and the
probability of interrupting this process during its execution. Classic models are founded on
the probability of execution, an estimated event, obtaining a higher or lower TTB, and its
survival attributes:
t
suuftFtTtS )()(1Pr)(
This corresponds to the probability that a process continues until date t.
The duration models estimate the probabilities of interruption after date t, knowing
that the process continued until the respective date t. This conditional probability is noted h(t)
and qualifies as a hazard function, defined as:
tTtTtPth
0lim)(
4. Interpretation of the hazard and survival
The slope of the hazard function indicates variations of the slope and survival
function. The variations of the hazard therefore correspond to modifications of the rhythm of
the survival, the acceleration, or the deceleration of the process. The slope of the hazard
curve h directly illustrates the variations of the descending rhythm of the survival function.
The obtained log-logistic hazard shows a reversal of the slope. Consequently, this conditional
probability increases over time, then decreases. The interruption is increasingly probable at
the beginning of the process, then decreasingly probable for higher durations. The form of

27
the hazard function therefore has important implications on the representation of the temporal
dynamic of the process (Hensher and Mannering, 1994).
5. The estimated residual survival median
A unique indicator of duration analysis is the median, preferred over the mean because
of the reduced bias formed through possible dissymmetric distribution. The non-parametric
estimation produced for the population at risk for each date shows that the supplemental
survival time reaches 50% of individuals. This is the residual survival median at date t,
showing the time of the remaining survival median for the population at risk for the date.
7.2 Qualitative interviews
We selected eleven people without using announcements to the general public (ex.
local advertising). By asking various people known by the team, we successfully identified
individuals that had high TTB. Listing and comparing certain socio-demographic criteria for
each interviewee confirmed the diversity of the sample. Certain individuals also had unique
attributes that enriched the results:
Paul works in Geneva, but lives in France.
Sarah and Wanda spend a lot of time using public transportation, without
necessarily traveling long distances.
Cindy regularly uses a bicycle for her trips during the week.
Rachel and Thomas use both the car and public transportation for the same trip
to get to work.
Caroline carpools with a colleague
The interviews were either performed in person or via telephone. The interviews
generally lasted between 45 and 60 minutes, with the questions focused on four phases:
childhood, adolescence, after moving out of the parent’s home, and the present. Several
questions were asked on the perceptions and experiences of these trips, residential location,
aspirations, other members of the household and their influences on the interviewee’s
mobility, the activities performed during the trip, and the regularity of these trips on a weekly
or monthly basis.
The criteria of the city or countryside in residential location, positive or negative
effects, and other subjective data all reflect the views of the interviewee.