STRATOSPHERIC OZONE DEPLETION - WordPress.com · global change instruction program ann m....
42
GLOBAL CHANGE INSTRUCTION PROGRAM ANN M. MIDDLEBROOK MARGARET A. TOLBERT STRATOSPHERIC OZONE DEPLETION
-
Upload
phunghuong -
Category
Documents
-
view
220 -
download
1
Transcript of STRATOSPHERIC OZONE DEPLETION - WordPress.com · global change instruction program ann m....

G L O B A L C H A N G E I N S T R U C T I O N P R O G R A M
ANN M. MIDDLEBROOKMARGARET A. TOLBERT
STRATOSPHERIC OZONEDEPLETION

Ann M. MiddlebrookNational Oceanic and Atmospheric Administration
Margaret A. TolbertUniversity of Colorado
Department of Chemistry and Biochemistry andCooperative Institute for Research in Environmental Sciences
UNIVERSITY SCIENCE BOOKSSAUSALITO, CALIFORNIA
STRATOSPHERIC OZONE
DEPLETION

University Science [email protected] Information: Telephone (703) 661-1572
Fax (703) 661-1501
Scientific director: Tom M.L. WigleyManaging editor: Lucy WarnerEditor: Carol RasmussenArt and design: NCAR Image and Design ServicesCover design and composition: Craig Malone
The book’s cover shows polar stratospheric clouds over McMurdo Station, Antarctica. The cover photograph is courtesy of David Hofmann,NOAA CMDL, Boulder, Colorado.
This book is printed on acid-free paper.
Copyright © 2000 by University Corporation for Atmospheric Research.All rights reserved.
Reproduction or translation of any part of this work beyond that permittedby Section 107 or 108 of the 1976 United States Copyright Act without thepermission of the copyright owner is unlawful. Requests for permission orfurther information should be addressed to UCAR Communications, Box 3000, Boulder, CO 80307-3000.
Library of Congress Cataloging-in-Publication Data
Middlebrook, Ann M., 1964–Stratospheric ozone depletion / Ann M. Middlebrook, Margaret A. Tolbert.
p. cm. – (Global change instruction program)Includes bibliographical references and index.Summary: Examines the phenomenon of ozone loss and considers its
chemistry, causes, and prevention.ISBN 1-891389-10-6 (softcover : alk. paper)1. Ozone layer depletion. [1. Ozone layer. 2. Ozone layer depletion.]
I. Tolbert, Margaret A., 1957-II. Title. III. Series
QC879.712 .M53 2000363.738’75–dc21
99-058346
Printed in the United State of America10 9 8 7 6 5 4 3 2 1

V
A Note on the Global Change Instruction Program
This series has been designed by college professors to fill an urgent needfor interdisciplinary materials on global change. These materials areaimed at undergraduate students not majoring in science. The modularmaterials can be integrated into a number of existing courses—in earthsciences, biology, physics, astronomy, chemistry, meteorology, and thesocial sciences. They are written to capture the interest of the student whohas little grounding in math and the technical aspects of science butwhose intellectual curiosity is piqued by concern for the environment.
For a complete list of modules available in the Global Change Instruc-tion Program, contact University Science Books, Sausalito, California, [email protected]. Information is also available on the World Wide Webat http://www.uscibooks.com/globdir.htm orhttp://www.ucar.edu/communications/gcip/.

Contents
Preface ix
Introduction 1
I. The Stratosphere and the Ozone Layer 2
II. Ozone Chemistry 7
III. The Ozone Hole 12Explaining the Ozone Hole 13The Role of Polar Stratospheric Clouds 14Summary of Conditions for the Ozone Hole 16
IV. Arctic and Global Ozone Destruction 18
V. Ozone Depletion and Policy 21
VI. Conclusion 26
Problems and Discussion Questions 27
Glossary 29
Suggested Additional Reading 31
Index 32

IX
As the 20th century draws to a close, the global impact of human activities,once inconceivable, is now a reality. These problems must be confronted andresolved to maintain the natural balance of the planet. In the past twenty years,the worldwide issue of ozone loss in the stratosphere has been identified, stud-ied, and explained, and the international community has banded together toprotect its mutual vital interests. During the next century, the results of thiseffort will be evident as the Antarctic ozone hole recedes. This module discussesthe discovery of the Antarctic ozone hole, scientific studies of the processes thatcause stratospheric ozone loss, and the international strategy to protect theozone layer for future generations. Hopefully, the lessons learned from theozone problem will pave the way for society to tackle other global and environ-mental issues. We dedicate this module to our children and their future.
A. M. M. and M. A. T.Boulder, CO
January 2000
Preface

Acknowledgments
This instructional module has been produced by the GlobalChange Instruction Program of the University Corporationfor Atmospheric Research, with support from the NationalScience Foundation. Any opinions, findings, conclusions, orrecommendations expressed in this publication are those ofthe authors and do not necessarily reflect the views of theNational Science Foundation.
This project was supported, in part, by the
National Science FoundationOpinions expressed are those of the authorsand not necessarily those of the Foundation

In the last decade, there have been numerousreports of ozone loss in the upper atmosphere.Often the newspaper headlines and sound bitesare too short to provide a complete picture andare simplified to tell only one side of the story.Some claim that ozone depletion is a monumen-tal global problem, whereas others state thatozone loss is nonexistent. Even current advertis-ing and science fiction movies are not immuneto the dramatic story of ozone loss. A recentMaybelline advertisement promotes its NaturalDefense™ make-up by stating, “You knowwhat’s happening to the ozone, imagine whatit’s doing to your skin.” In the movie RoboCop,there is a futuristic advertisement for a sunblockwith SPF 2000 because no ozone is left to stopthe Sun’s ultraviolet (UV) radiation from reach-ing Earth. Another sci-fi movie, Highlander II,depicts a physical barrier erected over Earth toprovide UV protection because the ozone layerwas completely destroyed.
Although the facts have sometimes beenmisrepresented, massive ozone loss over theAntarctic continent has been observed annuallysince 1979, significant ozone loss above the Arc-tic has been observed recently, and ozone has
been eroding slowly above the United Statesand other populated regions. Why should wecare about the ozone layer? Quite simply, ozonenaturally shields the planet from incoming UVradiation from the Sun, and this radiationdestroys deoxyribonucleic acid (DNA) and pro-teins in all living organisms. Increased UV radi-ation causes increased incidence of basal celland squamous cell skin cancer and possiblymelanoma, immune system deficiencies, andcataracts in humans. In addition, the productivi-ty of ocean phytoplankton and certain cropplants is diminished by increased UV radiation.The effects of higher UV radiation are discussedfurther in another module, Biological Conse-quences of Global Climate Change.
An interesting and profound aspect ofozone depletion is that it is a global problemcaused by human activities. Many people find itdifficult to realize that humans can affect theenvironment on a global scale. In this module,we will describe the chemistry of ozone, howozone destruction is attributed to human activi-ty, and what society is doing to avert furtherdamage to the ozone layer. At the end, we givea set of questions about ozone depletion.
1
Introduction

On the basis of temperature, the atmosphere issubdivided into different altitude regions likethe layers of an onion (see Figure 1). Closest tothe Earth’s surface is the region called the tropo-sphere. This region includes the air that webreathe and is where weather systems occur.The air pressure (and also the total number ofmolecules per unit volume) decreases almostexponentially with altitude so that roughly 90%of the mass of the atmosphere is in the tropo-sphere and 50% of the mass is within the 5.5 kmclosest to the Earth.
In the troposphere, the air is generally wellmixed vertically, so many gases released onEarth tend to be mixed throughout the tropo-sphere. We can understand the vertical mixing
of the troposphere by imagining what happenswhen a balloon of air at the ground is raised 1km into the atmosphere. The balloon willexpand because the pressure is lower at thehigher altitude and will cool because it has todo work to expand. If no heat is allowed to beexchanged between the balloon and the sur-rounding air, we can calculate from thermody-namics what the new balloon temperature willbe. In air that contains no water, the tempera-ture will drop 10 K per km raised. If the bal-loon’s new temperature is higher than that ofthe surrounding air at that altitude, the balloonwill continue to rise. This example representsunstable air that is well mixed, a condition thatis very common in the troposphere. If, however,
2
IThe Stratosphere and the Ozone Layer
Figure 1. Variation of temperature (bottomaxis) and ozone (top axis) with altitude fromthe surface of the Earth. In the troposphere,temperature decreases with altitude. In thestratosphere, temperature increases with alti-tude. The tropopause is located at the mini-mum temperature. Ozone concentrations maxi-mize in the stratosphere. The ozone concentra-tion is shown on a log scale in units of thenumber of molecules per cubic cm (#/cm3).Adapted from Watson, R.T., M.A. Geller, R.S.Stolarski, and R.F. Hampson: Present State ofKnowledge of the Upper Atmosphere: AnAssessment Report. NASA Reference Publi-cation 1162, NASA, Washington, D.C., 1986,p. 20.
1010 1011 1012 1013
80
60
40
20
0100 200 300 400 500
Temperature
Stratosphere
Troposphere
Tropopause
Ozone
Ozone concentration (cm-3)
Temperature (K)
Alt
itu
de
(km
)

the balloon’s new temperature is lower thanthat of the surrounding air, the balloon willdescend to its original position. This representsvery stable air with very little vertical mixing.This situation, where cold air is below warm air,is often referred to as a temperature inversionand is a contributing factor to smog.
As seen in Figure 1, above the tropospherethe temperature begins to increase as the alti-tude increases. This is due to the absorption oflight energy by ozone. The altitude where thelowest temperatures occur in the lower atmos-phere defines the top of the troposphere and iscalled the tropopause; above that is the regioncalled the stratosphere. Because the stratosphereis a giant inversion layer with warm air abovecold air, there is very slow vertical mixing inthis region. In very broad terms, the globalatmospheric circulation consists of upwellinginto the stratosphere near the equator anddownward transport of stratospheric air nearthe poles. The tropopause height is 16–18 kmnear the equator and 8–12 km near the poles.
A diagram of ozone concentration as a func-tion of altitude is included in Figure 1. Ozone
STRATOSPHERIC OZONE DEPLETION
3
Br bromineBrO bromine monoxideBrONO2 bromine nitrateBrOx bromine oxidesCCl2FCClF2 1,1,2-trichloro-1,2,2-trifluoroethane
(CFC-113)CCl4 carbon tetrachloride (CFC-10)CFCl3 trichlorofluoromethane (CFC-11)CF2Cl2 dichloro-difluoromethane
(CFC-12)CH2BrCl bromochloromethaneCHClF2 chlorodifluoromethane
(HCFC-22)CH3Br methyl bromideCH3Cl methyl chlorideCH3CCl3 methyl chloroformCH4 methaneCl chlorine atomClO chlorine monoxideClOO unstable chlorine dioxide(ClO)2 chlorine monoxide dimerClONO2 chlorine nitrateClOx chlorine oxidesCl2 chlorine moleculeCO2 carbon dioxideHBr hydrogen bromideHCl hydrochloric acidHNO3 nitric acidHO2 hydroperoxyl radicalHOx hydrogen oxidesH2O waterH2SO4 sulfuric acidM any moleculeNO nitric oxideNO2 nitrogen dioxideNO3 nitrate radicalNOx nitrogen oxidesN2O nitrous oxideN2O5 dinitrogen pentoxideNaCl sodium chlorideO oxygen atomO* highly energized oxygen atomOCS carbonyl sulfideOH hydroxyl radicalO2 oxygen moleculeO3 ozoneSO2 sulfur dioxide
In Figure 1, there is a slight increase inozone concentrations at altitudes very closeto ground level. High concentrations ofozone are often found in the troposphere inpolluted areas such as Los Angeles, Califor-nia. Although ozone near the ground willalso absorb DNA-damaging ultravioletradiation, it is toxic to plants and humans(see Biological Consequences of Global ClimateChange). Therefore, ozone can be thought ofas “good” in the stratosphere and “bad” inthe troposphere (where we would breatheit). Consequently, efforts should be made toreduce the amount of tropospheric ozoneformed by pollution and maintain theozone layer in the stratosphere.
Good Ozone and Bad Ozone
Chemicals Named in This Module

concentrations reach a maximum in the strato-sphere, forming the so-called ozone layer.Although ozone is a vital component of thestratosphere, the actual amount of ozone is verysmall. If all of the ozone in the atmosphere werecompressed to the pressure at sea level, theozone would form a layer only 3 mm thick,compared with 8,500 m if the entire atmospherewere similarly compressed.
The chemical composition of the strato-sphere is quite different from that of the tropo-sphere. For example, water concentrations aremuch lower in the stratosphere because watercondenses into clouds in the troposphere, andthese rain out. In addition, water rising throughthe tropical tropopause tends to freeze out dueto the extremely cold temperatures there. Only asmall amount of water vapor gets through this“cold trap.” Another source of stratosphericwater vapor is from the oxidation of CH4 gas(see list of chemical names and formulas on p.3) released on Earth. Because so little watervapor is present in the stratosphere, very fewclouds form there. However, these clouds play acrucial role in the ozone story.
Many of the molecules released on Earth donot reach the stratosphere because they are solu-ble (can dissolve) in water and return to the sur-face in precipitation or are broken down bychemical reactions in the troposphere. These
include such molecules as HCl and NaCl. BothHCl, from erupting volcanoes, and NaCl,released into the atmosphere by ocean wave-breaking, are very soluble in water, so they arenot a significant source of chlorine to the strato-sphere. Some molecules, such as hydrocarbonsemitted from plants and from incomplete com-bustion of fossil fuels, react in the tropospherewith OH before they can reach the stratosphere.
The only molecules that do reach the strato-sphere are those that are insoluble in water andalso are chemically inert (or unreactive). A par-tial list of these compounds includes nitrousoxide (N2O), carbonyl sulfide (OCS), methane(CH4), chlorofluorocarbons (CFCs), and halons(carbon-based molecules containing bromine).Some of these species are natural and some areanthropogenic (generated by human activity).Although these molecules do not react in thetroposphere, when they reach the stratospherethey absorb UV light and break apart. Suchreactions in which molecules absorb light andfall apart are called photolysis (or photochemi-cal) reactions. As we shall show below, photoly-sis of these molecules in the stratosphere affectsozone concentrations.
The intensity of solar radiation also variesbetween the troposphere and stratosphere. Bothgases and particles absorb and scatter radiation,preventing the full amount of sunlight from
THE STRATOSPHERE AND THE OZONE LAYER
4
Figure 2. The ozone absorption spectrum show-ing where ozone filters UV radiation. The largeabsorption band of ozone between 200 and 300nm is called the Hartley band, named after itsdiscoverer, John Hartley. From Griggs, M.:Absorption coefficients of ozone in the ultravio-let and visible regions. Journal of ChemicalPhysics 49, 1968, pp. 857–859. © 1968, Ameri-can Institute of Physics. Reprinted by permis-sion.
10.3
6.9
3.4
200 250 300Wavelength (nm)
Ab
sorp
tio
n c
ross
sec
tio
n(1
0-18
cm2 /
mo
lec)

reaching the ground. The amount of light at agiven wavelength reaching the planet’s surfacedepends on the gases and particles present in theatmosphere. A complete discussion of the Earth’sradiation budget is described in the module TheSun-Earth System. Here, it is important to notethat ozone absorbs UV radiation (wavelengths, λ,between 200 and 300 nm, see Figure 2), prevent-
ing high intensities at these wavelengths fromreaching the ground. Table 1 shows the approxi-mate wavelength regions of ultraviolet and visi-ble light. If less ozone is present in the strato-sphere, less UV light is absorbed there, so morereaches the ground. In fact, an increase in UVradiation has been observed as a function ofdecreasing ozone concentrations (see Figure 3).
STRATOSPHERIC OZONE DEPLETION
5
Name Approx. Wavelengths Comments
UV-C 200–280 nm Extremely damaging to DNA, but absorbed by both molecular oxygen and ozone
UV-B 280–320 nm Very damaging to DNA, sensitive to ozone changes
UV-A 320–400 nm Suntan region (some DNA damage)
Visible 400–700 nm Detectable with human eyes
150%
100%
50%
0%
-60% -50% -40% -30% -20% -10% 0%
South Pole, AntarcticaFeb 1991 – Dec 1992
Change in ozone(Spring vs. autumn, for the same solar angle)
Increases in Erythemal (Sunburning) UV RadiationDue to Ozone Reductions
Mea
sure
d in
crea
se in
UV
rad
iati
on
Figure 3. Measured increase in ultraviolet (UV) radiation at the South Pole as a function of change in ozone. From WMOGlobal Ozone Research and Monitoring Project: Scientific Assessment of Ozone Depletion: 1994. WMO, Geneva,Switzerland, No. 37, 1994, p. xxxiii.
Table 1: Ultraviolet and Visible Radiation

The Dobson spectrophotometer for measuring ozone is a ground-based instrument invented bythe English scientist George M.B. Dobson in 1927. It measures the column amount of ozone (totalnumber of ozone molecules above a square centimeter of the Earth’s surface) by measuring theamount of ultraviolet light absorbed by the atmosphere (see Figure 4). The longest Dobsonrecord is from the station in Arosa, Switzerland, where ozone has been measured continuouslysince 1932. In 1957, the International Geophysical Year, a network of 85 Dobson stations wasestablished to measure global ozone. This network has provided long-term data showing signifi-cant ozone loss on a global scale over the past 25 years.
The unit for measuring the column amount of ozone is called the Dobson Unit (DU), whereone DU equals 2.7 x 10¹⁶ molecules per cm2. This number was chosen because it represents 100times the height in mm of ozone per cm2 over Earth if all of the ozone were brought to the sameatmospheric pressure as at sea level. So, 3 mm of ozone per cm2 equals 300 DU. Other unitsused to measure actual concentration are number of molecules per cm3 as shown in Figure 1; themixing ratio of ozone to air in ppmv, ppbv, or pptv (1 part per million, billion, or trillion by vol-ume is 1 molecule per 106, 109, or 1012 total molecules); and partial pressure in millibars (1 mb =9.87 x 10⁻⁴ atmospheres) or milliPascals (1 mPa = 9.87 x 10⁻⁹ atmospheres), which is also thetotal pressure times the mixing ratio.
Sun
Light not absorbed by O3Light absorbed by O3
Dobsonspectrometer
Ozonelayer
Earth
I∞
I
6
Figure 4. Schematic diagram showing how ozone is measured by Dobson spectrometers. Because ozone transmits thevisible wavelengths and absorbs the ultraviolet, the amount of ozone can be determined by comparing differences inabsorption at two wavelengths. Beer's Law is used to calculate the amount of light transmitted (T) through an absorb-ing species, like ozone. A simplified example of this is shown, where the intensity of the Sun without any absorption byozone is Ι∞ and the intensity reaching the ground through the ozone layer is Ι. The fraction of available light reachingthe ground is given by
ΙT = — = exp [–N x σ(λ)]
Ι∞
where Ι∞ = the solar intensity above the ozone layer, Ι = the solar intensity reaching the ground, N = the column amountof ozone molecules (molec/cm2), and σ(λ) = the absorption cross-section (cm2/molec) at the wavelength = λ (nm).
Measuring Column Amounts of Ozone

Ozone, a molecule consisting of three oxygenatoms, was first discovered in the 1830s by theGerman scientist Christian Schönbein. He iden-tified a new compound in laboratory experi-ments using oxygen, and named the molecule“ozein,” meaning “to smell” in Greek. In 1881,John Hartley experimented with ozone andfound that it strongly absorbed ultraviolet light(see Figure 2). He compared the absorptionspectrum of ozone to the spectrum of sunlightas seen from the Earth’s surface and found thatthey matched exactly.
But where in the atmosphere was the ozonethat absorbed the Sun’s ultraviolet light? Ozonemeasurements in the troposphere in the early1900s showed that not enough ozone was thereto explain the observed column amount. Thus,the ozone must be higher up in the atmosphere.The vertical profile of ozone was finally estab-lished by measurements of Gotz and Dobson inthe 1930s, who showed that the ozone waslocated mainly in a layer about 22 km above theEarth. The fact that ozone concentrationspeaked in the stratosphere suggested a photo-chemical (sunlight-driven) source for ozone. In1930, Sidney Chapman (an English scientist)proposed a four-reaction mechanism to explainthe global distribution of stratospheric ozone.The ozone is produced by the photolysis of oxy-gen molecules into oxygen atoms, shown inReaction (1), followed by the reaction of oneoxygen atom with an oxygen molecule:
O2 + UV light → O + O λ < 242 nm (1)O + O2 + M → O3 + M (2)
Net: 2 O2 + UV light → O + O3
In Reaction (1), the ultraviolet light requiredto dissociate the O2 molecules must have awavelength less than 242 nm. The oxygen atomsformed in Reaction (1) react with an oxygenmolecule to form ozone in Reaction (2). Thethird molecule, M, is needed to remove theexcess energy and can be any other molecule inthe atmosphere. Note that the concentration ofM (or number of M molecules per unit volume)decreases as the pressure decreases withincreasing altitude. When Reactions (1) and (2)are added together, they form a single net reac-tion, shown below the solid line. The net reac-tion indicates that oxygen atoms and ozone areproduced from oxygen molecules and light.Ozone can be destroyed by photolysis [Reaction(3)] and by reaction with an oxygen atom:
O3 + light → O2 + O (3)O + O3 → 2 O2 (4)
Net: 2 O3 + light → 3 O2
We see that Reaction (3) produces an oxy-gen atom, which can recombine with an oxygenmolecule to reform ozone as in Reaction (2).Therefore, Reaction (3) does not necessarilyresult in ozone destruction unless it is followedby Reaction (4). The net reaction for Reactions(3) and (4) shows that ozone is destroyed bylight to regenerate oxygen molecules.
In the above Chapman mechanism, it canbe seen that sunlight is an important require-ment for the formation of ozone. It turns out,however, that the maximum amount of ozone isnot found in the tropics where the solar radia-tion is the highest, but rather at higher latitudesin the spring. Measurements of the global col-
7
IIOzone Chemistry

umn amount of ozone over the Earth as a func-tion of month of the year (prior to the ozonehole formation) are shown in Figure 5. The con-tour lines indicate the ozone concentrations atthat latitude and time of year. It can be seenthat there is a peak in ozone amount at 75° Nlatitude in March (460 DU) and a smaller peakat 60°S latitude in October (400 DU). The peaksin ozone at high latitudes occur because theozone concentrations are a strong function ofboth production chemistry and meteorologicaltransport. Recall that air is transported pole-ward and downward from the tropics, bringingozone to the poles where it is long-lived due tolow levels of sunlight. This transport isstrongest in the winter, causing ozone to accu-mulate at high latitudes and thus maximize inthe spring.
Other factors also can influence globalozone levels. Because Reactions (1) and (3)involve sunlight, variations in the amount ofsolar radiation influence global ozone. The UV
light from the Sun varies in an 11-year cycle,with ozone levels decreasing 1–2% from themaximum to the minimum. However, ozonelosses discussed later in this module far exceed1–2%, and their timing does not correlate withthe solar cycle.
The Chapman mechanism for ozone doesremarkably well in predicting where in theatmosphere ozone can be found, with a peak inthe lower stratosphere. However, the amount ofozone predicted by the Chapman mechanism isgreater than the amount of stratospheric ozoneactually observed. This is because, while Reac-tions (1) and (2) are the only net source of oxy-gen atoms and ozone, there are many ways inwhich ozone can be destroyed besides Reaction(4). For example, a Dutch scientist, PaulCrutzen, recognized in the early 1970s thatozone is catalytically destroyed in a cycleinvolving nitrogen oxides or NOx (NOx = NO +NO2). For his pioneering work on ozone chem-istry, Crutzen was a co-recipient of the 1995
OZONE CHEMISTRY
8
Figure 5. The global distri-bution of the columnamount of ozone before theformation of the ozone hole.The column amounts of O3
were derived from ground-based measurements. FromLondon, J.: Radiative ener-gy sources and sinks in thestratosphere and mesos-phere, pp. 703–721, in:Nicolet, M., and A.C.Aikin (eds), Proceedingsof the NATO AdvancedStudy Institute onAtmospheric Ozone: ItsVariations and HumanInfluences, U.S. Dept. ofTransportation, Washing-ton, D.C., 1980.
90
60
30
0
30
60
90J F M A M J J A S O N D
Total Ozone (Dobson units)
Lat
itu
de
N→
←S
Month
460440420400
380
360340
320 300
280
320
340
300280
260250
250250260
280
300 320320
340360
380
300280
400

Nobel Prize in chemistry. The catalytic cycle thathe proposed is shown below:
NO + O3 → NO2 + O2 (5)O + NO2 → NO + O2 (6)
Net: O + O3 → 2 O2
The net reaction above shows that an oxy-gen atom and an ozone molecule form two oxy-gen molecules. Interestingly, the net reactiondoes not use up any NOx molecules becausewhen Reactions (5) and (6) are added, neitherNO nor NO2 is produced or destroyed. Thus,this ozone loss cycle is catalyzed by NOxbecause the NO consumed in Reaction (5) isregenerated in Reaction (6) and the NO2 pro-duced by Reaction (5) is consumed in Reaction(6). Therefore, this cycle can repeat many timesas long as some NOx is available for reaction.NOx occurs both naturally and, to a lesserextent, anthropogenically in the stratosphere. Anatural source is the oxidation of N2O releasedin the troposphere by bacteria in soil and ocean-ic microorganisms. An anthropogenic source ofN2O is fertilization. N2O molecules do not pho-tolyze or react in the troposphere, and thus areable to reach the stratosphere. Once there, someN2O reacts with a highly energized oxygenatom, O*, to form NO. Nitrogen oxides may alsobe injected directly into the stratosphere byexhaust from high-flying aircraft (see below), asfirst recognized by the U.S. scientist HaroldJohnston at the same time that Crutzen pro-posed the above NOx ozone loss cycle.
Also in the 1970s, Richard Stolarski andRalph Cicerone (both scientists from the UnitedStates) proposed that chlorine from solid fuelrockets could cause ozone depletion via the cat-alytic cycle:
Cl + O3 → ClO + O2 (7)O + ClO → Cl + O2 (8)
Net: O + O3 → 2 O2
This scheme is also catalytic, with one atom ofchlorine being able to destroy 100,000 moleculesof ozone. Eventually, the chlorine atoms reactwith CH4 to form HCl, temporarily ending thisozone destruction cycle. Fortunately, theamount of chlorine emitted into the stratospherefrom rockets and space shuttle exhaust is verysmall. However, chlorine became recognized forpotentially destroying ozone.
The main source of chlorine oxides (ClOx =Cl + ClO) to the stratosphere was recognized in1974 by the U.S. scientists Mario Molina andSherwood Rowland to be CFCs. For theirimportant discovery of the link between CFCsand ozone depletion, Molina and Rowland wereco-recipients of the 1995 Nobel Prize in chem-istry. CFCs are molecules containing only car-bon, chlorine, and fluorine, and are known to bechemically inert. In fact, it was their inert naturethat made them ideally suited for use as aerosolpropellants, refrigerants, foam-blowing agents,and cleaning solvents. Because they are so inert,they do not react in the troposphere. The rapidmixing of the troposphere helps these moleculesto spread uniformly there. Recall that most airentering the stratosphere rises through the trop-ical tropopause. Therefore, CFCs rise in thetropics and are spread to both the northern andsouthern polar stratospheres even though mostsources are in the Northern Hemisphere. Weknow that CFCs reach the stratosphere becausethey have been observed there for many years(see Figure 6). Scientists also have measured theconcentrations of various chlorine species in thestratosphere and have determined that over80% of the chlorine compounds are anthro-pogenic (see Figure 7). In addition to the abovechlorine reactions with ozone, other tracespecies, such as bromine oxides (BrOx = Br +BrO) and hydrogen oxides (HOx = OH + HO2),can also lead to catalytic ozone destruction. Therelative importance of these species depends onaltitude and latitude.
STRATOSPHERIC OZONE DEPLETION
9

OZONE CHEMISTRY
10
Figure 7. Pie chart of chlorine-containing compounds in thestratosphere, showing that82% of the chlorine sources areanthropogenic. From WMOGlobal Ozone Research andMonitoring Project: ScientificAssessment of Ozone Deple-tion: 1994. No. 37, WMO,Geneva, Switzerland, 1994, p. xxix.
CFC-11(23%)
CFC-12(28%)
CCl4(12%)
CH3Cl(15%)
CH3CCl3(10%)
HCl(3%)
CFC-113(6%)
HCFC-22(3%)
Primary Sources of ChlorineEntering the Stratosphere
Naturalsources
contribute
Entirelyhuman-made
Figure 6. Measurement of CFC-11 (CFCl3) fromthe ground up to the stratosphere at midlatitudesin the Northern Hemisphere. These data wereobtained from five separate studies over the datesindicated. Note that the concentration decreasesonce CFCl3 is above the ozone layer. The ozonelayer is blocking the UV light needed to photo-chemically break apart the CFCl3 via:
CFCl3 + UV light → CFCl2 + Cl
Once the gas drifts above the ozone layer, itreleases chlorine atoms. From WMO GlobalOzone Research and Monitoring Project:Atmospheric Ozone: Assessment of OurUnderstanding of the Processes ControllingIts Present Distribution and Change. No. 16,WMO, Geneva, Switzerland, 1985, p. 634.
40
30
20
10
00.01 0.1 1 10 100
198019821983198219831982
CFCl3
Concentration (pptv)
Alt
itu
de
(km
)

STRATOSPHERIC OZONE DEPLETION
11
It is believed that early in the planet’s history, life existed only in the oceans where the harmfulUV radiation was absorbed and scattered by wave action, bubbles, and debris floating in thewater (Figure 8). Photosynthesis in ocean plants then converted CO2 and H2O into O2 and thesugars that provide the energy to make the plants grow. When the ocean became saturated withO2, the amount of oxygen in the atmosphere gradually increased. Gas-phase oxygen was con-sumed by two mechanisms: (1) new life forms used O2 and sugars to produce CO2, H2O, andenergy in the reverse-photosynthesis process called respiration, and (2) O3 was formed by thephotochemical destruction of O2. As concentrations of ozone in the atmosphere began toincrease, less UV radiation reached the Earth’s surface. Because the ozone absorbed the DNA-damaging radiation, life could begin to exist on the Earth’s surface rather than just under water.
O2O2
O2 O2
O3O3O3 O3O3
O3
Abioticchemical
evolution ona lifeless
Earth
Bacterialevolution
Early life basedon anaerobic
processes
PhotosynthesisGreen plantsutilize light,water, and
carbon dioxide
Atmosphericoxygen
accumulation
AerobicrespirationEvolution of
oxygen-usinglife forms
Ozone layerformation
Allows life tomove out of the
oceans onto land
Complex terrestrialmetazoan life
How Ozone Allowed Life to Evolve on the Surface of the Earth
Figure 8. How life evolved on Earth. The oxygen produced by underwater plants eventually accumulated in the atmos-phere. When UV light broke apart the oxygen, ozone was formed. After the ozone layer was formed, UV light was prevent-ed from reaching the ground. Then, plants and animals could exist on the surface of the planet. From R. P. Turco, EarthUnder Siege: Air Pollution and Global Change, Oxford Press, p. 86, 1993.
When gas-phase catalytic ozone destructioncycles involving NOx, ClOx, BrOx, and HOxwere first included in photochemical atmos-pheric models, global ozone levels were predict-ed to drop 5–10% over the next 100 years. Thisdecrease was predicted because CFCs wereincreasing rapidly in concentration, causing theamount of chlorine in the atmosphere toincrease.
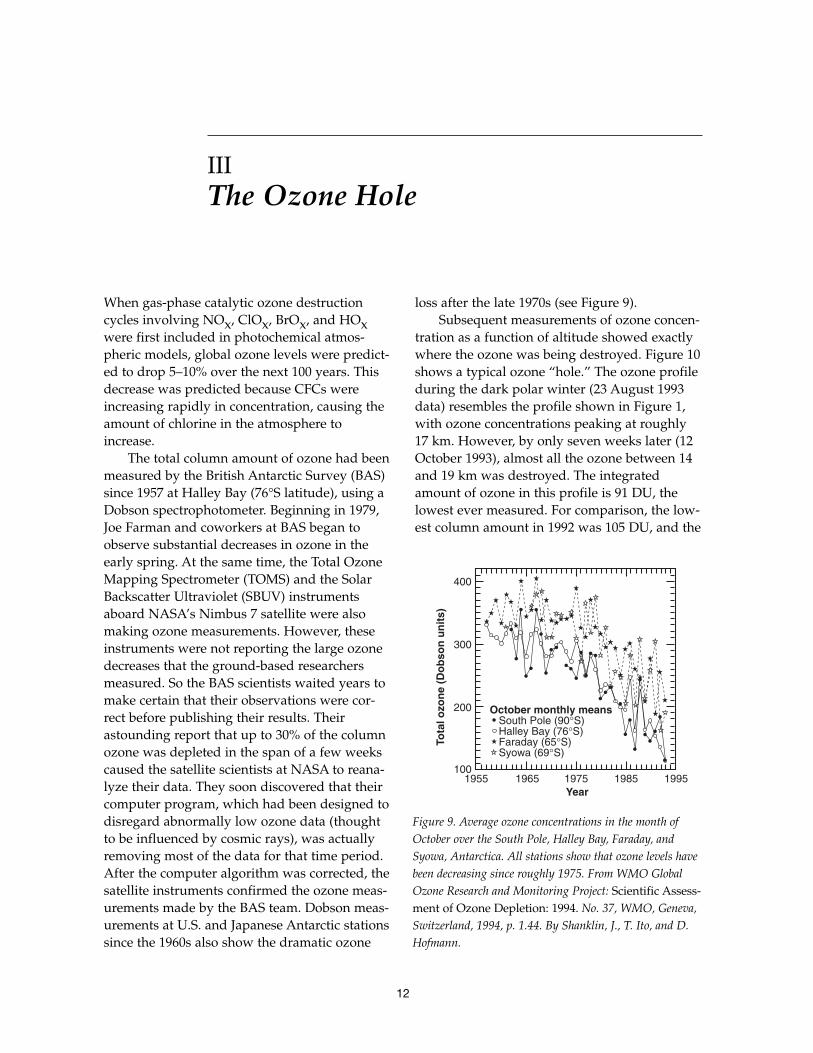
The total column amount of ozone had beenmeasured by the British Antarctic Survey (BAS)since 1957 at Halley Bay (76°S latitude), using aDobson spectrophotometer. Beginning in 1979,Joe Farman and coworkers at BAS began toobserve substantial decreases in ozone in theearly spring. At the same time, the Total OzoneMapping Spectrometer (TOMS) and the SolarBackscatter Ultraviolet (SBUV) instrumentsaboard NASA’s Nimbus 7 satellite were alsomaking ozone measurements. However, theseinstruments were not reporting the large ozonedecreases that the ground-based researchersmeasured. So the BAS scientists waited years tomake certain that their observations were cor-rect before publishing their results. Theirastounding report that up to 30% of the columnozone was depleted in the span of a few weekscaused the satellite scientists at NASA to reana-lyze their data. They soon discovered that theircomputer program, which had been designed todisregard abnormally low ozone data (thoughtto be influenced by cosmic rays), was actuallyremoving most of the data for that time period.After the computer algorithm was corrected, thesatellite instruments confirmed the ozone meas-urements made by the BAS team. Dobson meas-urements at U.S. and Japanese Antarctic stationssince the 1960s also show the dramatic ozone
loss after the late 1970s (see Figure 9). Subsequent measurements of ozone concen-
tration as a function of altitude showed exactlywhere the ozone was being destroyed. Figure 10shows a typical ozone “hole.” The ozone profileduring the dark polar winter (23 August 1993data) resembles the profile shown in Figure 1,with ozone concentrations peaking at roughly17 km. However, by only seven weeks later (12October 1993), almost all the ozone between 14and 19 km was destroyed. The integratedamount of ozone in this profile is 91 DU, thelowest ever measured. For comparison, the low-est column amount in 1992 was 105 DU, and the
12
IIIThe Ozone Hole
Figure 9. Average ozone concentrations in the month ofOctober over the South Pole, Halley Bay, Faraday, andSyowa, Antarctica. All stations show that ozone levels havebeen decreasing since roughly 1975. From WMO GlobalOzone Research and Monitoring Project: Scientific Assess-ment of Ozone Depletion: 1994. No. 37, WMO, Geneva,Switzerland, 1994, p. 1.44. By Shanklin, J., T. Ito, and D.Hofmann.
400
300
200
1001955 1965 1975 1985 1995
Year
October monthly meansSouth Pole (90°S)Halley Bay (76°S)Faraday (65°S)Syowa (69°S)
Tota
l ozo
ne
(Do
bso
n u
nit
s)

October column amount was about 300 DUuntil the late 1970s.
The ozone concentration record in the satel-lite data showed that the region where ozoneloss occurred over Antarctica was a rough circleor “hole” centered near the South Pole. Theozone “hole” was found to be deeper and to lastlonger every other year until 1989, 1990, and1991, when the holes were comparable. On Oct.8, 1993, the lowest column ozone ever measuredby TOMS (85 DU) was recorded above McMur-do Station (78°S). In 1998, the area covered bythe ozone hole was the largest on record. Whenscientists first tried to explain these losses, theysoon realized that they could not do so by theknown gas-phase chemical reactions, such asReactions (5) through (8). So, a search began foralternative (and better) explanations, and fordata to test alternative hypotheses.
Explaining the Ozone Hole
Since the models containing known gas-phase chemistry failed to predict the dramaticloss of ozone over Antarctica, it was clear thatsomething was missing. Three possible explana-tions emerged as those studying the ozone layercame to grips with the news of the hole. Onetheory was related to variations in solar energy.As mentioned above, the Sun has an 11-yearcycle of increasing and then decreasing activity.When the solar activity is high, increasedamounts of NOx are produced. The NOx couldreduce the ozone concentrations by Reactions (5)and (6). This theory was soon disproved whenscientists measured low NOx concentrationsduring the ozone hole rather than the elevatedones required by the solar theory. Also, the loss-es observed over Antarctica are much greaterthan the 1–2% expected from variations in thesolar cycle. In addition, the solar theory predict-ed ozone loss via Reactions (5) and (6) to occurat 40 km altitude, whereas the actual ozone lossoccurred between 15 and 20 km (see Figure 10).
Another theory to explain the ozone holeinvolved changes in atmospheric dynamics (the
air’s circulation patterns). At the beginning ofthe austral winter, a large, circular vortex devel-ops over the Antarctic continent (see Figure 11).This vortex effectively isolates the air aboveAntarctica from midlatitude air, preventingozone-rich air from the tropics from mixing withthe polar air. In addition to this isolation, thedynamical theory for the ozone hole suggestedthat the special cold conditions of the Antarcticcaused upwelling when the Sun returned, mov-ing ozone-poor air from lower to higher alti-tudes. Later, however, field observations showedthat the N2O concentrations were lower insidethe vortex than outside, indicating that the vor-tex air is older and had been transported down-ward from above. Thus, air moves downward
STRATOSPHERIC OZONE DEPLETION
13
Figure 10. Ozone profile measured in 1992 and 1993 at theSouth Pole Station, Antarctica. On August 23, the ozoneconcentration profile (right-hand line) appears normal. OnOctober 12, ozone concentrations between 14 and 19 kmwere below the instrument's detection limit, illustrating ver-tical location of the ozone hole. For comparison, the ozoneprofile on October 11, 1992, is also shown. From Hofmann,D.J., S.J. Oltmans, J.A. Lathrop, J.M. Harris, and H. Voemel:Record low ozone at the South Pole in the spring of 1993.Geophysical Research Letters 21, 1994, pp. 421–424.
35
30
25
20
15
10
5
00 5 10 15 20
23 Aug 93 276 DU12 Oct 93 91 DU11 Oct 92 105 DU
O3 partial pressure (mPa)A
ltit
ud
e (k
m)

inside the polar vortex, not upward as needed inthe dynamic (circulation) theory.
The third theory to explain the ozone holewas based on chemistry. Catalytic chain reac-tions caused by unusually high levels of ClOxwere proposed to be the cause of the enhancedozone loss. Ground-based field measurementsled by U.S. scientist Susan Solomon in thespring of 1986 in Antarctica showed greatlyenhanced levels of ClO above that expectedfrom known chemistry. This was confirmed byin-flight measurements of ClO in the strato-sphere above Antarctica in 1987, where lowozone levels were found in air with high ClOlevels. The data from flights into the vortex (seeFigure 12) clearly show that the ozone concen-trations decrease wherever ClO increases andvice versa. This relationship of low ozone withhigh ClO is referred to as the “smoking gun” ofozone destruction because it definitively
demonstrated that chlorine was the culprit. Although it was now clear that anthro-
pogenic chlorine was indeed to blame for theozone loss, the exact mechanism was still notknown. In the winter and early spring aboveAntarctica, strong sunlight is unavailable to cre-ate oxygen atoms, which are needed for ozoneloss via the chlorine catalytic cycle in Reactions(7) and (8). Thus, another mechanism was need-ed to recycle the ClO back to Cl atoms. Marioand Luisa Molina proposed that the ClO reactswith itself to form a dimer, (ClO)2, which in turnphotolyzes into Cl atoms for ozone destruction:
2 x [Cl + O3 → ClO + O2] (7)ClO + ClO + M → (ClO)2 + M (9)(ClO)2 + light → Cl + ClOO (10)ClOO + M → Cl + O2 + M (11)
Net: 2 O3 + light → 3 O2
Because Reaction (9) needs two ClO mole-cules, this ozone-destroying cycle is only effec-tive if the concentration of ClO is very high. Thismechanism is now thought to account for rough-ly 80% of the ozone destroyed above Antarctica.
Under typical midlatitude conditions, ClOrapidly reacts with NO2 to form ClONO2:
ClO + NO2 + M → ClONO2 + M (12)
When this happens, the chlorine is attached to anonreactive, or reservoir, molecule (ClONO2)that does not deplete ozone. Therefore, for ClOto deplete ozone, it is helpful if NO2 levels arelow. These special conditions of high ClO andlow NO2 are now recognized to occur in thewinter polar regions due to the presence ofpolar stratospheric clouds.
The Role of Polar Stratospheric Clouds
Polar stratospheric clouds (PSCs) have beenobserved in polar winters above Antarctica fordecades. Because little water vapor reaches thestratosphere, the temperature must be very cold
THE OZONE HOLE
14
Figure 11. Schematic diagram of the Antarctic vortexformed during the winter, showing the isolation of polar airfrom the rest of the stratosphere. From Wayne, R.P.:Chemistry of Atmospheres, 2nd ed., p. 184. © 1991,Oxford University Press. Reprinted by permission.
Slowradiatively
drivencirculation
Strongwesterlywinds inmid-lowstratosphere
Disturbedflow inthe lowstratosphere
Cold coreof Antarctic
vortex
ANTARCTIC CONTINENT
Mixing
Tropopause 9 km

(<187 K) for water-ice particles to condense andclouds to form. However, each year aboveAntarctica and also frequently above the ArcticOcean, stratospheric temperatures do becomethat low in the winter. Another type of PSC thatcontains crystals of nitric acid (HNO3) and icemay also form in the stratosphere. These nitricacid/ice particles form at slightly higher temper-atures (<195 K) than are needed for the pure iceclouds. Because they do not require such a verylow temperature for their formation, theseclouds are more common than ice clouds, andare found every year over both poles during thewinter.
It was first suggested by U.S. scientist SusanSolomon and coworkers that heterogeneouschemistry (requiring a gas and a surface) occur-ring on PSC particles could be the missing pieceof the puzzle to explain the ozone hole. It isnow recognized that PSC particles catalyze thereaction:
ClONO2 + HCl → Cl2 + HNO3 (13)
For her key scientific insights into explainingthe cause of the ozone hole and advancing theunderstanding of the global ozone layer,
Solomon was awarded the 1999 National Medalof Science by President Clinton.
Reaction (13), occurring on the surfaces ofPSC particles, converts the stable, ozone-friend-ly molecules ClONO2 and HCl into a form morethreatening to O3. Photolysis of the Cl2 mole-cules at polar sunrise produces chlorine atoms:
Cl2 + light → 2 Cl (14)
These chlorine atoms are then capable ofcatalytic ozone destruction via the Molina andMolina chlorine cycle, Reactions (7) and (9)through (11). Therefore, the net effect of Reac-tions (13) and (14) is to activate chlorine so thatit can destroy ozone. Laboratory experimentsshowed that Reaction (13) was slow in the gasphase. However, after the discovery of theozone hole, several research groups quicklydesigned experiments to investigate Reaction(13) on surfaces representative of PSC particlesand found that the presence of an ice surfacemade the reaction go much faster.
In addition to activating chlorine, Reaction(13) also forms HNO3, which remains incorpo-rated in the PSC particles. This conversionremoves NOx from the polar winter strato-
STRATOSPHERIC OZONE DEPLETION
15
Figure 12. Ozone/ClO "smoking gun"relationship measured above Antarcticain September 1987. As the ER-2 aircraftmaking the measurements approachedthe ozone hole region, ozone concentra-tions decreased and chlorine monoxideconcentrations increased. From Ander-son, J.G., W.H. Brune, and M.H. Prof-fitt: Ozone destruction by chlorine radi-cals within the Antarctic Vortex: Thespatial and temporal evolution of ClO-O3 anticorrelation based on in situ ER-2data. Journal of Geophysical Research94, 1989, pp. 11465–11479.
1200
1000
800
600
400
200
0
3000
2000
1000
062 63 64 65 66 67 68 69 70 71 72
Latitude (degrees South)
ClO
mix
ing
rat
io
O3
mix
ing
rat
io
O3
ClO
ClO mixing ratio (ppt)O3 mixing ratio (ppb)

sphere. If the cloud particles grow large enoughto fall, the HNO3 falls with them. Sedimenta-tion of HNO3 associated with PSC particles cancause permanent removal of nitrogen speciesfrom the stratosphere, the so-called denitrifica-tion. Low levels of NOx in the Antarctic strato-sphere prevent the sequestering of active chlo-rine (ClO) back into inactive forms (ClONO2)via Reaction (12). This overall sequence ofevents is shown schematically in Figure 13.Therefore, the net effect of the reaction ofClONO2 with HCl (Reaction 13) on the surfacesof PSC particles is to produce unusually highlevels of ClOx and unusually low levels ofNOx.
Although chlorine was found to be vital forpolar ozone depletion, laboratory and fieldmeasurements now indicate that brominespecies also play an important role in destroy-ing ozone. Another way of converting ClO intoCl atoms involves BrOx:
Cl + O3 → ClO + O2 (7)Br + O3 → BrO + O2 (15)BrO + ClO → Br + ClOO (16)ClOO + M → Cl + O2 + M (11)
Net: 2 O3 → 3 O2
In fact, on an atom-for-atom basis, bromineis 50–100 times more destructive of ozone thanis chlorine. This is partly because bromine com-pounds usually exist in the active BrOx formsrather than the non-ozone-destroying forms(BrONO2 and HBr), and thus are immediatelyready for ozone destruction. The main source ofbromine in the stratosphere is methyl bromide,emitted naturally by oceanic biological activityand from anthropogenic activities such as soilfumigation and biomass burning. Other poten-tially important anthropogenic bromine sourcesare halons, used in fire extinguishers. Currently,bromine gases are less than 1% as abundant aschlorine gases. Even so, ozone destruction bythe bromine/chlorine cycle, Reactions (7), (15),(16), and (11), is thought to account for about20% of the ozone lost in the polar regions.
Summary of Conditions for the Ozone Hole
The three requirements for massive ozoneloss in the stratosphere are now recognized to be(1) chlorine and bromine in the atmosphere, (2)cold temperatures and particle surfaces for het-erogeneous chemistry, and (3) modest amountsof sunlight. This is shown schematically in Fig-ure 14. These three conditions are all met in theunique environment of the Antarctic strato-sphere. The polar vortex that forms each winterabove Antarctica is important for isolating thestratospheric air, which allows the air to becomevery cold during the winter and reduces theinflux of ozone-rich air from the tropics. The lowtemperatures allow PSCs to form in thewinter/spring and thus support the heteroge-neous chemistry shown in Reaction (13). Sun-light is needed to drive the actual ozone-losscycles such as Reactions (10) and (14). The PSCsalso lead to denitrification, which prevents theactive ClO from reforming inactive ClONO2. Atthe altitude of PSCs, the ozone is completely
THE OZONE HOLE
16
Figure 13. Schematic representation of PSC processing.Reservoir chlorine molecules, ClONO2, react with HCl,also a chlorine reservoir, on PSC surfaces to form HNO3
and Cl2. Sunlight (hν) causes the Cl2 to photolyze into Clatoms, which catalytically destroy ozone. The catalytic cyclecontinues until ClO reacts with NO2 to reform ClONO2.NO2 is produced by the photolysis of gas-phase HNO3.However, HNO3 during the polar night may be permanent-ly removed if the PSC particle containing HNO3 falls outof the stratosphere. This results in low levels of NO2, andthus higher levels of ClO for O3 destruction.
NO2
Cl2 Cl
ClO
O3
O2
ClO
HCl
HNO3
ClONO2
PSC
hν

destroyed. Only when the polar vortex breaksdown in the late spring/early summer doesozone from lower latitudes fill in the hole. It isimportant to note that of the three requirementsfor ozone loss, the only one that has significantly
changed since the 1950s is the amount of chlo-rine and bromine in the atmosphere. Thus, it isthe increasing levels of these halogens that havecaused the regular appearance of the Antarticozone hole.
STRATOSPHERIC OZONE DEPLETION
17
Figure 14. Schematic diagram of the chemistry that causes the ozone hole. During the cold, dark polar winter, PSCs form,and the reservoir chlorine compounds ClONO2 and HCl react on their surfaces. With very little sunlight, the Cl2 is pho-tolyzed into Cl atoms that destroy ozone. As the temperature increases in the late spring, the PSCs evaporate and the reser-voir reactions slow down, resulting in increased ClONO2 and HCl concentrations and replenishment of ozone. From WMOGlobal Ozone Research and Monitoring Project: Scientific Assessment of Ozone Depletion: 1994. No. 37, WMO, Gene-va, Switzerland, 1994, p. 3.4.
Chlorine Reservoirs in the Polar Stratosphere
Inactivechlorine
Surfacereactions
Activechlorine
Gas phasereactions
Inactivechlorine
Fall Early Winter Late Spring
Time
Time
Denitrification & dehydration
Surface processing
Chlorine catalyzedozone destruction
Formation, cooling,& descent
Maximum intensity
Inactive chlorine recovery
Breakup
Surface reaction threshold
Polar vortex evolution
Tem
pera
ture
Abu
ndan
ce
ClONO2
HCl
ClONO2
HCl(Cl2 + ClO + 2Cl2O2)

Arctic Ozone Destruction
Why doesn’t an ozone hole appear over theArctic? The same amount of total chlorine andbromine exists in the northern polar regions asabove Antarctica, and both regions have sunlightduring the spring. An important differencebetween the two areas is temperature, whichaffects how many PSCs form, how long theypersist, and how much they overlap with thereturning sunlight. Data for 1980–88 show thatminimum polar stratospheric temperatures arealways low enough for ice PSCs in the southpolar region, but only occasionally low enoughfor them in northern regions (see Figure 15). Inthe north polar region there are more nitricacid/ice PSCs than pure ice PSCs. The main dif-
ference between the two types of PSCs is howwell they remove nitric acid from the gas phase.Although the nitric acid/ice particles containmore nitric acid by weight than do the pure iceparticles, the ice particles are more effective atpermanently removing nitric acid from the strat-osphere. This is because the ice particles are larg-er, so they fall faster out of the stratosphere, tak-ing the nitric acid with them. If the temperaturesabove the Arctic were lower for longer periodsof time, more ice PSC particles could form, thusremoving more nitric acid and leading to moreozone loss. Even in the absence of ice PSCs, chlo-rine activation via Reaction (13) still occurs effi-ciently on the background stratospheric sulfateaerosols at low temperatures. Thus, low temper-atures in the Arctic would favor ozone loss with-
IVArctic and Global Ozone Destruction
Figure 15. Diagram showing theenvelope of minimum tempera-tures in both the northern andsouthern polar regions of thestratosphere, during each hemi-sphere’s winter and spring. Theapproximate temperature thresh-olds for HNO3/ice and ice aredepicted as horizontal lines. Notethat the Southern Hemisphere ismuch colder than the NorthernHemisphere and thus supportsthe formation of more PSCs.From WMO Global OzoneResearch and Monitoring Pro-ject: Scientific Assessment ofStratospheric Ozone: 1989. No.20, WMO, Geneva, Switzerland,1989, p. 83.
Envelope of Minimum Brightness Temperature1980–1988 MSU Channel 24 (about 90 mb)
210
206
202
198
194
190
186
182JUNDEC
JULJAN
AUGFEB
SEPMAR
OCTAPR
Time (months)
Northern Hemisphere
Southern Hemisphere
Tem
per
atu
re (
K)
HNO3/Ice
Ice
18

out permanent removal of nitric acid. The low temperatures and low ozone levels
over Antarctica are sustained by its very strongvortex circulation in winter. Although the Arcticstratosphere also develops a vortex circulationpattern during the winter, it is not as strong asthe one formed over Antarctica, and air fromthe warmer, lower latitudes often moves intothe Arctic region. This inhibits the Arctic airfrom becoming as cold as in the Antarctic. How-ever, if ozone loss were to occur, the weakerArctic vortex could then transport that ozone-poor air to lower latitudes over populated areas.
During the winter of 1991/92, scientistsfound that all of the chlorine above the Arcticwas essentially ready for catalytic ozonedestruction. Fortunately, massive ozone loss didnot occur at that time because the temperaturesdid not remain low throughout the winter andspring. However, we can reasonably expectozone loss in the northern polar regions to occurduring colder winters. In fact, during the winterof 1994/95, temperatures in the Arctic were thelowest in 30 years, and scientists observedextremely low ozone concentrations—columnamounts as much as 50% below normal.
The temperatures in the Arctic winter1999/2000 were also extremely low, with theregion of temperature low enough to form PSCsbeing the largest recorded in over 40 years ofstratospheric analyses. Ozone loss of over 50%occurred during this Arctic winter at altitudesnear 18 km. While dramatic, the Arctic ozoneloss is still not as severe as that over Antarctica,and thus these recent events have been calledthe Arctic “half-a-hole.” The appearance of theArctic “half-a-hole” proves that ozone loss canand probably will occur over northern latitudesas long as the polar winters remain very coldand chlorine is present in the stratosphere.
Global Ozone Destruction
The polar ozone holes are reasonably simpleto explain through heterogeneous chemistryand atmospheric dynamics. Field measurements
have shown that the chlorine causing the dra-matic ozone loss comes from anthropogenicsources. Hence, we are responsible for the ozoneholes. Therefore, we have introduced policies tocontrol the release of chlorine into the atmo-sphere (see Section V). However, it is nowapparent that stratospheric ozone loss is notconfined to the cold polar regions, but is alsooccurring globally. Data from the TOMS instru-ment on the Nimbus 7 satellite from 1978 to1990 show an overall decrease of up to 0.8% peryear in ozone at midlatitudes (see Figure 16). Inaddition, the latest data from TOMS show thatthe midlatitude ozone concentrations reachedtheir lowest levels on record in 1992 and 1993after the eruption of Mt. Pinatubo. We do notfully understand the mechanisms causing thisglobal ozone loss. However, recent work sug-gests that heterogeneous reactions, like those
STRATOSPHERIC OZONE DEPLETION
19
Figure 16. Global trends in total ozone amounts from 1978to 1990. Percent change per year was deduced from TOMSsatellite data as a function of latitude and time of the year.The decrease in polar ozone during the austral spring (Sep-tember– November) and decreases in ozone at northern mid-latitudes (up to 0.8% per year) are observed. From Stolarski,R.S., P. Bloomfield, R.D. McPeters, and J.R. Herman: Totalozone trends deduced from Nimbus 7 TOMS data. Geo-physical Research Letters 18, 1991, pp. 1015–1018. © American Geophysical Union.
80N
60N
40N
20N
EQ
20S
40S
60S
80SJ F M A M J J A S O N D
TOMS Total Ozone Trends (%/year)
Month
Lat
itu
de
NODATA NO DATA
NO DATA
–1.0–1.5 –0.8
–0.8–0.6
–0.4
–0.4
–0.6
–0.2 –0.2
–0.2–0.2
–0.4–0.4
–0.6
–0.6
–0.4
–0.8–1.0
–1.5–2.0–3.0
–0.6
0
0
0
0

occurring on PSC particles, could take place onstratospheric sulfate aerosols (SSAs), whichbecome more widespread after explosive erup-tions like Mt. Pinatubo. Therefore, heteroge-neous reactions could also be contributing to theobserved global-scale decrease in ozone levels.
SSAs are composed of concentrated solu-tions of sulfuric acid (H2SO4) in water. Thebackground levels of these aerosols (i.e., in theabsence of volcanic eruptions) are thought toarise naturally from the oxidation of OCSreleased at ground level by microorganisms.However, the amount of sulfuric acid in thestratosphere can increase by up to two orders ofmagnitude following a major volcanic eruption.For example, the eruption of El Chichón in 1982injected SO2 into the stratosphere, which rapid-ly oxidized to H2SO4 and became globally dis-tributed. Ozone loss was detected at midlati-tudes after the El Chichón eruption, possiblydue to heterogeneous chemistry on SSAs. In1991, the eruption of Mt. Pinatubo injected 2–3times as much SO2 into the stratosphere as didEl Chichón. The combined increase in aerosolsurface area due to the Mt. Pinatubo eruptionand increase in chlorine in the stratosphere maybe responsible for the record low ozone concen-trations observed recently by TOMS.
The role of sulfuric acid particles is twofold.First, they can promote chlorine activation atlow temperatures via Reaction (13), which isknown to be important on PSC particles. Sec-ond, the SSAs promote the lowering of NOxthrough Reactions (17) and (18):
NO2 + NO3 ↔ N2O5 (gas phase) (17)N2O5 + H2O → 2 HNO3 (on SSAs) (18)
Lower levels of NOx can indirectly lead toincreases in ClO by slowing the formation ofClONO2 via Reaction (12). Recent inclusions ofReactions (13), (17), and (18) into stratosphericmodels show that heterogeneous chemistry onSSAs could cause enhanced ozone loss due toelevated ClO and decreased NOx.
It is important to note that the ozone lossfollowing volcanic eruptions is not due to chlo-
rine injected from the volcanoes. Field measure-ments clearly show that HCl is not enhancedafter such eruptions because it is washed outbefore reaching the stratosphere. Rather, the vol-canic eruptions cause an increase in the surfacearea of SSAs, which then directly or indirectlyactivate chlorine for ozone loss. The mainsource of chlorine to the stratosphere is theanthropogenic CFCs. Thus, volcanoes alone donot cause ozone loss, but volcanic SSAs in con-junction with anthropogenic chlorine andbromine do. Therefore, part of the long-termdownward trend in global ozone is due to thehigher levels of chlorine in combination withheterogeneous SSA chemistry.
Although increased chlorine levels and het-erogeneous reactions on SSAs explain part ofthe trend in ozone, they cannot account for allof the observed ozone loss. Some of the loss canbe accounted for when temperature and concen-tration fluctuations are included in the models.Several theories have been put forward to helpexplain the remaining discrepancy betweenmodeled and measured ozone. One is the dilu-tion of air when the ozone hole dissipates in thelate spring, i.e., mixing of low-ozone air fromhigher to lower latitudes. Another idea is thatair from the midlatitudes is processed throughthe polar regions, causing ozone to be destroyedin an assembly-line fashion. The problem withthese two theories is that neither is likely to pro-duce the observed magnitude of the ozone loss,or to explain the roughly equal ozone lossobserved in the two hemispheres. Another pos-sible contribution to global ozone loss is achange in the dynamics of the atmosphere sothat less ozone is transported to midlatitudes.
Although none of these theories alone canfully explain the current downward trend ofglobal ozone loss, a combination may beresponsible. In the future, atmospheric scientistswill be trying to explain these ozone trends andpredict further changes to the ozone layer inlight of perturbations both natural (e.g., vol-canic) and anthropogenic (e.g., chlorine andbromine compounds that replace CFCs andhigh-flying aircraft—see Section V).
ARCTIC AND GLOBAL OZONE DESTRUCTION
20

Since the 1950s, CFCs have been used inrefrigerators, in aerosol spray cans, as cleaningsolvents, and as foam-blowing agents. AfterMolina and Rowland showed in the 1970s thatchlorine from CFCs could destroy ozone, CFCuse in spray cans (aerosols) for hairspray,deodorant, and paint was restricted in the Unit-ed States, Canada, Norway, and Sweden. Figure17 shows how this ban affected worldwide CFCproduction and consumption. Overall, theproduction of CFCs has steadily increased fromthe 1960s to the mid-1980s except for the ten-year period directly after CFCs in aerosols were
banned. The consumption pie charts show thatthe relative usage of CFCs in aerosols decreasedbetween 1974 and 1988. However, usage forother applications continued to rise after aerosolusage dwindled, causing the overall productionrate to climb during the 1980s. This is an exam-ple of poor regulations as the use of CFCs inaerosols was restricted instead of the CFCs.
The growing use of CFCs and the hypothe-sis that CFCs cause ozone depletion promptedmany nations of the world to sign the ViennaConvention for the Protection of the OzoneLayer in 1985. Although the Vienna Convention
21
VOzone Depletion and Policy
Figure 17. CFC use plotsshowing total world produc-tion from 1960 to 1988 and piecharts of the applications ofCFCs in 1974 and in 1988.The amount of CFCs used inaerosol spray cans hasdecreased since the late 1970s.However, CFCs are increasing-ly being used as refrigerants,cleaning agents, and blowingagents. Although the relativeamount of aerosol use hasdecreased, the total productionof CFCs was still increasing inthe 1980s due to the otherapplications. From McFarland,M.: Chlorofluorocarbons andozone. Environmental Sci-ence and Technology 23,1989, pp. 1203–1205. © 1989,American Chemical Society.
Estimated World Production and Consumption of Chlorofluorocarbons
(a) Production3000
2500
2000
1500
1000
500
01960 1970 1980
Aerosols
Total CFCs
Non-aerosols
Year
Am
ou
nt
(mill
ion
lbs/
year
)
(b) Consumption (by application)
1974 (2025 million lbs) 1988 (2510 million lbs)
Aerosols69%
Refrigerants30%
Aerosols19%
Refrigerants18%
Cleaningagents 6%
Blowingagents 5%
Other 2%
Other 4%
Blowingagents 28%
Cleaningagents 19%

did not include explicit restrictions on CFCs, itcalled for future regulatory actions and scientif-ic understanding of the ozone layer, CFCs, andhalons. More importantly, it recognized thatozone depletion was an international issue andthat the policy questions it raised would beresolved by the international community. Thus,it set the stage and provided the framework forthe Montreal Protocol of 1987 (see below). Fur-thermore, it was prepared before the discoveryof the ozone hole and, in fact, before any ozoneloss was observed in the “real” atmosphere.
Following the framework of the ViennaConvention, the discovery of the ozone hole ledto the formation of the Montreal Protocol onSubstances That Deplete the Ozone Layer,which officially limited the production and useof CFCs. The countries that signed the originaldocument in 1987 agreed to freeze CFC produc-tion and use at the 1986 rates by the year 1989,and to cut CFC production and use by 50%over the next ten years. After the protocol wasadopted, it was determined that the rates pro-posed for CFC reduction were not rapidenough to substantially decrease the chlorineloading of the atmosphere. In fact, under theoriginal protocol that was established in Mon-treal in 1987, chlorine levels would still beincreasing by the end of the 21st century (seeFigure 18).
After scientific evidence demonstrated thatthe ozone hole was caused by the chlorine fromCFCs and that midlatitude ozone loss was alsooccurring, the 1990 London amendments wereadded to the Montreal Protocol to accelerate thereduction of the original CFCs listed to 100%reduction, i.e., a complete phaseout, by the year2000. The London amendments also provided atimetable for 100% phaseout of other ozone-destroying compounds, including a more com-plete list of CFCs, halons, carbon tetrachloride,and methyl chloroform. After the Londonamendments were adopted, the chlorine andbromine atmospheric levels were expected topeak by 2020 and not return to pre–ozone holelevels until the end of the 21st century, as shownin Figure 18.
Research continued, and the scientificunderstanding of ozone depletion progressed.Detailed model calculations showed that if theCFCs were phased out four years earlier, thetime for chlorine concentrations to return topre–ozone hole levels would be reduced by 20years. (Compare the London and Copenhagencalculations in Figure 18.) Furthermore, in thewinter of 1991/92, scientists who were monitor-ing ozone loss above the Arctic reported to thepublic the presence of unusually high amountsof ClO over the northern high- to midlatitudes.Fortunately, the winter did not remain coldenough for the active chlorine to replenish itselfvia heterogeneous reactions.
The predictions that chlorine concentrationscould be more rapidly returned to pre–ozonehole levels coupled with the immediate possibil-ity of ozone loss over populated regionsprompted the addition of the Copenhagen
OZONE DEPLETION POLICY
22
Figure 18. Atmospheric chlorine loading vs. year for differ-ent scenarios. The critical level of 2 ppbv is the amount ofchlorine when the ozone hole began to form. Not shown arethe predictions for chlorine levels without any restrictions.From Turco, R.P.: Earth Under Siege: Air Pollution andGlobal Change, p. 434. © 1996, Oxford University Press,Inc. Reprinted by permission.
8
6
4
2
01980 2020 2060 2100
Montreal Protocol 1987
London 1990
Critical level = 2 ppbv Cl
Copenhagen1992
YearA
tmo
sph
eric
ch
lori
ne
(pp
bv)

amendments in 1992. These amendments pro-vided for the complete phaseout of CFCs, car-bon tetrachloride, and methyl chloroform by theyear 1996. Furthermore, hydrochlorofluorocar-bons (HCFCs), which were being developed totemporarily replace CFCs, were added to the listfor phaseout by the year 2030 because they alsocontained chlorine that could destroy ozone.Since HCFCs react in the troposphere with OH,most HCFCs do not reach the stratosphereintact like the CFCs. Therefore, the threat to theozone layer is not as serious from HCFCs as it isfrom CFCs. Finally, these amendments recog-nized the potential for the bromine-containingcompound methyl bromide, used widely as afumigant, to destroy ozone. As shown in Reac-tions (7), (15), (16), and (11), bromine candestroy ozone in a synergistic cycle with chlo-rine. However, decreases in chlorine levels andincreases in bromine levels could increase theimportance of bromine-catalyzed ozone loss.The Copenhagen amendments provided a limitof the methyl bromide production rate to 1991levels beginning in 1995.
Other amendments to the Montreal Protocolwere drafted at the 1997 Montreal meeting tocommemorate the tenth anniversary of the orig-inal protocol. There, the parties agreed to accel-erate the complete phaseout of methyl bromideproduction by five years to 2005 for developedcountries and to set 2015 as the date of phaseoutfor developing countries. They also agreed toset up a licensing system for import and exportof substances controlled by the protocol.
When the parties met again in Cairo in 1998,one of the main topics of discussion was how tomake the Montreal Protocol policies consistentwith the 1997 Kyoto Protocol on global warm-ing. Some of the ozone replacement com-pounds, such as hydrofluorocarbons (HFCs)and perfluorocarbons (completely fluorinatedhydrocarbons), absorb infrared radiation andcould create a conflict between protecting theozone layer and preventing the buildup of green-house gases. Furthermore, global climate modelsindicate that a warmer troposphere causes cool-er temperatures in the stratosphere, which could
affect the ozone layer. Although it was agreedthat policies for the two protocols needed to becoordinated, no new amendments were generat-ed from this meeting.
In 1999, the parties met in Beijing and draft-ed amendments that mainly focused on HCFCs.They agreed to freeze production of these com-pounds to 1989 levels in 2004 for developedcountries and to 2015 levels in 2016 for develop-ing countries. Complete phaseout of HCFCswill occur in 2020 for developed countries andin 2040 for developing countries. Futhermore,trading of these compounds will be bannedunless the trading countries ratify the 1992Copenhagen amendments. The Beijing amend-ments also called for complete phaseout of anew compound, bromochloromethane(CH2BrCl), for all countries by 2002.
For the amendments to enter into force, atleast 20 countries must ratify, accept, or approvethem. As of March 2000, all but the Beijingamendments have been ratified by the mini-mum number of countries. Text of the Protocoland amendments and the current ratificationstatus are available to view on the UnitedNations Environment Programme website atwww.unep.ch/ozone.
So, where would we be without CFC regu-lations? Without any restrictions, the chlorinelevels would continue to increase by about 1ppbv per decade (see Figure 18). If more coun-tries were to become industrialized in theabsence of any CFC regulations, the rate ofincrease would become even larger. By the year2050, we would have had at least 10.5 ppbvmore of chlorine in the atmosphere, which is offthe scale of Figure 18. At the time the ozonehole appeared, chlorine concentrations in theatmosphere were about 2 ppbv. With the 1992Copenhagen amendments, the chlorine isexpected to peak at 4.3 ppbv near the year 2000and to decrease to pre–ozone hole concentra-tions by 2060. Therefore, under the most strin-gent, current CFC regulations, we can reason-ably expect the ozone hole formed by chlorinecycles to be a problem for decades. However,with the CFC regulations in place, the chlorine
STRATOSPHERIC OZONE DEPLETION
23

levels should return to the pre–ozone hole levelsand the ozone layer should recover.
Recent observations of CFCs in the atmo-sphere show that the rate of increase is nowbeginning to slow down (see Figure 19), indicat-ing that the international agreements are work-ing. In fact, one purely anthropogenic com-
pound, methyl chloroform, is actually decreas-ing due to the controls. Methyl chloroform lev-els are dropping faster than those of CFC-11 andCFC-12 due to its shorter lifetime (5.4 years,compared with 50 years for CFC-11 and 102years for CFC-12).
One interesting aspect of the above ozoneprotection process is that scientific advance-ments and policy decisions progressed in paral-lel and in coordination. As new scientific dis-coveries were made, scientists relayed them tothe policy community, and policies evolvedthrough the amendments to the Montreal Proto-col. Such a process occurred because the origi-nal Vienna Convention specifically set forth aschedule and mechanism whereby the interna-tional scientific community would produce peri-odic “state of the ozone layer” assessments.Those reports directly fed into the policy negoti-ations and resulting decisions. The success ofthis international scientific/political feedbackprocess is entirely unprecedented in the envi-ronmental arena.
Observations of a slowdown in growth ratesof some CFCs are proof that the halogen chal-lenge can be met by international agreements tocontrol the compounds that contain chlorineand bromine. However, anthropogenic pertur-bations to the ozone layer can also be caused byother compounds. One possibility raised in the1970s is related to the increased use of super-sonic transport planes (SSTs) and their NOx
OZONE DEPLETION POLICY
24
Figure 19. Tropospheric measurements of CFC-11 (CFCl3),CFC-12 (CF2Cl2), and methyl chloroform (CH3CCl3) as afunction of year. The atmospheric release rates of these com-pounds have been decreasing since 1991. The concentra-tions of CH3CCl3 are decreasing more rapidly than CFC-11and CFC-12 because the atmospheric lifetime of CH3CCl3is much shorter. From Ravishankara, A.R., and D.L. Albrit-ton: Methyl chloroform and the atmosphere. Science 269,1995, pp. 183–184. Reprinted by permission.
600
500
400
300
200
100
01980 1985 1990 1995
MontrealProtocol
Londonamendment Copenhagen
amendment
Year
Atm
osp
her
ic m
ixin
g r
atio
, pp
tv
CFC-12 (CF2Cl2)
CFC-11 (CFCl3)
Methyl chloroform (CH3CCl3)
Recently, some scientists have proposed vari-ous engineering solutions to the ozone-lossproblem. One proposal has been to fill theozone hole with ozone, like filling a pothole inthe street. However, this is impractical on amass basis (see questions). Another suggestionby Ralph Cicerone and colleagues was to injectpropane, a hydrocarbon, into the stratosphere.The intended effect of adding propane was toscavenge the chlorine atoms. After inspecting
their calculations more closely, however, theydetermined that their proposal could make theozone problem worse. So, in addition to thechallenges of scaling up laboratory and theo-retical solutions for the stratosphere, engi-neered solutions (sometimes called techno-fixes) to the ozone problem are risky unless allof the potential chemical ramifications are con-sidered. Unforeseen reactions could alsochange the predicted outcome of techno-fixes.
Engineering Solutions to Ozone Depletion

emissions. Catalytic destruction of ozone due tothe NOx cycle, Reactions (5) and (6), was origi-nally proposed by Paul Crutzen as a naturalozone-loss mechanism (because NOx was pro-duced naturally by oxidation of N2O, a gas thatis emitted by the Earth’s biosphere). However,Harold Johnston pointed out that a proposedfleet of 500 SSTs would emit NOx directly intothe stratosphere, where the aircraft would fly toattain high speeds. This started a huge scientificand political debate on whether or not high-fly-ing aircraft exhaust would damage the ozonelayer. In 1975, the U.S. Congress decided not tobuild a fleet of SSTs, not because of their envi-ronmental impacts, but because they were noteconomically viable. More on the story of SSTs,CFCs, and ozone in the 1970s is given in TheOzone Wars by L. Dotto and H.I. Schiff. John-ston’s impact on atmospheric chemistry andglobal public policy decisions earned him the1997 National Medal of Science.
In recent years, newer versions of high-fly-ing aircraft, now called high-speed civil trans-ports (HSCTs), are being considered. As was thecase with SSTs in the 1970s, the new HSCTs alsowould directly inject NOx into the stratosphere,although the proposed new engine technologywould result in much lower NOx emissions. Inaddition, laboratory measurements of Reaction(18) on sulfuric acid surfaces indicate that theNOx emissions would react on the background
stratospheric sulfate aerosols to form nitric acid,essentially stopping ozone destruction by theNOx cycle but increasing the importance of theClOx cycle. Another new twist in the HSCTdebate is that the emissions from these aircraftcould also increase the particle surface areaavailable for reaction. Thus, detailed photo-chemical models including the heterogeneousreaction rates and particle formation calcula-tions are needed to predict the effect of HSCTson stratospheric ozone. In addition to the chem-istry of HSCT emissions, the eventual distribu-tion of the emissions in the stratosphere isimportant in assessing the impact of these air-craft on the ozone layer.
International research on HSCTs has raisedthe question of how the current subsonic fleet ofaircraft is affecting the atmosphere. Theseplanes usually fly in the troposphere except onpolar routes, where the stratosphere is at alower altitude. Currently, little is known abouthow the emissions from these planes change thechemistry of the upper troposphere and lowerstratosphere and how widely the emissions aredistributed (atmospheric dynamics). In additionto the chemical and dynamical questions,researchers are looking at how the emissions ofsubsonic aircraft affect cirrus (high-altitude)cloud formation, which is important for globalradiation studies and climate (see moduleClouds and Climate Change).
STRATOSPHERIC OZONE DEPLETION
25
Direct observations of the atmosphere haveshown that the ozone hole occurs above Antarc-tica every spring and that chlorine from anthro-pogenic sources is responsible for this event. Bystudying the ozone hole phenomenon, scientistshave determined that humans can cause envi-ronmental change on a global scale and have animpact on the Earth’s future. In the case of theozone layer, steps have been taken to avoid fur-ther environmental problems by regulatinghuman activities. Because the effect of releasingCFCs is a global issue, international protocolshave been established in a cooperative effort forthe planet’s future. The ozone hole event isobservable every austral spring and will contin-ue to form until the chlorine levels are reduced.The ozone hole has been considered a relativelysimple problem where analysis of the underly-ing causes has resulted in the formation of aclear solution: restricted use of anthropogenichalogenated compounds. Unfortunately, anoth-er major global-scale environmental problem,climate change due to increasing greenhousegases, is more complex and unlikely to beresolved in such a straightforward manner.
Future challenges in the study of the ozonelayer lie in the area of global ozone loss over themidlatitudes, where most of the Earth’s popula-
tion lives. Currently, we do not understand thedetails well enough to provide a full explana-tion or to predict what may occur in the future.As with the increasing amount of CO2 in thetroposphere and how it relates to global warm-ing, global ozone depletion needs long-termrecords and models that can represent allprocesses accurately. The linkage of ozone lossto tropospheric climate changes requires a betterunderstanding of how the upper troposphereand lower stratosphere are coupled. For exam-ple, increasing concentrations of CO2, CH4,N2O, and other greenhouse gases are believedto cause cooling of the stratosphere. Our presentunderstanding of ozone-layer chemistry indi-cates that stratospheric cooling would causemore PSCs to form and the heterogeneous reac-tions on SSAs to occur more efficiently. Both ofthese factors would create more ozone loss. If,however, lower temperatures in the stratospherechange atmospheric circulation patterns, theeffect of increasing greenhouse gases on theozone layer would be harder to predict. Finally,we need to understand how emissions from fuelcombustion affect the ozone layer so that we canmake informed decisions about flying more air-craft in the stratosphere.
26
VIConclusion

1. In terms of altitude, where are the tropo-sphere and the stratosphere located? Whereis ozone loss a problem? Where wouldincreases in ozone be a problem?
2. How and where is ozone produced? Writeout the relevant equations.
3. Write down a catalytic cycle for the destruc-tion of ozone by chlorine.
4. How many ozone molecules can bedestroyed by one chlorine atom?
5. Which of the following, if released in mas-sive quantities on Earth, could lead to sub-stantial ozone loss?
HCl NaCl CF2Cl2
6. Why are CFCs being regulated when NaClis emitted from oceans in much greaterabundance?
7. For what contributions did Molina, Row-land, and Crutzen win the 1995 Nobel Prizein chemistry?
8. Why did the U.S. ban on CFCs in aerosolspray repellents in the 1970s have relativelylittle impact on global levels of CFCs?
9. Since CFCs are produced in the NorthernHemisphere near the ground, why shouldwe worry about their causing the Antarcticozone hole?
10. What compounds are being used to replaceCFCs, and why are they less harmful to theozone layer?
11. What are halons, and why have they beenbanned?
12. What three environmental conditions areneeded to cause massive ozone loss asobserved in the Antarctic ozone hole?
13. Why is the ozone hole worse over the SouthPole than over the North Pole?
14. What natural phenomenon causes ozone lossin the polar region to be worse some yearsthan others? What natural phenomenoncauses ozone loss in the global stratosphereto get worse?
15. Major explosive volcanic eruptions producecopious amounts of SO2 and HCl. Explainwhy such eruptions cause a large increase instratospheric sulfur but have little impacton stratospheric chlorine.
16. Why is ozone loss such a big problem for alllife forms? What are the potential effects onhumans of ozone loss?
17. Where are you more likely to get a sunburn,in the tropics or at midlatitudes? List threereasons for your answer.
18. Why do biologists looking for life on Marswant to look inside of rocks rather than onthe surface of the planet?
27
Problems and Discussion Questions

19. How would each of the following emittedfrom aircraft potentially impact ozone?
NO SO2 H2O
20. What government treaties are in place tohelp maintain the ozone layer? What impactdid the discovery of the ozone hole have onthe compounds regulated and the timeline?
21 The surface area of the Earth is 5 x 1018 cm2.A typical ozone column is 300 DU.
a. How many molecules of O3 are there inthe atmosphere?*
b. What is the mass of O3 molecules in theatmosphere? The weight of one O3 mole-cule is 8 x 10-23g.*
c. There are 6 billion people on earth, withan average weight of 60 kg. What is thetotal mass of humans on earth?*
d. Given the above masses, is it likely thatyou could replace the stratospheric O3layer by making O3 at the surface of theEarth and transporting it up to the strato-sphere?
PROBLEMS AND DISCUSSION
28
Answers:
21a. 4 x 103721b. 3 x 10¹⁵g21c. 3.6 x 10¹⁴g

Aerosol—a mixture of solid or liquid particlesdispersed in a gas. Rain, snow, smoke, andhairspray are all examples of aerosols.
Anthropogenic—made by humans. Pizza isanthropogenic; broccoli can be consideredeither anthropogenic or natural; milk is nat-ural; sea salt is natural.
Atmospheric dynamics—the air circulation pat-tern or how air moves in the atmosphere.
Austral—specific to the Southern Hemisphere,usually used when referring to seasons orstars.
Catalytic cycle—a set of reactions that can occurmany times before stopping. At least onespecies is converted back to itself by otherreactions in the cycle. Polar stratosphericozone depletion occurs via a catalytic cycle,Reactions (7) and (9) through (11). In thatcatalytic cycle, a single chlorine atom candestroy 100,000 ozone molecules beforeanother reaction can break the chain of reac-tions.
Chlorine activation—a process where inertchlorine reservoir molecules, ClONO2 andHCl, are converted into active chlorine radi-cals, Cl and ClO, that can destroy ozone in acatalytic cycle.
Chlorofluorocarbons (CFCs)—anthropogenic,carbon-based compounds containing chlo-rine and fluorine that are used as refriger-ants, blowing agents, and cleaning solvents.Their production is now being limitedbecause the chlorine from these moleculeseventually destroys stratospheric ozone.
Column amount—the total number of ozonemolecules above a square centimeter of theEarth’s surface.
Denitrification—a process where nitrogenspecies are permanently removed from thestratosphere. Denitrification is observedwhen the measured amount of nitrogenspecies is less than predicted.
Halons—anthropogenic, carbon-based com-pounds containing bromine that are used infire extinguishers. Like CFCs, their produc-tion is currently being regulated because thebromine in these compounds eventuallydestroys stratospheric ozone.
Heterogeneous—refers to two physical states orphases, like gas and solid or gas and liquid.The opposite of heterogeneous is homoge-neous, where the physical state is the same.For example, ice in water is a heterogeneous(solid and liquid) system. Cranberry-applejuice is an example of a homogenous (one-phase) system. Sodas can be either: they areheterogeneous systems when fresh (liquidwith gas bubbles) and homogeneous whenflat.
Hydrochlorofluorocarbons (HCFCs)—anthro-pogenic, carbon-based compounds contain-ing chlorine, fluorine, and hydrogen that arebeing developed to temporarily replaceCFCs. They react in the troposphere, so theyare “safer” than CFCs for the ozone layer.As with CFCs their production will eventu-ally be stopped, and other compounds arebeing developed to replace them.
Inert—nonreactive. Couch potatoes are inert.Latitude—an indicator of a distance from the
equator. The equator is at 0° (° = degrees)latitude and the poles are at 90° latitude(90°N is the North Pole and 90°S is theSouth Pole). Low latitudes are near the
29
Glossary

equator and the tropics, midlatitudes arewhere most of the world’s population lives,and high latitudes are near the poles.
Photochemical reactions (or photolysis)—reac-tions that are light-initiated. Photosynthesisis a photochemical reaction where carbondioxide reacts with water in the presence oflight to produce oxygen and sugars, thematerial of new plant growth.
Polar stratospheric clouds (PSCs)—cloudsformed in the stratosphere during the coldpolar winter. Heterogeneous reactions ofchlorine compounds on the surfaces of theseclouds play an important role in ozonedestruction.
Stratosphere—the part of the upper atmospherewhere the ozone layer exists. In the strato-sphere, the temperature increases withincreasing altitude.
Stratospheric sulfate aerosols (SSAs)—small,sulfuric acid particles that exist in the strato-sphere globally. Heterogeneous reactions ofnitrogen and chlorine compounds on SSAscould be fostering global ozone loss.
Tropopause—the altitude where the tropo-sphere and stratosphere meet. Thetropopause height varies with season andlatitude.
Troposphere—the part of the atmosphere clos-est to Earth. We breathe the air in the tropo-sphere, and weather is controlled by tropos-pheric air motions.
Ultraviolet (UV) radiation—high energy lightwith wavelengths between 200 and 400 nm.Table 1 contains details on regions of theUV spectrum.
GLOSSARY
30

Arctic ozone: AASE II observations. Science 261(special issue), 27 August 1993.
The changing atmosphere: Implications formankind. Chemical and Engineering News64(47) (special issue), 24 November 1986.
Dotto, L., and H.I. Schiff: The Ozone Wars. Dou-bleday, Garden City, New York, 1978.
National Research Council: Atmospheric Effects ofStratospheric Aircraft: An Evaluation ofNASA’s Interim Assessment. National Acade-my Press, Washington, D.C., 1994.
Toon, O.B., and R.P. Turco: Polar stratosphericclouds and ozone depletion. Scientific Ameri-can, June 1991, 68–74.
Turco, R.P. : The stratospheric ozone layer. InEarth Under Siege: Air Pollution and GlobalChange, Oxford University Press, New York,1996.
Wayne, R.P.: Ozone in the earth’s stratosphere.In Chemistry of Atmospheres (2nd ed.),Oxford University Press, New York, 1991.
World Meteorological Organization (WMO)Global Ozone Research and Monitoring Pro-ject: Atmospheric Ozone: 1985. No. 16, WMO,Geneva, Switzerland, 1985.
WMO Global Ozone Research and MonitoringProject: Scientific Assessment of Ozone Deple-tion: 1989 (No. 20), 1991 (No. 25), 1994(No. 37), and 1998 (No. 44), WMO, Geneva,Switzerland.
Other modules in the UCAR Global ChangeInstruction Program Available from UniversityScience Books, 55D Gate Five Road, Sausalito,CA 94965
Ennis, C., and N. Marcus: Biological Conse-quences of Global Climate Change
Rosencranz, A.: International EnvironmentalLaw and Policy
Streete, J.: The Sun-Earth System
Websites:www.unep.ch/ozone/www.unepie.org/ozonaction.html
31
Suggested Additional Reading

active chlorine (ClO, Cl2, and (ClO)2) 14, 15,16, 17
aircraft: emissions 9, 24–25, 26high speed civil transports (HSCTs) 25supersonic transports (SSTs) 24–25
Antarctic ozone hole: “fixing” the hole 24altitude profile of 12–13and polar vortex 14, 16chemistry of 14–16compared to Arctic 18–19conditions for 16–17discovery of 12–13historical record of 12possible explanations for 13–14role of polar stratospheric clouds in 14–16time frame of 12, 16–17“smoking gun” of 14, 15
Arosa, Switzerland 6atmosphere:
stratosphere 3stratospheric circulation 3, 8, 13–14, 25temperature structure 2–3tropopause 3troposphere 2
Beer’s law 6bromine nitrate (BrONO2) 16bromine, atomic and oxides (BrOX = BrO +
BrO2) 9, 16bromochloromethane (CH2BrCl) 23
carbon dioxide (CO2) 11, 26carbon tetrachloride (CCl4, CFC–10):
restrictions 22, 23measurements 10
carbonyl sulfide (OCS) 4, 20catalytic cycles:
with bromine and chlorine oxides 16with chlorine oxides 9, 14, 16, 25
with nitrogen oxides 9, 25with other trace species 9
CFC-10, see carbontetrachlorideCFC-11, see trichlorofluoromethaneCFC-113, see 1,1,2-trichloro-1,2,2-trifluoroethaneCFC-12, see dichlorodifluoromethaneChapman, Sidney 7chlorine monoxide (ClO) 9, 14, 16, 17, 20, 22chlorine monoxide dimer ((ClO)2) 14, 17chlorine nitrate (ClONO2) 14, 15, 16, 17, 20chlorine oxides (ClOx = ClO + ClO2) 9, 14, 16chlorine, atomic (Cl) and molecular (Cl2) 9, 14,
15, 16, 17chlorine, predictions of 22–23chlorine, stratospheric sources of 4, 9, 10, 20chlorodifluoromethane (CHClF2, HCFC-22) 10chlorofluorocarbons (CFCs):
global production and consumption 21lifetimes 24measurements 10, 24properties and uses 9, 21restrictions 22–23source of stratospheric chlorine 4, 9, 10
Cicerone, Ralph 9, 24climate change 23, 25, 26Crutzen, Paul 8, 25
denitrification of the stratosphere 15–16, 18–19deoxyribonucleic acid (DNA) 1, 3, 5dichlorodifluoromethane (CF2Cl2, CFC-12):
lifetime 24measurements 10, 24
dinitrogen pentoxide (N2O5) 20Dobson spectrometer and measurements 6, 12Dobson units (DU) 6, 8, 12Dobson, George M. B. 6, 7Dotto, Lydia 25
Faraday, Antarctica 12Farman, Joseph (Joe) 12
32
Index

global warming 23greenhouse gases 23Halley Bay, Antarctica 12halons:
restrictions 22source of stratospheric bromine 4, 16uses 16
Hartley, John 7HCFC-22, see chlorodifluoromethaneheterogeneous reactions 15, 16HSCTs, see aircraft: high speed civil transportshydrochloric acid (HCl) 4, 9, 10, 15, 16, 17, 20hydrochlorofluorocarbons (HCFCs):
as greenhouse gases 23potential source of stratospheric chlorine23restrictions 23
hydrofluorocarbons (HFCs) 23hydrogen bromide (HBr) 16hydrogen oxides (HOx = OH + HO2) 9hydroxyl radical (OH) 4, 9, 23
Johnston, Harold (Hal) 9, 25
Kyoto Protocol on Climate Change (1997) 23
McMurdo Station, Antarctica 13methane (CH4) 4, 9, 26methyl bromide (CH3Br) 16, 23methyl chloride (CH3Cl) 10methyl chloroform (CH3CCl3):
lifetime 24measurements 10, 24restrictions 22, 23
mixing ratio 6Molina, Louisa 14, 15,Molina, Mario 9, 14, 15, 21Montreal Protocol on Substances that Deplete
the Ozone Layer (1987) and Amendments22–24
National Medal of Science, recipients 15, 25nitrate radical (NO3) 20nitric acid (HNO3) 15, 16, 20nitrogen oxides (NOx = NO + NO2) 8–9, 13,
14, 15–16, 20, 24–25nitrous oxide (N2O) 4, 9, 25, 26Nobel prize in chemistry, 1995 recipients 8, 9
oxygen, atomic (O) 7, 9, 14
oxygen, excited atomic (O*) 9oxygen, molecular (O2) 7, 9, 11, 14, 16ozone (O3):
absorption spectrum 4, 5, 7altitude profile of 1, 3, 7and life on Earth 11Arctic 18–19changes and ultraviolet radiation 5column abundance 4, 6, 8, 12destruction by catalytic cycles 9, 14, 16, 25distribution 8global trends in 19–20good vs. bad 3layer 4, 7measurements 6, 8models of 20, 25production 7ultraviolet absorption 4, 5, 7, 11
perfluorocarbons 23polar stratospheric clouds (PSCs):
chemical processing by 15, 16formation and composition 14–15, 18ice 15, 18nitric acid/ice 15, 18surface reactions 15, 16, 17
Rowland, F. Sherwood 9, 21
Schiff, Harold I. 24Schönbein, Christian 7sodium chloride (NaCl) 4Solar Backscatter Ultraviolet (SBUV) instrument
12solar cycle 8, 13solar radiation: ultraviolet (UV) and visible 5Solomon, Susan 14, 15South Pole, Antarctica 12SSTs, see aircraft: supersonic transportsStolarski, Richard 9stratospheric sulfate aerosols (SSAs):
composition 20sources 20surface area and reactions 20, 25
sulfur dioxide (SO2) 20sulfuric acid (H2SO4) 20Syowa, Antarctica 12
Total Ozone Mapping Spectrometer (TOMS)12, 13, 19
STRATOSPHERIC OZONE DEPLETION
33
trichlorofluoromethane (CFCl3, CFC-11): lifetime 24measurements 10, 24
1,1,2-trichloro-1,2,2-trifluoroethane(CCl2FCClF2, CFC-113) 10
ultraviolet (UV) radiation and ozone changes1, 5
Vienna Convention for the Protection of theOzone Layer (1985) 21–22, 24
volcanoes: El Chichón 20emissions into the stratosphere 4, 20Mt. Pinatubo 19, 20
vortex circulation 13–14, 17, 19vortex, temperature within 17, 18
water vapor and cloud formation 4, 14–15
INDEX
34

STRATOSPHERIC OZONE DEPLETION
Ozone depletion is a global problem that is caused by human activities. This newmodule in the Global Change Instruction Program describes the chemistry of ozone,how ozone destruction is attributed to human activity, and what society is doing toavert further damage to the ozone layer. This introductory module can be integratedinto existing courses related to global change in earth and environmental sciences,meteorology, biology, and chemistry. Questions for the reader and a glossary areincluded.
GLOBAL CHANGE INSTRUCTION PROGRAM
• EFFECTS OF CHANGING CLIMATE ON WEATHER AND HUMAN ACTIVITIESby Kevin E. Trenberth, Kathleen Miller, Linda Mearns, and Steven Rhodes
• SYSTEM BEHAVIOR AND SYSTEM MODELING, by Arthur A. Few Winner of the EDUCOM Award, includes STELLA® II demo CD for Macs and Windows
• THE SUN-EARTH SYSTEM, by John Streete
• CLOUDS AND CLIMATE CHANGE, by Glenn E. Shaw
• POPULATION GROWTH, by Judith E. Jacobsen
• BIOLOGICAL CONSEQUENCES OF GLOBAL CLIMATE CHANGEby Christine A. Ennis and Nancy H. Marcus
• CLIMATIC VARIATION IN EARTH HISTORY, by Eric J. Barron
• EL NIÑO AND THE PERUVIAN ANCHOVY FISHERY, by Edward A. Laws
NEW FROM UNIVERSITY SCIENCE BOOKS:
CONSIDER A CYLINDRICAL COW, by John Harte
The cow is back. This time she is cylindrical, not spherical. Featuring a new core set of25 fully worked-out problems, this book is organized according to five thematic sectionson probability, optimization, scaling, differential equations, and stability & feedback.Following in the spirit of Consider a Spherical Cow, the Cylindrical Cow will help stu-dents achieve a whole new level of environmental modeling and problem solving.
UNIVERSITY SCIENCE [email protected] Information: Telephone (703) 661-1572
Fax (703) 661-1501
Cover design by Craig Malone, cover photograph by David Hofmann