Strategy & Overview - ceoclub.eu · Strategy & Overview March 2005 You & Us. 1 ... NNM Invested...
23
Strategy & Overview March 2005 You & Us
Transcript of Strategy & Overview - ceoclub.eu · Strategy & Overview March 2005 You & Us. 1 ... NNM Invested...
Strategy & Overview
March 2005
You & Us
1
Caution regarding forward-looking statementsThis communication contains statements that constitute “forward-looking statements”,including, but not limited to, statements relating to the implementation of strategic initiatives,such as the European wealth management business, and other statements relating to ourfuture business development and economic performance.
While these forward-looking statements represent our judgments and future expectationsconcerning the development of our business, a number of risks, uncertainties and otherimportant factors could cause actual developments and results to differ materially from ourexpectations.
These factors include, but are not limited to, (1) general market, macro-economic,governmental and regulatory trends, (2) movements in local and international securitiesmarkets, currency exchange rates and interest rates, (3) competitive pressures, (4) technologicaldevelopments, (5) changes in the financial position or credit worthiness of our customers,obligors and counterparties and developments in the markets in which they operate, (6)legislative developments, (7) management changes and changes to our Business Groupstructure and (8) other key factors that we have indicated could adversely affect our businessand financial performance which are contained in other parts of this document and in our pastand future filings and reports, including those filed with the SEC.
More detailed information about those factors is set forth elsewhere in this document and indocuments furnished by UBS and filings made by UBS with the SEC, including UBS’s AnnualReport on Form 20-F for the year ended 31 December 2003. UBS is not under any obligation to(and expressly disclaims any such obligations to) update or alter its forward-looking statementswhether as a result of new information, future events, or otherwise.
2
Agenda
♦ Facts & Figures
♦ Achievements & Track Record
♦ Growth Plan & Challenges
♦ Conclusion: Attractive Investment Case

Facts & Figures

4
♦ World's largestprivate bank
♦ CHF 918bninvested assets
♦ 4mn individualand corporateclients
♦ 25-35% of Swissbanking market
♦ 4th largest fullservice US broker
♦ 2mn privateclients
♦ 15% marketshare, 369 officesacross USA
♦ #1 muni franchise(15% marketshare)
♦ Top 5 globalbulge bracketposition
♦ #1 global Equityhouse (11%market share)
♦ #1 FX house (12%market share)
♦ 6'000corporations/institutions/clients
♦ Leadinginstitutional andwholesale assetmanager
♦ CHF 601bninvested assets
♦ Broad basedcapabilities
♦ Second largestEuropean mutualfund manager
Facts and figures
CHF 2.3 trillion invested assetsCHF 113.9 billion market capitalization1
CHF 34.5 billion equityOver 67'000 employees
UBS Group
WealthManagement &
Business Banking
WealthManagement
USAInvestment Bank Global Asset
Management
Note:1 Market capitalisation as per 9.2.2005
5
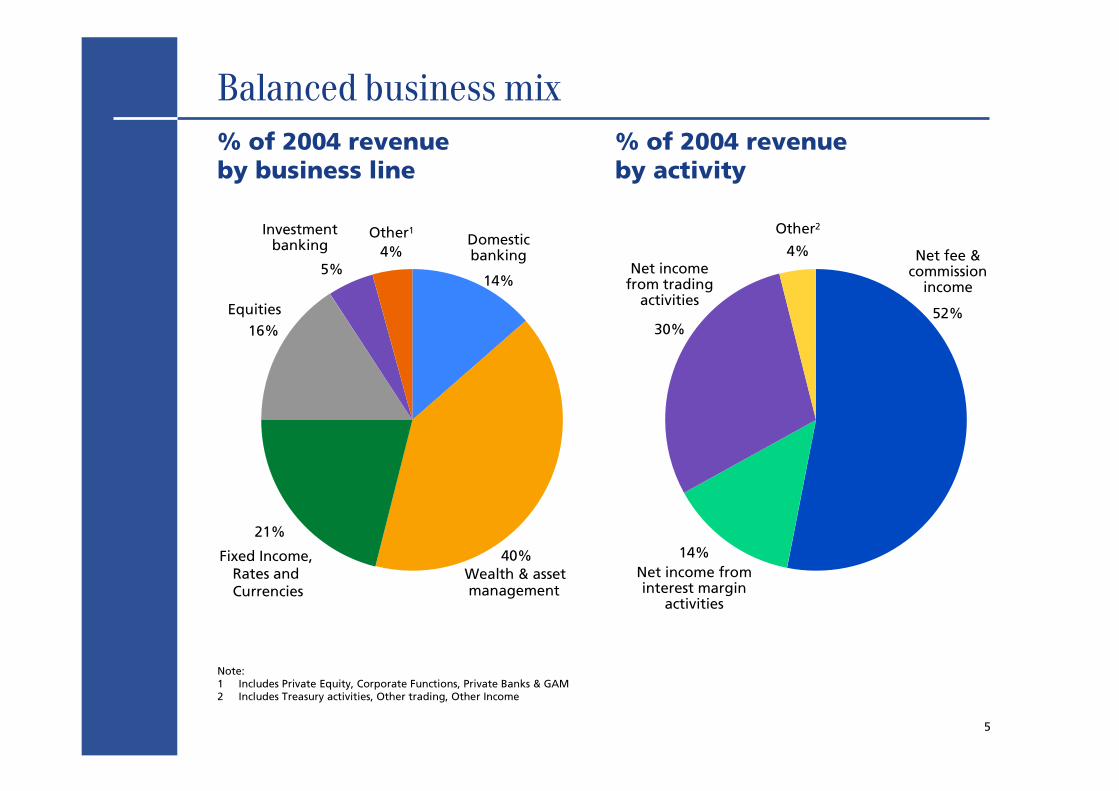
Balanced business mix% of 2004 revenueby business line
Net fee &commission
income
Net income frominterest margin
activities
Net incomefrom trading
activities
% of 2004 revenueby activity
Other2
52%
14%
4%
30%
14%
40%
21%
16%
5%4%
Domesticbanking
Equities
Investmentbanking
Wealth & assetmanagement
Fixed Income,Rates andCurrencies
Other1
Note:1 Includes Private Equity, Corporate Functions, Private Banks & GAM2 Includes Treasury activities, Other trading, Other Income

6
High margin businesses, with significant barriers to entry
1 2004 pre-tax profit margin pre goodwill2 Group profit before tax pre goodwill 20043 Includes Corporate Functions performance before tax
31% 5% 18% 6% 42% 4% 100%3
% of group profit before tax2
Pre-tax margin1
0
10
20
30
40
5046%
41%
33%30%
15%
46%
30%
WealthManagement
BusinessBanking
Switzerland
Global AssetManagement
InvestmentBank
WealthManagement
USA*
PrivateBanks &
GAM
UBS
%

Achievements & Track Record
8
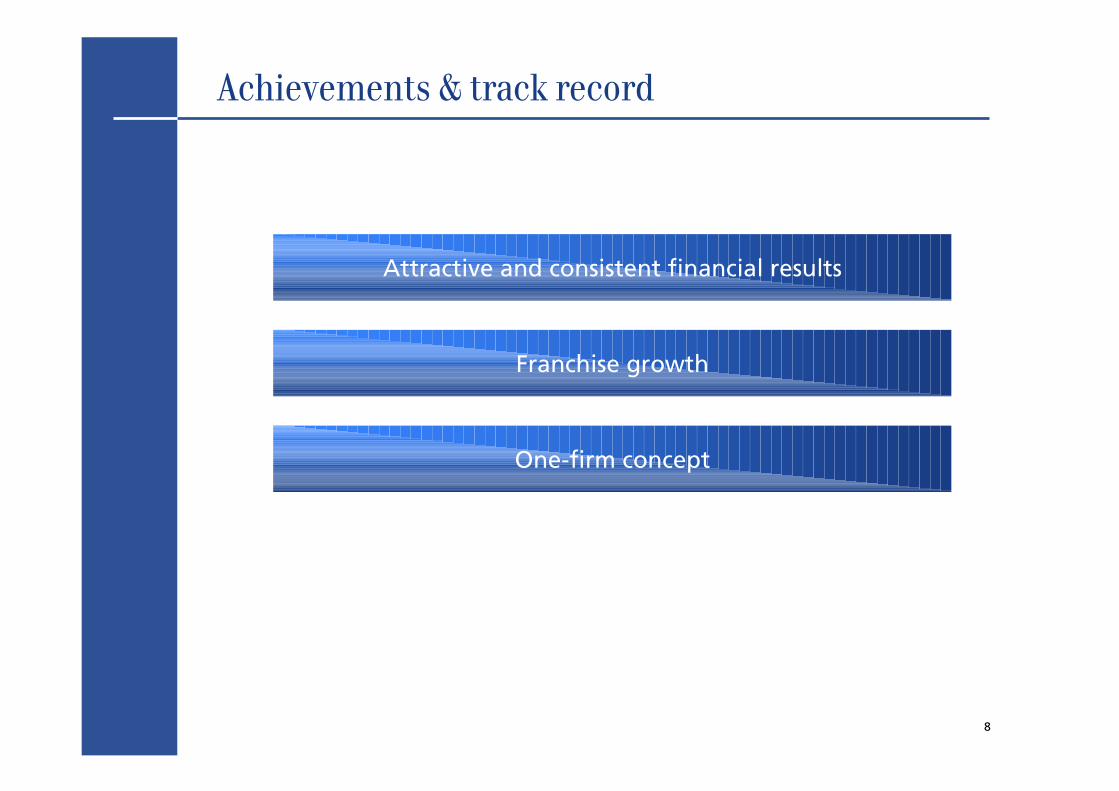
Achievements & track record
Franchise growth
Attractive and consistent financial results
One-firm concept
9
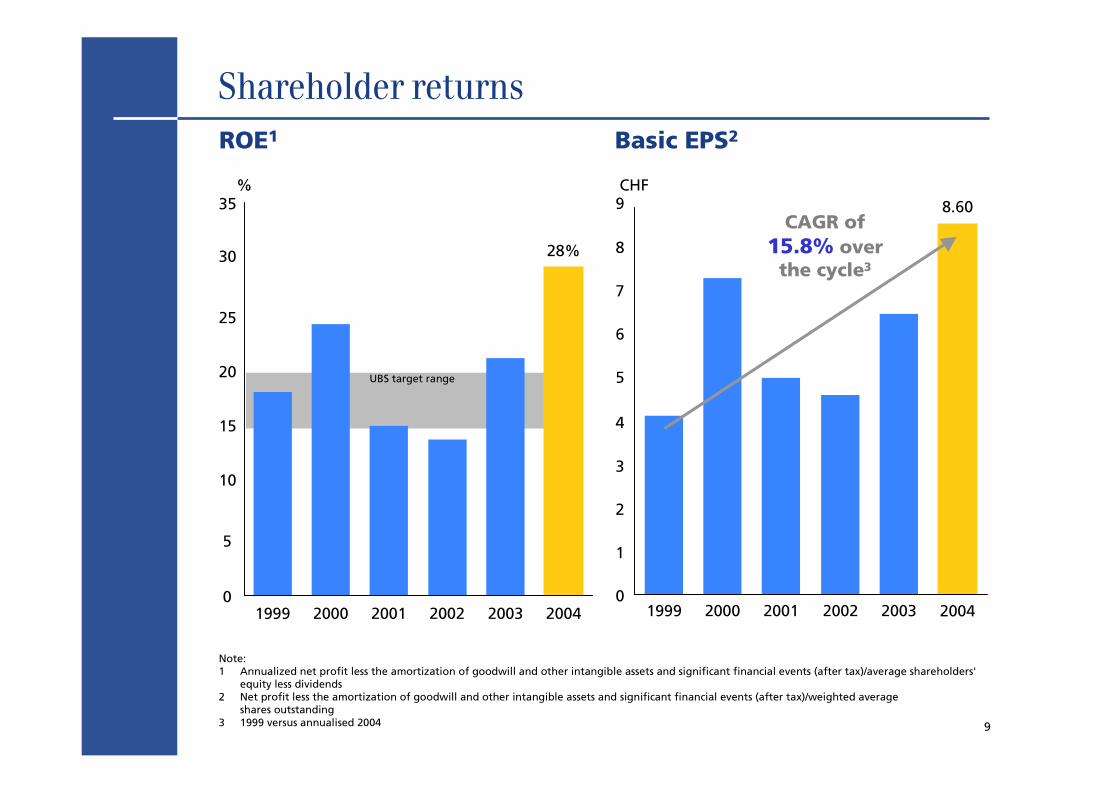
Shareholder returnsROE1 Basic EPS2
Note:1 Annualized net profit less the amortization of goodwill and other intangible assets and significant financial events (after tax)/average shareholders'
equity less dividends2 Net profit less the amortization of goodwill and other intangible assets and significant financial events (after tax)/weighted average
shares outstanding3 1999 versus annualised 2004
28%
UBS target range
0
5
10
15
20
25
30
35
1999 2000 2001 2002 2003 2004
CHF8.60
1999 2000 2001 2002 2003 2004
CAGR of15.8% over
the cycle3
0
1
2
3
4
5
6
7
8
9%

10
Return of capital to shareholders1
Note:1 Dividend is shown in the year of performance
60% of Operating cash flow returned to shareholders since1999
Buy-back program Dividend/par value reduction
CHF bn
0
5
10
15
20
25
30
35
1999 2000 2001 2002 2003 2004 Total
2
6
4
8
7
7 35

11
Net new moneyNNM UBS1 NNM wealth management
businesses
Note:1 Numbers from 1999 to 2001 have not been restated for definitional change
WM-US WM
0
10
20
30
40
50
60
70
16
2000
56
2001
36
2002
51
2003
CHF bn
1999
4 17
42
2004
59
-46-60
-40
-20
0
20
40
60
80
100
120
1999
-50
2000
102
2001
37
2002
69
2003
89
2004
CHF bn

12
The integrated business model at work
Corporate Center
WealthManagement
USA
Global AssetManagement
InvestmentBanking
WealthManagement &
Business Banking
Tradeflows
Funds
Tradeflows
Structured productsCorporate finance advice
NNMinflow
NNMinflow
Funds
DerivativesResearch
Tradeflows
Sales &Market-
ing
Productexper-
tise
ITI Controlling Communication Human ResourcesRisk Management Treasury
Structured productsCorporate finance advice
13
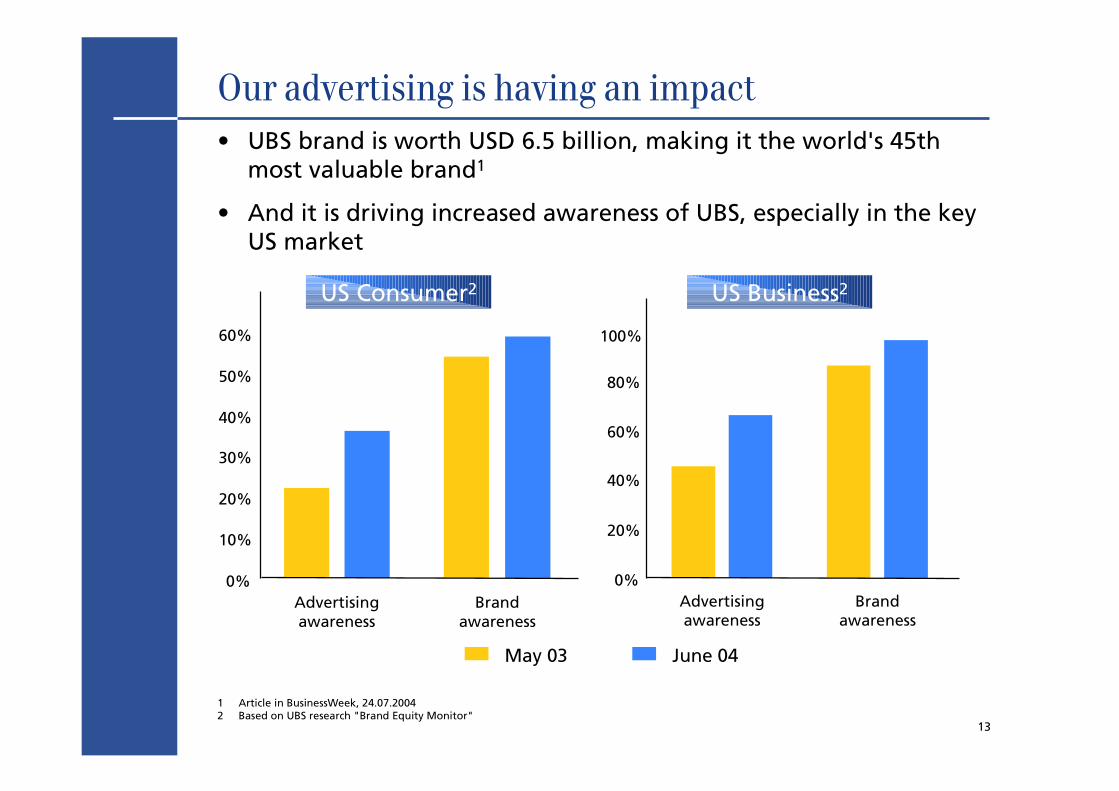
Our advertising is having an impact
US Consumer2 US Business2
May 03 June 04
• UBS brand is worth USD 6.5 billion, making it the world's 45thmost valuable brand1
• And it is driving increased awareness of UBS, especially in the keyUS market
1 Article in BusinessWeek, 24.07.20042 Based on UBS research "Brand Equity Monitor"
0%
10%
20%
30%
40%
50%
60%
Advertisingawareness
Brandawareness
Advertisingawareness
Brandawareness
100%
0%
20%
40%
60%
80%

Growth Plan & Challenges
15
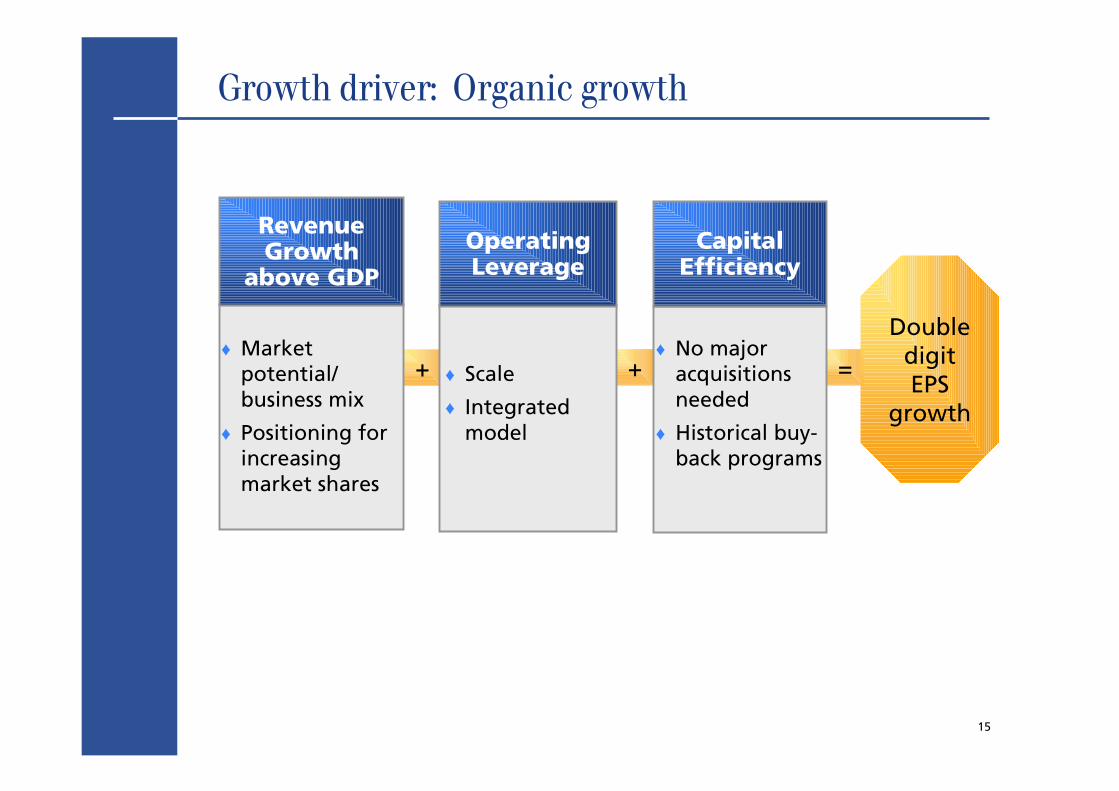
Growth driver: Organic growth
+ + =
RevenueGrowth
above GDP
♦ Marketpotential/business mix
♦ Positioning forincreasingmarket shares
OperatingLeverage
♦ Scale
♦ Integratedmodel
CapitalEfficiency
♦ No majoracquisitionsneeded
♦ Historical buy-back programs
DoubledigitEPS
growth
16
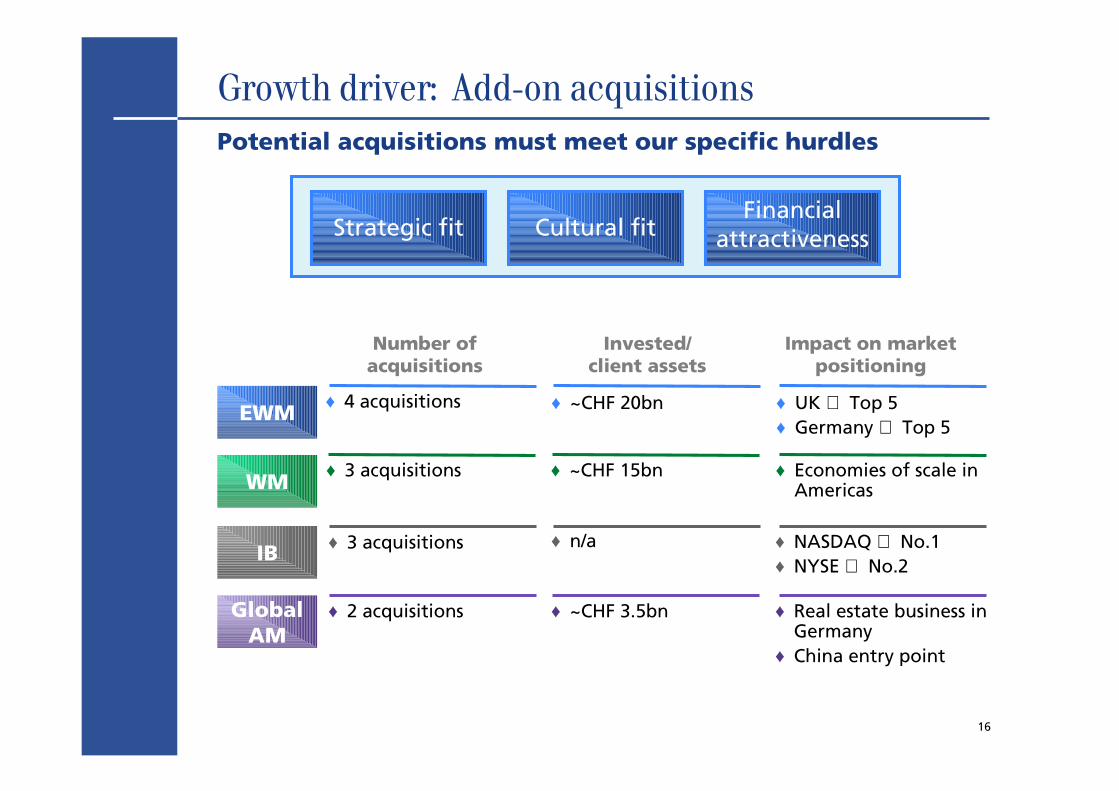
Growth driver: Add-on acquisitionsPotential acquisitions must meet our specific hurdles
♦ UK ⇒ Top 5♦ Germany ⇒ Top 5
Strategic fit Cultural fitFinancial
attractiveness
EWM
WM♦ Economies of scale in
Americas
♦ 4 acquisitions ♦ ~CHF 20bn
♦ ~CHF 15bn♦ 3 acquisitions
IB ♦ NASDAQ ⇒ No.1♦ NYSE ⇒ No.2
♦ n/a♦ 3 acquisitions
Number ofacquisitions
Invested/client assets
Impact on marketpositioning
GlobalAM
♦ Real estate business inGermany
♦ China entry point
♦ ~CHF 3.5bn♦ 2 acquisitions
17
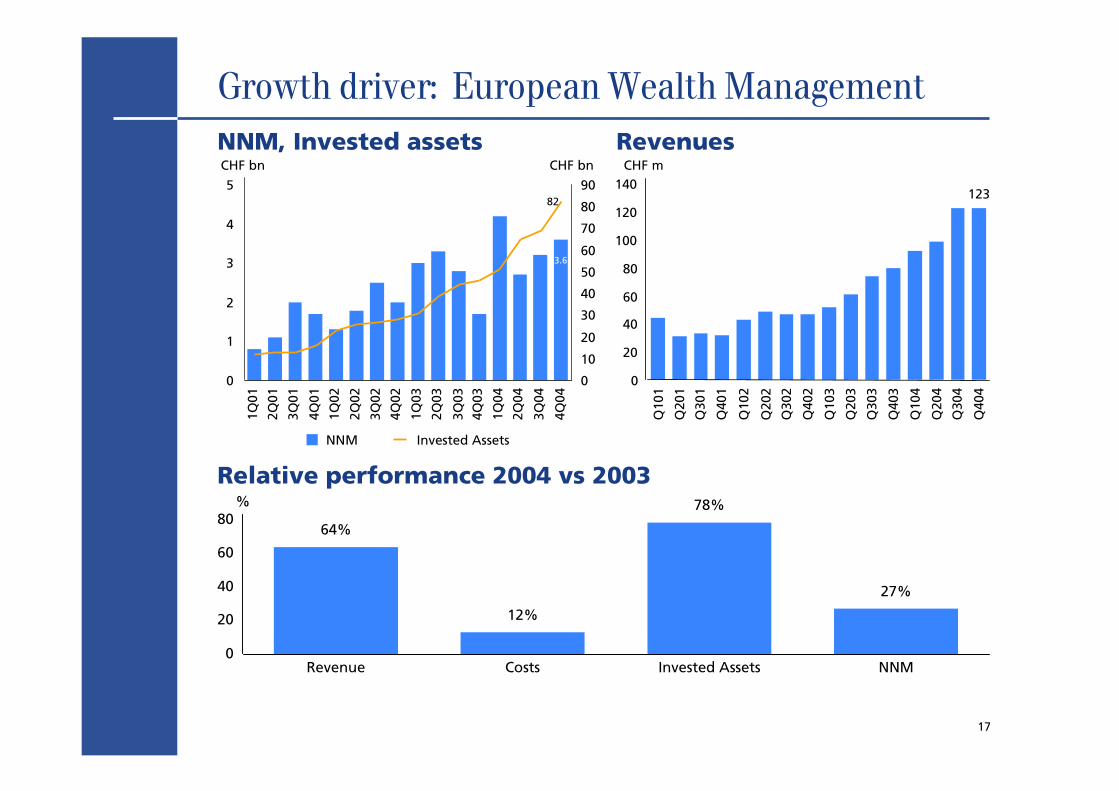
Growth driver: European Wealth ManagementNNM, Invested assets Revenues
Relative performance 2004 vs 2003
NNM Invested Assets
0
1
2
3
4
5
1Q01
2Q01
3Q01
4Q01
1Q02
2Q02
3Q02
4Q02
1Q03
2Q03
3Q03
4Q03
1Q04
2Q04
3Q04
4Q04
CHF bn
0
10
20
30
40
50
60
70
80
90
CHF bn
82
3.6
0
20
40
60
80
100
120
140
Q10
1
Q20
1
Q30
1
Q40
1
Q10
2
Q20
2
Q30
2
Q40
2
Q10
3
Q20
3
Q30
3
Q40
3
Q10
4
Q20
4
Q30
4
Q40
4
CHF m
123
64%
12%
78%
27%
0
20
40
60
80
Revenue Costs Invested Assets NNM
%
18
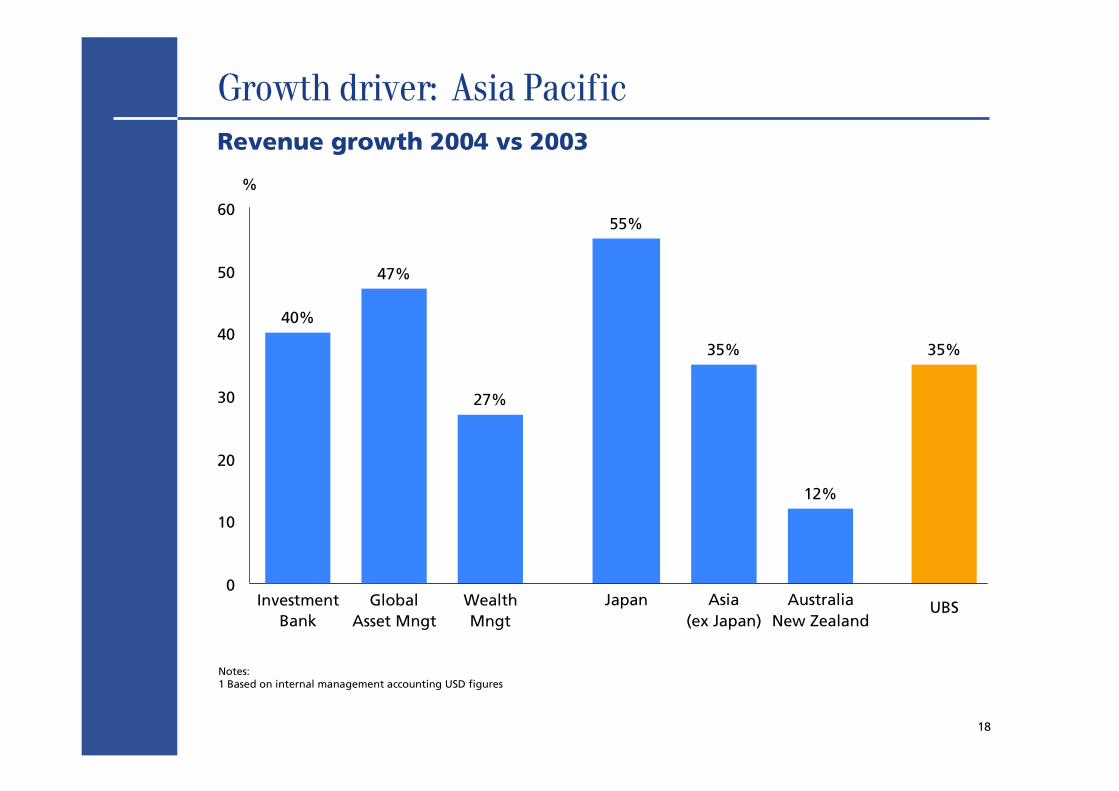
Growth driver: Asia Pacific
Notes:1 Based on internal management accounting USD figures
0
10
20
30
40
50
60
27%
WealthMngt
55%
Japan
12%
AustraliaNew Zealand
35%
UBS
35%
Asia(ex Japan)
40%
InvestmentBank
47%
GlobalAsset Mngt
%
Revenue growth 2004 vs 2003

19
Overall UBS challenges
Additional add-on acquisitions to supplement organicgrowth
Further increase our Asia-Pacific footprint
Group wide emphasis on operational risk
Maintain positive NNM momentum
Continue to build IB client franchise and executionexcellence
Conclusion: Attractive Investment Case

21
UBS investment case
Proven performance across cycles
Focused strategy
High margin businesses
Significant barriers to entry
Strong, integrated culture and brand
Attractive growth opportunities

Strategy & Overview
March 2005
You & Us