Strategy 2020 - Atria
140
Front page Atria in brief Atria’s key indicators CEO’s review Strategy 2021–2025 Strategy 2016–2020 Operating environment Business area reviews Atria Finland Atria Sweden Atria Denmark & Estonia Atria Russia Research and Development Financial Statements and Corporate Governance Financial Statements and Corporate Governance Auditor’s report Corporate Governance Statement Investor reporting Contact information 2020 Annual Report
Transcript of Strategy 2020 - Atria
Front page
Atria in brief
Atria’s key indicators
CEO’s review
Strategy 2021–2025
Strategy 2016–2020
Operating environment
Business area reviews
Atria Finland
Atria Sweden
Atria Denmark & Estonia
Atria Russia
Research and Development
Financial Statements and Corporate Governance
Financial Statements and Corporate Governance
Auditor’s report
Corporate Governance Statement
Investor reporting
Contact information
2020Annual Report
Front page
Atria in brief
Atria’s key indicators
CEO’s review
Strategy 2021–2025
Strategy 2016–2020
Operating environment
Business area reviews
Atria Finland
Atria Sweden
Atria Denmark & Estonia
Atria Russia
Research and Development
Financial Statements and Corporate Governance
Financial Statements and Corporate Governance
Auditor’s report
Corporate Governance Statement
Investor reporting
Contact information
2Atria’s Annual Report 2020
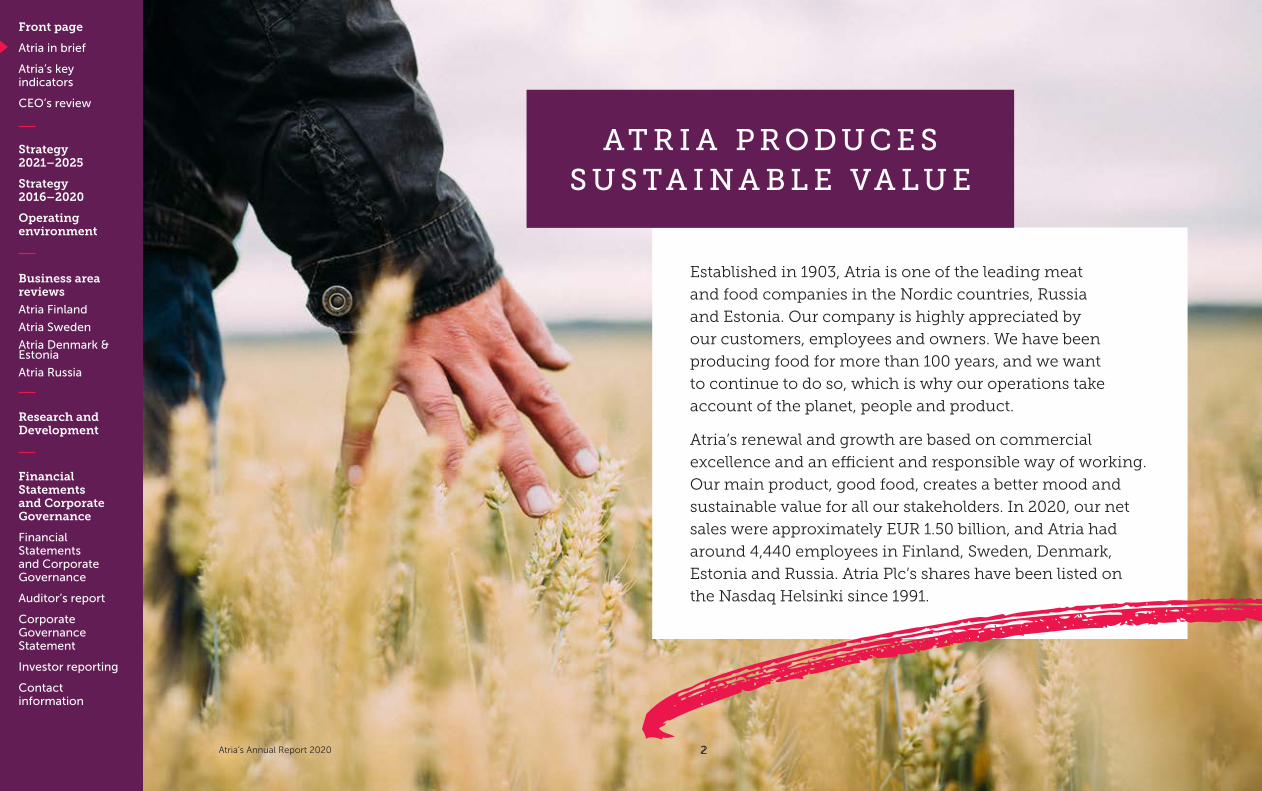
Established in 1903, Atria is one of the leading meat
and food companies in the Nordic countries, Russia
and Estonia. Our company is highly appreciated by
our customers, employees and owners. We have been
producing food for more than 100 years, and we want
to continue to do so, which is why our operations take
account of the planet, people and product.
Atria’s renewal and growth are based on commercial
excellence and an efficient and responsible way of working.
Our main product, good food, creates a better mood and
sustainable value for all our stakeholders. In 2020, our net
sales were approximately EUR 1.50 billion, and Atria had
around 4,440 employees in Finland, Sweden, Denmark,
Estonia and Russia. Atria Plc’s shares have been listed on
the Nasdaq Helsinki since 1991.
AT R I A P R O D U C E S S U S TA I N A B L E VA L U E
2
Front page
Atria in brief
Atria’s key indicators
CEO’s review
Strategy 2021–2025
Strategy 2016–2020
Operating environment
Business area reviews
Atria Finland
Atria Sweden
Atria Denmark & Estonia
Atria Russia
Research and Development
Financial Statements and Corporate Governance
Financial Statements and Corporate Governance
Auditor’s report
Corporate Governance Statement
Investor reporting
Contact information
Atria’s Annual Report 2020
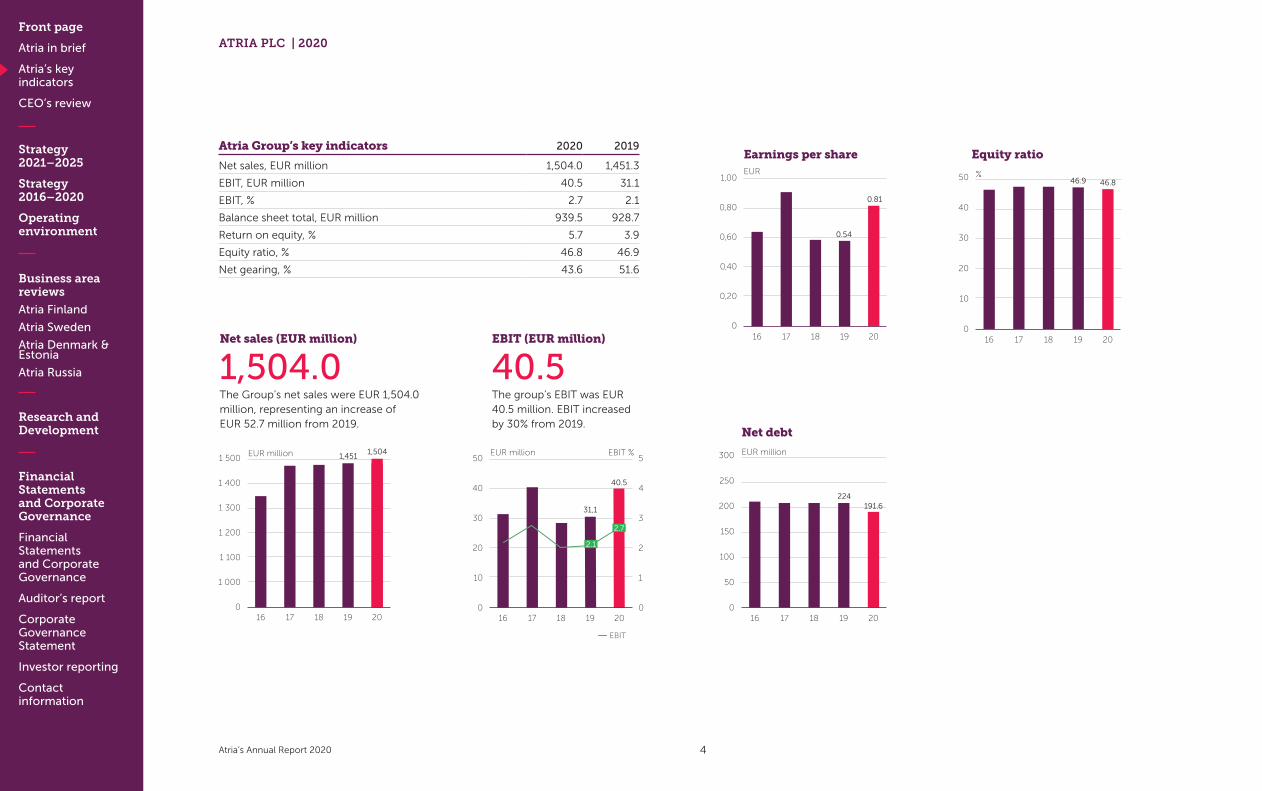
Atria Group’s key indicators 2020 2019
Net sales, EUR million 1,504.0 1,451.3
EBIT, EUR million 40.5 31.1
EBIT, % 2.7 2.1
Balance sheet total, EUR million 939.5 928.7
Return on equity, % 5.7 3.9
Equity ratio, % 46.8 46.9
Net gearing, % 43.6 51.6
EBIT (EUR million)
40.5The group’s EBIT was EUR 40.5 million. EBIT increased by 30% from 2019.
EUR million EBIT %
Net sales (EUR million)
1,504.0The Group’s net sales were EUR 1,504.0 million, representing an increase of EUR 52.7 million from 2019.
EUR million5
4
3
2
1
0
EBIT
50
40
30
20
10
016 17 18 19 20
40.5
1 500
1 400
1 300
1 200
1 100
1 000
016 17 18 19 20
31,1
Earnings per shareEUR
1,00
0,80
0,60
0,40
0,20
016 17 18 19 20
0.81
0.54
ATRIA PLC | 2020
Equity ratio
50
40
30
20
10
0
%
16 17 18 19 20
46.846.9
Net debt
300
250
200
150
100
50
0
EUR million
16 17 18 19 20
191.6224
1,5041,451
2.1
2.7
4
Front page
Atria in brief
Atria’s key indicators
CEO’s review
Strategy 2021–2025
Strategy 2016–2020
Operating environment
Business area reviews
Atria Finland
Atria Sweden
Atria Denmark & Estonia
Atria Russia
Research and Development
Financial Statements and Corporate Governance
Financial Statements and Corporate Governance
Auditor’s report
Corporate Governance Statement
Investor reporting
Contact information
Atria’s Annual Report 2020
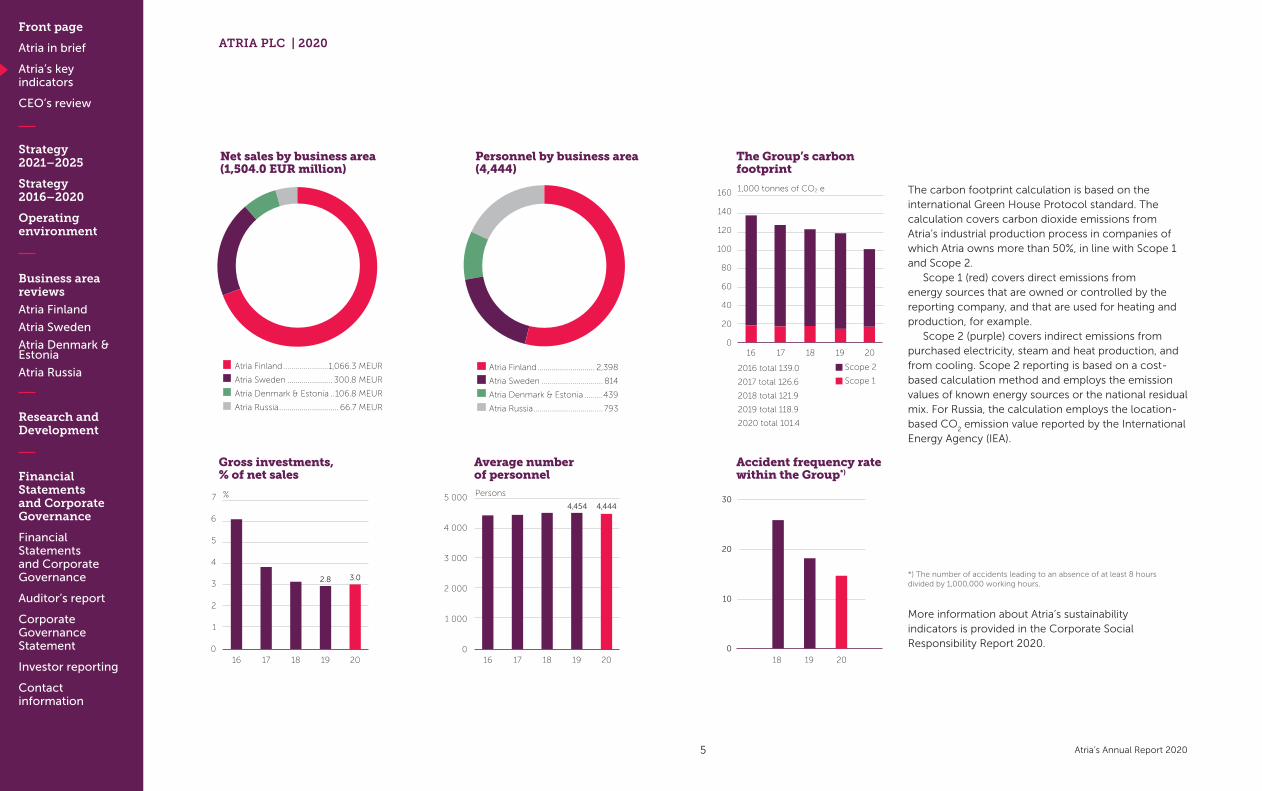
Atria Finland ......................1,066.3 MEUR
Atria Sweden ...................... 300.8 MEUR
Atria Denmark & Estonia ..106.8 MEUR
Atria Russia ............................. 66.7 MEUR
Net sales by business area (1,504.0 EUR million)
Gross investments, % of net sales
7
6
5
4
3
2
1
0
%
16 17 18 19 20
3.02.8
Average number of personnel
5 000
4 000
3 000
2 000
1 000
0
Persons
16 17 18 19 20
4,4444,454
Atria Finland ............................ 2,398
Atria Sweden .............................. 814
Atria Denmark & Estonia .........439
Atria Russia .................................. 793
Personnel by business area (4,444)
The Group’s carbon footprint
Accident frequency rate within the Group*)
18 19 20
30
20
10
0
The carbon footprint calculation is based on the international Green House Protocol standard. The calculation covers carbon dioxide emissions from Atria’s industrial production process in companies of which Atria owns more than 50%, in line with Scope 1 and Scope 2.
Scope 1 (red) covers direct emissions from energy sources that are owned or controlled by the reporting company, and that are used for heating and production, for example.
Scope 2 (purple) covers indirect emissions from purchased electricity, steam and heat production, and from cooling. Scope 2 reporting is based on a cost-based calculation method and employs the emission values of known energy sources or the national residual mix. For Russia, the calculation employs the location-based CO
2 emission value reported by the International
Energy Agency (IEA).
Scope 2
Scope 1
2016 total 139.0
2017 total 126.6
2018 total 121.9
2019 total 118.9
2020 total 101.4
1,000 tonnes of CO2 e160
140
120
100
80
60
40
20
016 17 18 19 20
*) The number of accidents leading to an absence of at least 8 hours divided by 1,000,000 working hours.
More information about Atria’s sustainability indicators is provided in the Corporate Social Responsibility Report 2020.
ATRIA PLC | 2020
5
Front page
Atria in brief
Atria’s key indicators
CEO’s review
Strategy 2021–2025
Strategy 2016–2020
Operating environment
Business area reviews
Atria Finland
Atria Sweden
Atria Denmark & Estonia
Atria Russia
Research and Development
Financial Statements and Corporate Governance
Financial Statements and Corporate Governance
Auditor’s report
Corporate Governance Statement
Investor reporting
Contact information
Atria’s Annual Report 2020
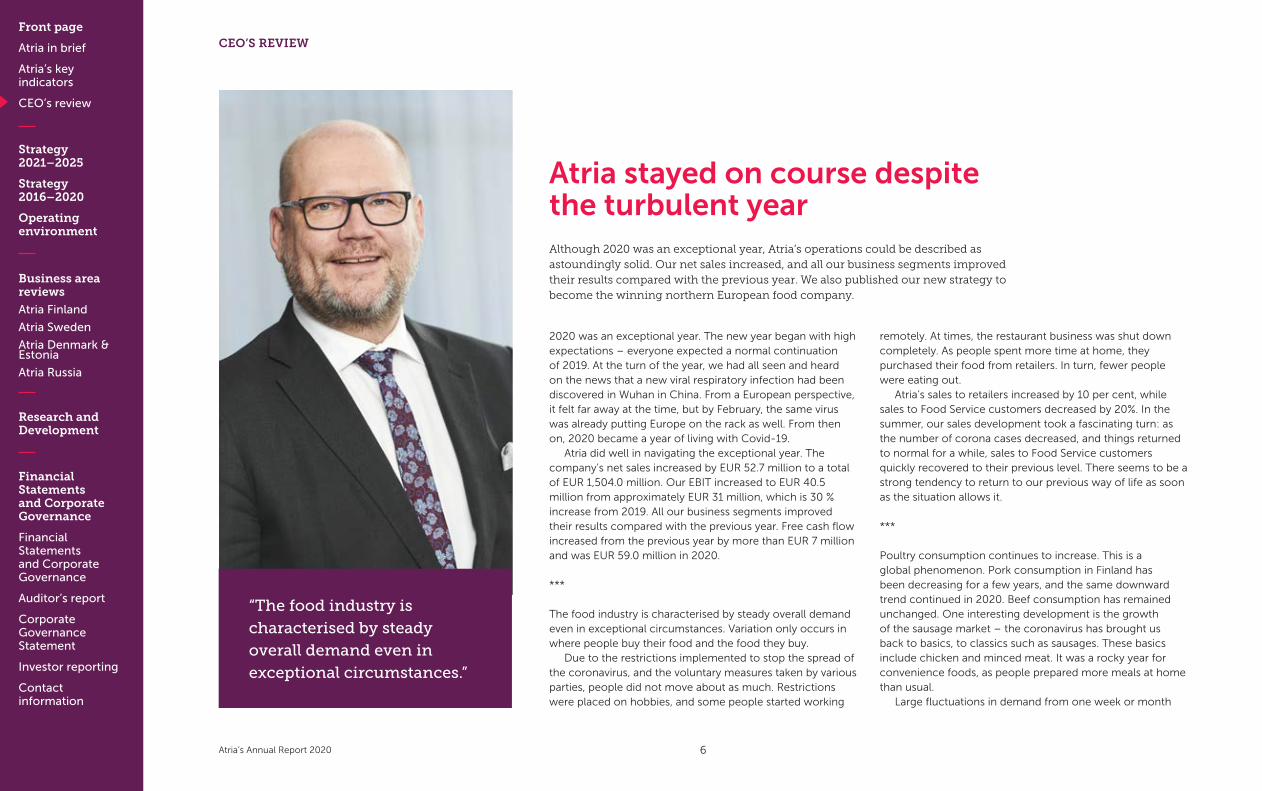
Atria stayed on course despite the turbulent year Although 2020 was an exceptional year, Atria’s operations could be described as astoundingly solid. Our net sales increased, and all our business segments improved their results compared with the previous year. We also published our new strategy to become the winning northern European food company.
2020 was an exceptional year. The new year began with high expectations – everyone expected a normal continuation of 2019. At the turn of the year, we had all seen and heard on the news that a new viral respiratory infection had been discovered in Wuhan in China. From a European perspective, it felt far away at the time, but by February, the same virus was already putting Europe on the rack as well. From then on, 2020 became a year of living with Covid-19.
Atria did well in navigating the exceptional year. The company’s net sales increased by EUR 52.7 million to a total of EUR 1,504.0 million. Our EBIT increased to EUR 40.5 million from approximately EUR 31 million, which is 30 % increase from 2019. All our business segments improved their results compared with the previous year. Free cash flow increased from the previous year by more than EUR 7 million and was EUR 59.0 million in 2020.
***
The food industry is characterised by steady overall demand even in exceptional circumstances. Variation only occurs in where people buy their food and the food they buy.
Due to the restrictions implemented to stop the spread of the coronavirus, and the voluntary measures taken by various parties, people did not move about as much. Restrictions were placed on hobbies, and some people started working
remotely. At times, the restaurant business was shut down completely. As people spent more time at home, they purchased their food from retailers. In turn, fewer people were eating out.
Atria’s sales to retailers increased by 10 per cent, while sales to Food Service customers decreased by 20%. In the summer, our sales development took a fascinating turn: as the number of corona cases decreased, and things returned to normal for a while, sales to Food Service customers quickly recovered to their previous level. There seems to be a strong tendency to return to our previous way of life as soon as the situation allows it.
***
Poultry consumption continues to increase. This is a global phenomenon. Pork consumption in Finland has been decreasing for a few years, and the same downward trend continued in 2020. Beef consumption has remained unchanged. One interesting development is the growth of the sausage market – the coronavirus has brought us back to basics, to classics such as sausages. These basics include chicken and minced meat. It was a rocky year for convenience foods, as people prepared more meals at home than usual.
Large fluctuations in demand from one week or month
“The food industry is characterised by steady overall demand even in exceptional circumstances.”
CEO’S REVIEW
6
Front page
Atria in brief
Atria’s key indicators
CEO’s review
Strategy 2021–2025
Strategy 2016–2020
Operating environment
Business area reviews
Atria Finland
Atria Sweden
Atria Denmark & Estonia
Atria Russia
Research and Development
Financial Statements and Corporate Governance
Financial Statements and Corporate Governance
Auditor’s report
Corporate Governance Statement
Investor reporting
Contact information
Atria’s Annual Report 2020
“We are now aiming to improve our cost-effectiveness through a straightforward approach. We already have an excellent handle on market intelligence. It is time to make more use of this data.”
to another are typical of our industry. So we are already used to fluctuating demand, and this has made it easier for us to adapt to the corona time. We have put all our energy into focusing on the basics. On the other hand, we have not delayed forward-looking measures. Instead, we have strived to maintain business as usual wherever possible. For example, investments have not been postponed.
***
In late 2020, we published our new strategy to become the winning northern European food company. “Winning” here refers to operational leadership: Atria wants to be a company that leads by example, reforming the entire industry. Our industrial operations are located in northern Europe.
We are a food company with a versatile product offering that includes delicious solutions for all kinds of meals. The new strategy is a continuation of our Healthy Growth Strategy, which offers a solid foundation for building something new. In recent years, we have enhanced our productivity through means like improved tools for operational monitoring and control. We are now aiming to improve our cost-effectiveness through a straightforward approach. We already have an excellent handle on market intelligence. It is time to make more use of this data.
We want to be a first-class partner for our customers. During the pandemic, many of us at Atria have learned a lot of things the hard way. More than ever, we have come to understand the value of long-term partnerships and the difficulty of building new networks. I want to thank all our customers for placing your trust in Atria.
2020 was a tough year for our personnel. We have had to work in exceptional circumstances, in a situation where nobody knows how long the unusual arrangements will last. However, everyone has done a great job, and both individual employees and different parts of the organisation have clearly demonstrated their willingness to take responsibility. This willpower and the performance it has driven have kept the situation under control. Thank you all.
I also want to thank our business partners and shareholders, who have helped us to succeed and thrive in 2020.
Seinäjoki, March 2021
Juha GröhnCEO
“Our EBIT increased to EUR 40.5 million from approximately EUR 31 million in 2019. All our business segments improved their results.”
CEO’S REVIEW
7
Front page
Atria in brief
Atria’s key indicators
CEO’s review
Strategy 2021–2025
Strategy 2016–2020
Operating environment
Business area reviews
Atria Finland
Atria Sweden
Atria Denmark & Estonia
Atria Russia
Research and Development
Financial Statements and Corporate Governance
Financial Statements and Corporate Governance
Auditor’s report
Corporate Governance Statement
Investor reporting
Contact information
Atria’s Annual Report 2020
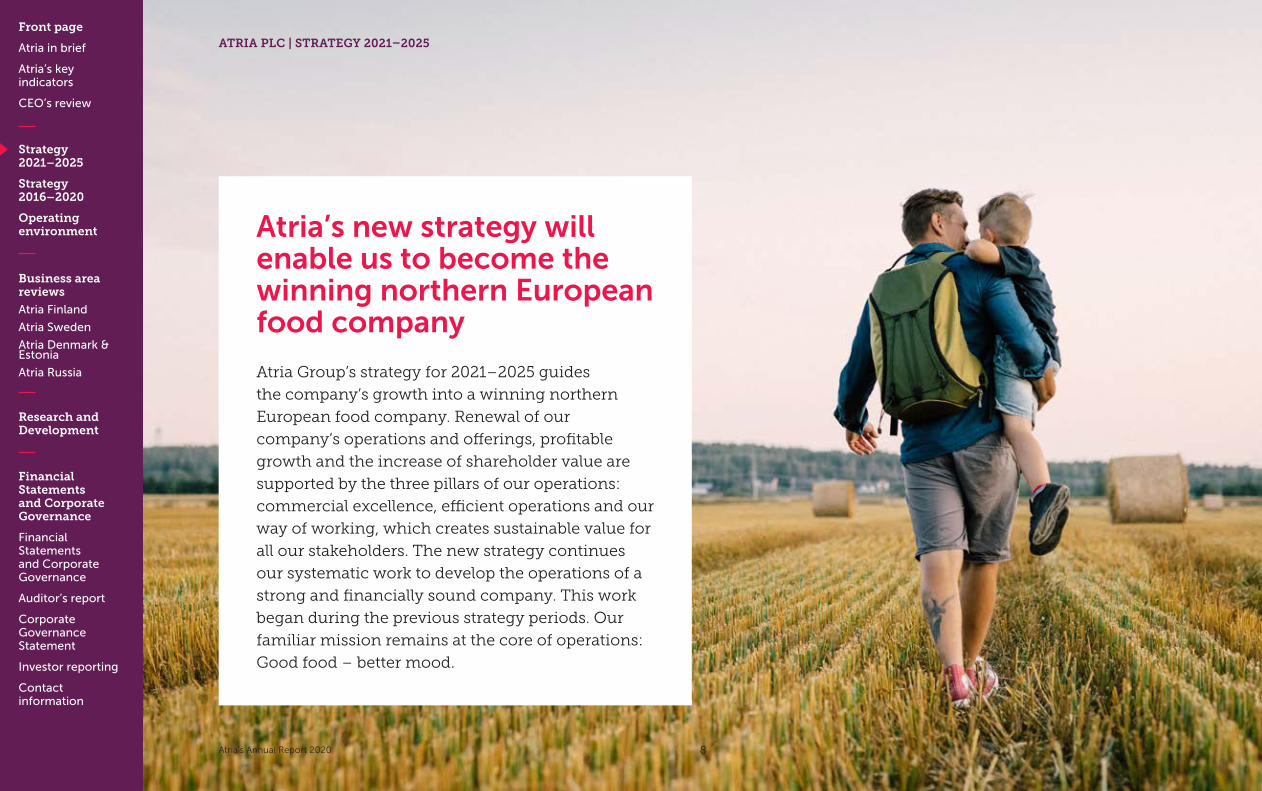
Atria’s new strategy will enable us to become the winning northern European food company
Atria Group’s strategy for 2021–2025 guides
the company’s growth into a winning northern
European food company. Renewal of our
company’s operations and offerings, profitable
growth and the increase of shareholder value are
supported by the three pillars of our operations:
commercial excellence, efficient operations and our
way of working, which creates sustainable value for
all our stakeholders. The new strategy continues
our systematic work to develop the operations of a
strong and financially sound company. This work
began during the previous strategy periods. Our
familiar mission remains at the core of operations:
Good food – better mood.
ATRIA PLC | STRATEGY 2021–2025
8

Front page
Atria in brief
Atria’s key indicators
CEO’s review
Strategy 2021–2025
Strategy 2016–2020
Operating environment
Business area reviews
Atria Finland
Atria Sweden
Atria Denmark & Estonia
Atria Russia
Research and Development
Financial Statements and Corporate Governance
Financial Statements and Corporate Governance
Auditor’s report
Corporate Governance Statement
Investor reporting
Contact information
Atria’s Annual Report 2020
Strategic goals from primary production to the customer experience Atria’s new strategic goals reflect our development focus on the entire food chain, from primary production to the customer experience. Strong financial performance and commercial expertise are complemented by people: customers, employees and owner-producers. Sustainability will also become a more important strategic strength in Atria’s operations.
OUR STRATEGIC GOALS: CHARACTERISTICS OF A WINNING NORTHERN EUROPEAN FOOD COMPANY
Our financial targets for 2021–2025
• EBIT 5% • Equity ratio: 40%• Return on equity: 10%• Capital distribution: 50% of the profit for the period• Growth above market
Goal Implementation
Best in class financial performance • Strong financial performance: growing faster than the market.• Maintaining a strong balance sheet and performance.
Most desired brands • Atria’s brands are the best-known in their product categories, as well as the most highly recommended in all our business areas.
Preferred partner for the customer • Customer’s overall satisfaction. • Successfully and jointly implemented upgrades to shopper experience.• Likelihood of customer recommending.
Best partner for owner-producers • The best sales channel for meat from contract producers across Finland.• Close cooperation throughout the production chain.• The best contract producers, expertise and continuous development improve competitiveness.• Financially strong owner-producers.
Leader in sustainability • A carbon-neutral food chain by 2035. • Reducing carbon dioxide emissions by 25% by 2025 compared with 2016.• Increasing antibiotic-free production.• Zero animal welfare violations.
Committed people • Strengthening employees’ commitment.• Reducing the number of accidents.• Employee satisfaction with development opportunities.• Mobility for personnel from one job to another across country borders and job rotation within business areas.
ATRIA PLC | STRATEGY 2021–2025
9
Front page
Atria in brief
Atria’s key indicators
CEO’s review
Strategy 2021–2025
Strategy 2016–2020
Operating environment
Business area reviews
Atria Finland
Atria Sweden
Atria Denmark & Estonia
Atria Russia
Research and Development
Financial Statements and Corporate Governance
Financial Statements and Corporate Governance
Auditor’s report
Corporate Governance Statement
Investor reporting
Contact information
Atria’s Annual Report 2020
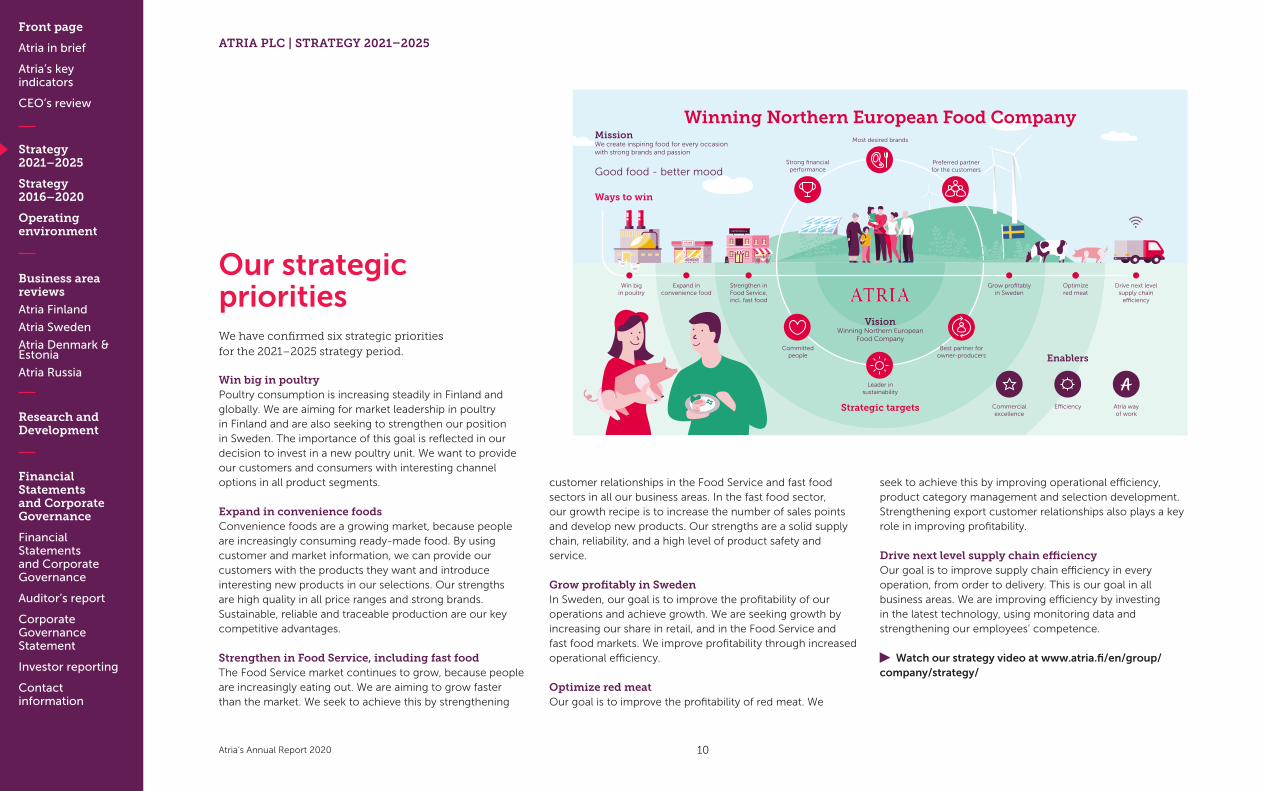
Our strategic prioritiesWe have confirmed six strategic priorities for the 2021–2025 strategy period.
Win big in poultryPoultry consumption is increasing steadily in Finland and globally. We are aiming for market leadership in poultry in Finland and are also seeking to strengthen our position in Sweden. The importance of this goal is reflected in our decision to invest in a new poultry unit. We want to provide our customers and consumers with interesting channel options in all product segments.
Expand in convenience foodsConvenience foods are a growing market, because people are increasingly consuming ready-made food. By using customer and market information, we can provide our customers with the products they want and introduce interesting new products in our selections. Our strengths are high quality in all price ranges and strong brands. Sustainable, reliable and traceable production are our key competitive advantages.
Strengthen in Food Service, including fast foodThe Food Service market continues to grow, because people are increasingly eating out. We are aiming to grow faster than the market. We seek to achieve this by strengthening
ATRIA PLC | STRATEGY 2021–2025
customer relationships in the Food Service and fast food sectors in all our business areas. In the fast food sector, our growth recipe is to increase the number of sales points and develop new products. Our strengths are a solid supply chain, reliability, and a high level of product safety and service.
Grow profitably in Sweden In Sweden, our goal is to improve the profitability of our operations and achieve growth. We are seeking growth by increasing our share in retail, and in the Food Service and fast food markets. We improve profitability through increased operational efficiency.
Optimize red meatOur goal is to improve the profitability of red meat. We
seek to achieve this by improving operational efficiency, product category management and selection development. Strengthening export customer relationships also plays a key role in improving profitability.
Drive next level supply chain efficiencyOur goal is to improve supply chain efficiency in every operation, from order to delivery. This is our goal in all business areas. We are improving efficiency by investing in the latest technology, using monitoring data and strengthening our employees’ competence.
Watch our strategy video at www.atria.fi/en/group/company/strategy/
Ways to win
Drive next level supply chain
e�ciency
Win big in poultry
STORE
Expand in convenience food
Strengthen in Food Service, incl. fast food
Grow profitablyin Sweden
Optimize red meat
Atria way of work
Commercial excellence
E�ciency
Enablers
Strategic targets
Best partner forowner-producers
Strong financial performance
Most desired brands
Leader in sustainability
Preferred partner for the customers
Committed people
Winning Northern European Food Company
Good food - better mood
MissionWe create inspiring food for every occasion with strong brands and passion
VisionWinning Northern European
Food Company
10
Front page
Atria in brief
Atria’s key indicators
CEO’s review
Strategy 2021–2025
Strategy 2016–2020
Operating environment
Business area reviews
Atria Finland
Atria Sweden
Atria Denmark & Estonia
Atria Russia
Research and Development
Financial Statements and Corporate Governance
Financial Statements and Corporate Governance
Auditor’s report
Corporate Governance Statement
Investor reporting
Contact information
Atria’s Annual Report 2020
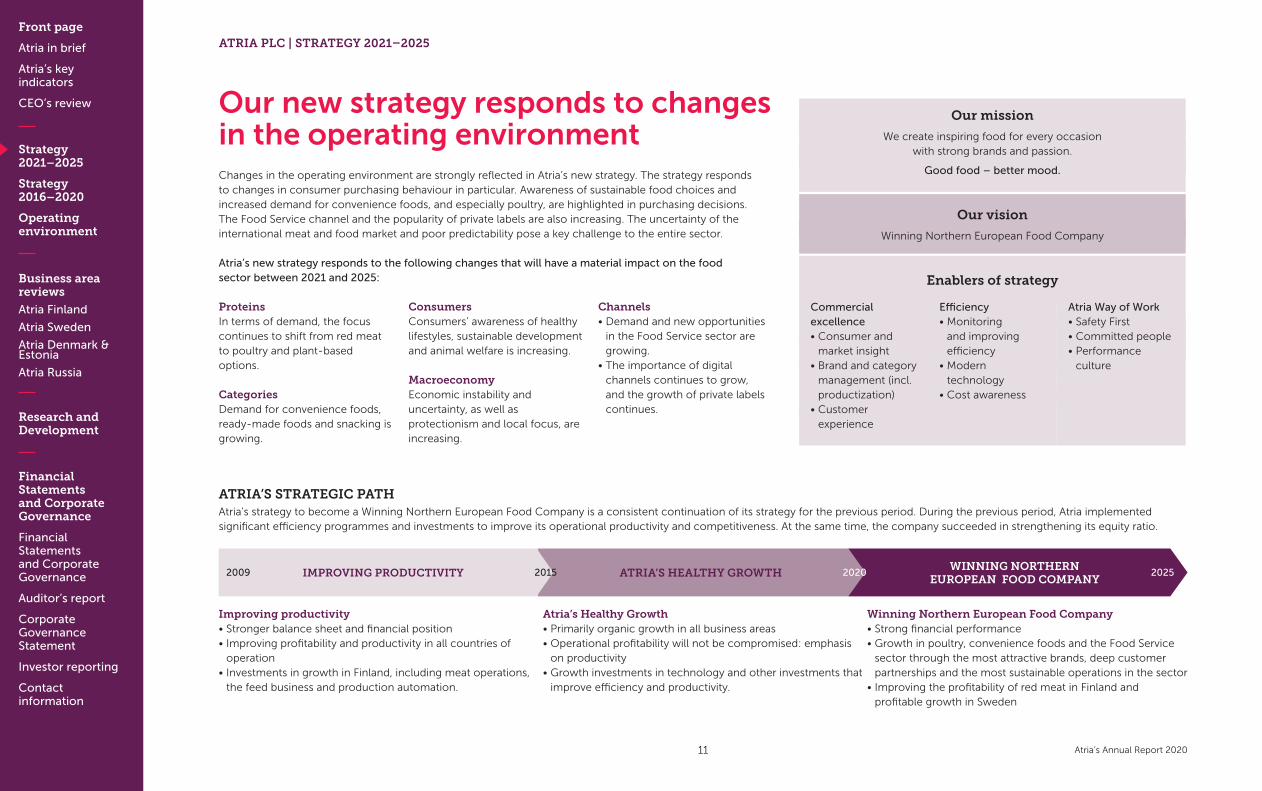
Our new strategy responds to changes in the operating environment Changes in the operating environment are strongly reflected in Atria’s new strategy. The strategy responds to changes in consumer purchasing behaviour in particular. Awareness of sustainable food choices and increased demand for convenience foods, and especially poultry, are highlighted in purchasing decisions. The Food Service channel and the popularity of private labels are also increasing. The uncertainty of the international meat and food market and poor predictability pose a key challenge to the entire sector.
Atria’s new strategy responds to the following changes that will have a material impact on the food sector between 2021 and 2025:
ProteinsIn terms of demand, the focus continues to shift from red meat to poultry and plant-based options.
CategoriesDemand for convenience foods, ready-made foods and snacking is growing.
ConsumersConsumers’ awareness of healthy lifestyles, sustainable development and animal welfare is increasing.
MacroeconomyEconomic instability and uncertainty, as well as protectionism and local focus, are increasing.
Channels • Demand and new opportunities
in the Food Service sector are growing.
• The importance of digital channels continues to grow, and the growth of private labels continues.
Our mission
We create inspiring food for every occasion with strong brands and passion.
Good food – better mood.
Our vision
Winning Northern European Food Company
Enablers of strategy
Commercial excellence • Consumer and
market insight• Brand and category
management (incl. productization)
• Customer experience
Efficiency• Monitoring
and improving efficiency
• Modern technology
• Cost awareness
Atria Way of Work• Safety First• Committed people• Performance
culture
Improving productivity• Stronger balance sheet and financial position• Improving profitability and productivity in all countries of
operation• Investments in growth in Finland, including meat operations,
the feed business and production automation.
Atria’s Healthy Growth • Primarily organic growth in all business areas• Operational profitability will not be compromised: emphasis
on productivity• Growth investments in technology and other investments that
improve efficiency and productivity.
Winning Northern European Food Company• Strong financial performance• Growth in poultry, convenience foods and the Food Service
sector through the most attractive brands, deep customer partnerships and the most sustainable operations in the sector
• Improving the profitability of red meat in Finland and profitable growth in Sweden
ATRIA’S STRATEGIC PATHAtria’s strategy to become a Winning Northern European Food Company is a consistent continuation of its strategy for the previous period. During the previous period, Atria implemented significant efficiency programmes and investments to improve its operational productivity and competitiveness. At the same time, the company succeeded in strengthening its equity ratio.
WINNING NORTHERN EUROPEAN FOOD COMPANY
ATRIA’S HEALTHY GROWTH IMPROVING PRODUCTIVITY2009 2015 2020 2025
ATRIA PLC | STRATEGY 2021–2025
11

Front page
Atria in brief
Atria’s key indicators
CEO’s review
Strategy 2021–2025
Strategy 2016–2020
Operating environment
Business area reviews
Atria Finland
Atria Sweden
Atria Denmark & Estonia
Atria Russia
Research and Development
Financial Statements and Corporate Governance
Financial Statements and Corporate Governance
Auditor’s report
Corporate Governance Statement
Investor reporting
Contact information
Atria’s Annual Report 2020
ATRIA PLC | STRATEGY 2016–2020
Atria’s Healthy Growth strategy highlighted profitabilityAtria’s Healthy Growth strategy period ended at the close of 2020. The focus of the strategy period was on profitability. Other key goals included improving profitability, accelerating growth and increasing shareholder value systematically over the long term.
During the 2016–2020 strategy period, Atria aimed to grow in a mainly organic manner by developing and expanding its existing operations. The company sought to drive growth by developing new product segments and expanding into new market areas. In this respect, the most significant achievement was entry into the Chinese pork market.
Alongside organic growth, Atria actively identified
opportunities for acquisitions and other arrangements generating healthy growth. These supplemented existing business operations, as well as offering opportunities to create entirely new product segments or enter new market areas. The most significant acquisitions in Finland were the Kaivon Liha Kaunismaa beef and the Domretor convenience food companies. In Sweden, Atria acquired the Lagerbergs poultry company.
Atria managed its Healthy Growth strategy through three main themes: commercial excellence; efficient operations; and the Atria Way of Work. More information about the most important theme-specific successes of the strategy period is provided in the Board of Directors’ report (Financial Review, p. 46).
ATRIA’S FINANCIAL TARGETS AND RESULTS 2018–2020
Target Result 2020 Result 2019 Result 2018
EBIT 5% 2.7% 2.1% 2.0%
Equity ratio 40% 46.8% 46.9% 47.7%
Return on equity (ROE) 8% 5.7% 3.9% 4.1%
Capital distribution of the profit for the period 50% 61.4%*) 78.4% 68.8%
*) Board of Directors’ proposal
Atria’s most significant production investments 2016–2020
New pig-cutting plant: EUR 36 millionAtria’s new pig-cutting plant was completed in 2017, with world-leading technologies. This investment of around EUR 36 million has enabled Atria to improve the productivity of the pig-cutting plant and the competitiveness of its entire pork chain for the domestic and export markets.
Lagerbergs poultry company: EUR 33 millionAtria entered the growing Swedish fresh poultry market by acquiring Lagerbergs in 2016. The acquisition of around EUR 19 million was supplemented by an investment programme of around EUR 14 million, through which Atria has strongly improved the productivity and competitiveness of the entire production chain.
12
Front page
Atria in brief
Atria’s key indicators
CEO’s review
Strategy 2021–2025
Strategy 2016–2020
Operating environment
Business area reviews
Atria Finland
Atria Sweden
Atria Denmark & Estonia
Atria Russia
Research and Development
Financial Statements and Corporate Governance
Financial Statements and Corporate Governance
Auditor’s report
Corporate Governance Statement
Investor reporting
Contact information
Atria’s Annual Report 2020
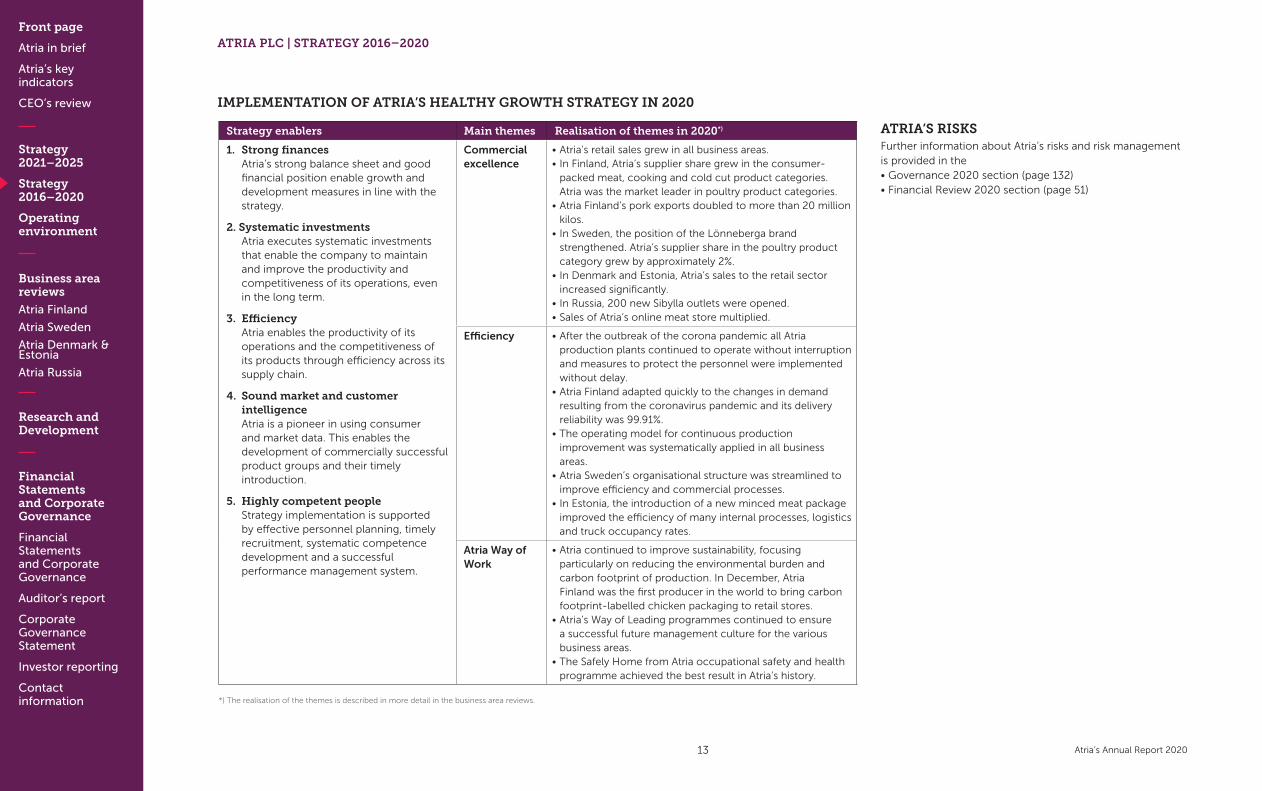
IMPLEMENTATION OF ATRIA’S HEALTHY GROWTH STRATEGY IN 2020
Strategy enablers Main themes Realisation of themes in 2020*)
1. Strong finances Atria’s strong balance sheet and good financial position enable growth and development measures in line with the strategy.
2. Systematic investments Atria executes systematic investments that enable the company to maintain and improve the productivity and competitiveness of its operations, even in the long term.
3. Efficiency Atria enables the productivity of its operations and the competitiveness of its products through efficiency across its supply chain.
4. Sound market and customer intelligence Atria is a pioneer in using consumer and market data. This enables the development of commercially successful product groups and their timely introduction.
5. Highly competent people Strategy implementation is supported by effective personnel planning, timely recruitment, systematic competence development and a successful performance management system.
Commercial excellence
• Atria’s retail sales grew in all business areas. • In Finland, Atria’s supplier share grew in the consumer-
packed meat, cooking and cold cut product categories. Atria was the market leader in poultry product categories.
• Atria Finland’s pork exports doubled to more than 20 million kilos.
• In Sweden, the position of the Lönneberga brand strengthened. Atria’s supplier share in the poultry product category grew by approximately 2%.
• In Denmark and Estonia, Atria’s sales to the retail sector increased significantly.
• In Russia, 200 new Sibylla outlets were opened. • Sales of Atria’s online meat store multiplied.
Efficiency • After the outbreak of the corona pandemic all Atria production plants continued to operate without interruption and measures to protect the personnel were implemented without delay.
• Atria Finland adapted quickly to the changes in demand resulting from the coronavirus pandemic and its delivery reliability was 99.91%.
• The operating model for continuous production improvement was systematically applied in all business areas.
• Atria Sweden’s organisational structure was streamlined to improve efficiency and commercial processes.
• In Estonia, the introduction of a new minced meat package improved the efficiency of many internal processes, logistics and truck occupancy rates.
Atria Way of Work
• Atria continued to improve sustainability, focusing particularly on reducing the environmental burden and carbon footprint of production. In December, Atria Finland was the first producer in the world to bring carbon footprint-labelled chicken packaging to retail stores.
• Atria’s Way of Leading programmes continued to ensure a successful future management culture for the various business areas.
• The Safely Home from Atria occupational safety and health programme achieved the best result in Atria’s history.
*) The realisation of the themes is described in more detail in the business area reviews.
ATRIA’S RISKSFurther information about Atria’s risks and risk management is provided in the• Governance 2020 section (page 132)• Financial Review 2020 section (page 51)
ATRIA PLC | STRATEGY 2016–2020
13
Front page
Atria in brief
Atria’s key indicators
CEO’s review
Strategy 2021–2025
Strategy 2016–2020
Operating environment
Business area reviews
Atria Finland
Atria Sweden
Atria Denmark & Estonia
Atria Russia
Research and Development
Financial Statements and Corporate Governance
Financial Statements and Corporate Governance
Auditor’s report
Corporate Governance Statement
Investor reporting
Contact information
Atria’s Annual Report 2020
ATRIA PLC | OPERATING ENVIRONMENT
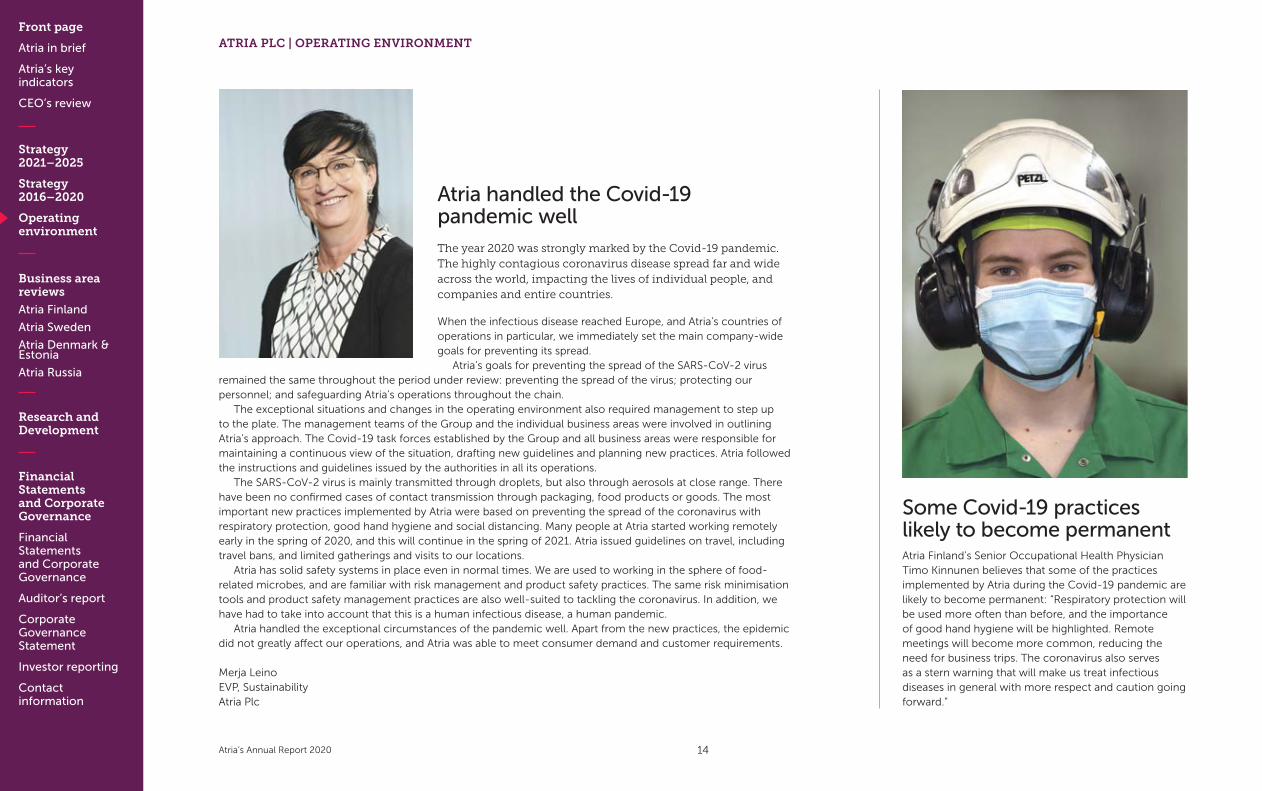
Some Covid-19 practices likely to become permanentAtria Finland’s Senior Occupational Health Physician Timo Kinnunen believes that some of the practices implemented by Atria during the Covid-19 pandemic are likely to become permanent: “Respiratory protection will be used more often than before, and the importance of good hand hygiene will be highlighted. Remote meetings will become more common, reducing the need for business trips. The coronavirus also serves as a stern warning that will make us treat infectious diseases in general with more respect and caution going forward.”
Atria handled the Covid-19 pandemic well The year 2020 was strongly marked by the Covid-19 pandemic. The highly contagious coronavirus disease spread far and wide across the world, impacting the lives of individual people, and companies and entire countries.
When the infectious disease reached Europe, and Atria’s countries of operations in particular, we immediately set the main company-wide goals for preventing its spread.
Atria’s goals for preventing the spread of the SARS-CoV-2 virus remained the same throughout the period under review: preventing the spread of the virus; protecting our personnel; and safeguarding Atria’s operations throughout the chain.
The exceptional situations and changes in the operating environment also required management to step up to the plate. The management teams of the Group and the individual business areas were involved in outlining Atria’s approach. The Covid-19 task forces established by the Group and all business areas were responsible for maintaining a continuous view of the situation, drafting new guidelines and planning new practices. Atria followed the instructions and guidelines issued by the authorities in all its operations.
The SARS-CoV-2 virus is mainly transmitted through droplets, but also through aerosols at close range. There have been no confirmed cases of contact transmission through packaging, food products or goods. The most important new practices implemented by Atria were based on preventing the spread of the coronavirus with respiratory protection, good hand hygiene and social distancing. Many people at Atria started working remotely early in the spring of 2020, and this will continue in the spring of 2021. Atria issued guidelines on travel, including travel bans, and limited gatherings and visits to our locations.
Atria has solid safety systems in place even in normal times. We are used to working in the sphere of food-related microbes, and are familiar with risk management and product safety practices. The same risk minimisation tools and product safety management practices are also well-suited to tackling the coronavirus. In addition, we have had to take into account that this is a human infectious disease, a human pandemic.
Atria handled the exceptional circumstances of the pandemic well. Apart from the new practices, the epidemic did not greatly affect our operations, and Atria was able to meet consumer demand and customer requirements.
Merja LeinoEVP, SustainabilityAtria Plc
14

Front page
Atria in brief
Atria’s key indicators
CEO’s review
Strategy 2021–2025
Strategy 2016–2020
Operating environment
Business area reviews
Atria Finland
Atria Sweden
Atria Denmark & Estonia
Atria Russia
Research and Development
Financial Statements and Corporate Governance
Financial Statements and Corporate Governance
Auditor’s report
Corporate Governance Statement
Investor reporting
Contact information
Atria’s Annual Report 2020
Increased sales to retailers and decreased sales to the Food Service sector in all business areasThe Covid-19 pandemic had very similar effects on all Atria’s business areas: it boosted sales to retailers, and reduced sales to the Food Service and Fast Food sectors. The increase in retailer sales was approximately 10 per cent. Sales to Food Service and
Fast Food customers decreased by approximately 20 per cent due to the coronavirus restrictions implemented in various business areas.
THE EFFECTS OF THE CORONA PANDEMIC ON ATRIA’S BUSINESS OPERATIONS
Atria Finland Atria Sweden Atria Denmark & Estonia Atria Russia
Effect on overall demand for Atria’s product categories
In retail trade Demand grew by about 10%. Demand grew by about 10%. Demand grew by about 10%. Demand grew by about 10%.
In the FS sector (incl. the Fast Food sector)
Demand fell by about 20%. Demand fell by about 20%. In Denmark demand fell by about 35% and in Estonia more than 50%.
Demand fell by about 5%.
Product categories showing the largest growth
In retail trade Strongest growth in the cooking and convenience food categories.
Strongest growth in cold cuts, sausages, poultry meat and convenience food.
In Estonia demand for minced meat grew in the spring.
No significant effect.
In the FS sector (incl. the Fast Food sector)
Decline in all product categories.
Decline in all product categories.
• No significant effect.• Demand for the best cuts fell
in Estonia
Decline in all product categories, except high-quality, air-dried products.
Effect on the production and supply chain • Delivery reliability was 99.91% despite great fluctuations in demand during the early stages of the pandemic.
• Management system was revised to secure the continuity of production and reliable deliveries.
• Investments to ensure uninterrupted production.
• Strict health and safety instructions were adopted to secure operations.
Strict health and safety instructions were adopted to secure operations.
Strict health and safety instructions and travel restrictions were adopted to secure operations.
Effect on production costs and other costs Additional costs for special arrangements and protecting the personnel.
ATRIA PLC | OPERATING ENVIRONMENT
15
Front page
Atria in brief
Atria’s key indicators
CEO’s review
Strategy 2021–2025
Strategy 2016–2020
Operating environment
Business area reviews
Atria Finland
Atria Sweden
Atria Denmark & Estonia
Atria Russia
Research and Development
Financial Statements and Corporate Governance
Financial Statements and Corporate Governance
Auditor’s report
Corporate Governance Statement
Investor reporting
Contact information
Atria’s Annual Report 2020
ATRIA PLC | OPERATING ENVIRONMENT
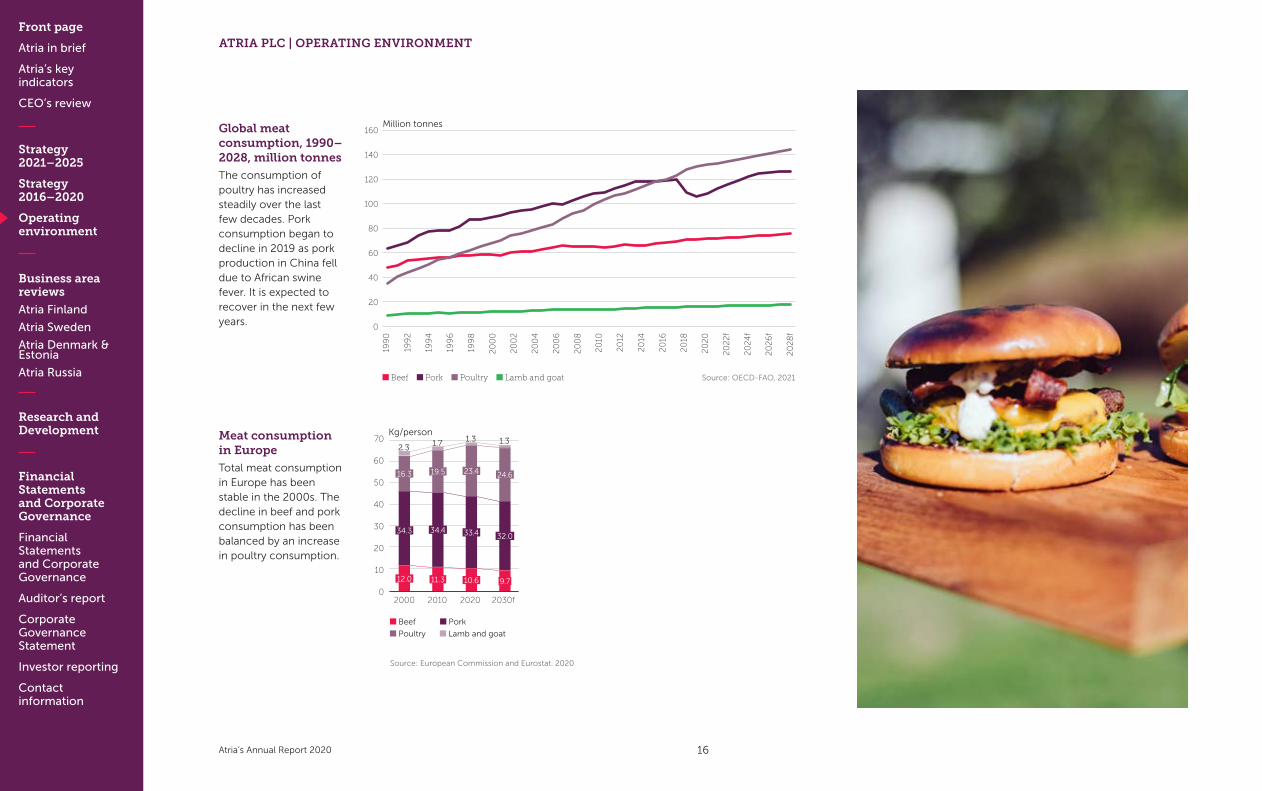
Global meat consumption, 1990–2028, million tonnes
The consumption of poultry has increased steadily over the last few decades. Pork consumption began to decline in 2019 as pork production in China fell due to African swine fever. It is expected to recover in the next few years.
199
0
199
2
199
4
199
6
199
8
20
00
20
02
20
04
20
06
20
08
20
10
20
12
20
14
20
16
20
18
20
20
20
22
f
20
24f
20
26
f
20
28
f
160
140
120
100
80
60
40
20
0
Beef Pork Poultry Lamb and goat Source: OECD-FAO, 2021
Million tonnes
Meat consumption in Europe
Total meat consumption in Europe has been stable in the 2000s. The decline in beef and pork consumption has been balanced by an increase in poultry consumption.
70
60
50
40
30
20
10
02000 2010 2020 2030f
Kg/person
Beef Pork
Poultry Lamb and goat
12.0
34.3
16.3
2.3
11.3
34.4
19.5
1.7
10.6
33.4
23.4
1.3
9.7
32.0
24.6
1.3
Source: European Commission and Eurostat. 2020
16

Front page
Atria in brief
Atria’s key indicators
CEO’s review
Strategy 2021–2025
Strategy 2016–2020
Operating environment
Business area reviews
Atria Finland
Atria Sweden
Atria Denmark & Estonia
Atria Russia
Research and Development
Financial Statements and Corporate Governance
Financial Statements and Corporate Governance
Auditor’s report
Corporate Governance Statement
Investor reporting
Contact information
Atria’s Annual Report 2020
Global pork production in 2020
World pork production decreased in 2019, as pork proction in China declined about a third due to African swine fever (ASF).
Source: USDA, 2021
China 38.0 mill. tn• Share 39.1%• Change -10.7%
EU 24.2 mill. tn• Share 24.7%• Change 0.2%
USA 12.8 mill. tn• Share 13.2%• Change 2.4%
Brazil 4.1 mill. tn• Share 4.2%• Change 3.8%
Russia 3.4 mill. tn• Share 3.5%• Change 5.7%
Others 14.8 mill. tn• Share 15.2%• Change -6.0%
97.6million tonnes
Source: European Commission, 2020 Index 2015=100
160
140
120
100
80
60
40
20
0
Development of pork prices in Europe (index, 2015=100)
Pork price shot up in 2019 after the collapse of Chinese pork production due to African swine fever. In 2020, the price returned to its pre-disease level.
1/15
3/1
55
/15
7/15
9/1
511
/15
1/16
3/1
65
/16
7/16
9/1
611
/16
1/17
3/1
75
/17
7/17
9/1
711
/17
1/18
3/1
85
/18
7/18
9/1
811
/18
1/19
3/1
95
/19
7/19
9/1
911
/19
1/2
03
/20
5/2
07/
20
9/2
011
/20
Index
ATRIA PLC | OPERATING ENVIRONMENT
17
Front page
Atria in brief
Atria’s key indicators
CEO’s review
Strategy 2021–2025
Strategy 2016–2020
Operating environment
Business area reviews
Atria Finland
Atria Sweden
Atria Denmark & Estonia
Atria Russia
Research and Development
Financial Statements and Corporate Governance
Financial Statements and Corporate Governance
Auditor’s report
Corporate Governance Statement
Investor reporting
Contact information
Atria’s Annual Report 2020
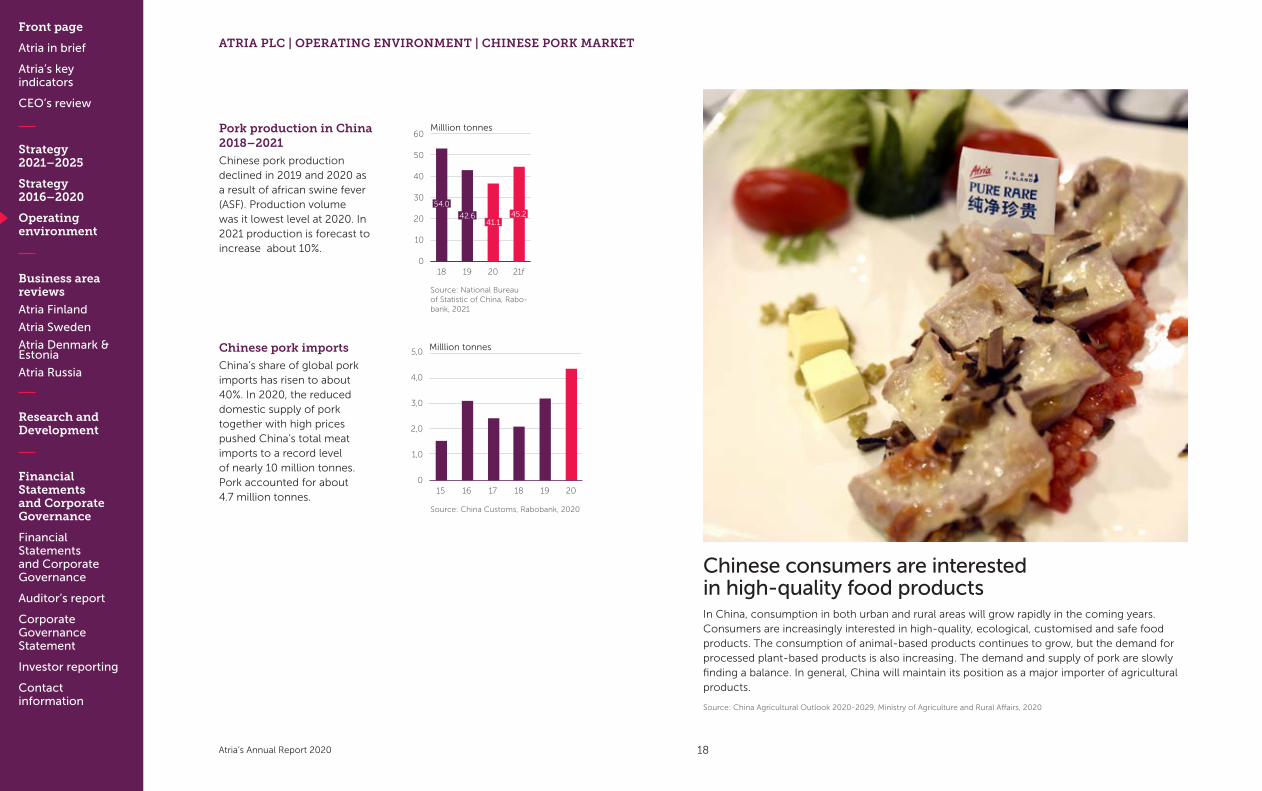
Chinese consumers are interested in high-quality food productsIn China, consumption in both urban and rural areas will grow rapidly in the coming years. Consumers are increasingly interested in high-quality, ecological, customised and safe food products. The consumption of animal-based products continues to grow, but the demand for processed plant-based products is also increasing. The demand and supply of pork are slowly finding a balance. In general, China will maintain its position as a major importer of agricultural products.
Source: China Agricultural Outlook 2020-2029, Ministry of Agriculture and Rural Affairs, 2020
Pork production in China 2018–2021
Chinese pork production declined in 2019 and 2020 as a result of african swine fever (ASF). Production volume was it lowest level at 2020. In 2021 production is forecast to increase about 10%.
Chinese pork imports
China’s share of global pork imports has risen to about 40%. In 2020, the reduced domestic supply of pork together with high prices pushed China’s total meat imports to a record level of nearly 10 million tonnes. Pork accounted for about 4.7 million tonnes.
15 16 17 18 19 20
5,0
4,0
3,0
2,0
1,0
0
Milllion tonnes
Source: China Customs, Rabobank, 2020
ATRIA PLC | OPERATING ENVIRONMENT | CHINESE PORK MARKET
60
50
40
30
20
10
0
Milllion tonnes
18 19 20 21f
45.241.1
42.6
54.0
Source: National Bureau of Statistic of China, Rabo-bank, 2021
18

Front page
Atria in brief
Atria’s key indicators
CEO’s review
Strategy 2021–2025
Strategy 2016–2020
Operating environment
Business area reviews
Atria Finland
Atria Sweden
Atria Denmark & Estonia
Atria Russia
Research and Development
Financial Statements and Corporate Governance
Financial Statements and Corporate Governance
Auditor’s report
Corporate Governance Statement
Investor reporting
Contact information
Atria’s Annual Report 2020
Strong growth for Atria’s pork exportsAtria’s export of pork to China increased to over 20 million kilos in 2020. This accounts for almost 30% of the volume of meat processed by Atria. Exports to other key export countries, such as South Korea and Sweden, also increased. In addition, Atria signed a new cooperation agreement with a Japanese restaurant chain.
In total, Atria’s exports increased by about 50% from 2019. It is important to Atria’s export customers that the products are clean, safe and traceable, and that the rearing of the animals is antibiotic-free.
Antibiotic-free pork for a Japanese restaurant chainAtria signed a cooperation agreement with a Japanese restaurant chain for the export of Finnish antibiotic-free pork to Japan. The Japanese Bikkuri Donkey family restaurant chain uses Atria pork in its burger steaks.
Bikkuri Donkey is part of the Aleph Inc. Group, which is committed to sustainable development. Its restaurants only use responsibly produced ingredients.
ATRIA PLC | OPERATING ENVIRONMENT | CHINESE PORK MARKET
19

Front page
Atria in brief
Atria’s key indicators
CEO’s review
Strategy 2021–2025
Strategy 2016–2020
Operating environment
Business area reviews
Atria Finland
Atria Sweden
Atria Denmark & Estonia
Atria Russia
Research and Development
Financial Statements and Corporate Governance
Financial Statements and Corporate Governance
Auditor’s report
Corporate Governance Statement
Investor reporting
Contact information
Atria’s Annual Report 2020
ATRIA PLC | OPERATING ENVIRONMENT | FINNISH POULTRY MARKET
Poultry market growth in Finland in 2000–2020
Poultry consumption has increased steadily in Finland throughout the 2000s. In 2020, both poultry consumption and production increased by about 4%. The domestic share of consumption also increased.
Forecast for poultry consumption in Finland
According to consumption forecasts by Atria, poultry consumption (mainly chicken products) in Finland will exceed 200 million kilos by 2030 if the consumption trend remains similar to that between 2011 and 2020, when the average annual growth rate was 3.8%.
160
140
120
100
80
60
40
20
0
Production Consumption Import Source: Kantar TNS 2021
Million kg of bone-in meat
Million kg
20
10
20
12
20
14
20
16
20
18
20
20
20
22
f
20
24f
20
26
f
20
28
f
20
30
f
250
200
150
100
50
0
Consumption forecast scenarios: +4% +3% +2% Source: Atria Insight, 2019
Atria introduced carbon footprint markings on chicken product packagingThe first carbon footprint-marked chicken products were sold in retail stores in December 2020. As far as we know, Atria is the first producer to use carbon footprint labelling on its chicken products. Farm-specific traceability of the meat raw material enables product-specific carbon footprint labelling. The Alatalo farm’s chicken products were the first to carry a carbon footprint label. As farm-specific calculations are completed for more farms, more and more products will get a carbon footprint marking. The label shows the climate impact of the product’s entire production chain in terms of carbon dioxide. The calculation also takes into account industrial production and packaging. The carbon footprint calculation was carried out in cooperation with Envitecpolis Oy and Atria producers.
20
00
20
02
20
04
20
06
20
08
20
10
20
12
20
14
20
16
20
18
20
20
20

Front page
Atria in brief
Atria’s key indicators
CEO’s review
Strategy 2021–2025
Strategy 2016–2020
Operating environment
Business area reviews
Atria Finland
Atria Sweden
Atria Denmark & Estonia
Atria Russia
Research and Development
Financial Statements and Corporate Governance
Financial Statements and Corporate Governance
Auditor’s report
Corporate Governance Statement
Investor reporting
Contact information
Atria’s Annual Report 2020
The decision to build a new poultry plant was confirmedIn October, Atria confirmed the decision to build a new poultry plant in Nurmo. The investment is the largest in Atria’s history and extremely important to the company. The value of the investment is approximately EUR 155 million, and it will increase Atria Finland’s poultry production capacity by approximately 40%.
The construction of the new poultry plant meets the increased demand for chicken and strengthens Atria’s position as the market leader in chicken products. The consumption of chicken has grown strongly both in Finland and globally for many years, and it is expected to keep growing.
The new plant will be completed in 2024. Further information about the progress of the investment is available on our website at www.atria.fi/konserni/ajankohtaista/atrian-siipikarjainvestointi-2024/.
2021 2022 2023 2024
Planning
Excavation
Construction
Equipment installations
Start-up
• Atria confirmed the decision to build a new poultry plant on October 21, 2020 • The designers of the expanding project was chosen on January 20, 2021• The excavation will begin during the spring 2021.
The schedule of the new poultry plant
ATRIA PLC | OPERATING ENVIRONMENT | FINNISH POULTRY MARKET
21

Front page
Atria in brief
Atria’s key indicators
CEO’s review
Strategy 2021–2025
Strategy 2016–2020
Operating environment
Business area reviews
Atria Finland
Atria Sweden
Atria Denmark & Estonia
Atria Russia
Research and Development
Financial Statements and Corporate Governance
Financial Statements and Corporate Governance
Auditor’s report
Corporate Governance Statement
Investor reporting
Contact information
Atria’s Annual Report 2020
In terms of operational structure, Atria Group consists of four business areas,
or reporting segments: Atria Finland, Atria Sweden, Atria Denmark & Estonia
and Atria Russia. In 2020, Atria Group’s net sales were EUR 1,504 million,
which was distributed between the business areas follows: Atria Finland 70%,
Atria Sweden 19%, Atria Denmark & Estonia 7% and Atria Russia 4%.
B U S I N E S S A R E AR E V I E W S
22
Front page
Atria in brief
Atria’s key indicators
CEO’s review
Strategy 2021–2025
Strategy 2016–2020
Operating environment
Business area reviews
Atria Finland
Atria Sweden
Atria Denmark & Estonia
Atria Russia
Research and Development
Financial Statements and Corporate Governance
Financial Statements and Corporate Governance
Auditor’s report
Corporate Governance Statement
Investor reporting
Contact information
Atria’s Annual Report 2020
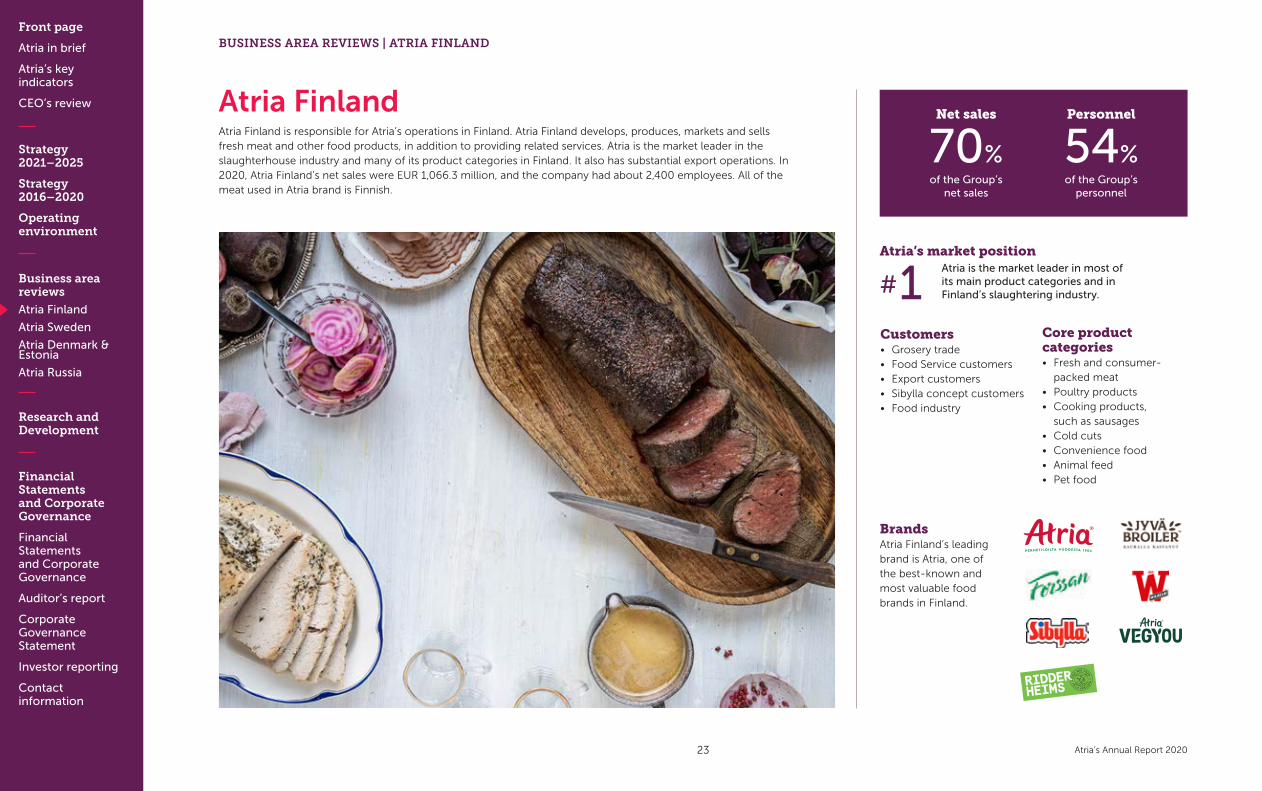
Atria FinlandAtria Finland is responsible for Atria’s operations in Finland. Atria Finland develops, produces, markets and sells fresh meat and other food products, in addition to providing related services. Atria is the market leader in the slaughterhouse industry and many of its product categories in Finland. It also has substantial export operations. In 2020, Atria Finland’s net sales were EUR 1,066.3 million, and the company had about 2,400 employees. All of the meat used in Atria brand is Finnish.
Net sales
70%of the Group’s
net sales
Personnel
54%of the Group’s
personnel
Atria’s market position
# 1Atria is the market leader in most of its main product categories and in Finland’s slaughtering industry.
Customers• Grosery trade• Food Service customers• Export customers• Sibylla concept customers• Food industry
Core product categories• Fresh and consumer-
packed meat• Poultry products• Cooking products,
such as sausages• Cold cuts• Convenience food• Animal feed• Pet food
BrandsAtria Finland’s leading brand is Atria, one of the best-known and most valuable food brands in Finland.
BUSINESS AREA REVIEWS | ATRIA FINLAND
23
Front page
Atria in brief
Atria’s key indicators
CEO’s review
Strategy 2021–2025
Strategy 2016–2020
Operating environment
Business area reviews
Atria Finland
Atria Sweden
Atria Denmark & Estonia
Atria Russia
Research and Development
Financial Statements and Corporate Governance
Financial Statements and Corporate Governance
Auditor’s report
Corporate Governance Statement
Investor reporting
Contact information
Atria’s Annual Report 2020
Net sales (EUR million)
The net sales of Atria Finland grew by EUR 32.5 million compared to the previous year, and amounted to EUR 1,066.3 million. Net sales were boosted by increased sales to the retail sector and export customers. Pork exports to China increased significantly and the sales of Atria’s product categories in the Finnish retail trade also grew more strongly than in the previous year. Sales to Food Service customers decreased significantly due to the coronavirus pandemic.
EBIT (EUR million)
Atria Finland’s EBIT increased EUR 3.1 million from the previous year to EUR 43.1 million. This was 4.0% of net sales. Profitability improved mostly because of increased net sales, improved productivity and effective cost control.
Strong growth under challenging circumstancesThe year 2020 was good for Atria Finland’s growth and profitability. Despite the coro-navirus pandemic making our operating environment exceptionally challenging and uncertain, we succeeded to make stronger
progress than in the previous year in two of our main channels, retail trade and exports. In our third main channel, the Food Service sector, the measures taken to limit the coronavirus pandemic reduced the industry’s total earnings by about one-fifth. Atria’s development was similar to the general development of the industry.
The coronavirus pandemic also changed the Finnish consumer demand for food dramatically. Demand for food grew at the same rate as cooking at home, and good home-cooked meals became highly valued. This was directly reflected in Atria’s sales to the retail sector. The market for Atria’s cooking, poultry and consumer-packed meat product categories grew by almost 10%. Atria’s supplier share grew in all product categories, as did the sales of Atria’s own brands. Overall development was strong. The same is true of Atria’s pork exports to China: they more than doubled from the previous year to over 20 million kilos. This was almost 30% of the pork produced by the Nurmo plant.
The consumption of meat in Finland remained stable. Ninety-three per cent of Finns eat meat – and specifically meat produced in Finland. About 83% of all meat consumed in Finland was domestically produced. These figures are very important for Atria’s future growth. After all, the year 2020 saw the largest investment decision in our history, amounting to approximately EUR 155 million, to build a new poultry unit near the Nurmo plants.
Mika Ala-FossiExecutive Vice President, Atria Finland
1,066.3(EUR 1,033.8 million in 2019)
1 200
1 000
800
600
400
200
0
MEUR
16 17 18 19 20
1,034 1,066
43.1(EUR 40.0 million in 2019)
EBIT-%
5
4
3
2
1
0
50
40
30
20
10
0
EUR million EBIT-%
16 17 18 19 20
4.03.9
4340
BUSINESS AREA REVIEWS | ATRIA FINLAND
24

Front page
Atria in brief
Atria’s key indicators
CEO’s review
Strategy 2021–2025
Strategy 2016–2020
Operating environment
Business area reviews
Atria Finland
Atria Sweden
Atria Denmark & Estonia
Atria Russia
Research and Development
Financial Statements and Corporate Governance
Financial Statements and Corporate Governance
Auditor’s report
Corporate Governance Statement
Investor reporting
Contact information
Atria’s Annual Report 2020
Category Change in overall markets 2)
Manufacturing share 3)
Atria’s bränds 4)
Value (€) Volume (%) Value (€) Volume
Consumer-packed meat 10.2% 7.0% 31.7% #1
Poultry 13.4% 11.3% 44.0% #1
Cooking 11.9% 6.0% 24.2% #2
Cold cuts 5.9% 1.2% 21.6% #1
Convenience food 7.1% 4.6% 13.3% #2
Total 9.1% 5.8% 24.4%
1) Retail sector, consumer-packed products2) Percentage of change in comparison to 2019
3) Atria as a supplier4) The market position of product categories sold under the Atria brand
THE FINNISH BARBECUE MARKET IN 2020 1)
Value, approx. (EUR million)
124Change-%
9.5% (-4.6% in 2019)
28%Market share of
Atria’s barbecue
product categories
#1Market position
of Atria’s
barbecue product
categories1) Atria Insight 2020
THE POSITION OF ATRIA’S MAIN CATEGORIES IN THE MARKET 1)
TOTAL MARKETS OF ATRIA’S MAIN PRODUCT CATEGORIES 1)
Value (EUR million)
2,651Change-%
8.4%
Volume (EUR million)
387Change-%
5.8%1) Grocery trade, consumer-packed and bulk products
FINLAND’S MEAT MARKET AND MEAT PRODUCT MARKETS 2)
2) Total value of the meat and meat products market in the grocery trade and food service channels.
Value (EUR million)
3,080 (VAT 0%)Change-%
0.6 (volume) 3.7 (value)
An acquisition strengthened Atria’s position in convenience food selectionsAtria Finland acquired the entire share capital of Domretor Oy, a contract manufacturer in the food industry. Domretor produces a range of convenience food products and semi-prepared foods. The acquisition strengthens Atria’s position both in the retail convenience food selections and in the market for Food Service products. Domretor Oy has been an associated company of Atria since 2013 and will continue to operate independently as its own company.
BUSINESS AREA REVIEWS | ATRIA FINLAND
25

Front page
Atria in brief
Atria’s key indicators
CEO’s review
Strategy 2021–2025
Strategy 2016–2020
Operating environment
Business area reviews
Atria Finland
Atria Sweden
Atria Denmark & Estonia
Atria Russia
Research and Development
Financial Statements and Corporate Governance
Financial Statements and Corporate Governance
Auditor’s report
Corporate Governance Statement
Investor reporting
Contact information
Atria’s Annual Report 2020
Total meat
• Production............................ 409 million kg 2%
• Consumption ........................423 million kg 0%
• Export .......................................65 million kg 8%
• Import ....................................... 73 million kg -13%
• Domestic share of consumption .....82.8%
Pork
• Production............................. 176 million kg 3%
• Consumption ........................164 million kg -3%
• Export ....................................... 41 million kg 17%
• Import ....................................... 27 million kg -21%
• Domestic share of consumption .....83.3%
Poultry
• Production............................. 145 million kg 4%
• Consumption ........................ 152 million kg 4%
• Export ........................................17 million kg 4%
• Import ....................................... 21 million kg -8%
• Domestic share of consumption .....86.3%
Beef
• Production...............................87 million kg - 1%
• Consumption ........................103 million kg - 1%
• Export ......................................... 7 million kg -17%
• Import .......................................22 million kg -5%
• Domestic share of consumption .....78.9%
1) Production and consumption of bone-in meat. 80% of bone meat is boneless, and the loss of cooking varies from 10 to 30% depending on the product.
Source: Kantar TNS Agri, 2021
MEAT PRODUCTION AND CONSUMPTION IN 2020 1)
Change, %, in comparison to 2019
-10 -8 -6 -4 -2 0 2 4 6 8 10
Atria’s delivery reliability (%)
99.91Atria’s sound management ofthe supply chain increases thepredictability of operationsalongside delivery reliability. Atria’s supply chain was able to respond to large fluctuations in demand during 2019 the year under review. Delivery reliability was 99.91 percent.
Volume of meat processed by Atria (million kg)
176.6
Poultry Beef Pork
Million kg
16 17 18 19 20
180
160
140
120
100
80
60
40
20
0
41
55
75
42
80.0 75.0 67.2
55.054.5 65.0
41.0 41.042.6
66.5
63.0
44.1
68.5
65.5
42.6
Compared to the previous year, the meat volumes processed by Atria increased by 3.0 million kilos to 176.6 million kilos. Poultry and pork processing volumes increased almost as much. Atria is the market leader in the slaughter industry in Finland.
%
16 17 18 19 20
100
90
Online meat sales multipliedOnline food sales took a big step forward during this exceptional year, and this was also seen in Atria’s online meat store. In 2020, online sales and deliveries of meat multiplied. As more cooking was done at home than before, consumers bought premium meat products from Atria’s online store. Sales of fillets and organic products grew particularly strongly.
BUSINESS AREA REVIEWS | ATRIA FINLAND
26
Front page
Atria in brief
Atria’s key indicators
CEO’s review
Strategy 2021–2025
Strategy 2016–2020
Operating environment
Business area reviews
Atria Finland
Atria Sweden
Atria Denmark & Estonia
Atria Russia
Research and Development
Financial Statements and Corporate Governance
Financial Statements and Corporate Governance
Auditor’s report
Corporate Governance Statement
Investor reporting
Contact information
Atria’s Annual Report 2020
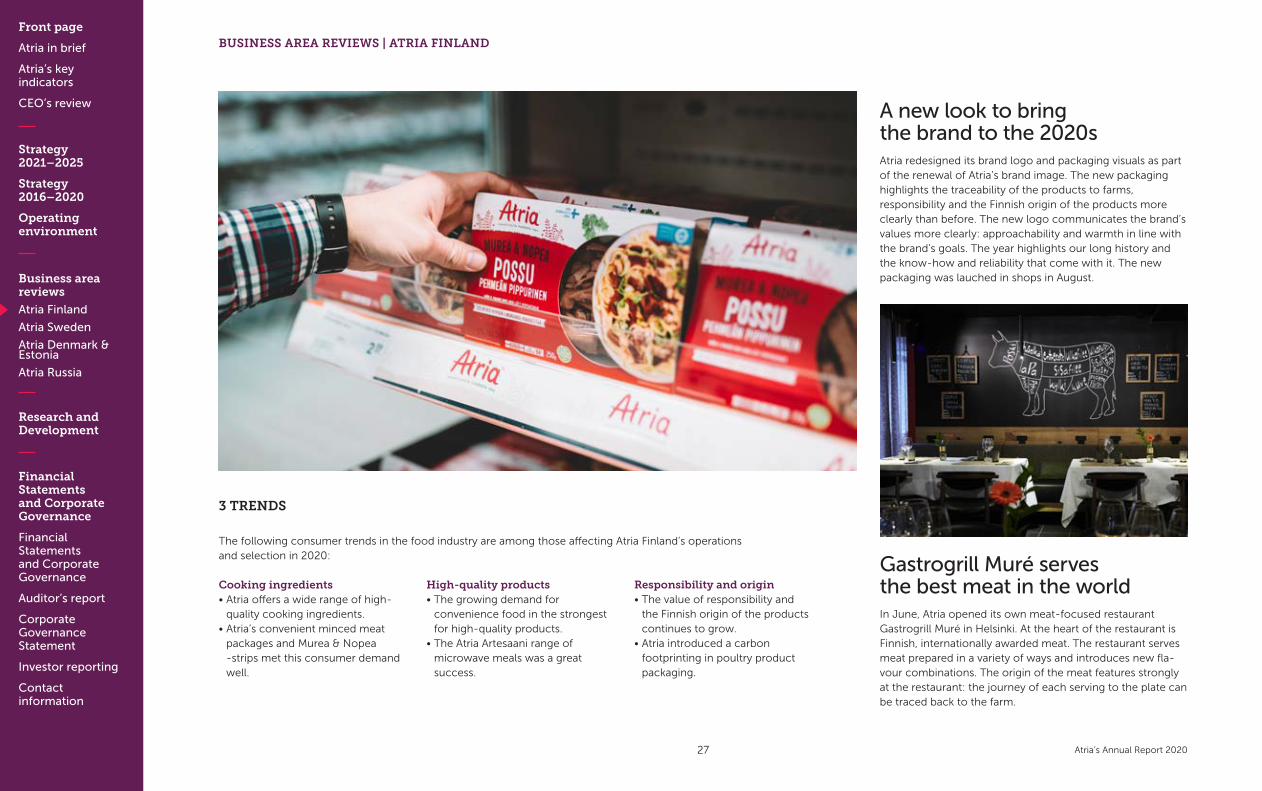
Gastrogrill Muré serves the best meat in the world In June, Atria opened its own meat-focused restaurant Gastrogrill Muré in Helsinki. At the heart of the restaurant is Finnish, internationally awarded meat. The restaurant serves meat prepared in a variety of ways and introduces new fla-vour combinations. The origin of the meat features strongly at the restaurant: the journey of each serving to the plate can be traced back to the farm.
A new look to bring the brand to the 2020sAtria redesigned its brand logo and packaging visuals as part of the renewal of Atria’s brand image. The new packaging highlights the traceability of the products to farms, responsibility and the Finnish origin of the products more clearly than before. The new logo communicates the brand’s values more clearly: approachability and warmth in line with the brand’s goals. The year highlights our long history and the know-how and reliability that come with it. The new packaging was lauched in shops in August.
3 TRENDS
The following consumer trends in the food industry are among those affecting Atria Finland’s operations and selection in 2020:
Cooking ingredients • Atria offers a wide range of high-
quality cooking ingredients. • Atria’s convenient minced meat
packages and Murea & Nopea -strips met this consumer demand well.
High-quality products• The growing demand for
convenience food in the strongest for high-quality products.
• The Atria Artesaani range of microwave meals was a great success.
Responsibility and origin• The value of responsibility and
the Finnish origin of the products continues to grow.
• Atria introduced a carbon footprinting in poultry product packaging.
BUSINESS AREA REVIEWS | ATRIA FINLAND
27
Front page
Atria in brief
Atria’s key indicators
CEO’s review
Strategy 2021–2025
Strategy 2016–2020
Operating environment
Business area reviews
Atria Finland
Atria Sweden
Atria Denmark & Estonia
Atria Russia
Research and Development
Financial Statements and Corporate Governance
Financial Statements and Corporate Governance
Auditor’s report
Corporate Governance Statement
Investor reporting
Contact information
Atria’s Annual Report 2020
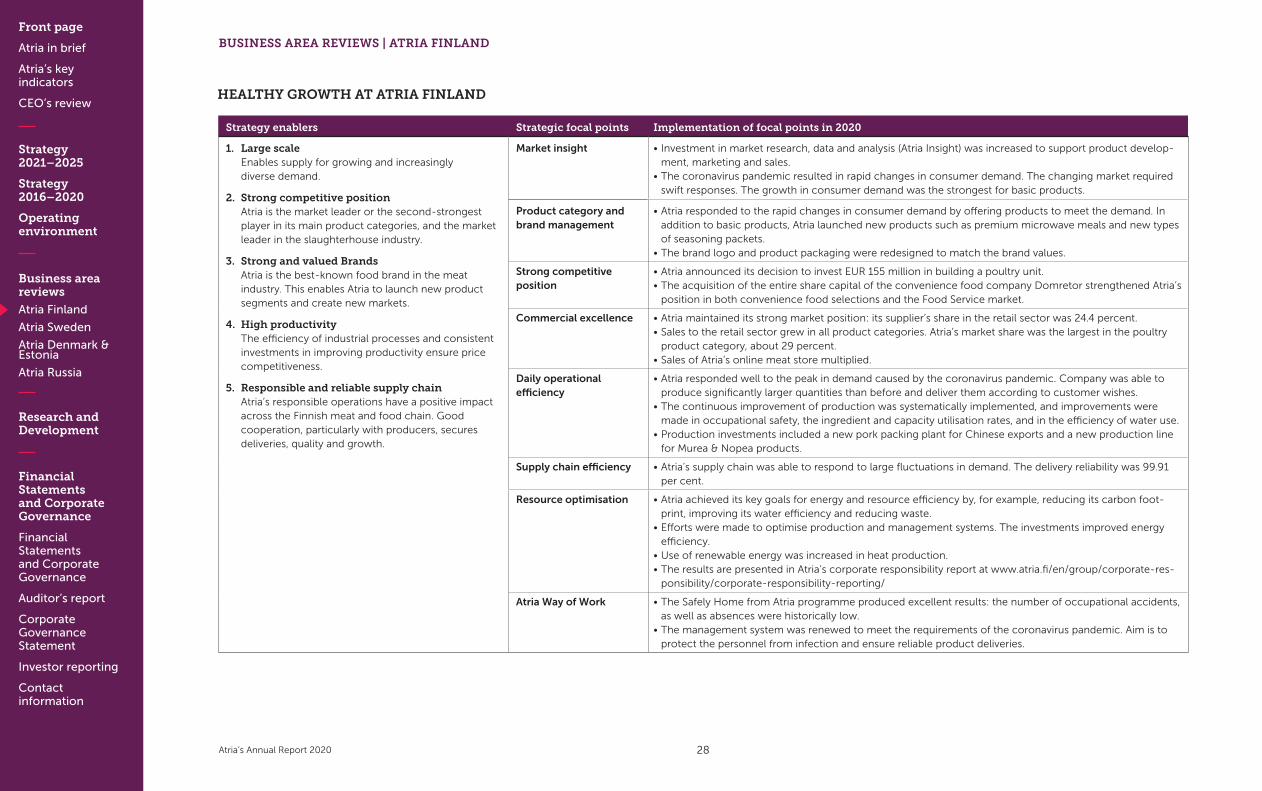
HEALTHY GROWTH AT ATRIA FINLAND
HEALTHY GROWTH AT ATRIA FINLAND
Strategy enablers Strategic focal points Implementation of focal points in 2020
1. Large scale Enables supply for growing and increasingly diverse demand.
2. Strong competitive position Atria is the market leader or the second-strongest player in its main product categories, and the market leader in the slaughterhouse industry.
3. Strong and valued Brands Atria is the best-known food brand in the meat industry. This enables Atria to launch new product segments and create new markets.
4. High productivity The efficiency of industrial processes and consistent investments in improving productivity ensure price competitiveness.
5. Responsible and reliable supply chain Atria’s responsible operations have a positive impact across the Finnish meat and food chain. Good cooperation, particularly with producers, secures deliveries, quality and growth.
Market insight • Investment in market research, data and analysis (Atria Insight) was increased to support product develop-ment, marketing and sales.
• The coronavirus pandemic resulted in rapid changes in consumer demand. The changing market required swift responses. The growth in consumer demand was the strongest for basic products.
Product category and brand management
• Atria responded to the rapid changes in consumer demand by offering products to meet the demand. In addition to basic products, Atria launched new products such as premium microwave meals and new types of seasoning packets.
• The brand logo and product packaging were redesigned to match the brand values.
Strong competitive position
• Atria announced its decision to invest EUR 155 million in building a poultry unit.• The acquisition of the entire share capital of the convenience food company Domretor strengthened Atria’s
position in both convenience food selections and the Food Service market.
Commercial excellence • Atria maintained its strong market position: its supplier’s share in the retail sector was 24.4 percent.• Sales to the retail sector grew in all product categories. Atria’s market share was the largest in the poultry
product category, about 29 percent.• Sales of Atria’s online meat store multiplied.
Daily operational efficiency
• Atria responded well to the peak in demand caused by the coronavirus pandemic. Company was able to produce significantly larger quantities than before and deliver them according to customer wishes.
• The continuous improvement of production was systematically implemented, and improvements were made in occupational safety, the ingredient and capacity utilisation rates, and in the efficiency of water use.
• Production investments included a new pork packing plant for Chinese exports and a new production line for Murea & Nopea products.
Supply chain efficiency • Atria’s supply chain was able to respond to large fluctuations in demand. The delivery reliability was 99.91 per cent.
Resource optimisation • Atria achieved its key goals for energy and resource efficiency by, for example, reducing its carbon foot-print, improving its water efficiency and reducing waste.
• Efforts were made to optimise production and management systems. The investments improved energy efficiency.
• Use of renewable energy was increased in heat production.• The results are presented in Atria’s corporate responsibility report at www.atria.fi/en/group/corporate-res-
ponsibility/corporate-responsibility-reporting/
Atria Way of Work • The Safely Home from Atria programme produced excellent results: the number of occupational accidents, as well as absences were historically low.
• The management system was renewed to meet the requirements of the coronavirus pandemic. Aim is to protect the personnel from infection and ensure reliable product deliveries.
BUSINESS AREA REVIEWS | ATRIA FINLAND
28
Front page
Atria in brief
Atria’s key indicators
CEO’s review
Strategy 2021–2025
Strategy 2016–2020
Operating environment
Business area reviews
Atria Finland
Atria Sweden
Atria Denmark & Estonia
Atria Russia
Research and Development
Financial Statements and Corporate Governance
Financial Statements and Corporate Governance
Auditor’s report
Corporate Governance Statement
Investor reporting
Contact information
Atria’s Annual Report 2020
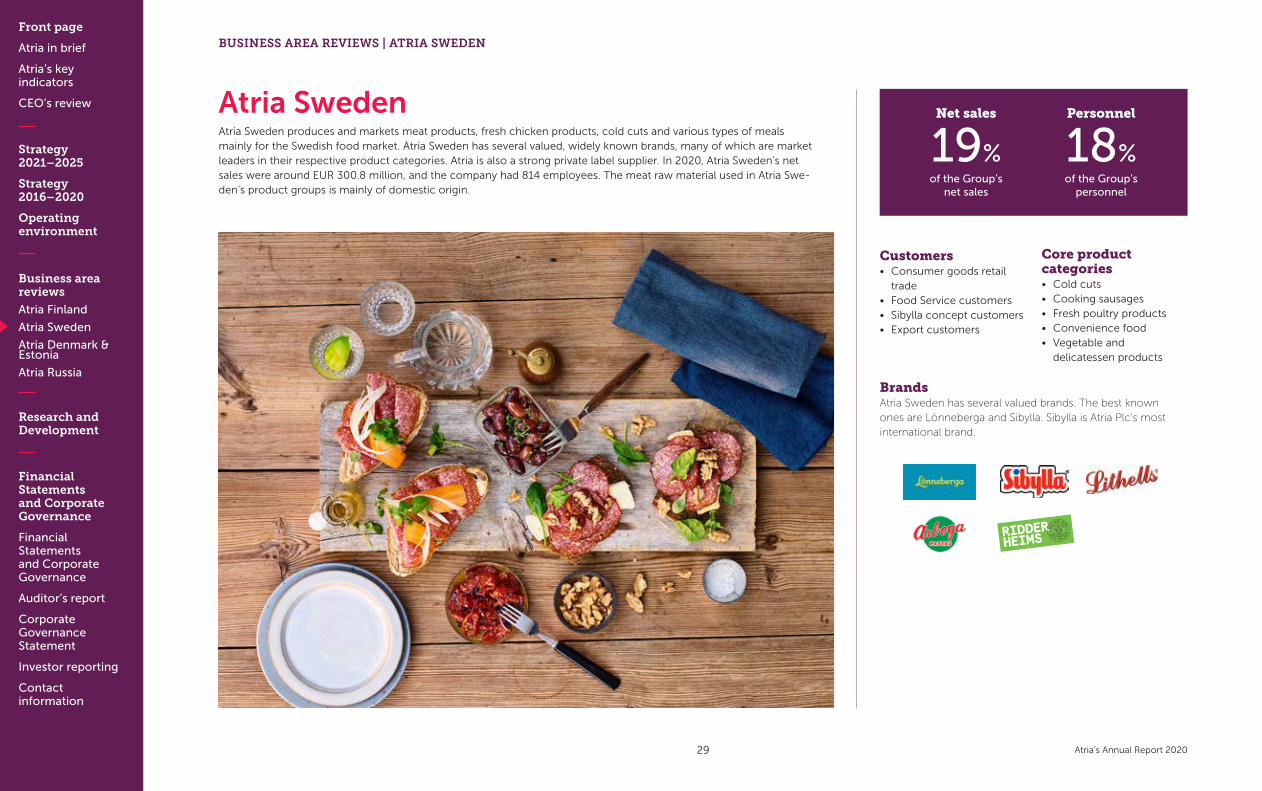
Atria SwedenAtria Sweden produces and markets meat products, fresh chicken products, cold cuts and various types of meals mainly for the Swedish food market. Atria Sweden has several valued, widely known brands, many of which are market leaders in their respective product categories. Atria is also a strong private label supplier. In 2020, Atria Sweden’s net sales were around EUR 300.8 million, and the company had 814 employees. The meat raw material used in Atria Swe-den’s product groups is mainly of domestic origin.
Net sales
19%of the Group’s
net sales
Personnel
18%of the Group’s
personnel
Customers• Consumer goods retail
trade• Food Service customers• Sibylla concept customers• Export customers
Core product categories• Cold cuts• Cooking sausages• Fresh poultry products• Convenience food• Vegetable and
delicatessen products
BrandsAtria Sweden has several valued brands. The best known ones are Lönneberga and Sibylla. Sibylla is Atria Plc’s most international brand.
BUSINESS AREA REVIEWS | ATRIA SWEDEN
29
Front page
Atria in brief
Atria’s key indicators
CEO’s review
Strategy 2021–2025
Strategy 2016–2020
Operating environment
Business area reviews
Atria Finland
Atria Sweden
Atria Denmark & Estonia
Atria Russia
Research and Development
Financial Statements and Corporate Governance
Financial Statements and Corporate Governance
Auditor’s report
Corporate Governance Statement
Investor reporting
Contact information
Atria’s Annual Report 2020
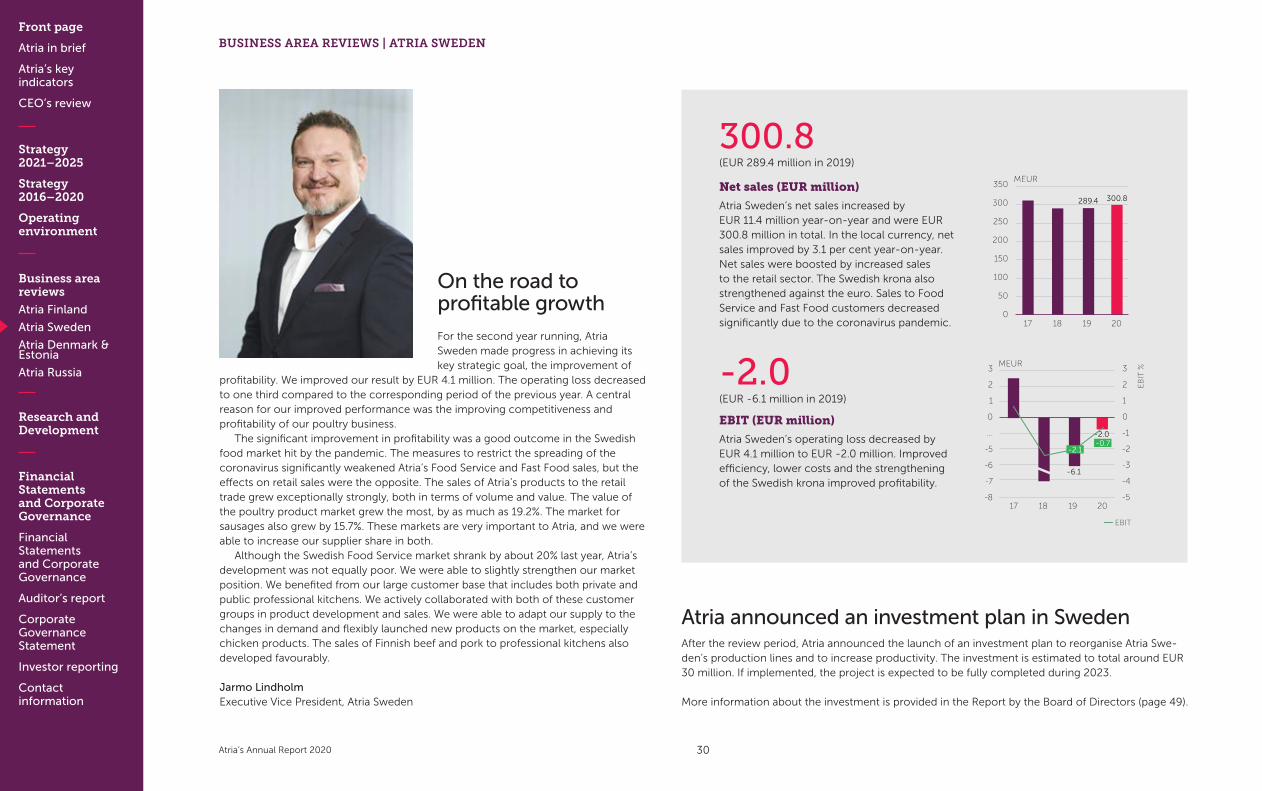
17 18 19 20
Net sales (EUR million)
Atria Sweden’s net sales increased by EUR 11.4 million year-on-year and were EUR 300.8 million in total. In the local currency, net sales improved by 3.1 per cent year-on-year. Net sales were boosted by increased sales to the retail sector. The Swedish krona also strengthened against the euro. Sales to Food Service and Fast Food customers decreased significantly due to the coronavirus pandemic.
EBIT (EUR million)
Atria Sweden’s operating loss decreased by EUR 4.1 million to EUR -2.0 million. Improved efficiency, lower costs and the strengthening of the Swedish krona improved profitability.
3
2
1
0
...
-5
-6
-7
-8
MEUR
X,X
3
2
1
0
-1
-2
-3
-4
-5
EB
IT %
-2.0
-6.1
On the road to profitable growth
For the second year running, Atria Sweden made progress in achieving its key strategic goal, the improvement of
profitability. We improved our result by EUR 4.1 million. The operating loss decreased to one third compared to the corresponding period of the previous year. A central reason for our improved performance was the improving competitiveness and profitability of our poultry business.
The significant improvement in profitability was a good outcome in the Swedish food market hit by the pandemic. The measures to restrict the spreading of the coronavirus significantly weakened Atria’s Food Service and Fast Food sales, but the effects on retail sales were the opposite. The sales of Atria’s products to the retail trade grew exceptionally strongly, both in terms of volume and value. The value of the poultry product market grew the most, by as much as 19.2%. The market for sausages also grew by 15.7%. These markets are very important to Atria, and we were able to increase our supplier share in both.
Although the Swedish Food Service market shrank by about 20% last year, Atria’s development was not equally poor. We were able to slightly strengthen our market position. We benefited from our large customer base that includes both private and public professional kitchens. We actively collaborated with both of these customer groups in product development and sales. We were able to adapt our supply to the changes in demand and flexibly launched new products on the market, especially chicken products. The sales of Finnish beef and pork to professional kitchens also developed favourably.
Jarmo LindholmExecutive Vice President, Atria Sweden
BUSINESS AREA REVIEWS | ATRIA SWEDEN
300.8(EUR 289.4 million in 2019)
17 18 19 20
350
300
250
200
150
100
50
0
MEUR
289.4 300.8
-2.0(EUR -6.1 million in 2019)
EBIT
-2.1-0.7
Atria announced an investment plan in Sweden After the review period, Atria announced the launch of an investment plan to reorganise Atria Swe-den’s production lines and to increase productivity. The investment is estimated to total around EUR 30 million. If implemented, the project is expected to be fully completed during 2023.
More information about the investment is provided in the Report by the Board of Directors (page 49).
30
Front page
Atria in brief
Atria’s key indicators
CEO’s review
Strategy 2021–2025
Strategy 2016–2020
Operating environment
Business area reviews
Atria Finland
Atria Sweden
Atria Denmark & Estonia
Atria Russia
Research and Development
Financial Statements and Corporate Governance
Financial Statements and Corporate Governance
Auditor’s report
Corporate Governance Statement
Investor reporting
Contact information
Atria’s Annual Report 2020
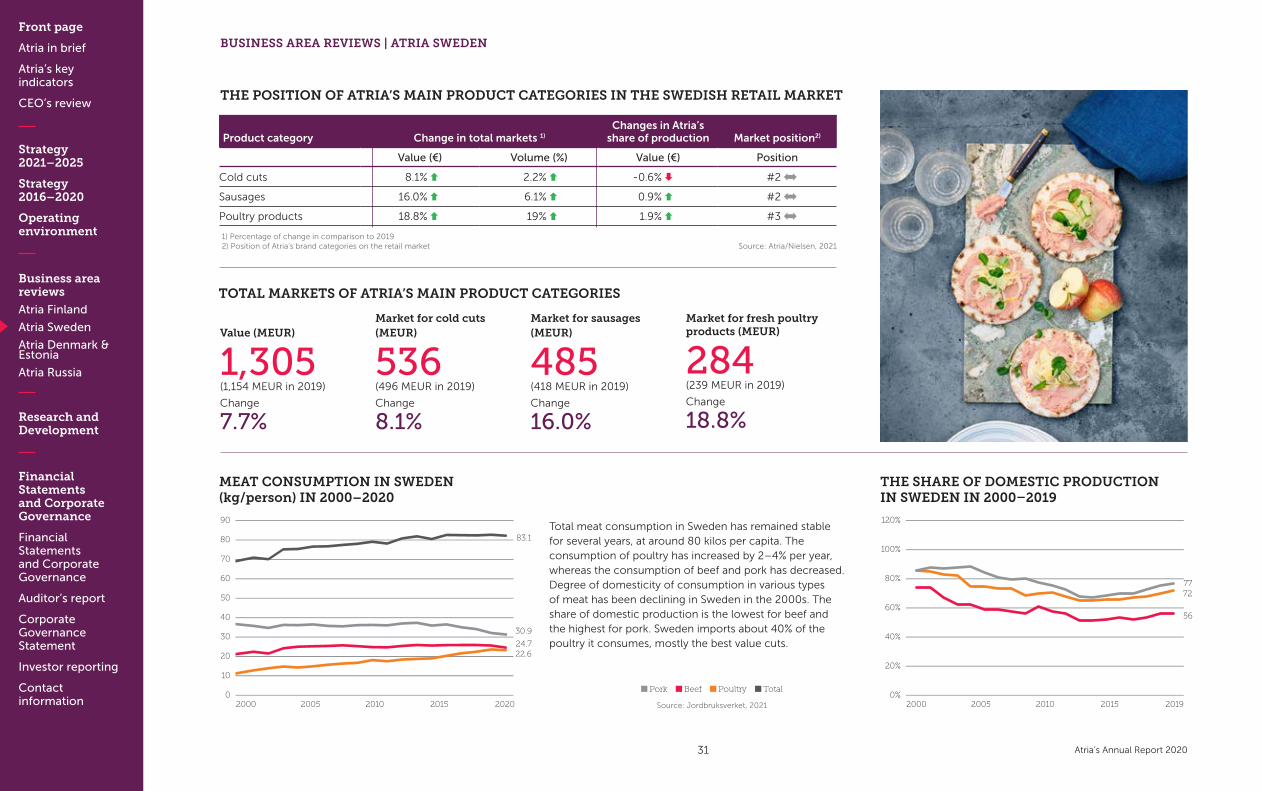
TOTAL MARKETS OF ATRIA’S MAIN PRODUCT CATEGORIES
Value (MEUR)
1,305(1,154 MEUR in 2019)
Change
7.7%
Market for cold cuts (MEUR)
536(496 MEUR in 2019)
Change
8.1%
Market for sausages (MEUR)
485(418 MEUR in 2019)
Change
16.0%
Market for fresh poultry products (MEUR)
284(239 MEUR in 2019)
Change
18.8%
Total meat consumption in Sweden has remained stable for several years, at around 80 kilos per capita. The consumption of poultry has increased by 2–4% per year, whereas the consumption of beef and pork has decreased. Degree of domesticity of consumption in various types of meat has been declining in Sweden in the 2000s. The share of domestic production is the lowest for beef and the highest for pork. Sweden imports about 40% of the poultry it consumes, mostly the best value cuts.
MEAT CONSUMPTION IN SWEDEN (kg/person) IN 2000–2020
THE POSITION OF ATRIA’S MAIN PRODUCT CATEGORIES IN THE SWEDISH RETAIL MARKET
Product category Change in total markets 1)
Changes in Atria’s share of production Market position2)
Value (€) Volume (%) Value (€) Position
Cold cuts 8.1% 2.2% -0.6% #2
Sausages 16.0% 6.1% 0.9% #2
Poultry products 18.8% 19% 1.9% #3
1) Percentage of change in comparison to 20192) Position of Atria’s brand categories on the retail market Source: Atria/Nielsen, 2021
90
80
70
60
50
40
30
20
10
0 Pork Beef Poultry Total
Source: Jordbruksverket, 20212000 2005 2010 2015 2020
THE SHARE OF DOMESTIC PRODUCTION IN SWEDEN IN 2000–2019
83.1
30.9
24.722.6
7772
56
120%
100%
80%
60%
40%
20%
0%2000 2005 2010 2015 2019
BUSINESS AREA REVIEWS | ATRIA SWEDEN
31
Front page
Atria in brief
Atria’s key indicators
CEO’s review
Strategy 2021–2025
Strategy 2016–2020
Operating environment
Business area reviews
Atria Finland
Atria Sweden
Atria Denmark & Estonia
Atria Russia
Research and Development
Financial Statements and Corporate Governance
Financial Statements and Corporate Governance
Auditor’s report
Corporate Governance Statement
Investor reporting
Contact information
Atria’s Annual Report 2020
5 TRENDS
The following consumer trends in the food industry are among those affecting Atria Sweden’s operations and selection.
Responsibility• We promote people’s health and
well-being through a well-balanced selection of good food.
• Ethical operations and partnerships are of key importance in our business operations and partnerships.
• We are a pioneer in animal welfare: all the production animals we use must be healthy and well cared for.
• We reduce environmental and climate impacts across the value chain. We have reduced our carbon footprint by 84% since 2016.
Healthiness• We are making full use of the trend
towards white meat by strengthening our offering of poultry products.
• We focus on a balanced diet and stay out of short-lived fads.
Consumers as influencers• We ensure the best value for money. • We act openly to build trust in our
brands.• We strengthen our diverse presence
online and on social media.
Ease of use• We offer new types of convenience
food solutions for busy lifestyles.• We react to changes in our sales
channels and the resulting changes in customer and consumer require-ments.
• We are developing our Food Service and Concept business operations in response to the growing trend of eating out.
EnjoymentThe coronavirus pandemic has brought joy to cooking and eating well.
BUSINESS AREA REVIEWS | ATRIA SWEDEN
32
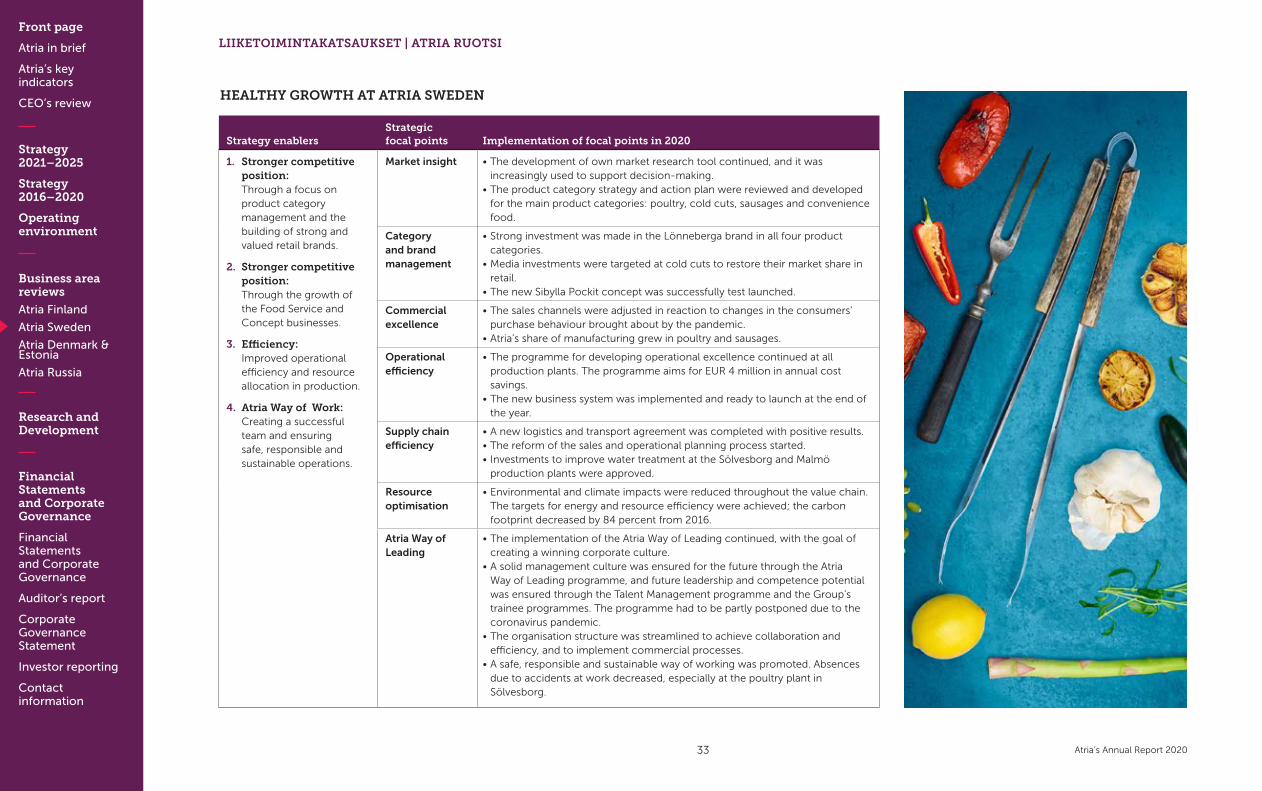
Front page
Atria in brief
Atria’s key indicators
CEO’s review
Strategy 2021–2025
Strategy 2016–2020
Operating environment
Business area reviews
Atria Finland
Atria Sweden
Atria Denmark & Estonia
Atria Russia
Research and Development
Financial Statements and Corporate Governance
Financial Statements and Corporate Governance
Auditor’s report
Corporate Governance Statement
Investor reporting
Contact information
Atria’s Annual Report 2020
HEALTHY GROWTH AT ATRIA SWEDEN
Strategy enablersStrategic focal points Implementation of focal points in 2020
1. Stronger competitive position: Through a focus on product category management and the building of strong and valued retail brands.
2. Stronger competitive position: Through the growth of the Food Service and Concept businesses.
3. Efficiency: Improved operational efficiency and resource allocation in production.
4. Atria Way of Work: Creating a successful team and ensuring safe, responsible and sustainable operations.
Market insight • The development of own market research tool continued, and it was increasingly used to support decision-making.
• The product category strategy and action plan were reviewed and developed for the main product categories: poultry, cold cuts, sausages and convenience food.
Category and brand management
• Strong investment was made in the Lönneberga brand in all four product categories.
• Media investments were targeted at cold cuts to restore their market share in retail.
• The new Sibylla Pockit concept was successfully test launched.
Commercial excellence
• The sales channels were adjusted in reaction to changes in the consumers’ purchase behaviour brought about by the pandemic.
• Atria’s share of manufacturing grew in poultry and sausages.
Operational efficiency
• The programme for developing operational excellence continued at all production plants. The programme aims for EUR 4 million in annual cost savings.
• The new business system was implemented and ready to launch at the end of the year.
Supply chain efficiency
• A new logistics and transport agreement was completed with positive results. • The reform of the sales and operational planning process started.• Investments to improve water treatment at the Sölvesborg and Malmö
production plants were approved.
Resource optimisation
• Environmental and climate impacts were reduced throughout the value chain. The targets for energy and resource efficiency were achieved; the carbon footprint decreased by 84 percent from 2016.
Atria Way of Leading
• The implementation of the Atria Way of Leading continued, with the goal of creating a winning corporate culture.
• A solid management culture was ensured for the future through the Atria Way of Leading programme, and future leadership and competence potential was ensured through the Talent Management programme and the Group’s trainee programmes. The programme had to be partly postponed due to the coronavirus pandemic.
• The organisation structure was streamlined to achieve collaboration and efficiency, and to implement commercial processes.
• A safe, responsible and sustainable way of working was promoted. Absences due to accidents at work decreased, especially at the poultry plant in Sölvesborg.
LIIKETOIMINTAKATSAUKSET | ATRIA RUOTSI
33
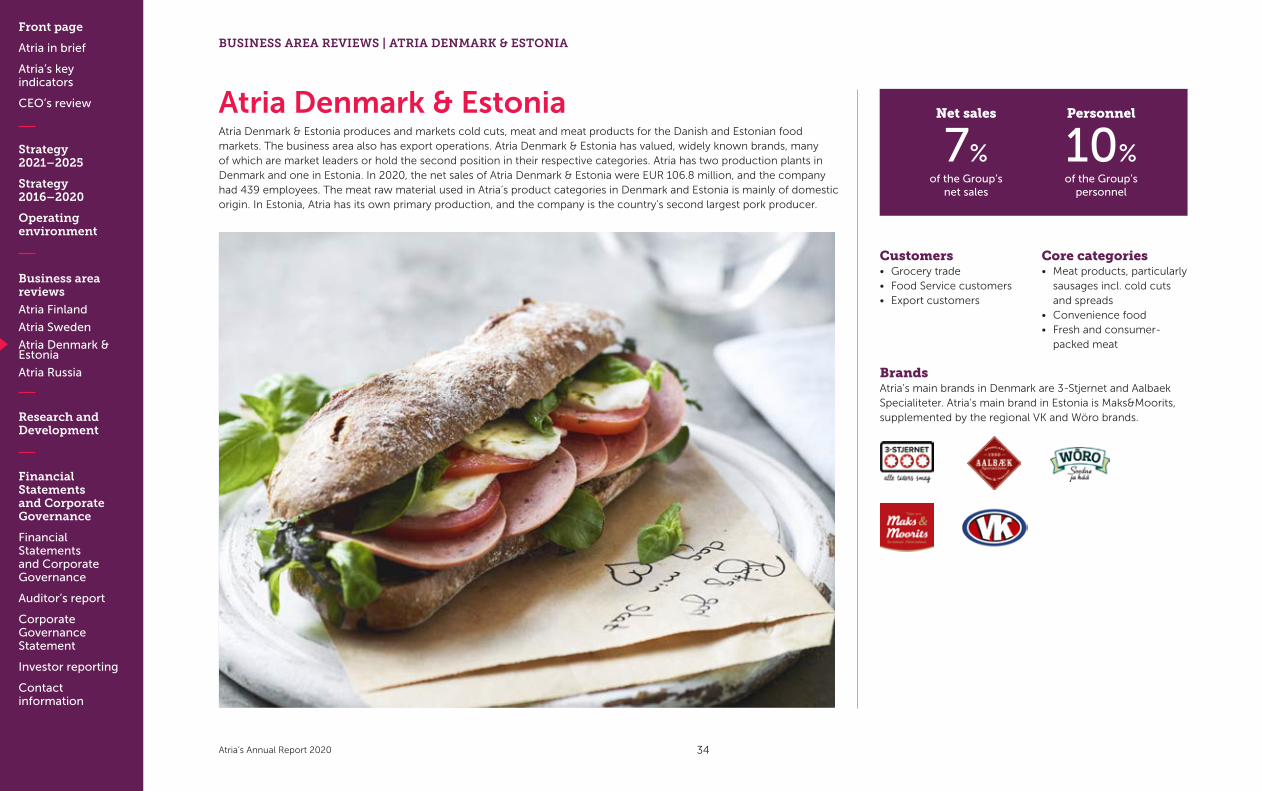
Front page
Atria in brief
Atria’s key indicators
CEO’s review
Strategy 2021–2025
Strategy 2016–2020
Operating environment
Business area reviews
Atria Finland
Atria Sweden
Atria Denmark & Estonia
Atria Russia
Research and Development
Financial Statements and Corporate Governance
Financial Statements and Corporate Governance
Auditor’s report
Corporate Governance Statement
Investor reporting
Contact information
Atria’s Annual Report 2020
Atria Denmark & EstoniaAtria Denmark & Estonia produces and markets cold cuts, meat and meat products for the Danish and Estonian food markets. The business area also has export operations. Atria Denmark & Estonia has valued, widely known brands, many of which are market leaders or hold the second position in their respective categories. Atria has two production plants in Denmark and one in Estonia. In 2020, the net sales of Atria Denmark & Estonia were EUR 106.8 million, and the company had 439 employees. The meat raw material used in Atria’s product categories in Denmark and Estonia is mainly of domestic origin. In Estonia, Atria has its own primary production, and the company is the country’s second largest pork producer.
Customers• Grocery trade• Food Service customers• Export customers
Core categories• Meat products, particularly
sausages incl. cold cuts and spreads
• Convenience food• Fresh and consumer-
packed meat
BrandsAtria’s main brands in Denmark are 3-Stjernet and Aalbaek Specialiteter. Atria’s main brand in Estonia is Maks&Moorits, supplemented by the regional VK and Wöro brands.
Net sales
7%of the Group’s
net sales
Personnel
10%of the Group’s
personnel
BUSINESS AREA REVIEWS | ATRIA DENMARK & ESTONIA
34

Front page
Atria in brief
Atria’s key indicators
CEO’s review
Strategy 2021–2025
Strategy 2016–2020
Operating environment
Business area reviews
Atria Finland
Atria Sweden
Atria Denmark & Estonia
Atria Russia
Research and Development
Financial Statements and Corporate Governance
Financial Statements and Corporate Governance
Auditor’s report
Corporate Governance Statement
Investor reporting
Contact information
Atria’s Annual Report 2020
Net sales (EUR million)
The net sales of Atria Denmark & Estonia increased by EUR 10.2 million in comparison to the corresponding period in the previous year and were EUR 106.8 million in total. Net sales grew as a result of increased sales to both Danish and Estonian retail sectors. Food Service sales account for a small share of Atria Denmark & Estonia’s net sales.
EBIT (EUR million)
The operating profit of Atria Denmark & Estonia increased by EUR 0.9 million to EUR 5.3 million. This was 4.9% of net sales, which is almost in line with the Group’s 5% EBIT margin target. The result was improved mostly by increased sales volumes at strengthened prices.
EB
IT %
106.8(EUR 96.6 million in 2019)
5.3(EUR 4.4 million in 2019)
EBIT
17 18 19 20
100
80
60
40
20
0
EUR million96.6
106.8
EUR million6
5
4
3
2
1
0
6
5
4
3
2
1
0
4.4 5.3
17 18 19 20
The cold cut market is growing well in Denmark A strong upward trend was seen in Atria Denmark’s sales. Atria was able to maintain a strong supplier share of around 17% in the Danish retail cold cut market, which grew both in volume and value. The increase in value was 8.4%. The growth in sales was driven by significant investments in marketing and sales. Atria renewed and diversified the product selections of both its Danish brands, 3-Stjernet and Aalbaeck. The development of Aalbaeck, which focuses on premium organic products, was the most significant: the brand was also able to considerably increase its sales in Danish discount chains.
Atria Denmark’s export operations decreased due to the coronavirus pandemic. The pandemic also limited our cooperation with the Food Service sector, which had a good start in the previous year. The growing use Aalbaeck organic products in professional kitchens was a positive development.
Svend Schou BorchExecutive Vice President, Atria Denmark
Investment in minced meat drove development in Estonia Atria Estonia kept its position well in a market that remained almost at the previous year’s level. The sales volumes of Atria’s product categories in the Estonian retail sector fell slightly from the previous year - by 1%. The reduction was exceptional, albeit understandable, in exceptional circumstances where the consumers’ purchasing power fell. Prices, on the other hand, rose by 4.4%. In this market, Atria’s most successful product category was minced meat. Atria launched a new, more ecological minced meat package in Estonia, which increased the delivery volumes of minced meat to the retail sector by about 40%.
Atria Estonia’s deliveries to professional kitchens decreased, as did exports. However, this did not have a major impact as the retail trade developed so well.
Olle HormExecutive Vice President, Atria Estonia
4.5 4.9
BUSINESS AREA REVIEWS | ATRIA DENMARK & ESTONIA
35

Front page
Atria in brief
Atria’s key indicators
CEO’s review
Strategy 2021–2025
Strategy 2016–2020
Operating environment
Business area reviews
Atria Finland
Atria Sweden
Atria Denmark & Estonia
Atria Russia
Research and Development
Financial Statements and Corporate Governance
Financial Statements and Corporate Governance
Auditor’s report
Corporate Governance Statement
Investor reporting
Contact information
Atria’s Annual Report 2020
The value of the markets for cold cuts in Denmark and the value of the market for meat and meat products in Estonia’s retail sector in total
Value
669EUR million
Change in market volumes on average
Volume
1.0%
Value
6.4%
THE MARKETS FOR ATRIA’S MAIN PRODUCT CATEGORIES IN DENMARK AND ESTONIA
THE POSITION OF ATRIA’S MAIN CATEGORIES ON THE RETAIL MARKETS OF DENMARK AND ESTONIA
Market position
#2Manufacturer
share
16.9%(17.2% in 2019)
Manufacturer share
15.3%(15.7% in 2019)
Market position
#2
Estonia Category:
Meat, meat products and convenience foods
Denmark Category: Cold cuts
Change in the value of Atria’s main product categories in Denmark and Estonia on average
Atria brought high-quality organic products to the Food Service market As part of the business strategy for Denmark, we aim to establish Atria as a new player in the Food Service market. To achieve this goal, Atria launched a selection of high-quality Aalbaek dry organic sausages.
8.4%(2.3 % in 2019)
Change in Denmark
2.9%(-0.7 % in 2019)
Change in Denmark
-1%(12.7 % in 2019)
Change in Estonia
4.4%(11.7 % in 2019)
Change in Estonia
BUSINESS AREA REVIEWS | ATRIA DENMARK & ESTONIA
36
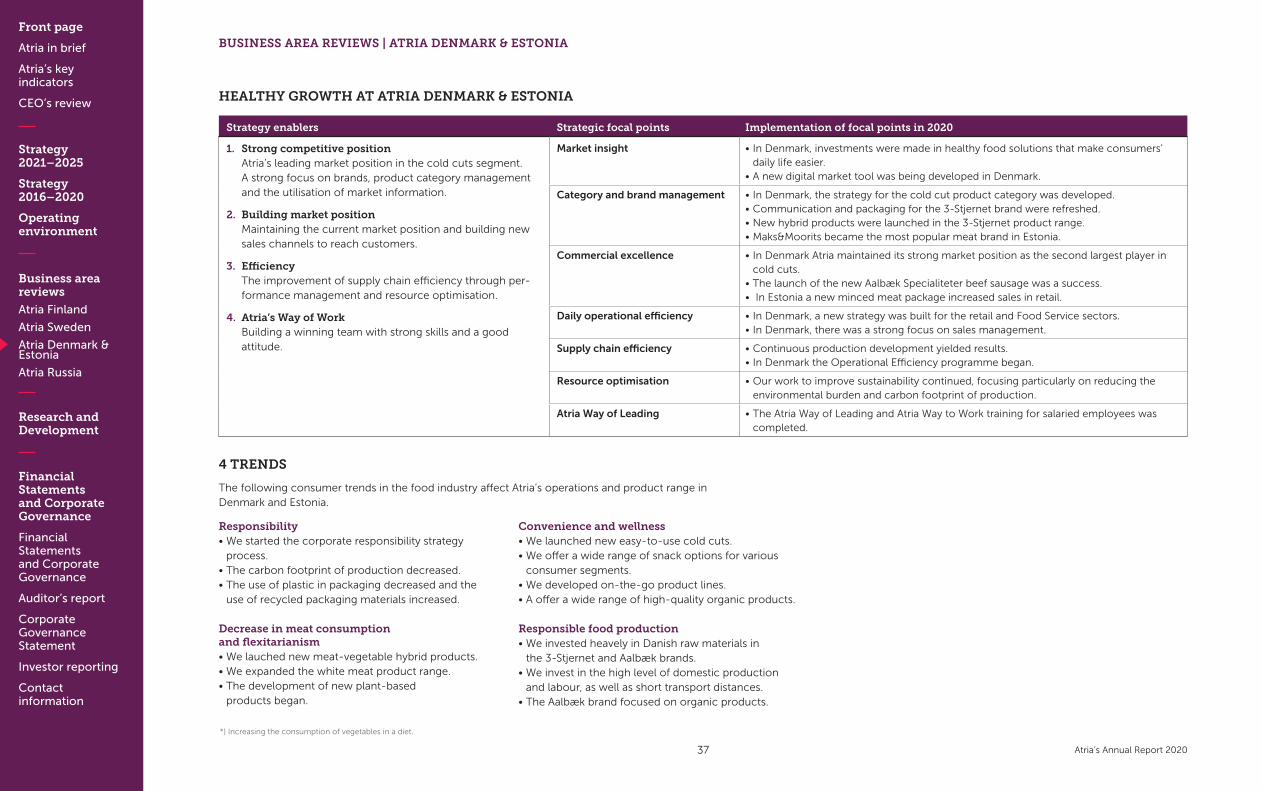
Front page
Atria in brief
Atria’s key indicators
CEO’s review
Strategy 2021–2025
Strategy 2016–2020
Operating environment
Business area reviews
Atria Finland
Atria Sweden
Atria Denmark & Estonia
Atria Russia
Research and Development
Financial Statements and Corporate Governance
Financial Statements and Corporate Governance
Auditor’s report
Corporate Governance Statement
Investor reporting
Contact information
Atria’s Annual Report 2020
*) Increasing the consumption of vegetables in a diet.
4 TRENDS
The following consumer trends in the food industry affect Atria’s operations and product range in Denmark and Estonia.
Responsibility• We started the corporate responsibility strategy
process.• The carbon footprint of production decreased. • The use of plastic in packaging decreased and the
use of recycled packaging materials increased.
Decrease in meat consumption and flexitarianism• We lauched new meat-vegetable hybrid products.• We expanded the white meat product range.• The development of new plant-based
products began.
Convenience and wellness• We launched new easy-to-use cold cuts.• We offer a wide range of snack options for various
consumer segments.• We developed on-the-go product lines.• A offer a wide range of high-quality organic products.
Responsible food production• We invested heavely in Danish raw materials in
the 3-Stjernet and Aalbæk brands.• We invest in the high level of domestic production
and labour, as well as short transport distances.• The Aalbæk brand focused on organic products.
Strategy enablers Strategic focal points Implementation of focal points in 2020
1. Strong competitive position Atria’s leading market position in the cold cuts segment. A strong focus on brands, product category management and the utilisation of market information.
2. Building market position Maintaining the current market position and building new sales channels to reach customers.
3. Efficiency The improvement of supply chain efficiency through per-formance management and resource optimisation.
4. Atria’s Way of Work Building a winning team with strong skills and a good attitude.
Market insight • In Denmark, investments were made in healthy food solutions that make consumers’ daily life easier.
• A new digital market tool was being developed in Denmark.
Category and brand management • In Denmark, the strategy for the cold cut product category was developed.• Communication and packaging for the 3-Stjernet brand were refreshed.• New hybrid products were launched in the 3-Stjernet product range. • Maks&Moorits became the most popular meat brand in Estonia.
Commercial excellence • In Denmark Atria maintained its strong market position as the second largest player in cold cuts.
• The launch of the new Aalbæk Specialiteter beef sausage was a success.• In Estonia a new minced meat package increased sales in retail.
Daily operational efficiency • In Denmark, a new strategy was built for the retail and Food Service sectors. • In Denmark, there was a strong focus on sales management.
Supply chain efficiency • Continuous production development yielded results.• In Denmark the Operational Efficiency programme began.
Resource optimisation • Our work to improve sustainability continued, focusing particularly on reducing the environmental burden and carbon footprint of production.
Atria Way of Leading • The Atria Way of Leading and Atria Way to Work training for salaried employees was completed.
HEALTHY GROWTH AT ATRIA DENMARK & ESTONIA
BUSINESS AREA REVIEWS | ATRIA DENMARK & ESTONIA
37
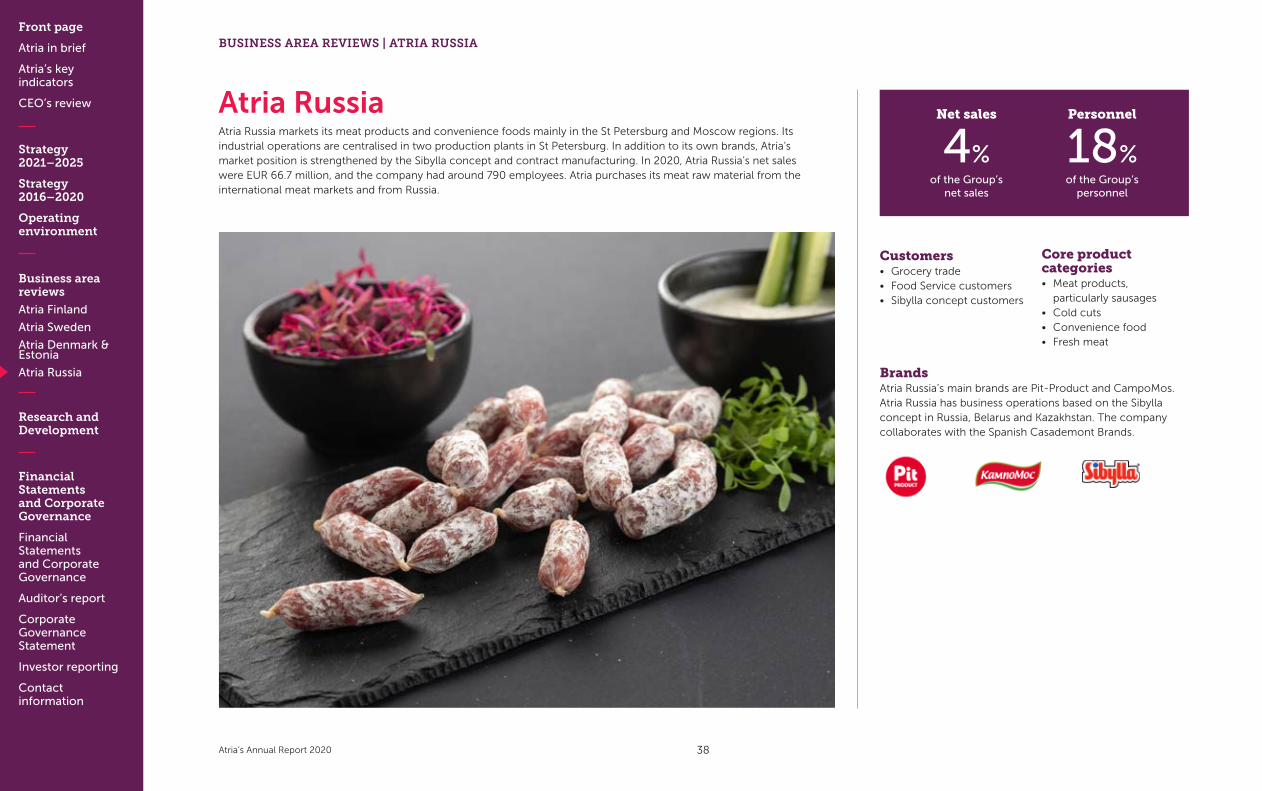
Front page
Atria in brief
Atria’s key indicators
CEO’s review
Strategy 2021–2025
Strategy 2016–2020
Operating environment
Business area reviews
Atria Finland
Atria Sweden
Atria Denmark & Estonia
Atria Russia
Research and Development
Financial Statements and Corporate Governance
Financial Statements and Corporate Governance
Auditor’s report
Corporate Governance Statement
Investor reporting
Contact information
Atria’s Annual Report 2020
Atria RussiaAtria Russia markets its meat products and convenience foods mainly in the St Petersburg and Moscow regions. Its industrial operations are centralised in two production plants in St Petersburg. In addition to its own brands, Atria’s market position is strengthened by the Sibylla concept and contract manufacturing. In 2020, Atria Russia’s net sales were EUR 66.7 million, and the company had around 790 employees. Atria purchases its meat raw material from the international meat markets and from Russia.
Net sales
4%of the Group’s
net sales
Personnel
18%of the Group’s
personnel
BUSINESS AREA REVIEWS | ATRIA RUSSIA
Customers• Grocery trade• Food Service customers • Sibylla concept customers
Core product categories• Meat products,
particularly sausages• Cold cuts• Convenience food• Fresh meat
BrandsAtria Russia’s main brands are Pit-Product and CampoMos. Atria Russia has business operations based on the Sibylla concept in Russia, Belarus and Kazakhstan. The company collaborates with the Spanish Casademont Brands.
38
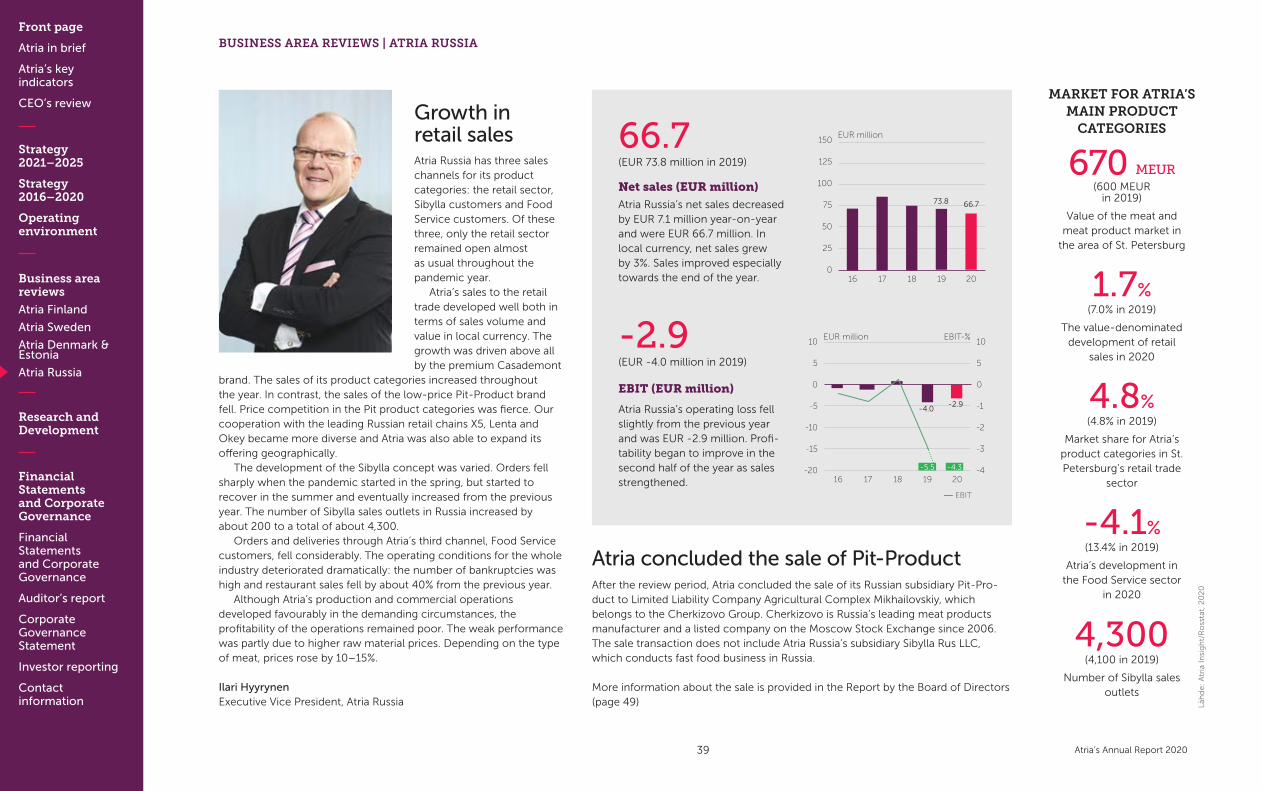
Front page
Atria in brief
Atria’s key indicators
CEO’s review
Strategy 2021–2025
Strategy 2016–2020
Operating environment
Business area reviews
Atria Finland
Atria Sweden
Atria Denmark & Estonia
Atria Russia
Research and Development
Financial Statements and Corporate Governance
Financial Statements and Corporate Governance
Auditor’s report
Corporate Governance Statement
Investor reporting
Contact information
Atria’s Annual Report 2020
Net sales (EUR million)Atria Russia’s net sales decreased by EUR 7.1 million year-on-year and were EUR 66.7 million. In local currency, net sales grew by 3%. Sales improved especially towards the end of the year.
EBIT (EUR million)
Atria Russia’s operating loss fell slightly from the previous year and was EUR -2.9 million. Profi-tability began to improve in the second half of the year as sales strengthened.
Growth in retail salesAtria Russia has three sales channels for its product categories: the retail sector, Sibylla customers and Food Service customers. Of these three, only the retail sector remained open almost as usual throughout the pandemic year.
Atria’s sales to the retail trade developed well both in terms of sales volume and value in local currency. The growth was driven above all by the premium Casademont
brand. The sales of its product categories increased throughout the year. In contrast, the sales of the low-price Pit-Product brand fell. Price competition in the Pit product categories was fierce. Our cooperation with the leading Russian retail chains X5, Lenta and Okey became more diverse and Atria was also able to expand its offering geographically.
The development of the Sibylla concept was varied. Orders fell sharply when the pandemic started in the spring, but started to recover in the summer and eventually increased from the previous year. The number of Sibylla sales outlets in Russia increased by about 200 to a total of about 4,300.
Orders and deliveries through Atria’s third channel, Food Service customers, fell considerably. The operating conditions for the whole industry deteriorated dramatically: the number of bankruptcies was high and restaurant sales fell by about 40% from the previous year.
Although Atria’s production and commercial operations developed favourably in the demanding circumstances, the profitability of the operations remained poor. The weak performance was partly due to higher raw material prices. Depending on the type of meat, prices rose by 10–15%.
Ilari Hyyrynen Executive Vice President, Atria Russia
MARKET FOR ATRIA’S MAIN PRODUCT
CATEGORIES
670 MEUR(600 MEUR
in 2019)
Value of the meat and meat product market in
the area of St. Petersburg
1.7%(7.0% in 2019)
The value-denominated development of retail
sales in 2020
4.8%(4.8% in 2019)
Market share for Atria’s product categories in St. Petersburg’s retail trade
sector
-4.1%(13.4% in 2019)
Atria’s development in the Food Service sector
in 2020
4,300(4,100 in 2019)
Number of Sibylla sales outlets
Läh
de
: A
tria
Insi
gh
t/R
oss
tat,
20
20
66.7(EUR 73.8 million in 2019)
150
125
100
75
50
25
0
EUR million
16 17 18 19 20
73.8 66.7
Atria concluded the sale of Pit-Product After the review period, Atria concluded the sale of its Russian subsidiary Pit-Pro-duct to Limited Liability Company Agricultural Complex Mikhailovskiy, which belongs to the Cherkizovo Group. Cherkizovo is Russia’s leading meat products manufacturer and a listed company on the Moscow Stock Exchange since 2006. The sale transaction does not include Atria Russia’s subsidiary Sibylla Rus LLC, which conducts fast food business in Russia.
More information about the sale is provided in the Report by the Board of Directors (page 49)
-4.3-5.5
-2.9(EUR -4.0 million in 2019)
-4.0-2.9
10
5
0
-1
-2
-3
-4
EBIT
10
5
0
-5
-10
-15
-20
EUR million EBIT-%
16 17 18 19 20
BUSINESS AREA REVIEWS | ATRIA RUSSIA
39
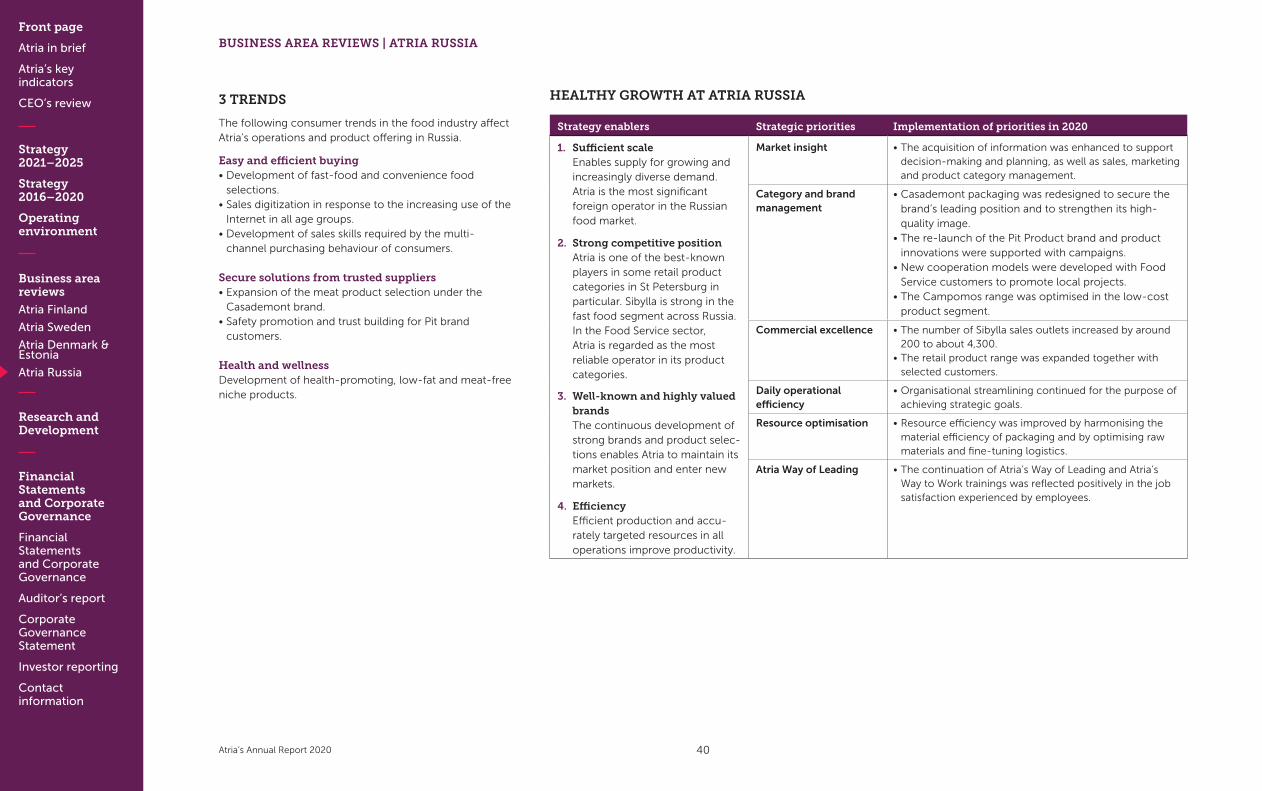
Front page
Atria in brief
Atria’s key indicators
CEO’s review
Strategy 2021–2025
Strategy 2016–2020
Operating environment
Business area reviews
Atria Finland
Atria Sweden
Atria Denmark & Estonia
Atria Russia
Research and Development
Financial Statements and Corporate Governance
Financial Statements and Corporate Governance
Auditor’s report
Corporate Governance Statement
Investor reporting
Contact information
Atria’s Annual Report 2020
HEALTHY GROWTH AT ATRIA RUSSIA
3 TRENDS
The following consumer trends in the food industry affect Atria’s operations and product offering in Russia.
Easy and efficient buying • Development of fast-food and convenience food
selections.• Sales digitization in response to the increasing use of the
Internet in all age groups.• Development of sales skills required by the multi-
channel purchasing behaviour of consumers.
Secure solutions from trusted suppliers• Expansion of the meat product selection under the
Casademont brand.• Safety promotion and trust building for Pit brand
customers.
Health and wellnessDevelopment of health-promoting, low-fat and meat-free niche products.
Strategy enablers Strategic priorities Implementation of priorities in 2020
1. Sufficient scale Enables supply for growing and increasingly diverse demand. Atria is the most significant foreign operator in the Russian food market.
2. Strong competitive position Atria is one of the best-known players in some retail product categories in St Petersburg in particular. Sibylla is strong in the fast food segment across Russia. In the Food Service sector, Atria is regarded as the most reliable operator in its product categories.
3. Well-known and highly valued brands The continuous development of strong brands and product selec-tions enables Atria to maintain its market position and enter new markets.
4. Efficiency Efficient production and accu-rately targeted resources in all operations improve productivity.
Market insight • The acquisition of information was enhanced to support decision-making and planning, as well as sales, marketing and product category management.
Category and brand management
• Casademont packaging was redesigned to secure the brand’s leading position and to strengthen its high-quality image.
• The re-launch of the Pit Product brand and product innovations were supported with campaigns.
• New cooperation models were developed with Food Service customers to promote local projects.
• The Campomos range was optimised in the low-cost product segment.
Commercial excellence • The number of Sibylla sales outlets increased by around 200 to about 4,300.
• The retail product range was expanded together with selected customers.
Daily operational efficiency
• Organisational streamlining continued for the purpose of achieving strategic goals.
Resource optimisation • Resource efficiency was improved by harmonising the material efficiency of packaging and by optimising raw materials and fine-tuning logistics.
Atria Way of Leading • The continuation of Atria’s Way of Leading and Atria’s Way to Work trainings was reflected positively in the job satisfaction experienced by employees.
HEALTHY GROWTH AT ATRIA RUSSIA
BUSINESS AREA REVIEWS | ATRIA RUSSIA
40
Front page
Atria in brief
Atria’s key indicators
CEO’s review
Strategy 2021–2025
Strategy 2016–2020
Operating environment
Business area reviews
Atria Finland
Atria Sweden
Atria Denmark & Estonia
Atria Russia
Research and Development
Financial Statements and Corporate Governance
Financial Statements and Corporate Governance
Auditor’s report
Corporate Governance Statement
Investor reporting
Contact information
Atria’s Annual Report 2020
Comprehensive and proactive market and consumer insight is very important in
Atria’s field of business. Consumers’ food choices are guided by many factors, and
the industry is characterised by fragmented consumer behaviour. Atria’s investments
in research and development totalled around EUR 15.0 million in 2020.
R E S E A R C H & D E V E L O P M E N T
Strategy enablers Strategic priorities Implementation of priorities in 2020
1. Sufficient scale Enables supply for growing and increasingly diverse demand. Atria is the most significant foreign operator in the Russian food market.
2. Strong competitive position Atria is one of the best-known players in some retail product categories in St Petersburg in particular. Sibylla is strong in the fast food segment across Russia. In the Food Service sector, Atria is regarded as the most reliable operator in its product categories.
3. Well-known and highly valued brands The continuous development of strong brands and product selec-tions enables Atria to maintain its market position and enter new markets.
4. Efficiency Efficient production and accu-rately targeted resources in all operations improve productivity.
Market insight • The acquisition of information was enhanced to support decision-making and planning, as well as sales, marketing and product category management.
Category and brand management
• Casademont packaging was redesigned to secure the brand’s leading position and to strengthen its high-quality image.
• The re-launch of the Pit Product brand and product innovations were supported with campaigns.
• New cooperation models were developed with Food Service customers to promote local projects.
• The Campomos range was optimised in the low-cost product segment.
Commercial excellence • The number of Sibylla sales outlets increased by around 200 to about 4,300.
• The retail product range was expanded together with selected customers.
Daily operational efficiency
• Organisational streamlining continued for the purpose of achieving strategic goals.
Resource optimisation • Resource efficiency was improved by harmonising the material efficiency of packaging and by optimising raw materials and fine-tuning logistics.
Atria Way of Leading • The continuation of Atria’s Way of Leading and Atria’s Way to Work trainings was reflected positively in the job satisfaction experienced by employees.
41
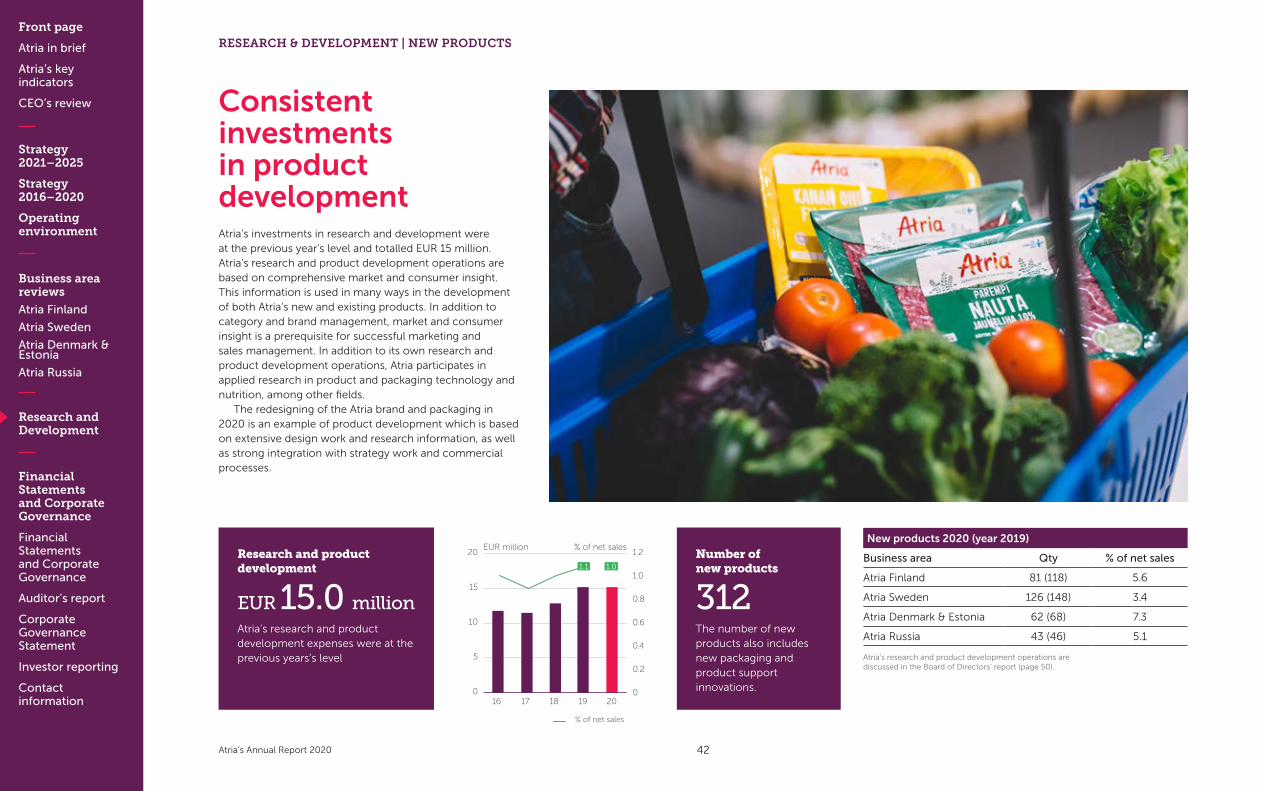
Front page
Atria in brief
Atria’s key indicators
CEO’s review
Strategy 2021–2025
Strategy 2016–2020
Operating environment
Business area reviews
Atria Finland
Atria Sweden
Atria Denmark & Estonia
Atria Russia
Research and Development
Financial Statements and Corporate Governance
Financial Statements and Corporate Governance
Auditor’s report
Corporate Governance Statement
Investor reporting
Contact information
Atria’s Annual Report 2020
Consistent investments in product development Atria’s investments in research and development were at the previous year’s level and totalled EUR 15 million. Atria’s research and product development operations are based on comprehensive market and consumer insight. This information is used in many ways in the development of both Atria’s new and existing products. In addition to category and brand management, market and consumer insight is a prerequisite for successful marketing and sales management. In addition to its own research and product development operations, Atria participates in applied research in product and packaging technology and nutrition, among other fields.
The redesigning of the Atria brand and packaging in 2020 is an example of product development which is based on extensive design work and research information, as well as strong integration with strategy work and commercial processes.
New products 2020 (year 2019)
Business area Qty % of net sales
Atria Finland 81 (118) 5.6
Atria Sweden 126 (148) 3.4
Atria Denmark & Estonia 62 (68) 7.3
Atria Russia 43 (46) 5.1
Atria’s research and product development operations are discussed in the Board of Directors’ report (page 50).
Research and product development
EUR 15.0 millionAtria’s research and product development expenses were at the previous years’s level
Number of new products
312The number of new products also includes new packaging and product support innovations.
RESEARCH & DEVELOPMENT | NEW PRODUCTS
% of net sales
20
15
10
5
0
1.2
1.0
0.8
0.6
0.4
0.2
0
EUR million % of net sales
16 17 18 19 20
1.1 1.0
42
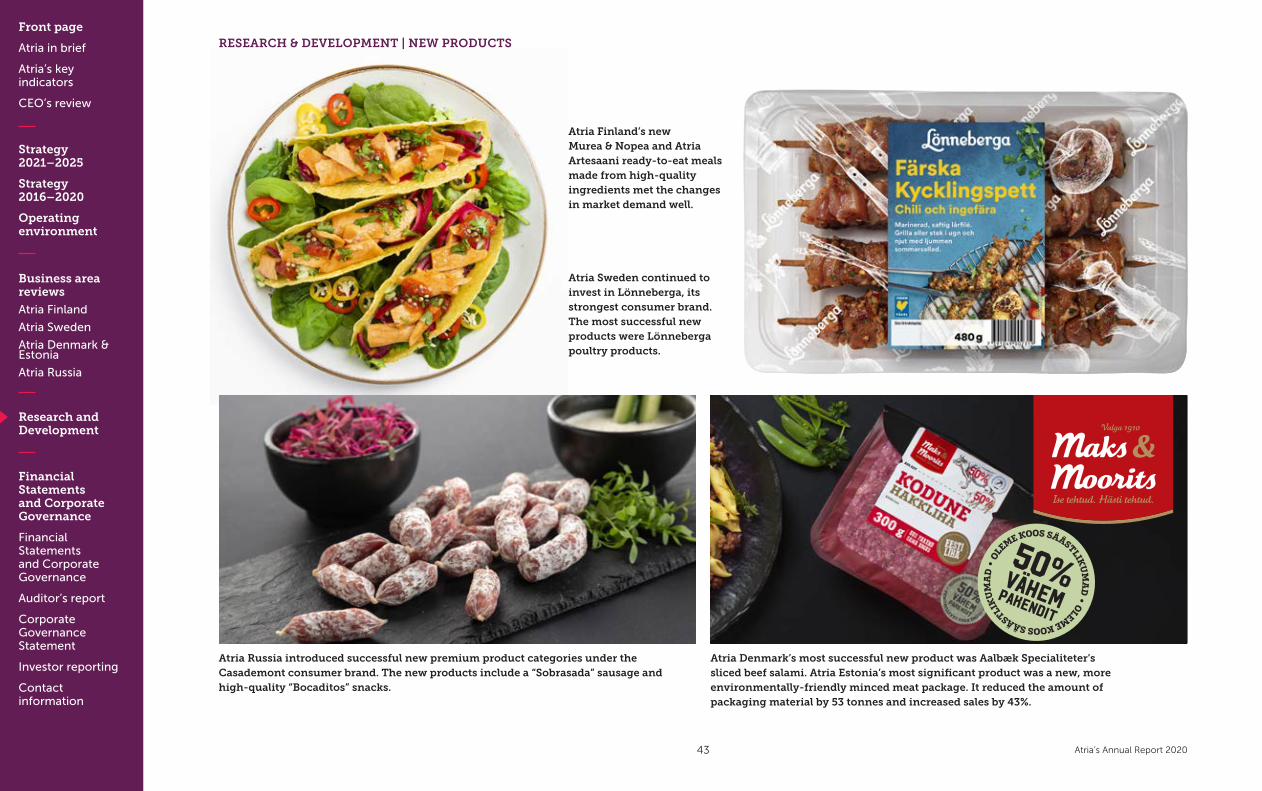
Front page
Atria in brief
Atria’s key indicators
CEO’s review
Strategy 2021–2025
Strategy 2016–2020
Operating environment
Business area reviews
Atria Finland
Atria Sweden
Atria Denmark & Estonia
Atria Russia
Research and Development
Financial Statements and Corporate Governance
Financial Statements and Corporate Governance
Auditor’s report
Corporate Governance Statement
Investor reporting
Contact information
Atria’s Annual Report 2020
Atria Sweden continued to invest in Lönneberga, its strongest consumer brand. The most successful new products were Lönneberga poultry products.
Atria Finland’s new Murea & Nopea and Atria Artesaani ready-to-eat meals made from high-quality ingredients met the changes in market demand well.
Atria Russia introduced successful new premium product categories under the Casademont consumer brand. The new products include a “Sobrasada” sausage and high-quality “Bocaditos” snacks.
Atria Denmark’s most successful new product was Aalbæk Specialiteter’s sliced beef salami. Atria Estonia’s most significant product was a new, more environmentally-friendly minced meat package. It reduced the amount of packaging material by 53 tonnes and increased sales by 43%.
RESEARCH & DEVELOPMENT | NEW PRODUCTS
43
Front page
Atria in brief
Atria’s key indicators
CEO’s review
Strategy 2021–2025
Strategy 2016–2020
Operating environment
Business area reviews
Atria Finland
Atria Sweden
Atria Denmark & Estonia
Atria Russia
Research and Development
Financial Statements and Corporate Governance
Financial Statements and Corporate Governance
Auditor’s report
Corporate Governance Statement
Investor reporting
Contact information
Atria’s Annual Report 2020
FINANCIAL STATEMENTS AND CORPORATE GOVERNANCE
Invitation to the Annual General Meeting .............................................45Report by the Board of Directors............................................................46Shareholders and shares .......................................................................... 60Atria Group key indicators ........................................................................ 61Atria Group financial statements, IFRS ..................................................63Notes to the consolidated financial statements, IFRS ........................69Parent company financial statements, FAS.........................................103Notes to the parent company financial statements, FAS ................105Signatures .................................................................................................. 113Auditor’s report ......................................................................................... 114Corporate Governance Statement ....................................................... 118Remuneration Report ..............................................................................134Investor reporting .....................................................................................139Contact information ................................................................................140
44

Front page
Atria in brief
Atria’s key indicators
CEO’s review
Strategy 2021–2025
Strategy 2016–2020
Operating environment
Business area reviews
Atria Finland
Atria Sweden
Atria Denmark & Estonia
Atria Russia
Research and Development
Financial Statements and Corporate Governance
Financial Statements and Corporate Governance
Auditor’s report
Corporate Governance Statement
Investor reporting
Contact information
Atria’s Annual Report 2020
Annual General Meeting on 29 April 2021
Due to the coronavirus pandemic, the General Meeting will be held without shareholders’ and their proxy representatives’ presence at the venue of the meeting.
Atria Plc invites its shareholders to the Annual General Meeting to be held on Wednesday, 29 April 2021 in the Company’s Helsinki Office at Läkkisepäntie 23. The shareholders and their proxy representatives can only participate in the meeting and exercise the shareholder’s rights by voting in advance as well as by submitting counterproposals and asking questions in advance. See www.atria.com/agm for further information.
The Chairman of the Board of Directors, the members of the Board of Directors, the CEO and other management of the company and the Auditor will not attend the General Meeting. Furthermore, no webcast will be provided.
The agenda includes matters that are to be discussed by the Annual General Meeting in accordance with Article 14 of the Articles of Association.
The AGM documents are available on the company website at www.atria.com/agm.
In 2021, Atria Plc will publish financial results as follows: Financial Statement Release 2020 ............................ 16 February 2021Annual Report 2020 ...................................................... In week 12/2021Interim Report Q1 (3 months) ........................................... 29 April 2021Half Year Financial Report (6 months) .............................. 20 July 2021Interim Report Q3 (9 months).....................................21 October 2021
Atria’s financial information will be published in real time on the company website at www.atria.com.
INVITATION TO THE ANNUAL GENERAL MEETING
45
Front page
Atria in brief
Atria’s key indicators
CEO’s review
Strategy 2021–2025
Strategy 2016–2020
Operating environment
Business area reviews
Atria Finland
Atria Sweden
Atria Denmark & Estonia
Atria Russia
Research and Development
Financial Statements and Corporate Governance
Financial Statements and Corporate Governance
Auditor’s report
Corporate Governance Statement
Investor reporting
Contact information
Atria’s Annual Report 2020
REPORT BY THE BOARD OF DIRECTORS 1 JANUARY–31 DECEMBER 2020
Atria’s management of challenges during exceptional circumstances good – in terms of growth and results, 2020 was a strong year for AtriaThe year 2020 will be marked in Atria’s history as an exceptional one. As of March, the operating environment changed into something entirely different than anticipated due to the COVID-19 pandemic. Atria’s organisation and people demonstrated an excellent ability to adjust to changes and a desire to stick to the set goals and targets. From the very start of the pandemic, Atria set itself two goals: continuing deliveries to customers without disruption and ensuring that its personnel stays healthy. In terms of these goals, 2020 was a successful year.
In terms of growth and the result, Atria’s year was strong. The implementation of the strategy proceeded successfully. Atria Group’s net sales increased by nearly EUR 53 million year-on-year. EBIT improved by around EUR 9 million. One corporate acquisition was carried out in 2020: Atria acquired the entire share capital of Domretor Oy, a contract manufacturer in the food industry. Domretor Oy has been an associated company of Atria since 2013, when Atria acquired a 24.9% of Domretor’s shares.
Atria’s balance sheet and financial position were good during the review period. Free cash flow was EUR 59.0 million (EUR 51.0 million).
THE HEALTHY GROWTH STRATEGY PERIOD 2016–2020Atria’s Healthy Growth strategy period concluded at the end of 2020. Its key objectives were to improve profitability, accelerate growth and increase shareholder value systematically over the long term. Atria’s goal was to grow mainly organically, by developing and expanding its existing business operations. The company sought to drive growth by developing new product segments and expanding into new market areas.
Alongside organic growth, Atria actively identified opportunities for acquisitions and other arrangements generating healthy growth.
The Healthy Growth strategy was led through three main themes:1. Commercial excellence2. Efficiency3. Atria’s Way of Work
The most important successes by theme during the 2016–2020 strategy period were as follows:1. Commercial excellence
• Product and packaging innovations, including entirely new type of packaging for minced meat.
• The first pork exports to China and the increase of exporting.
2. Efficiency • The commissioning of the new pig-cutting plant representing world-class technology
in 2017. The new investment has improved the pig-cutting plant’s productivity and the entire pork production chain’s competitiveness.
• Significant investments in the development of Atria Sweden’s poultry business. • Investments in the development of the company’s own feed production.• Initiation of the planning and implementation of Atria Finland’s new poultry plant
investment.
3. Atria’s Way of Work• Placing responsibility at the core of the business strategy and initiating the Responsible
Atria programme with the aim of achieving a carbon-neutral food chain by 2035.• Building Finland’s biggest solar power park next to Atria’s Nurmo plant.• The launch of the Safely Home from Atria occupational safety and health programme
and a significant reduction in the number of occupational accidents.
4. Conclusion of corporate acquisitions• The acquisition of Lagerberg i Norjeby AB, Well-Beef Ltd. and Domretor Oy.
The strategy revision project was launched in late 2019, and the new strategy was published in the autumn of 2020.
46
Front page
Atria in brief
Atria’s key indicators
CEO’s review
Strategy 2021–2025
Strategy 2016–2020
Operating environment
Business area reviews
Atria Finland
Atria Sweden
Atria Denmark & Estonia
Atria Russia
Research and Development
Financial Statements and Corporate Governance
Financial Statements and Corporate Governance
Auditor’s report
Corporate Governance Statement
Investor reporting
Contact information
Atria’s Annual Report 2020
New strategy: The Winning Northern European Food CompanyThe new strategy was completed in the autumn of 2020 and its communication was launched in October 2020.
The principal objective of the revised strategy is for Atria to be the winning food company in northern Europe with: • strong financial performance;• the most desired brands;• preferred partner for the customers;• committed people;• leader in sustainability; and• best partner for owner-producers.
The most important changes in the operating environment which influenced the new strategy related to consumers’ purchasing behaviour. Awareness of sustainable food choices and increased demand for convenience foods, especially poultry, are accentuated in purchasing decisions. The popularity of the food service channel and private labels is also increasing. The uncertainty in the markets over the past year has had an impact of the food industry’s outlook.
REPORT BY THE BOARD OF DIRECTORS 1 JANUARY–31 DECEMBER 2020
47

Front page
Atria in brief
Atria’s key indicators
CEO’s review
Strategy 2021–2025
Strategy 2016–2020
Operating environment
Business area reviews
Atria Finland
Atria Sweden
Atria Denmark & Estonia
Atria Russia
Research and Development
Financial Statements and Corporate Governance
Financial Statements and Corporate Governance
Auditor’s report
Corporate Governance Statement
Investor reporting
Contact information
Atria’s Annual Report 2020
REPORT BY THE BOARD OF DIRECTORS 1 JANUARY–31 DECEMBER 2020
It is essential for the achievement of the objectives to continue investments aiming to improve commercial excellence, efficiency and Atria’s Way of Work. In addition, it is particularly important for us to be successful in the six focal points most important in terms of our strategy’s performance. These focal points are:• win pig in poultry• expand in convenience foods• strengthen in Food Service, including fast food• grow profitably in Sweden• optimize red meat• drive next level in supply chain efficiency.
Atria’s financial targets in 2021–2025 are as follows:• EBIT .............................................................5%• Equity ratio: ............................................. 40%• Return on equity: ....................................10%• Capital distribution: ................................50% of the profit for the period• Growth above market
Financial review 2020Atria Group’s full-year net sales amounted to EUR 1504.0 million (EUR 1451.3 million). EBIT was EUR 40.5 million (EUR 31.1 million). Atria Group’s net sales increased due to good retail sector sales and exports. Sales to Food Service customers declined by roughly 20%
compared to the previous year. The Group’s EBIT improved as a result of the growth in net sales, the good development of exports and lower costs..
The exceptional circumstances brought about by the coronavirus pandemic impacted Atria’s operating environment as of the end of the first quarter. The national restrictions and recommendations related to restaurant activities and public food services had an impact on Atria’s business. The opening hours and customer numbers of restaurants have been restricted, and the reduced travel and mobility of people has also decreased food sales in fast food restaurants and service stations.
The popularity of everyday meals sold to retail stores grew suddenly as people began preparing for the exceptional situation in late March. Sales volumes to fast food and Food Service customers declined considerably in April–May. Food Service sales began to increase alongside the gradual easing of the coronavirus restrictions and the market began to recover towards the end of the second quarter. Even so, it did not rebound to the level preceding the pandemic by the end of September. During the last quarter of the year, the restrictions were again tightened, which reduced sales to Food Service customers. Sales to the retail sector have been significantly higher than in the year before.
The shift to exceptional circumstances in Atria’s operations was carried out rapidly so that the company was able to remain operational. The uninterrupted continuance of operations and ensuring the delivery reliability of products were Atria’s primary tasks, in addition to ensuring the personnel’s health and working capacity. The production plants adopted new practices aiming to prevent the spread of a possible viral infection. The special arrangements are still in use and have incurred extra costs. On the other hand, the shift to remote working and the end of business travel have accumulated savings. Atria has been successful in its objective of ensuring the personnel’s health and working capacity and maintaining the delivery reliability of products. Atria Finland’s full-year net sales were EUR 1,066.3 million (EUR 1,033.8 million). The increase in net sales was attributable to increased sales to the retail sector and export customers. The sales of Food Service products declined by 20% compared to the year before due to coronavirus restrictions. The company’s EBIT increased to EUR 43.1 million (EUR 40.0 million). The increase in EBIT was attributable to increased net sales, the good development of exports and improved productivity. The coronavirus pandemic has resulted in extra costs, but their negative impact on the result was mitigated by a reduction in the statutory pension insurance contribution. In October, Atria confirmed the decision to build a new poultry plant in Nurmo. The investment is the largest in Atria’s history and extremely important to the company. The value of the investment is approximately EUR 155 million, and it will increase Atria Finland’s poultry production capacity by approximately 40%.
48

Front page
Atria in brief
Atria’s key indicators
CEO’s review
Strategy 2021–2025
Strategy 2016–2020
Operating environment
Business area reviews
Atria Finland
Atria Sweden
Atria Denmark & Estonia
Atria Russia
Research and Development
Financial Statements and Corporate Governance
Financial Statements and Corporate Governance
Auditor’s report
Corporate Governance Statement
Investor reporting
Contact information
Atria’s Annual Report 2020
Atria Sweden’s net sales were EUR 300.8 million (EUR 289.4 million). Net sales grew by 3.1% in local currency compared to the corresponding period the year before. The coronavirus restrictions had a negative impact on the Food Service and fast food business. On the other hand, sales to the retail sector grew considerably. This had a positive effect on the full-year net sales. The good sales of poultry products strengthened net sales. EBIT was EUR -2.0 million (EUR -6.1 million). EBIT was burdened by decreased sales to fast food and Food Service customers. In addition, the coronavirus pandemic resulted in extra costs. Their impact on the result was mitigated by the compensation for sick leaves paid by the state. Improved efficiency, lower costs and the strengthening of the Swedish krona improved profitability. EBIT for the comparative period includes EUR 1.4 million of costs related to personnel arrangements.
Atria Denmark & Estonia’s full-year net sales were EUR 106.8 million (EUR 96.6 million). EBIT was EUR 5.3 million (EUR 4.4 million). The growth in net sales was attributable to a strong increase in sales to the retail sector in both Estonia and Denmark. The price increases implemented during the first half of the year improved net sales.
Atria Russia’s net sales were EUR 66.7 million (EUR 73.8 million). Net sales grew by 3.0% in local currency. EBIT was EUR -2.9 million (EUR -4.0 million). Sales to the retail sector were significantly higher than in the year before. Sales of the Casademont products grew strongly throughout the review period. Sales of Food Service products declined due to the coronavirus restrictions, but recovered during the fourth quarter. The growth in EBIT was the result of increased net sales and a better sales structure.
Events after the period under review After the review period, Atria concluded the sale of its Russian subsidiary Pit-Product to Limited Liability Company Agricultural Complex Mikhailovskiy, which belongs to the Cherkizovo Group. Cherkizovo is Russia’s leading meat products manufacturer and a listed company on the Moscow Stock Exchange since 2006. OOO Pit-Product is a wholly owned subsidiary. Atria has owned the company since 2005. At the end of 2020, the company had approximately 700 employees. The company produces food products for the retail and Food Service channels and owns the Gorelovo and Sinyavino plants. The sale transaction does not include Atria Russia’s subsidiary Sibylla Rus LLC, which conducts fast food business in Russia. The transaction is expected to close during the first half of 2021. The transaction is subject to the approval of the Russian Competition Authority. The impact of the divested business on Atria Group’s net sales is approximately EUR 35 million. The business has been loss-making.
The amount of accumulated translation differences related to Pit-Product on December 31, 2020 was EUR -45 million. The translation difference has arisen from exchange rate changes during Pit-Product’s ownership. Atria acquired Pit-Product in 2005. At that time, the exchange rate of the Ruble against the euro was about 34 and at the end of 2020 about 92. Upon divestment of a foreign subsidiary, the accumulated translation differences
related to that subsidiary, presented already earlier in equity, are recognized in profit or loss. As the accumulated translation differences already reduce the Group’s equity, this entry will not have an effect on the Group’s equity nor cash flow. Translation differences are not recognized until the final completion of the transaction. The final purchase price will be determined at the closing of the transaction and the divestment is not expected to have any other significant effect on the consolidated result.
After the review period, Atria announced the launch of an investment plan to reorganise Atria Sweden’s production lines and to increase productivity. The investment is estimated to total around EUR 30 million. The investment plan will thoroughly investigate the reorganisation of production lines, potential transfers and investment needs related to the construction of new production lines. The project will involve assessing the option of moving production from the Malmö plant to the Sköllersta plant. After the planning phase, the implementation of the investment will be decided on. If implemented, the project is expected to be fully completed during 2023.
Key performance indicatorsEUR million 2020 2019 2018
Net sales 1,504.0 1,451.3 1,438.5
EBIT 40.5 31.1 28.2
EBIT, % 2.7 2.1 2.0
Earnings per share, EUR 0.81 0.54 0.58
Dividend/share, EUR 0.50 0.42 0.40
Dividend/profit, % 61.4 78.4 68.8
Return on equity, % 5.7 3.9 4.1
Equity ratio, % 46.8 46.9 47.7
Net gearing, % 43.6 51.6 52.1
Financing and liquidityInterest rates for the euro and the Swedish krona – Atria’s key currencies – remained on a low level throughout 2020. Euro-denominated short-term Euribors and 1–7-year long-term interest rates were negative throughout the review period. Sweden’s short-term Stibor rates fluctuated on both sides of zero over the year, but the longer-term SEK rates fluctuated between 0–1%. The coronavirus pandemic resulted in significant changes in the financial markets. Liquidity in short-term commercial paper markets declined significantly and the availability of financing became more uncertain as many companies wanted to increase their cash funds at the same time as investors became more cautious and some investors pulled out of the market altogether for a certain period of time. Atria nevertheless managed to refinance its maturing commercial papers with new ones. The pandemic also had an
REPORT BY THE BOARD OF DIRECTORS 1 JANUARY–31 DECEMBER 2020
49
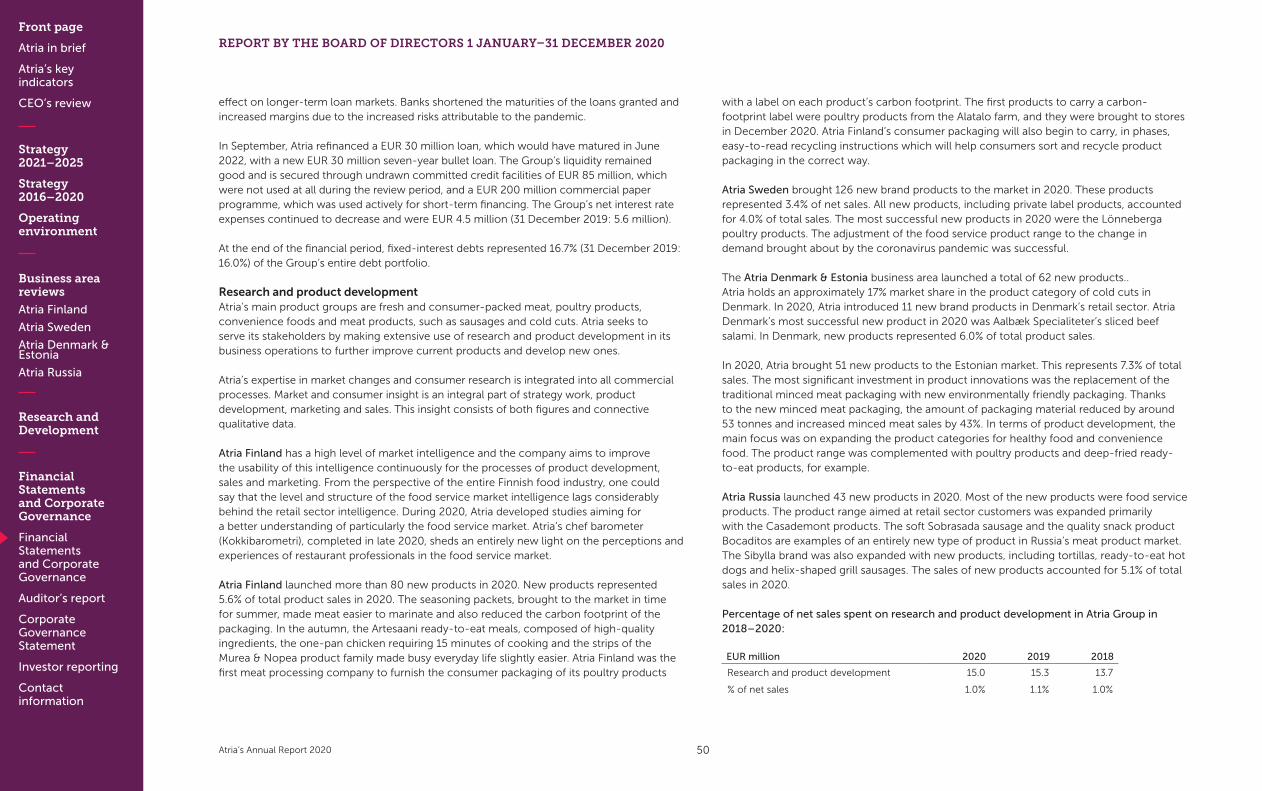
Front page
Atria in brief
Atria’s key indicators
CEO’s review
Strategy 2021–2025
Strategy 2016–2020
Operating environment
Business area reviews
Atria Finland
Atria Sweden
Atria Denmark & Estonia
Atria Russia
Research and Development
Financial Statements and Corporate Governance
Financial Statements and Corporate Governance
Auditor’s report
Corporate Governance Statement
Investor reporting
Contact information
Atria’s Annual Report 2020
REPORT BY THE BOARD OF DIRECTORS 1 JANUARY–31 DECEMBER 2020
effect on longer-term loan markets. Banks shortened the maturities of the loans granted and increased margins due to the increased risks attributable to the pandemic.
In September, Atria refinanced a EUR 30 million loan, which would have matured in June 2022, with a new EUR 30 million seven-year bullet loan. The Group’s liquidity remained good and is secured through undrawn committed credit facilities of EUR 85 million, which were not used at all during the review period, and a EUR 200 million commercial paper programme, which was used actively for short-term financing. The Group’s net interest rate expenses continued to decrease and were EUR 4.5 million (31 December 2019: 5.6 million).
At the end of the financial period, fixed-interest debts represented 16.7% (31 December 2019: 16.0%) of the Group’s entire debt portfolio.
Research and product developmentAtria’s main product groups are fresh and consumer-packed meat, poultry products, convenience foods and meat products, such as sausages and cold cuts. Atria seeks to serve its stakeholders by making extensive use of research and product development in its business operations to further improve current products and develop new ones.
Atria’s expertise in market changes and consumer research is integrated into all commercial processes. Market and consumer insight is an integral part of strategy work, product development, marketing and sales. This insight consists of both figures and connective qualitative data.
Atria Finland has a high level of market intelligence and the company aims to improve the usability of this intelligence continuously for the processes of product development, sales and marketing. From the perspective of the entire Finnish food industry, one could say that the level and structure of the food service market intelligence lags considerably behind the retail sector intelligence. During 2020, Atria developed studies aiming for a better understanding of particularly the food service market. Atria’s chef barometer (Kokkibarometri), completed in late 2020, sheds an entirely new light on the perceptions and experiences of restaurant professionals in the food service market.
Atria Finland launched more than 80 new products in 2020. New products represented 5.6% of total product sales in 2020. The seasoning packets, brought to the market in time for summer, made meat easier to marinate and also reduced the carbon footprint of the packaging. In the autumn, the Artesaani ready-to-eat meals, composed of high-quality ingredients, the one-pan chicken requiring 15 minutes of cooking and the strips of the Murea & Nopea product family made busy everyday life slightly easier. Atria Finland was the first meat processing company to furnish the consumer packaging of its poultry products
with a label on each product’s carbon footprint. The first products to carry a carbon-footprint label were poultry products from the Alatalo farm, and they were brought to stores in December 2020. Atria Finland’s consumer packaging will also begin to carry, in phases, easy-to-read recycling instructions which will help consumers sort and recycle product packaging in the correct way.
Atria Sweden brought 126 new brand products to the market in 2020. These products represented 3.4% of net sales. All new products, including private label products, accounted for 4.0% of total sales. The most successful new products in 2020 were the Lönneberga poultry products. The adjustment of the food service product range to the change in demand brought about by the coronavirus pandemic was successful.
The Atria Denmark & Estonia business area launched a total of 62 new products..Atria holds an approximately 17% market share in the product category of cold cuts in Denmark. In 2020, Atria introduced 11 new brand products in Denmark’s retail sector. Atria Denmark’s most successful new product in 2020 was Aalbæk Specialiteter’s sliced beef salami. In Denmark, new products represented 6.0% of total product sales.
In 2020, Atria brought 51 new products to the Estonian market. This represents 7.3% of total sales. The most significant investment in product innovations was the replacement of the traditional minced meat packaging with new environmentally friendly packaging. Thanks to the new minced meat packaging, the amount of packaging material reduced by around 53 tonnes and increased minced meat sales by 43%. In terms of product development, the main focus was on expanding the product categories for healthy food and convenience food. The product range was complemented with poultry products and deep-fried ready-to-eat products, for example.
Atria Russia launched 43 new products in 2020. Most of the new products were food service products. The product range aimed at retail sector customers was expanded primarily with the Casademont products. The soft Sobrasada sausage and the quality snack product Bocaditos are examples of an entirely new type of product in Russia’s meat product market. The Sibylla brand was also expanded with new products, including tortillas, ready-to-eat hot dogs and helix-shaped grill sausages. The sales of new products accounted for 5.1% of total sales in 2020.
Percentage of net sales spent on research and product development in Atria Group in 2018–2020:
EUR million 2020 2019 2018
Research and product development 15.0 15.3 13.7
% of net sales 1.0% 1.1% 1.0%
50

Front page
Atria in brief
Atria’s key indicators
CEO’s review
Strategy 2021–2025
Strategy 2016–2020
Operating environment
Business area reviews
Atria Finland
Atria Sweden
Atria Denmark & Estonia
Atria Russia
Research and Development
Financial Statements and Corporate Governance
Financial Statements and Corporate Governance
Auditor’s report
Corporate Governance Statement
Investor reporting
Contact information
Atria’s Annual Report 2020
Business risks during the review period and short-term risksThe coronavirus (COVID-19) pandemic was Atria’s most significant risk in 2020. The social, market economy and public health impact of the pandemic has been visible in Atria’s operations since March 2020. The risk’s significance has varied both in terms of business areas and seasons. The news concerning the vaccines received during the fourth quarter did not yet have the chance to reduce the risk. Instead, the virus’s capacity for mutation resulted in increased coronavirus restrictions and protective measures in some countries.
Throughout the pandemic, Atria has invested in ensuring its employees’ health and working capacity as well as in maintaining production reliability. Atria’s different units have adjusted their operations according to the changed circumstances and product demand.
Although Atria has incurred some extra costs due to hygiene requirements and the adjustment of operations, the impact on the result and cash flow has been moderate. The company’s financial position has also remained good.
Governments have stimulated the economy with support measures and stimulus packages during the pandemic. In Finland, Atria’s operations were supported by a 2.6% reduction in the employer’s pension insurance contributions during the period between 1 May – 31 December 2020. In Sweden, the state compensated companies for sick leaves. The vaccination programmes in different countries got underway in early 2021. The duration of these programmes, the efficacy of various vaccines and the virus’s capacity for rapid mutation nevertheless mean that forecasting the pandemic’s effects on Atria’s 2021 result, balance sheet and cash flow is still difficult.
Atria’s normal food production risks pertain to the quality, availability, safety and price of its raw materials and products. The African swine fever occurring in a number of European countries as well as in China and Russia has had an impact on the price as well as the demand and supply of pork around the world. Given that there is a risk of the African swine fever spreading to Finland, Atria has implemented measures aiming to prevent its spread in its own production plants and contract production farms. The cases of avian influenza found in Europe in late 2020, on the other hand, resulted in uncertainty in poultry markets.
Information security issues became the subject of increasing public debate during the second half of 2020. Atria’s operations could also become the target of spoofing, hacking or data leakages. The company aims to prevent and protect itself against these risks by systematic monitoring and measures aiming to improve information security.
Atria’s personnel is a vitally important resource for the company. Personnel risks are managed with the help of training and preventive measures investing in the safety of work and the personnel’s healthcare. These measures aim to ensure the personnel’s well-being and competence as well as the implementation of Atria’s strategy and the achievement of its goals.
Risks and risk managementThe implementation of Atria’s strategy, the achievement of its goals and responsible operations call for the identification and management of favourable and unfavourable events that affect operations. Favourable events improve Atria’s result and financial position, while unfavourable events increase costs and hinder operations.
Atria seeks to prevent unfavourable events and their impact on business operations through risk management as part of its day-to-day operations. Atria’s risk management policy and process guidelines determine goals, principles, responsibilities and authorisations for risk management, as well as operating methods for risk assessment and reporting. More information about Atria’s framework for risk management is available in the Corporate Governance Statement section of the Annual Report.
For the purposes of reporting, Atria divides the risks affecting its operations into four categories: strategic, operational, liability and financial risks.
Strategic risks relate to operational development and the planning and implementation of long-term business decisions as well as to brands, management systems, the allocation of resources and the ability to respond to changes in the operating environment. Atria’s Board of Directors participates in the identification and management of strategic risks.
Operational risks are related to day-to-day business operations in processes, systems and people’s activities, for example. Everyone at Atria participates in the identification and management of these risks.
Liability risks are errors, malfunctions and accidents that occur within Atria or in the business environment and that cause damage or loss. Liability risks are managed through continuity plans, and Atria seeks to transfer them to insurance companies.
Financial risks have to do with changes in market prices and the sufficiency of financial assets in the short and medium terms as well as to counterparties’ ability to meet their financial obligations. Financial risks are managed in cooperation with financial institutions and by making use of various financial instruments in minimising risks.
REPORT BY THE BOARD OF DIRECTORS 1 JANUARY–31 DECEMBER 2020
51
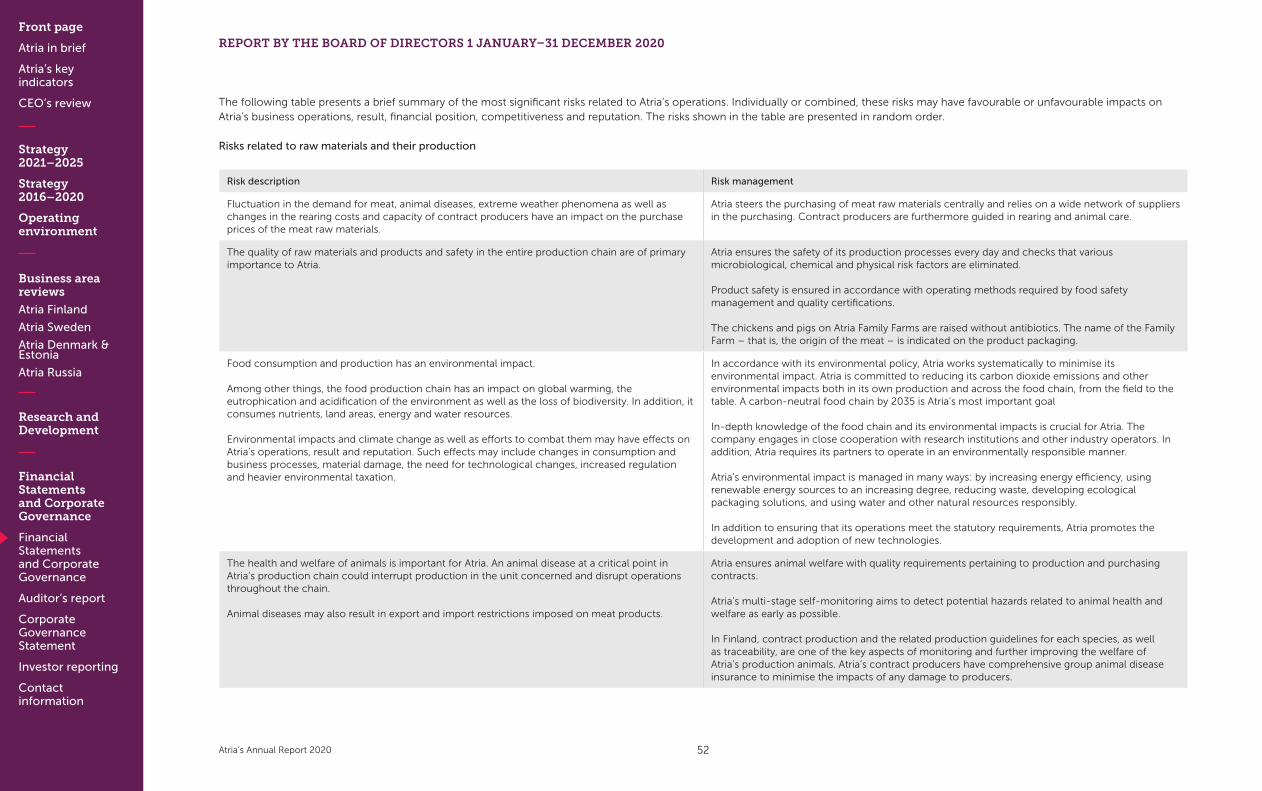
Front page
Atria in brief
Atria’s key indicators
CEO’s review
Strategy 2021–2025
Strategy 2016–2020
Operating environment
Business area reviews
Atria Finland
Atria Sweden
Atria Denmark & Estonia
Atria Russia
Research and Development
Financial Statements and Corporate Governance
Financial Statements and Corporate Governance
Auditor’s report
Corporate Governance Statement
Investor reporting
Contact information
Atria’s Annual Report 2020
REPORT BY THE BOARD OF DIRECTORS 1 JANUARY–31 DECEMBER 2020
The following table presents a brief summary of the most significant risks related to Atria’s operations. Individually or combined, these risks may have favourable or unfavourable impacts on Atria’s business operations, result, financial position, competitiveness and reputation. The risks shown in the table are presented in random order.
Risks related to raw materials and their production
Risk description Risk management
Fluctuation in the demand for meat, animal diseases, extreme weather phenomena as well as changes in the rearing costs and capacity of contract producers have an impact on the purchase prices of the meat raw materials.
Atria steers the purchasing of meat raw materials centrally and relies on a wide network of suppliers in the purchasing. Contract producers are furthermore guided in rearing and animal care.
The quality of raw materials and products and safety in the entire production chain are of primary importance to Atria.
Atria ensures the safety of its production processes every day and checks that various microbiological, chemical and physical risk factors are eliminated.
Product safety is ensured in accordance with operating methods required by food safety management and quality certifications.
The chickens and pigs on Atria Family Farms are raised without antibiotics. The name of the Family Farm – that is, the origin of the meat – is indicated on the product packaging.
Food consumption and production has an environmental impact.
Among other things, the food production chain has an impact on global warming, the eutrophication and acidification of the environment as well as the loss of biodiversity. In addition, it consumes nutrients, land areas, energy and water resources.
Environmental impacts and climate change as well as efforts to combat them may have effects on Atria’s operations, result and reputation. Such effects may include changes in consumption and business processes, material damage, the need for technological changes, increased regulation and heavier environmental taxation.
In accordance with its environmental policy, Atria works systematically to minimise its environmental impact. Atria is committed to reducing its carbon dioxide emissions and other environmental impacts both in its own production and across the food chain, from the field to the table. A carbon-neutral food chain by 2035 is Atria’s most important goal
In-depth knowledge of the food chain and its environmental impacts is crucial for Atria. The company engages in close cooperation with research institutions and other industry operators. In addition, Atria requires its partners to operate in an environmentally responsible manner.
Atria’s environmental impact is managed in many ways: by increasing energy efficiency, using renewable energy sources to an increasing degree, reducing waste, developing ecological packaging solutions, and using water and other natural resources responsibly.
In addition to ensuring that its operations meet the statutory requirements, Atria promotes the development and adoption of new technologies.
The health and welfare of animals is important for Atria. An animal disease at a critical point in Atria’s production chain could interrupt production in the unit concerned and disrupt operations throughout the chain.
Animal diseases may also result in export and import restrictions imposed on meat products.
Atria ensures animal welfare with quality requirements pertaining to production and purchasing contracts.
Atria’s multi-stage self-monitoring aims to detect potential hazards related to animal health and welfare as early as possible.
In Finland, contract production and the related production guidelines for each species, as well as traceability, are one of the key aspects of monitoring and further improving the welfare of Atria’s production animals. Atria’s contract producers have comprehensive group animal disease insurance to minimise the impacts of any damage to producers.
52
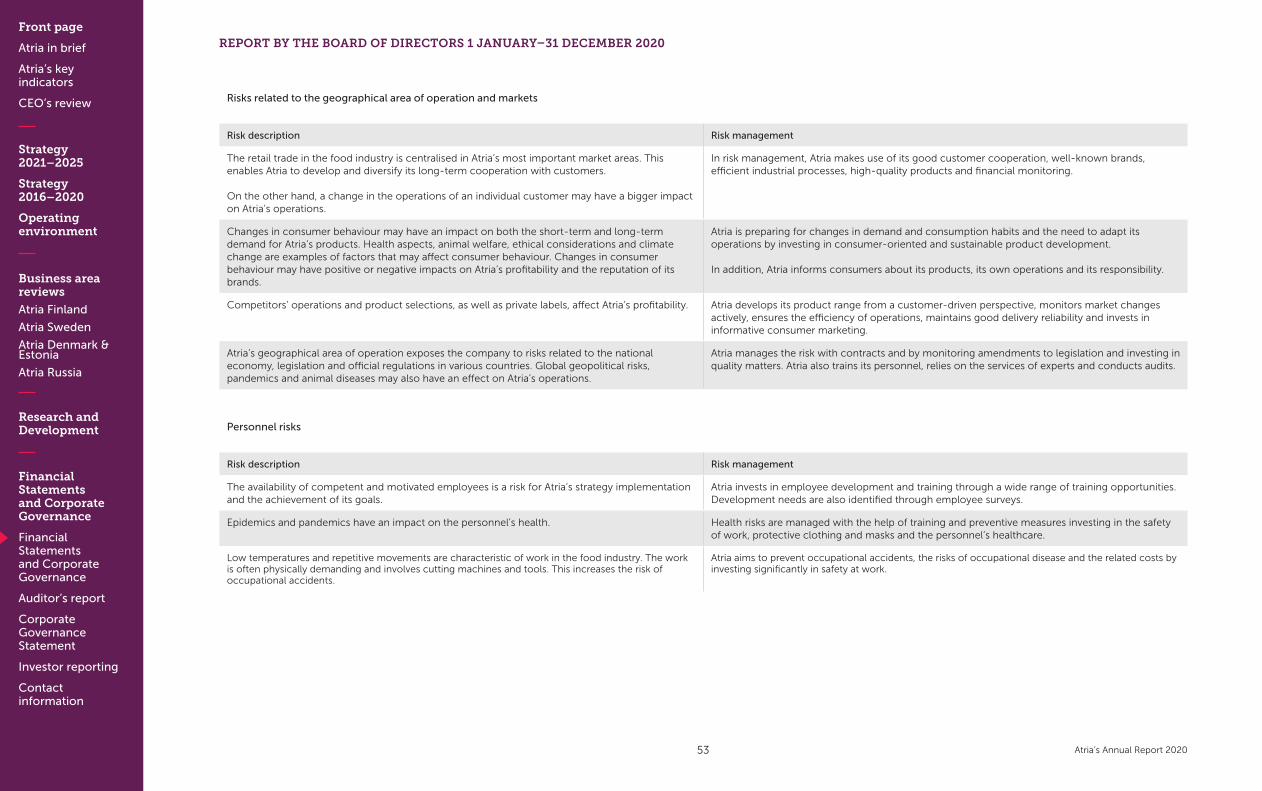
Front page
Atria in brief
Atria’s key indicators
CEO’s review
Strategy 2021–2025
Strategy 2016–2020
Operating environment
Business area reviews
Atria Finland
Atria Sweden
Atria Denmark & Estonia
Atria Russia
Research and Development
Financial Statements and Corporate Governance
Financial Statements and Corporate Governance
Auditor’s report
Corporate Governance Statement
Investor reporting
Contact information
Atria’s Annual Report 2020
Risks related to the geographical area of operation and markets
Risk description Risk management
The retail trade in the food industry is centralised in Atria’s most important market areas. This enables Atria to develop and diversify its long-term cooperation with customers.
On the other hand, a change in the operations of an individual customer may have a bigger impact on Atria’s operations.
In risk management, Atria makes use of its good customer cooperation, well-known brands, efficient industrial processes, high-quality products and financial monitoring.
Changes in consumer behaviour may have an impact on both the short-term and long-term demand for Atria’s products. Health aspects, animal welfare, ethical considerations and climate change are examples of factors that may affect consumer behaviour. Changes in consumer behaviour may have positive or negative impacts on Atria’s profitability and the reputation of its brands.
Atria is preparing for changes in demand and consumption habits and the need to adapt its operations by investing in consumer-oriented and sustainable product development.
In addition, Atria informs consumers about its products, its own operations and its responsibility.
Competitors’ operations and product selections, as well as private labels, affect Atria’s profitability. Atria develops its product range from a customer-driven perspective, monitors market changes actively, ensures the efficiency of operations, maintains good delivery reliability and invests in informative consumer marketing.
Atria’s geographical area of operation exposes the company to risks related to the national economy, legislation and official regulations in various countries. Global geopolitical risks, pandemics and animal diseases may also have an effect on Atria’s operations.
Atria manages the risk with contracts and by monitoring amendments to legislation and investing in quality matters. Atria also trains its personnel, relies on the services of experts and conducts audits.
Personnel risks
Risk description Risk management
The availability of competent and motivated employees is a risk for Atria’s strategy implementation and the achievement of its goals.
Atria invests in employee development and training through a wide range of training opportunities. Development needs are also identified through employee surveys.
Epidemics and pandemics have an impact on the personnel’s health. Health risks are managed with the help of training and preventive measures investing in the safety of work, protective clothing and masks and the personnel’s healthcare.
Low temperatures and repetitive movements are characteristic of work in the food industry. The work is often physically demanding and involves cutting machines and tools. This increases the risk of occupational accidents.
Atria aims to prevent occupational accidents, the risks of occupational disease and the related costs by investing significantly in safety at work.
REPORT BY THE BOARD OF DIRECTORS 1 JANUARY–31 DECEMBER 2020
53
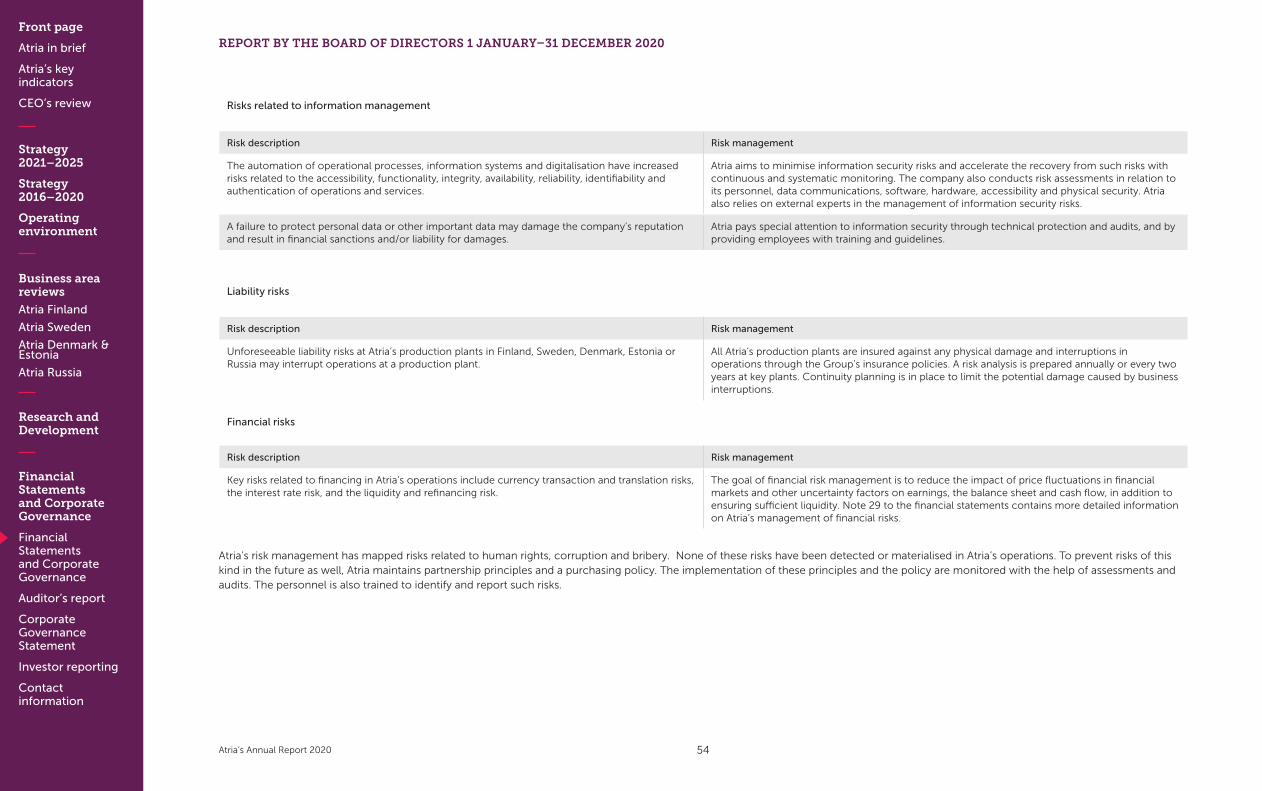
Front page
Atria in brief
Atria’s key indicators
CEO’s review
Strategy 2021–2025
Strategy 2016–2020
Operating environment
Business area reviews
Atria Finland
Atria Sweden
Atria Denmark & Estonia
Atria Russia
Research and Development
Financial Statements and Corporate Governance
Financial Statements and Corporate Governance
Auditor’s report
Corporate Governance Statement
Investor reporting
Contact information
Atria’s Annual Report 2020
REPORT BY THE BOARD OF DIRECTORS 1 JANUARY–31 DECEMBER 2020
Risks related to information management
Risk description Risk management
The automation of operational processes, information systems and digitalisation have increased risks related to the accessibility, functionality, integrity, availability, reliability, identifiability and authentication of operations and services.
Atria aims to minimise information security risks and accelerate the recovery from such risks with continuous and systematic monitoring. The company also conducts risk assessments in relation to its personnel, data communications, software, hardware, accessibility and physical security. Atria also relies on external experts in the management of information security risks.
A failure to protect personal data or other important data may damage the company’s reputation and result in financial sanctions and/or liability for damages.
Atria pays special attention to information security through technical protection and audits, and by providing employees with training and guidelines.
Liability risks
Risk description Risk management
Unforeseeable liability risks at Atria’s production plants in Finland, Sweden, Denmark, Estonia or Russia may interrupt operations at a production plant.
All Atria’s production plants are insured against any physical damage and interruptions in operations through the Group’s insurance policies. A risk analysis is prepared annually or every two years at key plants. Continuity planning is in place to limit the potential damage caused by business interruptions.
Financial risks
Risk description Risk management
Key risks related to financing in Atria’s operations include currency transaction and translation risks, the interest rate risk, and the liquidity and refinancing risk.
The goal of financial risk management is to reduce the impact of price fluctuations in financial markets and other uncertainty factors on earnings, the balance sheet and cash flow, in addition to ensuring sufficient liquidity. Note 29 to the financial statements contains more detailed information on Atria’s management of financial risks.
Atria’s risk management has mapped risks related to human rights, corruption and bribery. None of these risks have been detected or materialised in Atria’s operations. To prevent risks of this kind in the future as well, Atria maintains partnership principles and a purchasing policy. The implementation of these principles and the policy are monitored with the help of assessments and audits. The personnel is also trained to identify and report such risks.
54
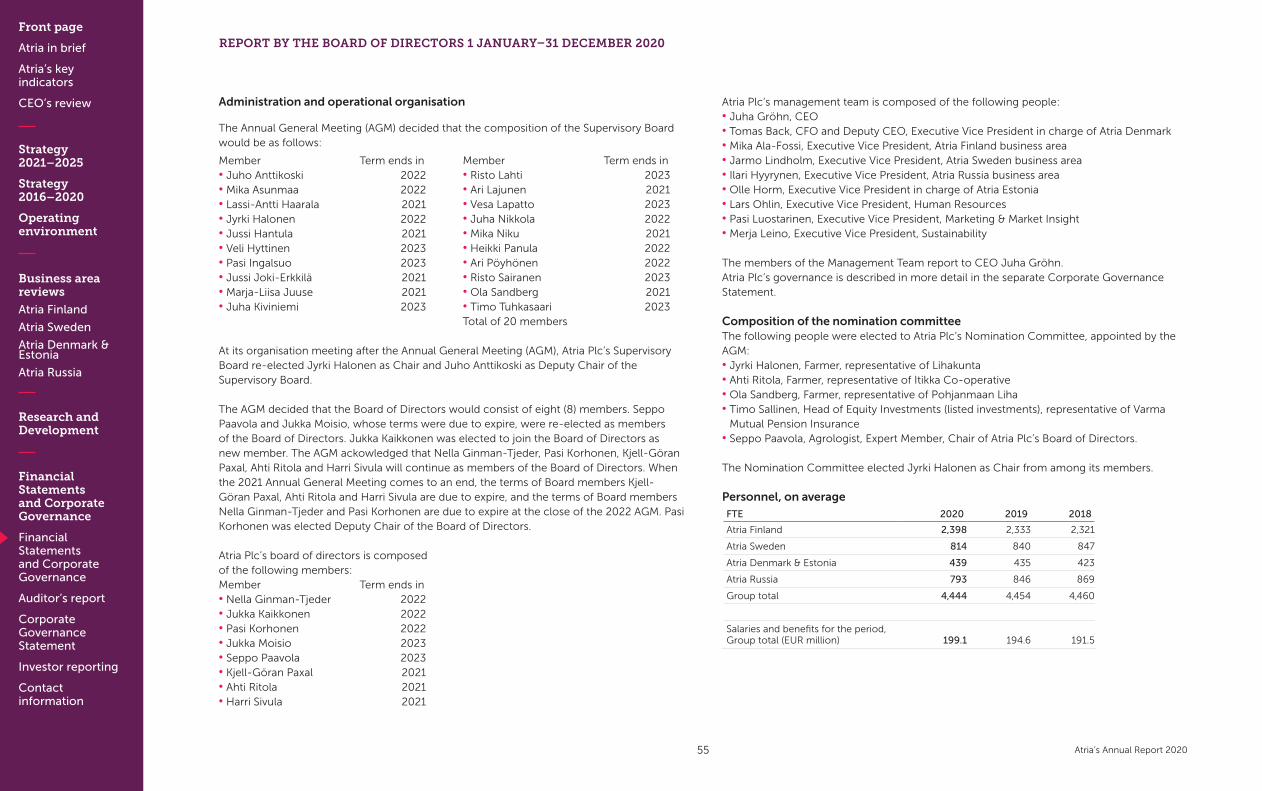
Front page
Atria in brief
Atria’s key indicators
CEO’s review
Strategy 2021–2025
Strategy 2016–2020
Operating environment
Business area reviews
Atria Finland
Atria Sweden
Atria Denmark & Estonia
Atria Russia
Research and Development
Financial Statements and Corporate Governance
Financial Statements and Corporate Governance
Auditor’s report
Corporate Governance Statement
Investor reporting
Contact information
Atria’s Annual Report 2020
Administration and operational organisation
The Annual General Meeting (AGM) decided that the composition of the Supervisory Board would be as follows:
Member Term ends in• Juho Anttikoski 2022• Mika Asunmaa 2022• Lassi-Antti Haarala 2021• Jyrki Halonen 2022• Jussi Hantula 2021• Veli Hyttinen 2023• Pasi Ingalsuo 2023• Jussi Joki-Erkkilä 2021• Marja-Liisa Juuse 2021• Juha Kiviniemi 2023
Member Term ends in • Risto Lahti 2023• Ari Lajunen 2021• Vesa Lapatto 2023• Juha Nikkola 2022• Mika Niku 2021• Heikki Panula 2022• Ari Pöyhönen 2022• Risto Sairanen 2023• Ola Sandberg 2021• Timo Tuhkasaari 2023Total of 20 members
At its organisation meeting after the Annual General Meeting (AGM), Atria Plc’s Supervisory Board re-elected Jyrki Halonen as Chair and Juho Anttikoski as Deputy Chair of the Supervisory Board.
The AGM decided that the Board of Directors would consist of eight (8) members. Seppo Paavola and Jukka Moisio, whose terms were due to expire, were re-elected as members of the Board of Directors. Jukka Kaikkonen was elected to join the Board of Directors as new member. The AGM ackowledged that Nella Ginman-Tjeder, Pasi Korhonen, Kjell-Göran Paxal, Ahti Ritola and Harri Sivula will continue as members of the Board of Directors. When the 2021 Annual General Meeting comes to an end, the terms of Board members Kjell-Göran Paxal, Ahti Ritola and Harri Sivula are due to expire, and the terms of Board members Nella Ginman-Tjeder and Pasi Korhonen are due to expire at the close of the 2022 AGM. Pasi Korhonen was elected Deputy Chair of the Board of Directors.
Atria Plc’s board of directors is composed of the following members: Member Term ends in• Nella Ginman-Tjeder 2022• Jukka Kaikkonen 2022• Pasi Korhonen 2022• Jukka Moisio 2023• Seppo Paavola 2023• Kjell-Göran Paxal 2021• Ahti Ritola 2021• Harri Sivula 2021
Atria Plc’s management team is composed of the following people:• Juha Gröhn, CEO• Tomas Back, CFO and Deputy CEO, Executive Vice President in charge of Atria Denmark• Mika Ala-Fossi, Executive Vice President, Atria Finland business area• Jarmo Lindholm, Executive Vice President, Atria Sweden business area• Ilari Hyyrynen, Executive Vice President, Atria Russia business area• Olle Horm, Executive Vice President in charge of Atria Estonia• Lars Ohlin, Executive Vice President, Human Resources• Pasi Luostarinen, Executive Vice President, Marketing & Market Insight• Merja Leino, Executive Vice President, Sustainability
The members of the Management Team report to CEO Juha Gröhn.Atria Plc’s governance is described in more detail in the separate Corporate Governance Statement.
Composition of the nomination committeeThe following people were elected to Atria Plc’s Nomination Committee, appointed by the AGM: • Jyrki Halonen, Farmer, representative of Lihakunta• Ahti Ritola, Farmer, representative of Itikka Co-operative• Ola Sandberg, Farmer, representative of Pohjanmaan Liha• Timo Sallinen, Head of Equity Investments (listed investments), representative of Varma
Mutual Pension Insurance• Seppo Paavola, Agrologist, Expert Member, Chair of Atria Plc’s Board of Directors.
The Nomination Committee elected Jyrki Halonen as Chair from among its members.
Personnel, on averageFTE 2020 2019 2018
Atria Finland 2,398 2,333 2,321
Atria Sweden 814 840 847
Atria Denmark & Estonia 439 435 423
Atria Russia 793 846 869
Group total 4,444 4,454 4,460
Salaries and benefits for the period,Group total (EUR million) 199.1 194.6 191.5
REPORT BY THE BOARD OF DIRECTORS 1 JANUARY–31 DECEMBER 2020
55
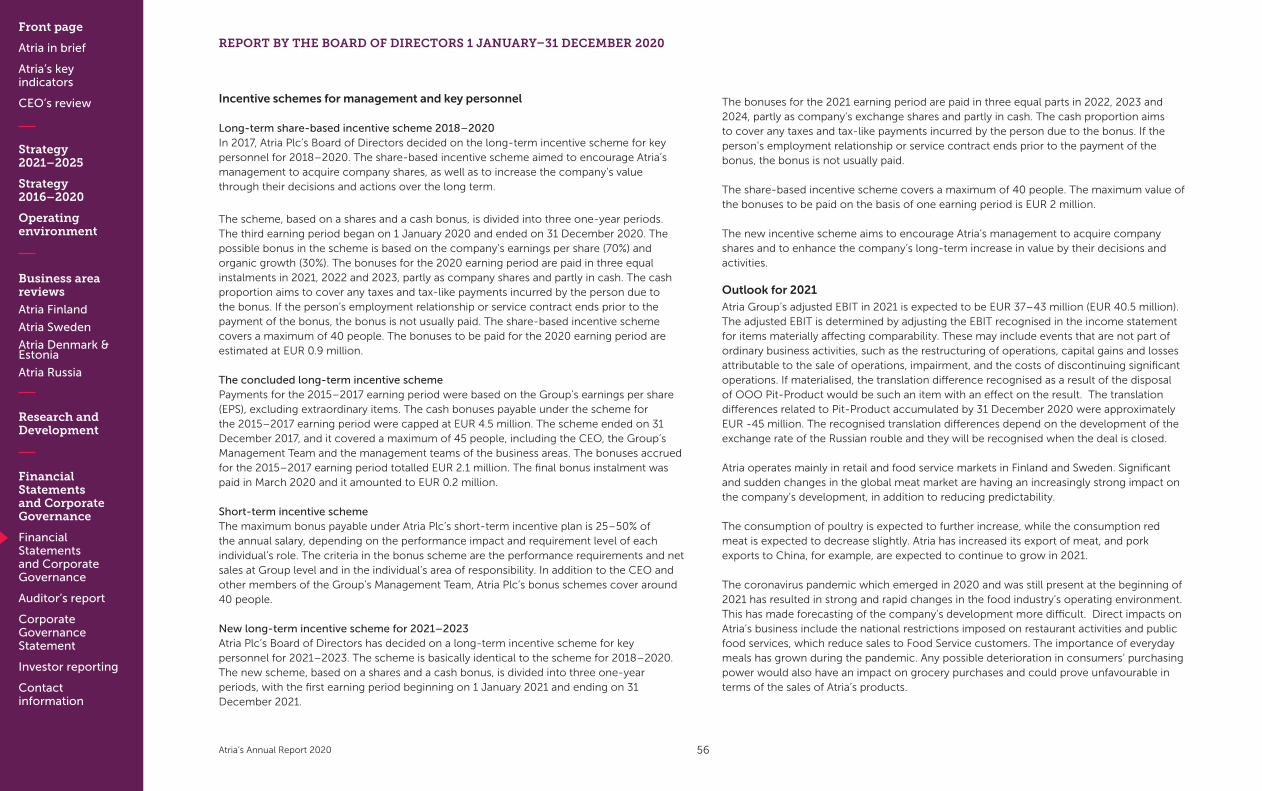
Front page
Atria in brief
Atria’s key indicators
CEO’s review
Strategy 2021–2025
Strategy 2016–2020
Operating environment
Business area reviews
Atria Finland
Atria Sweden
Atria Denmark & Estonia
Atria Russia
Research and Development
Financial Statements and Corporate Governance
Financial Statements and Corporate Governance
Auditor’s report
Corporate Governance Statement
Investor reporting
Contact information
Atria’s Annual Report 2020
REPORT BY THE BOARD OF DIRECTORS 1 JANUARY–31 DECEMBER 2020
Incentive schemes for management and key personnel
Long-term share-based incentive scheme 2018–2020In 2017, Atria Plc’s Board of Directors decided on the long-term incentive scheme for key personnel for 2018–2020. The share-based incentive scheme aimed to encourage Atria’s management to acquire company shares, as well as to increase the company’s value through their decisions and actions over the long term.
The scheme, based on a shares and a cash bonus, is divided into three one-year periods. The third earning period began on 1 January 2020 and ended on 31 December 2020. The possible bonus in the scheme is based on the company’s earnings per share (70%) and organic growth (30%). The bonuses for the 2020 earning period are paid in three equal instalments in 2021, 2022 and 2023, partly as company shares and partly in cash. The cash proportion aims to cover any taxes and tax-like payments incurred by the person due to the bonus. If the person’s employment relationship or service contract ends prior to the payment of the bonus, the bonus is not usually paid. The share-based incentive scheme covers a maximum of 40 people. The bonuses to be paid for the 2020 earning period are estimated at EUR 0.9 million.
The concluded long-term incentive schemePayments for the 2015–2017 earning period were based on the Group’s earnings per share (EPS), excluding extraordinary items. The cash bonuses payable under the scheme for the 2015–2017 earning period were capped at EUR 4.5 million. The scheme ended on 31 December 2017, and it covered a maximum of 45 people, including the CEO, the Group’s Management Team and the management teams of the business areas. The bonuses accrued for the 2015–2017 earning period totalled EUR 2.1 million. The final bonus instalment was paid in March 2020 and it amounted to EUR 0.2 million.
Short-term incentive schemeThe maximum bonus payable under Atria Plc’s short-term incentive plan is 25–50% of the annual salary, depending on the performance impact and requirement level of each individual’s role. The criteria in the bonus scheme are the performance requirements and net sales at Group level and in the individual’s area of responsibility. In addition to the CEO and other members of the Group’s Management Team, Atria Plc’s bonus schemes cover around 40 people.
New long-term incentive scheme for 2021–2023Atria Plc’s Board of Directors has decided on a long-term incentive scheme for key personnel for 2021–2023. The scheme is basically identical to the scheme for 2018–2020. The new scheme, based on a shares and a cash bonus, is divided into three one-year periods, with the first earning period beginning on 1 January 2021 and ending on 31 December 2021.
The bonuses for the 2021 earning period are paid in three equal parts in 2022, 2023 and 2024, partly as company’s exchange shares and partly in cash. The cash proportion aims to cover any taxes and tax-like payments incurred by the person due to the bonus. If the person’s employment relationship or service contract ends prior to the payment of the bonus, the bonus is not usually paid.
The share-based incentive scheme covers a maximum of 40 people. The maximum value of the bonuses to be paid on the basis of one earning period is EUR 2 million.
The new incentive scheme aims to encourage Atria’s management to acquire company shares and to enhance the company’s long-term increase in value by their decisions and activities.
Outlook for 2021Atria Group’s adjusted EBIT in 2021 is expected to be EUR 37–43 million (EUR 40.5 million). The adjusted EBIT is determined by adjusting the EBIT recognised in the income statement for items materially affecting comparability. These may include events that are not part of ordinary business activities, such as the restructuring of operations, capital gains and losses attributable to the sale of operations, impairment, and the costs of discontinuing significant operations. If materialised, the translation difference recognised as a result of the disposal of OOO Pit-Product would be such an item with an effect on the result. The translation differences related to Pit-Product accumulated by 31 December 2020 were approximately EUR -45 million. The recognised translation differences depend on the development of the exchange rate of the Russian rouble and they will be recognised when the deal is closed.
Atria operates mainly in retail and food service markets in Finland and Sweden. Significant and sudden changes in the global meat market are having an increasingly strong impact on the company’s development, in addition to reducing predictability.
The consumption of poultry is expected to further increase, while the consumption red meat is expected to decrease slightly. Atria has increased its export of meat, and pork exports to China, for example, are expected to continue to grow in 2021.
The coronavirus pandemic which emerged in 2020 and was still present at the beginning of 2021 has resulted in strong and rapid changes in the food industry’s operating environment. This has made forecasting of the company’s development more difficult. Direct impacts on Atria’s business include the national restrictions imposed on restaurant activities and public food services, which reduce sales to Food Service customers. The importance of everyday meals has grown during the pandemic. Any possible deterioration in consumers’ purchasing power would also have an impact on grocery purchases and could prove unfavourable in terms of the sales of Atria’s products.
56
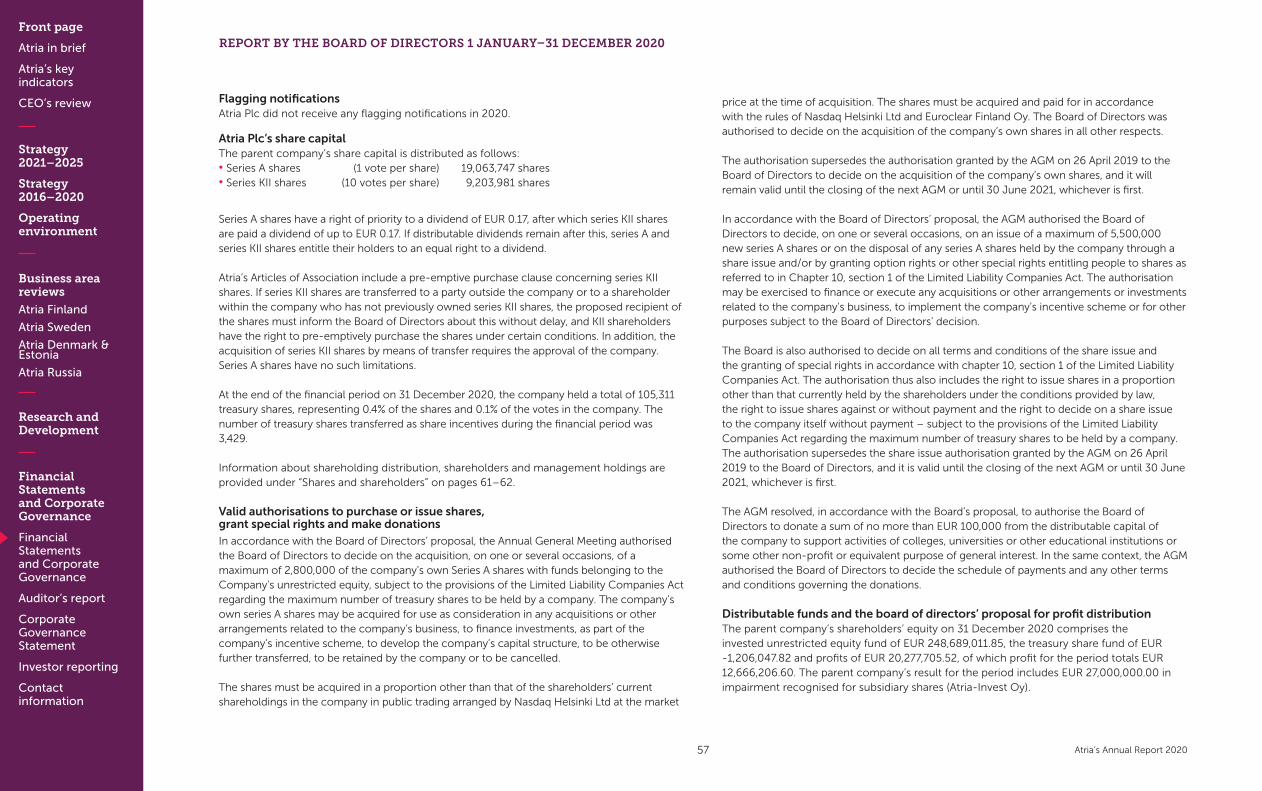
Front page
Atria in brief
Atria’s key indicators
CEO’s review
Strategy 2021–2025
Strategy 2016–2020
Operating environment
Business area reviews
Atria Finland
Atria Sweden
Atria Denmark & Estonia
Atria Russia
Research and Development
Financial Statements and Corporate Governance
Financial Statements and Corporate Governance
Auditor’s report
Corporate Governance Statement
Investor reporting
Contact information
Atria’s Annual Report 2020
Flagging notificationsAtria Plc did not receive any flagging notifications in 2020.
Atria Plc’s share capitalThe parent company’s share capital is distributed as follows:• Series A shares (1 vote per share) 19,063,747 shares• Series KII shares (10 votes per share) 9,203,981 shares
Series A shares have a right of priority to a dividend of EUR 0.17, after which series KII shares are paid a dividend of up to EUR 0.17. If distributable dividends remain after this, series A and series KII shares entitle their holders to an equal right to a dividend.
Atria’s Articles of Association include a pre-emptive purchase clause concerning series KII shares. If series KII shares are transferred to a party outside the company or to a shareholder within the company who has not previously owned series KII shares, the proposed recipient of the shares must inform the Board of Directors about this without delay, and KII shareholders have the right to pre-emptively purchase the shares under certain conditions. In addition, the acquisition of series KII shares by means of transfer requires the approval of the company. Series A shares have no such limitations.
At the end of the financial period on 31 December 2020, the company held a total of 105,311 treasury shares, representing 0.4% of the shares and 0.1% of the votes in the company. The number of treasury shares transferred as share incentives during the financial period was 3,429.
Information about shareholding distribution, shareholders and management holdings are provided under “Shares and shareholders” on pages 61–62.
Valid authorisations to purchase or issue shares, grant special rights and make donationsIn accordance with the Board of Directors’ proposal, the Annual General Meeting authorised the Board of Directors to decide on the acquisition, on one or several occasions, of a maximum of 2,800,000 of the company’s own Series A shares with funds belonging to the Company’s unrestricted equity, subject to the provisions of the Limited Liability Companies Act regarding the maximum number of treasury shares to be held by a company. The company’s own series A shares may be acquired for use as consideration in any acquisitions or other arrangements related to the company’s business, to finance investments, as part of the company’s incentive scheme, to develop the company’s capital structure, to be otherwise further transferred, to be retained by the company or to be cancelled.
The shares must be acquired in a proportion other than that of the shareholders’ current shareholdings in the company in public trading arranged by Nasdaq Helsinki Ltd at the market
price at the time of acquisition. The shares must be acquired and paid for in accordance with the rules of Nasdaq Helsinki Ltd and Euroclear Finland Oy. The Board of Directors was authorised to decide on the acquisition of the company’s own shares in all other respects.
The authorisation supersedes the authorisation granted by the AGM on 26 April 2019 to the Board of Directors to decide on the acquisition of the company’s own shares, and it will remain valid until the closing of the next AGM or until 30 June 2021, whichever is first.
In accordance with the Board of Directors’ proposal, the AGM authorised the Board of Directors to decide, on one or several occasions, on an issue of a maximum of 5,500,000 new series A shares or on the disposal of any series A shares held by the company through a share issue and/or by granting option rights or other special rights entitling people to shares as referred to in Chapter 10, section 1 of the Limited Liability Companies Act. The authorisation may be exercised to finance or execute any acquisitions or other arrangements or investments related to the company’s business, to implement the company’s incentive scheme or for other purposes subject to the Board of Directors’ decision.
The Board is also authorised to decide on all terms and conditions of the share issue and the granting of special rights in accordance with chapter 10, section 1 of the Limited Liability Companies Act. The authorisation thus also includes the right to issue shares in a proportion other than that currently held by the shareholders under the conditions provided by law, the right to issue shares against or without payment and the right to decide on a share issue to the company itself without payment – subject to the provisions of the Limited Liability Companies Act regarding the maximum number of treasury shares to be held by a company. The authorisation supersedes the share issue authorisation granted by the AGM on 26 April 2019 to the Board of Directors, and it is valid until the closing of the next AGM or until 30 June 2021, whichever is first.
The AGM resolved, in accordance with the Board’s proposal, to authorise the Board of Directors to donate a sum of no more than EUR 100,000 from the distributable capital of the company to support activities of colleges, universities or other educational institutions or some other non-profit or equivalent purpose of general interest. In the same context, the AGM authorised the Board of Directors to decide the schedule of payments and any other terms and conditions governing the donations.
Distributable funds and the board of directors’ proposal for profit distributionThe parent company’s shareholders’ equity on 31 December 2020 comprises the invested unrestricted equity fund of EUR 248,689,011.85, the treasury share fund of EUR -1,206,047.82 and profits of EUR 20,277,705.52, of which profit for the period totals EUR 12,666,206.60. The parent company’s result for the period includes EUR 27,000,000.00 in impairment recognised for subsidiary shares (Atria-Invest Oy).
REPORT BY THE BOARD OF DIRECTORS 1 JANUARY–31 DECEMBER 2020
57
Front page
Atria in brief
Atria’s key indicators
CEO’s review
Strategy 2021–2025
Strategy 2016–2020
Operating environment
Business area reviews
Atria Finland
Atria Sweden
Atria Denmark & Estonia
Atria Russia
Research and Development
Financial Statements and Corporate Governance
Financial Statements and Corporate Governance
Auditor’s report
Corporate Governance Statement
Investor reporting
Contact information
Atria’s Annual Report 2020
REPORT BY THE BOARD OF DIRECTORS 1 JANUARY–31 DECEMBER 2020
The Board of Directors will propose to the Annual General Meeting that the distributable funds be used as follows:• a dividend of EUR 0.50 per share be paid, totalling EUR 14,087,771.50• to be retained as equity, EUR 253,672,898.05
267,760,669.55
Statement on non-financial information
Securing a sustainable food chainCorporate responsibility is an integral part of Atria’s business and corporate culture. Responsibility is integrated into all levels of Atria’s operations: its mission, goals, values, operating strategies, management and day-to-day work. Through its responsible operations, the company aims to secure its current and future operating conditions. In line with the principles of sustainable development, the company considers the economic, social and environmental aspects of its operations in all its business areas.
Atria’s chain of good food consists of primary production and the purchasing of raw materials, industrial production, customers and consumers. The food chain takes into account value creation and distribution at the various stages of production, the environmental impacts, and the social impacts related to the food chain and products. The planet, food and people are Atria’s material sustainability focuses for the development and implementation of responsible business operations. By investing in the development of corporate responsibility matters relevant to Atria, the company secures its future operating conditions and creates both financial and social value to society. Direct financial value arises from the jobs provided by Atria, and indirect value from the supply chain and taxes paid. Social value is created by developing the industry in line with the principles of sustainable development and producing food for the needs of customers and consumers with the help of trustworthy brands and a trustworthy corporate image. Atria actively seeks to make an impact on society through trade associations.
Atria’s corporate responsibility is managed at two levels. In Atria Group’s new strategy for 2021–2025, the company states its goal of of leader in sustainability. Concrete goals include a carbon-neutral food chain by 2035, increasing the production of antibiotic-free meat production and a reduction in carbon dioxide emissions. The shared Code of Conduct and policies are determined at Group level. The Group also ensures compliance with the Code and the policies, and determines the development projects and strategic target state applicable to all business areas. The annual reporting related to Atria’s corporate responsibility is also implemented at Group level. The realisation and continuous improvement of Atria’s responsibility are part of day-to-day operational management across the business areas. The steering groups of the business areas analyse the operating environment and key stakeholders’ expectations with regard to responsibility, and also
integrate the implementation of the necessary development measures into their business plans.
Stakeholders are strongly present in the food chain, from raw material procurement all the way to the finished products and their use. Listening to stakeholders and taking their needs into account is one of the cornerstones of Atria’s sustainability work. Atria’s responsibility is constructed through dialogue and is supported by openness and transparency. Atria’s Corporate Responsibility Report contains a comprehensive description of the company’s sustainability work. The Corporate Responsibility Report is available on Atria’s website at https://www.atria.fi/en/group/corporate-responsibility/corporate-responsibility-reporting/. Atria’s reporting is based on the international Global Reporting Initiative (GRI) standard. Atria has selected the essential measurements and indicators relevant to its operations and stakeholders from the GRI standard.
The Atria Code of Conduct supports sustainable business operationsCompliance with healthy and sustainable business practices lays the foundation for Atria’s operations. The Atria Code of Conduct is a set of ethical principles concerning business operations, stakeholder relations and environmental responsibility, approved by Atria Plc’s Board of Directors. The Code of Conduct is supported by internal policies and guidelines that define and guide operating methods. The Code of Conduct concerns all Atria employees in all business areas. The Atria Code of Conduct and the corporate policies supporting the Code are based on the laws and collective agreements of Atria’s countries of operation, and on international agreements and recommendations concerning responsible operations in terms of human rights and anti-corruption, for example.
In accordance with its Code of Conduct, Atria has zero tolerance for any type of corruption or bribery. Atria’s employees must not give or receive benefits, gifts or hospitality that could inappropriately influence business decisions. Atria’s employees have been familiarised with the Code of Conduct and the policies that support the Code through an induction programme that supports their job descriptions.
Respect for human rights is an integral part of Atria’s Code of Conduct and HR policy. Atria respects and supports internationally recognised human rights principles and requires all its employees, suppliers and subcontractors to comply with these principles.
Through its Code of Conduct and the policies that support the Code, Atria is committed to the following international agreements and recommendations:• UN Universal Declaration of Human Rights and Convention on Rights of the Child• UN Global Compact initiative for the promotion of human rights, labour rights,
environmental protection and the prevention of corruption• ILO Declaration on Fundamental Principles and Rights at Work• OECD Guidelines for Multinational Enterprises
58

Front page
Atria in brief
Atria’s key indicators
CEO’s review
Strategy 2021–2025
Strategy 2016–2020
Operating environment
Business area reviews
Atria Finland
Atria Sweden
Atria Denmark & Estonia
Atria Russia
Research and Development
Financial Statements and Corporate Governance
Financial Statements and Corporate Governance
Auditor’s report
Corporate Governance Statement
Investor reporting
Contact information
Atria’s Annual Report 2020
• Business Charter for Sustainable Development of the International Chamber of Commerce (ICC) and the ICC Rules on Combating Corruption
• Responsible purchasing principles of the Business Social Compliance Initiative (BSCI)
Atria expects its business partners to comply with either their own code of conduct or the equivalent Atria Partnership Code of Conduct within their operations. In addition, procurement contracts obligate Atria’s partners to meet the company’s requirements for product quality, operating methods and the supply chain, for example.
Atria assesses the compliance of its contractual partners’ operations before undertaking a partnership and on a regular basis during the partnership. In addition to the experience gained during the business relationship, the assessment takes into account risk factors related to financial, environmental and social responsibility. Atria has the right to audit the operations of its contractual partners if necessary. In the audits, attention is paid to food safety, for example, as well as environmental and social responsibility, such as human rights and the prevention of corruption and bribery.
Atria has established a whistleblowing channel for its employees to report suspected breaches of the Code of Conduct or illegal activities. All reports are processed confidentially, and Atria implements any necessary measures based on the reports. The related indicator is the number of reports submitted to the whistleblowing channel or to the authorities. No reports were submitted to Atria’s whistleblowing channel during 2020.
PLANETIn accordance with its environmental policy, Atria works systematically to minimise its environmental impact. Atria is committed to reducing carbon dioxide emissions and other environmental impacts in its own production and across the food chain. The goals of environmental management at Atria’s plants have been adjusted to changes in the operating environment. Priorities include energy efficiency, water efficiency and the prevention of waste and food waste, as well as ensuring statutory compliance in operations.
Concerning the food chain as a whole, a carbon-neutral food chain by 2035 is Atria’s most important environmental goal. The means and measures for achieving a carbon-neutral food chain and the key indicators of environmental responsibility are reported in more detail in the Corporate Responsibility Report. Producers play a key role in mitigating the environmental impact of primary production. At the farm level, minimising environmental impacts means farm-specific solutions based on the type of production. Resource efficiency and good input-output ratios play a key role in terms of the environment.
The key projects to improve the environmental efficiency of the production chain are discussed in the business area reviews in the Annual Report and in the Corporate Responsibility Report.
EnergySustainable, efficient energy use reduces carbon dioxide emissions, which facilitate climate change. Atria Group’s energy consumption in 2020 was 514,976 MWh. Consumption decreased by 1.3%, and consumption per kilo produced decreased by 2.8% year-on-year. The decrease in energy consumption was the result of a growth in the share of biofuels at Atria’s plant in Nurmo, Finland, and a general decrease in consumption achieved through energy efficiency measures, particularly in terms of heating energy. Atria Group’s carbon dioxide emissions have decreased by 27% from the 2016 level. The decrease in carbon dioxide emissions was due to the increased use of renewable energy sources, such as increasing the share of bio-based fuels in heat production.
Water The quality, adequacy and pumping capacity of water are critical for Atria’s operations. Plant-specific environmental permits determine the threshold values for wastewater quality. All wastewater is directed to a local wastewater treatment facility. Atria Group’s water consumption in 2020 was 3,020,256 m3. Consumption decreased by 1%, and consumption per kilo produced decreased by 2% compared to 2019. The continuous management of water consumption is part of the plants’ environmental management and continuous improvement.
Materials Food production is at the core of the circular economy. Side streams that do not end up as products are directed back to the food chain, as precisely and with as high a value as possible. They are used in applications of the feed industry, as nutrients, for material recycling or as energy. During the strategy period which concluded at the end 2020, Atria focused on strengthening an anti-wastage operating culture. Atria’s internal waste management aims to improve value creation for material flows suitable for food production. Atria’s wastage is managed in accordance with the same principles in all business areas of the Group. The various types of process wastage have been identified and monitoring indicators have been created for them. They are displayed at the departments and daily management reacts to deviations without delay. In addition to the personnel’s activities, wastage reduction requires investments in the processes.
Compliance The operations of Atria’s production plants are subject to environmental permits. All Atria’s production plants have management systems that meet the requirements of the ISO 14001 standard for environmental systems and the requirements of the ISO 50001 standard for energy management systems. The Corporate Responsibility Report includes information about the system certification status. No leaks were reported, no warnings were issued by the authorities, and no coercive measures were imposed in the reporting period.
REPORT BY THE BOARD OF DIRECTORS 1 JANUARY–31 DECEMBER 2020
59
Front page
Atria in brief
Atria’s key indicators
CEO’s review
Strategy 2021–2025
Strategy 2016–2020
Operating environment
Business area reviews
Atria Finland
Atria Sweden
Atria Denmark & Estonia
Atria Russia
Research and Development
Financial Statements and Corporate Governance
Financial Statements and Corporate Governance
Auditor’s report
Corporate Governance Statement
Investor reporting
Contact information
Atria’s Annual Report 2020
PRODUCT
OriginAtria’s food is ethically produced, pure and safe. The production chain is open and transparent. Atria is aiming for a fully transparent food chain, where consumers and other parties can be provided with information about the origin of all the raw materials, ingredients and packaging materials that we use.
Meat is the most important raw material for Atria’s products. Animal welfare is ensured and proved throughout Atria’s food chain.
Environmental considerations related to food production are continuously subject to public debate. Atria wants to lead the way in proving that meat can still be an ethically sustainable choice for consumers as part of well-balanced diets. In the development of sustainable primary production, Atria invests in animal welfare, animal disease management and the development of feeding solutions in cooperation with meat producers, industry experts and research institutions, for example.
The good treatment of production animals and animal welfare are key operating principles for Atria. In its operations, Atria complies with the laws related to the treatment and slaughter of animals. More detailed information about this is provided in Atria’s Corporate Responsibility Report. Tuoretie Oy is responsible for Atria Finland’s animal transport operations and compliance with the related laws. These aspects are also reported in more detail in the Corporate Responsibility Report.
SafetyIf materialised, a product safety risk could have fatal consequences for people’s health and Atria’s business operations. Atria therefore takes product safety extremely seriously. Atria’s food safety and quality policy lays the foundation for commitments, goal setting and continuous improvement. The product safety management systems of Atria’s production plants have FSSC 22000 certification.
During statutory assessments in 2020, no serious shortcomings in operating methods were detected that could compromise food safety and result in fines or coercive measures imposed by the authorities. In 2020, Atria had to carry out five product recalls. Two in Finland, two in Sweden and one in Estonia. No recalls were necessary in Denmark and Russia.
More detailed information about Atria’s principles and results concerning the origin and safe production of food is provided in the Corporate Responsibility Report, starting from page 27
PEOPLE
ConsumersAs a food producer, Atria understands its responsibility towards consumers and public health. The purity and nutritional quality of food, as well as ethical food chains, are important values for consumers. People’s well-being is based on healthy and nourishing food. Atria’s main product categories are fresh and consumer-packed meat and meat products, such as sausages and cold cuts, as well as convenience foods and poultry products. By participating in applied research in product and packaging technology and nutrition, Atria can also create innovative products and concepts for future needs. Further information about the results of Atria’s product development and research operations is provided on page 42.
EmployeesThe company’s future relies on highly competent employees and well-being at work. We want to offer a workplace where competent professionals thrive. Our goal is to be one of the most attractive employers in the food industry. Safety at work is one of the cornerstones of our operations: we ensure in many different ways that our employees return safely home from Atria. Our long-term goal is zero accidents across Atria Group.
Our HR policy defines the material aspects of personnel responsibility concerning employment relationships. These include a fair employment relationship, well-being and safety at work, competence development, equality, non-discrimination and freedom of association, as well as the prevention of child labour and forced labour.
In 2020, Atria Group continued to implement the Safely Home from Atria occupational safety programme. Employees’ well-being improved in 2020, confirmed by sickness absence levels and accident frequency rates.
Further information about Atria’s responsibility for people is provided in the Corporate Responsibility Report, starting from page 29.
REPORT BY THE BOARD OF DIRECTORS 1 JANUARY–31 DECEMBER 2020
60
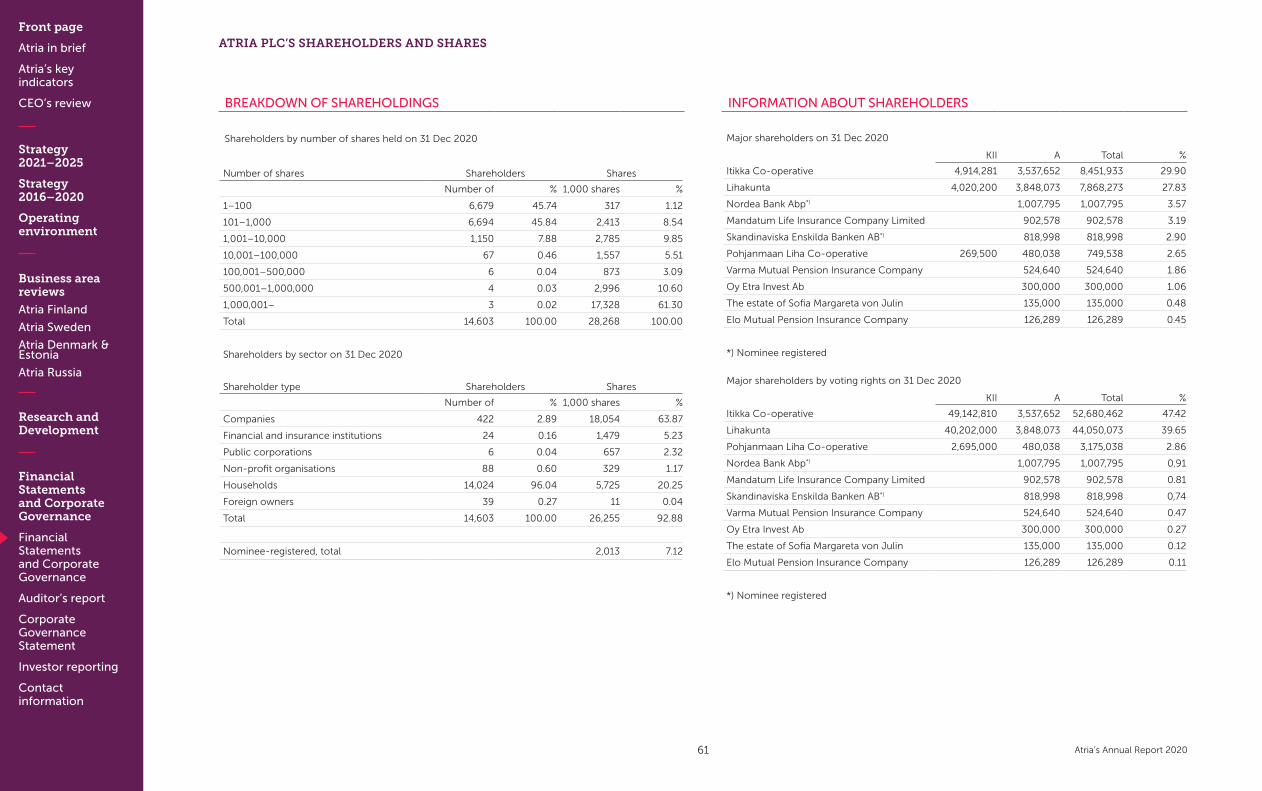
Front page
Atria in brief
Atria’s key indicators
CEO’s review
Strategy 2021–2025
Strategy 2016–2020
Operating environment
Business area reviews
Atria Finland
Atria Sweden
Atria Denmark & Estonia
Atria Russia
Research and Development
Financial Statements and Corporate Governance
Financial Statements and Corporate Governance
Auditor’s report
Corporate Governance Statement
Investor reporting
Contact information
Atria’s Annual Report 2020
ATRIA PLC’S SHAREHOLDERS AND SHARES
BREAKDOWN OF SHAREHOLDINGS
Shareholders by number of shares held on 31 Dec 2020
Number of shares Shareholders Shares
Number of % 1,000 shares %
1–100 6,679 45.74 317 1.12
101–1,000 6,694 45.84 2,413 8.54
1,001–10,000 1,150 7.88 2,785 9.85
10,001–100,000 67 0.46 1,557 5.51
100,001–500,000 6 0.04 873 3.09
500,001–1,000,000 4 0.03 2,996 10.60
1,000,001– 3 0.02 17,328 61.30
Total 14,603 100.00 28,268 100.00
Shareholders by sector on 31 Dec 2020
Shareholder type Shareholders Shares
Number of % 1,000 shares %
Companies 422 2.89 18,054 63.87
Financial and insurance institutions 24 0.16 1,479 5.23
Public corporations 6 0.04 657 2.32
Non-profit organisations 88 0.60 329 1.17
Households 14,024 96.04 5,725 20.25
Foreign owners 39 0.27 11 0.04
Total 14,603 100.00 26,255 92.88
Nominee-registered, total 2,013 7.12
INFORMATION ABOUT SHAREHOLDERS
Major shareholders on 31 Dec 2020
KII A Total %
Itikka Co-operative 4,914,281 3,537,652 8,451,933 29.90
Lihakunta 4,020,200 3,848,073 7,868,273 27.83
Nordea Bank Abp*) 1,007,795 1,007,795 3.57
Mandatum Life Insurance Company Limited 902,578 902,578 3.19
Skandinaviska Enskilda Banken AB*) 818,998 818,998 2.90
Pohjanmaan Liha Co-operative 269,500 480,038 749,538 2.65
Varma Mutual Pension Insurance Company 524,640 524,640 1.86
Oy Etra Invest Ab 300,000 300,000 1.06
The estate of Sofia Margareta von Julin 135,000 135,000 0.48
Elo Mutual Pension Insurance Company 126,289 126,289 0.45
*) Nominee registered
Major shareholders by voting rights on 31 Dec 2020
KII A Total %
Itikka Co-operative 49,142,810 3,537,652 52,680,462 47.42
Lihakunta 40,202,000 3,848,073 44,050,073 39.65
Pohjanmaan Liha Co-operative 2,695,000 480,038 3,175,038 2.86
Nordea Bank Abp*) 1,007,795 1,007,795 0,91
Mandatum Life Insurance Company Limited 902,578 902,578 0.81
Skandinaviska Enskilda Banken AB*) 818,998 818,998 0,74
Varma Mutual Pension Insurance Company 524,640 524,640 0.47
Oy Etra Invest Ab 300,000 300,000 0.27
The estate of Sofia Margareta von Julin 135,000 135,000 0.12
Elo Mutual Pension Insurance Company 126,289 126,289 0.11
*) Nominee registered
61

Front page
Atria in brief
Atria’s key indicators
CEO’s review
Strategy 2021–2025
Strategy 2016–2020
Operating environment
Business area reviews
Atria Finland
Atria Sweden
Atria Denmark & Estonia
Atria Russia
Research and Development
Financial Statements and Corporate Governance
Financial Statements and Corporate Governance
Auditor’s report
Corporate Governance Statement
Investor reporting
Contact information
Atria’s Annual Report 2020
EUR
MANAGEMENT’S SHAREHOLDING
On 31 December 2020, the members of the Board of Directors and the Supervisory Board, the CEO and Deputy CEO, as well as the members of the Group’s Management Team, held a total of 80,739 series A shares, or 0.29% of the shares and 0.07% of the voting rights conferred by shares.
MONTHLY TRADING VOLUME OF SERIES A SHARES IN 2020
MonthTrading,
EURTrading,
sharesMonthly
lowestMonthlyhighest
January 5,928,252 583,807 9.60 10.86
February 4,865,610 518,213 8.20 10.14
March 6,351,985 791,486 7.13 8.86
April 4,840,546 520,405 8.16 10.40
May 2,401,271 271,444 8.41 9.39
June 2,313,879 266,194 8.40 8.95
July 2,150,295 243,777 8.50 9.20
August 1,335,221 156,375 8.47 8.79
September 1,993,290 233,823 8.42 8.67
October 4,010,556 431,774 8.62 10.00
November 3,276,358 348,533 8.82 10.08
December 2,290,058 233,447 9.56 10.04
Total 41,757,321 4,599,278
CHANGES IN THE SERIES A SHARE PRICE 2016–2020 (AVERAGE PRICE)
ATRIA PLC’S SHAREHOLDERS AND SHARES
12/2
0
09
/20
06
/20
03
/20
12/19
09
/19
06
/19
03
/19
12/18
09
/18
03
/18
12/17
09
/17
06
/17
03
/17
12/16
09
/16
06
/16
03
/16
14.00
13.00
12.00
11.00
10.00
9.00
8.00
7.00
6.00
5.00
4.00
3.00
62
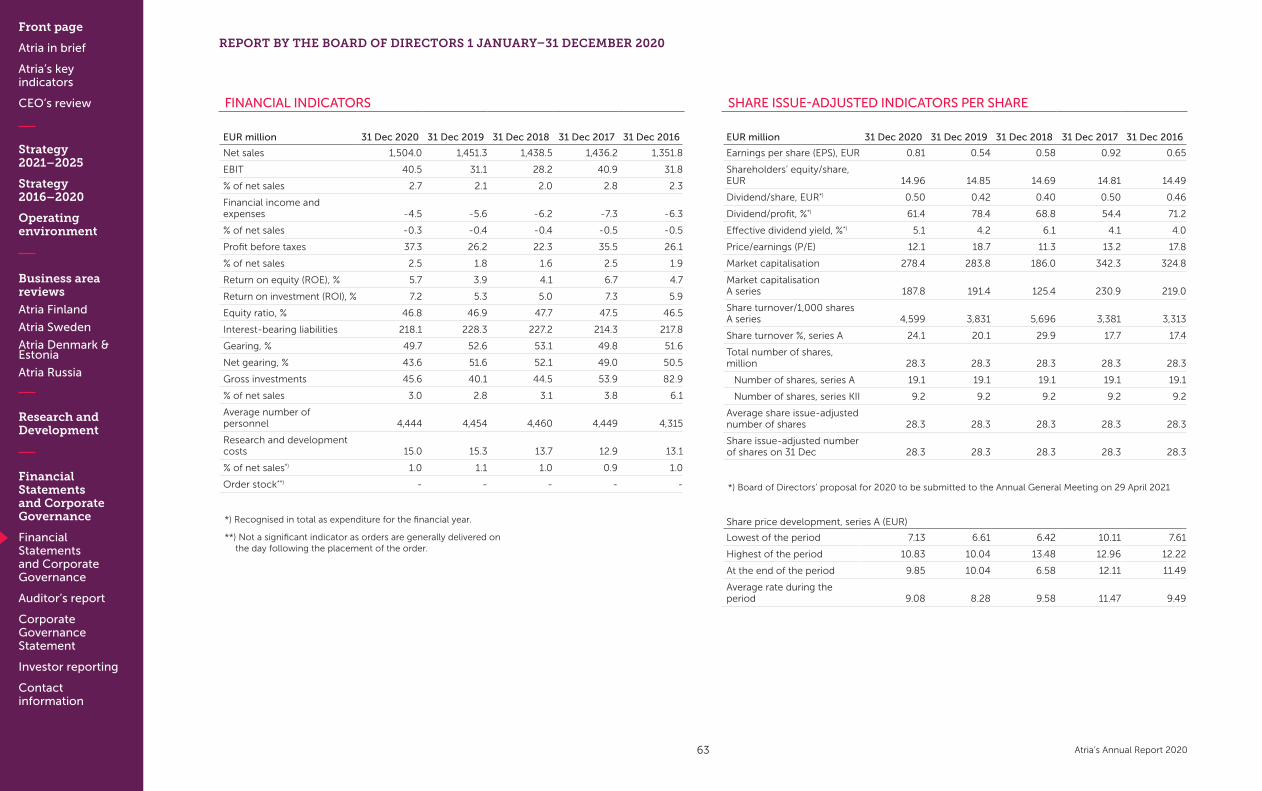
Front page
Atria in brief
Atria’s key indicators
CEO’s review
Strategy 2021–2025
Strategy 2016–2020
Operating environment
Business area reviews
Atria Finland
Atria Sweden
Atria Denmark & Estonia
Atria Russia
Research and Development
Financial Statements and Corporate Governance
Financial Statements and Corporate Governance
Auditor’s report
Corporate Governance Statement
Investor reporting
Contact information
Atria’s Annual Report 2020
SHARE ISSUE-ADJUSTED INDICATORS PER SHARE
EUR million 31 Dec 2020 31 Dec 2019 31 Dec 2018 31 Dec 2017 31 Dec 2016
Earnings per share (EPS), EUR 0.81 0.54 0.58 0.92 0.65
Shareholders’ equity/share, EUR 14.96 14.85 14.69 14.81 14.49
Dividend/share, EUR*) 0.50 0.42 0.40 0.50 0.46
Dividend/profit, %*) 61.4 78.4 68.8 54.4 71.2
Effective dividend yield, %*) 5.1 4.2 6.1 4.1 4.0
Price/earnings (P/E) 12.1 18.7 11.3 13.2 17.8
Market capitalisation 278.4 283.8 186.0 342.3 324.8
Market capitalisation A series 187.8 191.4 125.4 230.9 219.0
Share turnover/1,000 shares A series 4,599 3,831 5,696 3,381 3,313
Share turnover %, series A 24.1 20.1 29.9 17.7 17.4
Total number of shares, million 28.3 28.3 28.3 28.3 28.3
Number of shares, series A 19.1 19.1 19.1 19.1 19.1
Number of shares, series KII 9.2 9.2 9.2 9.2 9.2
Average share issue-adjusted number of shares 28.3 28.3 28.3 28.3 28.3
Share issue-adjusted number of shares on 31 Dec 28.3 28.3 28.3 28.3 28.3
*) Board of Directors’ proposal for 2020 to be submitted to the Annual General Meeting on 29 April 2021
Share price development, series A (EUR)
Lowest of the period 7.13 6.61 6.42 10.11 7.61
Highest of the period 10.83 10.04 13.48 12.96 12.22
At the end of the period 9.85 10.04 6.58 12.11 11.49
Average rate during the period 9.08 8.28 9.58 11.47 9.49
FINANCIAL INDICATORS
EUR million 31 Dec 2020 31 Dec 2019 31 Dec 2018 31 Dec 2017 31 Dec 2016
Net sales 1,504.0 1,451.3 1,438.5 1,436.2 1,351.8
EBIT 40.5 31.1 28.2 40.9 31.8
% of net sales 2.7 2.1 2.0 2.8 2.3
Financial income and expenses -4.5 -5.6 -6.2 -7.3 -6.3
% of net sales -0.3 -0.4 -0.4 -0.5 -0.5
Profit before taxes 37.3 26.2 22.3 35.5 26.1
% of net sales 2.5 1.8 1.6 2.5 1.9
Return on equity (ROE), % 5.7 3.9 4.1 6.7 4.7
Return on investment (ROI), % 7.2 5.3 5.0 7.3 5.9
Equity ratio, % 46.8 46.9 47.7 47.5 46.5
Interest-bearing liabilities 218.1 228.3 227.2 214.3 217.8
Gearing, % 49.7 52.6 53.1 49.8 51.6
Net gearing, % 43.6 51.6 52.1 49.0 50.5
Gross investments 45.6 40.1 44.5 53.9 82.9
% of net sales 3.0 2.8 3.1 3.8 6.1
Average number of personnel 4,444 4,454 4,460 4,449 4,315
Research and development costs 15.0 15.3 13.7 12.9 13.1
% of net sales*) 1.0 1.1 1.0 0.9 1.0
Order stock**) - - - - -
*) Recognised in total as expenditure for the financial year.
**) Not a significant indicator as orders are generally delivered on the day following the placement of the order.
REPORT BY THE BOARD OF DIRECTORS 1 JANUARY–31 DECEMBER 2020
63
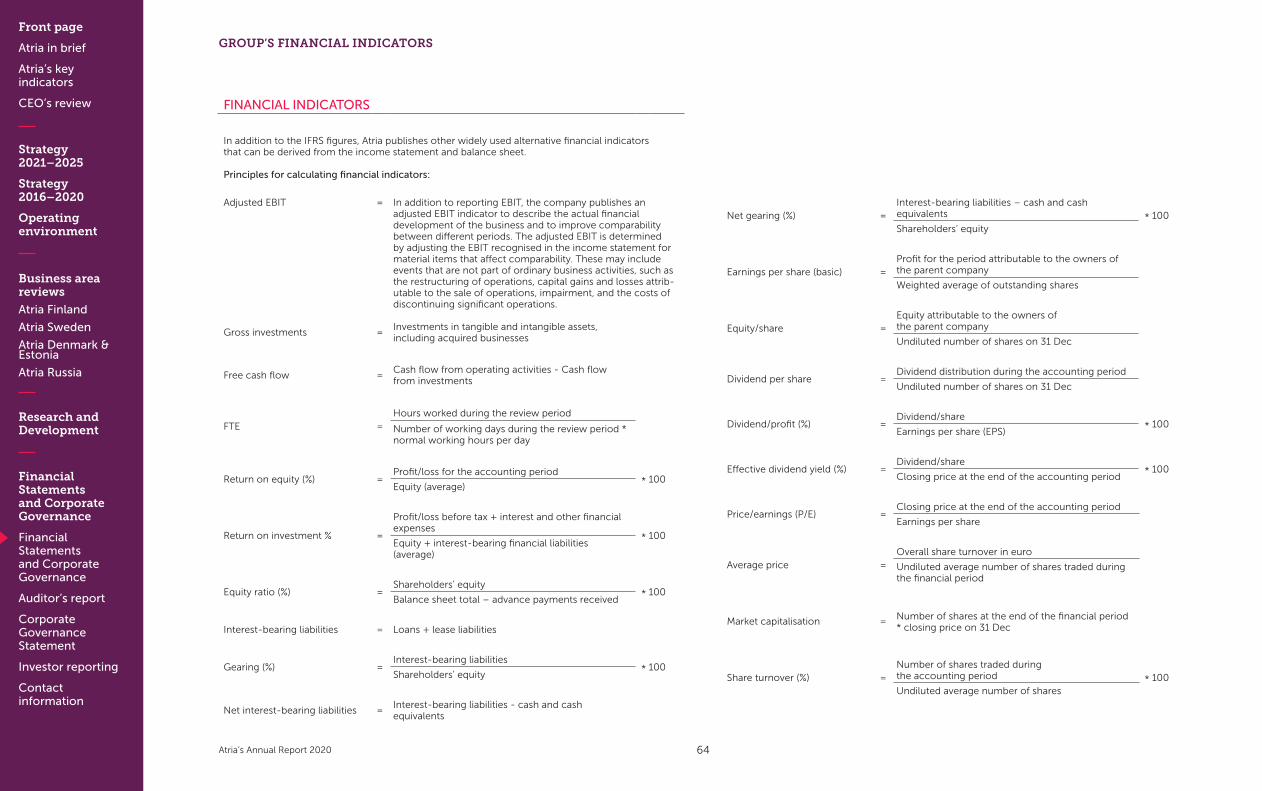
Front page
Atria in brief
Atria’s key indicators
CEO’s review
Strategy 2021–2025
Strategy 2016–2020
Operating environment
Business area reviews
Atria Finland
Atria Sweden
Atria Denmark & Estonia
Atria Russia
Research and Development
Financial Statements and Corporate Governance
Financial Statements and Corporate Governance
Auditor’s report
Corporate Governance Statement
Investor reporting
Contact information
Atria’s Annual Report 2020
GROUP’S FINANCIAL INDICATORS
FINANCIAL INDICATORS
In addition to the IFRS figures, Atria publishes other widely used alternative financial indicatorsthat can be derived from the income statement and balance sheet.
Principles for calculating financial indicators:
Adjusted EBIT = In addition to reporting EBIT, the company publishes an adjusted EBIT indicator to describe the actual financial development of the business and to improve comparability between different periods. The adjusted EBIT is determined by adjusting the EBIT recognised in the income statement for material items that affect comparability. These may include events that are not part of ordinary business activities, such as the restructuring of operations, capital gains and losses attrib-utable to the sale of operations, impairment, and the costs of discontinuing significant operations.
Gross investments =Investments in tangible and intangible assets, including acquired businesses
Free cash flow =Cash flow from operating activities - Cash flow from investments
FTE =Hours worked during the review period
Number of working days during the review period * normal working hours per day
Return on equity (%) =Profit/loss for the accounting period
* 100Equity (average)
Return on investment % =
Profit/loss before tax + interest and other financial expenses
* 100Equity + interest-bearing financial liabilities (average)
Equity ratio (%) =Shareholders’ equity
* 100Balance sheet total – advance payments received
Interest-bearing liabilities = Loans + lease liabilities
Gearing (%) =Interest-bearing liabilities
* 100Shareholders’ equity
Net interest-bearing liabilities =Interest-bearing liabilities - cash and cash equivalents
Net gearing (%) =Interest-bearing liabilities – cash and cash equivalents * 100Shareholders’ equity
Earnings per share (basic) =Profit for the period attributable to the owners of the parent company
Weighted average of outstanding shares
Equity/share =Equity attributable to the owners of the parent company
Undiluted number of shares on 31 Dec
Dividend per share =Dividend distribution during the accounting period
Undiluted number of shares on 31 Dec
Dividend/profit (%) =Dividend/share
* 100Earnings per share (EPS)
Effective dividend yield (%) =Dividend/share
* 100Closing price at the end of the accounting period
Price/earnings (P/E) =Closing price at the end of the accounting period
Earnings per share
Average price =Overall share turnover in euro
Undiluted average number of shares traded during the financial period
Market capitalisation = Number of shares at the end of the financial period * closing price on 31 Dec
Share turnover (%) =Number of shares traded during the accounting period * 100Undiluted average number of shares
64

Front page
Atria in brief
Atria’s key indicators
CEO’s review
Strategy 2021–2025
Strategy 2016–2020
Operating environment
Business area reviews
Atria Finland
Atria Sweden
Atria Denmark & Estonia
Atria Russia
Research and Development
Financial Statements and Corporate Governance
Financial Statements and Corporate Governance
Auditor’s report
Corporate Governance Statement
Investor reporting
Contact information
Atria’s Annual Report 2020
CONSOLIDATED INCOME STATEMENT
EUR 1,000 Note 1 Jan–31 Dec 2020 1 Jan–31 Dec 2019
Net sales 1, 2 1,504,036 1,451,273
Costs of goods sold 7, 8 -1,337,715 -1,288,547
Gross profit 166,321 162,726
Sales and marketing expenses 3, 7, 8 -77,708 -84,309
Administrative expenses 4, 7, 8 -45,702 -44,006
Impairment losses from financial assets and contractual assets 20 -456 -1,196
Other operating income 5 3,226 3,247
Other operating expenses 6, 8 -5,140 -5,349
EBIT 1 40,540 31,113
Financial income 9, 29 16,682 11,277
Financial expenses 9, 25, 29 -21,157 -16,832
Net financial items -4,475 -5,555
Income from investments accounted for using the equity method 16 1,193 625
Profit/loss before taxes 37,257 26,183
Income taxes 10, 18 -12,589 -9,223
Profit for the period 24,668 16,960
Profit attributable to:
Owners of the parent 22,915 15,086
Non-controlling interests 1,753 1,874
Total 24,668 16,960
Basic earnings per share, EUR 11 0.81 0.54
Earnings per share adjusted by the dilution effect, earnings per share, EUR 11 0.81 0.54
CONSOLIDATED STATEMENT OF COMPREHENSIVE INCOME
EUR 1,000 Note 1 Jan–31 Dec 2020 1 Jan–31 Dec 2019
Profit for the period 24,668 16,960
Other items of comprehensive income after tax:
Items not reclassified to profit or loss
Actuarial gains/losses from benefit-based pension obligations 10, 26 -144 -531
Items reclassified to profit or loss when specific conditions are met
Changes in the fair value of debt instruments recognised at fair value through other comprehensive income
Cash flow hedges 9, 10, 29 -1,477 -3,570
Translation differences 9, 10, 29 -6,822 4,576
Total comprehensive income for the period 16,225 17,435
Comprehensive income distribution for the financial period:
Owners of the parent 14,472 15,561
Non-controlling interests 1,753 1,874
Total 16,225 17,435
The notes on pages 69–102 are an integral part of the consolidated financial statements.
IFRS FINANCIAL STATEMENTS
65

Front page
Atria in brief
Atria’s key indicators
CEO’s review
Strategy 2021–2025
Strategy 2016–2020
Operating environment
Business area reviews
Atria Finland
Atria Sweden
Atria Denmark & Estonia
Atria Russia
Research and Development
Financial Statements and Corporate Governance
Financial Statements and Corporate Governance
Auditor’s report
Corporate Governance Statement
Investor reporting
Contact information
Atria’s Annual Report 2020
IFRS FINANCIAL STATEMENTS
CONSOLIDATED STATEMENT OF FINANCIAL POSITION
ASSETS, EUR 1,000 Note 31 Dec 2020 31 Dec 2019
Non-current assets
Property, plant and equipment 12 395,493 398,081
Biological assets 13 610 694
Right-of-use assets 14 33,697 33,303
Goodwill 15 164,829 160,779
Other intangible assets 15 83,932 84,677
Investments in joint ventures and associates 16, 31, 34 14,479 15,036
Other financial assets 17, 29 1,201 1,198
Trade receivables, loans and other receivables 20, 29 4,638 5,216
Deferred tax assets 10, 18 1,481 4,048
Total 32 700,360 703,032
Current assets
Inventories 19 102,893 110,192
Biological assets 13 3,639 4,099
Trade and other receivables 20, 29, 32 104,682 104,558
Current tax assets 1,386 2,418
Cash and cash equivalents 21, 29 26,576 4,395
Total 32 239,176 225,662
Total assets 1 939,535 928,694
EQUITY AND LIABILITIES, EUR 1,000 Notes 31 Dec 2020 31 Dec 2019
Equity attributable to the shareholders of the parent company
Share capital 48,055 48,055
Treasury shares -1,206 -1,246
Other funds -1,310 170
Invested unrestricted equity fund 249,544 249,239
Translation differences -62,668 -55,848
Retained earnings 190,407 179,506
Total 10, 11, 18, 22, 23, 29 422,822 419,876
Non-controlling interests 16,062 14,420
Equity total 438,885 434,296
Non-current liabilities
Loans 24, 29 138,838 140,868
Lease liabilities 25 24,553 24,996
Deferred tax liabilities 10, 18 39,250 40,674
Pension obligations 26 7,185 6,817
Other liabilities 27, 29 1,799 7,028
Provisions 27 290 687
Total 32 211,914 221,070
Current liabilities
Loans 24, 29 45,130 53,854
Lease liabilities 25 9,613 8,612
Trade and other payables 28, 31 233,914 210,182
Current tax liabilities 79 680
Total 32 288,736 273,328
Total liabilities 1 500,651 494,398
Total equity and liabilities 939,535 928,694
The notes on pages 69–102 are an integral part of the consolidated financial statements.
66

Front page
Atria in brief
Atria’s key indicators
CEO’s review
Strategy 2021–2025
Strategy 2016–2020
Operating environment
Business area reviews
Atria Finland
Atria Sweden
Atria Denmark & Estonia
Atria Russia
Research and Development
Financial Statements and Corporate Governance
Financial Statements and Corporate Governance
Auditor’s report
Corporate Governance Statement
Investor reporting
Contact information
Atria’s Annual Report 2020
CONSOLIDATED STATEMENT OF CHANGES IN EQUITY
Equity attributable to the owners of the parent company
Non-controlling
interests Equity total
EUR 1,000 Note Share capital Treasury shares Other funds
Invested unrestricted equity fund
Currency translation differences
fundRetained earnings Total
Equity on 1 Jan 2019 48,055 -1,277 3,740 249,211 -60,424 176,016 415,321 12,864 428,185
Total comprehensive income for the period
Profit for the period 15,086 15,086 1,874 16,960
Other comprehensive income
Cash flow hedges 29 -3,570 -3,570 -3,570
Acturial losses from pension liabilities 26 -531 -531 -531
Currency translation differences 9, 10 4,576 4,576 4,576
Transactions with owners
Share of non-controlling interest related to acquisition of subsidiary 27 198 198 198
Share incentives 23 31 28 59 59
Distribution of dividend 22 -11,263 -11,263 -318 -11,581
Equity on 31 Dec 2019 48,055 -1,246 170 249,239 -55,848 179,506 419,876 14,420 434,296
Total comprehensive income for the period
Profit for the period 22,915 22,915 1,753 24,668
Other comprehensive income
Cash flow hedges 29 -1,477 -1,477 -1,477
Acturial losses from pension liabilities 26 -144 -144 -144
Currency translation differences 9, 10 -2 -6,820 -6,822 -6,822
Transactions with owners
Share of non-controlling interest related to acquisition of subsidiary 27 -42 -42 -42
Share incentives 23 40 305 345 345
Distribution of dividend 22 -11,828 -11,828 -110 -11,938
Equity on 31 Dec 2020 48,055 -1,206 -1,310 249,544 -62,668 190,407 422,822 16,062 438,885
The notes on pages 69–102 are an integral part of the consolidated financial statements.
IFRS FINANCIAL STATEMENTS
67
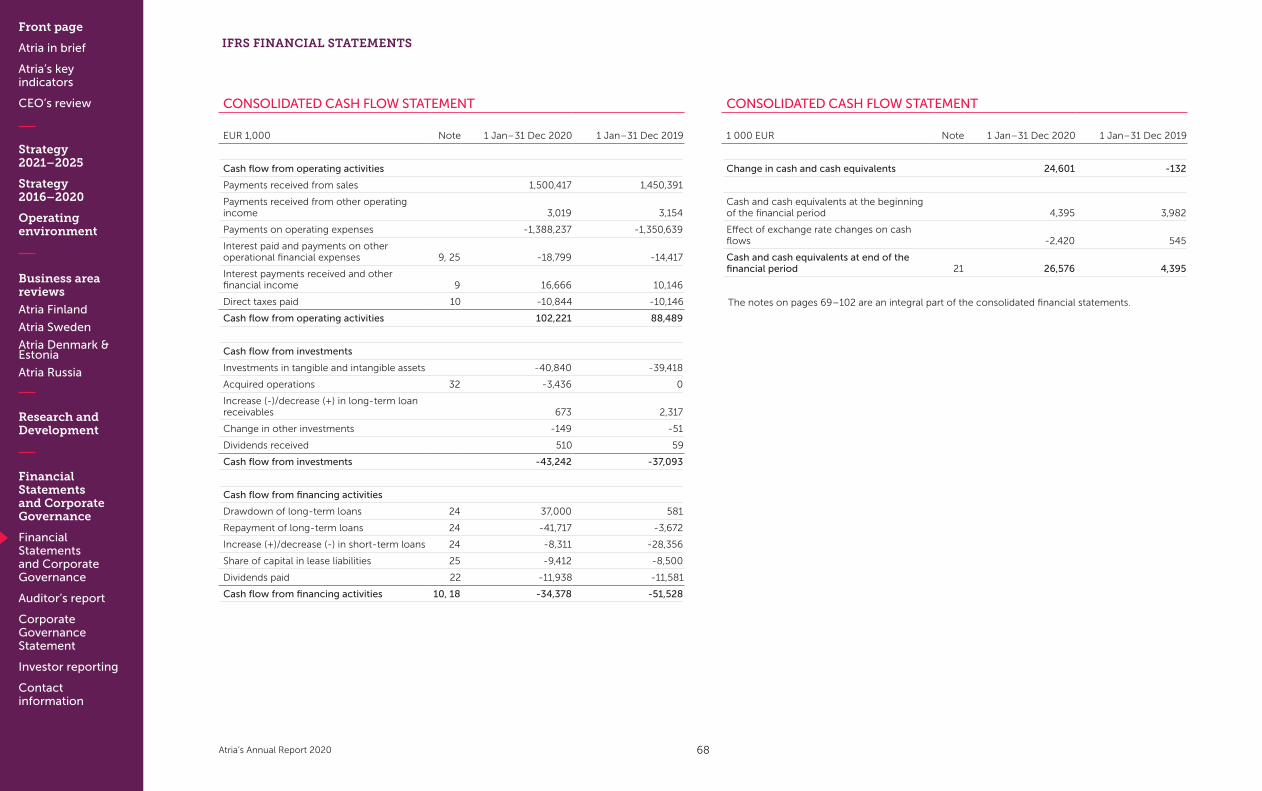
Front page
Atria in brief
Atria’s key indicators
CEO’s review
Strategy 2021–2025
Strategy 2016–2020
Operating environment
Business area reviews
Atria Finland
Atria Sweden
Atria Denmark & Estonia
Atria Russia
Research and Development
Financial Statements and Corporate Governance
Financial Statements and Corporate Governance
Auditor’s report
Corporate Governance Statement
Investor reporting
Contact information
Atria’s Annual Report 2020
CONSOLIDATED CASH FLOW STATEMENT
EUR 1,000 Note 1 Jan–31 Dec 2020 1 Jan–31 Dec 2019
Cash flow from operating activities
Payments received from sales 1,500,417 1,450,391
Payments received from other operating income 3,019 3,154
Payments on operating expenses -1,388,237 -1,350,639
Interest paid and payments on other operational financial expenses 9, 25 -18,799 -14,417
Interest payments received and other financial income 9 16,666 10,146
Direct taxes paid 10 -10,844 -10,146
Cash flow from operating activities 102,221 88,489
Cash flow from investments
Investments in tangible and intangible assets -40,840 -39,418
Acquired operations 32 -3,436 0
Increase (-)/decrease (+) in long-term loan receivables 673 2,317
Change in other investments -149 -51
Dividends received 510 59
Cash flow from investments -43,242 -37,093
Cash flow from financing activities
Drawdown of long-term loans 24 37,000 581
Repayment of long-term loans 24 -41,717 -3,672
Increase (+)/decrease (-) in short-term loans 24 -8,311 -28,356
Share of capital in lease liabilities 25 -9,412 -8,500
Dividends paid 22 -11,938 -11,581
Cash flow from financing activities 10, 18 -34,378 -51,528
CONSOLIDATED CASH FLOW STATEMENT
1 000 EUR Note 1 Jan–31 Dec 2020 1 Jan–31 Dec 2019
Change in cash and cash equivalents 24,601 -132
Cash and cash equivalents at the beginning of the financial period 4,395 3,982
Effect of exchange rate changes on cash flows -2,420 545
Cash and cash equivalents at end of the financial period 21 26,576 4,395
The notes on pages 69–102 are an integral part of the consolidated financial statements.
IFRS FINANCIAL STATEMENTS
68
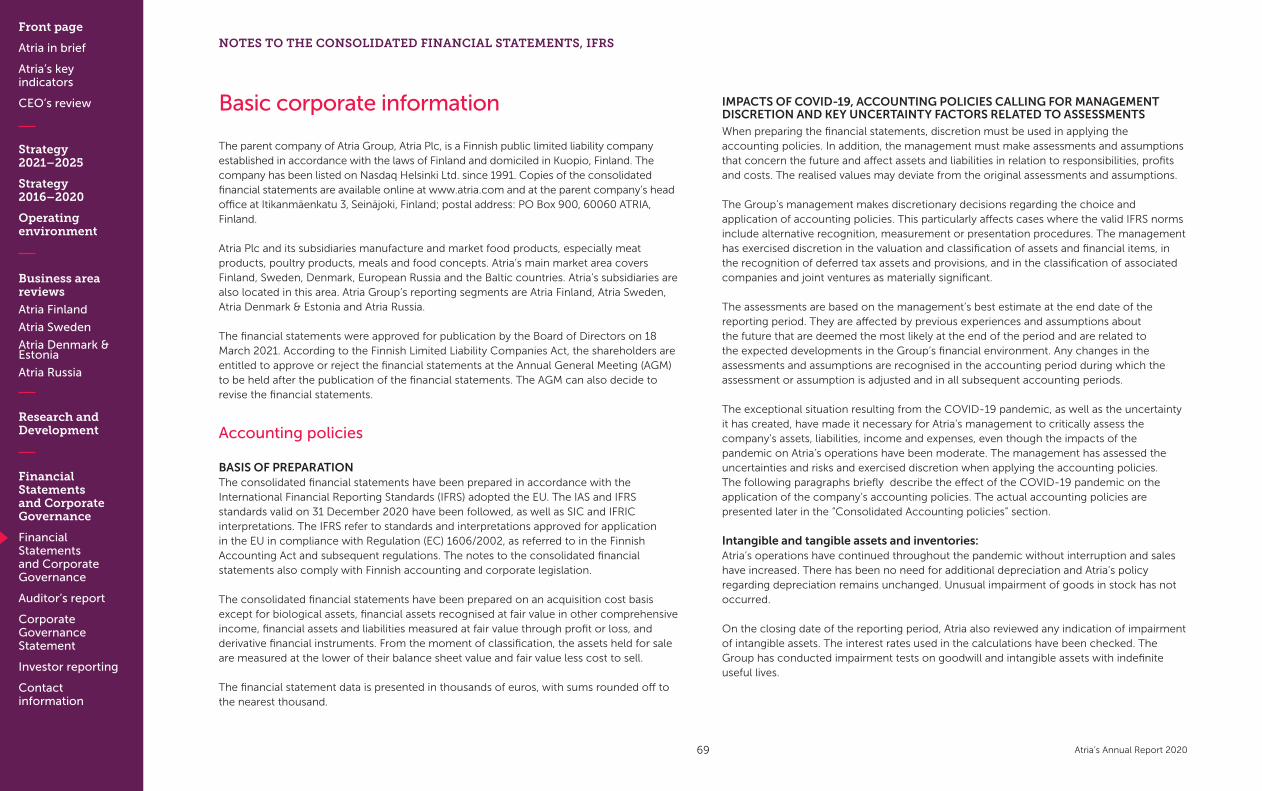
Front page
Atria in brief
Atria’s key indicators
CEO’s review
Strategy 2021–2025
Strategy 2016–2020
Operating environment
Business area reviews
Atria Finland
Atria Sweden
Atria Denmark & Estonia
Atria Russia
Research and Development
Financial Statements and Corporate Governance
Financial Statements and Corporate Governance
Auditor’s report
Corporate Governance Statement
Investor reporting
Contact information
Atria’s Annual Report 2020
Basic corporate information
The parent company of Atria Group, Atria Plc, is a Finnish public limited liability company established in accordance with the laws of Finland and domiciled in Kuopio, Finland. The company has been listed on Nasdaq Helsinki Ltd. since 1991. Copies of the consolidated financial statements are available online at www.atria.com and at the parent company’s head office at Itikanmäenkatu 3, Seinäjoki, Finland; postal address: PO Box 900, 60060 ATRIA, Finland.
Atria Plc and its subsidiaries manufacture and market food products, especially meat products, poultry products, meals and food concepts. Atria’s main market area covers Finland, Sweden, Denmark, European Russia and the Baltic countries. Atria’s subsidiaries are also located in this area. Atria Group’s reporting segments are Atria Finland, Atria Sweden, Atria Denmark & Estonia and Atria Russia.
The financial statements were approved for publication by the Board of Directors on 18 March 2021. According to the Finnish Limited Liability Companies Act, the shareholders are entitled to approve or reject the financial statements at the Annual General Meeting (AGM) to be held after the publication of the financial statements. The AGM can also decide to revise the financial statements.
Accounting policies
BASIS OF PREPARATIONThe consolidated financial statements have been prepared in accordance with the International Financial Reporting Standards (IFRS) adopted the EU. The IAS and IFRS standards valid on 31 December 2020 have been followed, as well as SIC and IFRIC interpretations. The IFRS refer to standards and interpretations approved for application in the EU in compliance with Regulation (EC) 1606/2002, as referred to in the Finnish Accounting Act and subsequent regulations. The notes to the consolidated financial statements also comply with Finnish accounting and corporate legislation.
The consolidated financial statements have been prepared on an acquisition cost basis except for biological assets, financial assets recognised at fair value in other comprehensive income, financial assets and liabilities measured at fair value through profit or loss, and derivative financial instruments. From the moment of classification, the assets held for sale are measured at the lower of their balance sheet value and fair value less cost to sell.
The financial statement data is presented in thousands of euros, with sums rounded off to the nearest thousand.
IMPACTS OF COVID-19, ACCOUNTING POLICIES CALLING FOR MANAGEMENT DISCRETION AND KEY UNCERTAINTY FACTORS RELATED TO ASSESSMENTSWhen preparing the financial statements, discretion must be used in applying the accounting policies. In addition, the management must make assessments and assumptions that concern the future and affect assets and liabilities in relation to responsibilities, profits and costs. The realised values may deviate from the original assessments and assumptions.
The Group’s management makes discretionary decisions regarding the choice and application of accounting policies. This particularly affects cases where the valid IFRS norms include alternative recognition, measurement or presentation procedures. The management has exercised discretion in the valuation and classification of assets and financial items, in the recognition of deferred tax assets and provisions, and in the classification of associated companies and joint ventures as materially significant.
The assessments are based on the management’s best estimate at the end date of the reporting period. They are affected by previous experiences and assumptions about the future that are deemed the most likely at the end of the period and are related to the expected developments in the Group’s financial environment. Any changes in the assessments and assumptions are recognised in the accounting period during which the assessment or assumption is adjusted and in all subsequent accounting periods.
The exceptional situation resulting from the COVID-19 pandemic, as well as the uncertainty it has created, have made it necessary for Atria’s management to critically assess the company’s assets, liabilities, income and expenses, even though the impacts of the pandemic on Atria’s operations have been moderate. The management has assessed the uncertainties and risks and exercised discretion when applying the accounting policies. The following paragraphs briefly describe the effect of the COVID-19 pandemic on the application of the company’s accounting policies. The actual accounting policies are presented later in the “Consolidated Accounting policies” section.
Intangible and tangible assets and inventories:Atria’s operations have continued throughout the pandemic without interruption and sales have increased. There has been no need for additional depreciation and Atria’s policy regarding depreciation remains unchanged. Unusual impairment of goods in stock has not occurred.
On the closing date of the reporting period, Atria also reviewed any indication of impairment of intangible assets. The interest rates used in the calculations have been checked. The Group has conducted impairment tests on goodwill and intangible assets with indefinite useful lives.
NOTES TO THE CONSOLIDATED FINANCIAL STATEMENTS, IFRS
69

Front page
Atria in brief
Atria’s key indicators
CEO’s review
Strategy 2021–2025
Strategy 2016–2020
Operating environment
Business area reviews
Atria Finland
Atria Sweden
Atria Denmark & Estonia
Atria Russia
Research and Development
Financial Statements and Corporate Governance
Financial Statements and Corporate Governance
Auditor’s report
Corporate Governance Statement
Investor reporting
Contact information
Atria’s Annual Report 2020
NOTES TO THE CONSOLIDATED FINANCIAL STATEMENTS, IFRS
The calculation to test the impairment of intangible assets is based on a series of figures from a five-year strategic period which is annually assessed, taking into account any changes in the business environment, measures taken by Atria and the results achieved.
Each of Atria’s business areas has prepared its own five-year series, and the continuation of the COVID-19 pandemic in 2021 has been taken into account in the first year of the series. Together with the business areas, the Group’s Management Team has assessed how realistic the series is during and after the pandemic, as well as the risks. The figures were finally also reviewed by the Board, which approved the proposals made. No indications of impairment were detected. Impairment testing and sensitivity analyses are described in more detail in Note 15.
Right-of-use assets and lease liabilities:The Group has leased properties, machinery and equipment. The lease contracts are made for a fixed period or are valid until further notice. The contract period for leases that are valid until further notice, as well as any options to extend them, are assessed on a case-by-case basis. COVID-19 has not affected the terms of Atria’s leases and Atria has not received any lease relief.
Revenue recognition and management of liquidity risk:Atria’s total sales have developed favourably during the pandemic and there has been no need to change the revenue recognition policies. As a result of increased sales and good results, the company’s financial position and cash flow were good during the financial year and, despite the exceptional circumstances, Atria has managed to refinance its maturing commercial papers with new ones. Cash and cash equivalents increased by approximately EUR 30 million during the first quarter, but were reduced to levels closer to normal during the second and third quarters. Trade receivables:Atria’s trade receivables from consumer goods customers are short-term and do not include significant financial components. Consumer product customers are mainly central wholesale businesses. Some of the trade receivables are sold to finance companies. The sold trade receivables are derecognised on the balance sheet when the finance company has settled the payment for the receivables and when all material risks and benefits related to the ownership have transferred to the buyer. Each Group company has assessed their trade receivables and their age distribution. Atria has evaluated its model for expected credit losses from trade receivables, which takes into account macroeconomic developments. It was not necessary to make material changes to the amount of recognised credit loss provision.
Employee benefits:Due to the COVID-19 pandemic, employers were given a discount of 2.6% on their TyEL contributions during the period from 1 May to 31 December 2020. In Sweden, the state
reimbursed some of the salary costs and social security contributions for sick leaves caused by the coronavirus from 1 March to 31 December 2020. No grants or subsidies related to the COVID-19 pandemic were received in Atria’s other business areas.
Acquired operations:During the review period, Atria Finland acquired the entire share capital of Domretor Oy. Because the assets and liabilities acquired in business combinations are measured at fair value at the time of acquisition, Atria’s management has assessed the value of the assets, compared them with market prices and made assumptions of their future use. The liabilities have also been critically assessed. The management believes that the assessments and assumptions are sufficiently detailed to be used as the basis for fair value measurement.
Taxes:In connection with the financial statements, Atria’s management has assessed the effect of uncertainty over tax treatment in accordance with IFRIC 23. Atria has not taken advantage of the tax reliefs granted by the tax authorities in connection with the COVID-19 pandemic and income taxes are recognised on the basis of the taxable result for the year. Deferred tax assets have been written down in Russia, because the Company did not foresee convincing evidence of future opportunities to offset tax losses. As a result of COVID-19 subsidies, it is not possible to use a group subsidy in Sweden to equalise the taxable results of the companies. This will slightly increase the income taxes paid by our Swedish companies.
CHANGES IN ACCOUNTING POLICIES AND DISCLOSURESa) New and amended standards, effective for financial periods beginning on or after 1 January 2020
Definition of ‘material’ – amendments to IAS 1 and IAS 8The IASB has made amendments to IAS 1 Presentation of Financial Statements and IAS 8 Accounting Policies, Changes in Accounting Estimates and Errors which use a consistent definition of materiality throughout International Financial Reporting Standards and the Conceptual Framework for Financial Reporting, clarify when information is material and incorporate some of the guidance in IAS 1 about immaterial information.
Atria takes into account the changed definition of materiality in its consolidated financial statements and for publication in the data.
70

Front page
Atria in brief
Atria’s key indicators
CEO’s review
Strategy 2021–2025
Strategy 2016–2020
Operating environment
Business area reviews
Atria Finland
Atria Sweden
Atria Denmark & Estonia
Atria Russia
Research and Development
Financial Statements and Corporate Governance
Financial Statements and Corporate Governance
Auditor’s report
Corporate Governance Statement
Investor reporting
Contact information
Atria’s Annual Report 2020
b) Significant new standards and interpretations that have been issued, but will not become effective until after 1 January 2020
Classification of liabilities into current or non-current items - Amendments to IAS 1The narrow-scope amendments to IAS 1 Presentation of Financial Statements clarify that liabilities are classified as either current or non-current, depending on the rights that exist at the end of the reporting period. Classification is unaffected by the expectations of the entity or events after the reporting date. The amendments also clarify what IAS 1 means when it refers to the ‘settlement’ of a liability.
The amendments could affect the classification of liabilities, particularly for entities that previously considered management’s intentions to determine classification and for some liabilities that can be converted into equity. They must be applied retrospectively in accordance with the normal requirements in IAS 8 Accounting Policies, Changes in Accounting Estimates and Errors. In May 2020, the IASB issued an Exposure Draft proposing to defer the effective date of the amendments to 1 January 2023.
Atria is currently assessing the impact of these amedments.
Accounting policies for the consolidated financial statements
SUBSIDIARIESThe consolidated financial statements include the parent company Atria Plc and all its subsidiaries. Subsidiaries are companies controlled by the Group. The Group controls an entity when the Group is exposed to or entitled to variable returns from its involvement with the entity, and can affect those returns through its power over the entity. Subsidiaries acquired during the financial year are consolidated from the date of their acquisition and divested subsidiaries are included up to their date of sale.
Business combinations are treated using the acquisition method of accounting. Consideration transferred, and the identifiable acquired assets and assumed liabilities of the acquired business are measured at fair value at acquisition date. Consideration transferred includes the fair value of an asset or liability arising from a contingent consideration arrangement. The costs of acquisition are charged to the income statement during the period in which they are incurred and the related services are received. The net assets and accepted and contingent liabilities acquired in business combinations are measured at fair value at the time of the acquisition. The interest of non-controlling owners in the acquisition target is recognised on acquisition basis either at fair value or based on their relative share of the identifiable net assets of the acquisition target.
Where the consideration transferred with the non-controlling interest and the fair value
of the previously held interest exceed the fair value of the acquired net assets, the excess is recorded as goodwill on the balance sheet. If the sum of the consideration, the amount of the non-controlling interest and previously held interest is less than the fair value of the acquired net assets, the difference is recorded in the income statement.
All intra-Group transactions, receivables and liabilities and income and expenses are eliminated. Profits and losses due to intra-Group transactions leading to the recognition of an asset are also eliminated. The accounting policies applied by subsidiaries have been revised to match the Group policies, where necessary.
The parent company’s changes of ownership of the subsidiaries, which do not lead to a loss of control, are treated as equity transactions. When shares are purchased from non-controlling shareholders, the difference between the consideration paid and the balance sheet value of the share acquired of the net assets of the subsidiary is recognised in equity. Profit or loss from the sale of shares to non-controlling shareholders is also recognised in equity.
When control or major influence by the Group ceases to exist, any remaining interest is measured at fair value on the date of the loss of control, and the change in balance sheet value is recognised in the income statement. This fair value serves as the original balance sheet value when the remaining interest is later recognised as an associated company, a joint venture or financial assets. In addition, the amounts of said entity previously recognised in other comprehensive income are treated as if the Group had directly disposed of the associated assets and liabilities. This may mean that amounts previously recognised as other comprehensive income are reclassified to the income statement.
ASSOCIATED COMPANIES AND JOINT ARRANGEMENTSAssociates are companies in which the Group holds between 20% and 50% of the voting rights, and in which the Group has significant influence, but which is does not control.
A joint arrangement is an arrangement in which two or more parties have joint control. Investments in joint arrangements are classified as either joint operations or joint ventures, depending on the contractual rights and obligations of each investor. A joint operation is a joint arrangement whereby the parties that have joint control of the arrangement have rights to the assets and obligations for the liabilities related to the arrangement. A joint venture is a joint arrangement whereby the parties that have joint control of the arrangement have rights to the net assets of the arrangement. The Group’s joint arrangements are joint ventures.
Investments in associates and joint ventures are consolidated using the equity method. When using the equity method, the investment is initially recognised at acquisition cost, and this amount is increased or decreased to recognise the investor’s share of the subsequent profits or losses of the investee after the time of acquisition. The Group’s investment in associates and joint ventures includes any goodwill identified on the acquisition.
NOTES TO THE CONSOLIDATED FINANCIAL STATEMENTS, IFRS
71

Front page
Atria in brief
Atria’s key indicators
CEO’s review
Strategy 2021–2025
Strategy 2016–2020
Operating environment
Business area reviews
Atria Finland
Atria Sweden
Atria Denmark & Estonia
Atria Russia
Research and Development
Financial Statements and Corporate Governance
Financial Statements and Corporate Governance
Auditor’s report
Corporate Governance Statement
Investor reporting
Contact information
Atria’s Annual Report 2020
NOTES TO THE CONSOLIDATED FINANCIAL STATEMENTS, IFRS
If the interest in an associate company is reduced, but significant influence is retained, only a proportionate share of the amounts previously recognised in other comprehensive income is reclassified as profit or loss.
The Group’s share of associates’ post-acquisition profits or losses is recognised under operating profit on the income statement. The balance sheet value of the investment is adjusted accordingly. If the Group’s share of the loss of an associate is equal to or exceeds its interest in the associate, including any other unsecured receivables, the Group will not recognise further losses if it does not have a legal or factual obligation to do so, and it has not made payments on behalf of the associate.
FOREIGN CURRENCY TRANSLATIONItems included in the financial statements of each of the Group companies are measured using the currency of the primary economic environment in which the entity operates (‘the functional currency’). The consolidated financial statements are presented in euros (EUR), which is the parent company’s functional currency, and the parent company’s and the Group’s presentation currency.
Foreign currency transactions are translated using the exchange rates prevailing on the date of the transaction. Foreign currency receivables and liabilities are translated using the exchange rate prevailing on the end of the reporting period. Exchange differences arising from translation are recognised in the income statement and presented in the operating profit. Exchange gains and losses from forward exchange agreements protecting financial transactions and foreign currency-denominated loans are included in financial income and expenses, excluding exchange rate changes of derivative financial instruments that are qualifying cash flow hedges. These exchange rate differences have been recognised in other comprehensive income.
The income statements and balance sheet items of the Group companies outside the euro area are accounted for in the currency that is the currency of the operating region of the company in question. The income statements of Group companies outside the euro area are translated into euros at the average exchange rate for the reporting period and the balance sheets at the closing exchange rate. Differences resulting from the translation are recognised as part of translation differences in other comprehensive income. The translation differences arising from the elimination of the acquisition costs of subsidiaries outside the euro area and the hedge profits derived from the corresponding net investments are also recognised in other comprehensive income. When a foreign operation is partially disposed of or sold, exchange rate differences in equity are recognised in the income statement.
Goodwill and fair value adjustments arising on the acquisition of the foreign entity are treated as assets and liabilities of the foreign entity and translated at the closing rate. The exchange differences arising from this are recognised in other comprehensive income.
PROPERTY, PLANT AND EQUIPMENTProperty, plant and equipment are recognised at the cost of purchase or construction less accumulated depreciation and impairment losses.
If the tangible fixed asset consists of several parts with different useful lives, each part is treated as a separate asset. The costs arising from replacing the part are capitalised. Other subsequent expenditure is included in the acquisition cost only if it is probable that the future benefit connected to the asset will benefit the Group, and the acquisition cost of the asset can be reliably determined. All other repair and maintenance costs are recognised in the income statement as an expense as incurred.
Depreciation is recorded using a straight-line method over the estimated useful lives of the assets as follows: • Buildings ..................................................25–50 years • Machinery and equipment .................... 5–30 years• Other tangible assets .............................. 5–10 years
No depreciation is carried out on land and water. Asset items that cannot be recognised under property, plant and equipment due to their nature or depreciation periods are recognised as other tangible assets.
The residual value and useful lives of assets are reviewed annually at the closing of the accounts and, if necessary, adjusted so that the balance sheet value is equal to the recoverable amount.
The depreciation of property, plant and equipment ends when the asset item is classified as available for sale in accordance with IFRS 5 Non-current Assets Held for Sale and Discontinued Operations.
Gains and losses on the disposal or transfer of property, plant or equipment are included in other operating income or expenses.
RIGHT-OF-USE ASSETSThe Group has leased properties, machinery and equipment. The lease contracts are made for a fixed period or are valid until further notice. The contract period for leases valid until further notice is assessed on a case-by-case basis. The contracts may include options to extend the lease.
A right-of-use asset and a corresponding liability is recognised for leases when the leased asset is available for use by the Group. Assets and liabilities arising from leases are initially measured at present value.
72

Front page
Atria in brief
Atria’s key indicators
CEO’s review
Strategy 2021–2025
Strategy 2016–2020
Operating environment
Business area reviews
Atria Finland
Atria Sweden
Atria Denmark & Estonia
Atria Russia
Research and Development
Financial Statements and Corporate Governance
Financial Statements and Corporate Governance
Auditor’s report
Corporate Governance Statement
Investor reporting
Contact information
Atria’s Annual Report 2020
Right-of-use assets are measured at acquisition cost, which includes the following items: • The original amount of the lease liability (see ‘Lease liabilities’ for more information)• Lease payments made before the beginning of the contract less any incentives received • Initial direct costs • Restoration costs.
Lease payments are discounted using the interest rate implicit in the lease. If this interest rate is unknown, the lessee’s incremental borrowing rate will be used. This is the rate that the lessee would have to pay to borrow the necessary funds over a similar term and with a similar security.
Depreciation for right-of-use assets is usually recognised on a straight-line basis over the useful life of the asset, or the lease period if shorter. If it is reasonably certain that the Group will exercise the purchase option, the useful life will be used as the depreciation period for the asset. The company assesses the impairment of right-of-use assets in accordance with IAS 36 Impairment of Assets.
Payments related to short-term leases and leases of low-value assets are recognised as expenses on a straight-line basis. Leases with a term of 12 months or less are considered to be short-term leases. Atria does not apply the IFRS 16 standard to intangible assets in accordance with IAS 38.
INTANGIBLE ASSETSGoodwill:Goodwill represents the Group’s share of the difference between the consideration transferred and the identifiable acquired assets and assumed liabilities measured at fair value on the acquisition date. Goodwill is tested annually for impairment. For this purpose, goodwill has been allocated to cash-generating units. The Group’s cash-generating units are classified based on subsidiaries’ operations and location. These are Atria Finland, Atria Sweden, Atria Denmark, Atria Estonia and Atria Russia. Goodwill is recognised on the balance sheet at cost less impairment losses. An impairment loss recognised for goodwill is not reversed.
Other intangible assets:An Intangible asset is initially capitalised on the balance sheet at cost if the cost can be measured reliably and it is probable that the company will receive future economic benefit from the asset.
Intangible assets with a limited useful life are amortised on a straight-line basis over their estimated useful lives. Intangible assets with indefinite useful lives are not amortised but are tested annually for impairment.
The depreciation periods are as follows:• Customer and supplier relationships ........... 3–8 years • Trademarks .......................................................5–20 years• Other intangible assets*) ................................ 5–10 years
*) Includes software and subscription fees, among other items
IMPAIRMENT OF NON-CURRENT ASSETSOn each balance sheet date, the Group reviews non-current assets for any indications of impairment. If there are such indications, the amount recoverable from the asset is estimated. The amount of cash recoverable from goodwill and intangible assets with indefinite useful lives is assessed annually and whenever there are indications of impairment. The recoverable amount is the higher of the present value of the future cash flows (value in use) and the fair value of the asset less costs of disposal. If the recoverable amount cannot be assessed per item, the impairment need is observed on the level of cash-flow generating units – that is, at the lowest unit level that is mainly independent of other units and at which cash flows can be distinguished from other cash flows.
Impairment loss is recognised if the balance sheet value of the asset is higher than the recoverable amount. Impairment loss is recognised immediately in the income statement. If the impairment loss concerns a cash-generating unit, it is first allocated to reduce the goodwill and then to reduce the other assets of the unit pro rata. The useful life of the depreciated asset is re-evaluated in connection with the recognition of an impairment loss. An impairment loss recognised for an asset other than goodwill is reversed if there has been a change in the estimates used to determine the amount recoverable from the asset. However, the impairment loss may not be reversed in excess of what the asset’s balance sheet value would be without the recognition of the impairment loss. An impairment loss recognised for goodwill is never reversed.
INVENTORIESInventories are measured at cost or probable net realisable value, whichever is lower. The acquisition cost is determined using the average price method. The acquisition cost for finished and unfinished products consists of raw materials, direct labour costs, other direct costs, and the appropriate share of manufacturing-related variable overheads and fixed overheads at a normal level of operations. The net realisable value is the estimated selling price in the ordinary course of business, less the estimated selling expenses.
BIOLOGICAL ASSETS The Group’s biological assets are living animals. They are measured at fair value less estimated sales-related expenses. Productive animals are included in tangible assets and other animals are included in inventories.
NOTES TO THE CONSOLIDATED FINANCIAL STATEMENTS, IFRS
73

Front page
Atria in brief
Atria’s key indicators
CEO’s review
Strategy 2021–2025
Strategy 2016–2020
Operating environment
Business area reviews
Atria Finland
Atria Sweden
Atria Denmark & Estonia
Atria Russia
Research and Development
Financial Statements and Corporate Governance
Financial Statements and Corporate Governance
Auditor’s report
Corporate Governance Statement
Investor reporting
Contact information
Atria’s Annual Report 2020
NOTES TO THE CONSOLIDATED FINANCIAL STATEMENTS, IFRS
The fair value of productive animals has been measured at cost less an expense corresponding to a reduction of value in use caused by ageing. There is no available market price for productive animals. The fair value of slaughter animals is equal to their market price, which is based on the company’s slaughter animal procurement/sales.
FINANCIAL ASSETS
ClassificationIn accordance with IFRS 9 Financial Instruments, the Group’s financial assets are classified in the following categories: financial assets at amortised cost, financial assets at fair value through other comprehensive income and financial assets at fair value through profit or loss. The classification is based on business models used for the management of the financial assets and on the contractual cash flows of the financial assets.
The purchases and sales of financial assets are recognised on the transaction date. Financial assets are classified as non-current assets when they fall due more than 12 months from the closing date. If the financial assets are intended to be kept for less than 12 months, they are classified as current assets. The Group derecognises financial assets when it has lost its right to receive the cash flows, or when it has substantially transferred the risks and rewards of ownership to an external party.
Financial assets recognised at amortised cost:Trade receivables, loan receivables and other receivables recognised at amortised cost are recognised less expected impairment loss. Trade receivables recognised at fair value in other comprehensive income are recognised at fair value. Changes in fair value are recognised in other comprehensive income, excluding impairment losses, which are recognised through profit or loss. Non-current trade receivables and interest-bearing loan receivables are primarily payment time provided to secure the supply of meat raw material and loans to primary production customers. These items are subject to the general impairment model. If there is no significant increase in credit risk, the estimated amount of credit losses is based on the expected credit losses of 12 months and, in other cases, on credit losses expected for the entire lifetime. Atria’s trade receivables from consumer goods customers are short-term and do not include significant financial components. These trade receivables are subject to a simplified method in which the estimated amount of credit losses is based on the expected credit losses over the receivables’ lifetime.
Some trade receivables in the Group are sold to finance companies. The sold trade receivables are derecognised on the balance sheet when the finance company has settled the payment for the receivables and when all material risks and benefits related to the ownership have transferred to the buyer. Trade receivables that may be sold are classified as financial assets recognised at fair value in other comprehensive income.
Equity investments recognised at fair value through other comprehensive income:The ‘other financial assets’ account includes equity investments in other companies (both listed and unlisted shares). The shares are not held for trading. In connection with the original recognition, the Group has made an irreversible selection of their inclusion in this group. Listed shares are recognised at fair value, which is based on their stock market price. Unlisted shares are recognised though valuation methods, or at acquisition price if it essentially corresponds to the fair value. When the shares are disposed of, the balance included in other comprehensive income is reclassified in retained earnings and will not be recognised through profit or loss.
At fair value through profit or loss:Derivatives not subject to hedge accounting are recognised at fair value through profit or loss. Derivatives are initially recognised on the balance sheet at acquisition price, which is equal to their fair value, and later at the fair value of the end date of the review period. Both unrealised and realised profit or loss attributable to changes in the fair value are recognised through profit or loss during the period in which they occur.
Cash and cash equivalents consist of cash, bank deposits withdrawable on demand and other cash. Credit facilities related to Group accounts are included in non-current financial liabilities.
FINANCIAL LIABILITIESThe Group’s loans are classified either in financial liabilities recognised at amortised cost or in financial liabilities recognised at fair value through profit or loss. Financial liabilities are classified as current unless the Group has an absolute right to postpone the payment of the debt to a date at least 12 months from the end date of the review period. Financial liabilities (or parts thereof) are derecognised on the balance sheet only when the debt no longer exists – that is, when the obligation specified in the contract has been fulfilled or revoked, or has expired.
Financial liabilities recognised at amortised cost:Loans taken out by the Group are included in financial liabilities recognised at amortised cost. They are initially recognised at fair value, using the effective interest rate method. Following the initial recognition, loans are recognised at amortised cost. Interest on loans is amortised over the loan’s maturity period through profit or loss, using the effective interest rate method.
Financial liabilities recognised at fair value through profit or loss:Financial liabilities recognised at fair value through profit or loss include derivatives that do not meet the criteria for hedge accounting. Both unrealised and realised profit or loss attributable to changes in the fair value of derivatives are recognised through profit or loss during the period in which they occur.
74
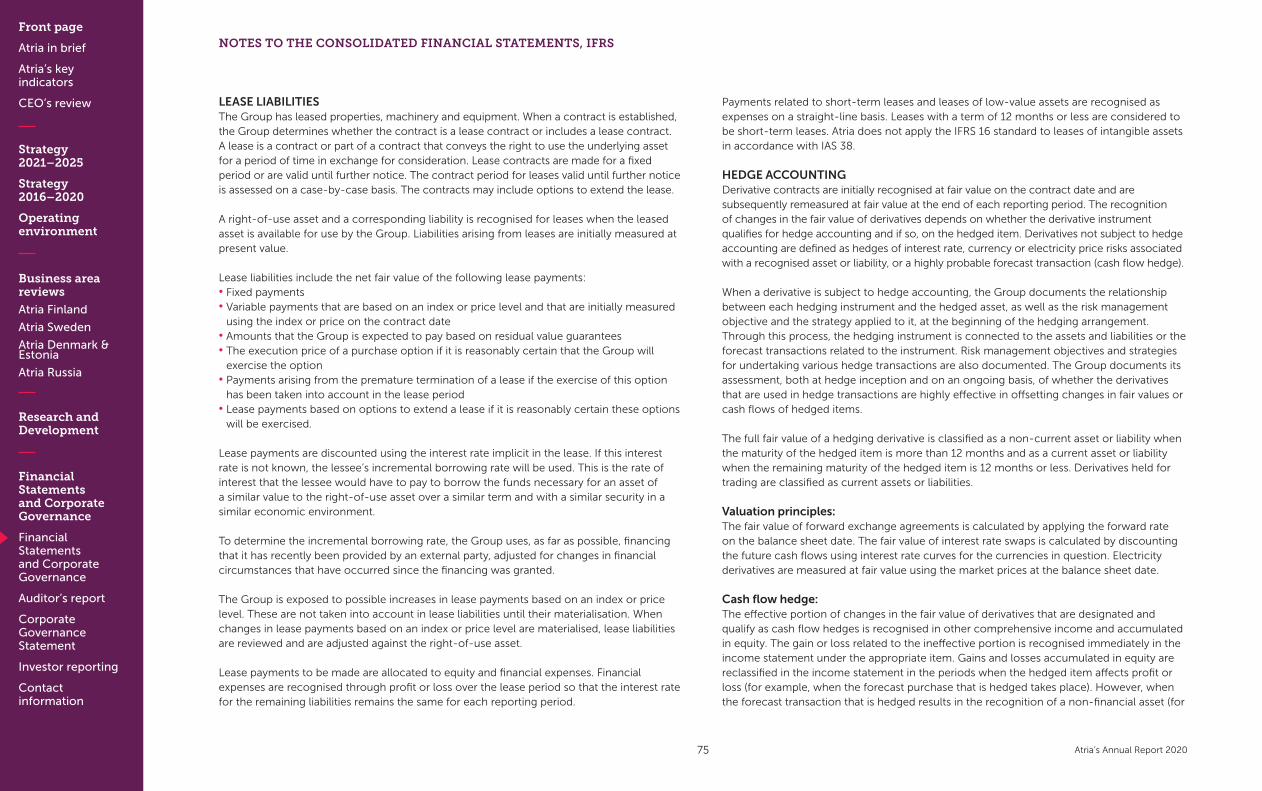
Front page
Atria in brief
Atria’s key indicators
CEO’s review
Strategy 2021–2025
Strategy 2016–2020
Operating environment
Business area reviews
Atria Finland
Atria Sweden
Atria Denmark & Estonia
Atria Russia
Research and Development
Financial Statements and Corporate Governance
Financial Statements and Corporate Governance
Auditor’s report
Corporate Governance Statement
Investor reporting
Contact information
Atria’s Annual Report 2020
LEASE LIABILITIESThe Group has leased properties, machinery and equipment. When a contract is established, the Group determines whether the contract is a lease contract or includes a lease contract. A lease is a contract or part of a contract that conveys the right to use the underlying asset for a period of time in exchange for consideration. Lease contracts are made for a fixed period or are valid until further notice. The contract period for leases valid until further notice is assessed on a case-by-case basis. The contracts may include options to extend the lease.
A right-of-use asset and a corresponding liability is recognised for leases when the leased asset is available for use by the Group. Liabilities arising from leases are initially measured at present value.
Lease liabilities include the net fair value of the following lease payments: • Fixed payments • Variable payments that are based on an index or price level and that are initially measured
using the index or price on the contract date • Amounts that the Group is expected to pay based on residual value guarantees • The execution price of a purchase option if it is reasonably certain that the Group will
exercise the option• Payments arising from the premature termination of a lease if the exercise of this option
has been taken into account in the lease period• Lease payments based on options to extend a lease if it is reasonably certain these options
will be exercised.
Lease payments are discounted using the interest rate implicit in the lease. If this interest rate is not known, the lessee’s incremental borrowing rate will be used. This is the rate of interest that the lessee would have to pay to borrow the funds necessary for an asset of a similar value to the right-of-use asset over a similar term and with a similar security in a similar economic environment.
To determine the incremental borrowing rate, the Group uses, as far as possible, financing that it has recently been provided by an external party, adjusted for changes in financial circumstances that have occurred since the financing was granted.
The Group is exposed to possible increases in lease payments based on an index or price level. These are not taken into account in lease liabilities until their materialisation. When changes in lease payments based on an index or price level are materialised, lease liabilities are reviewed and are adjusted against the right-of-use asset.
Lease payments to be made are allocated to equity and financial expenses. Financial expenses are recognised through profit or loss over the lease period so that the interest rate for the remaining liabilities remains the same for each reporting period.
Payments related to short-term leases and leases of low-value assets are recognised as expenses on a straight-line basis. Leases with a term of 12 months or less are considered to be short-term leases. Atria does not apply the IFRS 16 standard to leases of intangible assets in accordance with IAS 38.
HEDGE ACCOUNTINGDerivative contracts are initially recognised at fair value on the contract date and are subsequently remeasured at fair value at the end of each reporting period. The recognition of changes in the fair value of derivatives depends on whether the derivative instrument qualifies for hedge accounting and if so, on the hedged item. Derivatives not subject to hedge accounting are defined as hedges of interest rate, currency or electricity price risks associated with a recognised asset or liability, or a highly probable forecast transaction (cash flow hedge).
When a derivative is subject to hedge accounting, the Group documents the relationship between each hedging instrument and the hedged asset, as well as the risk management objective and the strategy applied to it, at the beginning of the hedging arrangement.Through this process, the hedging instrument is connected to the assets and liabilities or the forecast transactions related to the instrument. Risk management objectives and strategies for undertaking various hedge transactions are also documented. The Group documents its assessment, both at hedge inception and on an ongoing basis, of whether the derivatives that are used in hedge transactions are highly effective in offsetting changes in fair values or cash flows of hedged items.
The full fair value of a hedging derivative is classified as a non-current asset or liability when the maturity of the hedged item is more than 12 months and as a current asset or liability when the remaining maturity of the hedged item is 12 months or less. Derivatives held for trading are classified as current assets or liabilities.
Valuation principles:The fair value of forward exchange agreements is calculated by applying the forward rate on the balance sheet date. The fair value of interest rate swaps is calculated by discounting the future cash flows using interest rate curves for the currencies in question. Electricity derivatives are measured at fair value using the market prices at the balance sheet date.
Cash flow hedge:The effective portion of changes in the fair value of derivatives that are designated and qualify as cash flow hedges is recognised in other comprehensive income and accumulated in equity. The gain or loss related to the ineffective portion is recognised immediately in the income statement under the appropriate item. Gains and losses accumulated in equity are reclassified in the income statement in the periods when the hedged item affects profit or loss (for example, when the forecast purchase that is hedged takes place). However, when the forecast transaction that is hedged results in the recognition of a non-financial asset (for
NOTES TO THE CONSOLIDATED FINANCIAL STATEMENTS, IFRS
75

Front page
Atria in brief
Atria’s key indicators
CEO’s review
Strategy 2021–2025
Strategy 2016–2020
Operating environment
Business area reviews
Atria Finland
Atria Sweden
Atria Denmark & Estonia
Atria Russia
Research and Development
Financial Statements and Corporate Governance
Financial Statements and Corporate Governance
Auditor’s report
Corporate Governance Statement
Investor reporting
Contact information
Atria’s Annual Report 2020
NOTES TO THE CONSOLIDATED FINANCIAL STATEMENTS, IFRS
example, inventories or fixed assets), the gains and losses previously deferred in equity are transferred from equity and included in the initial acquisition cost of the asset. The deferred amounts are ultimately recognised in costs of goods sold in the case of inventories, or in depreciation in the case of fixed assets. When a hedging instrument expires or is sold, or when a hedge no longer meets the criteria for hedge accounting, any cumulative gain or loss existing in equity at the time remains in equity and is recognised in the income statement only when the forecast transaction occurs. When a forecast transaction is no longer expected to occur, the cumulative gain or loss that was reported in equity is immediately transferred to the income statement under the appropriate item.
ASSETS CLASSIFIED AS HELD FOR SALENon-current assets are classified as held for sale if their balance sheet value is to be recovered through a sale transaction rather than through continuing use. This condition is regarded as having been met only when the sale is highly probable, and the asset is available for immediate sale in its present condition and is subject only to terms that are usual and customary. Furthermore, management must be committed to the sale, which should be expected to occur within one year of the date of classification.
Immediately before being classified as held for sale, these assets are measured in accordance with the applicable IFRS standards. Thereafter, the assets are measured at the lower of their balance sheet value and fair value less cost to sell. These assets are no longer depreciated after the classification.
EQUITYOrdinary shares are presented as share capital. Expenses related to the issue or acquisition of equity instruments are presented as a deductible item under equity.
If a Group company acquires shares in the company, the consideration paid for them and the expenses arising directly from the acquisition, taking into consideration the tax effect, are deducted from the shareholders’ equity until the shares are either cancelled or reissued. If the shares are reissued, the consideration received for them less transaction costs directly attributable to the shares is included in the shareholders’ equity, taking into consideration the tax effect.
PROVISIONS A provision is entered when the Group has a legal or constructive obligation as a result of a past event, and it is probable that an outflow of resources will be required to settle the obligation and the amount of the obligation can be reliably estimated. Provisions are measured at the present value of the expenses required to cover the obligation. The amounts of provisions are reviewed on each balance sheet date and adjusted to correspond to the best estimate at that time. Changes in provisions are recognised in the income statement in the same item in which the original provision was entered.
REVENUE RECOGNITIONAtria sells food products, animal feed, traded animals and services. Sales revenue is recognised based on customer contracts. The contracts specify the contractual obligations and the prices applicable to them. Atria does not have consolidated contractual obligations or obligations to be met over time, advance payments or warranty obligations.
Atria recognises both the revenue and the receivable when control over the goods or service is transferred to the customer. Delivery usually takes place in Finland within 24 hours, and control and risks are transferred in connection with delivery. In export deals, the company estimates the time when control transfers to the customer specific to each delivery in accordance with the terms and time of delivery. Sales prices are not adjusted for the time value of money, because the period between the handover of the products and the payment made by the customer is less than a year. Atria always allocates discounts, as well as any refunds following the sale, to the month of delivery, taking the customers’ full-year volume into account.
In the recognition of sales revenue, Atria has identified two customer groups: consumer goods customers and primary production customers. Atria presents sales divided into these two revenue streams as part of the segment information in Note 1 and the division of receivables in Note 20. Atria considers these two customer groups to be the most material in terms of understanding the nature of sales revenue and cash flow arising from customer contracts. Most contracts with customers concern the sale of consumer products. Consumer goods customers are primarily central wholesale businesses. In addition, Atria sells traded animals and animal feed to primary production customers.
EMPLOYEE BENEFITS
Pension obligations: The Group companies have various local pension arrangements in their countries of operation. Pension arrangements are classified as either defined contribution plans or defined benefit pension plans.
In defined contribution plans, the Group makes fixed payments into a separate unit. The Group has no legal or constructive obligation to make additional payments if the recipient of the payments cannot pay the pension benefits in question. All plans that do not fulfil these conditions are defined benefit pension plans.
Payments made into defined contribution plans are recognised in the income statement in the reporting period to which they apply. The Group’s pension plans are mainly defined contribution plans. In defined benefit plans the company still has an ongoing obligation for the plan even after the payment for the period has been made. For arrangements classified
76
Front page
Atria in brief
Atria’s key indicators
CEO’s review
Strategy 2021–2025
Strategy 2016–2020
Operating environment
Business area reviews
Atria Finland
Atria Sweden
Atria Denmark & Estonia
Atria Russia
Research and Development
Financial Statements and Corporate Governance
Financial Statements and Corporate Governance
Auditor’s report
Corporate Governance Statement
Investor reporting
Contact information
Atria’s Annual Report 2020
as defined benefit plans, actuarial estimates acquired on a yearly basis serve as the grounds for recognising an expense and liability or asset in the financial statements. Actuarial gains or losses are recognised as equity refunds or a charge in other comprehensive income in the financial period in which they occur.
Share-based payments:The Group has an incentive programme for the management where the payments are made in part as company shares and in part as cash. The remuneration awarded under the programme is measured at fair value at the time of awarding, and recognised in the income statement as an expense arising from employee benefits spread over the earning and engagement period. The amount of money paid in the arrangement is remeasured using the review period’s closing share price and recognised in the income statement as an expense from employee benefits spread over from the day of awarding until the money is transferred to the recipient. The final amount of the expense depends on the extent to which the conditions of the incentive programme are met.
RESEARCH AND DEVELOPMENT EXPENSESResearch expenditure is recognised as an expense in the income statement. Expenditure related to individual projects is capitalised on the balance sheet when there is enough certainty that the product in question is technically viable and that the product is likely to generate future economic benefits. Capitalised development expenditure is recognised in project-specific expenses over the useful life of the product. The asset is amortised from the time it is ready for use. The Group has no capitalised development expenses.
GOVERNMENT GRANTSGrants received as compensation for expenses are recognised in the income statement, while expenses connected with the grant are entered as costs. Such grants are recognised under other operating income. The nature of the grants varies between countries, and the grants are only recognised after all the terms and conditions of the grant have been met, so the company does not have a repayment obligation arising from grants received.
Government grants – such as grants received for the acquisition of property, plant and equipment – are recognised as a deduction in the balance sheet value of property, plant and equipment when it is reasonably certain that the grant will be received and that the Group company fulfils the prerequisites for receiving the grant. Grants are recognised as income in the form of lower depreciation during the useful life of the asset.
INCOME TAXESThe consolidated income statement includes the current taxes of Group companies based on taxable profit for the financial period in line with local tax regulations, as well as adjustments to previous years’ taxes and changes in deferred taxes. Taxes are entered in the income statement unless they are related to other comprehensive income or items
recognised directly in equity. In such cases, the tax is also entered in other comprehensive income or directly in equity. Taxes based on taxable profit for the financial year are calculated using the current tax rate in each country.
Deferred taxes are recognised for all temporary differences between the balance sheet value and the tax base. The largest temporary differences arise from the depreciation of property, plants and equipment, and fair value measurements in connection with acquisitions. No deferred tax is recognised for non-deductible goodwill impairment, and no deferred tax is recognised for the undistributed profits of subsidiaries if the difference is unlikely to dissolve in the foreseeable future.
Deferred tax is calculated using the tax rates provided on the balance sheet date. Deferred tax assets are recognised to the amount for which it is likely that taxable profit will be generated in the future against which the temporary difference can be utilised. Deferred tax assets are recognised for confirmed losses made by Group companies to the extent in which it is likely that the assets can be utilised to offset future taxable profits.
NOTES TO THE CONSOLIDATED FINANCIAL STATEMENTS, IFRS
77
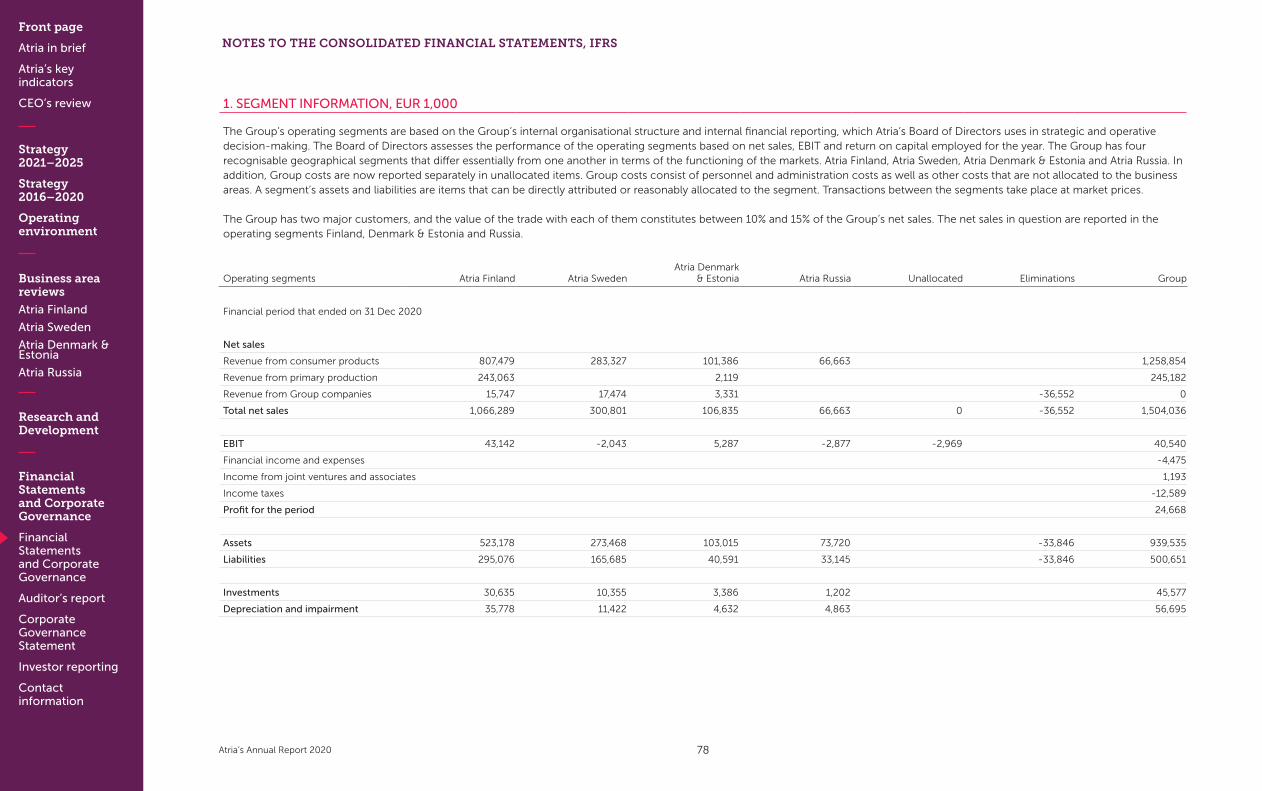
Front page
Atria in brief
Atria’s key indicators
CEO’s review
Strategy 2021–2025
Strategy 2016–2020
Operating environment
Business area reviews
Atria Finland
Atria Sweden
Atria Denmark & Estonia
Atria Russia
Research and Development
Financial Statements and Corporate Governance
Financial Statements and Corporate Governance
Auditor’s report
Corporate Governance Statement
Investor reporting
Contact information
Atria’s Annual Report 2020
NOTES TO THE CONSOLIDATED FINANCIAL STATEMENTS, IFRS
1. SEGMENT INFORMATION, EUR 1,000
The Group’s operating segments are based on the Group’s internal organisational structure and internal financial reporting, which Atria’s Board of Directors uses in strategic and operative decision-making. The Board of Directors assesses the performance of the operating segments based on net sales, EBIT and return on capital employed for the year. The Group has four recognisable geographical segments that differ essentially from one another in terms of the functioning of the markets. Atria Finland, Atria Sweden, Atria Denmark & Estonia and Atria Russia. In addition, Group costs are now reported separately in unallocated items. Group costs consist of personnel and administration costs as well as other costs that are not allocated to the business areas. A segment’s assets and liabilities are items that can be directly attributed or reasonably allocated to the segment. Transactions between the segments take place at market prices.
The Group has two major customers, and the value of the trade with each of them constitutes between 10% and 15% of the Group’s net sales. The net sales in question are reported in the operating segments Finland, Denmark & Estonia and Russia.
Operating segments Atria Finland Atria SwedenAtria Denmark
& Estonia Atria Russia Unallocated Eliminations Group
Financial period that ended on 31 Dec 2020
Net sales
Revenue from consumer products 807,479 283,327 101,386 66,663 1,258,854
Revenue from primary production 243,063 2,119 245,182
Revenue from Group companies 15,747 17,474 3,331 -36,552 0
Total net sales 1,066,289 300,801 106,835 66,663 0 -36,552 1,504,036
EBIT 43,142 -2,043 5,287 -2,877 -2,969 40,540
Financial income and expenses -4,475
Income from joint ventures and associates 1,193
Income taxes -12,589
Profit for the period 24,668
Assets 523,178 273,468 103,015 73,720 -33,846 939,535
Liabilities 295,076 165,685 40,591 33,145 -33,846 500,651
Investments 30,635 10,355 3,386 1,202 45,577
Depreciation and impairment 35,778 11,422 4,632 4,863 56,695
78

Front page
Atria in brief
Atria’s key indicators
CEO’s review
Strategy 2021–2025
Strategy 2016–2020
Operating environment
Business area reviews
Atria Finland
Atria Sweden
Atria Denmark & Estonia
Atria Russia
Research and Development
Financial Statements and Corporate Governance
Financial Statements and Corporate Governance
Auditor’s report
Corporate Governance Statement
Investor reporting
Contact information
Atria’s Annual Report 2020
1. SEGMENT INFORMATION, EUR 1,000
Operating segments Atria Finland Atria SwedenAtria Denmark
& Estonia Atria Russia Unallocated Eliminations Group
Financial period that ended on 31 Dec 2019
Net sales
Revenue from consumer products 774,266 271,891 90,876 73,829 1,210,862
Revenue from primary production 238,188 2,223 240,411
Revenue from Group companies 21,364 17,481 3,480 -42,325 0
Total net sales 1,033,818 289,372 96,579 73,829 0 -42,325 1,451,273
EBIT 40,006 -6,142 4,353 -4,049 -3,055 31,113
Financial income and expenses -5,555
Income from joint ventures and associates 625
Income taxes -9,223
Profit for the period 16,960
Assets 502,528 264,569 106,906 68,456 -13,765 928,694
Liabilities 255,281 167,416 47,596 37,870 -13,765 494,398
Investments 21,752 13,281 2,915 2,161 40,109
Depreciation and impairment 33,899 11,360 4,282 4,719 54,260
2. NET SALES, EUR 1,000 2020 2019
Sale of goods 1,496,457 1,443,662
Services, rents and other sales 7,579 7,611
Total 1,504,036 1,451,273
In the recognition of sales revenue, Atria has identified two customer groups: consumer goods customers and primary production customers. Atria presents sales divided into these two revenue streams as part of the segment information in Note 1 and the division of receivables in Note 20.
3. RESEARCH AND DEVELOPMENT EXPENSES, EUR 1,000 2020 2019
Research and development costs recognised as expenditure 15,002 15,261
% of net sales 1.0 1.1
NOTES TO THE CONSOLIDATED FINANCIAL STATEMENTS, IFRS
79

Front page
Atria in brief
Atria’s key indicators
CEO’s review
Strategy 2021–2025
Strategy 2016–2020
Operating environment
Business area reviews
Atria Finland
Atria Sweden
Atria Denmark & Estonia
Atria Russia
Research and Development
Financial Statements and Corporate Governance
Financial Statements and Corporate Governance
Auditor’s report
Corporate Governance Statement
Investor reporting
Contact information
Atria’s Annual Report 2020
NOTES TO THE CONSOLIDATED FINANCIAL STATEMENTS, IFRS
4. REMUNERATIONS PAID TO AUDITORS, EUR 1,000 2020 2019
Firm of authorised public accountants:
Auditing fees 322 328
Reports and statements 5 7
Other services 8
Total 327 343
5. OTHER OPERATING INCOME, EUR 1,000 2020 2019
Proceeds from sales of fixed assets 207 93
Grants received 180
Other 3,019 2,974
Total 3,226 3,247
6. OTHER OPERATING EXPENSES, EUR 1,000 2020 2019
Depreciation and impairment*) 4,346 3,553
Other**) 794 1,796
Total 5,140 5,349
*) In 2020, Atria Russia recognised a EUR 0.8 million impairment on a brand.**) The figure for 2019 includes EUR 1.4 million in costs arising from efficiency measures at Atria Sweden.
7. PERSONNEL EXPENSES, EUR 1,000 2020 2019
Expenses from employee benefits:
Salaries 199,148 194,600
Pension costs - defined-contribution plans 25,294 27,911
Pension costs - defined-benefit plans 194 195
Other staff-related expenses 23,294 22,488
Total 247,931 245,194
Due to the COVID-19 pandemic, employers were given a discount of 2.6% on their TyEL contributions during the period from 1 May to 31 December 2020. The discount’s impact on the financial period was around EUR 2.4 million. In Sweden, the state has reimbursed some of the salary costs and social security contributions for sick leaves caused by the coronavirus from 1 March to 31 December 2020. The amount of the reimbursed costs is approximately EUR 0.6 million. Information on employee benefits for managerial employees is presented in note 31.
Expenses from employee benefits by function:
Costs of goods sold 193,971 192,266
Sales and marketing expenses 29,485 30,492
Administrative expenses 24,475 22,436
Total 247,931 245,194
Group personnel on average by business area (FTE):
Finland 2,398 2,333
Sweden 814 840
Denmark & Estonia 439 435
Russia 793 846
Total 4,444 4,454
8. DEPRECIATION AND IMPAIRMENT, EUR 1,000 2020 2019
Depreciation and write-offs by function:
Costs of goods sold 44,136 42,579
Sales and marketing expenses 2,994 2,835
Administrative expenses 5,219 5,293
Other operating expenses (Note 6) *) 4,346 3,553
Total 56,695 54,260
*) Includes EUR 0.8 million impairment on a brand.
9. FINANCIAL INCOME AND EXPENSES, EUR 1,000 2020 2019
Financial income:
Interest income from financial assets measured at amortised cost 1,542 1,790
Exchange rate gains from financial liabilities and loan receivables measured at amortised cost 7,168 5,152
Changes in the value of financial assets recognised at fair value through profit or loss
- Derivative financial instruments - not in hedge accounting 7,957 4,335
Other financial income 15
Total 16,682 11,277
Financial expenses:
Interest expenses from financial liabilities measured at amortised cost -4,116 -4,394
Interest expenses from lease liabilities (Notes 14, 25) -642 -666
Exchange rate losses from financial liabilities and loan receivables measured at amortised cost -5,335 -4,727
80
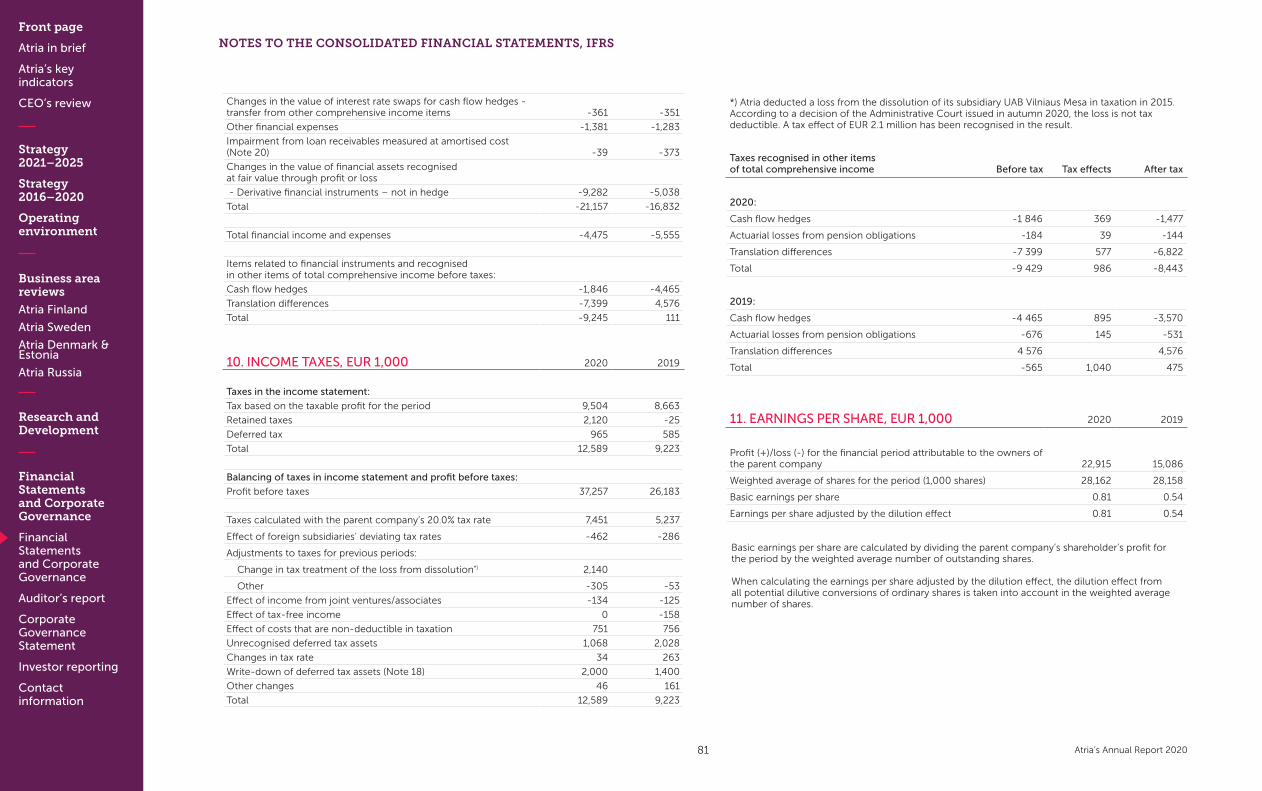
Front page
Atria in brief
Atria’s key indicators
CEO’s review
Strategy 2021–2025
Strategy 2016–2020
Operating environment
Business area reviews
Atria Finland
Atria Sweden
Atria Denmark & Estonia
Atria Russia
Research and Development
Financial Statements and Corporate Governance
Financial Statements and Corporate Governance
Auditor’s report
Corporate Governance Statement
Investor reporting
Contact information
Atria’s Annual Report 2020
Changes in the value of interest rate swaps for cash flow hedges - transfer from other comprehensive income items -361 -351
Other financial expenses -1,381 -1,283
Impairment from loan receivables measured at amortised cost (Note 20) -39 -373
Changes in the value of financial assets recognisedat fair value through profit or loss
- Derivative financial instruments – not in hedge -9,282 -5,038
Total -21,157 -16,832
Total financial income and expenses -4,475 -5,555
Items related to financial instruments and recognisedin other items of total comprehensive income before taxes:
Cash flow hedges -1,846 -4,465
Translation differences -7,399 4,576
Total -9,245 111
10. INCOME TAXES, EUR 1,000 2020 2019
Taxes in the income statement:
Tax based on the taxable profit for the period 9,504 8,663
Retained taxes 2,120 -25
Deferred tax 965 585
Total 12,589 9,223
Balancing of taxes in income statement and profit before taxes:
Profit before taxes 37,257 26,183
Taxes calculated with the parent company’s 20.0% tax rate 7,451 5,237
Effect of foreign subsidiaries’ deviating tax rates -462 -286
Adjustments to taxes for previous periods:
Change in tax treatment of the loss from dissolution*) 2,140
Other -305 -53
Effect of income from joint ventures/associates -134 -125
Effect of tax-free income 0 -158
Effect of costs that are non-deductible in taxation 751 756
Unrecognised deferred tax assets 1,068 2,028
Changes in tax rate 34 263
Write-down of deferred tax assets (Note 18) 2,000 1,400
Other changes 46 161
Total 12,589 9,223
*) Atria deducted a loss from the dissolution of its subsidiary UAB Vilniaus Mesa in taxation in 2015. According to a decision of the Administrative Court issued in autumn 2020, the loss is not tax deductible. A tax effect of EUR 2.1 million has been recognised in the result.
Taxes recognised in other items of total comprehensive income Before tax Tax effects After tax
2020:
Cash flow hedges -1 846 369 -1,477
Actuarial losses from pension obligations -184 39 -144
Translation differences -7 399 577 -6,822
Total -9 429 986 -8,443
2019:
Cash flow hedges -4 465 895 -3,570
Actuarial losses from pension obligations -676 145 -531
Translation differences 4 576 4,576
Total -565 1,040 475
11. EARNINGS PER SHARE, EUR 1,000 2020 2019
Profit (+)/loss (-) for the financial period attributable to the owners of the parent company 22,915 15,086
Weighted average of shares for the period (1,000 shares) 28,162 28,158
Basic earnings per share 0.81 0.54
Earnings per share adjusted by the dilution effect 0.81 0.54
Basic earnings per share are calculated by dividing the parent company’s shareholder’s profit for the period by the weighted average number of outstanding shares. When calculating the earnings per share adjusted by the dilution effect, the dilution effect from all potential dilutive conversions of ordinary shares is taken into account in the weighted average number of shares.
NOTES TO THE CONSOLIDATED FINANCIAL STATEMENTS, IFRS
81
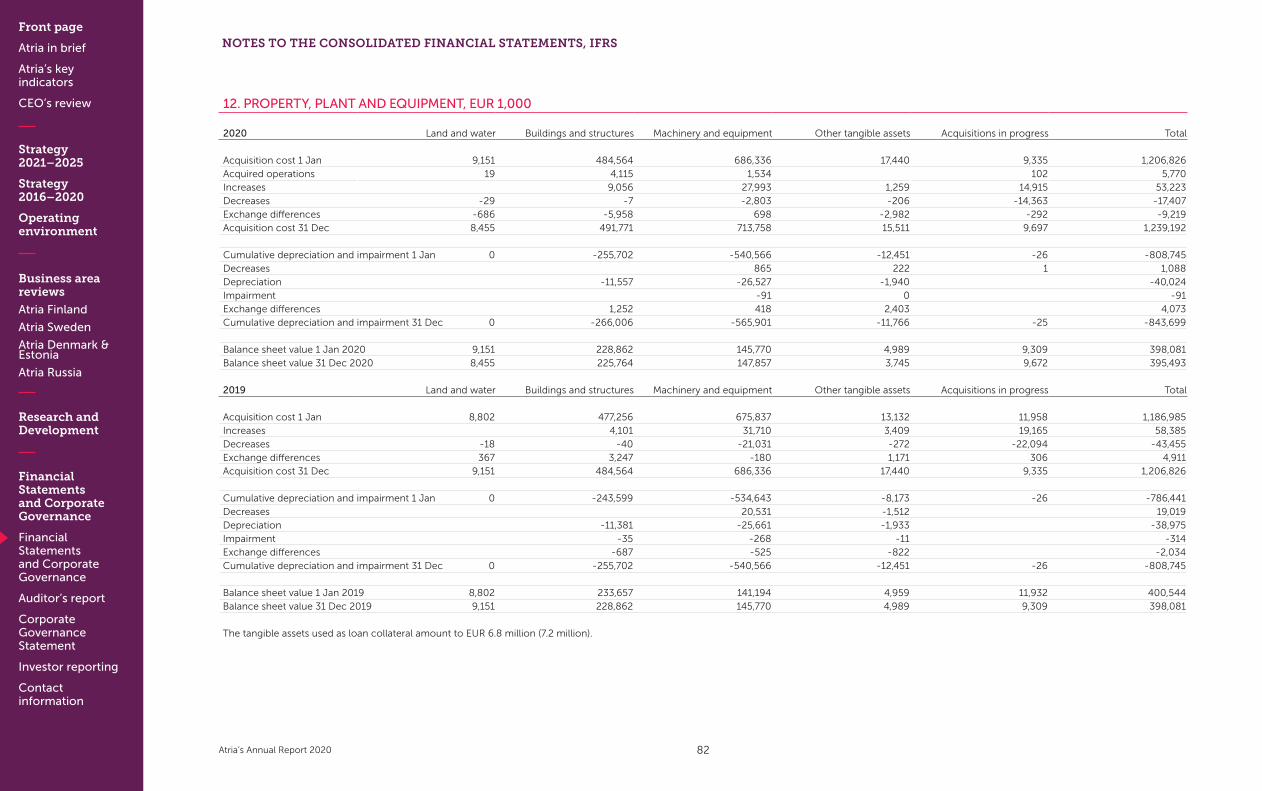
Front page
Atria in brief
Atria’s key indicators
CEO’s review
Strategy 2021–2025
Strategy 2016–2020
Operating environment
Business area reviews
Atria Finland
Atria Sweden
Atria Denmark & Estonia
Atria Russia
Research and Development
Financial Statements and Corporate Governance
Financial Statements and Corporate Governance
Auditor’s report
Corporate Governance Statement
Investor reporting
Contact information
Atria’s Annual Report 2020
NOTES TO THE CONSOLIDATED FINANCIAL STATEMENTS, IFRS
12. PROPERTY, PLANT AND EQUIPMENT, EUR 1,000
2020 Land and water Buildings and structures Machinery and equipment Other tangible assets Acquisitions in progress Total
Acquisition cost 1 Jan 9,151 484,564 686,336 17,440 9,335 1,206,826Acquired operations 19 4,115 1,534 102 5,770Increases 9,056 27,993 1,259 14,915 53,223Decreases -29 -7 -2,803 -206 -14,363 -17,407Exchange differences -686 -5,958 698 -2,982 -292 -9,219Acquisition cost 31 Dec 8,455 491,771 713,758 15,511 9,697 1,239,192
Cumulative depreciation and impairment 1 Jan 0 -255,702 -540,566 -12,451 -26 -808,745Decreases 865 222 1 1,088Depreciation -11,557 -26,527 -1,940 -40,024Impairment -91 0 -91Exchange differences 1,252 418 2,403 4,073Cumulative depreciation and impairment 31 Dec 0 -266,006 -565,901 -11,766 -25 -843,699
Balance sheet value 1 Jan 2020 9,151 228,862 145,770 4,989 9,309 398,081Balance sheet value 31 Dec 2020 8,455 225,764 147,857 3,745 9,672 395,493
2019 Land and water Buildings and structures Machinery and equipment Other tangible assets Acquisitions in progress Total
Acquisition cost 1 Jan 8,802 477,256 675,837 13,132 11,958 1,186,985Increases 4,101 31,710 3,409 19,165 58,385Decreases -18 -40 -21,031 -272 -22,094 -43,455Exchange differences 367 3,247 -180 1,171 306 4,911Acquisition cost 31 Dec 9,151 484,564 686,336 17,440 9,335 1,206,826
Cumulative depreciation and impairment 1 Jan 0 -243,599 -534,643 -8,173 -26 -786,441Decreases 20,531 -1,512 19,019Depreciation -11,381 -25,661 -1,933 -38,975Impairment -35 -268 -11 -314Exchange differences -687 -525 -822 -2,034Cumulative depreciation and impairment 31 Dec 0 -255,702 -540,566 -12,451 -26 -808,745
Balance sheet value 1 Jan 2019 8,802 233,657 141,194 4,959 11,932 400,544Balance sheet value 31 Dec 2019 9,151 228,862 145,770 4,989 9,309 398,081
The tangible assets used as loan collateral amount to EUR 6.8 million (7.2 million).
82
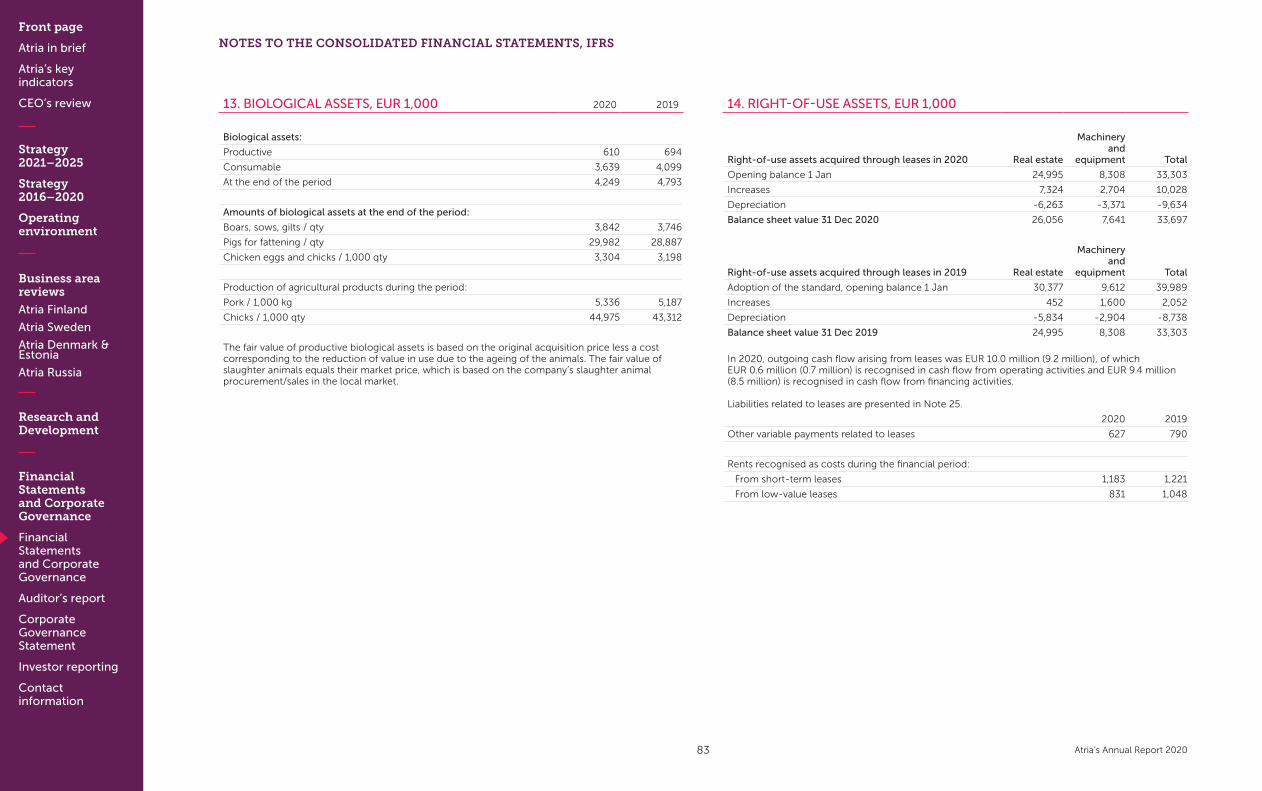
Front page
Atria in brief
Atria’s key indicators
CEO’s review
Strategy 2021–2025
Strategy 2016–2020
Operating environment
Business area reviews
Atria Finland
Atria Sweden
Atria Denmark & Estonia
Atria Russia
Research and Development
Financial Statements and Corporate Governance
Financial Statements and Corporate Governance
Auditor’s report
Corporate Governance Statement
Investor reporting
Contact information
Atria’s Annual Report 2020
13. BIOLOGICAL ASSETS, EUR 1,000 2020 2019
Biological assets:
Productive 610 694
Consumable 3,639 4,099
At the end of the period 4,249 4,793
Amounts of biological assets at the end of the period:
Boars, sows, gilts / qty 3,842 3,746
Pigs for fattening / qty 29,982 28,887
Chicken eggs and chicks / 1,000 qty 3,304 3,198
Production of agricultural products during the period:
Pork / 1,000 kg 5,336 5,187
Chicks / 1,000 qty 44,975 43,312
The fair value of productive biological assets is based on the original acquisition price less a cost corresponding to the reduction of value in use due to the ageing of the animals. The fair value of slaughter animals equals their market price, which is based on the company’s slaughter animal procurement/sales in the local market.
14. RIGHT-OF-USE ASSETS, EUR 1,000
Right-of-use assets acquired through leases in 2020 Real estate
Machinery and
equipment Total
Opening balance 1 Jan 24,995 8,308 33,303
Increases 7,324 2,704 10,028
Depreciation -6,263 -3,371 -9,634
Balance sheet value 31 Dec 2020 26,056 7,641 33,697
Right-of-use assets acquired through leases in 2019 Real estate
Machinery and
equipment Total
Adoption of the standard, opening balance 1 Jan 30,377 9,612 39,989
Increases 452 1,600 2,052
Depreciation -5,834 -2,904 -8,738
Balance sheet value 31 Dec 2019 24,995 8,308 33,303
In 2020, outgoing cash flow arising from leases was EUR 10.0 million (9.2 million), of which EUR 0.6 million (0.7 million) is recognised in cash flow from operating activities and EUR 9.4 million (8.5 million) is recognised in cash flow from financing activities. Liabilities related to leases are presented in Note 25.
2020 2019
Other variable payments related to leases 627 790
Rents recognised as costs during the financial period:
From short-term leases 1,183 1,221
From low-value leases 831 1,048
NOTES TO THE CONSOLIDATED FINANCIAL STATEMENTS, IFRS
83
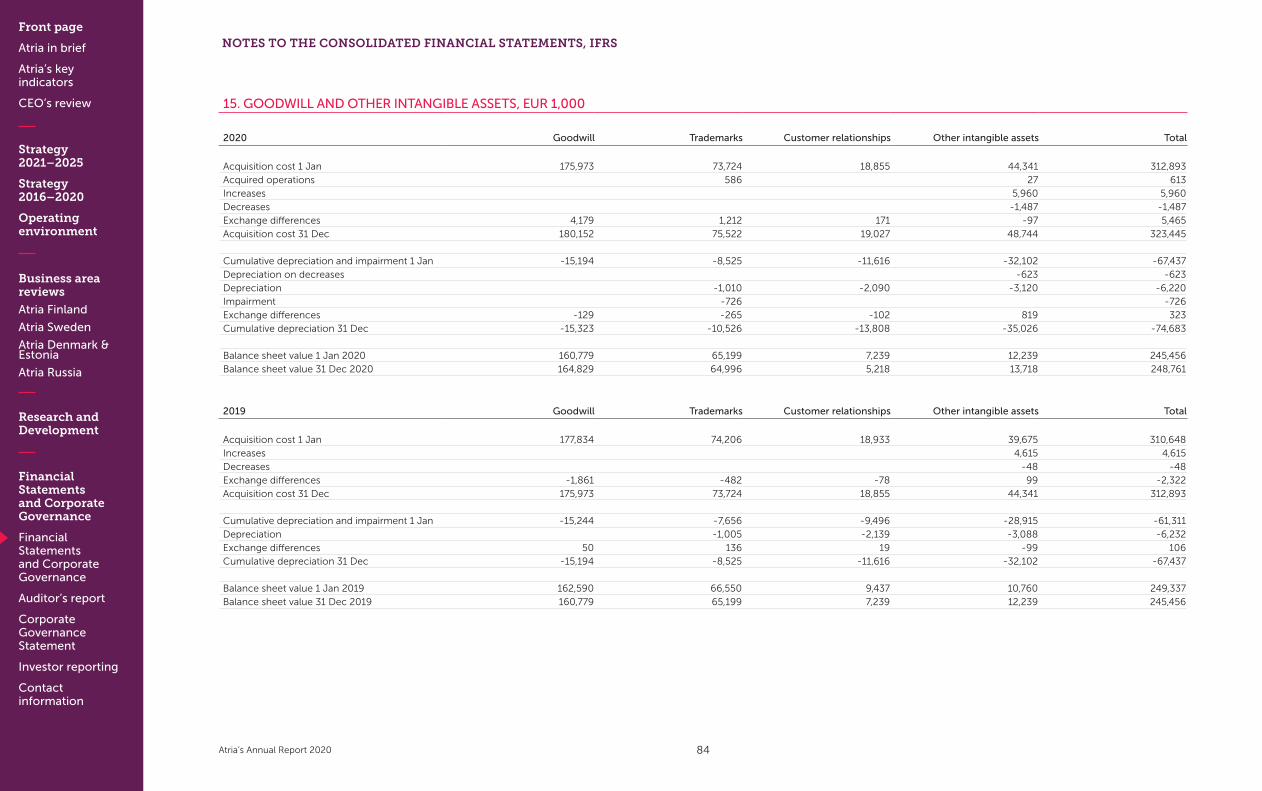
Front page
Atria in brief
Atria’s key indicators
CEO’s review
Strategy 2021–2025
Strategy 2016–2020
Operating environment
Business area reviews
Atria Finland
Atria Sweden
Atria Denmark & Estonia
Atria Russia
Research and Development
Financial Statements and Corporate Governance
Financial Statements and Corporate Governance
Auditor’s report
Corporate Governance Statement
Investor reporting
Contact information
Atria’s Annual Report 2020
NOTES TO THE CONSOLIDATED FINANCIAL STATEMENTS, IFRS
15. GOODWILL AND OTHER INTANGIBLE ASSETS, EUR 1,000
2020 Goodwill Trademarks Customer relationships Other intangible assets Total
Acquisition cost 1 Jan 175,973 73,724 18,855 44,341 312,893Acquired operations 586 27 613Increases 5,960 5,960Decreases -1,487 -1,487Exchange differences 4,179 1,212 171 -97 5,465Acquisition cost 31 Dec 180,152 75,522 19,027 48,744 323,445
Cumulative depreciation and impairment 1 Jan -15,194 -8,525 -11,616 -32,102 -67,437Depreciation on decreases -623 -623Depreciation -1,010 -2,090 -3,120 -6,220Impairment -726 -726Exchange differences -129 -265 -102 819 323Cumulative depreciation 31 Dec -15,323 -10,526 -13,808 -35,026 -74,683
Balance sheet value 1 Jan 2020 160,779 65,199 7,239 12,239 245,456Balance sheet value 31 Dec 2020 164,829 64,996 5,218 13,718 248,761
2019 Goodwill Trademarks Customer relationships Other intangible assets Total
Acquisition cost 1 Jan 177,834 74,206 18,933 39,675 310,648Increases 4,615 4,615Decreases -48 -48Exchange differences -1,861 -482 -78 99 -2,322Acquisition cost 31 Dec 175,973 73,724 18,855 44,341 312,893
Cumulative depreciation and impairment 1 Jan -15,244 -7,656 -9,496 -28,915 -61,311Depreciation -1,005 -2,139 -3,088 -6,232Exchange differences 50 136 19 -99 106Cumulative depreciation 31 Dec -15,194 -8,525 -11,616 -32,102 -67,437
Balance sheet value 1 Jan 2019 162,590 66,550 9,437 10,760 249,337Balance sheet value 31 Dec 2019 160,779 65,199 7,239 12,239 245,456
84

Front page
Atria in brief
Atria’s key indicators
CEO’s review
Strategy 2021–2025
Strategy 2016–2020
Operating environment
Business area reviews
Atria Finland
Atria Sweden
Atria Denmark & Estonia
Atria Russia
Research and Development
Financial Statements and Corporate Governance
Financial Statements and Corporate Governance
Auditor’s report
Corporate Governance Statement
Investor reporting
Contact information
Atria’s Annual Report 2020
Goodwill and intangible assets with indefinite useful lives are allocated to the Group’s cash-generating units as follows:
Goodwill Trademarks2020 2019 2020 2019
Atria Finland 28,436 28,438 2,500 2,500Atria Sweden 100,542 96,637 35,080 33,695Atria Denmark 35,851 35,704 13,332 13,277Atria Estonia 2,857 2,857Atria Russia 1,686 3,062Total 164,829 160,779 55,455 55,391
Impairment testing:
Key assumptions for 2020 Atria Finland Atria Sweden Atria Denmark Atria Estonia Atria Russia brand
Long-term net sales growth rate 1.0% 1.0% 1.0% 1.0% 2.5%Discount rate defined before taxes 4.0% 5.8% 3.9% 3.3% 11.6%*)
Key assumptions for 2019 Atria Finland Atria Sweden Atria Denmark Atria Estonia Atria Russia brand
Long-term net sales growth rate 1.0% 1.0% 1.0% 1.0% 2.5%Discount rate defined before taxes 4.3% 4.9% 3.7% 3.9% 12.7%*)
*) After tax
The recoverable amount of a cash-generating unit is defined on the basis of value-in-use calculations. These calculations, which use cash flow forecasts based on management-approved budgets and strategic targets, are defined before taxes and extend over a five-year period. Cash flows after this period are extrapolated using the growth rates presented above.
The most important assumptions used in Atria’s impairment testing for cash flow forecasts are growth in net sales and long-term EBIT margin. The growth and profitability assumptions used are based on the net sales growth rates and profitability levels that business areas will experience in the near future. EBIT margins are expected to be close to the Group’s targeted level of 5%.
Growth rate assumptions are moderate in all market areas. Russia’s higher growth projection is due to its higher inflation and the relatively high growth projection for meat consumption. Due to the relatively stable development of the food industry and moderately optimistic growth forecasts, it is unlikely that the growth rate assumptions will generate impairment losses in the future.
As regards EBIT margins, impairment losses must be recognised in Atria Sweden, provided that the long-term level remains below 19% of the assumed level. The same applies to Atria Denmark, if the long-term level remains below 32%. Discount rates would give rise to impairment losses (all cash flow forecasts being equal) if they increased by 0.9 percentage points in Sweden and by 1.2 percentage points in Denmark. Clearly higher discount rates would mean that the market situation has changed and that the change could also affect Atria’s cash flows. Therefore, the aforementioned increases in discount rates do not directly mean that there would be a need for impairment. It is the company’s view that no potential change to be expected would result in the recognition of an impairment in Atria Finland or Atria Estonia.
A separate test was conducted on a brand with an indefinite useful life for Atria Russia. The brand’s sales have declined and expectations with regard to the recovery of sales are cautious. An impairment of EUR 0.8 million was recognised on the brand. At the end of the financial period, the brand’s value was EUR 1.7 million. Any deterioration in sales expectations or an increase in the discount rate would result in new impairments.
NOTES TO THE CONSOLIDATED FINANCIAL STATEMENTS, IFRS
85

Front page
Atria in brief
Atria’s key indicators
CEO’s review
Strategy 2021–2025
Strategy 2016–2020
Operating environment
Business area reviews
Atria Finland
Atria Sweden
Atria Denmark & Estonia
Atria Russia
Research and Development
Financial Statements and Corporate Governance
Financial Statements and Corporate Governance
Auditor’s report
Corporate Governance Statement
Investor reporting
Contact information
Atria’s Annual Report 2020
NOTES TO THE CONSOLIDATED FINANCIAL STATEMENTS, IFRS
16. INVESTMENTS IN JOINT VENTURES AND ASSOCIATES, EUR 1,000 2020 2019
Effect on the Group’s earnings
Associates 28 154
Joint ventures 1,165 471
Total 1,193 625
Balance sheet values in the consolidated statement of financial position
Associates 2,836 4,175
Joint ventures 11,643 10,861
Total 14,479 15,036
Material investment in a joint venture: 2020 2019
Honkajoki Oy is a recycling facility for animal-based raw materials in Honkajoki, Finland. The company has four subsidiaries: Findest Protein Oy, GMM Finland Oy, Honkaleather Oy and Remsoil Oy. Atria Plc owns 50% of the company and exercises joint control in it with HKScan Finland. Honkajoki Group’s figures, which are reported according to the Finnish Accounting Standards (FAS), have been consolidated using the equity method.
Summary of Honkajoki Group’s results:
Net sales 42,332 40,312
EBIT 3,279 1,374
Profit before taxes 3,036 1,152
Profit for the period 2,427 880
Summary of Honkajoki Group’s balance sheet:
Assets
Non-current assets 26,667 27,101
Current assets 14,381 9,057
Total assets 41,048 36,157
Liabilities
Non-current liabilities 10,885 7,683
Current liabilities 7,490 7,326
Total liabilities 18,376 15,009
Net assets 22,672 21,148
Reconciliation of the summary of financial information for Honkajoki Group:
Profit for the period 2,427 880
share of non-controlling interest -8 -3
Income from joint venture (50%) 1,209 438
Net assets 1 Jan 21,148 20,270
Profit for the period 2,427 880
Other changes -138 -2
Dividend distribution -765
Net assets 1 Jan 22,672 21,148
share of non-controlling interest 230 222
Share of joint venture (50%) 11,221 10,463
Non-material investments in joint ventures: 2020 2019
Balance sheet value in the consolidated statement of financial position 422 398
Effect on earnings in the consolidated income statement -44 33
The joint ventures and associates are listed in Note 34.
17. OTHER FINANCIAL ASSETS, EUR 1,000 2020 2019
Other financial assets 1 Jan 1,198 1,198
Increases 3 0
Other financial assets 1 Dec 1,201 1,198
Other financial assets are classified as financial assets recognised at fair value through comprehensive income. Other financial assets include unlisted shares.
18. DEFERRED TAX ASSETS AND LIABILITIES, EUR 1,000 2020 2019
Deferred tax assets:
Tax asset to be realised in more than 12 months 1,311 3,913
Tax asset to be realised within 12 months 170 135
Total 1,481 4,048
86

Front page
Atria in brief
Atria’s key indicators
CEO’s review
Strategy 2021–2025
Strategy 2016–2020
Operating environment
Business area reviews
Atria Finland
Atria Sweden
Atria Denmark & Estonia
Atria Russia
Research and Development
Financial Statements and Corporate Governance
Financial Statements and Corporate Governance
Auditor’s report
Corporate Governance Statement
Investor reporting
Contact information
Atria’s Annual Report 2020
Deferred tax liabilities:
Tax liability to be realised in more than 12 months 39,220 40,595
Tax liability to be realised within 12 months 30 79
Total 39,250 40,674
Deferred tax assets by balance sheet item:
Intangible and tangible assets 133 63
Inventories 133 160
Trade and other receivables 550 629
Interest-bearing and non-interest-bearing liabilities 665 1,033
Recognised losses 0 2,163
Total 1,481 4,048
Deferred tax liabilities by balance sheet item:
Intangible and tangible assets 39,067 40,403
Inventories 149 172
Trade and other receivables 1 1
Interest-bearing and non-interest-bearing liabilities 33 98
Total 39,250 40,674
Change in deferred taxes:
Recognised in the income statement -965 -585
Recognised in other items of total comprehensive income 986 1,040
From acquired operations -395
Exchange differences -768 540
Total -1,143 995
Deferred tax assets for unused tax losses are recognised to the amount for which obtaining tax benefits on the basis of taxable profit is likely. Deferred tax assets unrecognised for the period were EUR 1.1 million (2.0 million).
In 2020, Atria Russia’s deferred tax assets were written down in the amount of EUR 2.0 million (1.4 million).
The gradual decrease in the corporation tax rate in Sweden in 2019, 2020 and 2021 has been taken into account in deferred taxes.
19. INVENTORIES, EUR 1,000 2020 2019
Materials and supplies 44,106 46,269
Unfinished products 4,928 4,903
Finished products 51,031 55,842
Other inventories 2,828 3,178
Total 102,893 110,192
During the accounting period, EUR 2.0 million (EUR 1.9 million), i.e. the amount used to lower the book value of the inventories to a value comparable with the net realisable value, was recognised as expenses.
20. TRADE RECEIVABLES, LOANS AND OTHER RECEIVABLES, EUR 1,000 2020 2019
Non-current: Balance sheet Balance sheet
Trade receivables from primary production customers 2,753 2,623
Loan receivables from primary production customers 920 1,632
Other receivables 514 463
Derivative instruments - in hedge accounting 452 498
Total 4,638 5,216
Current:
Trade receivables from consumer goods customers 63,241 58,390
Trade receivables from primary production customers 20,409 23,364
Loan receivables from primary production customers 2,860 3,145
Other loan receivables 551 476
Other receivables 10,422 10,717
Derivative instruments – in hedge accounting 282 839
Derivative financial instruments – not in hedge accounting 125 212
Accrued credits and deferred charges 6,791 7,415
Total 104,682 104,558
Current and non-current total 109,320 109,774
NOTES TO THE CONSOLIDATED FINANCIAL STATEMENTS, IFRS
87

Front page
Atria in brief
Atria’s key indicators
CEO’s review
Strategy 2021–2025
Strategy 2016–2020
Operating environment
Business area reviews
Atria Finland
Atria Sweden
Atria Denmark & Estonia
Atria Russia
Research and Development
Financial Statements and Corporate Governance
Financial Statements and Corporate Governance
Auditor’s report
Corporate Governance Statement
Investor reporting
Contact information
Atria’s Annual Report 2020
NOTES TO THE CONSOLIDATED FINANCIAL STATEMENTS, IFRS
Fair values do not deviate significantly from balance sheet values. The maximum credit risk for loans and other receivables is equivalent to their balance sheet value. Material items in accrued credits and deferred charges consist of prepaid expenses of purchase invoices, lease receivables and tax amortisations. Financial assets and liabilities by class are presented in Note 29.
Current and non-current receivables are divided between currencies as follows: 2020 2019
EUR 71,518 69,054
SEK 17,260 17,741
RUB 9,701 11,557
DKK 6,139 6,737
USD 3,279 2,716
Other 1,424 1,969
Total 109,320 109,774
Receivables from consumer goods:
Breakdown of trade receivables by age and expected credit losses in 2020
Trade receivables
before provisions
Change in credit loss provision
Net trade receivables
Expected credit
losses, %
Not due 59,293 0 59,293 0.0%
Overdue
Less than 30 days 3,373 22 3,395 -0.7%
30–60 days 254 0 254 0.0%
61–90 days 31 0 31 0.0%
More than 90 days 494 -225 268 45.7%
Total 63,445 -203 63,241 0.3%
Provision for credit risk fromtrade receivables on 1 Jan 2020 1,292
Provision increase 225
Realised credit losses -544
Cancelled provisions -22
Exchange differences -185
Total on 31 Dec 2020 766
Breakdown of trade receivables by age and expected credit losses in 2019
Trade receivables
before provisions
Change in credit loss provision
Net trade receivables
Expected credit
losses, %
Not due 50,618 0 50,618 0.0%
Overdue
Less than 30 days 3,882 0 3,882 0.0%
30–60 days 1,066 -18 1,048 1.7%
61–90 days 116 0 116 0.0%
More than 90 days 3,739 -1,013 2,726 27.1%
Total 59,421 -1,031 58,390 1.7%
Provision for credit risk from trade receivables on 1 Jan 2019 436
Provision increase*) 1,031
Realised credit losses -179
Cancelled provisions -20
Exchange differences 24
Total 31 Dec 2019 1,292
*) The credit loss provision was increased by EUR 0.8 million due to the financial difficulties of an individual customer.
88
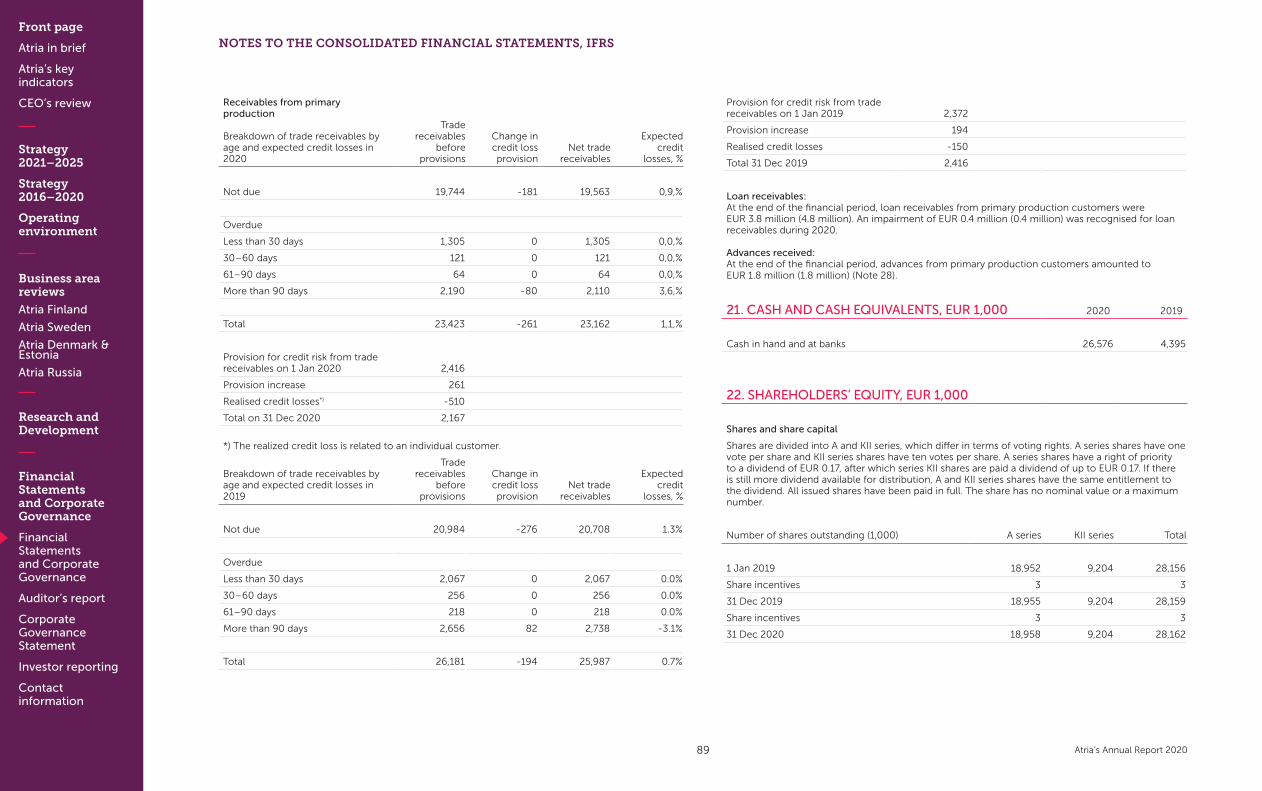
Front page
Atria in brief
Atria’s key indicators
CEO’s review
Strategy 2021–2025
Strategy 2016–2020
Operating environment
Business area reviews
Atria Finland
Atria Sweden
Atria Denmark & Estonia
Atria Russia
Research and Development
Financial Statements and Corporate Governance
Financial Statements and Corporate Governance
Auditor’s report
Corporate Governance Statement
Investor reporting
Contact information
Atria’s Annual Report 2020
Receivables from primary production
Breakdown of trade receivables by age and expected credit losses in 2020
Trade receivables
before provisions
Change in credit loss provision
Net trade receivables
Expected credit
losses, %
Not due 19,744 -181 19,563 0,9,%
Overdue
Less than 30 days 1,305 0 1,305 0,0,%
30–60 days 121 0 121 0,0,%
61–90 days 64 0 64 0,0,%
More than 90 days 2,190 -80 2,110 3,6,%
Total 23,423 -261 23,162 1,1,%
Provision for credit risk from trade receivables on 1 Jan 2020 2,416
Provision increase 261
Realised credit losses*) -510
Total on 31 Dec 2020 2,167
*) The realized credit loss is related to an individual customer.
Breakdown of trade receivables by age and expected credit losses in 2019
Trade receivables
before provisions
Change in credit loss provision
Net trade receivables
Expected credit
losses, %
Not due 20,984 -276 20,708 1.3%
Overdue
Less than 30 days 2,067 0 2,067 0.0%
30–60 days 256 0 256 0.0%
61–90 days 218 0 218 0.0%
More than 90 days 2,656 82 2,738 -3.1%
Total 26,181 -194 25,987 0.7%
Provision for credit risk from trade receivables on 1 Jan 2019 2,372
Provision increase 194
Realised credit losses -150
Total 31 Dec 2019 2,416
Loan receivables:At the end of the financial period, loan receivables from primary production customers were EUR 3.8 million (4.8 million). An impairment of EUR 0.4 million (0.4 million) was recognised for loan receivables during 2020. Advances received: At the end of the financial period, advances from primary production customers amounted to EUR 1.8 million (1.8 million) (Note 28).
21. CASH AND CASH EQUIVALENTS, EUR 1,000 2020 2019
Cash in hand and at banks 26,576 4,395
22. SHAREHOLDERS’ EQUITY, EUR 1,000
Shares and share capital
Shares are divided into A and KII series, which differ in terms of voting rights. A series shares have one vote per share and KII series shares have ten votes per share. A series shares have a right of priority to a dividend of EUR 0.17, after which series KII shares are paid a dividend of up to EUR 0.17. If there is still more dividend available for distribution, A and KII series shares have the same entitlement to the dividend. All issued shares have been paid in full. The share has no nominal value or a maximum number.
Number of shares outstanding (1,000) A series KII series Total
1 Jan 2019 18,952 9,204 28,156
Share incentives 3 3
31 Dec 2019 18,955 9,204 28,159
Share incentives 3 3
31 Dec 2020 18,958 9,204 28,162
NOTES TO THE CONSOLIDATED FINANCIAL STATEMENTS, IFRS
89

Front page
Atria in brief
Atria’s key indicators
CEO’s review
Strategy 2021–2025
Strategy 2016–2020
Operating environment
Business area reviews
Atria Finland
Atria Sweden
Atria Denmark & Estonia
Atria Russia
Research and Development
Financial Statements and Corporate Governance
Financial Statements and Corporate Governance
Auditor’s report
Corporate Governance Statement
Investor reporting
Contact information
Atria’s Annual Report 2020
NOTES TO THE CONSOLIDATED FINANCIAL STATEMENTS, IFRS
Reserves included in shareholders’ equity:
Treasury shares
The treasury shares reserve contains the acquisition cost of own shares held by the Group. In 2008 and 2009, the Group’s parent company, Atria Plc, acquired 145,102 series A shares on the stock exchange for an acquisition cost of EUR 1.3 million. The number of treasury shares transferred as part of the share incentive scheme of the Group’s key personnel in 2020 was 3,429 (2,572 shares). At the end of the year, the parent company held a total of 105,311 treasury shares (108,740).
Other funds 2020 2019
Hedging fund
Effective portion of currency and commodity derivatives. -1,000 1,088
Effective portion of interest rate derivatives -638 -878
Deferred tax 329 -40
Total -1,310 170
The Other funds item includes a hedge fund in which the effective portions of changes in the fair value of the derivative financial instruments used for hedging are recognised. Hedge accounting results for currency and commodity derivatives are transferred from equity to the income statement for adjustment of purchase expenses and, correspondingly, the hedging result for interest rate derivatives is transferred for adjustment of interest expenses.
Invested unrestricted equity fund
This reserve contains other equity investments and the share subscription price to the extent that it is not recognised in share capital according to a separate decision, as well as the value of shares earned on the basis of the share incentive scheme, calculated at the rate of the grant date.
Translation differences
The following are recognised: the translation differences from the translation of the financial statements of foreign subsidiaries, as well as the translation of fair value adjustments of goodwill, assets and liabilities arising in conjunction with the acquisition of the said companies. Profits and losses arisen from hedges of net investments in foreign operations are also recognised as translation differences when the hedge accounting criteria are met.
Parent company’s distributable shareholders’ equity 2020 2019
Invested unrestricted equity fund 248,689 248,730
Retained earnings 7,611 17,206
Treasury shares -1,206 -1,246
Profit for the period 12,666 2,233
Total 267,761 266,923
Dividend per share paid for the period 2020 2019
Dividend/share, EUR 0.42 0.40
Dividend distributed by the parent company 11,828 11,263
The Board of Directors proposes to the Annual General Meeting to be held on 29 April 2021 that a dividend of EUR 0.50 per share be distributed, totalling EUR 14,087,771.50.
23. SHARE-BASED PAYMENTS, EUR 1,000
Atria Plc has a long-term incentive scheme for key persons for 2018–2020. The share-based incentive scheme aims to encourage Atria’s management to acquire company shares as well as to increase the company’s value through their decisions and actions over the long term.
The scheme is based on a share bonus and a cash bonus, and is divided into three one-year periods. The possible bonus in the scheme is based on the company’s earnings per share (70%) and organic growth (30%). The bonuses for each period are paid in equal instalments over three years following the earning period, The cash proportion aims to cover any taxes and tax-like payments incurred by the person due to the bonus. If the person’s employment relationship or service contract ends prior to the payment of the bonus, the bonus is not usually paid. The share-based incentive scheme covers a maximum of 40 people. The bonuses to be paid for the 2020 earning period are estimated at EUR 0.9 million.
Earning period: 2020 2019
Grant date 12 Feb 2020 12 Feb 2019
Earning period begins 1 Jan 2020 1 Jan 2019
Earning period ends 31 Dec 2020 31 Dec 2019
Maximum number of shares granted as remuneration 43,400 45,000
Earnings criteria:
- EPS 70.0% 70.0%
- Organic growth 30.0% 30.0%
Achievement of earnings criteria, % 67.5% 5.7%
Share incentives earned 29,273 2,565
Share price listed on grant date, EUR 10.06 8.16
Share price listed on balance sheet date, EUR 9.85 10.04
90
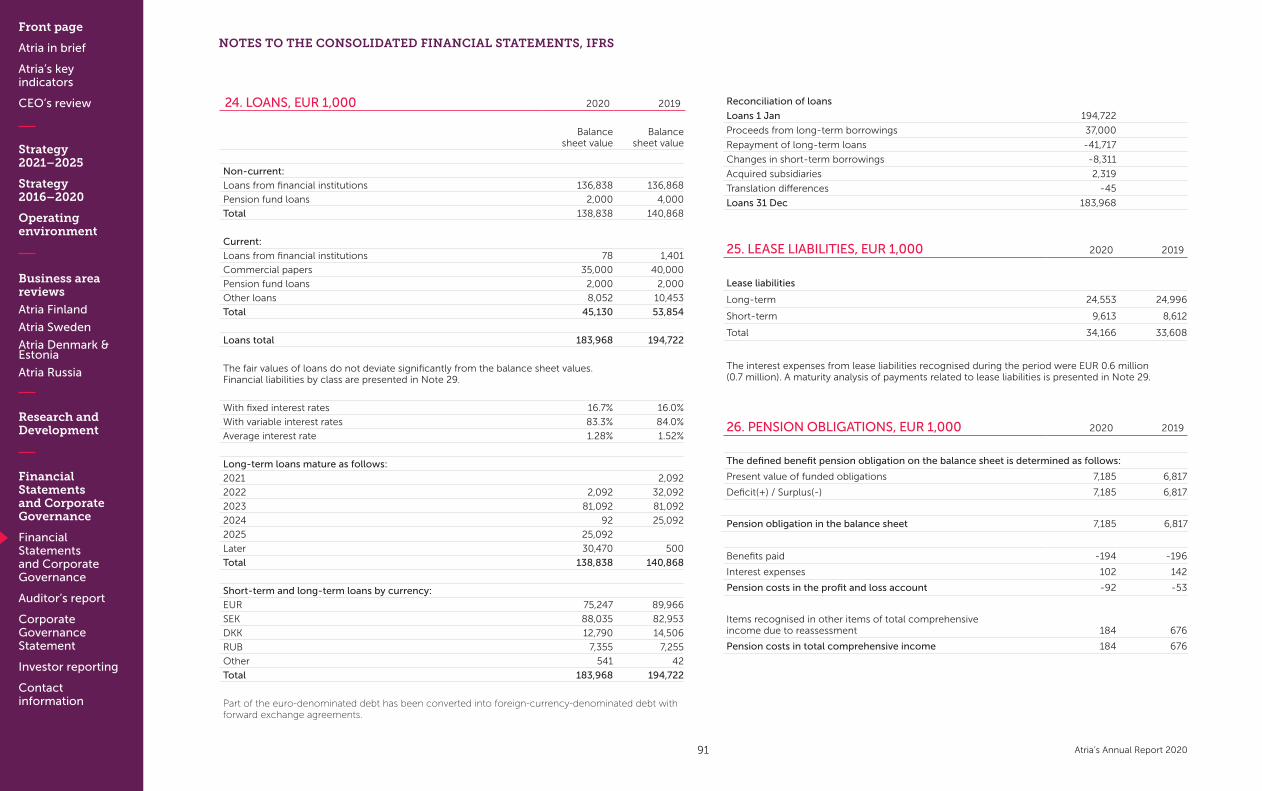
Front page
Atria in brief
Atria’s key indicators
CEO’s review
Strategy 2021–2025
Strategy 2016–2020
Operating environment
Business area reviews
Atria Finland
Atria Sweden
Atria Denmark & Estonia
Atria Russia
Research and Development
Financial Statements and Corporate Governance
Financial Statements and Corporate Governance
Auditor’s report
Corporate Governance Statement
Investor reporting
Contact information
Atria’s Annual Report 2020
24. LOANS, EUR 1,000 2020 2019
Balancesheet value
Balancesheet value
Non-current:
Loans from financial institutions 136,838 136,868
Pension fund loans 2,000 4,000
Total 138,838 140,868
Current:
Loans from financial institutions 78 1,401
Commercial papers 35,000 40,000
Pension fund loans 2,000 2,000
Other loans 8,052 10,453
Total 45,130 53,854
Loans total 183,968 194,722
The fair values of loans do not deviate significantly from the balance sheet values. Financial liabilities by class are presented in Note 29.
With fixed interest rates 16.7% 16.0%
With variable interest rates 83.3% 84.0%
Average interest rate 1.28% 1.52%
Long-term loans mature as follows:
2021 2,092
2022 2,092 32,092
2023 81,092 81,092
2024 92 25,092
2025 25,092
Later 30,470 500
Total 138,838 140,868
Short-term and long-term loans by currency:
EUR 75,247 89,966
SEK 88,035 82,953
DKK 12,790 14,506
RUB 7,355 7,255
Other 541 42
Total 183,968 194,722
Part of the euro-denominated debt has been converted into foreign-currency-denominated debt with forward exchange agreements.
Reconciliation of loans
Loans 1 Jan 194,722
Proceeds from long-term borrowings 37,000
Repayment of long-term loans -41,717
Changes in short-term borrowings -8,311
Acquired subsidiaries 2,319
Translation differences -45
Loans 31 Dec 183,968
25. LEASE LIABILITIES, EUR 1,000 2020 2019
Lease liabilities
Long-term 24,553 24,996
Short-term 9,613 8,612
Total 34,166 33,608
The interest expenses from lease liabilities recognised during the period were EUR 0.6 million (0.7 million). A maturity analysis of payments related to lease liabilities is presented in Note 29.
26. PENSION OBLIGATIONS, EUR 1,000 2020 2019
The defined benefit pension obligation on the balance sheet is determined as follows:
Present value of funded obligations 7,185 6,817
Deficit(+) / Surplus(-) 7,185 6,817
Pension obligation in the balance sheet 7,185 6,817
Benefits paid -194 -196
Interest expenses 102 142
Pension costs in the profit and loss account -92 -53
Items recognised in other items of total comprehensive income due to reassessment 184 676
Pension costs in total comprehensive income 184 676
NOTES TO THE CONSOLIDATED FINANCIAL STATEMENTS, IFRS
91

Front page
Atria in brief
Atria’s key indicators
CEO’s review
Strategy 2021–2025
Strategy 2016–2020
Operating environment
Business area reviews
Atria Finland
Atria Sweden
Atria Denmark & Estonia
Atria Russia
Research and Development
Financial Statements and Corporate Governance
Financial Statements and Corporate Governance
Auditor’s report
Corporate Governance Statement
Investor reporting
Contact information
Atria’s Annual Report 2020
NOTES TO THE CONSOLIDATED FINANCIAL STATEMENTS, IFRS
Changes to liabilities in the balance sheet:
Liability of the ITP2 pension arrangement at the beginning of the financial period 6,817 6,313
Pension costs in the income statement and total comprehensive income 91 622
Exchange differences 277 -119
At the end of the period 7,185 6,817
Actuarial assumptions used (%):
Discount rate 1.00 1.50
Inflation rate 1.50 1.80
The Group’s Swedish companies have defined benefit pension arrangements (ITP2). Most of the ITP2 pension arrangements are provided by the occupational pension insurance company Alecta as multiple-employer arrangements, so the funds and liabilities within them cannot be allocated to an individual company. For this reason, the ITP2 pension arrangements managed by Alecta are treated as defined contribution plans in the financial statements. The remaining ITP2 pension arrangements are financed through the FPG/PRI system, and they are treated as defined benefit plans as of the 2011 accounting period.
27. OTHER NON-CURRENT LIABILITIES AND PROVISIONS, EUR 1,000 2020 2019
Other liabilities *) 294 5,986
Derivative instruments - in hedge accounting 1,429 972
Accruals and deferred income 77 70
Total 1,799 7,028
*) Other liabilities in 2019 include the current value, EUR 5.7 million, of the call option related to the minority share in the subsidiary Well-Beef Kaunismaa Ltd, acquired in 2016 (see Note 28), which was classified as short-term in 2020. Other non-current liabilities are mainly in euros. Financial liabilities by class are presented in Note 29.
Provisions 2020
Provisions 1 Jan 687
The cost of Atria Sweden’s efficiency measures
- Other operating expenses, decreases -397
Provisions 31 Dec 290
28. CURRENT TRADE AND OTHER PAYABLES,EUR 1,000 2020 2019
Trade payables 120,251 111,246
Advances received (Note 20) 1,941 1,859
Other liabilities*) 54,206 46,919
Derivative instruments - in hedge accounting 945 182
Derivative financial instruments - not in hedge accounting 3,640 1,783
Accruals and deferred income 52,931 48,193
Total 233,914 210,182
*) Other liabilities include the current value, EUR 5.8 million, of the call option related to the minority share in the subsidiary Well-Beef Ltd., acquired in 2016 (Note 27).
Material items in accrued liabilities consist of personnel expenses and the amortisation of debt interests.
Financial liabilities by class are presented in Note 29.
Current liabilities consist of the following currencies:
EUR 164,738 142,808
SEK 54,487 49,576
RUB 4,919 9,928
DKK 8,498 6,245
PLN 732 1,057
USD 453 425
Other 87 143
Total 233,914 210,182
29. FINANCIAL RISK MANAGEMENT
The treasury policy approved by the Board of Directors defines the general principles of financial risk management. The Board has delegated the management of financial risks to the Treasury Committee, while the practical management of financial risks is centralised in the Group’s Treasury unit. The goal of financial risk management is to reduce the impact that price fluctuations in the financial markets and other uncertainty factors have on earnings, the balance sheet and cash flow, as well as to ensure sufficient liquidity. Treasury, together with the business areas, aims to identify, assess and hedge against all risks in accordance with the treasury policy. The main risks related to financing are interest rate risk, currency risk, liquidity and refinancing risk, and credit risk. Commodity risks and capital struc-ture management are also discussed at the end of this section.
Interest rate risk
Interest rate risk is managed by dividing financing into instruments with floating and fixed interest rates and by hedging with interest rate derivatives. During the financial year, the Group used interest rate swaps for interest rate risk management. The Group links interest rate risk management to the interest
92

Front page
Atria in brief
Atria’s key indicators
CEO’s review
Strategy 2021–2025
Strategy 2016–2020
Operating environment
Business area reviews
Atria Finland
Atria Sweden
Atria Denmark & Estonia
Atria Russia
Research and Development
Financial Statements and Corporate Governance
Financial Statements and Corporate Governance
Auditor’s report
Corporate Governance Statement
Investor reporting
Contact information
Atria’s Annual Report 2020
margin indicator that is forecast by dividing the 12-month rolling operating margin by the forecast net interest rate expenses. The lower the EBITDA is in relation to net financial costs, the larger the share of debt that must have a fixed interest rate. Consolidated interest-bearing debt on the balance sheet date amounted to EUR 218.1 million (228.3 million). The interest-bearing debt includes EUR 184.0 million (194.7 million) in loans and EUR 34.2 million (33.6 million) in lease liabilities. Fixed-rate loans accounted for EUR 30.7 million (31.1 million), or 16.7% (16.0%), of the loans. The ratio of debt with fixed and floating interest rates is at the level defined by the Group’s treasury policy.
The interest rate risk is mainly related to the Group’s interest-bearing liabilities, because the amount of money market investments is low, as is the related interest rate risk. The Group’s cash flows from operating activities are to a large extent independent of fluctuations in interest rates. On the balance sheet date, Atria Plc had one interest rate swap subject to hedge accounting.
1. An interest rate swap amounting to EUR 30 million, where Atria pays a fixed interest rate of 0.897% and receives the 6-month Euribor rate. The company will use the interest rate swap to hedge a EUR 30 million loan with a floating interest rate which matures on 25 September 2027 and is included in the fixed-rate interest-bearing debt.
The sensitivity analysis of net interest rate expenses is based on a 1% change in interest rates, which is considered to be reasonably realistic. It is calculated for year-end interest-bearing, variable-rate net liabilities that are expected to remain the same over the financial period. The interest rate swap is taken into account in the calculation. In simulations, the same change in interest rate is used for all currencies. On 31 December 2020, net variable-rate liabilities excluding lease liabilities amounted to EUR 126.7 million (159.3 million). At the end of 2020, a +/-1% increase in interest rates corresponded to a change of EUR +/-1.3 million in the Group’s annual interest rate expenses (+/-1.6 million). The effect on equity would be EUR 0.3 million (0.8 million) with an increase of 1% and EUR -0.3 million (-0.8 million) with a decrease of 1%.
Currency risk
Atria Group operates in many currency zones and is exposed to currency-related risks. Currency risks arise from forecast transactions, assets and liabilities recognised on the balance sheet, and from net investments in foreign subsidiaries. The subsidiaries hedge the currency risk related to commercial operational items according to their currency risk policy for each business area. Each currency risk policy has been approved by the Treasury Committee.
In Finland and Sweden, hedge accounting is applied to the currency hedges mentioned above. Cur-rency risk is monitored according to the 12-month rolling cash flow forecast, and hedges are carried out for periods of 1 to 6 months using forward exchange agreements. The cash flows hedged during this time are expected to occur and affect profit or loss. Transaction risks arise from, for example, the euro-denominated meat raw material imports of Atria’s companies in Sweden, as well as from Atria Russia’s USD-denominated meat raw material imports and euro-denominated purchases of goods other than meat. In Atria’s Finnish operations, currency flows and risks are relatively low and are mainly related to USD-denominated exports. Exports to China are invoiced in euros.
The Group’s net investments in the operations of foreign subsidiaries are exposed to currency risks. The Treasury Committee decides on net investment hedges on a case-by-case basis. On the balance sheet date, there were no derivative agreements in force for net investment hedging. The parent company grants financing to the subsidiaries in their home currencies and has hedged the curren-cy-denominated loan receivables from the subsidiaries through currency loans and forward exchange agreements.
During the financial year, translation differences recognised in the consolidated statement of comp-rehensive income amounted to EUR -6.8 million (+4.6 million). At the end of the year, the value of net investments exposed to fluctuations of the rouble was EUR 36.7 million (47.9 million).
If, at the end of the financial year, the euro had been 10% weaker/stronger than the Swedish krona (all other factors being equal), profit before taxes would have been EUR 0.8 million higher/lower due to the Swedish subsidiaries’ unhedged euro-denominated net position of accounts receivable and accounts payable (0.6 million). The effect on equity would have been EUR 0.8 million (0.7 million). Sensitivity analyses also take into account the effects of currency derivatives, which offset the effects of change in exchange rates.
Liquidity and refinancing risk
Atria Plc’s Treasury raises the majority of the Group’s interest-bearing capital. Liquidity and refinancing risks are managed through a balanced loan maturity distribution and by having sufficient committed credit facilities with sufficiently long periods of validity at hand, by using several financial institutions and instruments to raise financing and by keeping a sufficient amount of cash funds. Atria uses com-mercial papers for short-term financing and liquidity management. Unused committed credit facilities totalled EUR 85.0 million (85.0 million) at the end of the year, and EUR 165.0 million of the EUR 200 million commercial paper programme had not been used at the end of the financial year (160.0 mil-lion). The average maturity of the Group’s loans and committed credit facilities was 3 years 2 months (3 years 2 months).
The main covenant used in loan agreements is a minimum equity ratio covenant of 28%. The Group’s equity ratio has been around 40% for many years, and the Group will continue to ensure an equity ratio higher than the level required by the covenant. According to the terms of loan agreements, the implementation of covenants is reported to financiers quarterly. According to the Group manage-ment’s view, there was no significant liquidity accumulation in financial assets or financial sources.
The table below shows the maturity analysis for financial liabilities and derivative financial instruments (undiscounted figures). The capital levies and revenue of derivative liabilities and assets are related to forward exchange agreements, and interest payments are related to interest rate swaps.
Maturity, 31 Dec 2020
EUR 1,000 < 1 year 1–5 years > 5 years Total
Loans Instalments 44,744 108,369 30,855 183,968
Interest payments 2,125 5,415 463 8,004
Lease liabilities Instalments 9,613 22,103 2,450 34,166
Derivative financial instruments*)
Electricity derivatives 766 790 1,557
Interest rate swaps 430 215 645
Currency derivatives**)
- Capital payments 140,991 140,991
- Capital income -144,736 -144,736
Other liabilities Instalments 10,492 294 10,786
Trade payables Payments 120,251 120,251
Accruals and deferred income Payments 52,931 77 53,008
Total Total payments 382,345 137,263 33,767 553,376
Total income -144,736 0 0 -144,736
Net payments 237,608 137,263 33,767 408,639
NOTES TO THE CONSOLIDATED FINANCIAL STATEMENTS, IFRS
93
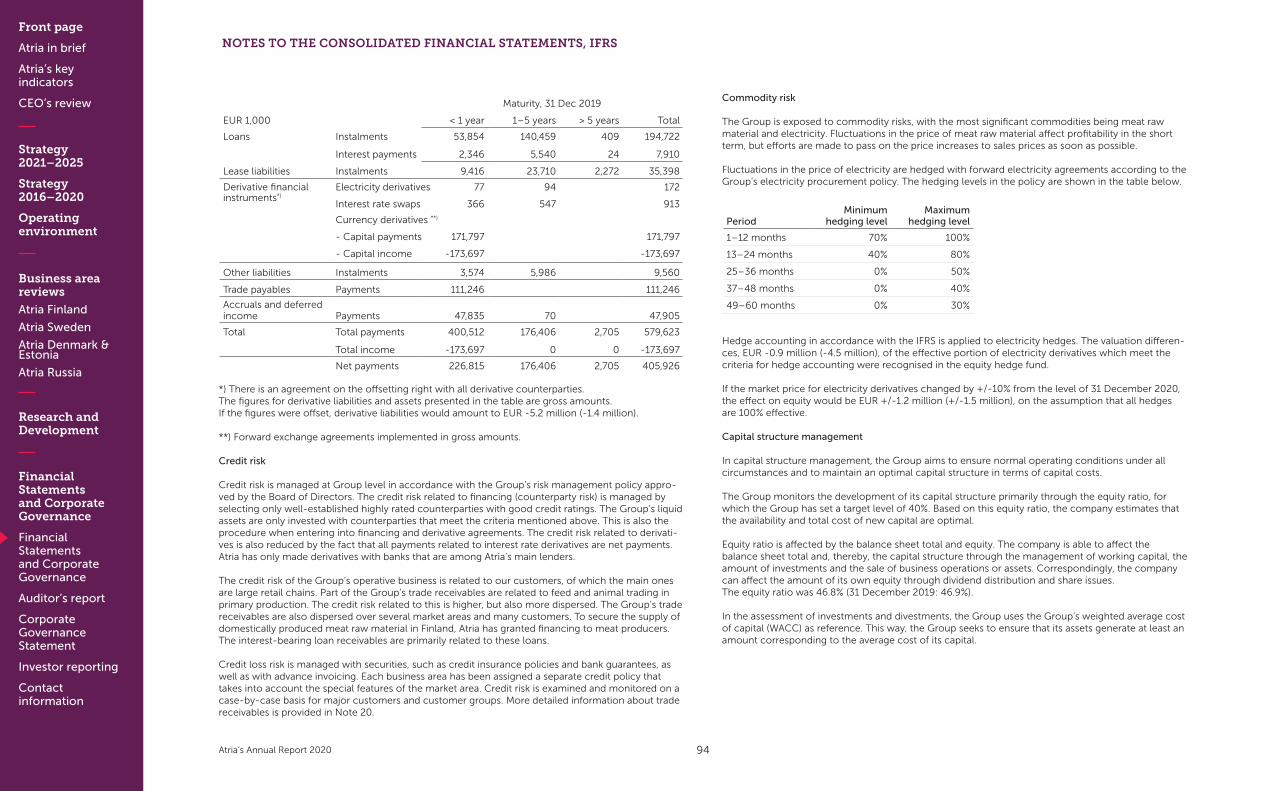
Front page
Atria in brief
Atria’s key indicators
CEO’s review
Strategy 2021–2025
Strategy 2016–2020
Operating environment
Business area reviews
Atria Finland
Atria Sweden
Atria Denmark & Estonia
Atria Russia
Research and Development
Financial Statements and Corporate Governance
Financial Statements and Corporate Governance
Auditor’s report
Corporate Governance Statement
Investor reporting
Contact information
Atria’s Annual Report 2020
NOTES TO THE CONSOLIDATED FINANCIAL STATEMENTS, IFRS
Maturity, 31 Dec 2019
EUR 1,000 < 1 year 1–5 years > 5 years Total
Loans Instalments 53,854 140,459 409 194,722
Interest payments 2,346 5,540 24 7,910
Lease liabilities Instalments 9,416 23,710 2,272 35,398
Derivative financial instruments*)
Electricity derivatives 77 94 172
Interest rate swaps 366 547 913
Currency derivatives **)
- Capital payments 171,797 171,797
- Capital income -173,697 -173,697
Other liabilities Instalments 3,574 5,986 9,560
Trade payables Payments 111,246 111,246
Accruals and deferred income Payments 47,835 70 47,905
Total Total payments 400,512 176,406 2,705 579,623
Total income -173,697 0 0 -173,697
Net payments 226,815 176,406 2,705 405,926
*) There is an agreement on the offsetting right with all derivative counterparties. The figures for derivative liabilities and assets presented in the table are gross amounts. If the figures were offset, derivative liabilities would amount to EUR -5.2 million (-1.4 million). **) Forward exchange agreements implemented in gross amounts. Credit risk
Credit risk is managed at Group level in accordance with the Group’s risk management policy appro-ved by the Board of Directors. The credit risk related to financing (counterparty risk) is managed by selecting only well-established highly rated counterparties with good credit ratings. The Group’s liquid assets are only invested with counterparties that meet the criteria mentioned above. This is also the procedure when entering into financing and derivative agreements. The credit risk related to derivati-ves is also reduced by the fact that all payments related to interest rate derivatives are net payments. Atria has only made derivatives with banks that are among Atria’s main lenders.
The credit risk of the Group’s operative business is related to our customers, of which the main ones are large retail chains. Part of the Group’s trade receivables are related to feed and animal trading in primary production. The credit risk related to this is higher, but also more dispersed. The Group’s trade receivables are also dispersed over several market areas and many customers. To secure the supply of domestically produced meat raw material in Finland, Atria has granted financing to meat producers. The interest-bearing loan receivables are primarily related to these loans.
Credit loss risk is managed with securities, such as credit insurance policies and bank guarantees, as well as with advance invoicing. Each business area has been assigned a separate credit policy that takes into account the special features of the market area. Credit risk is examined and monitored on a case-by-case basis for major customers and customer groups. More detailed information about trade receivables is provided in Note 20.
Commodity risk
The Group is exposed to commodity risks, with the most significant commodities being meat raw material and electricity. Fluctuations in the price of meat raw material affect profitability in the short term, but efforts are made to pass on the price increases to sales prices as soon as possible.
Fluctuations in the price of electricity are hedged with forward electricity agreements according to the Group’s electricity procurement policy. The hedging levels in the policy are shown in the table below.
PeriodMinimum
hedging levelMaximum
hedging level
1–12 months 70% 100%
13–24 months 40% 80%
25–36 months 0% 50%
37–48 months 0% 40%
49–60 months 0% 30%
Hedge accounting in accordance with the IFRS is applied to electricity hedges. The valuation differen-ces, EUR -0.9 million (-4.5 million), of the effective portion of electricity derivatives which meet the criteria for hedge accounting were recognised in the equity hedge fund.
If the market price for electricity derivatives changed by +/-10% from the level of 31 December 2020, the effect on equity would be EUR +/-1.2 million (+/-1.5 million), on the assumption that all hedges are 100% effective.
Capital structure management
In capital structure management, the Group aims to ensure normal operating conditions under all circumstances and to maintain an optimal capital structure in terms of capital costs.
The Group monitors the development of its capital structure primarily through the equity ratio, for which the Group has set a target level of 40%. Based on this equity ratio, the company estimates that the availability and total cost of new capital are optimal.
Equity ratio is affected by the balance sheet total and equity. The company is able to affect the balance sheet total and, thereby, the capital structure through the management of working capital, the amount of investments and the sale of business operations or assets. Correspondingly, the company can affect the amount of its own equity through dividend distribution and share issues. The equity ratio was 46.8% (31 December 2019: 46.9%).
In the assessment of investments and divestments, the Group uses the Group’s weighted average cost of capital (WACC) as reference. This way, the Group seeks to ensure that its assets generate at least an amount corresponding to the average cost of its capital.
94
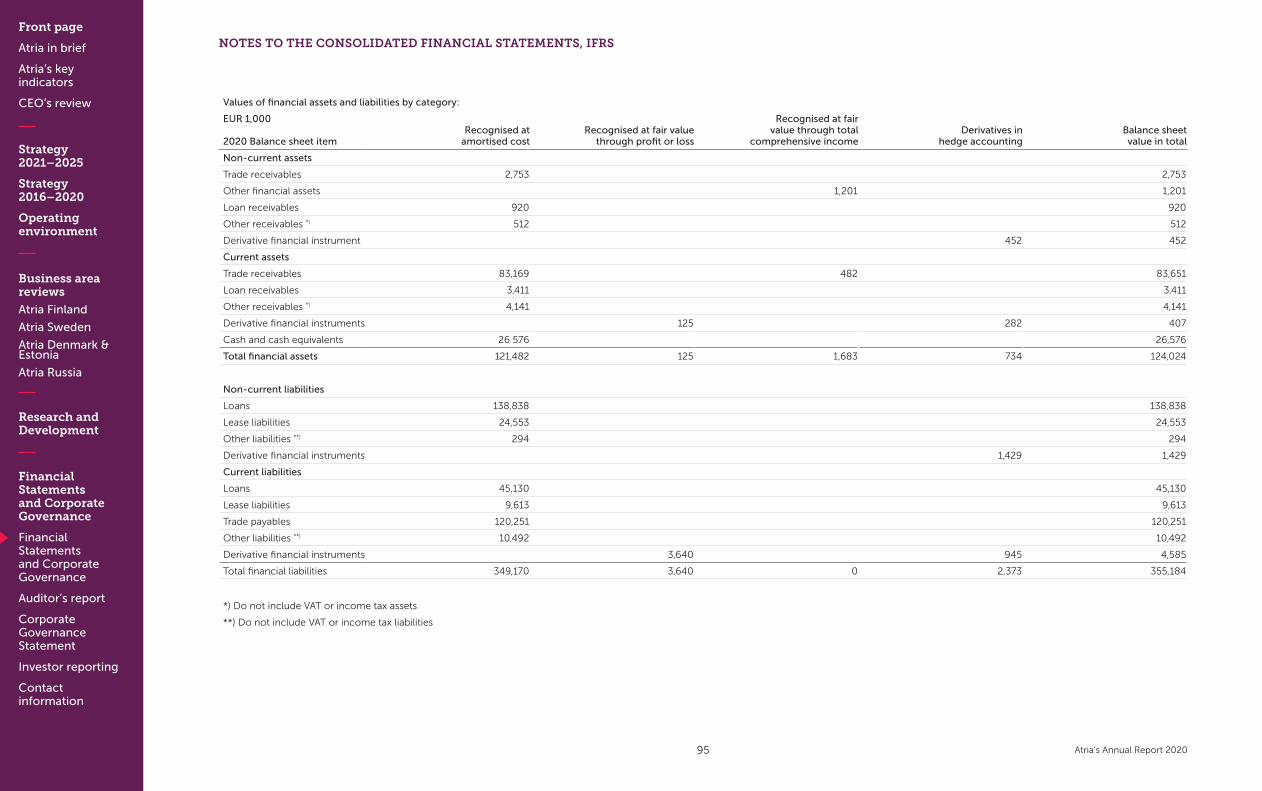
Front page
Atria in brief
Atria’s key indicators
CEO’s review
Strategy 2021–2025
Strategy 2016–2020
Operating environment
Business area reviews
Atria Finland
Atria Sweden
Atria Denmark & Estonia
Atria Russia
Research and Development
Financial Statements and Corporate Governance
Financial Statements and Corporate Governance
Auditor’s report
Corporate Governance Statement
Investor reporting
Contact information
Atria’s Annual Report 2020
Values of financial assets and liabilities by category:
EUR 1,000
2020 Balance sheet itemRecognised at
amortised costRecognised at fair value
through profit or loss
Recognised at fair value through total
comprehensive incomeDerivatives in
hedge accountingBalance sheet value in total
Non-current assets
Trade receivables 2,753 2,753
Other financial assets 1,201 1,201
Loan receivables 920 920
Other receivables *) 512 512
Derivative financial instrument 452 452
Current assets
Trade receivables 83,169 482 83,651
Loan receivables 3,411 3,411
Other receivables *) 4,141 4,141
Derivative financial instruments 125 282 407
Cash and cash equivalents 26 576 26,576
Total financial assets 121,482 125 1,683 734 124,024
Non-current liabilities
Loans 138,838 138,838
Lease liabilities 24,553 24,553
Other liabilities **) 294 294
Derivative financial instruments 1,429 1,429
Current liabilities
Loans 45,130 45,130
Lease liabilities 9,613 9,613
Trade payables 120,251 120,251
Other liabilities **) 10,492 10,492
Derivative financial instruments 3,640 945 4,585
Total financial liabilities 349,170 3,640 0 2,373 355,184
*) Do not include VAT or income tax assets
**) Do not include VAT or income tax liabilities
NOTES TO THE CONSOLIDATED FINANCIAL STATEMENTS, IFRS
95
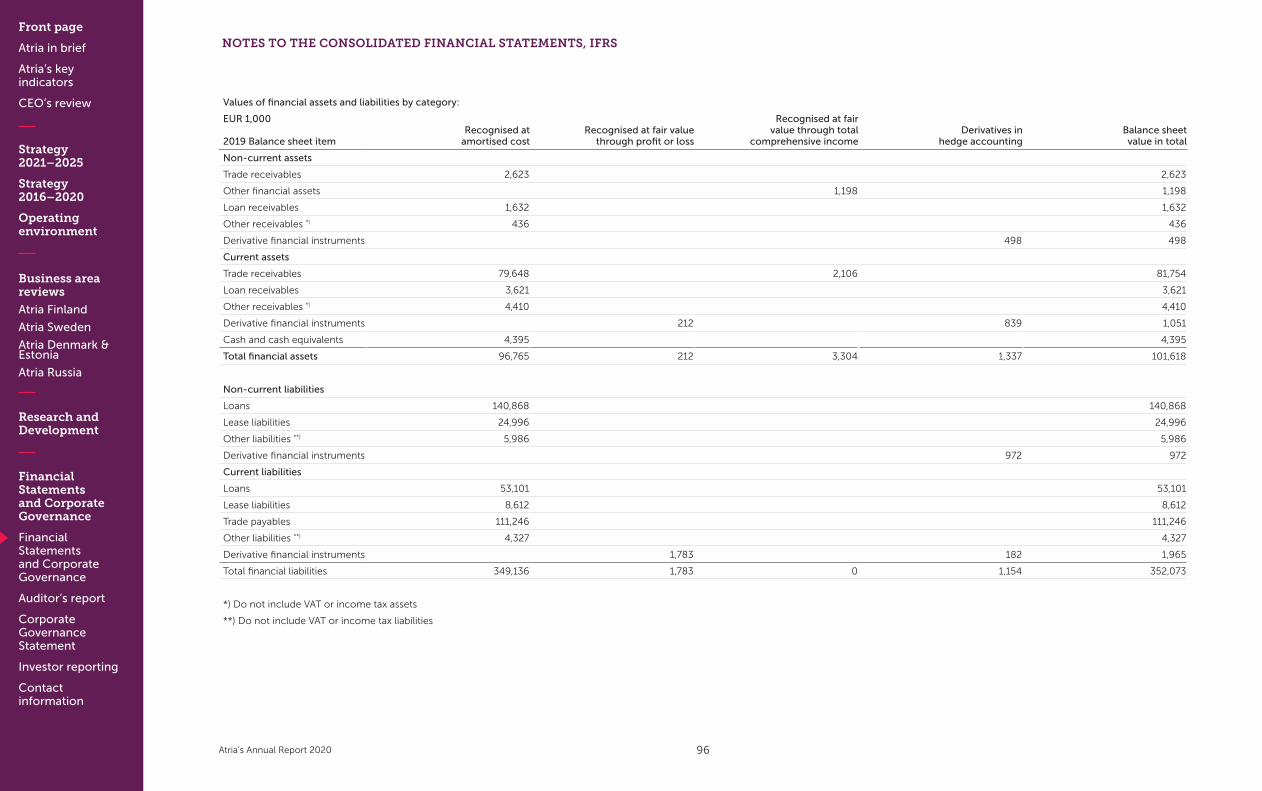
Front page
Atria in brief
Atria’s key indicators
CEO’s review
Strategy 2021–2025
Strategy 2016–2020
Operating environment
Business area reviews
Atria Finland
Atria Sweden
Atria Denmark & Estonia
Atria Russia
Research and Development
Financial Statements and Corporate Governance
Financial Statements and Corporate Governance
Auditor’s report
Corporate Governance Statement
Investor reporting
Contact information
Atria’s Annual Report 2020
NOTES TO THE CONSOLIDATED FINANCIAL STATEMENTS, IFRS
Values of financial assets and liabilities by category:
EUR 1,000
2019 Balance sheet itemRecognised at
amortised costRecognised at fair value
through profit or loss
Recognised at fair value through total
comprehensive incomeDerivatives in
hedge accountingBalance sheet value in total
Non-current assets
Trade receivables 2,623 2,623
Other financial assets 1,198 1,198
Loan receivables 1,632 1,632
Other receivables *) 436 436
Derivative financial instruments 498 498
Current assets
Trade receivables 79,648 2,106 81,754
Loan receivables 3,621 3,621
Other receivables *) 4,410 4,410
Derivative financial instruments 212 839 1,051
Cash and cash equivalents 4,395 4,395
Total financial assets 96,765 212 3,304 1,337 101,618
Non-current liabilities
Loans 140,868 140,868
Lease liabilities 24,996 24,996
Other liabilities **) 5,986 5,986
Derivative financial instruments 972 972
Current liabilities
Loans 53,101 53,101
Lease liabilities 8,612 8,612
Trade payables 111,246 111,246
Other liabilities **) 4,327 4,327
Derivative financial instruments 1,783 182 1,965
Total financial liabilities 349,136 1,783 0 1,154 352,073
*) Do not include VAT or income tax assets
**) Do not include VAT or income tax liabilities
96
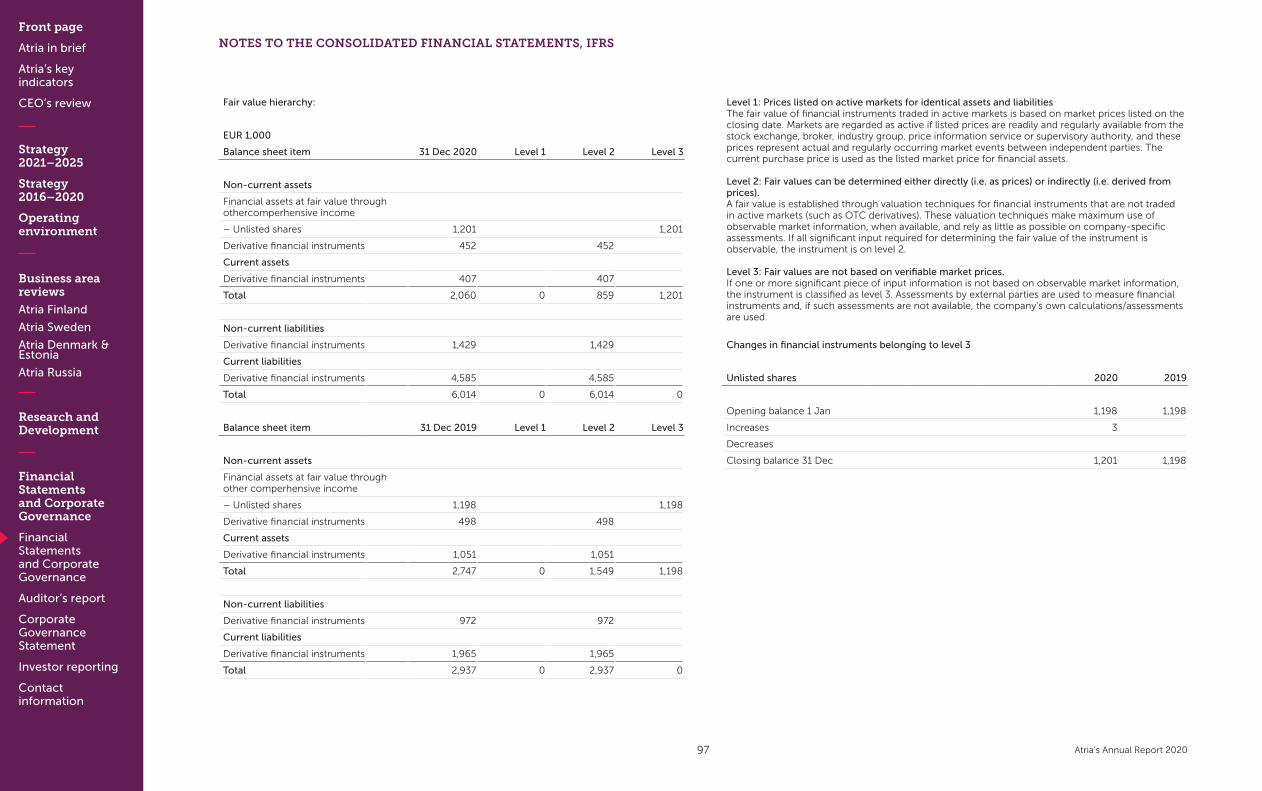
Front page
Atria in brief
Atria’s key indicators
CEO’s review
Strategy 2021–2025
Strategy 2016–2020
Operating environment
Business area reviews
Atria Finland
Atria Sweden
Atria Denmark & Estonia
Atria Russia
Research and Development
Financial Statements and Corporate Governance
Financial Statements and Corporate Governance
Auditor’s report
Corporate Governance Statement
Investor reporting
Contact information
Atria’s Annual Report 2020
Fair value hierarchy:
EUR 1,000
Balance sheet item 31 Dec 2020 Level 1 Level 2 Level 3
Non-current assets
Financial assets at fair value through othercomperhensive income
– Unlisted shares 1,201 1,201
Derivative financial instruments 452 452
Current assets
Derivative financial instruments 407 407
Total 2,060 0 859 1,201
Non-current liabilities
Derivative financial instruments 1,429 1,429
Current liabilities
Derivative financial instruments 4,585 4,585
Total 6,014 0 6,014 0
Balance sheet item 31 Dec 2019 Level 1 Level 2 Level 3
Non-current assets
Financial assets at fair value through other comperhensive income
– Unlisted shares 1,198 1,198
Derivative financial instruments 498 498
Current assets
Derivative financial instruments 1,051 1,051
Total 2,747 0 1,549 1,198
Non-current liabilities
Derivative financial instruments 972 972
Current liabilities
Derivative financial instruments 1,965 1,965
Total 2,937 0 2,937 0
Level 1: Prices listed on active markets for identical assets and liabilitiesThe fair value of financial instruments traded in active markets is based on market prices listed on the closing date. Markets are regarded as active if listed prices are readily and regularly available from the stock exchange, broker, industry group, price information service or supervisory authority, and these prices represent actual and regularly occurring market events between independent parties. The current purchase price is used as the listed market price for financial assets.
Level 2: Fair values can be determined either directly (i.e. as prices) or indirectly (i.e. derived from prices).A fair value is established through valuation techniques for financial instruments that are not traded in active markets (such as OTC derivatives). These valuation techniques make maximum use of observable market information, when available, and rely as little as possible on company-specific assessments. If all significant input required for determining the fair value of the instrument is observable, the instrument is on level 2.
Level 3: Fair values are not based on verifiable market prices.If one or more significant piece of input information is not based on observable market information, the instrument is classified as level 3. Assessments by external parties are used to measure financial instruments and, if such assessments are not available, the company’s own calculations/assessments are used.
Changes in financial instruments belonging to level 3
Unlisted shares 2020 2019
Opening balance 1 Jan 1,198 1,198
Increases 3
Decreases
Closing balance 31 Dec 1,201 1,198
NOTES TO THE CONSOLIDATED FINANCIAL STATEMENTS, IFRS
97

Front page
Atria in brief
Atria’s key indicators
CEO’s review
Strategy 2021–2025
Strategy 2016–2020
Operating environment
Business area reviews
Atria Finland
Atria Sweden
Atria Denmark & Estonia
Atria Russia
Research and Development
Financial Statements and Corporate Governance
Financial Statements and Corporate Governance
Auditor’s report
Corporate Governance Statement
Investor reporting
Contact information
Atria’s Annual Report 2020
NOTES TO THE CONSOLIDATED FINANCIAL STATEMENTS, IFRS
Derivative financial instruments:
Fair values of derivative instrumentsEUR 1,000
Derivative assets 31 Dec
2020
Derivative liabilities 31
Dec 2020Net fair value 31 Dec 2020
Net fair value 31 Dec 2019
Forward exchange agreements
Cash flow hedges under hedge accounting 140 178 -38 -73
Other hedges 125 3,640 -3,515 -1,626
Interest rate swaps, due in more than one year
Cash flow hedges under hedge accounting 638 -638 -878
Electricity derivatives
Cash flow hedges under hedge accounting 594 1,557 -963 1,162
Other hedges 0 27
Total 859 6,014 -5,155 -1,388
Nominal values of derivative financial instruments EUR 1,000 31 Dec 2020 31 Dec 2019
Forward exchange agreements
Cash flow hedges under hedge accounting 12,182 6,090
Other hedges 130,792 104,620
Interest rate swaps
Cash flow hedges under hedge accounting 30,000 30,000
Electricity derivatives
Cash flow hedges under hedge accounting 12,718 11,993
Other hedges 62
Total 185,692 152,765
30. CONTINGENT LIABILITIES, EUR 1,000 2020 2019
Debts with mortgages or other collateral given as security
Loans from financial institutions 1,291 1,388
Pension fund loans 4,387 4,213
Total 5,678 5,601
Mortgages and other securities given as comprehensive security
Real estate mortgages 1,291 1,388
Corporate mortgages
Total 1,291 1,388
Contingent liabilities not included in the balance sheet
Guarantees 88 84
31. RELATED PARTY TRANSACTIONS, EUR 1,000
Atria Group’s related parties include the members of the Board of Directors and the Supervisory Board, the CEO, the Deputy CEO and other members of the management team, their immediate families and the companies in which they have a controlling interest. Other related parties include the Group’s joint ventures and associated companies, as well as the shareholding co-operatives Itikka Co-operative, Lihakunta and Pohjanmaan Liha Co-operative and the subsidiaries of these companies. Group companies, Group joint ventures and associates are presented in more detail in Note 34. All business transactions that are entered into with related parties and are not eliminated in the consolidated financial statements are recognised as related party transactions.
Transactions with related parties and related-party assets and liabilities
Joint ventures and associates
Other related parties Total
1 Jan–31 Dec 2020
Sale of goods 4,201 11,017 15,219
Sale of services 10 193 203
Rental income 4,713 4,713
Purchase of goods 15,263 16,412 31,675
Purchase of services 54,879 81 54,961
Rental costs 5,908 5,704 11,612
98
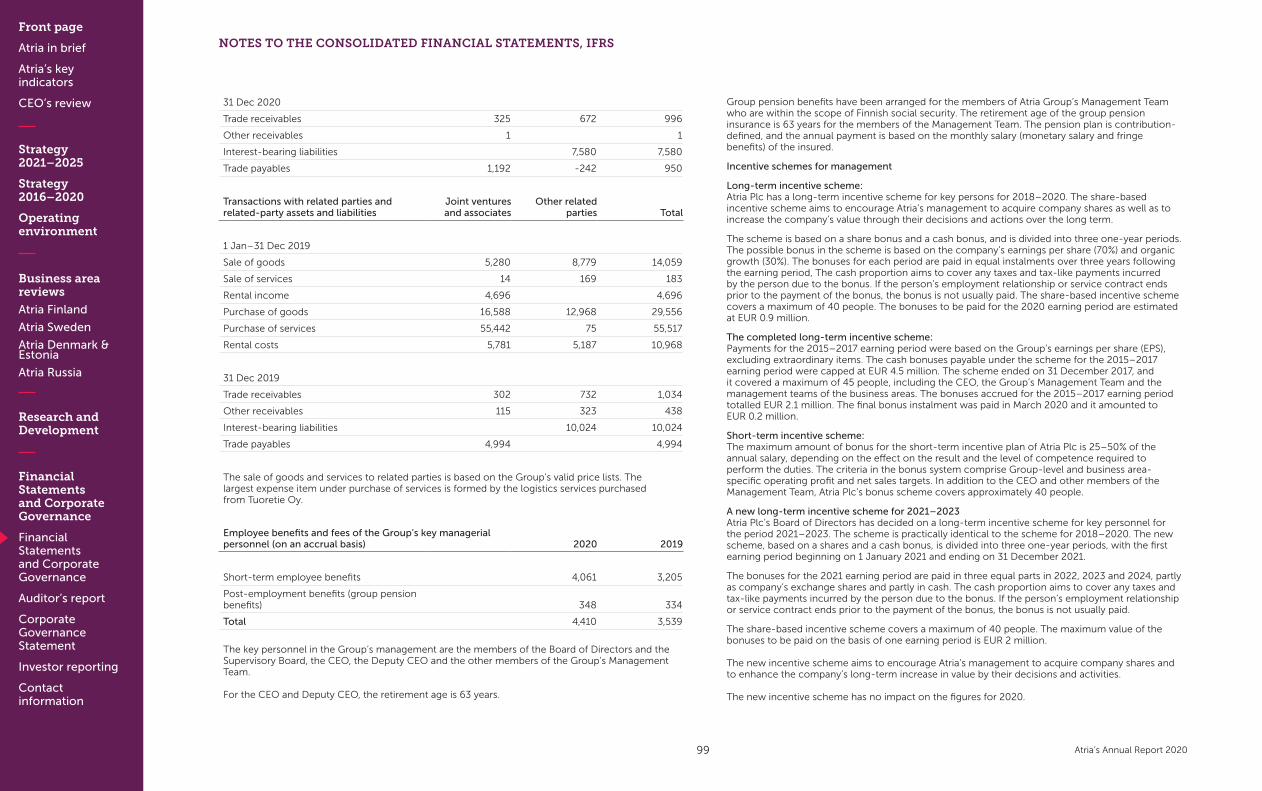
Front page
Atria in brief
Atria’s key indicators
CEO’s review
Strategy 2021–2025
Strategy 2016–2020
Operating environment
Business area reviews
Atria Finland
Atria Sweden
Atria Denmark & Estonia
Atria Russia
Research and Development
Financial Statements and Corporate Governance
Financial Statements and Corporate Governance
Auditor’s report
Corporate Governance Statement
Investor reporting
Contact information
Atria’s Annual Report 2020
31 Dec 2020
Trade receivables 325 672 996
Other receivables 1 1
Interest-bearing liabilities 7,580 7,580
Trade payables 1,192 -242 950
Transactions with related parties and related-party assets and liabilities
Joint ventures and associates
Other related parties Total
1 Jan–31 Dec 2019
Sale of goods 5,280 8,779 14,059
Sale of services 14 169 183
Rental income 4,696 4,696
Purchase of goods 16,588 12,968 29,556
Purchase of services 55,442 75 55,517
Rental costs 5,781 5,187 10,968
31 Dec 2019
Trade receivables 302 732 1,034
Other receivables 115 323 438
Interest-bearing liabilities 10,024 10,024
Trade payables 4,994 4,994
The sale of goods and services to related parties is based on the Group’s valid price lists. The largest expense item under purchase of services is formed by the logistics services purchased from Tuoretie Oy.
Employee benefits and fees of the Group’s key managerial personnel (on an accrual basis) 2020 2019
Short-term employee benefits 4,061 3,205
Post-employment benefits (group pension benefits) 348 334
Total 4,410 3,539
The key personnel in the Group’s management are the members of the Board of Directors and the Supervisory Board, the CEO, the Deputy CEO and the other members of the Group’s Management Team. For the CEO and Deputy CEO, the retirement age is 63 years.
Group pension benefits have been arranged for the members of Atria Group’s Management Team who are within the scope of Finnish social security. The retirement age of the group pension insurance is 63 years for the members of the Management Team. The pension plan is contribution-defined, and the annual payment is based on the monthly salary (monetary salary and fringe benefits) of the insured.
Incentive schemes for management
Long-term incentive scheme:Atria Plc has a long-term incentive scheme for key persons for 2018–2020. The share-based incentive scheme aims to encourage Atria’s management to acquire company shares as well as to increase the company’s value through their decisions and actions over the long term.
The scheme is based on a share bonus and a cash bonus, and is divided into three one-year periods. The possible bonus in the scheme is based on the company’s earnings per share (70%) and organic growth (30%). The bonuses for each period are paid in equal instalments over three years following the earning period, The cash proportion aims to cover any taxes and tax-like payments incurred by the person due to the bonus. If the person’s employment relationship or service contract ends prior to the payment of the bonus, the bonus is not usually paid. The share-based incentive scheme covers a maximum of 40 people. The bonuses to be paid for the 2020 earning period are estimated at EUR 0.9 million.
The completed long-term incentive scheme:Payments for the 2015–2017 earning period were based on the Group’s earnings per share (EPS), excluding extraordinary items. The cash bonuses payable under the scheme for the 2015–2017 earning period were capped at EUR 4.5 million. The scheme ended on 31 December 2017, and it covered a maximum of 45 people, including the CEO, the Group’s Management Team and the management teams of the business areas. The bonuses accrued for the 2015–2017 earning period totalled EUR 2.1 million. The final bonus instalment was paid in March 2020 and it amounted to EUR 0.2 million.
Short-term incentive scheme:The maximum amount of bonus for the short-term incentive plan of Atria Plc is 25–50% of the annual salary, depending on the effect on the result and the level of competence required to perform the duties. The criteria in the bonus system comprise Group-level and business area-specific operating profit and net sales targets. In addition to the CEO and other members of the Management Team, Atria Plc’s bonus scheme covers approximately 40 people.
A new long-term incentive scheme for 2021–2023Atria Plc’s Board of Directors has decided on a long-term incentive scheme for key personnel for the period 2021–2023. The scheme is practically identical to the scheme for 2018–2020. The new scheme, based on a shares and a cash bonus, is divided into three one-year periods, with the first earning period beginning on 1 January 2021 and ending on 31 December 2021.
The bonuses for the 2021 earning period are paid in three equal parts in 2022, 2023 and 2024, partly as company’s exchange shares and partly in cash. The cash proportion aims to cover any taxes and tax-like payments incurred by the person due to the bonus. If the person’s employment relationship or service contract ends prior to the payment of the bonus, the bonus is not usually paid.
The share-based incentive scheme covers a maximum of 40 people. The maximum value of the bonuses to be paid on the basis of one earning period is EUR 2 million.
The new incentive scheme aims to encourage Atria’s management to acquire company shares and to enhance the company’s long-term increase in value by their decisions and activities.
The new incentive scheme has no impact on the figures for 2020.
NOTES TO THE CONSOLIDATED FINANCIAL STATEMENTS, IFRS
99
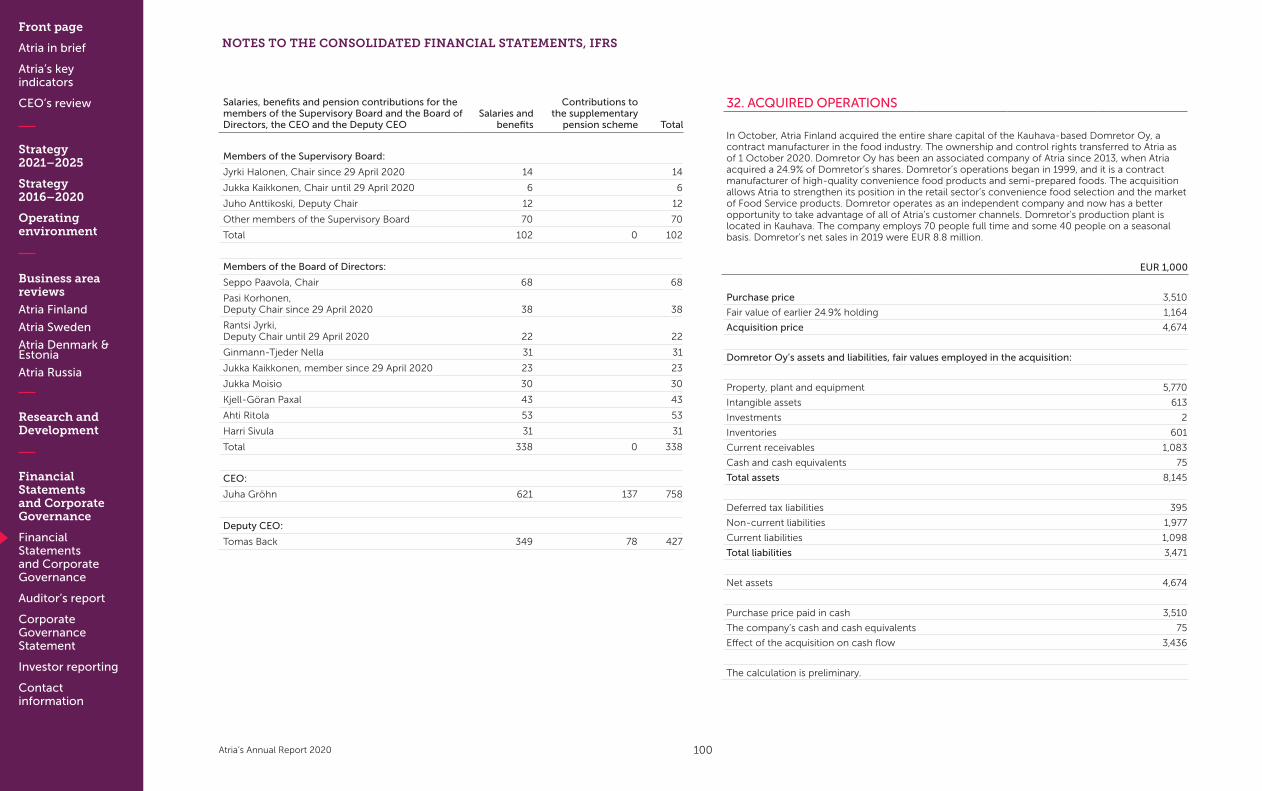
Front page
Atria in brief
Atria’s key indicators
CEO’s review
Strategy 2021–2025
Strategy 2016–2020
Operating environment
Business area reviews
Atria Finland
Atria Sweden
Atria Denmark & Estonia
Atria Russia
Research and Development
Financial Statements and Corporate Governance
Financial Statements and Corporate Governance
Auditor’s report
Corporate Governance Statement
Investor reporting
Contact information
Atria’s Annual Report 2020
NOTES TO THE CONSOLIDATED FINANCIAL STATEMENTS, IFRS
32. ACQUIRED OPERATIONS
In October, Atria Finland acquired the entire share capital of the Kauhava-based Domretor Oy, a contract manufacturer in the food industry. The ownership and control rights transferred to Atria as of 1 October 2020. Domretor Oy has been an associated company of Atria since 2013, when Atria acquired a 24.9% of Domretor’s shares. Domretor’s operations began in 1999, and it is a contract manufacturer of high-quality convenience food products and semi-prepared foods. The acquisition allows Atria to strengthen its position in the retail sector’s convenience food selection and the market of Food Service products. Domretor operates as an independent company and now has a better opportunity to take advantage of all of Atria’s customer channels. Domretor’s production plant is located in Kauhava. The company employs 70 people full time and some 40 people on a seasonal basis. Domretor’s net sales in 2019 were EUR 8.8 million.
EUR 1,000
Purchase price 3,510
Fair value of earlier 24.9% holding 1,164
Acquisition price 4,674
Domretor Oy’s assets and liabilities, fair values employed in the acquisition:
Property, plant and equipment 5,770
Intangible assets 613
Investments 2
Inventories 601
Current receivables 1,083
Cash and cash equivalents 75
Total assets 8,145
Deferred tax liabilities 395
Non-current liabilities 1,977
Current liabilities 1,098
Total liabilities 3,471
Net assets 4,674
Purchase price paid in cash 3,510
The company’s cash and cash equivalents 75
Effect of the acquisition on cash flow 3,436
The calculation is preliminary.
Salaries, benefits and pension contributions for the members of the Supervisory Board and the Board of Directors, the CEO and the Deputy CEO
Salaries and benefits
Contributions to the supplementary
pension scheme Total
Members of the Supervisory Board:
Jyrki Halonen, Chair since 29 April 2020 14 14
Jukka Kaikkonen, Chair until 29 April 2020 6 6
Juho Anttikoski, Deputy Chair 12 12
Other members of the Supervisory Board 70 70
Total 102 0 102
Members of the Board of Directors:
Seppo Paavola, Chair 68 68
Pasi Korhonen, Deputy Chair since 29 April 2020 38 38
Rantsi Jyrki, Deputy Chair until 29 April 2020 22 22
Ginmann-Tjeder Nella 31 31
Jukka Kaikkonen, member since 29 April 2020 23 23
Jukka Moisio 30 30
Kjell-Göran Paxal 43 43
Ahti Ritola 53 53
Harri Sivula 31 31
Total 338 0 338
CEO:
Juha Gröhn 621 137 758
Deputy CEO:
Tomas Back 349 78 427
100
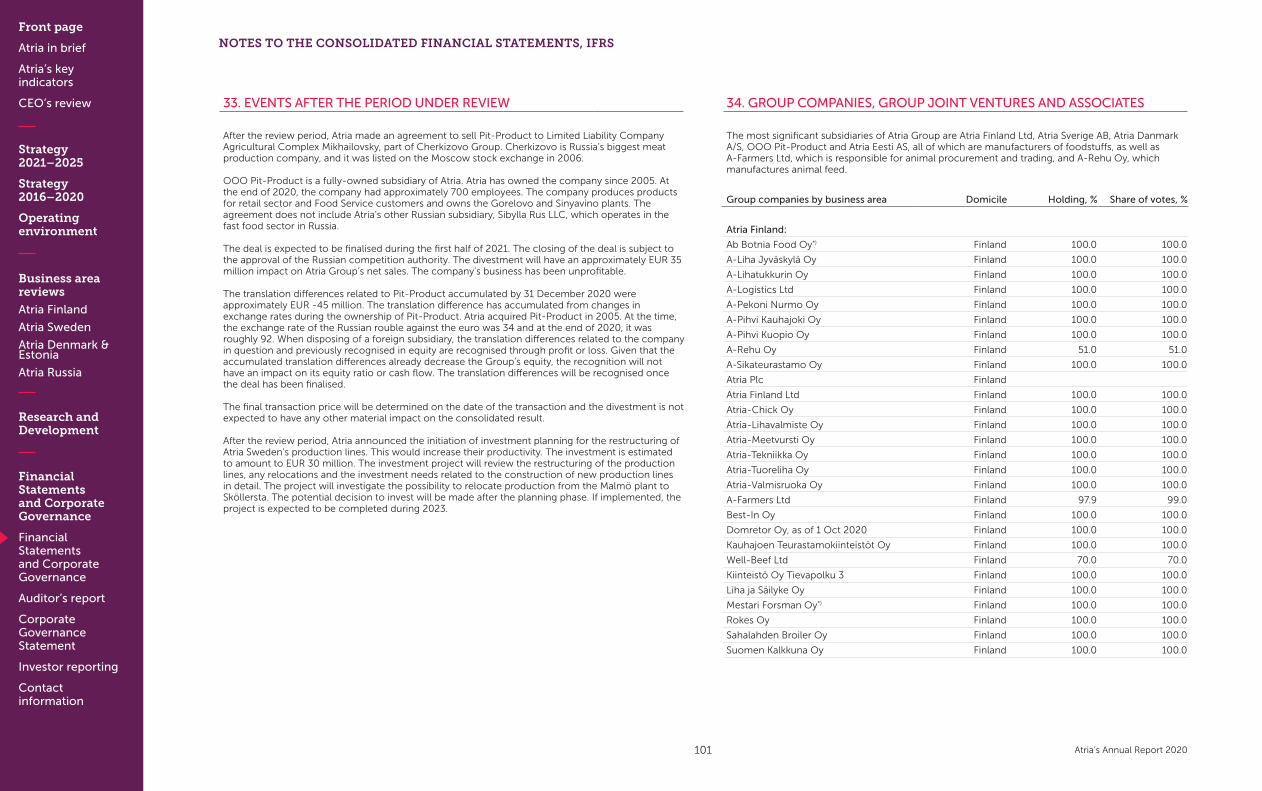
Front page
Atria in brief
Atria’s key indicators
CEO’s review
Strategy 2021–2025
Strategy 2016–2020
Operating environment
Business area reviews
Atria Finland
Atria Sweden
Atria Denmark & Estonia
Atria Russia
Research and Development
Financial Statements and Corporate Governance
Financial Statements and Corporate Governance
Auditor’s report
Corporate Governance Statement
Investor reporting
Contact information
Atria’s Annual Report 2020
33. EVENTS AFTER THE PERIOD UNDER REVIEW
After the review period, Atria made an agreement to sell Pit-Product to Limited Liability Company Agricultural Complex Mikhailovsky, part of Cherkizovo Group. Cherkizovo is Russia’s biggest meat production company, and it was listed on the Moscow stock exchange in 2006.
OOO Pit-Product is a fully-owned subsidiary of Atria. Atria has owned the company since 2005. At the end of 2020, the company had approximately 700 employees. The company produces products for retail sector and Food Service customers and owns the Gorelovo and Sinyavino plants. The agreement does not include Atria’s other Russian subsidiary, Sibylla Rus LLC, which operates in the fast food sector in Russia.
The deal is expected to be finalised during the first half of 2021. The closing of the deal is subject to the approval of the Russian competition authority. The divestment will have an approximately EUR 35 million impact on Atria Group’s net sales. The company’s business has been unprofitable.
The translation differences related to Pit-Product accumulated by 31 December 2020 were approximately EUR -45 million. The translation difference has accumulated from changes in exchange rates during the ownership of Pit-Product. Atria acquired Pit-Product in 2005. At the time, the exchange rate of the Russian rouble against the euro was 34 and at the end of 2020, it was roughly 92. When disposing of a foreign subsidiary, the translation differences related to the company in question and previously recognised in equity are recognised through profit or loss. Given that the accumulated translation differences already decrease the Group’s equity, the recognition will not have an impact on its equity ratio or cash flow. The translation differences will be recognised once the deal has been finalised.
The final transaction price will be determined on the date of the transaction and the divestment is not expected to have any other material impact on the consolidated result.
After the review period, Atria announced the initiation of investment planning for the restructuring of Atria Sweden’s production lines. This would increase their productivity. The investment is estimated to amount to EUR 30 million. The investment project will review the restructuring of the production lines, any relocations and the investment needs related to the construction of new production lines in detail. The project will investigate the possibility to relocate production from the Malmö plant to Sköllersta. The potential decision to invest will be made after the planning phase. If implemented, the project is expected to be completed during 2023.
34. GROUP COMPANIES, GROUP JOINT VENTURES AND ASSOCIATES
The most significant subsidiaries of Atria Group are Atria Finland Ltd, Atria Sverige AB, Atria Danmark A/S, OOO Pit-Product and Atria Eesti AS, all of which are manufacturers of foodstuffs, as well as A-Farmers Ltd, which is responsible for animal procurement and trading, and A-Rehu Oy, which manufactures animal feed.
Group companies by business area Domicile Holding, % Share of votes, %
Atria Finland:
Ab Botnia Food Oy*) Finland 100.0 100.0
A-Liha Jyväskylä Oy Finland 100.0 100.0
A-Lihatukkurin Oy Finland 100.0 100.0
A-Logistics Ltd Finland 100.0 100.0
A-Pekoni Nurmo Oy Finland 100.0 100.0
A-Pihvi Kauhajoki Oy Finland 100.0 100.0
A-Pihvi Kuopio Oy Finland 100.0 100.0
A-Rehu Oy Finland 51.0 51.0
A-Sikateurastamo Oy Finland 100.0 100.0
Atria Plc Finland
Atria Finland Ltd Finland 100.0 100.0
Atria-Chick Oy Finland 100.0 100.0
Atria-Lihavalmiste Oy Finland 100.0 100.0
Atria-Meetvursti Oy Finland 100.0 100.0
Atria-Tekniikka Oy Finland 100.0 100.0
Atria-Tuoreliha Oy Finland 100.0 100.0
Atria-Valmisruoka Oy Finland 100.0 100.0
A-Farmers Ltd Finland 97.9 99.0
Best-In Oy Finland 100.0 100.0
Domretor Oy, as of 1 Oct 2020 Finland 100.0 100.0
Kauhajoen Teurastamokiinteistöt Oy Finland 100.0 100.0
Well-Beef Ltd Finland 70.0 70.0
Kiinteistö Oy Tievapolku 3 Finland 100.0 100.0
Liha ja Säilyke Oy Finland 100.0 100.0
Mestari Forsman Oy*) Finland 100.0 100.0
Rokes Oy Finland 100.0 100.0
Sahalahden Broiler Oy Finland 100.0 100.0
Suomen Kalkkuna Oy Finland 100.0 100.0
NOTES TO THE CONSOLIDATED FINANCIAL STATEMENTS, IFRS
101
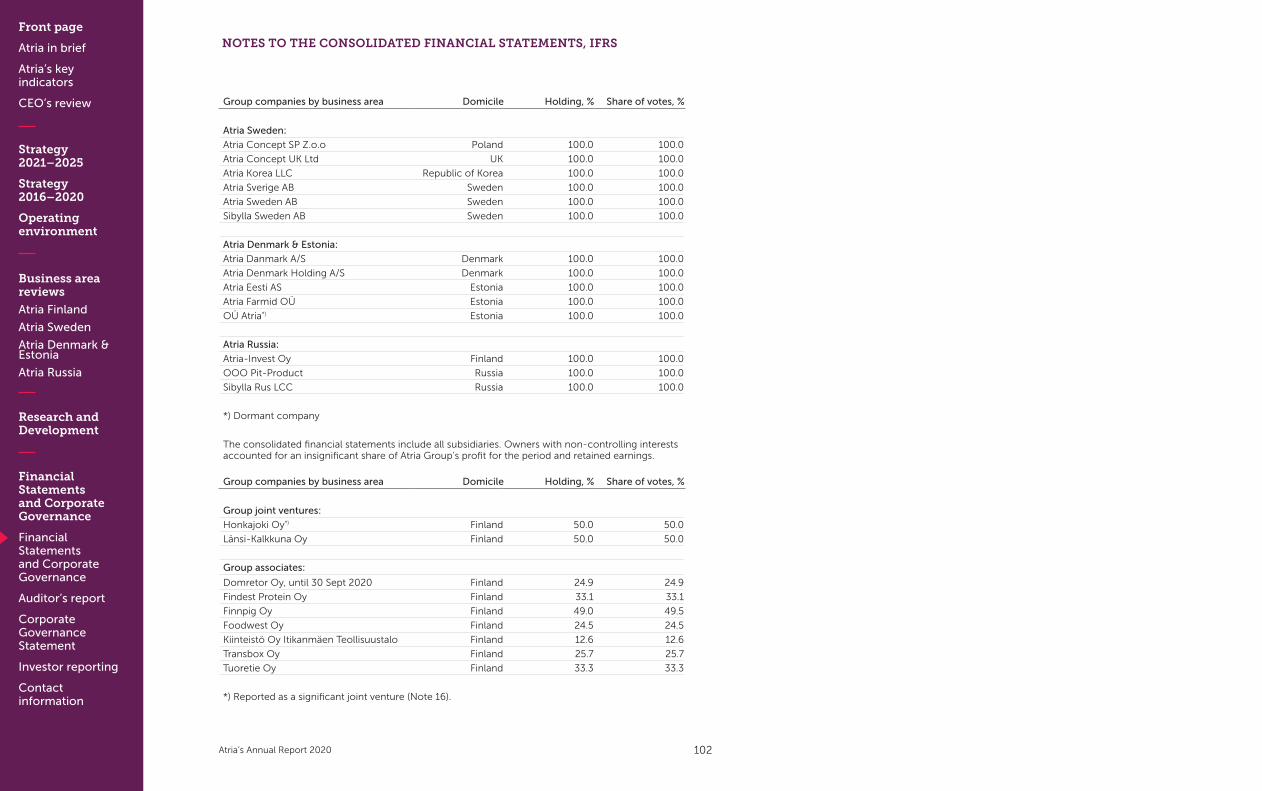
Front page
Atria in brief
Atria’s key indicators
CEO’s review
Strategy 2021–2025
Strategy 2016–2020
Operating environment
Business area reviews
Atria Finland
Atria Sweden
Atria Denmark & Estonia
Atria Russia
Research and Development
Financial Statements and Corporate Governance
Financial Statements and Corporate Governance
Auditor’s report
Corporate Governance Statement
Investor reporting
Contact information
Atria’s Annual Report 2020
NOTES TO THE CONSOLIDATED FINANCIAL STATEMENTS, IFRS
Group companies by business area Domicile Holding, % Share of votes, %
Atria Sweden:
Atria Concept SP Z.o.o Poland 100.0 100.0
Atria Concept UK Ltd UK 100.0 100.0
Atria Korea LLC Republic of Korea 100.0 100.0
Atria Sverige AB Sweden 100.0 100.0
Atria Sweden AB Sweden 100.0 100.0
Sibylla Sweden AB Sweden 100.0 100.0
Atria Denmark & Estonia:
Atria Danmark A/S Denmark 100.0 100.0
Atria Denmark Holding A/S Denmark 100.0 100.0
Atria Eesti AS Estonia 100.0 100.0
Atria Farmid OÜ Estonia 100.0 100.0
OÜ Atria*) Estonia 100.0 100.0
Atria Russia:
Atria-Invest Oy Finland 100.0 100.0
OOO Pit-Product Russia 100.0 100.0
Sibylla Rus LCC Russia 100.0 100.0
*) Dormant company
The consolidated financial statements include all subsidiaries. Owners with non-controlling interests accounted for an insignificant share of Atria Group’s profit for the period and retained earnings.
Group companies by business area Domicile Holding, % Share of votes, %
Group joint ventures:
Honkajoki Oy*) Finland 50.0 50.0
Länsi-Kalkkuna Oy Finland 50.0 50.0
Group associates:
Domretor Oy, until 30 Sept 2020 Finland 24.9 24.9
Findest Protein Oy Finland 33.1 33.1
Finnpig Oy Finland 49.0 49.5
Foodwest Oy Finland 24.5 24.5
Kiinteistö Oy Itikanmäen Teollisuustalo Finland 12.6 12.6
Transbox Oy Finland 25.7 25.7
Tuoretie Oy Finland 33.3 33.3
*) Reported as a significant joint venture (Note 16).
102
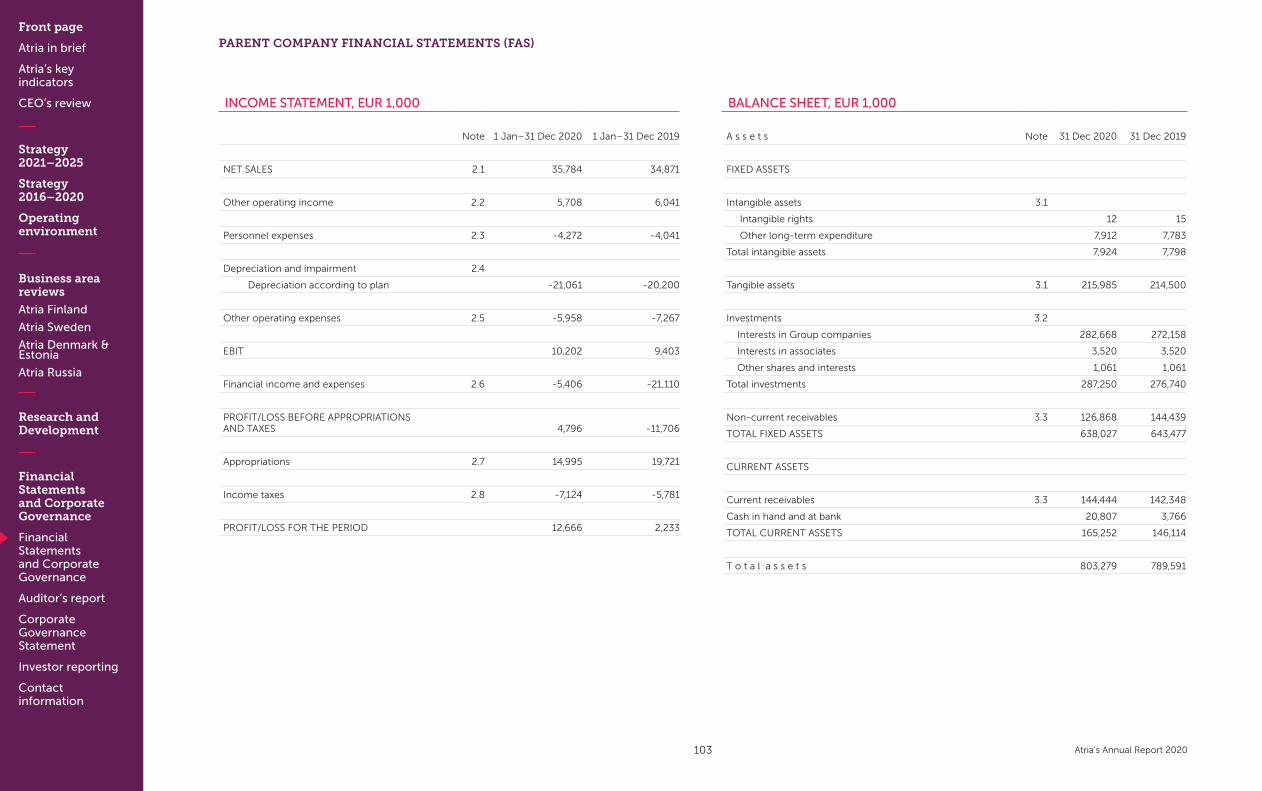
Front page
Atria in brief
Atria’s key indicators
CEO’s review
Strategy 2021–2025
Strategy 2016–2020
Operating environment
Business area reviews
Atria Finland
Atria Sweden
Atria Denmark & Estonia
Atria Russia
Research and Development
Financial Statements and Corporate Governance
Financial Statements and Corporate Governance
Auditor’s report
Corporate Governance Statement
Investor reporting
Contact information
Atria’s Annual Report 2020
BALANCE SHEET, EUR 1,000
A s s e t s Note 31 Dec 2020 31 Dec 2019
FIXED ASSETS
Intangible assets 3.1
Intangible rights 12 15
Other long-term expenditure 7,912 7,783
Total intangible assets 7,924 7,798
Tangible assets 3.1 215,985 214,500
Investments 3.2
Interests in Group companies 282,668 272,158
Interests in associates 3,520 3,520
Other shares and interests 1,061 1,061
Total investments 287,250 276,740
Non-current receivables 3.3 126,868 144,439
TOTAL FIXED ASSETS 638,027 643,477
CURRENT ASSETS
Current receivables 3.3 144,444 142,348
Cash in hand and at bank 20,807 3,766
TOTAL CURRENT ASSETS 165,252 146,114
T o t a l a s s e t s 803,279 789,591
INCOME STATEMENT, EUR 1,000
Note 1 Jan–31 Dec 2020 1 Jan–31 Dec 2019
NET SALES 2.1 35,784 34,871
Other operating income 2.2 5,708 6,041
Personnel expenses 2.3 -4,272 -4,041
Depreciation and impairment 2.4
Depreciation according to plan -21,061 -20,200
Other operating expenses 2.5 -5,958 -7,267
EBIT 10,202 9,403
Financial income and expenses 2.6 -5,406 -21,110
PROFIT/LOSS BEFORE APPROPRIATIONS AND TAXES 4,796 -11,706
Appropriations 2.7 14,995 19,721
Income taxes 2.8 -7,124 -5,781
PROFIT/LOSS FOR THE PERIOD 12,666 2,233
PARENT COMPANY FINANCIAL STATEMENTS (FAS)
103
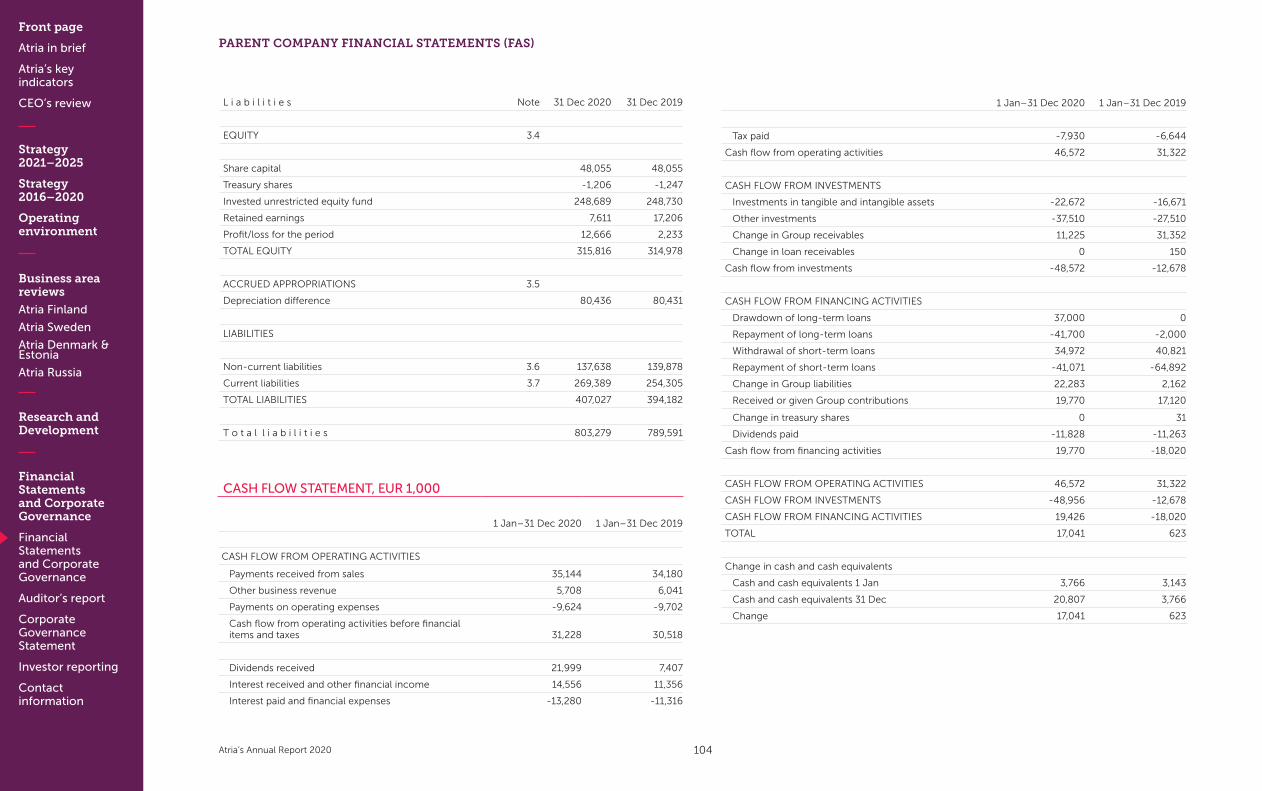
Front page
Atria in brief
Atria’s key indicators
CEO’s review
Strategy 2021–2025
Strategy 2016–2020
Operating environment
Business area reviews
Atria Finland
Atria Sweden
Atria Denmark & Estonia
Atria Russia
Research and Development
Financial Statements and Corporate Governance
Financial Statements and Corporate Governance
Auditor’s report
Corporate Governance Statement
Investor reporting
Contact information
Atria’s Annual Report 2020
1 Jan–31 Dec 2020 1 Jan–31 Dec 2019
Tax paid -7,930 -6,644
Cash flow from operating activities 46,572 31,322
CASH FLOW FROM INVESTMENTS
Investments in tangible and intangible assets -22,672 -16,671
Other investments -37,510 -27,510
Change in Group receivables 11,225 31,352
Change in loan receivables 0 150
Cash flow from investments -48,572 -12,678
CASH FLOW FROM FINANCING ACTIVITIES
Drawdown of long-term loans 37,000 0
Repayment of long-term loans -41,700 -2,000
Withdrawal of short-term loans 34,972 40,821
Repayment of short-term loans -41,071 -64,892
Change in Group liabilities 22,283 2,162
Received or given Group contributions 19,770 17,120
Change in treasury shares 0 31
Dividends paid -11,828 -11,263
Cash flow from financing activities 19,770 -18,020
CASH FLOW FROM OPERATING ACTIVITIES 46,572 31,322
CASH FLOW FROM INVESTMENTS -48,956 -12,678
CASH FLOW FROM FINANCING ACTIVITIES 19,426 -18,020
TOTAL 17,041 623
Change in cash and cash equivalents
Cash and cash equivalents 1 Jan 3,766 3,143
Cash and cash equivalents 31 Dec 20,807 3,766
Change 17,041 623
CASH FLOW STATEMENT, EUR 1,000
1 Jan–31 Dec 2020 1 Jan–31 Dec 2019
CASH FLOW FROM OPERATING ACTIVITIES
Payments received from sales 35,144 34,180
Other business revenue 5,708 6,041
Payments on operating expenses -9,624 -9,702
Cash flow from operating activities before financial items and taxes 31,228 30,518
Dividends received 21,999 7,407
Interest received and other financial income 14,556 11,356
Interest paid and financial expenses -13,280 -11,316
PARENT COMPANY FINANCIAL STATEMENTS (FAS)
L i a b i l i t i e s Note 31 Dec 2020 31 Dec 2019
EQUITY 3.4
Share capital 48,055 48,055
Treasury shares -1,206 -1,247
Invested unrestricted equity fund 248,689 248,730
Retained earnings 7,611 17,206
Profit/loss for the period 12,666 2,233
TOTAL EQUITY 315,816 314,978
ACCRUED APPROPRIATIONS 3.5
Depreciation difference 80,436 80,431
LIABILITIES
Non-current liabilities 3.6 137,638 139,878
Current liabilities 3.7 269,389 254,305
TOTAL LIABILITIES 407,027 394,182
T o t a l l i a b i l i t i e s 803,279 789,591
104

Front page
Atria in brief
Atria’s key indicators
CEO’s review
Strategy 2021–2025
Strategy 2016–2020
Operating environment
Business area reviews
Atria Finland
Atria Sweden
Atria Denmark & Estonia
Atria Russia
Research and Development
Financial Statements and Corporate Governance
Financial Statements and Corporate Governance
Auditor’s report
Corporate Governance Statement
Investor reporting
Contact information
Atria’s Annual Report 2020
PARENT COMPANY FINANCIAL STATEMENTS, FAS
1. PRINCIPLES APPLIED IN PREPARING THE FINANCIAL STATEMENTS
General principles applied in preparing the financial statements
Atria Plc’s financial statements have been drawn up in accordance with Finland’s Accounting Act and the other rules and regulations pertaining to the compilation of financial statements (FAS).
Information concerning the Group
Atria Plc is the parent company of Atria Group, and its domicile is in Kuopio, Finland.Copies of Atria Plc’s consolidated financial statements are available at the company’s head office at Itikanmäenkatu 3, Seinäjoki; postal address: P.O. Box 900, 60060 ATRIA, Finland.
Valuation principles
In the balance sheet, tangible and intangible assets are entered at their direct acquisition cost less planned depreciation and value adjustments. Depreciation is implemented on a straight-line basis over the service life of the assets. Contributions received for the acquisition of tangible assets are recognised as a decrease in acquisition costs. These contributions are not significant.
The depreciation periods are as follows:
Buildings Seinäjoki 40 years
other locations 25 years
Machinery and equipment Seinäjoki 10 years
other locations 7 years
Software 5 years
Other long-term items 10 years
Investments under non-current assets are originally entered at acquisition price. The book value of investments is assessed annually in connection with the preparation of the financial statements and, if the criteria of Chapter 5, section 13 of the Accounting Act are met, revaluations can be made as necessary.
Items presented in foreign currencies
Items expressed in foreign currencies have been converted into euro at the exchange rate quoted by the European Central Bank. The exchange differences of the realised currency-denominated loans are presented under financial items.
Financial assets and liabilities
Financial instruments are measured primarily in accordance with chapter 5, section 2 of the Accounting Act. Receivables at nominal value, although at a maximum probable value. Securi-ties and others of the kind falling under the scope of financial assets at acquisition cost or, if their probable normal value on the closing date is less than that, at this value. Liabilities at nominal value or, if the debt is tied to an index or some other basis for comparison, to the value higher than the nominal value pursuant to the changed basis for comparison.
Derivative financial instruments
Of financial instruments, derivatives are measured at fair value in accordance with the alternative practice presented in chapter 5, section 2a of the Accounting Act. Derivatives are accounted for as hedging. The company enters into derivative contracts mainly to hedge against fluctuations in inte-rest rates and currency exchange rates. The derivatives used are forward exchange agreements and interest rate swaps. The company recognises derivatives at fair value on the balance sheet when the derivative contract enters into force Interest rate swaps have been recognised in accordance with this principle since the 2018 financial year. Derivatives are measured at fair value on the balance sheet date, and gains and losses arising from the valuation difference are recognised in financial income and expenses in the income statement.
105
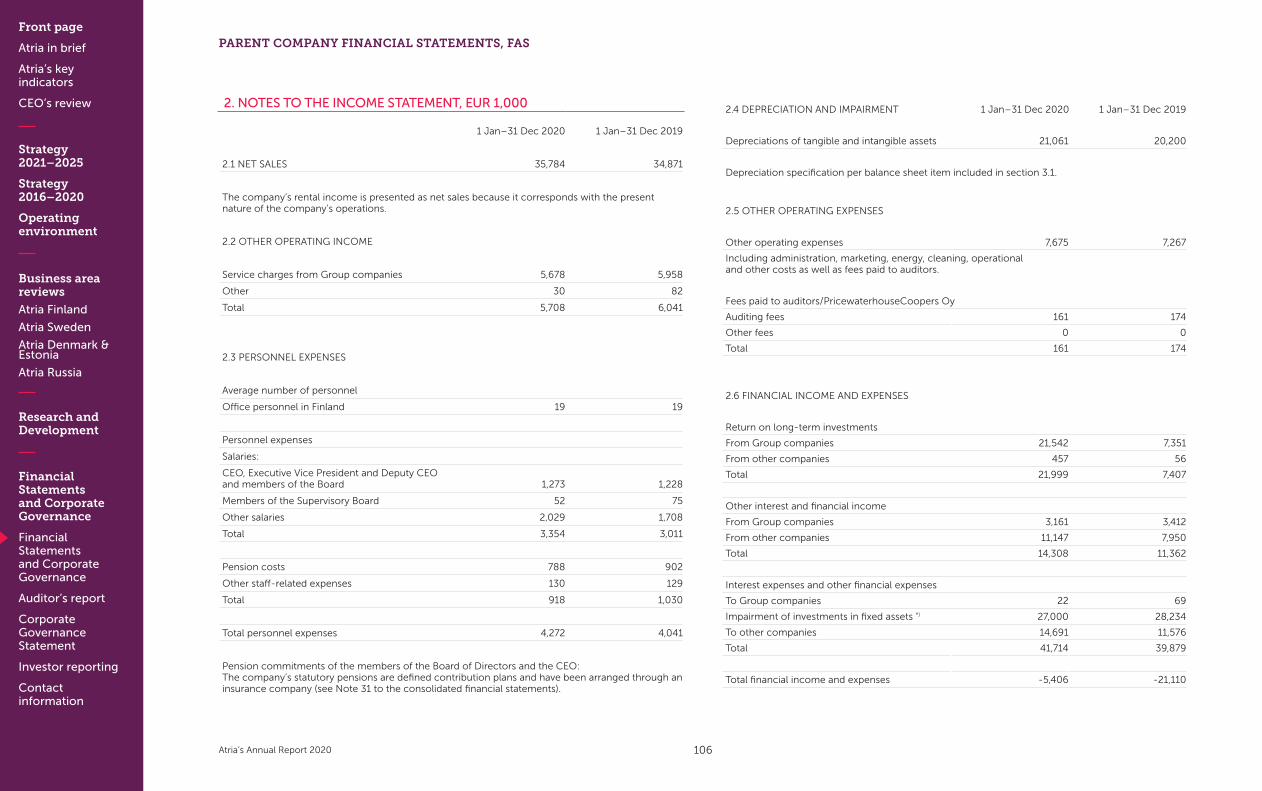
Front page
Atria in brief
Atria’s key indicators
CEO’s review
Strategy 2021–2025
Strategy 2016–2020
Operating environment
Business area reviews
Atria Finland
Atria Sweden
Atria Denmark & Estonia
Atria Russia
Research and Development
Financial Statements and Corporate Governance
Financial Statements and Corporate Governance
Auditor’s report
Corporate Governance Statement
Investor reporting
Contact information
Atria’s Annual Report 2020
PARENT COMPANY FINANCIAL STATEMENTS, FAS
2. NOTES TO THE INCOME STATEMENT, EUR 1,000
1 Jan–31 Dec 2020 1 Jan–31 Dec 2019
2.1 NET SALES 35,784 34,871
The company’s rental income is presented as net sales because it corresponds with the present nature of the company’s operations.
2.2 OTHER OPERATING INCOME
Service charges from Group companies 5,678 5,958
Other 30 82
Total 5,708 6,041
2.3 PERSONNEL EXPENSES
Average number of personnel
Office personnel in Finland 19 19
Personnel expenses
Salaries:
CEO, Executive Vice President and Deputy CEO and members of the Board 1,273 1,228
Members of the Supervisory Board 52 75
Other salaries 2,029 1,708
Total 3,354 3,011
Pension costs 788 902
Other staff-related expenses 130 129
Total 918 1,030
Total personnel expenses 4,272 4,041
Pension commitments of the members of the Board of Directors and the CEO:The company’s statutory pensions are defined contribution plans and have been arranged through an insurance company (see Note 31 to the consolidated financial statements).
2.4 DEPRECIATION AND IMPAIRMENT 1 Jan–31 Dec 2020 1 Jan–31 Dec 2019
Depreciations of tangible and intangible assets 21,061 20,200
Depreciation specification per balance sheet item included in section 3.1.
2.5 OTHER OPERATING EXPENSES
Other operating expenses 7,675 7,267
Including administration, marketing, energy, cleaning, operational and other costs as well as fees paid to auditors.
Fees paid to auditors/PricewaterhouseCoopers Oy
Auditing fees 161 174
Other fees 0 0
Total 161 174
2.6 FINANCIAL INCOME AND EXPENSES
Return on long-term investments
From Group companies 21,542 7,351
From other companies 457 56
Total 21,999 7,407
Other interest and financial income
From Group companies 3,161 3,412
From other companies 11,147 7,950
Total 14,308 11,362
Interest expenses and other financial expenses
To Group companies 22 69
Impairment of investments in fixed assets *) 27,000 28,234
To other companies 14,691 11,576
Total 41,714 39,879
Total financial income and expenses -5,406 -21,110
106
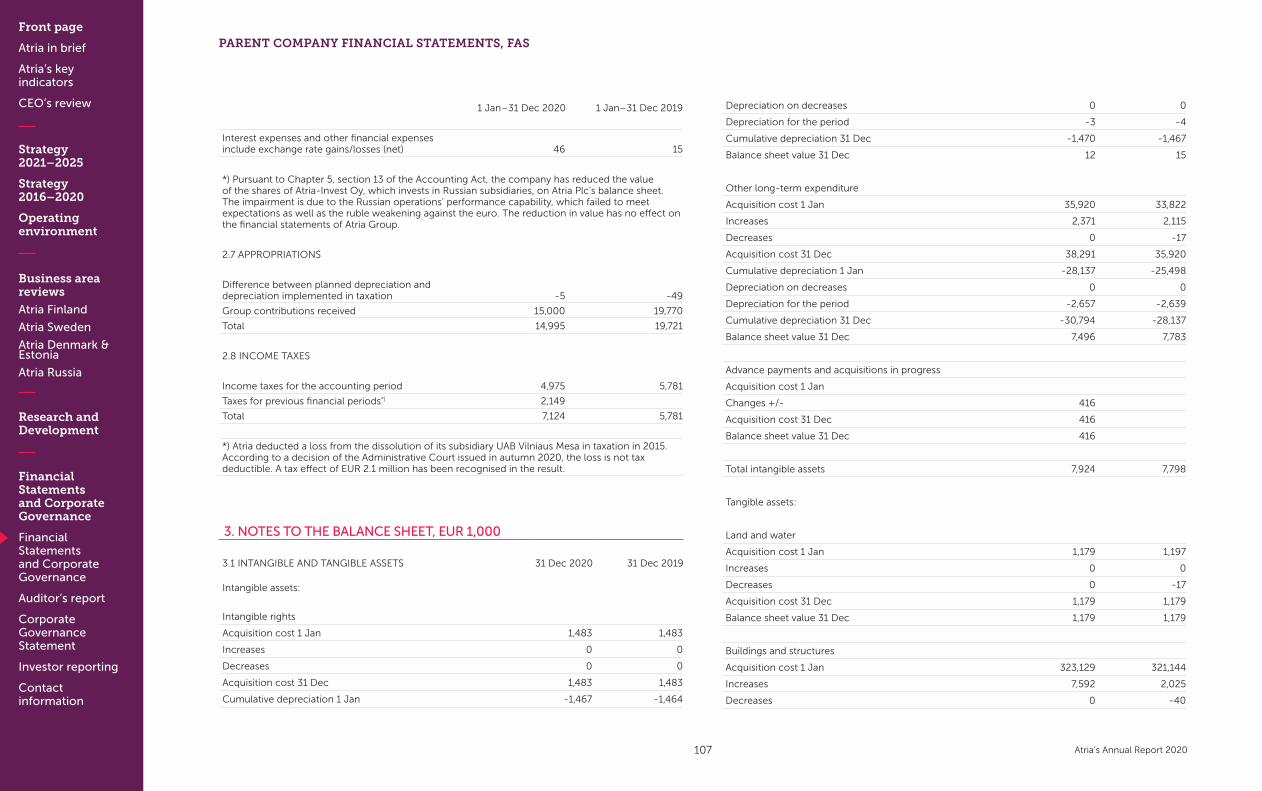
Front page
Atria in brief
Atria’s key indicators
CEO’s review
Strategy 2021–2025
Strategy 2016–2020
Operating environment
Business area reviews
Atria Finland
Atria Sweden
Atria Denmark & Estonia
Atria Russia
Research and Development
Financial Statements and Corporate Governance
Financial Statements and Corporate Governance
Auditor’s report
Corporate Governance Statement
Investor reporting
Contact information
Atria’s Annual Report 2020
3. NOTES TO THE BALANCE SHEET, EUR 1,000
3.1 INTANGIBLE AND TANGIBLE ASSETS 31 Dec 2020 31 Dec 2019
Intangible assets:
Intangible rights
Acquisition cost 1 Jan 1,483 1,483
Increases 0 0
Decreases 0 0
Acquisition cost 31 Dec 1,483 1,483
Cumulative depreciation 1 Jan -1,467 -1,464
Depreciation on decreases 0 0
Depreciation for the period -3 -4
Cumulative depreciation 31 Dec -1,470 -1,467
Balance sheet value 31 Dec 12 15
Other long-term expenditure
Acquisition cost 1 Jan 35,920 33,822
Increases 2,371 2,115
Decreases 0 -17
Acquisition cost 31 Dec 38,291 35,920
Cumulative depreciation 1 Jan -28,137 -25,498
Depreciation on decreases 0 0
Depreciation for the period -2,657 -2,639
Cumulative depreciation 31 Dec -30,794 -28,137
Balance sheet value 31 Dec 7,496 7,783
Advance payments and acquisitions in progress
Acquisition cost 1 Jan
Changes +/- 416
Acquisition cost 31 Dec 416
Balance sheet value 31 Dec 416
Total intangible assets 7,924 7,798
Tangible assets:
Land and water
Acquisition cost 1 Jan 1,179 1,197
Increases 0 0
Decreases 0 -17
Acquisition cost 31 Dec 1,179 1,179
Balance sheet value 31 Dec 1,179 1,179
Buildings and structures
Acquisition cost 1 Jan 323,129 321,144
Increases 7,592 2,025
Decreases 0 -40
1 Jan–31 Dec 2020 1 Jan–31 Dec 2019
Interest expenses and other financial expenses include exchange rate gains/losses (net) 46 15
*) Pursuant to Chapter 5, section 13 of the Accounting Act, the company has reduced the value of the shares of Atria-Invest Oy, which invests in Russian subsidiaries, on Atria Plc’s balance sheet. The impairment is due to the Russian operations’ performance capability, which failed to meet expectations as well as the ruble weakening against the euro. The reduction in value has no effect on the financial statements of Atria Group.
2.7 APPROPRIATIONS
Difference between planned depreciation and depreciation implemented in taxation -5 -49
Group contributions received 15,000 19,770
Total 14,995 19,721
2.8 INCOME TAXES
Income taxes for the accounting period 4,975 5,781
Taxes for previous financial periods*) 2,149
Total 7,124 5,781
*) Atria deducted a loss from the dissolution of its subsidiary UAB Vilniaus Mesa in taxation in 2015. According to a decision of the Administrative Court issued in autumn 2020, the loss is not tax deductible. A tax effect of EUR 2.1 million has been recognised in the result.
PARENT COMPANY FINANCIAL STATEMENTS, FAS
107
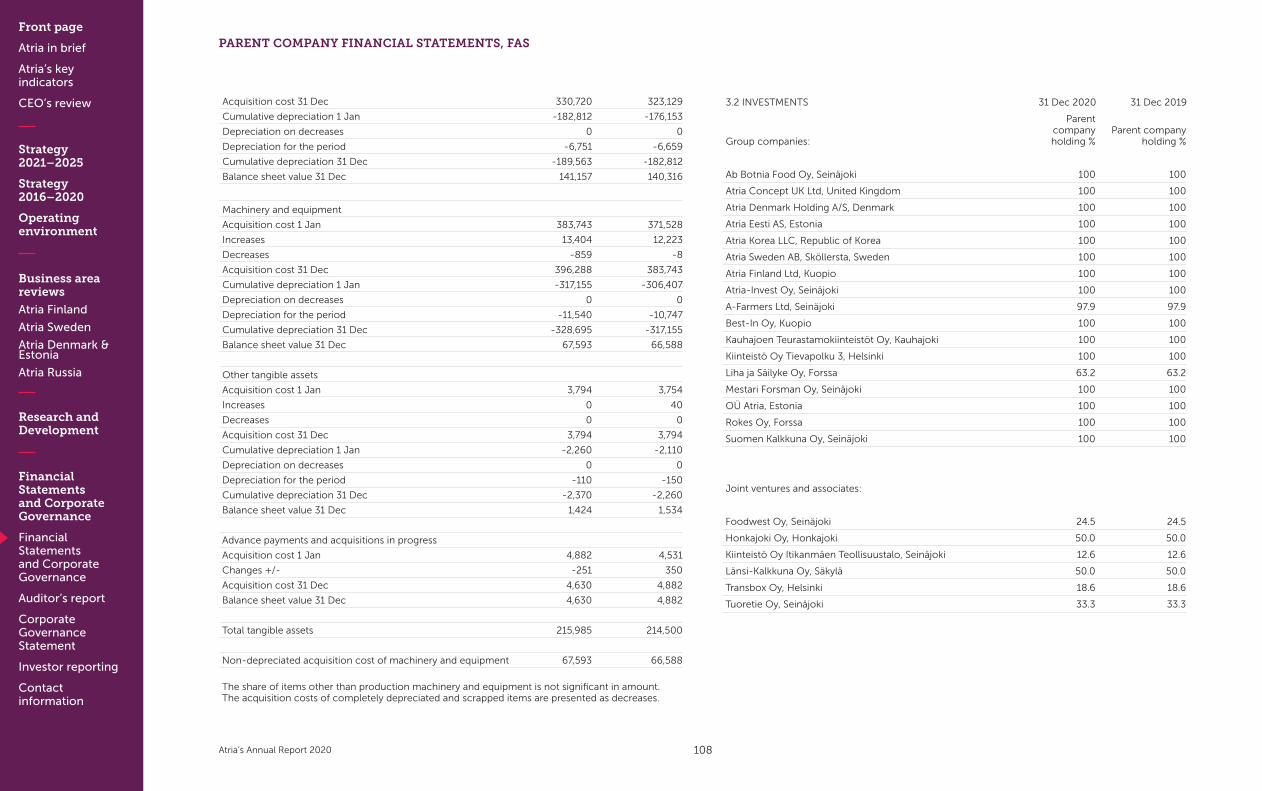
Front page
Atria in brief
Atria’s key indicators
CEO’s review
Strategy 2021–2025
Strategy 2016–2020
Operating environment
Business area reviews
Atria Finland
Atria Sweden
Atria Denmark & Estonia
Atria Russia
Research and Development
Financial Statements and Corporate Governance
Financial Statements and Corporate Governance
Auditor’s report
Corporate Governance Statement
Investor reporting
Contact information
Atria’s Annual Report 2020
PARENT COMPANY FINANCIAL STATEMENTS, FAS
Acquisition cost 31 Dec 330,720 323,129
Cumulative depreciation 1 Jan -182,812 -176,153
Depreciation on decreases 0 0
Depreciation for the period -6,751 -6,659
Cumulative depreciation 31 Dec -189,563 -182,812
Balance sheet value 31 Dec 141,157 140,316
Machinery and equipment
Acquisition cost 1 Jan 383,743 371,528
Increases 13,404 12,223
Decreases -859 -8
Acquisition cost 31 Dec 396,288 383,743
Cumulative depreciation 1 Jan -317,155 -306,407
Depreciation on decreases 0 0
Depreciation for the period -11,540 -10,747
Cumulative depreciation 31 Dec -328,695 -317,155
Balance sheet value 31 Dec 67,593 66,588
Other tangible assets
Acquisition cost 1 Jan 3,794 3,754
Increases 0 40
Decreases 0 0
Acquisition cost 31 Dec 3,794 3,794
Cumulative depreciation 1 Jan -2,260 -2,110
Depreciation on decreases 0 0
Depreciation for the period -110 -150
Cumulative depreciation 31 Dec -2,370 -2,260
Balance sheet value 31 Dec 1,424 1,534
Advance payments and acquisitions in progress
Acquisition cost 1 Jan 4,882 4,531
Changes +/- -251 350
Acquisition cost 31 Dec 4,630 4,882
Balance sheet value 31 Dec 4,630 4,882
Total tangible assets 215,985 214,500
Non-depreciated acquisition cost of machinery and equipment 67,593 66,588
The share of items other than production machinery and equipment is not significant in amount.The acquisition costs of completely depreciated and scrapped items are presented as decreases.
3.2 INVESTMENTS 31 Dec 2020 31 Dec 2019
Group companies:
Parent company holding %
Parent company holding %
Ab Botnia Food Oy, Seinäjoki 100 100
Atria Concept UK Ltd, United Kingdom 100 100
Atria Denmark Holding A/S, Denmark 100 100
Atria Eesti AS, Estonia 100 100
Atria Korea LLC, Republic of Korea 100 100
Atria Sweden AB, Sköllersta, Sweden 100 100
Atria Finland Ltd, Kuopio 100 100
Atria-Invest Oy, Seinäjoki 100 100
A-Farmers Ltd, Seinäjoki 97.9 97.9
Best-In Oy, Kuopio 100 100
Kauhajoen Teurastamokiinteistöt Oy, Kauhajoki 100 100
Kiinteistö Oy Tievapolku 3, Helsinki 100 100
Liha ja Säilyke Oy, Forssa 63.2 63.2
Mestari Forsman Oy, Seinäjoki 100 100
OÜ Atria, Estonia 100 100
Rokes Oy, Forssa 100 100
Suomen Kalkkuna Oy, Seinäjoki 100 100
Joint ventures and associates:
Foodwest Oy, Seinäjoki 24.5 24.5
Honkajoki Oy, Honkajoki 50.0 50.0
Kiinteistö Oy Itikanmäen Teollisuustalo, Seinäjoki 12.6 12.6
Länsi-Kalkkuna Oy, Säkylä 50.0 50.0
Transbox Oy, Helsinki 18.6 18.6
Tuoretie Oy, Seinäjoki 33.3 33.3
108

Front page
Atria in brief
Atria’s key indicators
CEO’s review
Strategy 2021–2025
Strategy 2016–2020
Operating environment
Business area reviews
Atria Finland
Atria Sweden
Atria Denmark & Estonia
Atria Russia
Research and Development
Financial Statements and Corporate Governance
Financial Statements and Corporate Governance
Auditor’s report
Corporate Governance Statement
Investor reporting
Contact information
Atria’s Annual Report 2020
3.3 RECEIVABLES 31 Dec 2020 31 Dec 2019
Non-current receivables:
Loan receivables 5 5
Receivables from group companies:
Loan receivables 126,863 144,434
Total non-current receivables 126,868 144,439
Current receivables:
Trade receivables 3 67
Other receivables -4 -4
Accrued credits and deferred charges 473 383
Receivables from group companies:
Trade receivables 2,500 1,795
Other receivables 125,829 119,483
Accrued credits and deferred charges 15,643 20,623
Total current receivables 144,444 142,348
Material items included in accrued credits and deferred charges:
– Group contributions 15,000 19,770
– amortised interest 646 857
– valuation of forward contracts 0 37
– other 470 343
Total 16,117 21,006
3.4 EQUITY 31 Dec 2020 31 Dec 2019
Share capital 1 Jan 48,055 48,055
Share capital 31 Dec 48,055 48,055
Total restricted equity 48,055 48,055
Treasury shares 1 Jan -1,247 -1,277
Share incentives 41 31
Treasury shares 31 Dec -1,206 -1,247
Invested unrestricted equity fund 1 Jan 248,730 248,730
Change -41
Invested unrestricted equity fund 31 Dec 248,689 248,730
Retained earnings 1 Jan 19,440 28,469
Distribution of dividends -11,828 -11,263
Retained earnings 31 Dec 7,611 17,206
Profit/loss for the period 12,666 2,233
Retained earnings 31 Dec 20,278 19,440
Total unrestricted equity 267,761 266,923
Total equity 315,816 314,978
At the end of the financial period on 31 December 2020, the company held a total of 105,311 treasury shares, representing 0.4% of the shares and 0.1% of the votes in the company.
The number of treasury shares transferred as share incentives during the financial period was 3,429.
Calculation of distributable funds:
Invested unrestricted equity fund 248,689 248,730
Retained earnings 7,611 17,206
Profit/loss for the period 12,666 2,233
Treasury shares -1,206 -1,247
Total 267,761 266,923
PARENT COMPANY FINANCIAL STATEMENTS, FAS
109
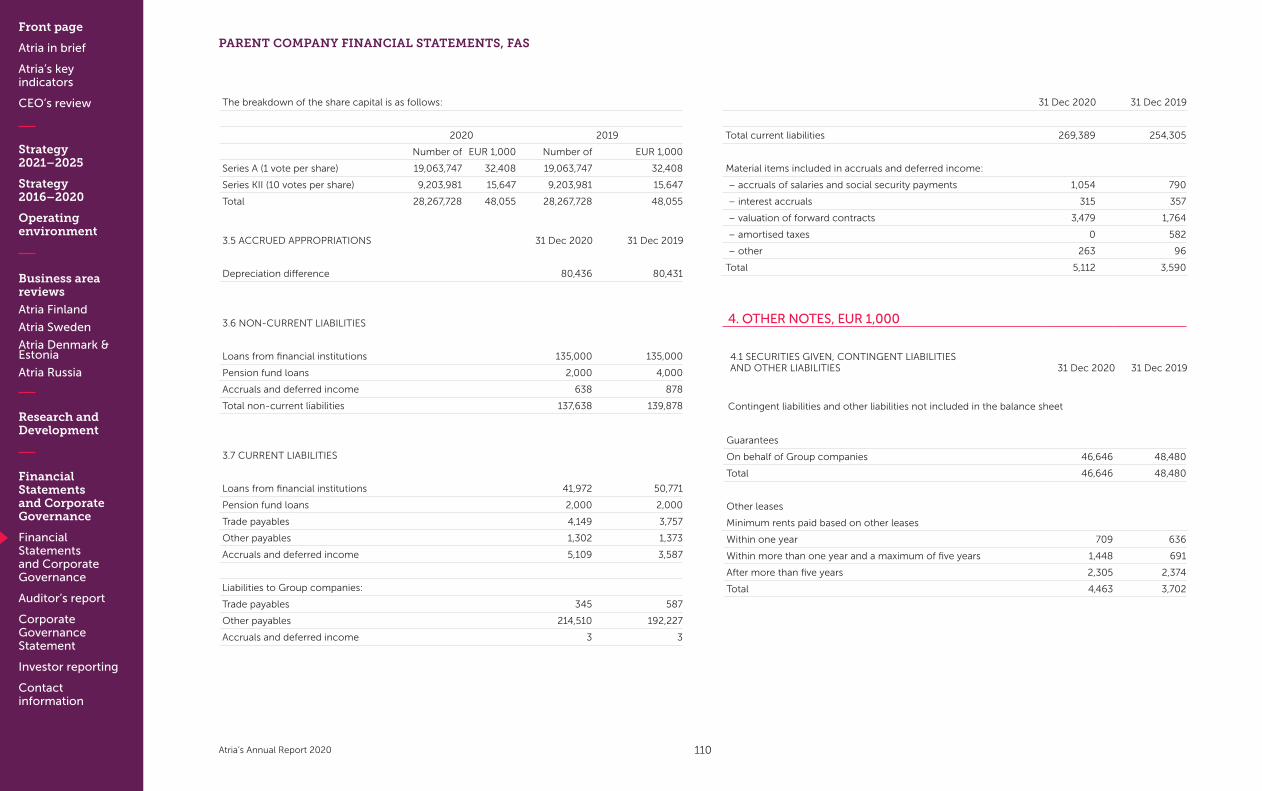
Front page
Atria in brief
Atria’s key indicators
CEO’s review
Strategy 2021–2025
Strategy 2016–2020
Operating environment
Business area reviews
Atria Finland
Atria Sweden
Atria Denmark & Estonia
Atria Russia
Research and Development
Financial Statements and Corporate Governance
Financial Statements and Corporate Governance
Auditor’s report
Corporate Governance Statement
Investor reporting
Contact information
Atria’s Annual Report 2020
PARENT COMPANY FINANCIAL STATEMENTS, FAS
The breakdown of the share capital is as follows:
2020 2019
Number of EUR 1,000 Number of EUR 1,000
Series A (1 vote per share) 19,063,747 32,408 19,063,747 32,408
Series KII (10 votes per share) 9,203,981 15,647 9,203,981 15,647
Total 28,267,728 48,055 28,267,728 48,055
3.5 ACCRUED APPROPRIATIONS 31 Dec 2020 31 Dec 2019
Depreciation difference 80,436 80,431
3.6 NON-CURRENT LIABILITIES
Loans from financial institutions 135,000 135,000
Pension fund loans 2,000 4,000
Accruals and deferred income 638 878
Total non-current liabilities 137,638 139,878
3.7 CURRENT LIABILITIES
Loans from financial institutions 41,972 50,771
Pension fund loans 2,000 2,000
Trade payables 4,149 3,757
Other payables 1,302 1,373
Accruals and deferred income 5,109 3,587
Liabilities to Group companies:
Trade payables 345 587
Other payables 214,510 192,227
Accruals and deferred income 3 3
31 Dec 2020 31 Dec 2019
Total current liabilities 269,389 254,305
Material items included in accruals and deferred income:
– accruals of salaries and social security payments 1,054 790
– interest accruals 315 357
– valuation of forward contracts 3,479 1,764
– amortised taxes 0 582
– other 263 96
Total 5,112 3,590
4. OTHER NOTES, EUR 1,000
4.1 SECURITIES GIVEN, CONTINGENT LIABILITIES AND OTHER LIABILITIES 31 Dec 2020 31 Dec 2019
Contingent liabilities and other liabilities not included in the balance sheet
Guarantees
On behalf of Group companies 46,646 48,480
Total 46,646 48,480
Other leases
Minimum rents paid based on other leases
Within one year 709 636
Within more than one year and a maximum of five years 1,448 691
After more than five years 2,305 2,374
Total 4,463 3,702
110

Front page
Atria in brief
Atria’s key indicators
CEO’s review
Strategy 2021–2025
Strategy 2016–2020
Operating environment
Business area reviews
Atria Finland
Atria Sweden
Atria Denmark & Estonia
Atria Russia
Research and Development
Financial Statements and Corporate Governance
Financial Statements and Corporate Governance
Auditor’s report
Corporate Governance Statement
Investor reporting
Contact information
Atria’s Annual Report 2020
4.4 DERIVATIVE FINANCIAL INSTRUMENTS
Fair values of derivative instruments:
Derivative assets31 Dec 2020
Derivative liabilities31 Dec 2020
Net fair value31 Dec 2020
Net fair value31 Dec 2019
Forward exchange agreements(maturity less than a year) 0 -3,479 -3,479 -1,728
Interest rate swaps -639 -639 -878
Total 0 -4,118 -4,118 -2,605
Nominal values of derivative financial instruments: 31 Dec 2020 31 Dec 2019
Forward exchange agreements 102,878 97,690
Interest rate swaps 30,000 30,000
Total 132,878 127,690
The grounds employed to determine the fair value of derivative financial instruments are consistent with the Group’s principles. Detailed information concerning derivatives (including risk management and hierarchy levels) are presented in Note 29 to the consolidated financial statements.
4.2 VAT LIABILITIES
The company has made property investments as referred to in the Value Added Tax Act. The remaining verification liability of these investments was assessed for each verification period on 31 December 2020.
31 Dec 2020 31 Dec 2019
Year of completion of the investment Remaining amount of
verification liability
2011 177
2012 91 181
2013 174 260
2014 278 371
2015 838 1,047
2016 948 1,138
2017 671 783
2018 378 432
2019 577 650
2020 1,435
Total 5,389 5,039
The company is obliged to verify reductions in VAT on property investments if the taxable use of the properties decreases during the verification period.
4.3 INTEREST RATE SWAPS
To be hedged:A loan of EUR 30 million, 22 September 2020 – 25 September 2027, interest 6-month EuriborHedging derivative:Interest rate swap with a nominal value of EUR 30 million; the company receives a six-month Euribor rate and pays a fixed interest rate; the fair value of the agreement on the closing date is EUR -639,000. The cash flow from the interest rate swap is recognised in the income statement with the same periods as the interest flows from the hedged loan.
PARENT COMPANY FINANCIAL STATEMENTS, FAS
111
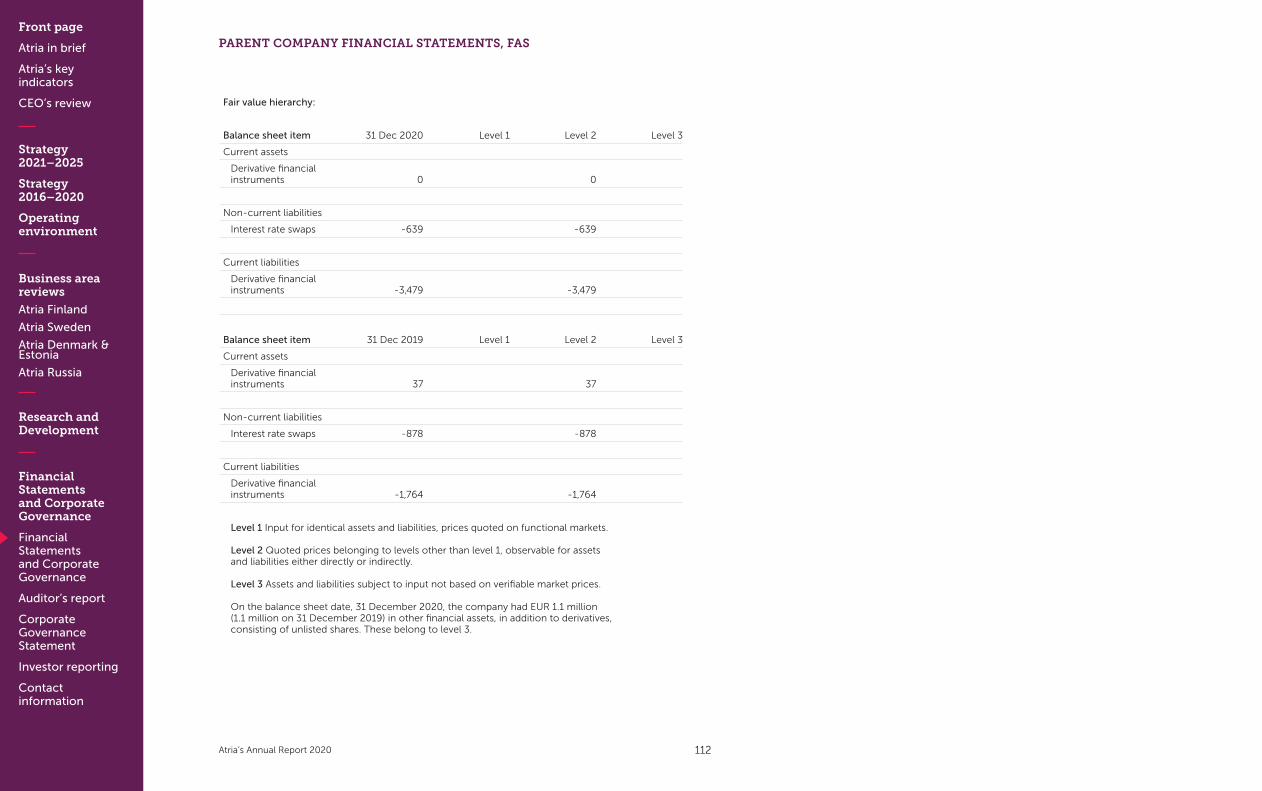
Front page
Atria in brief
Atria’s key indicators
CEO’s review
Strategy 2021–2025
Strategy 2016–2020
Operating environment
Business area reviews
Atria Finland
Atria Sweden
Atria Denmark & Estonia
Atria Russia
Research and Development
Financial Statements and Corporate Governance
Financial Statements and Corporate Governance
Auditor’s report
Corporate Governance Statement
Investor reporting
Contact information
Atria’s Annual Report 2020
PARENT COMPANY FINANCIAL STATEMENTS, FAS
Fair value hierarchy:
Balance sheet item 31 Dec 2020 Level 1 Level 2 Level 3
Current assets
Derivative financial instruments 0 0
Non-current liabilities
Interest rate swaps -639 -639
Current liabilities
Derivative financial instruments -3,479 -3,479
Balance sheet item 31 Dec 2019 Level 1 Level 2 Level 3
Current assets
Derivative financial instruments 37 37
Non-current liabilities
Interest rate swaps -878 -878
Current liabilities
Derivative financial instruments -1,764 -1,764
Level 1 Input for identical assets and liabilities, prices quoted on functional markets.
Level 2 Quoted prices belonging to levels other than level 1, observable for assets and liabilities either directly or indirectly. Level 3 Assets and liabilities subject to input not based on verifiable market prices. On the balance sheet date, 31 December 2020, the company had EUR 1.1 million (1.1 million on 31 December 2019) in other financial assets, in addition to derivatives, consisting of unlisted shares. These belong to level 3.
112
Front page
Atria in brief
Atria’s key indicators
CEO’s review
Strategy 2021–2025
Strategy 2016–2020
Operating environment
Business area reviews
Atria Finland
Atria Sweden
Atria Denmark & Estonia
Atria Russia
Research and Development
Financial Statements and Corporate Governance
Financial Statements and Corporate Governance
Auditor’s report
Corporate Governance Statement
Investor reporting
Contact information
Atria’s Annual Report 2020
SIGNATURES
Signatures to the financial statements and annual report
Seinäjoki, 18 March 2021
Seppo Paavola Nella Ginman-TjederChair
Jukka Kaikkonen Pasi Korhonen
Jukka Moisio Kjell-Göran Paxal
Ahti Ritola Harri Sivula
Juha GröhnCEO
Note to the financial statements
A report on the audit performed has been issued today.
Seinäjoki, 18 March 2021PricewaterhouseCoopers OyFirm of authorised public accountants
Samuli PeräläAuthorised public accountant
113
Front page
Atria in brief
Atria’s key indicators
CEO’s review
Strategy 2021–2025
Strategy 2016–2020
Operating environment
Business area reviews
Atria Finland
Atria Sweden
Atria Denmark & Estonia
Atria Russia
Research and Development
Financial Statements and Corporate Governance
Financial Statements and Corporate Governance
Auditor’s report
Corporate Governance Statement
Investor reporting
Contact information
Atria’s Annual Report 2020
PARENT COMPANY FINANCIAL STATEMENTS, FAS
Report on the Audit of the Financial StatementsTo the Annual General Meeting of Atria Plc
REPORT ON THE AUDIT OF THE FINANCIAL STATEMENTS
OPINIONIn our opinion • the consolidated financial statements give a true and fair view of the group’s financial posi-
tion and financial performance and cash flows in accordance with International Financial Reporting Standards (IFRS) as adopted by the EU
• the financial statements give a true and fair view of the parent company’s financial perfor-mance and financial position in accordance with the laws and regulations governing the preparation of the financial statements in Finland and comply with statutory requirements.
Our opinion is consistent with the additional report to the Board of Directors.
What we have auditedWe have audited the financial statements of Atria Plc (business identity code 0841066-1) for the period of 1 January to 31 December 2020. The financial statements comprise:• the consolidated balance sheet, income statement, statement of comprehensive income,
statement of changes in equity, statement of cash flows and notes, including a summary of significant accounting policies
• the parent company’s balance sheet, income statement, statement of cash flows and notes.
BASIS FOR OPINION We conducted our audit in accordance with good auditing practice in Finland. Our responsi-bilities under good auditing practice are further described in the Auditor’s Responsibilities for the Audit of the Financial Statements section of our report.
We believe that the audit evidence we have obtained is sufficient and appropriate to provide a basis for our opinion.
IndependenceWe are independent of the parent company and of the group companies in accordance with the ethical requirements that are applicable in Finland and are relevant to our audit, and we have fulfilled our other ethical responsibilities in accordance with these requirements.
To the best of our knowledge and belief, the non-audit services that we have provided to the parent company and to the group companies are in accordance with the applicable law and regulations in Finland and we have not provided non-audit services that are prohibited under Article 5(1) of Regulation (EU) No 537/2014. The non-audit services that we have provided are disclosed in note 4 to the Financial Statements.
OUR AUDIT APPROACH
Overview• Overall group materiality: 2,600,000 euros.
• Audit scope: The audit scope included the parent company of the Group and subsidiaries in Finland, Sweden, Russia, Estonia and Denmark.
The following items have been recognised as key audit matters:• Revenue recognition• Valuation of goodwill and trademarks• Valuation of inventory• Valuation of subsidiary shares and loan receivables (applies only to the parent company)
As part of designing our audit, we determined materiality and assessed the risks of material misstatement in the financial statements. In particular, we considered where management made subjective judgements; for example, in respect of significant accounting estimates that involved making assumptions and considering future events that are inherently uncer-tain.
MaterialityThe scope of our audit was influenced by our application of materiality. An audit is designed to obtain reasonable assurance whether the financial statements are free from material misstatement. Misstatements may arise due to fraud or error. They are considered material if individually or in aggregate, they could reasonably be expected to influence the economic decisions of users taken on the basis of the financial statements.
Based on our professional judgement, we determined certain quantitative thresholds for materiality, including the overall group materiality for the consolidated financial statements as set out in the table below. These, together with qualitative considerations, helped us to determine the scope of our audit and the nature, timing and extent of our audit procedures and to evaluate the effect of misstatements on the financial statements as a whole.
Materiality
Group scoping
Key audit
matters
114
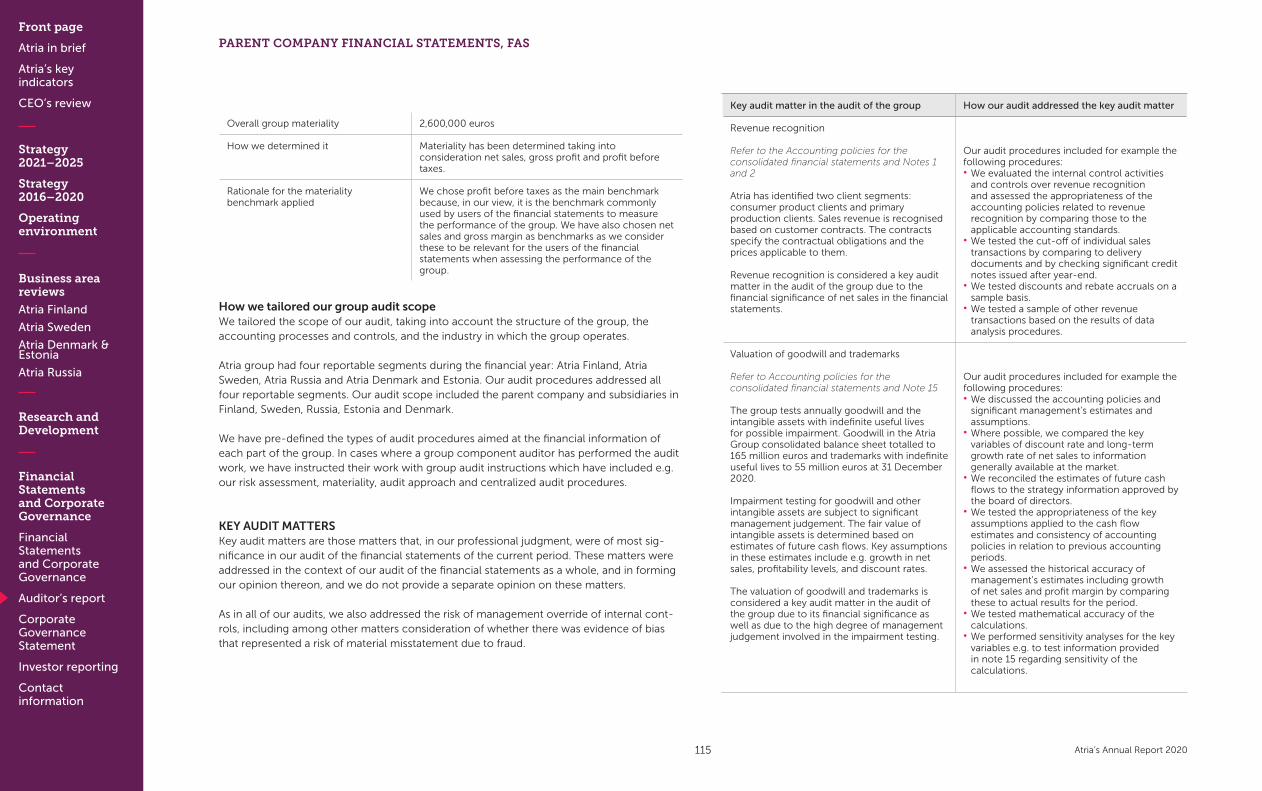
Front page
Atria in brief
Atria’s key indicators
CEO’s review
Strategy 2021–2025
Strategy 2016–2020
Operating environment
Business area reviews
Atria Finland
Atria Sweden
Atria Denmark & Estonia
Atria Russia
Research and Development
Financial Statements and Corporate Governance
Financial Statements and Corporate Governance
Auditor’s report
Corporate Governance Statement
Investor reporting
Contact information
Atria’s Annual Report 2020
Overall group materiality 2,600,000 euros
How we determined it Materiality has been determined taking into consideration net sales, gross profit and profit before taxes.
Rationale for the materiality benchmark applied
We chose profit before taxes as the main benchmark because, in our view, it is the benchmark commonly used by users of the financial statements to measure the performance of the group. We have also chosen net sales and gross margin as benchmarks as we consider these to be relevant for the users of the financial statements when assessing the performance of the group.
How we tailored our group audit scopeWe tailored the scope of our audit, taking into account the structure of the group, the accounting processes and controls, and the industry in which the group operates.
Atria group had four reportable segments during the financial year: Atria Finland, Atria Sweden, Atria Russia and Atria Denmark and Estonia. Our audit procedures addressed all four reportable segments. Our audit scope included the parent company and subsidiaries in Finland, Sweden, Russia, Estonia and Denmark.
We have pre-defined the types of audit procedures aimed at the financial information of each part of the group. In cases where a group component auditor has performed the audit work, we have instructed their work with group audit instructions which have included e.g. our risk assessment, materiality, audit approach and centralized audit procedures.
KEY AUDIT MATTERS Key audit matters are those matters that, in our professional judgment, were of most sig-nificance in our audit of the financial statements of the current period. These matters were addressed in the context of our audit of the financial statements as a whole, and in forming our opinion thereon, and we do not provide a separate opinion on these matters.
As in all of our audits, we also addressed the risk of management override of internal cont-rols, including among other matters consideration of whether there was evidence of bias that represented a risk of material misstatement due to fraud.
Key audit matter in the audit of the group How our audit addressed the key audit matter
Revenue recognition
Refer to the Accounting policies for the consolidated financial statements and Notes 1 and 2
Atria has identified two client segments: consumer product clients and primary production clients. Sales revenue is recognised based on customer contracts. The contracts specify the contractual obligations and the prices applicable to them.
Revenue recognition is considered a key audit matter in the audit of the group due to the financial significance of net sales in the financial statements.
Our audit procedures included for example the following procedures: • We evaluated the internal control activities and controls over revenue recognition and assessed the appropriateness of the accounting policies related to revenue recognition by comparing those to the applicable accounting standards.
• We tested the cut-off of individual sales transactions by comparing to delivery documents and by checking significant credit notes issued after year-end.
• We tested discounts and rebate accruals on a sample basis.
• We tested a sample of other revenue transactions based on the results of data analysis procedures.
Valuation of goodwill and trademarks
Refer to Accounting policies for the consolidated financial statements and Note 15
The group tests annually goodwill and the intangible assets with indefinite useful lives for possible impairment. Goodwill in the Atria Group consolidated balance sheet totalled to 165 million euros and trademarks with indefinite useful lives to 55 million euros at 31 December 2020.
Impairment testing for goodwill and other intangible assets are subject to significant management judgement. The fair value of intangible assets is determined based on estimates of future cash flows. Key assumptions in these estimates include e.g. growth in net sales, profitability levels, and discount rates.
The valuation of goodwill and trademarks is considered a key audit matter in the audit of the group due to its financial significance as well as due to the high degree of management judgement involved in the impairment testing.
Our audit procedures included for example the following procedures: • We discussed the accounting policies and significant management’s estimates and assumptions.
• Where possible, we compared the key variables of discount rate and long-term growth rate of net sales to information generally available at the market.
• We reconciled the estimates of future cash flows to the strategy information approved by the board of directors.
• We tested the appropriateness of the key assumptions applied to the cash flow estimates and consistency of accounting policies in relation to previous accounting periods.
• We assessed the historical accuracy of management’s estimates including growth of net sales and profit margin by comparing these to actual results for the period.
• We tested mathematical accuracy of the calculations.
• We performed sensitivity analyses for the key variables e.g. to test information provided in note 15 regarding sensitivity of the calculations.
PARENT COMPANY FINANCIAL STATEMENTS, FAS
115
Front page
Atria in brief
Atria’s key indicators
CEO’s review
Strategy 2021–2025
Strategy 2016–2020
Operating environment
Business area reviews
Atria Finland
Atria Sweden
Atria Denmark & Estonia
Atria Russia
Research and Development
Financial Statements and Corporate Governance
Financial Statements and Corporate Governance
Auditor’s report
Corporate Governance Statement
Investor reporting
Contact information
Atria’s Annual Report 2020
PARENT COMPANY FINANCIAL STATEMENTS, FAS
Key audit matter in the audit of the group How our audit addressed the key audit matter
Valuation of inventories
Refer to Accounting policies for the consolidated financial statements and Note 19
Inventories are measured at the lower of cost or probable net realisable value. The cost for finished and unfinished products consists of raw materials, direct labour costs, other direct costs and the appropriate share of manufacturing-related variable overheads and fixed overheads at a normal level of operations. The net realisable value is the estimated selling price in the ordinary course of business, less the estimated selling expenses.
Valuation of inventories is considered a key audit matter in the audit of the group due to its financial significance and as it includes judgement as described in the accounting principles.
Our audit procedures included for example the following procedures: • We evaluated the internal key controls of inventories and the purchasing process.
• We tested the appropriateness of the accounting principles relating to valuation of inventories.
• We tested price variances of single inventory items on a sample basis.
• We tested the appropriateness of key assumptions used in the valuation of inventory and the mathematic accuracy of the calculations.
Key audit matter in the audit of the group How our audit addressed the key audit matter
Valuation of subsidiary shares and loan receivables
Refer to Notes to the parent company financial statements 3.2 and 3.3
Value of shares in subsidiaries in the Atria Plc financial statements at 31 December 2020 totalled 283 million euros and loan receivables from group companies 127 million euros. Valuation of shares in subsidiaries and loan receivables in accordance with the Accounting Act is subject to management judgement. These valuations include significant management judgement in relation to for example subsidiaries projected future cash flows.
Valuation of subsidiary shares and loan receivables is considered a key audit matter in the audit of the parent company due to its financial significance as well as due to the high degree of management judgement involved in the valuation.
Our audit procedures included for example the following procedures: • We assessed the book value of Atria Plc’s shares in subsidiaries based on the subsidiary’s equity and the management estimates of the projected future cash flows.
• We discussed with the management the most significant assumptions used in the valuation of shares in subsidiaries and assessed the assumptions of the valuation calculations.
• We evaluated the reliability of estimates from previous years by comparing those to the actual results for the period.
There are no significant risks of material misstatement referred to in Article 10(2c) of Regu-lation (EU) No 537/2014 with respect to the audit of the consolidated financial statements or the parent company financial statements.
RESPONSIBILITIES OF THE BOARD OF DIRECTORS AND THE MANAGING DIRECTOR FOR THE FINANCIAL STATEMENTSThe Board of Directors and the Managing Director are responsible for the preparation of consolidated financial statements that give a true and fair view in accordance with Interna-tional Financial Reporting Standards (IFRS) as adopted by the EU, and of financial statements that give a true and fair view in accordance with the laws and regulations governing the preparation of financial statements in Finland and comply with statutory requirements. The Board of Directors and the Managing Director are also responsible for such internal control as they determine is necessary to enable the preparation of financial statements that are free from material misstatement, whether due to fraud or error.
In preparing the financial statements, the Board of Directors and the Managing Director are responsible for assessing the parent company’s and the group’s ability to continue as a going concern, disclosing, as applicable, matters relating to going concern and using the going concern basis of accounting. The financial statements are prepared using the going concern basis of accounting unless there is an intention to liquidate the parent company or the group or to cease operations, or there is no realistic alternative but to do so.
AUDITOR’S RESPONSIBILITIES FOR THE AUDIT OF THE FINANCIAL STATEMENTSOur objectives are to obtain reasonable assurance about whether the financial statements as a whole are free from material misstatement, whether due to fraud or error, and to issue an auditor’s report that includes our opinion. Reasonable assurance is a high level of assurance, but is not a guarantee that an audit conducted in accordance with good auditing practice will always detect a material misstatement when it exists. Misstatements can arise from fraud or error and are considered material if, individually or in the aggregate, they could reaso-nably be expected to influence the economic decisions of users taken on the basis of these financial statements.
As part of an audit in accordance with good auditing practice, we exercise professional jud-gment and maintain professional scepticism throughout the audit. We also: • Identify and assess the risks of material misstatement of the financial statements, whether
due to fraud or error, design and perform audit procedures responsive to those risks, and obtain audit evidence that is sufficient and appropriate to provide a basis for our opinion. The risk of not detecting a material misstatement resulting from fraud is higher than for one resulting from error, as fraud may involve collusion, forgery, intentional omissions, misrepresentations, or the override of internal control.
• Obtain an understanding of internal control relevant to the audit in order to design audit procedures that are appropriate in the circumstances, but not for the purpose of expres-sing an opinion on the effectiveness of the parent company’s or the group’s internal control.
116
Front page
Atria in brief
Atria’s key indicators
CEO’s review
Strategy 2021–2025
Strategy 2016–2020
Operating environment
Business area reviews
Atria Finland
Atria Sweden
Atria Denmark & Estonia
Atria Russia
Research and Development
Financial Statements and Corporate Governance
Financial Statements and Corporate Governance
Auditor’s report
Corporate Governance Statement
Investor reporting
Contact information
Atria’s Annual Report 2020
• Evaluate the appropriateness of accounting policies used and the reasonableness of accounting estimates and related disclosures made by management.
• Conclude on the appropriateness of the Board of Directors’ and the Managing Director’s use of the going concern basis of accounting and based on the audit evidence obtained, whether a material uncertainty exists related to events or conditions that may cast signifi-cant doubt on the parent company’s or the group’s ability to continue as a going concern. If we conclude that a material uncertainty exists, we are required to draw attention in our auditor’s report to the related disclosures in the financial statements or, if such disclosures are inadequate, to modify our opinion. Our conclusions are based on the audit evidence obtained up to the date of our auditor’s report. However, future events or conditions may cause the parent company or the group to cease to continue as a going concern.
• Evaluate the overall presentation, structure and content of the financial statements, including the disclosures, and whether the financial statements represent the underlying transactions and events so that the financial statements give a true and fair view.
• Obtain sufficient appropriate audit evidence regarding the financial information of the entities or business activities within the group to express an opinion on the consolidated financial statements. We are responsible for the direction, supervision and performance of the group audit. We remain solely responsible for our audit opinion.
We communicate with those charged with governance regarding, among other matters, the planned scope and timing of the audit and significant audit findings, including any significant deficiencies in internal control that we identify during our audit.
We also provide those charged with governance with a statement that we have complied with relevant ethical requirements regarding independence, and to communicate with them all relationships and other matters that may reasonably be thought to bear on our indepen-dence, and where applicable, related safeguards.
From the matters communicated with those charged with governance, we determine those matters that were of most significance in the audit of the financial statements of the current period and are therefore the key audit matters. We describe these matters in our auditor’s report unless law or regulation precludes public disclosure about the matter or when, in extremely rare circumstances, we determine that a matter should not be communicated in our report because the adverse consequences of doing so would reasonably be expected to outweigh the public interest benefits of such communication.
Other Reporting Requirements
APPOINTMENTPricewaterhouseCoopers Oy or auditors employed by it were first appointed as auditors by the annual general meeting on 10 May 1999.
OTHER INFORMATION The Board of Directors and the Managing Director are responsible for the other information. The other information comprises the report of the Board of Directors and the information included in the Annual Report, but does not include the financial statements and our audi-tor’s report thereon.
Our opinion on the financial statements does not cover the other information.
In connection with our audit of the financial statements, our responsibility is to read the other information and, in doing so, consider whether the other information is materially inconsistent with the financial statements or our knowledge obtained in the audit, or otherwise appears to be materially misstated. With respect to the report of the Board of Directors, our responsibility also includes considering whether the report of the Board of Directors has been prepared in accordance with the applicable laws and regulations.
In our opinion• the information in the report of the Board of Directors is consistent with the information in
the financial statements• the report of the Board of Directors has been prepared in accordance with the applicable
laws and regulations.
If, based on the work we have performed, we conclude that there is a material misstatement of this other information, we are required to report that fact. We have nothing to report in this regard.
Seinäjoki 18 March 2021PricewaterhouseCoopers OyAuthorised Public Accountants
Samuli PeräläAuthorised Public Accountant
PARENT COMPANY FINANCIAL STATEMENTS, FAS
117
Front page
Atria in brief
Atria’s key indicators
CEO’s review
Strategy 2021–2025
Strategy 2016–2020
Operating environment
Business area reviews
Atria Finland
Atria Sweden
Atria Denmark & Estonia
Atria Russia
Research and Development
Financial Statements and Corporate Governance
Financial Statements and Corporate Governance
Auditor’s report
Corporate Governance Statement
Investor reporting
Contact information
Atria’s Annual Report 2020
CORPORATE GOVERNANCE STATEMENT
Contents Corporate Governance StatementCorporate Governance Statement ..................................119Articles of Association ........................................................119Shareholder agreement .....................................................119
Governing BodiesAnnual General Meeting ....................................................119Shareholders’ Nomination Board.................................... 120
Supervisory Board .............................................................. 120Board of Directors .............................................................. 122Duties of Board of Directors ............................................ 122Meeting practices and information flow ....................... 122Composition of the Board of Directors ..........................123Principles concerning the diversity of the Board of Directors and the Supervisory Board ......127Diversity of the Board of Directors ..................................127Diversity of the Supervisory Board ..................................127Implementation of the diversity principles ....................127Board Committees ..............................................................127CEO ....................................................................................... 128Management Team ............................................................ 128Remuneration ......................................................................132
Other GovernanceInternal control, risk management and internal audit ................................................................132Internal control ....................................................................132Risk management at Atria ..................................................132Internal audit ........................................................................133Auditing .................................................................................133Insider policy ........................................................................133Related-party transactions ................................................133Communications ................................................................ 134 Remuneration ReportShortly about the Remuneration Policy ........................ 134Shortly about the remuneration in 2020 .......................135Development of Atria’s financial performance and remuneration ......................................135Remuneration of the members of the Supervisory Board ...................................................135Remuneration of the members of the Board of Directors .................................................. 136Remuneration of CEO and Deputy CEO ........................137
118

Front page
Atria in brief
Atria’s key indicators
CEO’s review
Strategy 2021–2025
Strategy 2016–2020
Operating environment
Business area reviews
Atria Finland
Atria Sweden
Atria Denmark & Estonia
Atria Russia
Research and Development
Financial Statements and Corporate Governance
Financial Statements and Corporate Governance
Auditor’s report
Corporate Governance Statement
Investor reporting
Contact information
Atria’s Annual Report 2020
1. Corporate Governance StatementAtria Plc (“Atria” or “the company”) is a Finnish public company, and the responsibilities and obligations of its governing bodies are determined by Finnish law. The parent company, Atria Plc, and its subsidiaries constitute the international Atria Group. The company is domiciled in Kuopio.
Responsibility for the administration and operations of Atria Group lies with the governing bodies of the parent, Atria Plc. These are the Annual General Meeting, the Supervisory Board, the Board of Directors and the CEO.
Decision-making and governance at Atria comply with the Finnish Limited Liability Companies Act, the Securities Markets Act, the Auditing Act and the Accounting Act and other regulations pertaining to listed companies, as well as with Atria Plc’s Articles of Association and the rules of procedure of Atria’s Board and Board committees. Atria is also bound by EU-level regulations and Nasdaq Helsinki Ltd’s rules, as well as by orders and guidelines issued by the Financial Supervisory Authority. Atria follows the Securities Market Association’s (SMA) Corporate Governance Code, which came into effect on 1 January 2020. The Corporate Governance Code is available on the SMA website at www.cgfinland.fi.
In accordance with the ‘comply or explain’ principle, the company departs from the recommendations of the Corporate Governance Code as follows (the departures are explained under the relevant items):• As an exception to recommendation 6 of the Corporate Governance Code, the term of
each Board member is three years in accordance with Atria’s Articles of Association.• As an exception to recommendation 10 of the Corporate Governance Code, three of the
eight members on the Board of Directors are independent of the company.• As an exception to recommendation 17 and 18 of the Corporate Governance Code, one of
the three members on the Nomination and Remuneration Committee is independent of the company.
The Corporate Governance Statement is presented as a report separate from the Board of Directors’ Report. The Corporate Governance Statement is available on the company’s website at www.atria.com (Investors > Corporate Governance).
1.1 Articles of AssociationThe Articles of Association and the redemption clause are available on the company’s website at www.atria.com (Investors > Corporate Governance).
1.2 Shareholder AgreementLihakunta and Itikka Co-operative, two of Atria’s shareholders, have agreed to ensure that they are both represented on the Supervisory Board in proportion to their holdings of Series KII shares in the company, and that all members of the Supervisory Board are appointed by
them, unless it has been separately agreed on a case-by-case basis that some Supervisory Board members are selected from among candidates designated by other shareholders. It has also been agreed that when the Chair of the Supervisory Board and the Vice Chair of the Board of Directors are appointed by one of these two parties, the Chair of the Board of Directors and the Vice Chair of the Supervisory Board are appointed by the other party.
Regarding the distribution of Board positions, it has been agreed that each of the parties may nominate three ordinary members and their deputy members to the Board of Directors. The agreement also includes stipulations on the mutual proportion of shareholding and on the procedures followed when either party acquires more series KII shares directly or indirectly. According to the agreement, the acquisition of series A shares is not considered in the evaluation of the mutual proportion of shareholding.
Furthermore, Lihakunta, Itikka Co-operative and Pohjanmaan Liha Co-operative, which hold shares in Atria, have agreed to ensure that Pohjanmaan Liha Co-operative has one representative on the Supervisory Board. The agreement also includes stipulations on Pohjanmaan Liha Co-operative’s shareholding.
The company is not aware of any other shareholder agreements.
Despite the above, the Annual General Meeting, as stated in section 3 below, decides on the number of members of the company’s Supervisory Board and of the Board of Directors and their election.
2. Annual General Meeting The Annual General Meeting is Atria Plc’s highest decision-making body. At the General Meeting, shareholders decide, among other things, on the approval of the financial statements and the use of the profit shown on the balance sheet; the discharge of the members of the Board of Directors and of the Supervisory Board, as well as the CEO, from liability; the number of members of the Supervisory Board and of the Board of Directors, and their election and remuneration; and the election an remuneration of the auditor.
The Annual General Meeting is held annually by the end of June on a date designated by the Board of Directors, and the agenda includes matters that are to be processed by the Annual General Meeting in accordance with the Limited Liability Companies Act and the Articles of Association and any other proposals mentioned in the notice of the meeting. Extraordinary General Meetings may be convened as needed.
Under the Limited Liability Companies Act, a shareholder has the right to have a matter falling within the competence of the Annual General Meeting dealt with by the Annual General Meeting if the shareholder so demands in writing from the Board of Directors
CORPORATE GOVERNANCE STATEMENT
119
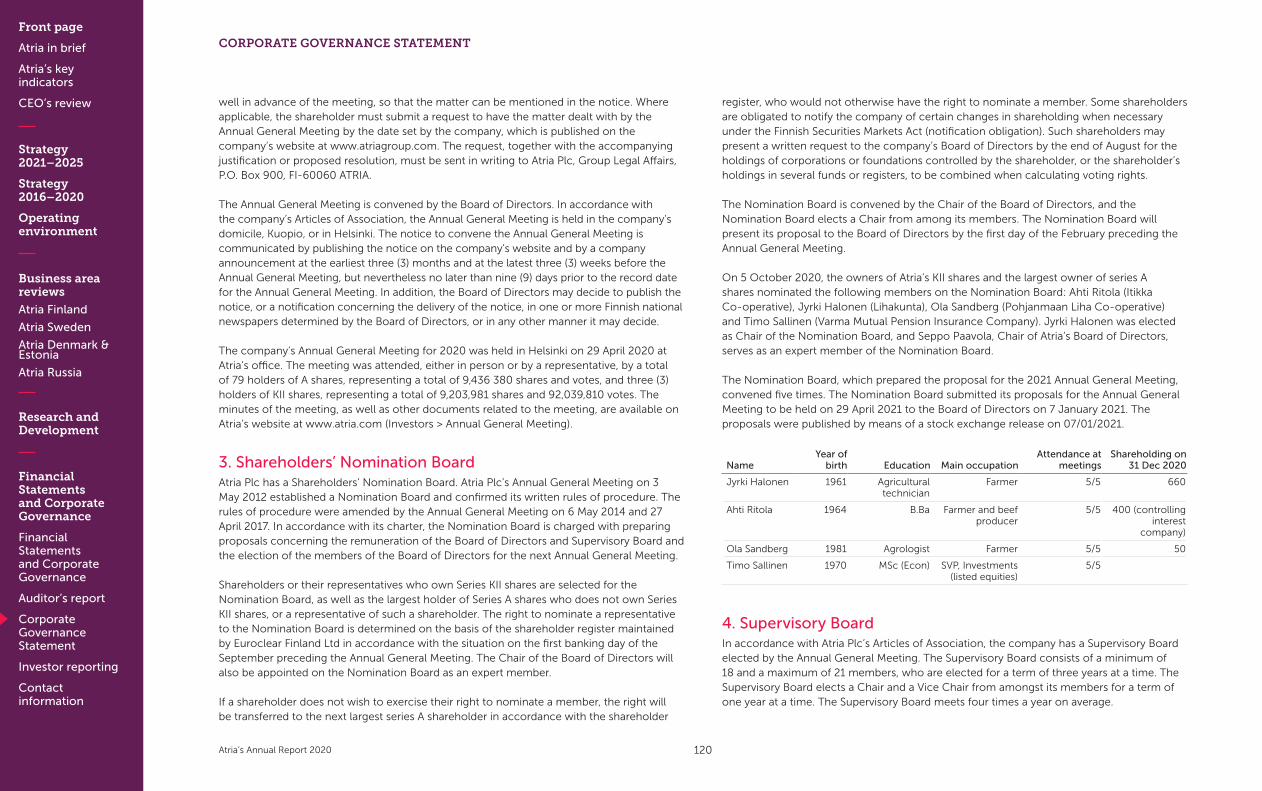
Front page
Atria in brief
Atria’s key indicators
CEO’s review
Strategy 2021–2025
Strategy 2016–2020
Operating environment
Business area reviews
Atria Finland
Atria Sweden
Atria Denmark & Estonia
Atria Russia
Research and Development
Financial Statements and Corporate Governance
Financial Statements and Corporate Governance
Auditor’s report
Corporate Governance Statement
Investor reporting
Contact information
Atria’s Annual Report 2020
CORPORATE GOVERNANCE STATEMENT
well in advance of the meeting, so that the matter can be mentioned in the notice. Where applicable, the shareholder must submit a request to have the matter dealt with by the Annual General Meeting by the date set by the company, which is published on the company’s website at www.atriagroup.com. The request, together with the accompanying justification or proposed resolution, must be sent in writing to Atria Plc, Group Legal Affairs, P.O. Box 900, FI-60060 ATRIA.
The Annual General Meeting is convened by the Board of Directors. In accordance with the company’s Articles of Association, the Annual General Meeting is held in the company’s domicile, Kuopio, or in Helsinki. The notice to convene the Annual General Meeting is communicated by publishing the notice on the company’s website and by a company announcement at the earliest three (3) months and at the latest three (3) weeks before the Annual General Meeting, but nevertheless no later than nine (9) days prior to the record date for the Annual General Meeting. In addition, the Board of Directors may decide to publish the notice, or a notification concerning the delivery of the notice, in one or more Finnish national newspapers determined by the Board of Directors, or in any other manner it may decide.
The company’s Annual General Meeting for 2020 was held in Helsinki on 29 April 2020 at Atria’s office. The meeting was attended, either in person or by a representative, by a total of 79 holders of A shares, representing a total of 9,436 380 shares and votes, and three (3) holders of KII shares, representing a total of 9,203,981 shares and 92,039,810 votes. The minutes of the meeting, as well as other documents related to the meeting, are available on Atria’s website at www.atria.com (Investors > Annual General Meeting).
3. Shareholders’ Nomination BoardAtria Plc has a Shareholders’ Nomination Board. Atria Plc’s Annual General Meeting on 3 May 2012 established a Nomination Board and confirmed its written rules of procedure. The rules of procedure were amended by the Annual General Meeting on 6 May 2014 and 27 April 2017. In accordance with its charter, the Nomination Board is charged with preparing proposals concerning the remuneration of the Board of Directors and Supervisory Board and the election of the members of the Board of Directors for the next Annual General Meeting.
Shareholders or their representatives who own Series KII shares are selected for the Nomination Board, as well as the largest holder of Series A shares who does not own Series KII shares, or a representative of such a shareholder. The right to nominate a representative to the Nomination Board is determined on the basis of the shareholder register maintained by Euroclear Finland Ltd in accordance with the situation on the first banking day of the September preceding the Annual General Meeting. The Chair of the Board of Directors will also be appointed on the Nomination Board as an expert member.
If a shareholder does not wish to exercise their right to nominate a member, the right will be transferred to the next largest series A shareholder in accordance with the shareholder
register, who would not otherwise have the right to nominate a member. Some shareholders are obligated to notify the company of certain changes in shareholding when necessary under the Finnish Securities Markets Act (notification obligation). Such shareholders may present a written request to the company’s Board of Directors by the end of August for the holdings of corporations or foundations controlled by the shareholder, or the shareholder’s holdings in several funds or registers, to be combined when calculating voting rights.
The Nomination Board is convened by the Chair of the Board of Directors, and the Nomination Board elects a Chair from among its members. The Nomination Board will present its proposal to the Board of Directors by the first day of the February preceding the Annual General Meeting.
On 5 October 2020, the owners of Atria’s KII shares and the largest owner of series A shares nominated the following members on the Nomination Board: Ahti Ritola (Itikka Co-operative), Jyrki Halonen (Lihakunta), Ola Sandberg (Pohjanmaan Liha Co-operative) and Timo Sallinen (Varma Mutual Pension Insurance Company). Jyrki Halonen was elected as Chair of the Nomination Board, and Seppo Paavola, Chair of Atria’s Board of Directors, serves as an expert member of the Nomination Board.
The Nomination Board, which prepared the proposal for the 2021 Annual General Meeting, convened five times. The Nomination Board submitted its proposals for the Annual General Meeting to be held on 29 April 2021 to the Board of Directors on 7 January 2021. The proposals were published by means of a stock exchange release on 07/01/2021.
NameYear of
birth Education Main occupationAttendance at
meetingsShareholding on
31 Dec 2020
Jyrki Halonen 1961 Agricultural technician
Farmer 5/5 660
Ahti Ritola 1964 B.Ba Farmer and beef producer
5/5 400 (controlling interest
company)
Ola Sandberg 1981 Agrologist Farmer 5/5 50
Timo Sallinen 1970 MSc (Econ) SVP, Investments (listed equities)
5/5
4. Supervisory BoardIn accordance with Atria Plc’s Articles of Association, the company has a Supervisory Board elected by the Annual General Meeting. The Supervisory Board consists of a minimum of 18 and a maximum of 21 members, who are elected for a term of three years at a time. The Supervisory Board elects a Chair and a Vice Chair from amongst its members for a term of one year at a time. The Supervisory Board meets four times a year on average.
120
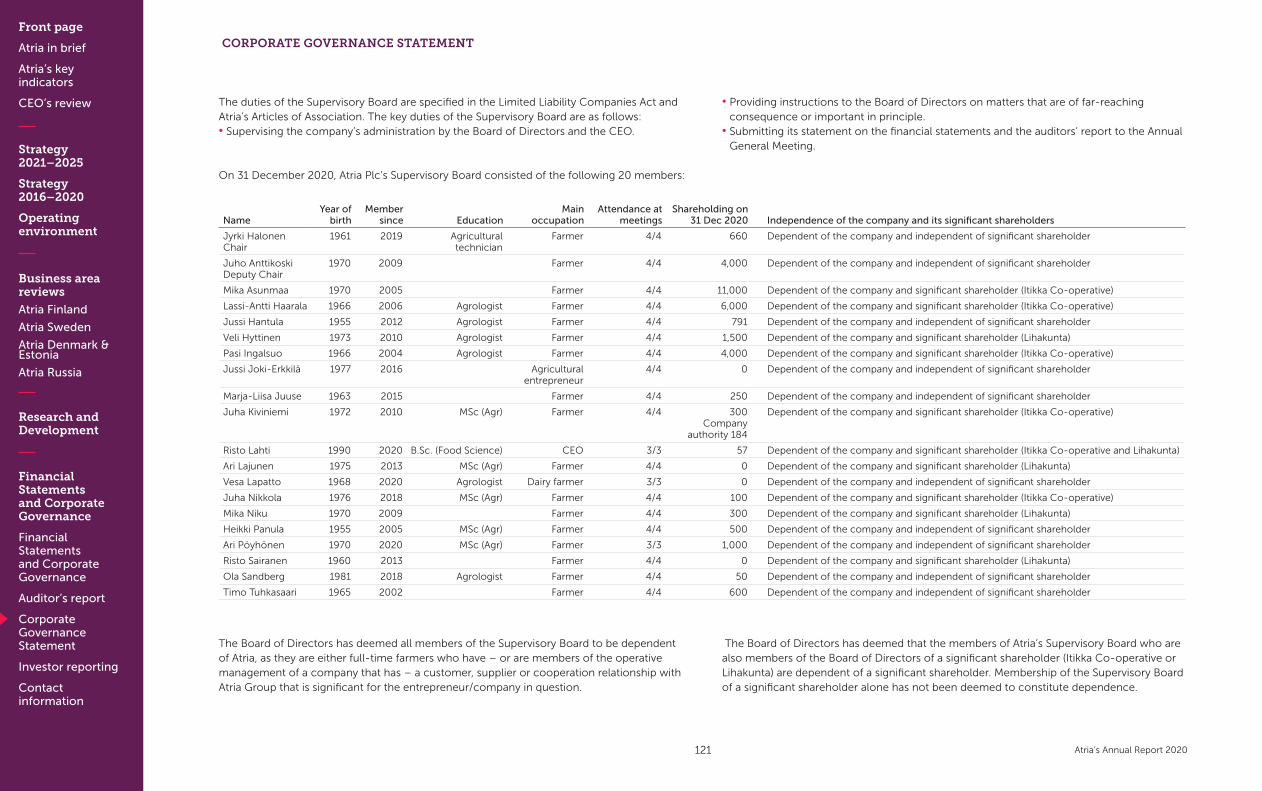
Front page
Atria in brief
Atria’s key indicators
CEO’s review
Strategy 2021–2025
Strategy 2016–2020
Operating environment
Business area reviews
Atria Finland
Atria Sweden
Atria Denmark & Estonia
Atria Russia
Research and Development
Financial Statements and Corporate Governance
Financial Statements and Corporate Governance
Auditor’s report
Corporate Governance Statement
Investor reporting
Contact information
Atria’s Annual Report 2020
The duties of the Supervisory Board are specified in the Limited Liability Companies Act and Atria’s Articles of Association. The key duties of the Supervisory Board are as follows:• Supervising the company’s administration by the Board of Directors and the CEO.
• Providing instructions to the Board of Directors on matters that are of far-reaching consequence or important in principle.
• Submitting its statement on the financial statements and the auditors’ report to the Annual General Meeting.
On 31 December 2020, Atria Plc’s Supervisory Board consisted of the following 20 members:
The Board of Directors has deemed all members of the Supervisory Board to be dependent of Atria, as they are either full-time farmers who have – or are members of the operative management of a company that has – a customer, supplier or cooperation relationship with Atria Group that is significant for the entrepreneur/company in question.
The Board of Directors has deemed that the members of Atria’s Supervisory Board who are also members of the Board of Directors of a significant shareholder (Itikka Co-operative or Lihakunta) are dependent of a significant shareholder. Membership of the Supervisory Board of a significant shareholder alone has not been deemed to constitute dependence.
NameYear of
birthMember
since EducationMain
occupationAttendance at
meetingsShareholding on
31 Dec 2020 Independence of the company and its significant shareholders
Jyrki Halonen Chair
1961 2019 Agricultural technician
Farmer 4/4 660 Dependent of the company and independent of significant shareholder
Juho AnttikoskiDeputy Chair
1970 2009 Farmer 4/4 4,000 Dependent of the company and independent of significant shareholder
Mika Asunmaa 1970 2005 Farmer 4/4 11,000 Dependent of the company and significant shareholder (Itikka Co-operative)
Lassi-Antti Haarala 1966 2006 Agrologist Farmer 4/4 6,000 Dependent of the company and significant shareholder (Itikka Co-operative)
Jussi Hantula 1955 2012 Agrologist Farmer 4/4 791 Dependent of the company and independent of significant shareholder
Veli Hyttinen 1973 2010 Agrologist Farmer 4/4 1,500 Dependent of the company and significant shareholder (Lihakunta)
Pasi Ingalsuo 1966 2004 Agrologist Farmer 4/4 4,000 Dependent of the company and significant shareholder (Itikka Co-operative)
Jussi Joki-Erkkilä 1977 2016 Agricultural entrepreneur
4/4 0 Dependent of the company and independent of significant shareholder
Marja-Liisa Juuse 1963 2015 Farmer 4/4 250 Dependent of the company and independent of significant shareholder
Juha Kiviniemi 1972 2010 MSc (Agr) Farmer 4/4 300 Company
authority 184
Dependent of the company and significant shareholder (Itikka Co-operative)
Risto Lahti 1990 2020 B.Sc. (Food Science) CEO 3/3 57 Dependent of the company and significant shareholder (Itikka Co-operative and Lihakunta)
Ari Lajunen 1975 2013 MSc (Agr) Farmer 4/4 0 Dependent of the company and significant shareholder (Lihakunta)
Vesa Lapatto 1968 2020 Agrologist Dairy farmer 3/3 0 Dependent of the company and independent of significant shareholder
Juha Nikkola 1976 2018 MSc (Agr) Farmer 4/4 100 Dependent of the company and significant shareholder (Itikka Co-operative)
Mika Niku 1970 2009 Farmer 4/4 300 Dependent of the company and significant shareholder (Lihakunta)
Heikki Panula 1955 2005 MSc (Agr) Farmer 4/4 500 Dependent of the company and independent of significant shareholder
Ari Pöyhönen 1970 2020 MSc (Agr) Farmer 3/3 1,000 Dependent of the company and independent of significant shareholder
Risto Sairanen 1960 2013 Farmer 4/4 0 Dependent of the company and significant shareholder (Lihakunta)
Ola Sandberg 1981 2018 Agrologist Farmer 4/4 50 Dependent of the company and independent of significant shareholder
Timo Tuhkasaari 1965 2002 Farmer 4/4 600 Dependent of the company and independent of significant shareholder
CORPORATE GOVERNANCE STATEMENT
121
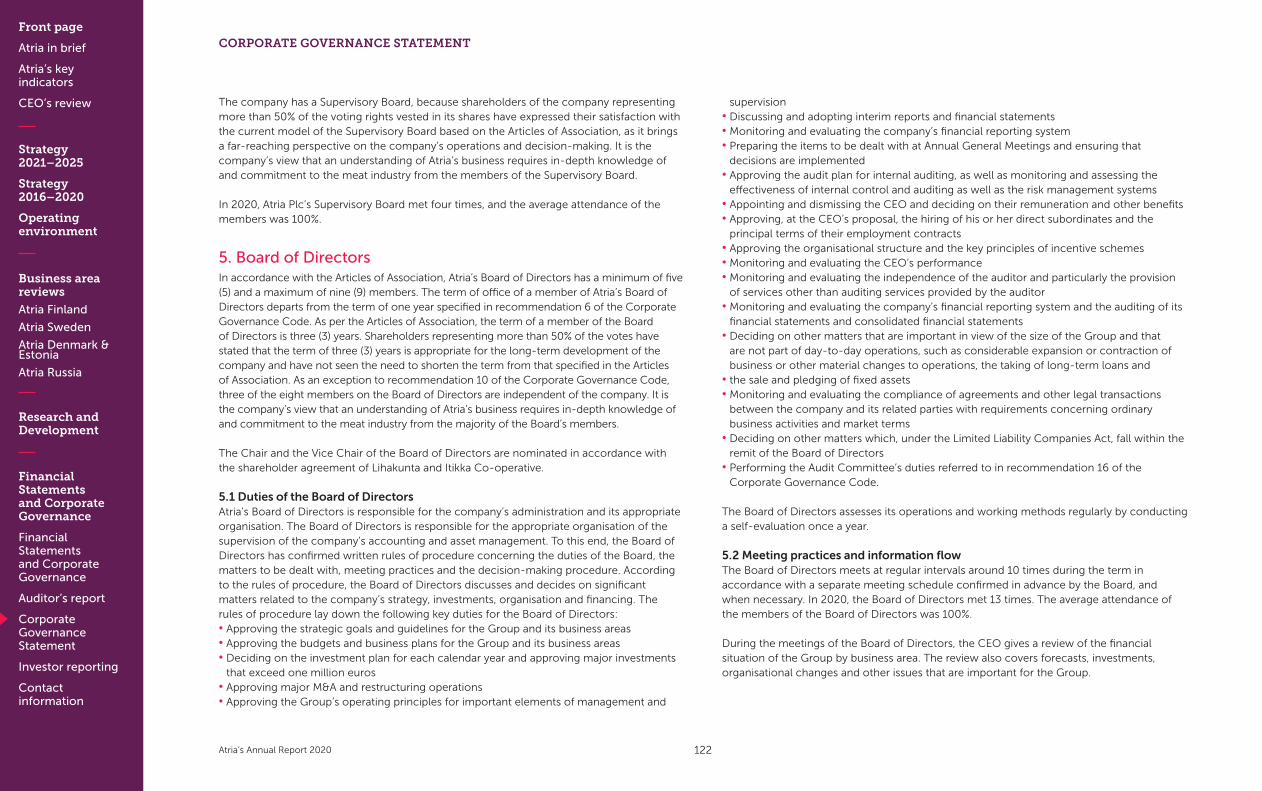
Front page
Atria in brief
Atria’s key indicators
CEO’s review
Strategy 2021–2025
Strategy 2016–2020
Operating environment
Business area reviews
Atria Finland
Atria Sweden
Atria Denmark & Estonia
Atria Russia
Research and Development
Financial Statements and Corporate Governance
Financial Statements and Corporate Governance
Auditor’s report
Corporate Governance Statement
Investor reporting
Contact information
Atria’s Annual Report 2020
CORPORATE GOVERNANCE STATEMENT
The company has a Supervisory Board, because shareholders of the company representing more than 50% of the voting rights vested in its shares have expressed their satisfaction with the current model of the Supervisory Board based on the Articles of Association, as it brings a far-reaching perspective on the company’s operations and decision-making. It is the company’s view that an understanding of Atria’s business requires in-depth knowledge of and commitment to the meat industry from the members of the Supervisory Board.
In 2020, Atria Plc’s Supervisory Board met four times, and the average attendance of the members was 100%.
5. Board of DirectorsIn accordance with the Articles of Association, Atria’s Board of Directors has a minimum of five (5) and a maximum of nine (9) members. The term of office of a member of Atria’s Board of Directors departs from the term of one year specified in recommendation 6 of the Corporate Governance Code. As per the Articles of Association, the term of a member of the Board of Directors is three (3) years. Shareholders representing more than 50% of the votes have stated that the term of three (3) years is appropriate for the long-term development of the company and have not seen the need to shorten the term from that specified in the Articles of Association. As an exception to recommendation 10 of the Corporate Governance Code, three of the eight members on the Board of Directors are independent of the company. It is the company’s view that an understanding of Atria’s business requires in-depth knowledge of and commitment to the meat industry from the majority of the Board’s members.
The Chair and the Vice Chair of the Board of Directors are nominated in accordance with the shareholder agreement of Lihakunta and Itikka Co-operative.
5.1 Duties of the Board of DirectorsAtria’s Board of Directors is responsible for the company’s administration and its appropriate organisation. The Board of Directors is responsible for the appropriate organisation of the supervision of the company’s accounting and asset management. To this end, the Board of Directors has confirmed written rules of procedure concerning the duties of the Board, the matters to be dealt with, meeting practices and the decision-making procedure. According to the rules of procedure, the Board of Directors discusses and decides on significant matters related to the company’s strategy, investments, organisation and financing. The rules of procedure lay down the following key duties for the Board of Directors:• Approving the strategic goals and guidelines for the Group and its business areas• Approving the budgets and business plans for the Group and its business areas• Deciding on the investment plan for each calendar year and approving major investments
that exceed one million euros• Approving major M&A and restructuring operations• Approving the Group’s operating principles for important elements of management and
supervision• Discussing and adopting interim reports and financial statements• Monitoring and evaluating the company’s financial reporting system• Preparing the items to be dealt with at Annual General Meetings and ensuring that
decisions are implemented• Approving the audit plan for internal auditing, as well as monitoring and assessing the
effectiveness of internal control and auditing as well as the risk management systems• Appointing and dismissing the CEO and deciding on their remuneration and other benefits• Approving, at the CEO’s proposal, the hiring of his or her direct subordinates and the
principal terms of their employment contracts• Approving the organisational structure and the key principles of incentive schemes• Monitoring and evaluating the CEO’s performance• Monitoring and evaluating the independence of the auditor and particularly the provision
of services other than auditing services provided by the auditor• Monitoring and evaluating the company’s financial reporting system and the auditing of its
financial statements and consolidated financial statements• Deciding on other matters that are important in view of the size of the Group and that
are not part of day-to-day operations, such as considerable expansion or contraction of business or other material changes to operations, the taking of long-term loans and
• the sale and pledging of fixed assets• Monitoring and evaluating the compliance of agreements and other legal transactions
between the company and its related parties with requirements concerning ordinary business activities and market terms
• Deciding on other matters which, under the Limited Liability Companies Act, fall within the remit of the Board of Directors
• Performing the Audit Committee’s duties referred to in recommendation 16 of the Corporate Governance Code.
The Board of Directors assesses its operations and working methods regularly by conducting a self-evaluation once a year.
5.2 Meeting practices and information flowThe Board of Directors meets at regular intervals around 10 times during the term in accordance with a separate meeting schedule confirmed in advance by the Board, and when necessary. In 2020, the Board of Directors met 13 times. The average attendance of the members of the Board of Directors was 100%.
During the meetings of the Board of Directors, the CEO gives a review of the financial situation of the Group by business area. The review also covers forecasts, investments, organisational changes and other issues that are important for the Group.
122

Front page
Atria in brief
Atria’s key indicators
CEO’s review
Strategy 2021–2025
Strategy 2016–2020
Operating environment
Business area reviews
Atria Finland
Atria Sweden
Atria Denmark & Estonia
Atria Russia
Research and Development
Financial Statements and Corporate Governance
Financial Statements and Corporate Governance
Auditor’s report
Corporate Governance Statement
Investor reporting
Contact information
Atria’s Annual Report 2020
5.3 On 31 December 2020, the members of the Board of Directors were the following:
Name Seppo Paavola, Chair Pasi Korhonen, Vice chair
Year of birth 1962 1975
Education Agrologist (secondary school graduate)
Main occupation Farmer Farmer
Relevant work experience • Agricultural entrepreneur 1996–present• Farm advisor, Rural Centre of Central Ostrobothnia 1991–1996
Farmer
Member of the Board since 2012 2016
Concurrent key positions oftrust
• Member of the Supervisory Board of Itikka Co-operative 2000–present, DeputyChair of the Supervisory Board of Itikka Co-operative 2008–2011Chair of the Supervisory Board of Itikka Co-operative 2012–present
• Chair of the Board of Directors of Perhonjokilaakso Co-operative Bank(former Kaustinen Co-operative Bank) 2002–present
• Member of the Board of Directors of Pellervo 2012–present
• Chair of the Board of Directors of Lihakunta 2019–present• Member of the Board of Directors of Lihakunta 2013–present• Member of the Board of Directors of Kainuun maa- ja metsäsäätiö 2013–present
Past key positions of trust • Member of the Supervisory Board of Atria Plc 2006–2012Deputy Chair of the Supervisory Board of Atria Plc 2009–2012
• Member of the Co-operative Advisory Committee of Pellervo Confederation2012–2017
• Deputy Chair of the Board of Directors of Lihakunta 2016–2019• Councillor of the Sotkamo Municipal Council 2005–2017
Independence Dependent of the company and independent on significant shareholders Dependent of the company and significant shareholders
Shareholding on 31 December 2020
4,400 0
Share-based rights in thecompany
None None
Attendance in meetings 13/13 13/13
CORPORATE GOVERNANCE STATEMENT
123

Front page
Atria in brief
Atria’s key indicators
CEO’s review
Strategy 2021–2025
Strategy 2016–2020
Operating environment
Business area reviews
Atria Finland
Atria Sweden
Atria Denmark & Estonia
Atria Russia
Research and Development
Financial Statements and Corporate Governance
Financial Statements and Corporate Governance
Auditor’s report
Corporate Governance Statement
Investor reporting
Contact information
Atria’s Annual Report 2020
CORPORATE GOVERNANCE STATEMENT
Name Nella Ginman-Tjeder Jukka Kaikkonen
Year of birth 1959 1963
Education M.Sc. (Econ.) Agrologist
Main occupation Eira Hospital, Managing Director Farmer, beef producer
Relevant work experience • Ifolor Oy, Managing Director 2007–2014• American Express, Country Manager 2004–2007
• Agricultural entrepreneur 1990–present• Salaojakeskus 1987–1990
Member of the Board since 2016 2020
Concurrent key positions oftrust
• Member of the Board of Directors of Viking Malt Oy 2014–present• Member of the Board of Directors of Oy Indmeas Ab 2008–present
• Member of the Board of Directors of Lihakunta 2020–present
Past key positions of trust • Member of the Board of Directors of Stiftelsen Arcada 2010–2020• Member of the Board of Directors of Tulikivi Corporation 2013–2015
• Deputy Chair and Member of the Supervisory Board of Lihakunta 2013–2020• Member of the Supervisory Board of Atria Plc 2013–2020 and Chair 2017–2020
Independence Independent of the company and significant shareholders Dependent of the company and significant shareholders
Shareholding on 31 December 2020
0 500
Share-based rights in thecompany
None ei
Attendance in meetings 13/13 8/8
124
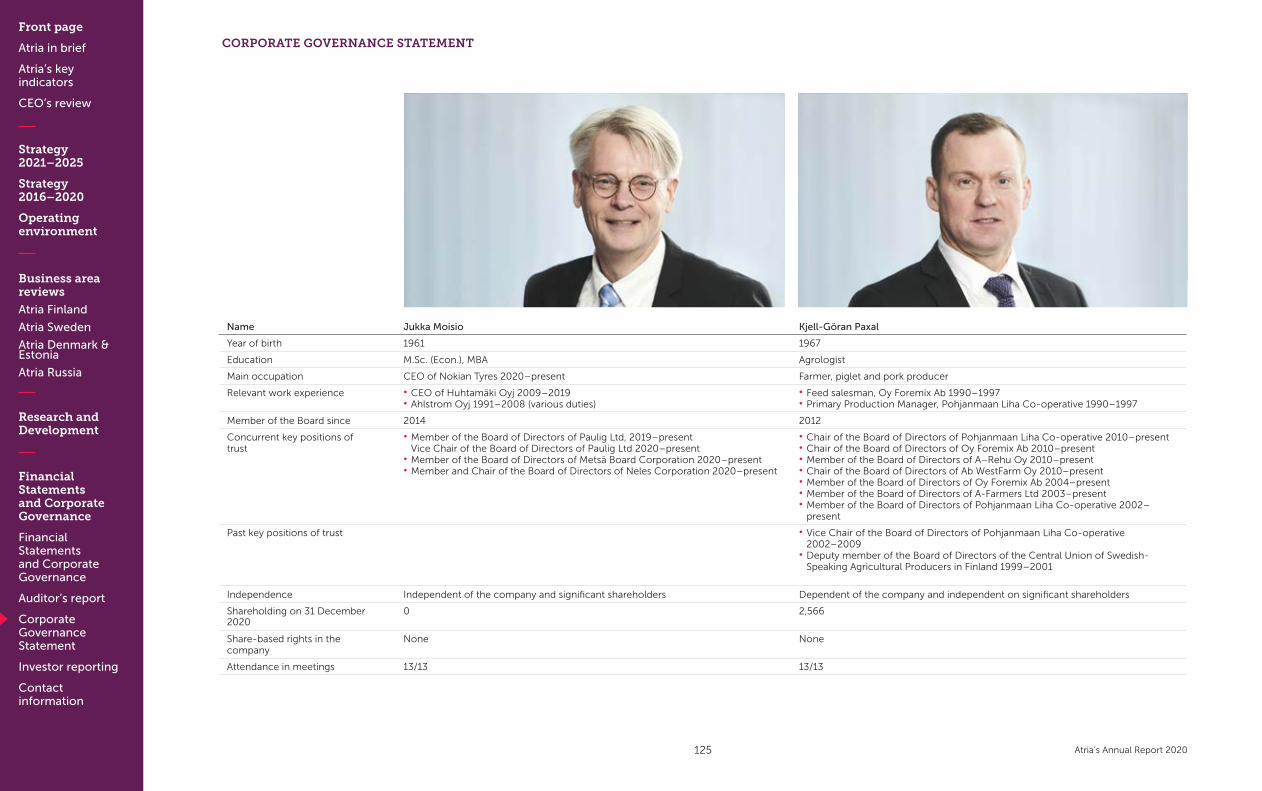
Front page
Atria in brief
Atria’s key indicators
CEO’s review
Strategy 2021–2025
Strategy 2016–2020
Operating environment
Business area reviews
Atria Finland
Atria Sweden
Atria Denmark & Estonia
Atria Russia
Research and Development
Financial Statements and Corporate Governance
Financial Statements and Corporate Governance
Auditor’s report
Corporate Governance Statement
Investor reporting
Contact information
Atria’s Annual Report 2020
Name Jukka Moisio Kjell-Göran Paxal
Year of birth 1961 1967
Education M.Sc. (Econ.), MBA Agrologist
Main occupation CEO of Nokian Tyres 2020–present Farmer, piglet and pork producer
Relevant work experience • CEO of Huhtamäki Oyj 2009–2019• Ahlstrom Oyj 1991–2008 (various duties)
• Feed salesman, Oy Foremix Ab 1990–1997• Primary Production Manager, Pohjanmaan Liha Co-operative 1990–1997
Member of the Board since 2014 2012
Concurrent key positions oftrust
• Member of the Board of Directors of Paulig Ltd, 2019–presentVice Chair of the Board of Directors of Paulig Ltd 2020–present
• Member of the Board of Directors of Metsä Board Corporation 2020–present• Member and Chair of the Board of Directors of Neles Corporation 2020–present
• Chair of the Board of Directors of Pohjanmaan Liha Co-operative 2010–present• Chair of the Board of Directors of Oy Foremix Ab 2010–present• Member of the Board of Directors of A–Rehu Oy 2010–present• Chair of the Board of Directors of Ab WestFarm Oy 2010–present• Member of the Board of Directors of Oy Foremix Ab 2004–present• Member of the Board of Directors of A-Farmers Ltd 2003–present• Member of the Board of Directors of Pohjanmaan Liha Co-operative 2002–
present
Past key positions of trust • Vice Chair of the Board of Directors of Pohjanmaan Liha Co-operative2002–2009
• Deputy member of the Board of Directors of the Central Union of Swedish-Speaking Agricultural Producers in Finland 1999–2001
Independence Independent of the company and significant shareholders Dependent of the company and independent on significant shareholders
Shareholding on 31 December 2020
0 2,566
Share-based rights in thecompany
None None
Attendance in meetings 13/13 13/13
CORPORATE GOVERNANCE STATEMENT
125
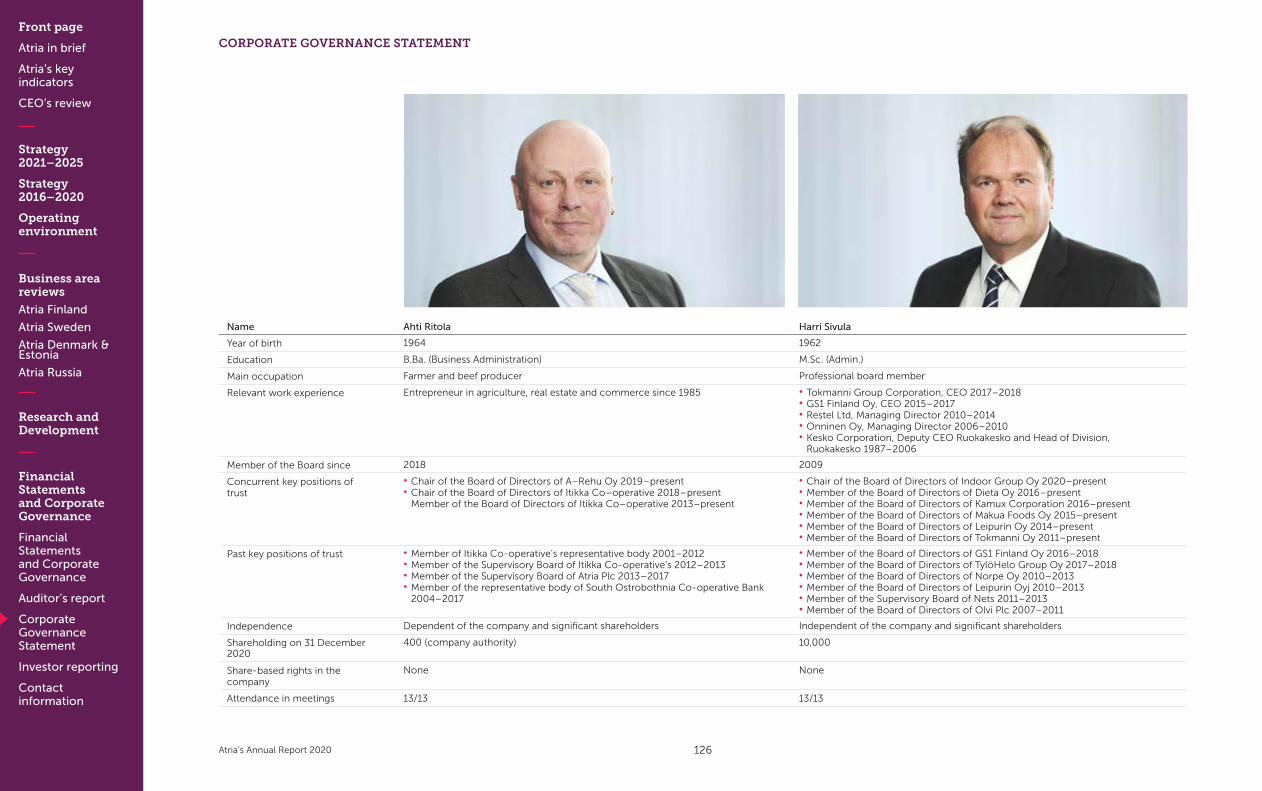
Front page
Atria in brief
Atria’s key indicators
CEO’s review
Strategy 2021–2025
Strategy 2016–2020
Operating environment
Business area reviews
Atria Finland
Atria Sweden
Atria Denmark & Estonia
Atria Russia
Research and Development
Financial Statements and Corporate Governance
Financial Statements and Corporate Governance
Auditor’s report
Corporate Governance Statement
Investor reporting
Contact information
Atria’s Annual Report 2020
CORPORATE GOVERNANCE STATEMENT
Name Ahti Ritola Harri Sivula
Year of birth 1964 1962
Education B.Ba. (Business Administration) M.Sc. (Admin.)
Main occupation Farmer and beef producer Professional board member
Relevant work experience Entrepreneur in agriculture, real estate and commerce since 1985 • Tokmanni Group Corporation, CEO 2017–2018• GS1 Finland Oy, CEO 2015–2017• Restel Ltd, Managing Director 2010–2014• Onninen Oy, Managing Director 2006–2010• Kesko Corporation, Deputy CEO Ruokakesko and Head of Division,
Ruokakesko 1987–2006
Member of the Board since 2018 2009
Concurrent key positions oftrust
• Chair of the Board of Directors of A–Rehu Oy 2019–present• Chair of the Board of Directors of Itikka Co–operative 2018–present
Member of the Board of Directors of Itikka Co–operative 2013–present
• Chair of the Board of Directors of Indoor Group Oy 2020–present• Member of the Board of Directors of Dieta Oy 2016–present• Member of the Board of Directors of Kamux Corporation 2016–present• Member of the Board of Directors of Makua Foods Oy 2015–present• Member of the Board of Directors of Leipurin Oy 2014–present• Member of the Board of Directors of Tokmanni Oy 2011–present
Past key positions of trust • Member of Itikka Co-operative’s representative body 2001–2012• Member of the Supervisory Board of Itikka Co-operative’s 2012–2013• Member of the Supervisory Board of Atria Plc 2013–2017• Member of the representative body of South Ostrobothnia Co-operative Bank
2004–2017
• Member of the Board of Directors of GS1 Finland Oy 2016–2018• Member of the Board of Directors of TylöHelo Group Oy 2017–2018• Member of the Board of Directors of Norpe Oy 2010–2013• Member of the Board of Directors of Leipurin Oyj 2010–2013• Member of the Supervisory Board of Nets 2011–2013• Member of the Board of Directors of Olvi Plc 2007–2011
Independence Dependent of the company and significant shareholders Independent of the company and significant shareholders
Shareholding on 31 December 2020
400 (company authority) 10,000
Share-based rights in thecompany
None None
Attendance in meetings 13/13 13/13
126
Front page
Atria in brief
Atria’s key indicators
CEO’s review
Strategy 2021–2025
Strategy 2016–2020
Operating environment
Business area reviews
Atria Finland
Atria Sweden
Atria Denmark & Estonia
Atria Russia
Research and Development
Financial Statements and Corporate Governance
Financial Statements and Corporate Governance
Auditor’s report
Corporate Governance Statement
Investor reporting
Contact information
Atria’s Annual Report 2020
The Board of Directors has deemed that the following members of the Board are dependent of Atria: Seppo Paavola, Jukka Kaikkonen, Ahti Ritola, Pasi Korhonen and Kjell-Göran Paxal. These members are either full-time farmers who have – or are members of the operative management of a company that has – a customer, supplier or cooperation relationship with Atria Group that is significant for the entrepreneur/company in question. Based on an overall evaluation, the Board has deemed that Harri Sivula is independent of the company, even though he has served as a member of Atria’s Board of Directors for more than ten years.
Of the Board members, Ahti Ritola is a member of the Board of Directors of Itikka Co-operative, a significant shareholder, and Pasi Korhonen and Jukka Kaikkonen are members of the Board of Directors of Lihakunta, a significant shareholder. They are therefore dependent of a significant shareholder. Seppo Paavola is a member of the Supervisory Board of Itikka Co-operative, a significant shareholder. Membership of the Supervisory Board of a significant shareholder alone has not been deemed to constitute dependence of a significant shareholder. The members of the Board of Directors are obliged to provide the Board with information sufficient to assess their skills and independence and to notify the Board of any changes to the information.
5.4 Principles concerning the diversity of the Board of Directors and the Supervisory BoardDiversity is part of Atria’s responsible business operations. When planning the composition of Atria’s Board of Directors and/or Supervisory Board, diversity is considered from a variety of perspectives, and the company’s development needs and the scope of its business operations are taken into account.
When selecting the members of the Board of Directors and/or Supervisory Board, the goal is that the members’ broad-based expertise and the composition of the Board support the development of Atria’s current and future business operations. A constructively questioning and challenging Board of Directors and Supervisory Board create added value for the company’s operations. This also brings diversity to their work. Atria seeks to promote the selection of members who are as qualified as possible and have broad and varied experience in various fields and to ensure that candidates of both genders have equal opportunities to be selected on the Board. Atria’s goal is to ensure that both genders are represented on the Board of Directors and the Supervisory Board, and that the representative of the minority gender is given preference if two candidates are equally competent. In addition to the aforementioned areas, the selection considers the candidates’ ability to spend a sufficient amount of time on their Board duties.
5.4.1. Diversity of the Board of DirectorsThe selection aims to ensure that the Board has core competence from a variety of fields within the value chain of Atria’s business operations, a wide range of experience of entrepreneurship and business activities, as well as know-how and understanding of
international business required by the company’s strategy. Rather than every member of the Board being qualified in all of the aforementioned areas, the aim is that every Board member possesses some skills in one or more of the aforementioned areas. The diversity of the Board of Directors is furthermore supported by the members’ other complementary skills, their training and experience from different occupational fields and industries, as well as by a consideration of the Board members’ age and gender distribution. In addition to the aforementioned areas, the selection considers the candidates’ ability to spend a sufficient amount of time on their Board duties.
5.4.2 Diversity of the Supervisory BoardWhen selecting members of the Supervisory Board, the goal is to consider their expertise in the meat industry and its various types of production. Diversity is also ensured by selecting members who represent various areas of Finland. In addition, the age and gender distribution of the members of the Supervisory Board are considered, along with other skills that support the Board’s work.
5.4.3. Implementation of the diversity principlesTo achieve the goals for the principles on diversity, the company has sought and seeks to actively communicate these goals to Atria’s shareholders. During the 2020 financial year, one member of the Board of Directors was a woman, and the other members were men, meaning that the minority gender represented 12.5% of all Board members. During the 2020 financial year, one member of the Supervisory Board was a woman, and the other members were men, meaning that the minority gender represented 5.2% of all Board members. The company’s goal of both genders being represented has therefore been met. The company’s other goals concerning the diversity of the Board of Directors and the Supervisory Board have also been met with regard to the Board members’ in-depth knowledge of the meat business and commercial and industrial operations, and the Supervisory Board members’ expertise in the meat industry and various types of production, as well as geographical representation.
6. Board CommitteesThe Board of Directors may decide to establish committees to handle duties designated by the Board. The Board confirms the committees’ rules of procedure.
The Board of Directors has one committee: the Nomination and Remuneration Committee. The Board of Directors appoints the members of the Committee from among its members in accordance with the Committee’s rules of procedure. The Committee has no autonomous decision-making power. The Board of Directors makes decisions on the basis of the Committee’s preparations and proposals. The Committee reports regularly to the Board of Directors, which supervises the operations of the Committee.
CORPORATE GOVERNANCE STATEMENT
127
Front page
Atria in brief
Atria’s key indicators
CEO’s review
Strategy 2021–2025
Strategy 2016–2020
Operating environment
Business area reviews
Atria Finland
Atria Sweden
Atria Denmark & Estonia
Atria Russia
Research and Development
Financial Statements and Corporate Governance
Financial Statements and Corporate Governance
Auditor’s report
Corporate Governance Statement
Investor reporting
Contact information
Atria’s Annual Report 2020
CORPORATE GOVERNANCE STATEMENT
The aim of the Nomination and Remuneration Committee is to prepare the CEO’s, the Deputy CEO’s and the management’s terms of employment, ensure objective decision-making, promote the achievement of the company’s goals through bonus schemes, increase the company’s value and ensure that bonus schemes are transparent and systematic. The aim of the Nomination and Remuneration Committee is also to ensure that the performance bonus systems are linked to the company’s strategy and the results achieved.
The Nomination and Remuneration Committee has three (3) members. The Nomination and Remuneration Committee consists of the Chair, Vice Chair and one member of the Board of Directors elected by the Board in accordance with its rules of procedure. As an exception to recommendations 17 and 18 of the Corporate Governance Code, one (1) of the members of the Nomination and Remuneration Committee is independent of the company. The Nomination and Remuneration Committee is composed of members of the Board of Directors.
The Chair of the Nomination and Remuneration Committee is Seppo Paavola, and the other members are Jyrki Rantsi (until 29 April) and, from 29 April, Pasi Korhonen and Nella Ginman-Tjeder. In 2020, the Nomination and Remuneration Committee met three times, and its members’ average attendance was 100% as follows: Seppo Paavola 3/3, Pasi Korhonen 2/2 and Nella Ginman-Tjeder 3/3.
According to its rules of procedure, the Nomination and Remuneration Committee has the following duties:• Making preparations for the nomination of the CEO and Deputy CEO• Making preparations to search for successors to the CEO and Deputy CEO• Preparing the terms of the service contracts of the CEO and Deputy CEO for the Board of
Directors to decide on• Preparing the remuneration, fees and other employment benefits of the directors who
report to the CEO and bringing them before the Board of Directors• Preparing the forms and criteria of the bonus and incentive schemes of top management
and bringing them before the Board of Directors• Preparing the content and group assignments of the pension programmes of the
company’s management and bringing them before the Board of Directors• Submitting its statement on the bonus arrangements for the entire personnel before their
approval and assessing their functionality and the achievement of the systems’ goals• If required, discussing possible interpretation problems related to the application of the
approved bonus schemes and recommending a solution• If required, reviews information to be published in the financial statements and, where
applicable, in other bonus-related documents• Preparing the remuneration policy and report for the Annual General Meeting, and
presenting the remuneration policy and report at the Annual General Meeting and answering any questions concerning the policy and report with regard to the remuneration of the CEO and the Deputy CEO
• Performing other duties separately assigned to it by the Board of Directors.
The Chair of the Nomination and Remuneration Committee convenes the Committee as needed. At the meetings, the matters falling under the duties of the Committee are reviewed. The Nomination and Remuneration Committee may invite other people to join its meetings if deemed necessary, and may use external experts to assist the Committee in fulfilling its duties.
As mentioned in section 4 above, Atria’s Annual General Meeting has established a separate Shareholders’ Nomination Board to prepare proposals concerning the election and remuneration of the members of the Board of Directors, as well as the remuneration of the members of the Supervisory Board for the next Annual General Meeting.
7. CEOThe company’s CEO in charge of managing its day-to-day operations in accordance with the instructions and orders issued by the Board of Directors and informing the Board of Directors of the development of the company’s operations and financial performance. The CEO also is also responsible for ensuring the legality of the company’s accounting and the reliability of asset management. The CEO is appointed by the Board of Directors, which decides on the terms of their service contract.
Since March 2011, Atria’s CEO has been Juha Gröhn, MSc (Food Sc). Atria also has a Deputy CEO. Tomas Back has served as Deputy CEO since 2018.
8. Management TeamAtria Group has a Management Team chaired by the CEO. The Management Team assists the CEO in planning the operations and in operational management. The duties of the Management Team include, among others, preparing strategic plans and putting them into practice, handling significant projects and organisational changes, as well as reviewing and implementing the Group’s risk management measures in their respective areas of responsibility. In 2020, the Management Team met ten times.
128
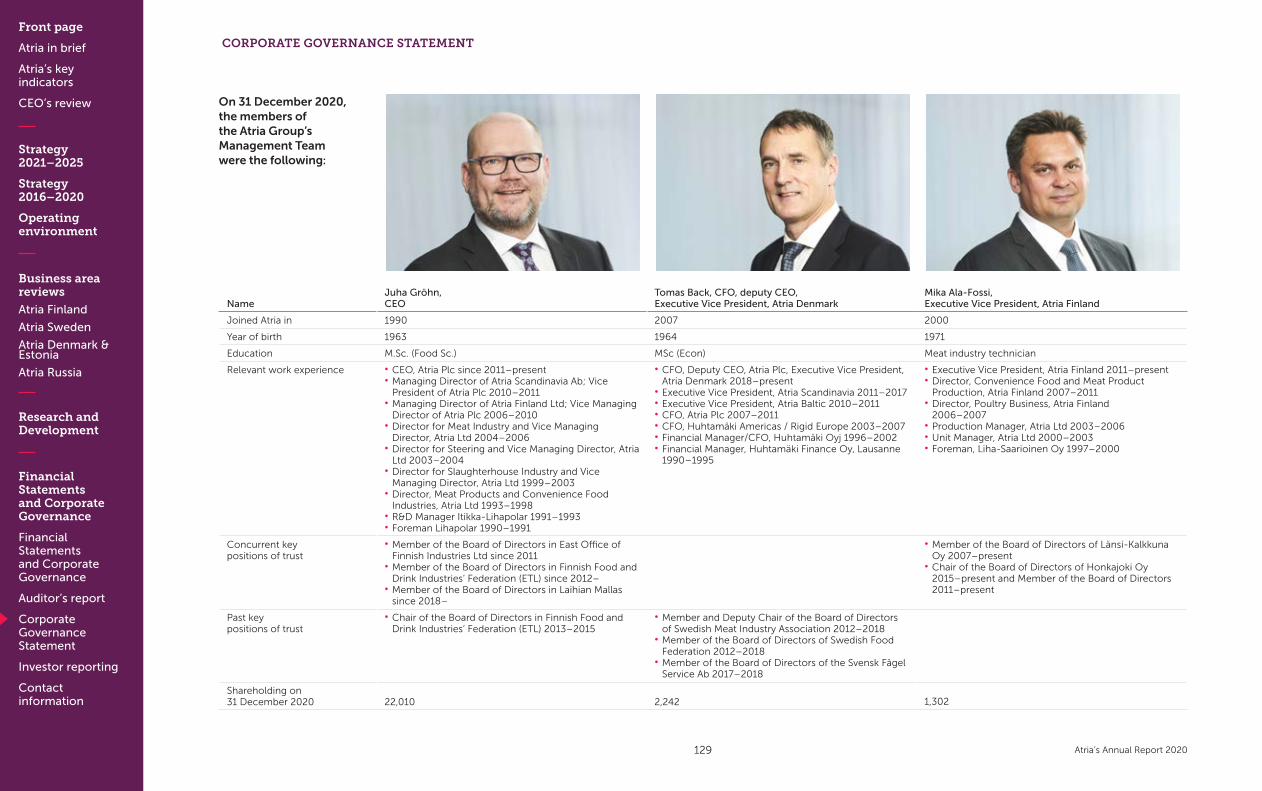
Front page
Atria in brief
Atria’s key indicators
CEO’s review
Strategy 2021–2025
Strategy 2016–2020
Operating environment
Business area reviews
Atria Finland
Atria Sweden
Atria Denmark & Estonia
Atria Russia
Research and Development
Financial Statements and Corporate Governance
Financial Statements and Corporate Governance
Auditor’s report
Corporate Governance Statement
Investor reporting
Contact information
Atria’s Annual Report 2020
NameJuha Gröhn, CEO
Tomas Back, CFO, deputy CEO, Executive Vice President, Atria Denmark
Mika Ala-Fossi, Executive Vice President, Atria Finland
Joined Atria in 1990 2007 2000
Year of birth 1963 1964 1971
Education M.Sc. (Food Sc.) MSc (Econ) Meat industry technician
Relevant work experience • CEO, Atria Plc since 2011–present• Managing Director of Atria Scandinavia Ab; Vice
President of Atria Plc 2010–2011• Managing Director of Atria Finland Ltd; Vice Managing
Director of Atria Plc 2006–2010• Director for Meat Industry and Vice Managing
Director, Atria Ltd 2004–2006• Director for Steering and Vice Managing Director, Atria
Ltd 2003–2004• Director for Slaughterhouse Industry and Vice
Managing Director, Atria Ltd 1999–2003• Director, Meat Products and Convenience Food
Industries, Atria Ltd 1993–1998• R&D Manager Itikka-Lihapolar 1991–1993• Foreman Lihapolar 1990–1991
• CFO, Deputy CEO, Atria Plc, Executive Vice President,Atria Denmark 2018–present
• Executive Vice President, Atria Scandinavia 2011–2017• Executive Vice President, Atria Baltic 2010–2011• CFO, Atria Plc 2007–2011• CFO, Huhtamäki Americas / Rigid Europe 2003–2007• Financial Manager/CFO, Huhtamäki Oyj 1996–2002• Financial Manager, Huhtamäki Finance Oy, Lausanne
1990–1995
• Executive Vice President, Atria Finland 2011–present• Director, Convenience Food and Meat Product
Production, Atria Finland 2007–2011• Director, Poultry Business, Atria Finland
2006–2007• Production Manager, Atria Ltd 2003–2006• Unit Manager, Atria Ltd 2000–2003• Foreman, Liha-Saarioinen Oy 1997–2000
Concurrent keypositions of trust
• Member of the Board of Directors in East Office ofFinnish Industries Ltd since 2011
• Member of the Board of Directors in Finnish Food andDrink Industries’ Federation (ETL) since 2012–
• Member of the Board of Directors in Laihian Mallassince 2018–
• Member of the Board of Directors of Länsi-KalkkunaOy 2007–present
• Chair of the Board of Directors of Honkajoki Oy2015–present and Member of the Board of Directors2011–present
Past keypositions of trust
• Chair of the Board of Directors in Finnish Food andDrink Industries’ Federation (ETL) 2013–2015
• Member and Deputy Chair of the Board of Directorsof Swedish Meat Industry Association 2012–2018
• Member of the Board of Directors of Swedish FoodFederation 2012–2018
• Member of the Board of Directors of the Svensk FågelService Ab 2017–2018
Shareholding on 31 December 2020 22,010 2,242 1,302
On 31 December 2020, the members of the Atria Group’s Management Team were the following:
CORPORATE GOVERNANCE STATEMENT
129

Front page
Atria in brief
Atria’s key indicators
CEO’s review
Strategy 2021–2025
Strategy 2016–2020
Operating environment
Business area reviews
Atria Finland
Atria Sweden
Atria Denmark & Estonia
Atria Russia
Research and Development
Financial Statements and Corporate Governance
Financial Statements and Corporate Governance
Auditor’s report
Corporate Governance Statement
Investor reporting
Contact information
Atria’s Annual Report 2020
CORPORATE GOVERNANCE STATEMENT
NameJarmo Lindholm, Executive Vice President, Atria Sweden
Olle Horm, Executive Vice President, Atria Estonia
Ilari Hyyrynen, Executive Vice President, Atria Russia
Joined Atria in 2002 2012 2018
Year of birth 1973 1967 1965
Education MSc (Econ) Engineer MBA
Relevant work experience • Executive Vice President, Atria Sweden 2018–present• Executive Vice President, Atria Russia 2011–2017• Group Vice President, Product Leadership, Atria Plc
2010–2011• Group Vice President, Product Group Management
and Product Development, Atria Plc, CommercialDirector, Atria Finland Ltd, 2005–2010
• Marketing Manager, Atria Ltd 2002–2005• Account Manager, Marketing Manager, AC Nielsen
2000–2002• Custom Service Manager & e-Business, Unilever
Finland 1998–2000
• Executive Vice President, Atria Estonia 2018–present• Executive Vice President, Atria Baltic 2012–2017• Chair of the Board, Maag Meat Industry 2009–2012• Chair of the Board, Skanska EMV AS 2008–2009• Chair of the Board, Rakvere Lihakombinaat AS
2000–2008• Head of transportation and equipment department,
EMV AS 1998–1999• Management and development duties, EK AS
1992–1998
• Executive Vice President, Atria Russia 2018–present• Country Director, Russia, Tikkurila Plc 2014–2018• Managing Director, Tikkurila Polska S.A. 2012–2014• Director BU North, Tikkurila Plc 2010–2012• Tikkurila Ltd/ Plc, several positions 2003-2010• Dynea Overlays Ltd, Sales Manager 2002–2003• Akzo Nobel Coatings Ltd, Sales Manager 1998–2002• Kausalan Tapetti ja Väri Ltd, Salesman 1988–1998
Concurrent keypositions of trust
• Member of the Board of Directors of Swedish FoodFederation since 2018–present
• Member of the Board of Directors of KCF (SvenskaKött & Chark Företagen) 2020–present
• Member of the Board of Directors of the EstonianFood Industry Federation
• Member of the Board of Directors of the Estonian PigBreeders’ Association
• Member of the Board of Directors of the East Office ofFinnish Industries Oy since 2018
Past keypositions of trust
• Member of the Board of Directors of the East Office ofFinnish Industries 2012–2018
Shareholding on 31 December 2020 1,382 - -
130

Front page
Atria in brief
Atria’s key indicators
CEO’s review
Strategy 2021–2025
Strategy 2016–2020
Operating environment
Business area reviews
Atria Finland
Atria Sweden
Atria Denmark & Estonia
Atria Russia
Research and Development
Financial Statements and Corporate Governance
Financial Statements and Corporate Governance
Auditor’s report
Corporate Governance Statement
Investor reporting
Contact information
Atria’s Annual Report 2020
NamePasi Luostarinen, Executive Vice President, Marketing & Market Insight
Lars Ohlin, Executive Vice President, Human Resources
Merja Leino, Executive Vice President, Sustainability
Joined Atria in 2000 2007 1996
Year of birth 1966 1958 1960
Education MSc (Econ) BA (International Business Administration) PhD (Food Chemistry)
Relevant work experience • Executive Vice President Marketing & MarketingInsight, Atria Plc 2016–present
• Senior Vice President Marketing & ProductDevelopment, Atria Finland 2011–2016
• Group Vice President Brand Management & Cold Cuts/ Senior Vice President Meat Products, Atria Plc andAtria Finland 2007–2011
• Group Vice President Marketing & ProductDevelopment, Atria Plc 2006–2007
• Marketing Director, Atria Plc, Atria Finland and AtriaSweden 2000– 2006
• Marketing Director, Valio 1997–2000• Trade Development Manager, British American
Tobacco Nordic 1996–1997• Key Account Manager/ Category Manager, Fazer
Makeiset Oy 1993– 1996• Product Manager, Mallasjuoma Oy 1991–1993
• Executive Vice President Human Resources, Atria Plc2016–present
• Senior Vice President Human Resources, AtriaScandinavia 2014–2016
• General Manager, Ridderheims & Falbygdens (AtriaDeli) 2010–2014
• Business Development Director, Atria Scandinavia2007–2010
• Business Development Director, Sardus 2000–2007• Business Area Director, Nationalencyklopedin
1997–2000• Vice Managing Director, Forte 1995–1997• Market Development Director, Master Foods Finland
and Baltics 1992–1995• Human Resource Director, Master Foods Sweden and
Finland 1988–1992• Product Manager, Master Foods Sweden 1987–1988• Product Manager, Findus/Nestlé 1984–1987
• Executive Vice President, Sustainability, Atria Plc 2019–present
• Senior Vice President, Convenience Food Business,Quality, Food Safety and Sustainability, Atria Finland2016–2019
• Senior Vice President, Poultry Business, Quality, FoodSafety and Sustainability, Atria Finland 2011–2016
• Group Vice President, Quality, Product Safety and FoodBusiness (poultry and convenience food), Atria Plc2007–2011
• Director, Poultry Business, Quality and Product Safety,Atria Finland 2000–2007
• Director, Consumer Packed Meat, Quality Developmentand Product Safety, Atria Finland 1999–2000
• Product Development Director, Atria Finland 1996–1999• National Coordinator, Elintarviketalouden
Osaamiskeskus 1995–1996• Packaging Developer / Packaging Manager, Unilever
1993–1995• Researcher, University of Turku 1991–1993• Product Developer, Huhtamäki, Jalostaja 1987–1991
Concurrent keypositions of trust
• Chairman of the Board of Directors, Foodwest Oy2005–present
• Member of the Supervisory Board, Finnish 4Horganization 2005–present
Past keypositions of trust
• Member of the Board of Seinäjoen TangomarkkinatLtd 2019–2020, Chair of the Board 2019–2020
• Member of the Board of Directors, Foodwest Oy1996–2005
Shareholding on 31 December 2020 2,326 872 2,031
CORPORATE GOVERNANCE STATEMENT
131
Front page
Atria in brief
Atria’s key indicators
CEO’s review
Strategy 2021–2025
Strategy 2016–2020
Operating environment
Business area reviews
Atria Finland
Atria Sweden
Atria Denmark & Estonia
Atria Russia
Research and Development
Financial Statements and Corporate Governance
Financial Statements and Corporate Governance
Auditor’s report
Corporate Governance Statement
Investor reporting
Contact information
Atria’s Annual Report 2020
CORPORATE GOVERNANCE STATEMENT
9. RemunerationAtria has prepared a remuneration report in compliance with the Corporate Governance Code that came into effect on 1 January 2020. The statement is available on the company’s website at www.atria.com (Investors > Corporate Governance).
10. Internal control, risk management and internal audit
10.1 Internal controlThe purpose of internal control within the Atria Group is to support the implementation of Atria’s strategy and the achievement of its goals, and to ensure that Atria’s operations are efficient and both external and internal reporting reliable. Internal control also ensures compliance with legislation, regulations, agreements and Atria’s values, as well as internal procedures and principles.
Atria has strategic and annual financial goals which steer the entire Group’s operations. These goals have been communicated to all business areas, and they have been agreed on and approved as part of the strategy process or the annual goal-setting process. The achievement of the financial goals is monitored on a monthly and quarterly basis in each business area and at Group level.
Atria uses Group policies, principles and guidelines for internal control and related steering. The company seeks to ensure compliance with the guidelines and rules by providing training and information. In addition, internal control is supported by internal audit and risk management. Approval procedures, user rights and controls are also part of internal control.
The reliability of financial and business reporting is ensured through the documentation of financial processes and by means of financial management guidelines, as well as control practices and the related guidelines. The control practices consist of both preventive and investigative measures. Typical control practices include approval, insurance, verification, reconciliation, operational inspections, the protection of assets, the separation of jobs and the administration of user rights.
The Group’s CEO and Board of Directors are responsible for the appropriate organisation of internal control. The Board of Directors is responsible for ensuring that Atria has internal control principles in place, and that the effectiveness of the principles is guided and monitored. Each business area is responsible for arranging effective and appropriate control procedures.
10.2 Risk management Risk management supports the implementation of Atria’s strategy and the achievement of its goals, as well as the organisation’s development in the operating environment defined
in Atria’s strategy. Risk management also aims to prevent unfavourable events and safeguard business continuity.
Atria defines risk as the impact of uncertainty on the company’s objectives. Risks can cause positive or negative deviations from set goals. For reporting purposes, Atria’s risks are divided into four categories: strategic risks, operational risks, liability risks and financial risks. Risks are also divided into internal and external risks depending on whether they are posed by factors external to the Group or by internal factors.
Risk management is guided by the company’s risk management policy, which has been approved by the Board of Directors, and by the ISO 31000 and ISO 31010 standards as applicable. The recommendations of the Securities Market Association (SMA) for listed companies have also been observed in the arrangement of risk management. The risk management policy specifies Atria’s risk management goals, principles, responsibilities and authorisations, along with the principles of risk assessment and reporting. More detailed guidelines for operating methods concerning risk identification and reporting are provided in Atria’s risk management process guidelines.
Risk management is part of Atria’s day-to-day business operations, and risk management enables the company to consider the impact of uncertainty on its operations when making decisions. Risk management at Atria Group is based on consistent risk identification, assessment and reporting, and risk management is part of the annual planning process. Communication related to risks complies with the Group’s communication plan. Risks are managed in accordance with the specified approved principles in all business areas and Group operations.
The Board of Directors approves the Risk Management Policy and any changes to the policy, and supervises the implementation of the principles specified in the policy. The Group’s CEO is responsible for the appropriate organisation of risk management at Atria, and the CFO sees to the development of the risk management and reporting framework.
Board of Directors and the members of the Group’s Management Team are responsible for identifying and assessing strategic risks and for implementing risk management in their respective areas of responsibility. The management teams of the business areas are responsible for identifying and assessing operational risks and for implementing risk management in their respective business areas. The Group’s Treasury Committee is responsible for identifying and assessing financial risks and for implementing risk management throughout the Group.
When preparing an annual plan for internal audit, key observations from the risk assessments made as part of the Group’s planning process are taken into account. Every Atria employee is responsible for identifying and assessing risks associated with their work and any other risks that they encounter, and for drawing attention to and preventing such risks.
132
Front page
Atria in brief
Atria’s key indicators
CEO’s review
Strategy 2021–2025
Strategy 2016–2020
Operating environment
Business area reviews
Atria Finland
Atria Sweden
Atria Denmark & Estonia
Atria Russia
Research and Development
Financial Statements and Corporate Governance
Financial Statements and Corporate Governance
Auditor’s report
Corporate Governance Statement
Investor reporting
Contact information
Atria’s Annual Report 2020
Major risks and uncertainties known to the Board of Directors are discussed in more detail in the Board of Directors’ report under ‘Risk management at Atria’.
10.3 Internal auditInternal Audit evaluates and inspects the effectiveness of the Group’s internal control system, the relevance and efficiency of the activities, and compliance with guidelines. It also aims to promote the quality of operations and the process, ensure the achievement of Atria’s goals and the effectiveness of risk management and highlight best practices and development opportunities in various functions.
Internal Audit assesses the following areas:• Accuracy and adequacy of financial information• Compliance with operating principles, guidelines and regulations• Protection of property against losses • Economical and efficient use of resources• Implementation of changes• Measures resulting from changes in the operating environment• Opportunities provided by various practices and the utilisation of best practices
The results of internal auditing are documented and discussed with the audited area of operation and Group management. A summary of the audit results is presented to the Board of Directors at least once a year. Regular discussions are held with the auditor to ensure that the audit activities cover a sufficiently wide range of operations and to avoid overlapping audit operations.
The Board of Directors approves the annual plan for internal auditing. The preparation of the audit plan is guided by risk management, issues identified as part of the Group’s internal reporting, goals related to improving the quality and efficiency of the operations, and current issues in the company’s operating environment. Atria’s Group Control function is responsible for internal auditing in cooperation with an external service provider. Where necessary, separate studies commissioned by the Board of Directors or the Group’s management will be conducted.
11. AuditingIn line with its Articles of Association, the company has one (1) auditor. Its auditor must be an audit firm approved by the Finnish Patent and Registration Office. The auditor’s term of service ends at the close of the Annual General Meeting following their election.
The auditor provides Atria’s shareholders with an auditor’s report in accordance with the law, in connection with the company’s financial statements, and reports regularly to the Board of Directors and management. The auditor participates in a Board meeting at least once a year, on which occasion a discussion of the audit plan and the results of auditing is held.
In 2020, Atria Plc’s Annual General Meeting elected PricewaterhouseCoopers Ltd, Authorised Public Accountants, as the company’s auditor for a term ending at the close of the next Annual General Meeting. The audit firm has announced that Samuli Perälä, APA, serves as the principal auditor. Remuneration is paid to the auditor according to an invoice approved by the company.
Auditor’s remuneration for the 2020 financial yearIn 2020, the Group paid EUR 322,000 to PricewaterhouseCoopers Ltd. as the auditor’s remuneration.
12. Insider policyAtria complies with Nasdaq Helsinki Ltd’s Guidelines for Insiders. In addition, Atria’s Board of Directors has confirmed Atria’s insider guidelines, which complement other insider guidelines and include instructions concerning insiders and insider administration. The company’s insider guidelines have been distributed to all persons discharging managerial duties as defined by the company, as well as to the people involved in the preparation of financial reporting. The guidelines are also available on the company’s intranet.
Regulation (EU) No 596/2014 of the European Parliament and of the Council of 16 April 2014 on market abuse (Market Abuse Regulation) has been applied since 3 July 2016. Atria has not established a permanent insider register. Insider information is managed by means of project-specific insider registers that are established and maintained as needed. All project-specific insiders are informed about their insider status in writing and provided with the appropriate insider instructions.
Atria has determined that the members of the Board of Directors, the members of the Supervisory Board, the CEO, the Deputy CEO and the CFO satisfy the definition of personnel discharging managerial duties with a notification obligation. The company maintains a list of the personnel discharging managerial duties and their related parties.
The company maintains registers of managers subject to the notification obligation and their related parties, as well as of Atria’s project-specific insiders when necessary. The company’s legal department and CFO monitor compliance with the insider guidelines. The right of personnel discharging managerial duties and involved in the preparation of financial reporting to trade in the company’s financial instruments has been restricted in such a way that the aforementioned people may not trade in the company’s shares 30 days prior to the publication of an interim report and a release of the financial statements and further should the period between the end of a review period and the publication of the report/release exceed 30 days.
CORPORATE GOVERNANCE STATEMENT
133
Front page
Atria in brief
Atria’s key indicators
CEO’s review
Strategy 2021–2025
Strategy 2016–2020
Operating environment
Business area reviews
Atria Finland
Atria Sweden
Atria Denmark & Estonia
Atria Russia
Research and Development
Financial Statements and Corporate Governance
Financial Statements and Corporate Governance
Auditor’s report
Corporate Governance Statement
Investor reporting
Contact information
Atria’s Annual Report 2020
CORPORATE GOVERNANCE STATEMENT
13. Related-party transactionsAtria’s business operations may include regular business transactions with its related parties. The ordinary business activities of Atria Group’s primary production companies may include the sale and purchase of animals, grain and feed to and from people included in Atria’s related parties. In addition, Atria Group’s companies may purchase and sell services and raw materials from and to companies included in Atria’s related parties.
The company has defined its related parties and maintains a list of such related parties. The related parties have been provided with the necessary guidelines. Each person included in Atria’s related parties is responsible for ensuring that Atria has up-to-date information about their related parties. The company updates its list of related parties at least once a year by sending an information request to the people included in its related parties. The communities included in Atria’s related parties are checked in connection with this.
Decision-making guidelines have been prepared for business transactions with related parties. These guidelines enable Atria to identify related party transactions and the related requirements and to assess in advance whether the transaction is part of is ordinary business activities. The purpose of the guidelines is to ensure the careful preparation of related party transactions and the acquisition of any reports, statements and/or assessments necessary for the preparation, as well as decision-making in accordance with the disqualification regulations.
Atria has a monitoring and reporting system for related party transactions, and control measures are also targeted regularly at related party transactions. Related party transactions are reported annually to the Board of Directors to ensure that the transactions are part of the company’s ordinary business activities and are conducted on market terms.
14. CommunicationsThe aim of Atria’s investor communications is to ensure that the markets have accurate and sufficient information to determine the value of Atria’s shares at all times. Another aim is to provide the financial markets with comprehensive information to enable active participants in the capital markets to create an overview of Atria as an investment.
Silent periodAtria has established a silent period for its investor relations communications. The silent period covers 30 calendar days prior to the publication of interim reports and annual reports and, if there are more than 30 days between the end of the review period and the publication of the report/release, the period in question. Atria will not issue any statements on its financial standing during this period.
Investor informationAtria publishes financial information in real time on its website at www.atria.com. The website contains annual reports, interim reports, and press and stock exchange releases. Information about the company’s largest shareholders is updated regularly on the website. The disclosure policy approved by Atria’s Board of Directors describes the key principles and procedures followed by Atria as a listed company in its communications with the media, capital markets and other stakeholders. Atria’s disclosure policy is available in its entirety on the company’s website at www.atriagroup.com, under Investors, Disclosure Policy.
Remuneration report 2020
This Remuneration Report includes information concerning the remuneration of the Board of Directors, Supervisory Board, CEO and deputy CEO of Atria Plc during 1 January 2020 – 31 December 2020. This Report describes the remuneration of our governing bodies according to Finnish Securities Market Act, Liability Companies Act and Corporate Governance Code 2020 published by Finnish Securities Market Association.
1. Shortly about our Remuneration PolicyThe Remuneration Policy of Atria Oyj was presented for the Annual General Meeting held on April, 29, 2020. The Policy is applied until the Annual General Meeting in 2024, unless the Board decides to bring it to the General Meeting earlier.
The objective of remuneration in Atria is to attract, motivate and retain the right people capabilities and leadership necessary to achieve performance and strategic goals. The structure of the total remuneration should be aligned with the long-term value creation of Atria, the business strategy, the financial results as well as the employee’s contribution. Remuneration is based on predetermined and measurable performance and result criteria.
The long-term goal of Atria is to secure and improve profitability, boost growth and increase the Company’s value. Remuneration at Atria aims to promote the Company´s long-term financial success, competitiveness and the favourable development of shareholder value. Remuneration is based on performance, results and contribution to Atria. Remuneration should be understandable, consistent, transparent, internally fair and non-discriminating. Remuneration complies with statutory regulations and good corporate governance.
During 1 January 2020 - 31 December 2020 Atria has followed its Remuneration Policy and the Policy has been seen to support our long term targets well. No deviations have been made from the Policy in 2020. No clawbacks of remuneration has been made.
134
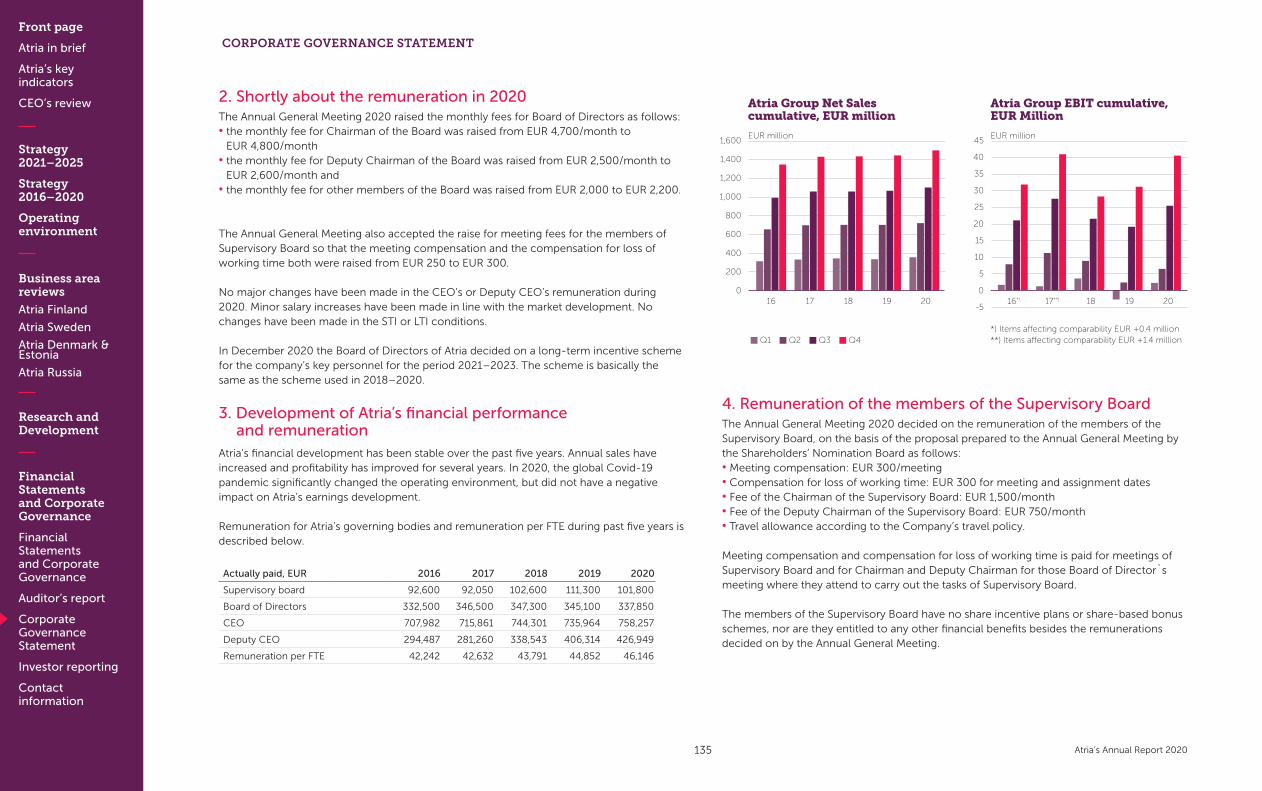
Front page
Atria in brief
Atria’s key indicators
CEO’s review
Strategy 2021–2025
Strategy 2016–2020
Operating environment
Business area reviews
Atria Finland
Atria Sweden
Atria Denmark & Estonia
Atria Russia
Research and Development
Financial Statements and Corporate Governance
Financial Statements and Corporate Governance
Auditor’s report
Corporate Governance Statement
Investor reporting
Contact information
Atria’s Annual Report 2020
2. Shortly about the remuneration in 2020The Annual General Meeting 2020 raised the monthly fees for Board of Directors as follows: • the monthly fee for Chairman of the Board was raised from EUR 4,700/month to
EUR 4,800/month• the monthly fee for Deputy Chairman of the Board was raised from EUR 2,500/month to
EUR 2,600/month and • the monthly fee for other members of the Board was raised from EUR 2,000 to EUR 2,200.
The Annual General Meeting also accepted the raise for meeting fees for the members of Supervisory Board so that the meeting compensation and the compensation for loss of working time both were raised from EUR 250 to EUR 300.
No major changes have been made in the CEO’s or Deputy CEO’s remuneration during 2020. Minor salary increases have been made in line with the market development. No changes have been made in the STI or LTI conditions.
In December 2020 the Board of Directors of Atria decided on a long-term incentive scheme for the company’s key personnel for the period 2021–2023. The scheme is basically the same as the scheme used in 2018–2020.
3. Development of Atria’s financial performance and remunerationAtria’s financial development has been stable over the past five years. Annual sales have increased and profitability has improved for several years. In 2020, the global Covid-19 pandemic significantly changed the operating environment, but did not have a negative impact on Atria’s earnings development.
Remuneration for Atria’s governing bodies and remuneration per FTE during past five years is described below.
Actually paid, EUR 2016 2017 2018 2019 2020
Supervisory board 92,600 92,050 102,600 111,300 101,800
Board of Directors 332,500 346,500 347,300 345,100 337,850
CEO 707,982 715,861 744,301 735,964 758,257
Deputy CEO 294,487 281,260 338,543 406,314 426,949
Remuneration per FTE 42,242 42,632 43,791 44,852 46,146
Atria Group Net Sales cumulative, EUR million
1,600
1,400
1,200
1,000
800
600
400
200
0
EUR million
16 17 18 19 20
Atria Group EBIT cumulative, EUR Million
45
40
35
30
25
20
15
10
5
0
-5
EUR million
16*) 17**) 18 19 20
Q1 Q2 Q3 Q4*) Items affecting comparability EUR +0.4 million**) Items affecting comparability EUR +1.4 million
4. Remuneration of the members of the Supervisory BoardThe Annual General Meeting 2020 decided on the remuneration of the members of the Supervisory Board, on the basis of the proposal prepared to the Annual General Meeting by the Shareholders’ Nomination Board as follows:• Meeting compensation: EUR 300/meeting• Compensation for loss of working time: EUR 300 for meeting and assignment dates• Fee of the Chairman of the Supervisory Board: EUR 1,500/month• Fee of the Deputy Chairman of the Supervisory Board: EUR 750/month• Travel allowance according to the Company’s travel policy.
Meeting compensation and compensation for loss of working time is paid for meetings of Supervisory Board and for Chairman and Deputy Chairman for those Board of Director`s meeting where they attend to carry out the tasks of Supervisory Board.
The members of the Supervisory Board have no share incentive plans or share-based bonus schemes, nor are they entitled to any other financial benefits besides the remunerations decided on by the Annual General Meeting.
CORPORATE GOVERNANCE STATEMENT
135

Front page
Atria in brief
Atria’s key indicators
CEO’s review
Strategy 2021–2025
Strategy 2016–2020
Operating environment
Business area reviews
Atria Finland
Atria Sweden
Atria Denmark & Estonia
Atria Russia
Research and Development
Financial Statements and Corporate Governance
Financial Statements and Corporate Governance
Auditor’s report
Corporate Governance Statement
Investor reporting
Contact information
Atria’s Annual Report 2020
CORPORATE GOVERNANCE STATEMENT
In 2020, the monthly and meeting fees paid to the members of the Supervisory Board (including fees for work performed in other companies within the same Group) were as follows:
Atria Plc A-Farmers Ltd A-Rehu Oy
The members of the Supervisory Board: Monthly fee Meeting fees Monthly fee Meeting fee Monthly fee Meeting fee Total
Halonen Jyrki, chairman as of 29 April 2020 12,000 2,050 14,050
Anttikoski Juho, deputy chairman 9,000 2,550 11,550
Asunmaa Mika 1,150 5,400 6,550
Haarala Lassi-Antti 1,150 1,150
Hantula Jussi 1,150 1,150
Hyttinen Veli 1,150 7,800 3,600 12,550
Ingalsuo Pasi 1,150 7,800 5,700 14,650
Joki-Erkkilä Jussi 1,150 1,150
Juuse Marja-Liisa 1,150 1,150
Kaikkonen Jukka, chairman until 28 April 2020 6,000 250 6,250
Kiviniemi Juha 1,150 1,150
Lahti Risto, as of 29 April 2020 900 900
Lajunen Ari 1,150 1,150
Lapatto Vesa, as of 29 April 2020 900 900
Nikkola Juha 1,150 1,150
Niku Mika 1,150 10,400 5,700 17,250
Ojala Pekka, until 28 April 2020 250 250
Panula Heikki 1,150 1,150
Pöyhönen Ari, as of 29 April 2020 900 900
Sairanen Risto 1,150 3,300 4,450
Sandberg Ola 1,150 300 1,450
Tuhkasaari Timo , 1,150 , , , , 1,150
5. Remuneration of the members of the Board of DirectorsThe Annual General Meeting 2020 decided on the remuneration of the members of the Board of Directors, on the basis of the proposal prepared to the Annual General Meeting by the Shareholders’ Nomination Board as follows:• Meeting compensation: EUR 300/meeting• Compensation for loss of working time: EUR 300 for meeting and assignment dates• Fee of the Chair of the Board of Directors: EUR 4,800/month• Fee of the Deputy Chair of the Board of Directors: EUR 2,600/month• Fee of members of the Board of Directors: EUR 2,200/month• Travel allowance according to the Company`s travel policy.
Meeting compensation and compensation for loss of working time is paid for members of Board of Directors beside of Board meetings also for meetings of Remuneration and Nomination Committee and those meetings of Supervisory Board where Board members attended. Remuneration is handled in the form of monetary compensation. The members of the Board of Directors have no share incentive plans or share-based bonus schemes, nor are they entitled to any other financial benefits besides the remunerations decided on by the Annual General Meeting.
136

Front page
Atria in brief
Atria’s key indicators
CEO’s review
Strategy 2021–2025
Strategy 2016–2020
Operating environment
Business area reviews
Atria Finland
Atria Sweden
Atria Denmark & Estonia
Atria Russia
Research and Development
Financial Statements and Corporate Governance
Financial Statements and Corporate Governance
Auditor’s report
Corporate Governance Statement
Investor reporting
Contact information
Atria’s Annual Report 2020
In 2020 monthly fees and meeting fees paid to the members of the Board of Directors (including being a member of the Board of another company that is part of the same Group) were as follows:
Atria Plc A-Farmers Ltd A-Rehu Oy
Name Monthly fee Meeting fee Monthly fee Meeting fees Monthly fee Meeting fee Total
Paavola Seppo, chairman 57,200 10,800 68,000
Korhonen Pasi, deputy chairman as of 29 April 2020 28,800 8,700 37,500
Ginman-Tjeder Nella 25,600 5,400 31,000
Kaikkonen Jukka, as of 29 April 2020 17,600 4,700 22,300
Moisio Jukka 25,600 4,800 30,400
Paxal Kjell-Göran 25,600 8,100 5,700 3,600 43,000
Rantsi Jyrki, deputy chairman until 28 April 2020 10,000 4,200 5,200 2,400 21,800
Ritola Ahti 25,600 7,800 15,600 3,600 52,600
Sivula Harri 25,600 5,400 , , , , 31,000
6. Remuneration of CEO and deputy CEO The remuneration of Atria Plc’s management aims to promote the company’s long-term financial success and competitiveness and the favorable development of shareholder value.
The remuneration of the CEO and the Deputy CEO consists of base salary (including fringe benefits), short-term incentive (STI) and long-term incentive (LTI), pension and other benefits. For the members of Atria Group Management Team, belonging to Finnish social security, there has been agreed a group pension arrangement accepted by the Atria Board of Directors. The retirement age based on the group pension arrangement is at least 63 years. According to the pension arrangement agreement, if the legislation concerning pension changes, the retirement age is altered. CEO and Deputy CEO have nevertheless the right with certain conditions to retire at the age of 60. The pension arrangement is payment based and the amount of pension is based on the annual earnings as decided by the Board of Directors (including monetary salary and fringe benefits without cash payments of incentive schemes). The CEO’s period of notice is six months for both parties. If the Company terminates the contract, the CEO is entitled to the salary for the period of notice and severance pay, which together correspond to 18 months’ salary. There are no terms and conditions for any other compensation based on the termination of employment. The Deputy CEO’s period of notice is six months for both parties. If the Company terminates the contract, the Deputy CEO is entitled to the salary for the period of notice and severance pay, which together correspond to 14 months’ salary. There are no terms and conditions for any other compensation based on the termination of employment.
Short-term incentive plan The maximum amount of bonus pay under Atria’s short-term incentive plan is 25 to 50% of the annual salary, depending on the effect on the results and the level of competence required for the role. The criteria in the bonus pay plan are the performance requirements and net sales at Group level and in the area of responsibility of the person concerned
Long-term incentive plansIn 2017, Atria Plc’s Board of Directors decided on the long-term incentive program for management and key personnel for the period 2018–2020. The aim of the share incentive program is to encourage Atria’s management to acquire shares in the company and to take action and make decisions that will increase the company’s long-term value. The program based on share and cash incentives and was divided into three year-long earning periods. The bonuses payable under the program were based on the company’s earnings per share (EPS) (70%) and organic growth (30%). The bonuses for each earning period are be paid in three equal instalments in three following years of the earning period partly in the form of shares and partly in cash. There are no restrictions regarding the ownership of paid shares. All payments from the earning period implemented in 2015–2017 were based on the Group’s earnings per share (EPS) excluding non-recurring items. The plan expired on 31 December 2017, and the final bonus payments were paid in March 2020.
The total paid salary for CEO during 2020 was EUR 620,891 and for deputy CEO EUR 349,113. The proportion of variable remuneration actually earnt in 2020 was 31% for the CEO and 23% for the Deputy CEO of the total remuneration.
CORPORATE GOVERNANCE STATEMENT
137

Front page
Atria in brief
Atria’s key indicators
CEO’s review
Strategy 2021–2025
Strategy 2016–2020
Operating environment
Business area reviews
Atria Finland
Atria Sweden
Atria Denmark & Estonia
Atria Russia
Research and Development
Financial Statements and Corporate Governance
Financial Statements and Corporate Governance
Auditor’s report
Corporate Governance Statement
Investor reporting
Contact information
Atria’s Annual Report 2020
CORPORATE GOVERNANCE STATEMENT
The remuneration of the CEO and the deputy CEO in 2020 was as follows:
Element CEO Deputy CEO
Base salary (including fringe benefits) EUR 549,464 EUR 310,148
Pension EUR 137,366 EUR 77,536
2020 paid short-term incentives
2020 earned short-term incentives
EUR 23,440 (paid in 2020)
EUR 122,097 (earned in 2020)
EUR 18,204 (paid in 2020)
EUR 71,372 (earned in 2020)
2020 paid long-term incentives
Earned long-term incentives
EUR 47,987 EUR 41,187 paid in cash 2020 + 850 shares at EUR 8.00 / 23 March 2020, cash and shares both earned based from earning periods 2017, 2018 and 2019.
EUR 191,681 Earned from earning periods 2018, 2019, 2020.Total value 19,460 shares (part of the shares is given as cash equivalent), with share value EUR 9.85 (share value per 31 December 2020), total value EUR 191,681.Shares/cash equivalent will be paid in 2021, 2022 and 2023.
EUR 20,761EUR 19,129 paid in cash 2020 + 204 shares at EUR 8.00 /23 March 2020, cash and shares both earned based from earning periods 2017, 2018 and 2019.
EUR 46,049Earned from earning periods 2018, 2019, 2020.Total value 4,675 shares (part of the shares is given as cash equivalent) with share value EUR 9.85 (share value 31 December 2020), total value EUR 46,049.Shares/cash equivalent will be paid in 2021, 2022 and 2023.
Other benefits No other benefits during 2020 No other benefits during 2020
138

Front page
Atria in brief
Atria’s key indicators
CEO’s review
Strategy 2021–2025
Strategy 2016–2020
Operating environment
Business area reviews
Atria Finland
Atria Sweden
Atria Denmark & Estonia
Atria Russia
Research and Development
Financial Statements and Corporate Governance
Financial Statements and Corporate Governance
Auditor’s report
Corporate Governance Statement
Investor reporting
Contact information
Atria’s Annual Report 2020
FINANCIAL COMMUNICATIONS
Investor reporting
The aim of Atria’s investor reporting is to ensure that the market has at all times correct and sufficient information available to determine the value of Atria’s share. In addition the aim is to provide the financial markets with versatile information, based on which those active in the capital markets can form a justified image of Atria as an investment object.
Atria has established a silent period for its investor relations communications; this period covers 30 calendar days prior to the publication of interim reports and annual reports and, if there are more than 30 days between the end of the review period and the publication of the report/release, the period in question. Atria will not issue any statements on its financial standing during this period
Investor informationAtria publishes financial information in real time on its web pages at www.atria.com. Here you can find annual reports, interim reports and press and company announcements. The company’s largest shareholders and insiders as well as their holdings are updated regularly to the web pages.
Stock exchange releasesAtria Plc published a total of 25 company announcements in 2020. The releases can be found on the Atria Group website www.atria.com.
Disclosure policyThe disclosure policy approved by the Atria Board of Directors describes the key principles followed by Atria as a listed company in its communications with the capital markets and other stakeholders. The disclosure policy is available in full on the company’s website.
Atria Plc’s IR contact person:Hanne KortesojaCommunication and IR managerTel: + 358 400 638 839e-mail: [email protected]
Atria’s performance has been monitored by at least the following analysts:
NORDEAJoni SandvallTel: +358 9 5300 5484e-mail: [email protected]
OP EquitiesJussi MikkonenTel: +358 10 252 8780e-mail: [email protected]
139
Front page
Atria in brief
Atria’s key indicators
CEO’s review
Strategy 2021–2025
Strategy 2016–2020
Operating environment
Business area reviews
Atria Finland
Atria Sweden
Atria Denmark & Estonia
Atria Russia
Research and Development
Financial Statements and Corporate Governance
Financial Statements and Corporate Governance
Auditor’s report
Corporate Governance Statement
Investor reporting
Contact information
Atria’s Annual Report 2020
ATRIA PLC
Head office:
Itikanmäenkatu 3, Seinäjoki
Box 900, FI-60060 ATRIA
Tel. +358 20 472 8111
www.atria.com
ATRIA FINLAND
Headoffice:
Atriantie 1, Seinäjoki
Box 900, FI-60060 ATRIA
Tel. +358 20 472 8111
www.atria.com
Invoicing address:
Box 1000
FI-60061 ATRIA
Financial administration:
Itikanmäenkatu 3, Seinäjoki
Finland
Box 900, FI-60060 ATRIA
Sales service centre:
Itikanmäenkatu 3,
Seinäjoki, Finland
Box 900, FI-60060 ATRIA
Commercial functions:
Läkkisepäntie 23
FI-00620 Helsinki, Finland
Other offices and plants:
Rahikkatie 95
FI-61850 Kauhajoki, Finland
Ankkuritie 2, Kuopio
PL 147, 70101 Kuopio
Pusurinkatu 48
30100 Forssa
Suluntie 1
40340 Jyväskylä
Isoniementie 79
36420 Sahalahti
ATRIA SWEDEN
Head office:
Löfströms allé 5
SE-172 66 Sundbyberg
Sweden
Tel. +46 10 482 3910
www.atria.se
Office: Deli & Export
Nellickevägen 20 B
SE-412 63 Göteborg
Sweden
Tel. +46 10 482 36 00
Office: Foodservice
Florettgatan 18
SE-254 67 Helsingborg
Sweden
Tel. +46 10 482 35 10
Offices/plants:
Sockenvägen 40
SE-697 80 Sköllersta
Sweden
Tel. +46 10 482 30 00
Skogholmsgatan 12
SE-213 76 Malmö
Sweden
Tel. +46 10 482 35 00
Furumovägen 110
SE-294 76 Sölvesborg
Sweden
Tel: +46 01 482 30 00
Hjälmarydsvägen 2
SE-573 38 Tranås
Sweden
Tel. +46 10 482 37 00
Maskingatan 1
SE-511 62 Skene
Sweden
Tel. +46 10 482 38 00
Johannelundsgatan 44
SE-506 40 Borås
Sweden
Tel. +46 10 482 38 10
Östanåkravägen 2
SE-342 62 Moheda
Sweden
Tel. +46 10 482 37 10
Fordonsgatan 3
SE-692 71 Kumla
Sweden
Tel. +46 19 57 18 78
Atria Concept
Spółka z o.o
Ul.Czestochowska 24
32-085, Modlnica
Poland
Tel. +48 12 661 20 33
ATRIA DENMARK
Langmarksvej 1
DK-8700 Horsens
Denmark
Tel. +45 76 28 25 00
Aage Jensen Bakken 1
DK-8700 Horsens
Denmark
Tel. +45 76 28 25 00
Anlaegsvej 3,
DK-7323 Give
Denmark
Tel. +45 76 28 25 00
www.atria.dk
ATRIA ESTONIA
Atria Eesti AS
Metsa str. 19
EE-68206 Valga, Estonia
Tel. +372 767 9900
www.atria.ee
Other locations:
Pärnu mnt 158
EE-11317 Tallinn, Estonia
ATRIA RUSSIA
OOO Pit -Product
pr. Obukhovskoy
Oborony 70
RUS-192029,
Saint-Petersburg
Russia
Tel +7 812 336 6888
Tel. +7 812 412 8822
www.atriarussia.ru
CONTACT INFORMATION
140

Front page
Atria in brief
Atria’s key indicators
CEO’s review
Strategy 2021–2025
Strategy 2016–2020
Operating environment
Business area reviews
Atria Finland
Atria Sweden
Atria Denmark & Estonia
Atria Russia
Research and Development
Financial Statements and Corporate Governance
Financial Statements and Corporate Governance
Auditor’s report
Corporate Governance Statement
Investor reporting
Contact information