Strategies to Reduce Emergency Department Overcrowding ... · Version 1 Medical Research ......
102
STRATEGIES TO REDUCE EMERGENCY DEPARTMENT OVERCROWDING
Transcript of Strategies to Reduce Emergency Department Overcrowding ... · Version 1 Medical Research ......

STRATEGIES TO REDUCE
EMERGENCY DEPARTMENT OVERCROWDING
id4664236 pdfMachine by Broadgun Software - a great PDF writer! - a great PDF creator! - http://www.pdfmachine.com http://www.broadgun.com

Other Titles in this Series HTA Report #1 Interface pressure measurement systems
for management of pressure sores HTA Report #2 Posteroventral pallidotomy in Parkinson�s
Disease HTA Report #3 In vitro fertilization and embryo transfer For more information contact:
as a treatment of infertility Health Technology Assessment HTA Report #4 Assessment of telehealth applications. Alberta Heritage Foundation for
Version 1 Medical Research HTA Report #5 Computerized gait analysis in the rehabilitation Suite 1500
of children with cerebral palsy and spina bifida 10104 � 103 Avenue Edmonton, Alberta HTA Report #6: Evaluation of a telepsychiatry pilot project Canada T5J 4A7 HTA Report #7 Dynamic posturography in the rehabilitation
of stroke, brain injured and amputee patients Tel: 780 423-5727 Fax: 780 429-3509 HTA Report #8 Hyperbaric oxygen treatment in Alberta HTA Report #9 Stereotactic radiosurgery: options for Albertans HTA Report #10 Functional diagnostic imaging in epilepsy HTA Report #11 Quantitative ultrasound for bone density
measurement HTA Report #12 Diagnostic tests for vaginosis/vaginitis HTA Report #13 Cord blood transplantation HTA Report #14 Intraocular lenses for uncomplicated
senile cataract HTA Report #15 Treatment options for acoustic neuroma HTA Report #16 Functional diagnostic imaging technologies
in the assessment of myocardial viability HTA Report #17 Brachytherapy for prostate cancer HTA Report #18 Allogeneic stem cell transplantation HTA Report #19 Low level laser therapy for wound healing
Continued on back inside cover

HTA Report #38 February 2006
Strategies to Reduce
Emergency Department Overcrowding
Bing Guo, Christa Harstall

HTA Report #38 February 2006
HTA Report #38 Strategies to Reduce Emergency Department Overcrowding
Prepared by: Bing Guo, Christa Harstall © Copyright Alberta Heritage Foundation for Medical Research, 2006 ISBN 1-894927-34-6 (Print) ISBN 1-894827-35-4 (On-line) ISSN: 1704-1090 (Print) ISSN: 1704-1104 (On-line) Additional information and comments relative to HTA Reports are welcome and should be sent to: Director, Health Technology Assessment Alberta Heritage Foundation for Medical Research 1500, 10104 � 103 Avenue NW Edmonton, Alberta, Canada T5J 4A7 Tel: 780-423-5727 Fax: 780-429-3509 www.ahfmr.ab.ca Alberta�s health technology assessment program has been established under the Health Research Collaboration Agreement between the Alberta Heritage Foundation for Medical Research and Alberta Health and Wellness.
AHFMR is a member of the International Network of Agencies for Health Technology Assessment (INAHTA)

HTA Report #38 February 2006
i
EXECUTIVE SUMMARY
Background
Emergency department (ED) overcrowding is a serious national and international public health issue. Substantial efforts have been made in the past years by ED physicians and nurses, hospital administrators, managers, and government decision makers to address this issue; however, little is known about the effectiveness of these strategies in reducing ED overcrowding.
Objectives
This report aims to identify strategies that have been evaluated and reported in the literature and to assess their effectiveness in reducing ED overcrowding.
Methodology
This is a systematic review of research evidence on the effectiveness of strategies to reduce ED overcrowding. One researcher reviewed and abstracted data from all included studies. Two researchers independently assessed the methodological quality of the studies with a before-and-after design. Strategies identified from each study were presented in a framework that combined the input-throughput-output model developed in the United States and the four domain (community, patient, emergency department, and hospital) model proposed by a panel of Canadian experts.
Results
Two systematic reviews and 23 primary studies met the inclusion criteria. The two systematic reviews suggested that interventions, such as the presence of a social worker at the ED, cost sharing/co-payment, or primary gate-keeping, might be effective in reducing unnecessary ED attendance; however, concerns remained about the safety of these interventions because the decrease in ED attendance was not restricted to non-urgent patients. Both reviews found that patient education was not effective in terms of reducing ED attendance.
In the 23 primary studies included in this report, the majority of the strategies addressed the contributing factors within the ED, with very little research focusing on strategies in the domain of community. Interventions were targeted at ED throughput components, such as ED staffing/reorganization (additional staff and space, improvement in ED flow process), ED acute care unit, fast track, and access to diagnostic services (advanced triage, implementation of point-of-care testing).
On the basis of evidence from three studies with better design (RCT or non-randomized comparative studies) and nine before-and-after studies with acceptable methodological quality selected from the 23 studies, some strategies looked promising in terms of decreasing ED demand, improving ED throughputs, decreasing access block, and

HTA Report #38 February 2006
ii
establishing system-wide change. The strategy for decreasing ED demand included pre-emptive ambulance distribution based on real-time information on access-block ED occupancy. Strategies aimed at improving ED throughput included extensive structural and staff reorganization of the ED, change in provider staffing based on a queueing analysis, implementation of a multidisciplinary care coordination team, addition of a faculty member to ED triage, provision of an on-site emergency physician on the night shift, addition of an acute care unit staffed by ED personnel, implementation of point-of-care tests in the ED, and triage nurse�s initiation of appropriate diagnostic tests. Strategies aimed at decreasing access block included increased ICU beds. Strategies aimed at system-wide change to decrease ED overcrowding included increased emergency physician coverage, designation of physician coordinators, and introduction of new hospital policy and sharing of process differences among hospitals in a large multi-hospital system.
The results from all the studies looked promising when taken individually. However, lack of standard definitions for outcome measures, such as ED length of stay or waiting times, makes it difficult to compare the results across studies. Furthermore, the issue of ED overcrowding is a complex and challenging area in which to conduct research. The overall poor methodological quality of the studies prevented any definitive conclusions about the effectiveness of the various strategies examined in these studies.
Conclusion and recommendations
This report serves as a benchmark of the currently published research and identifies areas for improvement. Standardization of the definitions for ED overcrowding and other relevant terms is essential. Research needs to be conducted on input and output components that are seen to be contributory rather than just on throughput. Identifying the determinants of ED overcrowding needs to involve leaders at all levels within the system from the ED to the community. Strategies to address the determinants need to be evaluated using clinically meaningful measures. Development of valid, reliable, and sensitive outcome measures is important. Adoption of standardized measures by all of the provincial regional health authorities would allow for some comparison of different strategies and the adoption of those that are most effective and efficient province-wide.
HTA #38 February 2006
iii
ACKNOWLEDGEMENTS
The Alberta Heritage Foundation for Medical Research is most grateful to the following persons for review and provision of information and comments on the draft report. The views expressed in the final report are those of the Foundation:
Dr Robert W. Derlet, Emergency Department, University of California - Davis Medical Centre, Sacramento, USA
Dr Eddy Lang, Emergency Department, SMBD � Jewish General Hospital, Montreal, Canada
Dr Brian Rowe, Emergency Department, University of Alberta Hospital, Edmonton, Canada
Dr Michael J. Schull, Institute for Clinical Evaluative Sciences, Toronto, Canada
The authors also wish to thank the following individuals for providing information regarding published or unpublished studies:
Mrs Wendy Cheung, Emergency Department, Centenary Health Centre, Toronto, Canada
Dr Matthew Cooke, Emergency Medicine Research Group, Centre for Primary Health Care Studies, University of Warwick, Coventry, UK
Mrs Carolyn L Flower, Emergency Department, Royal Melbourne Hospital, Parkville, Australia
Dr Ò Miró, Emergency Department, Hospital Clinic, Barcelona, Spain
Mrs Janice L Pound, Primary Care Program, Rouge Valley Health System, Toronto, Canada
Mr Doug Vincent, Capital Health, Edmonton, Canada
Professor Michael Ward, School of Medicine, University of Queensland, Royal Brisbane and Women�s Hospital, Brisbane, Australia
Information Service Support
Mrs Seana Collins, Information Specialist, University of Alberta Library, Edmonton, Canada
Mrs Liz Dennett, Information Specialist, Alberta Heritage Foundation for Medical Research, Edmonton, Canada

HTA Report #38 February 2006
iv
COMPETING INTEREST Only the external reviewers who were paid honoraria were asked to sign a declaration of competing interest. All others who provided general information were exempt.
Competing interest is considered to be financial interest or non-financial interest, either direct or indirect, that would affect the research contained in this report or create a situation where a person�s judgement could be unduly influenced by a secondary interest such as personal advancement.
Based on the statement above, no competing interest exists with the author(s) and/or external reviewer(s) of this report.

HTA Report #38 February 2006
v
ABBREVIATIONS
ACU � acute care unit
AD � ambulance diversion
ALC � alternative levels of care
CAEP � Canadian Association of Emergency Physicians
CQI � continuous quality improvement
CTAS � Canadian Triage and Acuity Scale
ED � emergency department
ED LOS � emergency department length of stay
EMS � emergency medicine service
EP � emergency physician
FT � fast track
GP � general practitioner
HITH - Hospital in the Home
HTA � health technology assessment
ICU � intensive care unit
KPIs � key performance indicators
LOS � length of stay
LWBS � left without being seen
NENA � National Emergency Nurses Affiliation
NHS � National Health Service
nss � not statistically significant
NZHTA � New Zealand Health Technology Assessment
PEG � percutaneous endoscopic gastrostomy
POCT � point-of-care testing
RAP � rapid assessment program
RCT � randomized controlled trial
RMH � Royal Melbourne Hospital
RN � registered nurse

HTA Report #38 February 2006
vi
SR � systematic review
ssnr � statistical significance not reported
TAT � turnaround time
UA � unit assistant
UC � urgent care
WT � waiting time

HTA Report #38 February 2006
vii
GLOSSARY
Access block � refers to the situation where patients in the ED requiring inpatient care are unable to gain access to appropriate hospital beds within a reasonable time frame1
After-load factors � factors leading to overcrowding in EDs because of delays in discharging patients from the EDs to appropriate sites of care2
Boarding � the decision to admit or transfer an emergency patient has been made, and the patient waits for a prolonged period to leave the ED3
Deputizing services � services where family physicians and general practitioners contract with an agency to provide coverage for out-of-hours patients� care4
Emergency department � refers to comprehensive EDs open 24 hours a day, seven days a week, and provide acute care to patients arriving either by ambulance or by other means5
Emergency department length of stay � the total time spent by a patient in an ED from the time of registration or triage (whichever occurs first) to the time of discharge from the ED5
Fast track system � referring patients with non-urgent problems to immediate or prompt care at sites that are within or adjacent to the ED and have higher patient-to-staff ratios6
Left without being seen � patient who is registered or triaged or both, but who left prior to being seen by healthcare providers5
Preload factors � factors leading to increased numbers of ED visits2
Patient disposition � discharged, admitted, left against medical advice, left without being seen by a physician, or died in the ED7
Test turnaround time � the time from when the sample was received in the laboratory until the results are posted on the hospital computer for the clinicians to view or are received by the physician8
Time to physician initial assessment � from the time the patient is first registered or triaged in the ED until the initial assessment by an emergency physician, as recorded by the physician5
Triage � the sorting or prioritizing of patients.9 Triage at the ED refers to the process that involves a nurse or other practitioner assessing a patient upon arrival in the ED and assigning a level of priority for care to that patient based on their level of acuity. The patient then awaits a stretcher, often additional nurse assessment, and, finally, physician assessment before diagnostic testing occurs.10

HTA Report #38 February 2006
viii
CONTENTS
Executive Summary...................................................................................................................... i
Acknowledgements .................................................................................................................... iii
Abbreviations ............................................................................................................................... v
Glossary.......................................................................................................................................vii
Introduction .................................................................................................................................. 1
Definition................................................................................................................................. 2
Magnitude of the problem.................................................................................................... 2
Contributing factors............................................................................................................... 3
Consequences ......................................................................................................................... 5
Objective and Scope..................................................................................................................... 7
The Conceptual Framework and Key Determinants .............................................................. 8
Effectiveness of Strategies Addressing ED Overcrowding.................................................. 11
Evidence from systematic reviews .................................................................................... 11
Evidence from primary studies.......................................................................................... 15
Selected Local/International Initiatives ................................................................................. 28
Guidelines/Position Statement................................................................................................ 31
Discussion ................................................................................................................................... 32
Overall findings.................................................................................................................... 32
Safety issues .......................................................................................................................... 35
Issues related to the definition ........................................................................................... 35
Consideration for future research...................................................................................... 36
Conclusion .................................................................................................................................. 38
Appendix A: Methodology....................................................................................................... 40
Appendix B: Excluded Studies................................................................................................. 49
Appendix C: Effectiveness of Strategies to Reduce ED Overcrowding............................. 51
Appendix D: Interventions in an Australian Study............................................................. 74
Appendix E: Guidelines/Position Statement ........................................................................ 76
References ................................................................................................................................... 79

HTA Report #38 February 2006
ix
Tables and Figures
Figure 1: Conceptual model of ED overcrowding .................................................................. 8
Table 1: Canadian triage and acuity scale (CTAS) .................................................................. 1
Table 2: Key determinants for ED overcrowding.................................................................... 9
Table 3: Summary of findings from the systematic reviews................................................ 12
Table 4: Summary of strategies identified from the primary studies................................. 17
Table 5: Classification of strategies.......................................................................................... 20
Table 6: Quality assessment of primary studies .................................................................... 22
Table A.1: Summary of search strategy .................................................................................. 40
Table B.1: Excluded studies ...................................................................................................... 49
Table C.1: Evidence from primary studies ............................................................................. 53

HTA Report #38 February 2006
1
INTRODUCTION
This report was prepared in response to a request from the Capital Health Region, Edmonton, Canada for information on effective strategies to deal with emergency department (ED) overcrowding. The question of interest is whether there is any scientific evidence that evaluates the effectiveness of various strategies that were developed to address problems related to ED overcrowding.
EDs are a vital component in our healthcare system that provide emergency care for the public 24 hours a day, 365 days per year, regardless of a person�s social or economic status and without requiring an appointment.11,12 In Canada, approximately 14 million visits to the ED occur each year,5 and in the United States this figure is close to 100 million.13 EDs are complex, process�rich systems in which multiple healthcare providers treat a wide variety of patients with complicated medical conditions and social problems.14 The unpredictable nature of acute illnesses and injuries makes access to timely emergency medical care an essential part of modern healthcare systems. The Canadian Triage and Acuity Scale, presented in Table 1, outlines the expected elapsed amount of time until initial assessment by a physician, as related to patient acuity levels.
Table 1: Canadian triage and acuity scale (CTAS)
Level Acuity Conditions Time to physician initial assessment
Level I Resuscitation Threats to life or limb requiring immediate aggressive interventions
Immediate
Level II Emergent Potential threat to life, limb, or function, requiring rapid medical intervention or delegated acts
≤ 15 minutes
Level III Urgent Could potentially progress to a serious problem requiring emergency intervention
≤ 30 minutes
Level IV Less urgent
(semi-urgent)
Related to patient age, distress, or potential for deterioration, or complications would benefit from intervention or reassurance within 1-2 hours.
≤ 1 hour
Level V Non-urgent May be acute but non-urgent, or may be part of a chronic problem with or without evidence of deterioration. The investigation or interventions for some of these illnesses or injuries could be delayed or even referred to other areas of the hospital or healthcare system.
≤ 2 hours
Source: Beveridge et al. 19989

HTA Report #38 February 2006
2
Definition According to the Canadian Association of Emergency Physicians (CAEP), ED overcrowding is a situation in which the demand for emergency services exceeds the ability of a department to provide quality care within acceptable time frames.15 ED volumes are not the primary determinant of overcrowding. The American College of Emergency Physicians (ACEP) defines ED overcrowding as a situation in which the identified need for emergency services outstrips available resources in the ED. This situation occurs in hospital EDs when there are more patients than staffed ED treatment beds and waiting times exceed a reasonable period.16 Both definitions in their entirety are similar.
Practically, however, there is no single, universally acceptable gold-standard definition for ED overcrowding.11,17
Magnitude of the problem In Canada, ED overcrowding is considered a chronic, systemic, and serious public health issue across the country and it has been identified as a serious impediment to clinical practice. ED overcrowding was first reported in the early 1980s and has continually worsened, leading to heavy reliance by urban hospitals on ambulance diversion as a technique for funnelling patients away from their sites, even for short periods of time.15,18,19 Today, ED overcrowding can be considered an epidemic in EDs nationwide.19 Despite the importance of ED overcrowding, no national research has been published to date to describe the actual magnitude of ED overcrowding across Canada.
In the United States, ED overcrowding became a national issue in the early 1990s and has resurfaced and become worse since 2000.20 A US national survey of hospitals in urban areas found that most EDs across the country experienced some degree of crowding.3 One study found that more than one third of EDs experience overcrowding on a daily basis.21 Despite the obvious differences between the American and Canadian healthcare systems, the EDs in both countries are the first point of entry for acutely injured and ill patients, and ED overcrowding is the most pressing concern confronting EDs in both countries.22 ED overcrowding was also identified as a significant national problem in other countries, such as Australia.23
The recent Motta inquiry in Alberta24 examined the consequences of a young adult with abdominal pain who left without being seen (LWBS) from two urban EDs in Calgary, Alberta, in 2001. When he subsequently underwent surgery for appendicitis in a peripheral centre, he suffered an anesthetic complication that was fatal. The inquiry identified ED overcrowding and LWBS as key issues that need to be resolved in order to prevent similar events in the future.

HTA Report #38 February 2006
3
Contributing factors In the literature, a number of factors have been suggested to be potential causes of ED overcrowding. According to the CAEP 25 factors contributing to ED overcrowding include the following:
Lack of inpatient beds for admitted ED patients
In Canada, hospital beds were reduced by almost 40% from 1995 to 2000.25 In the United States, a large number of hospitals, inpatient beds, and EDs were closed during the past 10 years; the number of hospitals with EDs dropped from approximately 6000 in 1992 to less than 4000 in 2002.26
Unavailability of operating rooms and delayed access to surgical services increased both inpatient and outpatient waiting times, leading to inefficient use of hospital beds and repeated ED visits by patients waiting for treatment.25
Lack of access to primary care, specialist physicians, and nurse practitioners
In Canada, where universal medical insurance exists, many people do not have access to a family physician, nurse practitioners, and specialists.19,25,27 Many primary care physicians do not provide after-hours access for their patients.25 Patients seek ED care when alternative services are not available and when access to primary care is delayed.25 In some rural communities the ED functions as a walk-in clinic for primary care (Dr E Lang, personal communication, November 2005).
Shortage of nursing and physician staff
In Canada, there is a shortage of trained emergency physicians and experienced and dedicated nursing staff.25 Currently, many Canadian hospitals cannot attract enough nurses to staff their EDs; this is partly because of a shortage of qualified nurses and partly because ED overcrowding has made the ED a frustrating work environment.25
Increased complexity and acuity of patients
As the population ages, a growing number of patients with chronic conditions, such as AIDS, mental illness, emphysema, diabetes, and cardiovascular disease, require emergency services.19,25 In addition, with the development and diffusion of new revolutionary medical technologies patients with chronic diseases survive longer. These patients with increased complications or with several comorbid conditions often require lengthy and complex assessments that utilize advanced diagnostic technologies to determine their need for hospital admissions or further treatments.19,25,28 Furthermore, there is an increase in the frequency of patients receiving organ transplants, cancer chemotherapy, and immuno-suppressive agents. These types of patients have increased the demands for specialized services provided only in urban-based EDs.

HTA Report #38 February 2006
4
Recently discharged patients also contribute to the increased complexity and acuity of patients who are entering EDs. Many inpatients, following surgical procedures or various illnesses, are typically released after a predetermined length of stay (LOS); these patients return to EDs for follow up and tie up resources that become unavailable for other patients.19
ED use by non-urgent patients
The rates of non-urgent ED use that were reported in the literature varied considerably, ranging from 7% to 94%.29 Differences in defining appropriate ED use may partly be attributed to this variation.29 According to a recent report by the Canadian Institute for Health Information,5 more than half (57%) of ED visits in 2003 to 2004 were for less urgent or non-urgent conditions based on the CTAS (see Table 1). A Canadian study showed that non-urgent use of EDs continues to exist in Canada, with 3% to 15% of total visits classified as non-urgent visits in large centres and 30% to 77% of total visits classified as non-urgent visits in smaller centres.2 However, another Canadian study found that ED misuse accounts for a small proportion of ED visits and thus is not an important source of ED overcrowding.29
A systematic review on ED attendance conducted by the New Zealand Health Technology Assessment Agency (NZHTA) found that over 80% of all patients who visited the ED were there for non-urgent problems.4 Reasons for ED use by non-urgent patients were either financial or related to access to care,30 which may include: (1) proximity to the ED, (2) social deprivation, (3) the inability to gain access to general practitioner services, (4) a poor knowledge of general practitioner services, (5) the convenience of 24-hour service of the ED, (6) the perceived urgency of the complaint, and (7) the perceived need for assessment in a hospital setting.4
According to the CAEP, non-urgent patients utilize a small proportion of ED resources and contribute little to ED overcrowding.25
Lack of alternative advanced diagnostic testing and facilities
In many communities, there are long waiting lists for diagnostic tests such as computer tomography scans and magnetic resonance imaging.25 As a consequence, patients seek ED care as a �safety net� to have their diagnostic tests performed more quickly.19 These delays in investigation and treatment can cause more ED visits for care.
Because of the lack of home care, community care, and long-term care, patients who require chronic care, chronic complex care, transition care, respite care, and palliative care have to remain in acute care facilities where they occupy a bed that could be used by patients waiting to be admitted from the ED.19
In summary, ED overcrowding is a complex and multifaceted issue. Whereas many internal or external factors, or both, are considered to contribute to ED overcrowding, the inability to transfer admitted ED patients to inpatient beds may be the factor that is

HTA Report #38 February 2006
5
most commonly associated with ED overcrowding.31 There seems to be some controversy, however, about whether ED visits by non-urgent patients substantially contribute to ED overcrowding.
Consequences Many internal and external factors contribute to ED overcrowding, as previously described. Regardless of the causes, ED overcrowding could be associated with the following consequences:
Decreased quality of ED care
As physicians and nurses feel rushed and overextended, the risk of medical error will be increased, and these errors could result in adverse effects on patients.25
Prolonged waiting times and patient/family member dissatisfaction
Prolonged waiting for care causes patients to become frustrated and dissatisfied and results in an increased number of patients who leave without being seen by an appropriate healthcare provider. This consequence may place these patients at risk for a serious adverse outcome.
Over the past 10 years, the number of reported LWBS cases has markedly increased. The Canadian Institute for Health Information reported that, on the basis of data from Ontario, Nova Scotia, British Columbia, and Prince Edward Island, on average 3% of patients left EDs without being seen in the year 2003/2004.5 Two Canadian studies reported rates of LWBS from 1.4% to 2.4%32,33 and several US studies noted rates ranging from 1% to 15%.34-36
A recent Edmonton study identified trends and reasons for LWBS in adult patients and parents of ill children who visited EDs.37 Most of these patients left, as a result of frustration; however, more than 60% of these patients required physician contact within seven days, and several experienced adverse outcomes (death, hospital admission, and surgery).
Delays in treatment
Pain relief and improvement in physical, mental, and emotional well-being are delayed beyond acceptable time limits.25 For time-sensitive care, such as treatments for acute myocardial infarction, delayed treatment can have unacceptable consequences.38
Ambulance diversions
Ambulance redirect has become an increasingly common problem in most urban centres in Canada25 and gradually has become a standard operating procedure in many cities in the United States.39

HTA Report #38 February 2006
6
Decreased nurse and physician satisfaction and burnout
Emergency physicians and nurses feel increasingly responsible for providing care that should be provided in the hospital or outpatient setting but not in the ED. For example, septic patients in need of an intensive care unit (ICU) setting are treated in the ED (Dr E Lang, personal communication, November 2005). ED physicians have experienced significant stress and burnout.27 This consequence aggravates overcrowding and has a negative effect on ED staff productivity and morale.25

HTA Report #38 February 2006
7
OBJECTIVE AND SCOPE
Substantial efforts have been made in an attempt to reduce ED overcrowding in the past years. By the early 1990s, numerous strategies were proposed to address the issue of ED overcrowding.19 However, little is known about the effectiveness of these strategies in reducing ED overcrowding.
The objective of this report is to identify strategies that have been reported in the published and unpublished literature and assess their efficacy/effectiveness in reducing ED overcrowding. Very few randomized controlled trials (RCTs) have been conducted in this area. In order to capture all efforts in reducing ED overcrowding, studies with a broad range of designs were eligible for inclusion.
Studies that focused on the current status of ED overcrowding (such as surveys) or research to determine the causes of ED overcrowding were included only as background information to set the context. Research that focused on the management of ambulance diversion was beyond the scope of this report.

HTA Report #38 February 2006
8
THE CONCEPTUAL FRAMEWORK AND KEY DETERMINANTS
ED overcrowding is a multi-factorial phenomenon that reflects complex, systemic problems within the healthcare system.25 A better understanding of the key legislative, social, and healthcare economic factors that have led to ED overcrowding is needed before considering potential solutions.11 In order to help researchers, administrators, and policy makers understand its cause and potential solutions, Asplin and colleagues40 developed a conceptual model of ED overcrowding (Figure 1).
Figure 1: Conceptual model of ED overcrowding
Input Throughput Output
Source: Asplin et al. 2003,40 with permission from the publisher for reprint
This model partitioned ED overcrowding into three interdependent components, including input, throughput, and output:
The input component includes any condition, event, or system characteristic that contributes to the demand for ED services. Care delivered in the ED can be categorized as follows: (1) emergency care, (2) unscheduled urgent care, and (3) safety net care. These three categories, depending on their mix, have considerable impact on the input side of the model.
The throughput component identifies the amount of time a patient spends in the ED. This part of the model highlights the importance of ED care processes and
ACUTE CARE SYSTEM
Emergency care
Seriously ill and injured patients from the community
Referral of patients with emergency conditions
Unscheduled urgent care Lack of capacity for
unscheduled care in the ambulatory care system
Desire for immediate care (eg. convenience, conflicts with job, family duties)
Safety net care Vulnerable populations
(eg. Medicaid beneficiaries, the uninsured)
Access barriers (eg. financial, transportation, insurance, lack of usual source of care)
Ambulance diversion
Demand for ED care
Patient arrives at ED
Triage and room placement
Diagnostic evaluation and ED treatment
ED boarding of inpatients
Leaves without treatment complete
Patient disposition
Lack of access to follow-up care
Ambulatory care system
Transfer to other facility (eg. skilled
nursing, referral
hospital)
Admit to hospital
Lack of available staffed inpatient beds

HTA Report #38 February 2006
9
the need to modify them to improve their efficiency and effectiveness. There are two primary throughput phases in the model. The first phase includes triage, room placement, and the initial provider evaluation. The second phase includes diagnostic testing and ED treatment, which typically constitutes the majority of a patient�s total ED throughput time in an efficient ED.
The output component reflects the disposition of ED patients. The main two options are admission to a hospital bed or discharge. The inability to move patients from the ED to an inpatient bed is considered one of the major contributing factors to ED overcrowding. As a consequence, these admitted inpatients are boarded in the ED. The number of patients boarded in the ED is considered one of the most important determinants of ambulance diversion.
A Canadian expert panel, consisting of 10 frontline key informants from four hospitals and an ambulance service in Ontario, developed a standard definition for ED overcrowding and proposed a list of key determinants for ED overcrowding.41 Of 46 factors postulated in the literature, 25 were chosen by the panel to be potentially important determinants for ED overcrowding. These factors were divided into four domains: (1) community factors, (2) patient factors, (3) ED factors, and (4) hospital factors (Table 2).
Table 2: Key determinants for ED overcrowding
Domain Important factors
Local home care service availability
Alternate level of care bed availability
Community
Nearby EDs diverting ambulances
Age
Urgency (Triage code)
Discharge diagnosis
Disposition
Patient
Time and day of arrival in the ED
Number of admitted patients held in the ED
Intermittent surges in number of newly arriving ambulance and ambulatory patients
Physician staffing (physician-hour/day)
Physician characteristics
Nurse staffing (nurse-hours/day)
Nurse profile (dedicated ED nurses or fill-in/agency)
Availability of social workers and geriatric teams
Consult response times
Emergency Department
Consult policies

HTA Report #38 February 2006
10
Table 2: Key determinants for ED overcrowding (cont�d)
Domain Important factors
Design (number of stretchers and monitors, size of department) Emergency Department (cont�d) Access to radiological tests off-hours
Hospital Number of critical and acute hospital beds (especially medical)
Overall bed occupancy rate
Length of stay
Occupancy rate of acute beds by alternate level of care patients
Source: Schull et al. 200241
The model by Asplin and colleagues40 looked at the causes of ED overcrowding from the ED perspective, that is, the process whereby a patient goes through the ED. This model is widely accepted and used in the emergency medicine field (Dr B Rowe, personal communication, July 2004). The four domains proposed by Schull and colleagues41 were based on opinions by Canadian experts and appear to look at the problems with ED overcrowding from a regional health perspective. In order to put the strategies identified in the literature into context, we used a combination of components from both frameworks to categorize the strategies addressing ED overcrowding. Furthermore, this framework may be useful for Regional Health Authorities to assess and identify the main pressure areas that are contributing to ED overcrowding.

HTA Report #38 February 2006
11
EFFECTIVENESS OF STRATEGIES ADDRESSING ED OVERCROWDING
Fifty-eight studies were identified that potentially met the initial inclusion criteria set out for this review. On closer examination of the full text articles, two systematic reviews,4,42 22 primary studies7,8,10,35,43-60 and one other study that was published in three separate articles61-63 met our final set of inclusion criteria (see Appendix A: Methodology). Thirty-five studies were excluded and the reasons for exclusion are summarized in Appendix B.
Evidence from systematic reviews The findings from two systematic reviews, one by Cooke and colleagues42 and the other by the NZHTA agency,4 are summarized in Table 3.
The recently published systematic review by Cooke and colleagues42 looked at what initiatives/interventions inside and outside of the EDs have been demonstrated to reduce waiting times and ED attendances. This systematic review used a broad search strategy to identify all relevant studies. Outcome measures included waiting times and attendance at EDs. One hundred and nine studies were found that met their inclusion criteria.
As the authors pointed out, there is surprisingly little evidence on the effectiveness of changes in service delivery and organization factors in emergency care on patients� ED LOS. Comparison across studies was difficult because of the lack of uniform definitions for overcrowding, delays, and waits. A variety of outcome timing measurements were utilized, including the interval from arrival to triage, from triage to seeing the doctor or nurse practitioner, from arrival to seeing the doctor or nurse practitioner, from the decision to admit to departure from the ED, and from arrival to departure time from the ED, as well as ambulance diversion.
Overall, a few interventions, such as the use of point-of-care testing (POCT), a fast-track system for minor illness and injury, and admission avoidance schemes were supported by evidence from RCTs. Other potentially useful interventions, such as the wide variety of interventions to reduce ED attendances by older people, frequent attenders, and those with chronic disease, as well as the use of observation wards and clinical decision units, were supported by weaker evidence, but require more studies designed with increased power. For some interventions, such as triage out, early evidence raises concerns about their safety and indicates urgent need for further evaluation. There appeared to be no evidence to support the effects of some strategies, such as general practitioners working in the ED, walk-in centres, patient education, or bed management in reducing waiting time or ED attendance.

HTA Report #38 February 2006
12
Table 3: Summary of findings from the systematic reviews
Strategies Findings
Systematic review by Cooke et al. 200442
Out-of-hospital care
Divert 999 calls to nurse advice It is possible to divert 999 calls to advice lines but the safety of such systems is still being evaluated.
Not taking patients to ED The role of paramedics in either discharging patients from the scene or deciding on appropriate destinations has not been adequately studied to confirm its safety and effectiveness in the UK.
Primary care
GPs working in the ED There is no evidence around the effects on waiting times of GPs working in EDs.
Interventions in primary care Primary gate keeping can reduce ED attendance, but its safety is unknown.
Walk-in centres, and NHS Direct and nurse telephone advice
Did not demonstrate a reduction in the attendances at EDs.
Emergency department
Triage out Triage out of the ED can reduce numbers but more work is required to assess the safety of such systems.
Co-payment and financial systems
Reduce attendance but may equally reduce attendances by those requiring emergency care.
Fast track Fast track for minor illness and injuries can reduce waits. Ideal configurations include senior staff.
Social care Attendance by the elderly, those with chronic disease and those with multiple attendances may be reduced.
Patient education The benefit is unproven in most areas except chronic disease management.
Diagnostics
Laboratory tests Point of care testing/satellite laboratories produces quicker test results.
Nurse ordering of x-rays May speed up processes where fast track is not operationalized.
ED performing imaging ED staff undertaking ultrasounds may reduce delays for those individuals who require it.

HTA Report #38 February 2006
13
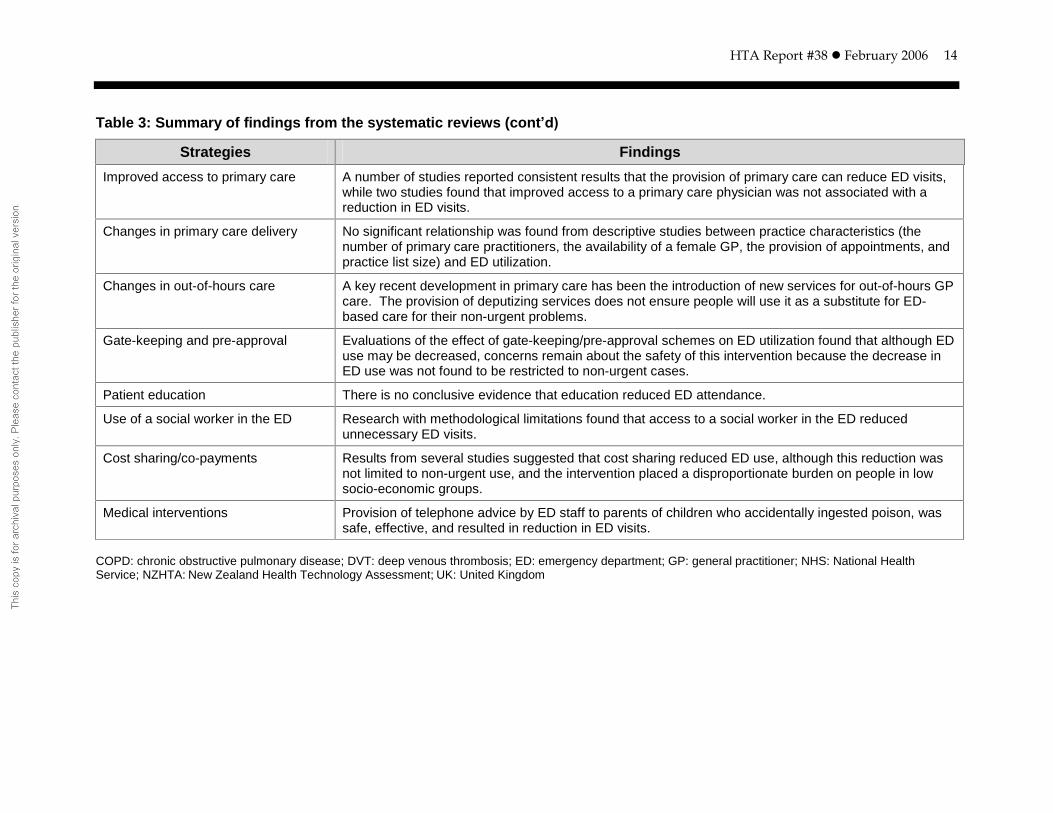
Table 3: Summary of findings from the systematic reviews (cont�d)
Strategies Findings
Admission avoidance
Specialist nurse care Specialist nurse care in heart failure, COPD, and DVT can reduce hospital admissions.
Home support Home support (medical and social) can reduce hospital admissions.
Observation wards Observation wards may reduce length of stay and avoid admission.
Bed management There is a lack of evidence on innovations in bed management. Allowing ED staff to admit to wards will reduce delays.
Delayed discharge There is a lack of evidence on innovations to reduce delayed discharges from hospital.
Staffing
Senior staff Use of senior staff may reduce admissions and delays.
Nurse practitioners Nurse practitioners are safe and effective, but their effect on waiting time is unknown.
Other healthcare professionals The role of other healthcare professionals in emergency care needs evaluation.
Systematic review by the NZHTA 19984
The structure of emergency services A report completed by the Audit Commission in England and Wales suggested that those EDs with fewer than 50,000 annual visits should consider centralization of services, the number of provincial hospital-based clinics should be limited, and minor clinics with expanded roles for nurses and GPs should be created. However, no evidence supported these recommendations.
The provision of a minor injury unit Evidence from opinion articles suggested that the timely provision of care for patients with minor injuries prevented their subsequent deterioration and the need for later hospital admission. Evidence from case series suggested that the minor injury units were acceptable to patients.
Triage Conflicting results were obtained from studies that assessed the effectiveness of triage among people who phoned the ED seeking advice for minor problems and those who presented at the ED. Some studies concluded that triage successfully reduced ED attendance when it was applied both to telephone callers and to those people who attended the ED. Several other studies examined the use of criteria for refusing care to patients who presented to an ED with non-urgent problems. Generally these studies concluded that care could not safely be refused at the ED.
HTA Report #38 February 2006
14
Table 3: Summary of findings from the systematic reviews (cont�d)
Strategies Findings
Improved access to primary care A number of studies reported consistent results that the provision of primary care can reduce ED visits, while two studies found that improved access to a primary care physician was not associated with a reduction in ED visits.
Changes in primary care delivery No significant relationship was found from descriptive studies between practice characteristics (the number of primary care practitioners, the availability of a female GP, the provision of appointments, and practice list size) and ED utilization.
Changes in out-of-hours care A key recent development in primary care has been the introduction of new services for out-of-hours GP care. The provision of deputizing services does not ensure people will use it as a substitute for ED-based care for their non-urgent problems.
Gate-keeping and pre-approval Evaluations of the effect of gate-keeping/pre-approval schemes on ED utilization found that although ED use may be decreased, concerns remain about the safety of this intervention because the decrease in ED use was not found to be restricted to non-urgent cases.
Patient education There is no conclusive evidence that education reduced ED attendance.
Use of a social worker in the ED Research with methodological limitations found that access to a social worker in the ED reduced unnecessary ED visits.
Cost sharing/co-payments Results from several studies suggested that cost sharing reduced ED use, although this reduction was not limited to non-urgent use, and the intervention placed a disproportionate burden on people in low socio-economic groups.
Medical interventions Provision of telephone advice by ED staff to parents of children who accidentally ingested poison, was safe, effective, and resulted in reduction in ED visits.
COPD: chronic obstructive pulmonary disease; DVT: deep venous thrombosis; ED: emergency department; GP: general practitioner; NHS: National Health Service; NZHTA: New Zealand Health Technology Assessment; UK: United Kingdom

HTA Report #38 February 2006
15
The authors suggested considering three factors when searching for solutions to ED overcrowding:
The solutions in any locality are likely to depend on local causes, which probably vary even within one healthcare system;
For any problem, there may be several ways of solving it;
In line with the �theory of constraints�, the apparent cause may only be the most severe bottleneck in the system and other constraints are likely to appear as the initial cause is resolved.
The systematic review prepared by the NZHTA4 specifically looked at studies on the appropriate use of the hospital-based EDs and assessed the effectiveness of interventions aimed at reducing inappropriate ED visits.
This systematic review concluded the following:
Despite the general limitations of the research, some evidence was available for the effectiveness of restricted ED access and expanded access to primary care and the efficacy of cost sharing, which have consistently been found to be effective methods to restrict ED use. Less robust evidence exists for the effectiveness of social workers in the ED or certain specific medical interventions.
Available evidence, although generally of poor quality, suggests that some interventions, including triage, patient education, and changes in the characteristics of general practitioner services, are ineffective at reducing the number of inappropriate ED visits.
These two systematic reviews had different research focuses and applied different methodologies. The review by Cook and colleagues42 looked at the effective strategies to reduce ED attendance and waiting time, while the NZHTA report4 looked only at the strategies to reduce ED attendance.
Both reviews suggested that interventions, such as the presence of a social worker at the ED, cost sharing/co-payment, or primary gate-keeping, might be effective in reducing unnecessary ED attendance; however, concerns remained about the safety of these interventions because the decrease in ED attendance was not restricted to non-urgent patients. Both reviews found that patient education was not effective in terms of reducing ED attendance. The results regarding the effectiveness of triage remain controversial, and both reviews pointed out the need for further assessing the safety of this intervention.
Evidence from primary studies The strategies identified from the 23 primary studies were grouped into seven categories according to the type of interventions, including (1) ambulance redistribution (one study),43 (2) ED staffing/reorganization (eight studies),7,35,44-49 (3) fast track (two

HTA Report #38 February 2006
16
studies),50,61-63 (4) observation unit/acute care unit (one study),51 (5) access to diagnostic services (three studies),8,10,52 (6) inpatient beds (four studies),53-56 and (7) system-wide interventions (defined as interventions that addressed more than one component according to Asplin�s three-component model40) (four studies)57,59,60,64(Table 4). Whereas some of the studies only evaluated one strategy, others looked at the effectiveness of multifaceted strategies that addressed a number of factors related to communities, EDs, and hospitals overall.
HTA Report #38 February 2006
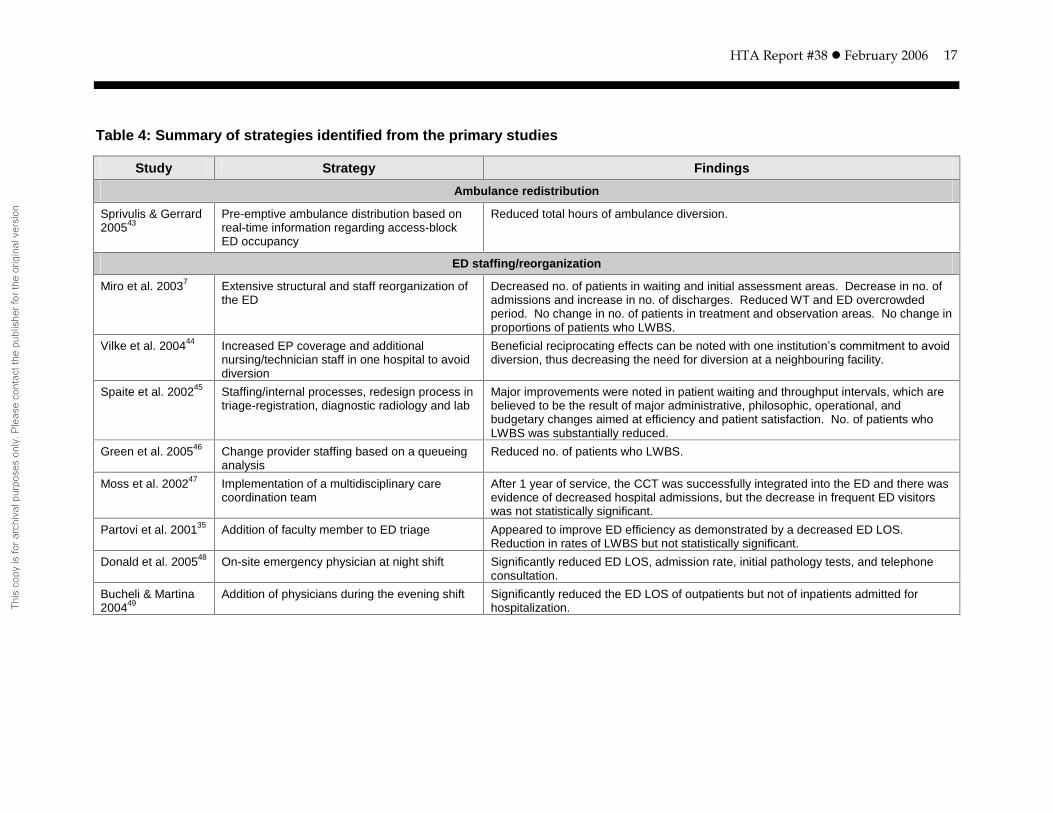
17
Table 4: Summary of strategies identified from the primary studies
Study Strategy Findings
Ambulance redistribution
Sprivulis & Gerrard 200543
Pre-emptive ambulance distribution based on real-time information regarding access-block ED occupancy
Reduced total hours of ambulance diversion.
ED staffing/reorganization
Miro et al. 20037 Extensive structural and staff reorganization of the ED
Decreased no. of patients in waiting and initial assessment areas. Decrease in no. of admissions and increase in no. of discharges. Reduced WT and ED overcrowded period. No change in no. of patients in treatment and observation areas. No change in proportions of patients who LWBS.
Vilke et al. 200444 Increased EP coverage and additional nursing/technician staff in one hospital to avoid diversion
Beneficial reciprocating effects can be noted with one institution�s commitment to avoid
diversion, thus decreasing the need for diversion at a neighbouring facility.
Spaite et al. 200245 Staffing/internal processes, redesign process in triage-registration, diagnostic radiology and lab
Major improvements were noted in patient waiting and throughput intervals, which are believed to be the result of major administrative, philosophic, operational, and budgetary changes aimed at efficiency and patient satisfaction. No. of patients who LWBS was substantially reduced.
Green et al. 200546 Change provider staffing based on a queueing analysis
Reduced no. of patients who LWBS.
Moss et al. 200247 Implementation of a multidisciplinary care coordination team
After 1 year of service, the CCT was successfully integrated into the ED and there was evidence of decreased hospital admissions, but the decrease in frequent ED visitors was not statistically significant.
Partovi et al. 200135 Addition of faculty member to ED triage Appeared to improve ED efficiency as demonstrated by a decreased ED LOS. Reduction in rates of LWBS but not statistically significant.
Donald et al. 200548 On-site emergency physician at night shift Significantly reduced ED LOS, admission rate, initial pathology tests, and telephone consultation.
Bucheli & Martina 200449
Addition of physicians during the evening shift Significantly reduced the ED LOS of outpatients but not of inpatients admitted for hospitalization.

HTA Report #38 February 2006
18
Table 4: Summary of strategies identified from the primary studies (cont�d)
Study Strategy Findings
Fast track (FT)
Cooke et al. 200250 Physician services for non-urgent patients in a separate room
A separate stream for minor injuries can produce an improvement in the no. of trauma patients waiting for over an hour by about 30%.
Fernandes & Christenson 1995,61, Fernandes et al. 199662 199763
An extra admitting clerk, streamlined FT process, an expanded FT area, a stricter, more detailed triage classification, an extra nurse in the FT area
The formal and continued application of CQI techniques in the ED can decrease ED LOS for FT patients. A decreased LOS for FT patients was associated with a concomitant decrease in the no. of ED patients who LWBS.
Observation unit/acute care unit (ACU)
Kelen et al. 200151 A 14-bed monitored ACU staffed by ED personnel
Decreased LWBS rate and AD hours significantly.
Access to diagnostic services
Murray et al. 199952 (RCT)
POCT compared with central lab testing ED LOS was reduced significantly by POCT.
Lee-Lewandrowski et al. 20038
Implementation of a point-of-care satellite lab in the ED
Compared with central lab testing, a substantial decrease in TAT for selected tests and a trend of overall decrease in ED LOS for the patients who received testing after the implementation of a POCT program. Clinicians were significantly more satisfied with the TAT and the accuracy of testing using the POCT option.
Cheung et al. 200210
Triage nurse�s initiation of appropriate diagnostic tests for eligible patients
The Advance Triage System eliminated the additional patient WT for lab and diagnostic imaging assessment and substantially reduced the LOS post-physician assessment thus reducing the total LOS in ED.

HTA Report #38 February 2006
19
Table 4: Summary of strategies identified from the primary studies (cont�d)
AD: ambulance diversion; CCT: care coordination team; CQI: continuous quality improvement; ED(s): emergency department(s); EP: emergency physician; FT: fast track; ICU: intensive care unit; lab: laboratory; LOS: length of stay; LWBS: left without being seen; no.: number; POCT: point-of-care testing; TAT: turnaround time; WT: waiting time
Study Strategy Findings
Inpatient beds
McConnell et al. 200553
Increased ICU beds ICU expansion reduced time spent on AD and ED LOS for patients admitted to ICU, but had less effect on other admitted patients and no effect on patients discharged home.
Dunn 200354 Increased availability of inpatient beds due to nursing strike
Modest decreases in hospital occupancy resulted in highly significant reductions in ED WT.
Hemphill & Nole 200555
Development of an Access Centre to deal exclusively with bed management
Decreased AD hours.
Burns et al. 200556 Improvement in bed management by using cusum analysis
Percentage of patients waiting more than 8 hours for admission did not decrease but increased after the intervention.
System-wide interventions
Cardin et al. 200357 Increased EP coverage, designation of physician coordinators, and new hospital policy
The successful hospital intervention to decrease crowding reduced the mean LOS for patients discharged from the ED,* without resulting in increased return visits to the ED or hospital readmission.
*Data from a previous study published in French.65
Cameron et al. 200258
51 actions in 4 areas: (1) emergency demand management, (2) elective surgery, (3) capacity management, (4) subacute processes
Decreased AD and no. of patients waiting more than 12 hours in the ED to be admitted to a hospital ward.
Cameron et al. 199959
Bonus payments to 21 hospitals AD and WT for patients in category 1, 2, and 3 decreased significantly. Reduction in no. of patients waiting > 12 hours for hospital admission was not statistically significant.
Hoffenberg et al. 200160
Sharing process differences in a large multi-hospital system
Decreased patient LOS in EDs, particularly in the slowest one third of EDs.
HTA Report #38 February 2006
20
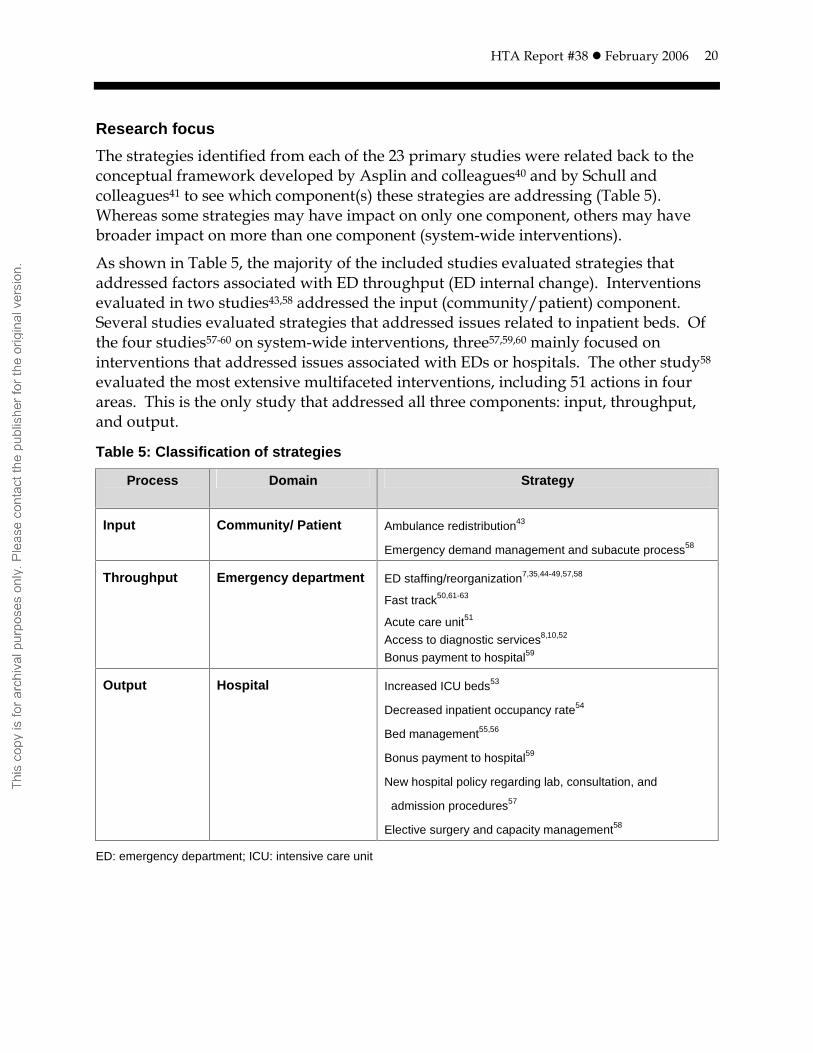
Research focus
The strategies identified from each of the 23 primary studies were related back to the conceptual framework developed by Asplin and colleagues40 and by Schull and colleagues41 to see which component(s) these strategies are addressing (Table 5). Whereas some strategies may have impact on only one component, others may have broader impact on more than one component (system-wide interventions).
As shown in Table 5, the majority of the included studies evaluated strategies that addressed factors associated with ED throughput (ED internal change). Interventions evaluated in two studies43,58 addressed the input (community/patient) component. Several studies evaluated strategies that addressed issues related to inpatient beds. Of the four studies57-60 on system-wide interventions, three57,59,60 mainly focused on interventions that addressed issues associated with EDs or hospitals. The other study58 evaluated the most extensive multifaceted interventions, including 51 actions in four areas. This is the only study that addressed all three components: input, throughput, and output.
Table 5: Classification of strategies
Process
Domain Strategy
Input Community/ Patient Ambulance redistribution43
Emergency demand management and subacute process58
Throughput Emergency department ED staffing/reorganization7,35,44-49,57,58
Fast track50,61-63
Acute care unit51
Access to diagnostic services8,10,52
Bonus payment to hospital59
Output Hospital Increased ICU beds53
Decreased inpatient occupancy rate54
Bed management55,56
Bonus payment to hospital59
New hospital policy regarding lab, consultation, and
admission procedures57
Elective surgery and capacity management58
ED: emergency department; ICU: intensive care unit

HTA Report #38 February 2006
21
Methodological quality of included studies
Among the 23 primary studies, only one52 had a randomized design and two10,35 were non-randomized comparative studies. The majority of the included studies used a pre- and post-intervention (before-and-after design) comparison approach, usually by retrospectively reviewing hospital administrative data.
A quality assessment tool consisting of six criteria was developed to assess the methodological quality of the 20 primary studies with a before-and-after design. The development, definition, and inter-rater reliability of these criteria are described in Appendix A. The results of the quality assessment for each of the studies are presented in Table 6. The only RCT52 and the two comparative studies10,35 were not assessed for their methodological quality because of their higher ranking in the hierarchy of evidence.
As shown in Table 6, nine studies7,43,46-48,51,53,57,60 were considered to be of acceptable methodological quality. None of the nine studies met all six criteria.
Eight studies7,8,44-47,49,60 had a prospective study design. The authors of nine studies43,47,48,51,53,57-60 reflected on other possible events as alternative explanations for the outcomes. More than half of the studies took seasonal/cyclic variations into consideration. The majority of the studies did not provide sufficient information about adaptation of the interventions or discuss the potential impact of the Hawthorne effect on the results. Almost all of the studies used the same outcome measurements before and after the intervention; however, fewer than half of the studies reported random variability and actual probability values for the main outcome measures. Overall, there were considerable methodological limitations.

HTA Report #38 February 2006
22
Table 6: Quality assessment of primary studies
Study Prospective design
Reflection on other events
Control for seasonal variation
Adaptation of intervention
Consistency of reporting
Random variability/ actual probability values
Ambulance redistribution
Sprivulis & Gerrard 200543* No Yes Yes No Yes Yes
Emergency department staffing/reorganization
Miro et al. 20037* Yes No Yes Yes Yes Yes
Vilke et al. 200444 Yes No Yes No Yes No
Spaite et al. 200245 Yes No No No Yes No
Green et al. 200546* Yes No Yes Yes Yes Yes
Moss et al. 200247* Yes Yes Yes No Yes Yes
Donald et al. 200548* No Yes Yes No Yes Yes
Bucheli & Martina 200449 Yes No No No Yes Yes
Fast track
Cooke et al. 200250 No No No No Yes Yes
Fernandes & Christenson 199561, Fernandes et al. 1996,62 199763
No No No No Yes No
Observation unit/acute care unit
Kelen et al. 200151* No Yes Yes Yes Yes No
Access to diagnostic services
Lee-Lewandrowski et al. 20038 Yes No No No Yes No
Inpatient beds
McConnell et al. 200553* No Yes Yes No Yes Yes
Dunn 200354 No No No No Yes Yes
Hemphill & Nole. 200555 No No Yes No Yes No
Burns et al. 200556 No No Yes No Yes Yes
System-wide interventions
Cardin et al. 200357* No Yes Yes No Yes Yes
Cameron et al. 200258 No Yes No No Yes No
Cameron et al. 1999 59 No Yes Yes No Yes No
Hoffenberg et al. 200160* Yes Yes Yes No Yes Yes
*Bolded studies are those with acceptable methodological quality
HTA Report #38 February 2006
23
Research findings
Details extracted from the primary studies, including study objective, setting and study population, strategies under investigation, and outcomes, are presented in Appendix C.
The following paragraphs summarize the research findings from the 23 primary studies according to their methodological quality ratings. Findings from RCTs, comparative studies, and before-and-after studies with acceptable methodological quality are summarized under the �Evidence from good-quality studies� subheadings. Findings from those before-and-after studies that received a low quality rating are summarized under the �Evidence from low-quality studies� subheadings.
Ambulance redistribution
Evidence from good-quality studies
The only study in this category43 received an acceptable methodological quality rating. This Australian study evaluated the effectiveness of ambulance redistribution. A small proportion of lower-urgent patients were diverted from larger inner metropolitan EDs that had high levels of access block to outer metropolitan EDs that were not experiencing high levels of access block. The decision to redistribute ambulances was made from the information provided by an emergency management Internet portal that allows simultaneous visualization of near-real-time ED workload conditions in all eight participating EDs. The study demonstrated a significant reduction in ambulance diversion episodes and total hours on diversion after the implementation of the intervention, despite an increase in mean weekly ED cubicle occupancy. However, as the authors pointed out, this intervention should be viewed only as complementary to strategies directed at reducing the root cause of ED overcrowding.
ED staffing/reorganization
Eight studies7,35,44-49 evaluated the effectiveness of ED staffing changes and reorganization within the ED. These studies were conducted in Spain,7 the United States,35,44-46 Australia,47,48 and Switzerland.49 The study by Partovi and colleagues35 is a comparative study. Of the seven studies with a before-and-after design, four studies7,46-48 were rated as acceptable from their methodological quality rating.
Evidence from good-quality studies
The study by Miró and colleagues7 evaluated strategies involving extensive staff or structural changes or both within the ED. This study demonstrated a reduction in waiting times and ED overcrowded periods, as well as reduction in number of admissions and an increase in number of discharges, but no significant changes in the proportions of patients who left without being seen.
An American study46 found that using a queueing model to identify provider staffing patterns reduced the fraction of patients who LWBS.

HTA Report #38 February 2006
24
An Australian study47 demonstrated that, after implementing a multidisciplinary care coordination team to ensure that ED patients were provided with services that would facilitate their return to, or maintenance in, the community, the rate of hospital admission from the ED decreased significantly, but the decrease in ED revisit was not statistically significant.
The other two studies found that having additional physicians to triage patients35 or having an emergency physician working at the night shift48 significantly reduced the ED LOS.
Outcomes measured in these studies included change in ED LOS, number of patients who LWBS, waiting time, patient readmission to the ED, and patient satisfaction. It was noted that some of the outcome measures differed across these studies. For example, ED LOS was defined as the nurse triage time and nurse discharge time,35 or the time between being seen by a doctor and disposition from the ED.48 Waiting times were reported as mean waiting times of the three patients waiting to enter an initial assessment area for the longest time7 or the time between arrival and being seen by a doctor.48 One study48 reported the outcomes for patients in different acuity categories, while the remaining studies reported the average values of the outcome measures for all patients. It is thus difficult to compare the results across these studies.
Evidence from low-quality studies
One study 44 with a short period of follow up found that increased emergency physician coverage and additional nursing and technician staff in one hospital significantly reduced the ambulance diversion hours and this impact was evident as well in the neighbouring hospital. Another study 45 demonstrated a substantial reduction in the numbers of patients who LWBS following changes in staffing and the internal processes, and in a process redesign in triage-registration, diagnostic radiology, and laboratory. The other study 49 found that increasing the number of physicians during the evening shift significantly reduced ED LOS.
Some of the outcome measures differed across the studies. ED LOS was defined as the time from patient triage to disposition,45 or the time from ED entry to discharge from the ED triage division (the ED consists of both a triage division and a treatment division).49 Waiting times were reported as the time from triage to patient room,45 or the time from ED entry to start of history taking and physical examination.49 These differences in outcome measures made it difficult to compare the results across these studies.
Fast track
Evidence from low-quality studies
Two studies50,61-63 evaluated the effectiveness of fast track for non-urgent ED patients, and the methodological quality of both studies was considered to be poor. One study

HTA Report #38 February 2006
25
was conducted in the UK,50 whereas the other was conducted in Canada, with the results reported in three separate articles.61-63
The UK study50 involved only a single intervention, that is, the addition of a doctor in the ED to see non-urgent patients. The Canadian study61-63 implemented a more sequential and comprehensive strategy over a period of time, including an extra admitting clerk, a streamlined fast-track process, an expansion of the fast-track area, a stricter and more detailed triage classification, and the addition of a nurse to the fast-track area.
The UK study50 demonstrated that the addition of a doctor for non-urgent patients was associated with a significantly decreased proportion of patients waiting for less than 30 and 60 minutes. The Canadian study61-63 found that, after interventions, there was a significantly decreased ED LOS (time interval from triage contact to discharge from the ED) and a decreased number of patients who LWBS.
Observation/acute care unit
Evidence from good-quality studies
Only one study51 with acceptable methodological quality fell into this category. This study suggested that adding a 14-bed monitored acute care unit was associated with a statistically significant reduction in the LWBS rate and ambulance diversion hours.
Access to diagnostic services
Three studies8,10,52 evaluated interventions to improve access to diagnostic services. Two studies10,52 were conducted in Canada and one was conducted in the United States.8 One study52 is a RCT, another 10 is a non-randomized comparative study, and the third is the only study with a before-and-after design8 but it is considered to be of poor quality.
Evidence from good-quality studies
The RCT52 assessed the effectiveness of implementing POCT in the ED and demonstrated a statistically significant reduction in ED LOS (time from triage to disposition) in the intervention group compared with the control group.
The non-randomized comparative study10 looked at the effectiveness of the triage nurse initiating the ordering of appropriate diagnostic tests based on a previously developed set of protocols. There was a decrease in the total ED LOS for all patients and also in patients within different categories (emergent, urgent, and non-urgent), a decrease in LOS after physician initial assessment for all patients and for patients in emergent and urgent categories, and a decrease in the time from physician assessment to disposition (the statistical significance of these changes was not reported).

HTA Report #38 February 2006
26
Evidence from low-quality studies
The other study8 also assessed the effectiveness of implementing POCT in the ED. This study showed an overall trend toward decreased ED LOS during the POCT program. The difference in ED LOS was not significant for any individual test but achieved statistical significance when pregnancy testing, cardiac markers, and urinalysis data were combined.
Inpatient beds
Four studies53-56 addressed issues associated with inpatient beds. Two studies53,55 were conducted in the United States, and the other two54,56 were conducted in Australia. One study53 received an acceptable methodological quality rating.
Evidence from good-quality studies
One US study53 looked at the effects of increased ICU beds on ED LOS and ambulance diversion. The authors performed a careful data analysis, including results adjusting for ED census and other factors, as well as sensitivity analysis. Outcomes were reported separately for different patient groups, such as patients who were admitted to ICU, telemetry units, and ward units, and patients who were discharged home. The authors discussed study limitations and potential alternative explanations for the research findings. This study found that the most notable change after ICU expansion was a decrease in time spent on ambulance diversion. Increased ICU beds also reduced ED LOS for patients admitted to the ICU but showed less effect on other admitted patients and no effect in patients who were discharged home.
Evidence from low-quality studies
The other US study55 reported the effects of improved bed management on ambulance diversion. The strategies, including developing an Access Centre to deal with bed management, identifying service line capacity, adding a bed management coordinator, and expediting bed assignments, resulted in a 63% reduction of ambulance diversion hours.
One Australian study54 observed changes in ED patient waiting time during an industrial action (i.e., hospital nurse strike) and found that the modest reduction in hospital occupancy (due to cancellation of all elective surgery) significantly reduced the waiting time in the ED through reduction of hospital admission and ED occupancy. The study concluded that ED overcrowding from large numbers of admitted patients awaiting hospital admission is a major cause of ED dysfunction.
The other Australian study56 used cumulative sum (cusum) analysis to demonstrate the important trends in patient flow that were not obvious in conventional time-series data, which prompted improvements in hospital bed use. However, after some initial improvement, the percentage of ED patients waiting more than eight hours for

HTA Report #38 February 2006
27
admission increased significantly. According to the authors, this was probably caused by excessive bed closures in response to the initial improvements in bed use.
System-wide interventions
Four studies57-60 examined the effects of system-wide, multifaceted interventions on ambulance diversion, ED LOS, waiting time, return ED visit, and patient satisfaction. One study was conducted in Canada,57, two 58,59 were conducted in Australia, and the other was conducted in the United States.60 Two studies57,60 were considered to be of acceptable methodological quality.
Evidence from good-quality studies
The Canadian study57 evaluated a number of system-wide, multifaceted interventions, including increasing emergency physician coverage, the designation of physician coordinators, and new hospital policies regarding laboratory, consultation, and admission procedures. The results on effectiveness of the multifaceted interventions were reported in a previous French language publication.65
The current study mainly looked at the potential adverse effect, return ED visits, of the interventions on ED patients. This study performed a power calculation and attempted to control for confounders by comparing the hospital receiving the intervention with two similar hospitals to detect a system-wide change in return visits between the pre- and post-intervention period. This study found that the successful intervention did not increase ED return visits and hospital readmission.
The US study60 involved a large multi-hospital system and identified differences in processes from patient presence at the ED to patient admission to the hospital for the fastest and slowest EDs, determined by ED LOS. The best demonstrated process differences were shared among all participating hospital EDs and these interventions were implemented, which resulted in decreased patient ED LOS, particularly in the slowest one third of EDs in the hospital system.
Evidence from low-quality studies
One Australian study58 reported the results of a system-wide, multifaceted intervention, including 51 actions in the areas of (1) emergency demand management, (2) elective surgery, (3) capacity management, and (4) subacute processes (see Appendix D for details of the interventions). A reduction in ambulance diversion and the number of patients waiting more than 12 hours to be admitted to a hospital ward was observed three months after the intervention.
Another Australian study59 evaluated the effectiveness of a bonus payment to 21 public hospitals and demonstrated a significant reduction in the number of occasions of ambulance diversion and some improvements in waiting times for category 1, 2, and 3 patients. However, the number of patients waiting more than 12 hours in EDs for inpatient beds was not significantly reduced.

HTA Report #38 February 2006
28
SELECTED LOCAL/INTERNATIONAL INITIATIVES
Alberta The Capital Health Region in Edmonton, Alberta, Canada conducted a focus group study to determine the perceptions of healthcare professionals and service providers on ED overcrowding.66 In addition to addressing issues regarding definitions of ED overcrowding, characteristics of an overcrowded ED, and causes of overcrowding, this study identified some potential interventions to improve ED throughput and address system-wide capacity.
Proposed interventions designed to improve throughput included:
increased availability of and quicker turnaround time for laboratory and diagnostic imaging services;
sufficient availability of porters, laboratory technicians, and other support staff;
increased accessibility to community care and palliative care services;
faster responses from and decisions by specialists; and
determination of appropriate staffing levels.
Interventions suggested to improve system-wide capacity included:
establishment of a holding unit for admitted patients or an observation unit adjacent to and managed by the ED;
access to the outpatient department 24 hours a day;
introduction of an internal transportation service for transfers of patients between sites; and
increased acute and long-term bed capacities on the basis of patient need, taking into account the demands of EDs.
To combat overcrowding and long waiting periods in the ED, several strategies were implemented by Capital Health.2 Strategies to deal with �preload� factors (defined as factors leading to increased numbers of ED visits) included the movement of intravenous therapy from the ED, a media campaign to educate patients on finding alternatives to non-urgent care, the implementation of direct admission policies for patient transfers as opposed to the older system of receiving transfers via the ED, the use of automated voice-messaging systems to direct patients calling the ED toward more appropriate resources and services, and an immunization campaign to prevent and control influenza outbreaks. Strategies to deal with the �after-load� factors (defined as factors leading to ED overcrowding because of delay in discharging patients from the EDs to appropriate sites of care) included the opening of new acute care beds.

HTA Report #38 February 2006
29
Other strategies to deal with the management of ED overcrowding included the development of reports to measure situations that look imminent, pre-diversion guidelines to free up ED space to prevent ambulance diversions, a bed management teleconference system to bring together site directors and administrators during peak demand periods to coordinate efforts, and finally, an ambulance diversion policy. These strategies were generally developed to address immediate concerns, and their impact has not yet been evaluated.2
In December 2003, a groundbreaking agreement was ratified by Alberta Health and Wellness, the Alberta Medical Association, and Alberta's Regional Health Authorities.67 This agreement was established by the three partners as an opportunity to renew the healthcare system, supported with innovative investment and a unique approach to primary care, to attain the shared goal of improving access and patient care. Under this master agreement, the primary care initiative agreement creates incentives for general practitioners to work with regions, specialists, and other providers to offer comprehensive, 24-hour seven-day-per-week access to primary care services.68 It could be anticipated that improvement in access to primary care would help reducing ED visits by patients with non-urgent conditions.
United Kingdom The substantive work undertaken by the UK�s National Health Service (NHS) to establish ED waiting time benchmarks has been reported in several publications (Dr M Schull, Dr E Lang, personal communication, December 2005). In a UK Department of Health report published in October 2004,69 Dr G Alberti summarized the key components of the initiatives and the main results of this work.
In 2000, the NHS Plan set the target that, by the end of 2004, all patients should be admitted, discharged, or transferred within four hours of arrival. New money to recruit an extra 600 ED nurses accompanied the target. A 10-year strategy, Reforming Emergency Care, was developed to drive the change in emergency care. In 2001, the Carson Report recommended a new model for providing out-of-hours care services. The Department of Health allocated £30 million to the NHS Modernization Agency to fund a national service improvement program, the Emergency Services Collaborative, targeted at frontline clinical teams. In a five-point plan agreed in January 2004, the Department of Health clarified the four-hour target and the 98% operational standard, introduced an incentive scheme to encourage NHS trusts to improve performance, brought together the Intensive Support Team and the Emergency Services Collaborative to provide more coordinated support to NHS trusts, focused on improving the patient journey and developing solutions for key causes of delay, and identified and implemented the relationship and performance mechanisms.
As a result of this initiative, by the second quarter of 2002/03, 77% of patients spent four hours or less in EDs (measured from time of arrival to time of admission, discharge, or transfer). By the first quarter of 2004/05 the number of patients reached

HTA Report #38 February 2006
30
94.7%. Since then the trend has continued to improve, and by October 2004, over 96% of patients spent four hours or less in EDs.69
The author pointed out that improvement in emergency care must start with the challenge, but not the solution. Each health and social care community faces its own set of issues, and addressing each of these issues requires tailored solutions. Improvements must not be limited to the EDs but rather, made across the whole hospital and whole health and social care community.69

HTA Report #38 February 2006
31
GUIDELINES/POSITION STATEMENT
In 2000 and 2003, the Canadian Association of Emergency Physicians (CAEP)/National Emergency Nurses Affiliation (NENA)15,25 recommended a number of strategies to address ED overcrowding (see Appendix E). These two position statements did not provide information about the scientific evidence upon which the recommendations were based.
HTA Report #38 February 2006
32
DISCUSSION
Overall findings Effectiveness
This report attempted to identify all of the published and unpublished English and German language literature pertaining to investigations on reducing ED overcrowding. Using a comprehensive set of search strategies, two systematic reviews and 23 primary studies were included in this report. The majority of interventions under investigation addressed the issues associated with ED throughput components and focused on continuous quality improvement. This indicates that, although it has been well recognized that ED overcrowding is often caused by factors beyond the control of the ED, there is a lack of research evidence on the effectiveness of strategies that addressed factors outside of the ED.
Moreover, although many interventions may have been attempted to address the issue of overcrowding across different EDs, few of them have been evaluated formally or disseminated in any manner. Even more disappointing, few studies have been completed in the Canadian healthcare system.
There are considerable methodological limitations of the included studies. For example, only one RCT was located, the majority of the studies used a before-and-after design that is susceptible to biases, including secular trends.70 It has been noted that conducting an RCT in this context would be difficult, if not impossible, and sometimes inappropriate or unethical (Dr E Lang, personal communication, November 2005). A rigorous before-and-after design with convincing results would be adequate in guiding decision making. However, quality appraisal of the included studies with before-and-after design indicated an overall poor quality and as such caution should be taken when drawing conclusions.
On the basis of the studies with better design (RCT or comparative studies) or before-and-after studies with acceptable quality, the following strategies warrant some considerations:
Decreasing ED demand
Pre-emptive ambulance distribution based on real-time information regarding access-block ED occupancy.
Improving ED throughput
Extensive structural and staff reorganization of the ED.
Change in provider staffing based on a queueing analysis.
Implementation of a multidisciplinary care coordination team.
HTA Report #38 February 2006
33
Addition of a faculty member to ED triage.
Provision of an on-site emergency physician at night shift.
Addition of an acute care unit staffed by ED personnel.
Implementation of point-of-care testing in the ED.
Triage nurse�s initiation of appropriate diagnostic tests for eligible patients.
Decreasing access block
Increase in ICU beds.
System-wide
Increase in emergency physician coverage, designation of physician coordinators, and adoption of a new hospital policy.
Sharing of process differences in a large multi-hospital system.
Overall, most studies demonstrated that various interventions were effective in improving outcome measures of ED overcrowding. These measures included reduced frequency or duration of ambulance diversion, ED LOS, waiting time, the number or proportion of patients who LWBS, ED return visits or hospital readmission, laboratory test turnaround time, increased patient satisfaction with the service, and physician/nurse satisfaction with laboratory test accuracy and turnaround time. Generally, strategies that focused on the problems within the ED demonstrated the potential to reduce ED LOS, waiting time, or number of patients who LWBS, whereas system-wide approaches demonstrated the ability to reduce the frequency and/or duration of ambulance diversion. The impact of these �improvements� on ED overcrowding may be limited, as it was only effective to a small degree and in some cases, through extreme efforts, internally within the ED (Dr R Darlet, personal communication, November 2005).
Research suggested that to affect changes in ED overcrowding and waiting times will require a multilevel approach.53 The success of the ED reorganization process was most likely the result of the multifaceted approach. Simply improving one or two of the process issues might have led to minimal overall improvements.45 Having the support of hospital administration and the emergency physician staff was essential in getting over the historical barriers of committing to rapidly assessing and treating all patients.45
The ultimate goal of emergency medicine is to provide timely access and treatment for patients with truly acute or severe illness or injuries. Outcome measures should be related to more patient-focused clinical outcomes, such as delay in treatment, prolonged pain and suffering, or in-hospital stay. However, these outcomes were not reported in any of the included studies.

HTA Report #38 February 2006
34
Clinical significance
Most of the included studies reported statistically significant mean changes in outcome measurements after the intervention. The clinical significance of such a mean change, for example, a mean reduction of 30 minutes in waiting time to be seen by a physician, was not clear. It seems to be more meaningful to look at the outcomes separately for patients with different levels of acuity.
Only the study that evaluated the effect of increased ICU beds mentioned clinical significance.53 This study found that there was a statistically significant reduction in ambulance diversion, but the changes in mean ED LOS were less striking. However, the fact that ED LOS for the 90th percentile of telemetry and ICU patients decreased by more than 60 minutes may have clinical significance. In other words, changes in the mean occur primarily because the right tail of the distribution is shortened (i.e., the longest times are decreased) and not necessarily because the centre of the distribution has shifted. As the authors pointed out, this phenomenon may be of interest to clinicians and hospital administrators. Clinically, it may be more important to reduce ED LOS for a small group of critical patients from eight hours to seven hours than to reduce ED LOS for all admitted patients by 10 minutes. Similarly, hospital administrators may have a preference for eliminating days in which ambulance diversion lasts more than 12 hours, rather than reducing the expected time in diversion by 1 hour for each day.53
Generalizability of the research findings
EDs vary substantially in terms of location, client population, human and structural resources, size and capacity of the hospital, number of specialists, and mechanism of revenue and reimbursement specialties.7 When analyzing the research it is obvious that EDs vary also in the following ways:
Staff mix; for example, the ratio of nurses to ED physicians based on patient volume
Where patients come from and how patients arrive at the ED; that is, for example, the proportion of patients who come from nursing homes and the proportion of patients who arrive by ambulance
Post acute care needs of disposed ED patients and where patients are discharged to; that is, for example, the proportion of patients who return to the community.
All of these variances make EDs unique and affect the potential benefits of implementing strategies that appear successful in the research literature in reducing ED overcrowding and waiting times. It is important for each ED to evaluate its uniqueness and determine how similar or dissimilar they are in comparison. No single solution will fit all hospitals or all healthcare systems.58

HTA Report #38 February 2006
35
Each ED may have its own primary problem associated with the ED flow process and thus needs to identify the most important issue first. For example, the study on increased ICU beds53 suggests that increased ICU capacity might be a reasonable response for reducing ambulance diversion but less compelling if the main concern is reducing ED LOS for all patients.
Safety issues Strategies for enhancing ED patient flow and ED productivity should not result in increasing stress levels, reducing care standards, or compromising patient safety.71 These effects could be measured by using direct measures of adverse health outcomes after discharge.57 Unfortunately, such information is usually not available from most hospital databases.
The majority of the included studies did not evaluate strategies to reduce ED overcrowding in terms of their effect on the quality of care delivered to patients. One Canadian study57 looked at ED return visits and hospital readmission after the intervention. The rationale for this is that patients discharged prematurely or treated inadequately are more likely to bounce back after discharge. The authors of this study did not find an association between the multifaceted intervention and the risk of unscheduled related return visits to the ED, even when they controlled important confounders using a multivariate analysis.
Issues related to the definition Although ED overcrowding has been a frequent topic of research, it is not clearly defined in the emergency medical literature.72,73 The lack of consensus for definitions of ED overcrowding has been a challenge for researchers, clinicians, administrators, and policy makers.40 Although emergency physicians have an intuitive sense of when an ED is becoming overcrowded, there is no universally accepted quantitative index of ED overcrowding, and ED overcrowding remains difficult to define.12,74
The medical conditions of patients who come to the ED can range from mild injuries to serious traumas and can also include patients with exacerbation of chronic conditions such as asthma or diabetes. Therefore, the space, equipment, and medical personnel resources required to treat patients vary. As a result, there are no specific criteria, such as a ratio of patients to staff, to define when an ED is overcrowded.3
The CAEP25 defines ED overcrowding as �a situation in which demand for service exceeds the ability to provide care within a reasonable time, causing physicians and nurses to be unable to provide quality care.� Although this definition has intuitive appeal, it is difficult to operationalize for research purposes.41
A survey of US ED directors suggested five different definitions of ED overcrowding: (1) patients wait more than 60 minutes to see a physician, (2) all ED beds are filled more than six hours/day, (3) patients are placed in hallways more than six hours/day,
HTA Report #38 February 2006
36
(4) emergency physicians feel rushed more than six hours/day, and (5) the waiting room is filled more than six hours/day.75 However, each of these criteria has its limitations. Some are difficult to measure; for example, the perception of being rushed may be too subjective. Others do not clearly represent a threat to timely and quality emergency care, for example, a full waiting room or a patient placed in a hallway for more than six hours. Workload measures alone are likely insufficient, because overcrowding represents a situation in which the workload exceeds the resources available, and the indicator must capture both aspects of the problem.41
Ambulance diversion was considered by the Canadian expert panel as an appropriate operational definition of urban ED overcrowding.41 It reflects the ability of an ED to fulfill its prime mandate, that is, the provision of rapid medical care to acutely ill patients. According to the Canadian experts, this definition is readily measured, is supported by other studies, and reflects the practices of some governments and hospital associations.41 Ambulance diversion however, is not an option for many hospitals, and EDs have widely variable thresholds for diverting ambulances; thus this definition may not be generalizable to ED overcrowding in some places.40
In the absence of specific criteria to define when an ED is crowded, health-care researchers suggest using several available indicators to point to crowded conditions. For example, three indicators, including diversion, boarding, and left before a medical evaluation, were chosen in the US General Accounting Office�s report.3
It was suggested that real-time computerized tracking of waiting times, treatment times, and current census of actual number of patients in the ED being treated or waiting to be seen are needed to accurately define ED overcrowding. However, such data are usually lacking in most EDs.28
Only one included primary study clearly defined ED overcrowding. Miró and colleagues7 defined ED overcrowding from both a numerical and functional perspective. Numerical overcrowding was defined as any three-hour period with more than 15 (before the reorganization) and 24 (after the reorganization) patient arrivals at the ED. Functional overcrowding was defined as lack of capacity in the treatment and observation area that reduced the flow of patients into the initial assessment area. However, this definition is closely related to the size and physical structure of EDs; thus it is difficult to extend its use to other EDs.
Consideration for future research Because scientifically sound evidence on interventions to reduce ED overcrowding is limited at this time, future high-quality research is urgently needed to examine the effectiveness of strategies to address ED overcrowding. The four general areas of ED overcrowding that require future research are:40
developing measures of ED overcrowding that are valid, reliable, and sensitive to changes throughout time;
HTA Report #38 February 2006
37
identifying the most important causes of ED overcrowding;
assessing the effect of ED overcrowding on the quality of patient care; and
evaluating interventions to reduce ED overcrowding.
As to evaluating interventions to reduce ED overcrowding, it is essential that any future research retains an overview of the larger picture because isolated interventions are unlikely to be effective. Focusing on one aspect of the problem in isolation is limited in terms of its overall utility and helpfulness in progressing toward a solution.76
Standardizing the definition of ED overcrowding, choosing and defining clinically meaningful and more patient-focused outcome measures, will be another challenge. Well-designed prospective studies with careful consideration of other potentially influential factors are required to detect the true effects of the intervention under investigation.

HTA Report #38 February 2006
38
CONCLUSION
ED overcrowding is a serious national and international public health issue and has received wide attention from administrators, physicians, nurses, researchers, and the media. However, to date no national study has been published to report the magnitude of the problem across Canada.
Substantial efforts have been made by ED physicians and nurses, hospital administrators, managers, and government decision makers to address this issue; however, scientifically defensible research evidence is limited.
Two systematic reviews suggested that interventions, such as the presence of a social worker at the ED, cost sharing/co-payment, or primary gate-keeping, might be effective in reducing unnecessary ED attendance; however, concerns remained about the safety of these interventions because the decrease in ED attendance was not restricted to non-urgent patients. Both reviews found that patient education was not effective in terms of reducing ED attendance.
In the 23 primary studies included in this report, the majority of the strategies addressed the contributing factors internal to the ED. In these studies, interventions were targeted at ED throughput components, such as ED staffing/reorganization (additional staff and space, improvement in ED flow process), ED acute care unit, fast track, and access to diagnostic services (advanced triage, implementation of POCT). These strategies resulted in reduction of ED LOS, number of patients who LWBS, waiting times, laboratory test turnaround times, or improved patient satisfaction. Increased hospital ICU beds appeared to significantly reduce ambulance diversion hours and to shorten ED LOS for patients admitted to the ICU. System-wide approaches appeared effective in reducing the frequency or duration of ambulance diversion.
On the basis of evidence from studies with better design (RCT or nonrandomized comparative studies) and before-and-after studies with acceptable methodological quality selected from the 23 studies, some strategies looked promising in terms of decreasing ED demand, improving ED throughputs, decreasing access block, and system-wide change.
Strategies for decreasing ED demand included pre-emptive ambulance distribution based on real-time information regarding access-block ED occupancy. Strategies aimed at improving ED throughput included extensive structural and staff reorganization of the ED, changing provider staffing, on the basis of queuing analysis, implementation of a multidisciplinary care coordination team, addition of a faculty member to ED triage, provision of an on-site emergency physician at the night shift, addition of an acute care unit staffed by ED personnel, implementation of point-of-care tests in the ED, and the triage nurse�s initiation of appropriate diagnostic tests for eligible patients. Strategies

HTA Report #38 February 2006
39
aimed at decreasing access block included increased ICU beds. Strategies aimed at system-wide change included increased emergency physician coverage, designation of physician coordinators, and implementation of a new hospital policy and sharing of process differences among hospitals in a large multi-hospital system.
The improvements shown in the results of each study, particularly those on patient flow internally, looked promising. However, as ED overcrowding relates largely to external factors, such improvements may have limited impact on ED overcrowding. Moreover, the lack of standard definitions for outcome measures, such as waiting times, makes it difficult to compare the results across studies. Furthermore, overall poor methodological quality prevented any definitive conclusions about the effectiveness of various interventions examined in these studies.
This report serves as a benchmark of the currently published research and identifies areas where research can be improved. Standardization of the definitions for ED overcrowding and other relevant terms is essential for future research in this area. Also, there is a need to reach a consensus on what is a clinically meaningful quantitative index for ED overcrowding (acuity level). Research needs to be conducted on input and output components rather than just on throughput component. Identifying the determinants of ED overcrowding needs to involve leaders at all levels, from the ED to the community. Strategies to address the determinants need to be evaluated using clinically meaningful measures. Development of valid, reliable, and sensitive outcome measures is important. Standardization of measures throughout the provincial regional health authorities would allow for comparison of different strategies and the adoption of those that are most effective and efficient province-wide.

HTA Report #38 February 2006
40
APPENDIX A: METHODOLOGY
Search strategy Literature searches were conducted by the AHFMR librarians between September 2003 and December 21, 2005. Major electronic databases used include PubMed, EMBASE, Cochrane Library, CINAHL, Dissertation Abstracts, Web of Science, and NHS Centre for Reviews and Dissemination (CRD) databases (NHSEED, HTA, DARE). Various library collections, as well as web sites of clinical trials, guidelines, regulatory agencies, evidence-based resources, and other HTA-related agencies were searched. Internet search engines were also used to locate grey literature.
The Medical Subject Headings (MeSH) term related to the topic is Emergency Service, Hospital.
Table A.1: Summary of search strategy�
Database Platform Latest edition or date last searched
Search terms ��
Core databases
The Cochrane Library
http://www.thecochrane library.com
Dec 21, 2005 (emergency department OR emergency room OR emergency centre) AND (gridlock OR overcrowding OR overloading OR overload OR overloaded))
PubMed http://www.pubmed.gov Dec 21, 2005 (Emergency department OR ED OR �emergency centre*� OR �emergency center*�
OR �casualty department*� OR Emergency
service, hospital)
AND
(gridlock OR �patient volume� OR �client
load� OR �patient load� OR crowd* OR
overcrowding OR overload* OR overloading OR �fast track system� OR ambulance diversion OR access OR �holding unit�)
CRD Databases (DARE, HTA, & NHS EED)
http://nhscrd.york.ac.uk Dec 21, 2005 emergency department AND (overcrowd OR overload)
EMBASE Ovid Licenced Resource Dec 21, 2005 emergency department.mp. OR exp Emergency Ward/ OR emergancy cent$.mp. OR A&E.mp AND Exp Crowding/ OR gridlock OR overload$ OR overcrowd$
Web of Science
ISI Licensed Resource Dec 21, 2005 TS=(ED OR Emergency Department) AND TS=(overload* OR overcrowd*)

HTA Report #38 February 2006
41
Database Platform Latest edition
or date last searched
Search terms ��
Core databases (cont�d)
CINAHL Ovid Licenced Resource Dec 21, 2005 (emergency room OR ER OR Emerg OR emergency cent$ OR emergency department OR A&E OR Emergency Medical Services OR EMS)
AND
(overcrowd$ OR overload$ OR gridlock OR crowd$)
HealthSTAR Ovid Licenced Resource Oct 14, 2004 Note: All HealthSTAR records are indexed as part of PubMed as of September 2004.
(emergency room OR emergency department OR emergency cent$ OR A&E)
AND
(overcrowd$ OR overload$ OR gridlock OR exp Patient Admission/ OR exp Crowding/ )
Limit to non-MEDLINE records.
Proquest Dissertations and Theses Full Text
Proquest Licensed Resource
Dec 21, 2005 (emergency department OR ED) AND overcrowding
Clinical trials
Clinicaltrials.gov
http://www.clinicaltrials.gov
Dec 21, 2005 emergency
UK National Research Register
http://www.update-software.com/national/
2005 Issue 4
Dec 21, 2005
(emergency NEXT department) AND (overcrowd* OR overload* OR crowd*)
Guidelines
Alberta Medical Association Guidelines
http://www.albertadoctors.org
Dec 21, 2005 Browsed list of Guidelines
Canadian Association of Emergency Physicians
http://www.caep.ca/002.policies/002-01.guidelines.htm
Dec 21, 2005 Browsed list of Guidelines
CMA Infobase http://mdm.ca/cpgsnew/cpgs/index.asp
Dec 21, 2005 emergency department OR ED AND overcrowding
National Guidelines Clearing-house
http://www.ngc.gov Dec 21, 2005 emergency department overcrowding

HTA Report #38 February 2006
42
Database Platform Latest edition
or date last searched
Search terms ��
Coverage/regulatory/licensing agencies
Alberta Health and Wellness
http://www.health.gov.ab. ca
Dec 21, 2005 Must contain in the title the phrase: emergency department
FDA http://www.fda.gov Dec 21, 2005 emergency overcrowding
Blue Cross/ Blue Shield
http://www.bluecares.com/tec/tecassessments.html
Dec 21, 2005 Browsed List of Technology Assessments 2003-2005
Evidence-based resources
EBM Reviews Ovid Licenced Resource Dec 21, 2005 (emergency department OR ED OR emergency room) AND (overcrowd$ OR overload$ OR gridlock)
Bandolier http://www.jr2.ox.ac.uk/bandolier/index.html
Dec 21, 2005 emergency department overcrowding
TRIP Database
http://www.tripdatabase.com
Dec 21, 2005 Title & Text: emergency department AND overcrowding
BestBETS http://www.bestbets.org Dec 21, 2005 Match All words (AND): emergency department overcrowding
Grey literature
NLM Gateway http://gateway.nlm.nih. gov/gw/Cmd
Dec 21, 2005 emergency AND overcrowding
Google http://www.google.ca Dec 21, 2005 �emergency department� crowding OR
overcrowding OR gridlock OR overcrowded OR crowded �pubmed
Sigle (Grey Lit Database)
Licensed Resource Oct 14, 2004* This database not available for June 2005 Update Search
Emergency department AND (overcrowding OR over-crowding)
Alltheweb. Com
http://www.alltheweb. com
Dec 21, 2005 �emergency department� AND (overcrowding
OR over-crowding)
Copernic http://www.copernic. com Dec 21, 2005 �ED overcrowding� AND (strategy OR
strategies)
HTA agencies and websites
CCOHTA http://www.ccohta.ca Dec 21, 2005 emergency
AETMIS http://www.aetmis.gouv.qc.ca/en/
Dec 21, 2005 emergency
NICE http://www.nice.nhs.uk Dec 21, 2005 emergency
ECRI Licensed Resource Dec 21, 2005 "emergency department" AND overcrowding
Note: � Limits: Searches were limited to publication dates 1993-2005; language: English or German; studies: human studies only. These limits are applied in databases where such functions are available. �� �*�and �$ � are truncation characters that retrieve all possible suffix variations of the root word e.g. surg* retrieves surgery, surgical, surgeon, etc.

HTA Report #38 February 2006
43
Study selection One researcher (BG) reviewed the abstracts and selected articles for inclusion on the basis of the following criteria. An emergency physician and researcher (Dr B Rowe) was involved in the development of the criteria and study selection.
Inclusion criteria
Studies were included if they met all of the following criteria:
Published from 1993 onward, in English or German
Conducted in Western developed countries
Focused on the effectiveness of strategies to address ED overcrowding
Study designs included systematic reviews, RCTS, non-randomized controlled studies, and prospective or retrospective studies with pre/post comparisons
Outcome measures included at least one of the following: ambulance diversion, ED length of stay (LOS), waiting time, number of patients who LWBS, hospital admission or hospital occupancy, turnaround time for laboratory tests, patient satisfaction, or safety (ED return visit, death, etc.)
Outcome measurements were the same for pre- and post-intervention periods
No limit on age or gender of the population
Exclusion criteria
Studies were excluded if they met any one of the following criteria:
Focused only on factors contributing to ED overcrowding
Focused only on the consequences of ED overcrowding
Focused only on management of ambulance diversion
Described the strategies to address ED overcrowding but without any pre- and post-intervention comparison of relevant outcome measures
Study participants were specific groups of patients, e.g., patients with certain conditions or diseases, such as asthma or congestive heart failure
Studies conducted in pediatric ED, because they have their own characteristics and patient volume-time distributions
Some outcome measurements related to ED overcrowding but the objective of the study was not to address ED overcrowding
Time interval for outcome measurement not clearly described
News reports
Letters, comments, or editorials

HTA Report #38 February 2006
44
Methodological quality assessment Development of quality assessment criteria
No quality assessment tool was found that was developed specifically for assessing studies with a before-and-after design. The checklist developed by Downs and Black77 was tried; however, more than half of the questions in this tool were not relevant and did not apply to most of the studies, particularly those questions regarding the selection of the participants.
Assessing methodological quality of studies with a before-and-after design appears to be challenging but also needed. This design was chosen by the researchers because it is most useful in demonstrating the immediate impacts of short-term interventions. It is however less useful for evaluating longer-term interventions because over the course of a longer period of time, more circumstances, that is, threats to internal validity, can arise that may obscure the effects of an intervention78. For pre/post studies conducted in a complex setting like EDs, some other factors, such as seasonal/cyclic variation and the Hawthorne effect, may also have an impact on the outcomes.
Given the difficulty in finding an appropriate tool for assessing the quality of the studies, a brief checklist consisting of six criteria was developed by the authors of this review. This checklist combined some important and relevant aspects on program evaluation taken mainly from two reference sources.77,78 The study would be considered of acceptable quality if more than half of the questions were answered yes. The study would be considered of low quality if fewer than half of the questions were answered yes.
Quality appraisal criteria and definition77,78
1. Prospective design � Prospective or retrospective data collection
Q: Did the study have a prospective design?
Yes
No
Definition
Yes: if it is clear from the study that data were collected prospectively.
No: if it is clear that data were collected and analyzed retrospectively, or it is not clear whether data were collected prospectively or retrospectively, or data collection was prospective for post-intervention outcomes but retrospective for pre-intervention outcomes.
2. Reflection on other events � Some other influential event(s), which could have a potential impact on outcomes, and these events occurred over the time of the study.

HTA Report #38 February 2006
45
Q: Were any other influential event(s) during the intervention identified and taken into account by the authors; and reflected on as to how they may impact the outcome?
Yes
No
Definition
Yes: if the author(s) mentioned some other event(s) (such as other changes throughout the system) and discussed their potential impact on the outcomes.
No: if the author(s) did not mention or specify other events.
3. Control for seasonal/cyclic variations � Changes in the outcome measures might be explained by seasonal/cyclic variations rather than the intervention itself.
Q: Were the outcomes measured in the same seasonal/cyclic time period before and after the intervention?
Yes
No
Definition
Yes: if the outcomes were measured at the same season(s)/month(s)/day(s)/hour(s) before and after intervention (e.g., March 1 to May 31, 1999 versus March 1 to May 31, 2000, June 1999 versus June 2000, one year before versus one year after the intervention, weekdays versus weekdays, weekends versus weekends. One to two weeks before versus one to two weeks after the intervention could also be answered yes, assuming the variation within a one-month period would be very small).
No: if the time period when the outcome of interest was measured was not in the same season/month/day before and after the intervention (e.g., January 1 to March 1, 2000, versus July 1 to September 1, 2000, or one month before and one month after the intervention, or week days versus weekend) or the comparison was made before and after the intervention but no time period was specified.
4. Adaptation of the intervention/avoiding the Hawthorne effect � An appropriate amount of time was allowed to elapse for the intervention to be fully implemented and functional as well as avoiding the Hawthorne effect (people perform differently by being aware of the ongoing intervention).
Q: Did the study provide information on an appropriate adaptation of the intervention?
Yes
No
Definition
Yes: if the author(s) allowed some time for the adaptation of the intervention, or if outcomes were not measured immediately after the implementation of the intervention.

HTA Report #38 February 2006
46
No: if the author(s) did not allow enough time for adaptation of the intervention, or if the outcomes were measured immediately after the implementation of the intervention, or it is unclear when the intervention was implemented and outcomes were measured.
5. Consistency of instrumentation/reporting - Validity of the instruments for measuring change over the course of the intervention.
Q: Were the outcomes measured and reporting kept constant before and after the intervention?
Yes
No
Definition
Yes: if the author(s) used the same outcomes (e.g., calculation of time interval for waiting time or ED LOS) before and after the intervention.
No: if the author(s) measured and reported different outcomes before and after the intervention.
6. Reporting of random variability and actual probability values- Reporting of random variability of outcome measures and actual probability values provides more accurate information about the outcomes and the statistical significance of the outcomes.
Q: Did the study provide estimates of the random variability and report actual probability values for the main outcomes?
Yes
No
Definition
Yes: if both random variability (such as range, standard error, standard deviation, or confidence interval) and actual probability values (e.g., P = 0.03 rather than P < 0.05, except where P < 0.001) were reported, or only random variability was reported where reporting �P� values was not applicable.
No: only mean (median) values of main outcomes were reported and/or �P� value was reported as <0.05.
Analysis of inter-rater reliability
The quality ratings for each of the studies were conducted independently by two reviewers (BG and CH). Any disagreements that could not be resolved by discussion were referred to a third reviewer for mediation until consensus was reached. The two reviewers discussed the criteria with respect to the interpretation of the questions prior to assessing the studies.

HTA Report #38 February 2006
47
Inter-rater reliability (inter-rater agreement), defined as the extent to which different raters assess the same criteria agree, was analyzed by calculating a Kappa coefficient. The ratings assigned by the two reviewers for each of the six criteria for each of the 20 studies were compared. Since there were only two categories for each criteria (yes or no), an un-weighted Kappa coefficient () was calculated using the following formula: 79
= observed agreement � chance agreement
1 � chance agreement
The following guidelines were provided for the evaluation of Kappa 80:
> .75 denotes excellent reproducibility.
.4 ≤ ≤ .75 denotes good reproducibility.
0 ≤ < .4 denotes marginal reproducibility.
According to the above guidelines, the Kappa coefficient that was calculated, 0.71, indicated good agreement between the two reviewers.
Data extraction The following information was extracted from each of the included primary studies:
Characteristics of the study
Author(s)
Date of publication
Country
Study design
Study�s objective
Setting and study participants
Setting
Location
ED volume
Study participants
Inclusion
Exclusion
Acuity of patients
Strategy
Intervention
Comparator (for RCT or comparative studies)
Team involved
= .86 - .51/1 - .51 = .71

HTA Report #38 February 2006
48
Period for comparison
Outcome
Expert review External reviewers with clinical expertise in emergency medicine and health technology assessment methodology evaluated the draft report and provided feedback. In selecting external reviewers, the practice of the AHFMR is to choose clinical and methodology experts who are well recognized and published in the peer-reviewed literature and who can offer a provincial and/or national perspective with respect to the strategies to reduce ED overcrowding.

HTA Report #38 February 2006
49
APPENDIX B: EXCLUDED STUDIES Table B.1: Excluded studies
Study Reason for exclusion
Systematic reviews
Anderson et al. 200681 Did not meet criteria for SR defined by Cook et al. 1997.82
Cooke et al. 200383 Did not meet criteria for SR defined by Cook et al. 1997.82
Haby et al. 200184 Focused on pediatric patients.
Hassan 200385 Did not meet criteria for SR defined by Cook et al. 1997.82
Stacey et al. 200386 The objective was not to address EDOC.
Primary studies
Anantharaman & Swee 200187
The study was not conducted in a Western developed country.
Barthell et al. 200388 Before-and-after comparison of outcomes was not clearly reported.
Bond 199589 Conducted in a pediatric ED.
Bond 200390 Focused on pediatric patients.
Browne et al. 200091 The study was conducted in a pediatric ED.
Cain et al. 199692 Focused on pediatric patients.
Cooke et al. 200393 Did not evaluate the effectiveness of an intervention addressing EDOC.
Cornwell et al. 200394 The study objective was not to address EDOC.
Derlet et al. 199595 No before-and-after comparison of EDOC-related outcomes.
Doxzon & Howard-Ducsay 200496
Intervention and time interval for outcome measurements were not clearly described.
France et al. 200597 Focused on physician�s behaviours but not EDOC-related outcomes.
Fry 200198 Focused on a specific patient group.
Granapathy & Zwemer 200399
No before-and-after comparison of EDOC-related outcomes.
Hu 1993100 The study was not conducted in a Western developed country.
Kilic et al. 1998101 The study was not conducted in a Western developed country.
Krakau & Hassler 1999102 The study objective was not to address EDOC.
Lewandrowski 2004103 The results were reported in an earlier study.8
McCarthy 2005104 Time intervals for outcome measurements were not clearly described.
Redelmeier et al. 1995105 Focused on a specific patient group.
Rehmani 2004106 Did not evaluate the effectiveness of an intervention.
Rinderer 1996107 Focused on identification but not evaluation of interventions.
Richardson 2002108 Not focused on the effectiveness of any intervention addressing EDOC.
Ross et al. 2001109 The study objective was not to address EDOC.
Rotstein et al. 2002110 The study was not conducted in a Western developed country.
Ryan et al. 1996111 Focused on a specific patient group.
Schneider et al. 2001112 Comparison of outcome measurements was not clear.

HTA Report #38 February 2006
50
Table B.1: Excluded studies (cont�d)
Study Reason for exclusion
Primary studies
Shaw & Lavelle 1998113 The study was conducted in a pediatric ED.
Simon et al. 1996114 The study was conducted in a pediatric ED.
Tran et al. 2002115 The study objective was not to address EDOC.
Washington et al. 20026 Focused on safety and health service utilization but no EDOC- related outcomes.
ED: emergency department; EDOC: emergency department overcrowding; SR: systematic review

HTA Report #38 February 2006
51
APPENDIX C: EFFECTIVENESS OF STRATEGIES TO REDUCE ED OVERCROWDING
Abbreviations for Appendix C A&E - accident and emergency
ACU - acute care unit
AD - ambulance diversion
CI - confidence interval
CQI - continuous quality improvement
BDP - best demonstrated processes
BUN - blood urea nitrogen
CG - control group
CI - confidence interval
CK-MB - creatine kinase isoenzyme MB
CQI � continuous quality improvement
ECG � electrocardiogram
ED � emergency department
EG � experimental group
EM - emergency medicine
EP - emergency physician
ESEP - Emergency Service Enhancement Program
FT - fast track
h - hour (s)
HITH - Hospital in the Home
ICU - intensive care unit
IDC - indwelling catheter
IMS - Internal Medicine Services
KPIs - key performance indicators
Lab - laboratory
LAMA - left against medical advice

HTA Report #38 February 2006
52
LOS - length of stay
LTC - long-term-care unit
LWBS - left without being seen
Min - minute(s)
mo - month(s)
no. - number
nss - not statistically significant
PEG - percutaneous endoscopic gastrostomy
POCT - point-of-care testing; patients: patients
RCT - randomized controlled trial
RMH - Royal Melbourne Hospital
RN - registered nurse
ssnr - statistical significance not reported
TAT - turnaround time
UA - unit assistant
UC - urgent care
Vs - versus
W - week(s)
WT - waiting time
yr - year(s)

HTA Report #38 February 2006
53
Table C.1: Evidence from primary studies
Study objective Setting/target population Strategy Outcome
ED staffing/reorganization
Sprivulis & Gerrard 200543
Australia
Pre- and post-intervention study
Objective: to determine whether an emergency management Internet portal developed to provide ambulance services with real-time access block and total ED occupancy, used in conjunction with pre-emptive distribution guidelines, would result in reduction in AD duration during periods of high access-block ED occupancy
Location: 8 public hospital EDs, 4 large inner metropolitan EDs, and 4 outer metropolitan EDs in Perth, Australia
ED annual visits: not available
Acuity of patients: lower-urgency patients
Inclusion: not available
Exclusion: not available
Intervention:
(1) Development of the ED system viewer to allow simultaneous visualization of near-real-time ED workload conditions in 8 EDs
(2) Distribution of lower-urgency patients away from EDs with high levels of admitted patient occupancy according to the pre-emptive ambulance distribution guidelines
Team involved: hospital management and emergency staff ambulance control centre staff
Period for comparison:
June 30, 2002 to Jan 4, 2003 vs June 29, 2003 to Jan 3, 2004
Ambulance attendances: Total: pre-: 33,352 vs post-intervention: 33,371 (nss)
Four large inner metropolitan EDs: decreased 2.7% (pre- 27,475 vs post-intervention: 26,743) (ssnr)
Four outer metropolitan EDs: increased 13% (pre-: 5877 vs post-intervention: 6628)(P < .001)
Mean weekly ED cubicle occupancy:
Pre-: 31 patients (95% CI 29 to 33) vs post-intervention: 39 patients (95% CI 36 to 43) (P < .001)
Ambulance diversion:
Episodes: pre-: 541 vs post-intervention: 349 (ssnr)
Total hours: pre-: 1788 vs post-intervention: 1138 (P < .001)
No. of triple diversion: pre-: 44 vs post-intervention: 40 (nss)
Ambulance unloading delays:
Total number of episodes: pre-: 219 (.66%) vs post-intervention: 223 (.67%) (nss)
Median duration: pre-: 38 min vs post-intervention: 50 min (P < .001)

HTA Report #38 February 2006
54
Table C.1: Evidence from primary studies (cont�d)
Study objective Setting/target population Strategy Outcome
ED staffing/reorganization
Miró et al. 20037
Spain
Pre- and post-intervention study
Objective: to assess if the ED reorganization improved patient flow and effectiveness, and reduced period of ED overcrowding
Location*: a tertiary teaching hospital in the inner city
ED annual visits*: 135,000 to 150,000
Acuity of patients: not available
Inclusion: not available
Exclusion: not available
*Dr. Ò Miró, personal communication, August 2004
Intervention: extensive structural and staff reorganization of the ED
(1) increasing the volume that the initial assessment area can manage (from 5 patients per hour to 8 patients per hour); (2) increasing capacity of observation and treatment area (from 25 to 41 beds); (3) changing staff�s
role: residents only work in the initial assessment area, one consultant was in charge in triage and initial assessment area, while the other was located in the treatment/observational area to take care of outcome and patient disposition.
Team involved: residents and consultant
Period for comparison:
Feb 10 to March 2, 1999 vs Feb 10 to March 2, 2000
No. of patients in waiting area:
Reduced by 57% (95% CI 37% to 77%, P < .001).
No. of patients in the initial assessment area: Reduced by 33% (95% CI 23% to 43%, P < .001).
No. of patients in treatment and observation area: Unchanged.
Admission & discharge: 20% decrease in admission (95% CI 7% to 33%, P < .01); proportion of patients discharged increased 35% (95% CI 16% to 54%, P= .001)(no data on re-admission rates or adverse outcome after discharge).
LWBS: No difference between both periods in proportions of patients who LWBS by a doctor or died in ED. No. of patients waiting: Decreased by 57% (95% CI 37% to 77%, P < .001, from 5.8 to 2.5 patients).
Waiting time to be seen**: Reduced by 73% (95% CI 51% to 95%, P < .001, from 87 to 24 min). Overcrowded period: There was a 74% (95% CI 48% to 102%, P < .01) and 69% (95% CI 46% to 92%, P < .001) reduction in overcrowded periods from a numerical and a functional point of view, respectively.
** Waiting time to be seen: calculated as the mean of WT of the 3 patients that were waiting to enter an initial assessment area cubicle for the longest times (i.e., those with the highest cumulative WT)

HTA Report #38 February 2006
55
Table C.1: Evidence from primary studies (cont�d)
Study objective Setting/target population Strategy Outcome
ED staffing/reorganization (cont�d)
Vilke et al. 200444
USA
Pre- and post-intervention study
Objective: to test the hypothesis that if one hospital could avoid ED diversion status, the need for diversion would be averted in the neighboring facility
Location: 2 urban teaching EDs (A and B)
ED annual visits: 45,000 and 39,000, respectively
Acuity of patients: not available
Inclusion: not available
Exclusion: not available
Intervention: ED A had secured additional resources and hospital-wide commitment for 1 wk, including expanding physician coverage several hours a day, and an additional nursing and technician shift each day. ED B remained on its standard staffing during the study period.
Team involved: physician, nurse, and technician
Period for comparison: 1 wk before vs 1 wk during, and 1 wk after the intervention
ED census:
Hospital A
Pre-: 882 vs during-: 936 vs post-intervention: 884 (nss)
Hospital B
Pre-: 714 vs during: 742 vs post-intervention: 781 (nss)
AD hours:
Hospital A Declined from 19.6 h at baseline to 1.4 h during the trial and returned to 39.4 h after the intervention (P < .05).
Hospital B Dropped from 27.7 h at baseline to 0 h during the trial and returned to 26.3 h after the intervention (P < .05).
Diverted patients:
Hospital A Declined from 19 at baseline to 2 during the trial and returned to 29 after the intervention (P < .05).
Hospital B Declined from 24 at baseline to 0 during the trial and increased to 9 after the intervention (P < .05).

HTA Report #38 February 2006
56
Table C.1: Evidence from primary studies (cont�d)
Study objective Setting/target population Strategy Outcome
Staffing/reorganization
Spaite et al. 200245
USA
Pre- and post-intervention study
Objective: to describe a rapid process redesign in a university-based ED to reduce waiting time intervals
Location: ED at University Medical Center
ED annual visits: 48,000
Acuity of patients: not available
Inclusion: not available
Exclusion: not available
Intervention: Process improvement changes including:
Staffing/internal process (decreased nursing ratio, rearranged nursing zone, addition of a new intermediate level zone, doubled UA and separated order processing from the communication process, increased EM resident staffing )
Redesign of triage-registration process (status board monitors in triage, brief triage and place patient immediately in room, in-room registration, doubled registration staff, two-way radios for communication between triage nurse, charge nurse, and registration staff)
Diagnostic radiology (electronic order entry, tripled ED radiology staffing, located new radiograph printer in ED, radiograph hung immediately, irrespective of whether old films available)
Laboratory (electronic order entry, bar-code labeling done in ED, bright visual cue for lab staff, ED lab samples take priority over all other lab samples)
Bed availability (ED-based nursing admit team)
Team involved: resident, nurse, UA staff, registration staff, and laboratory staff
Period for comparison: 3 mo pre- vs 1 mo post-intervention or 3 mo pre- vs 6 mo post-intervention
Median waiting room interval (time interval from triage to patient room): 3 mo pre-intervention: 31 min vs 1 mo post-intervention: 4 min for ED patients and 52 min vs 7 min for UC patients (ssnr).
Reduced 91% for ED patients and 90% for UC patients when compared 3 mo pre-intervention with 6 mo post-intervention (ssnr).
ED throughput interval (interval from triage to patient disposition): 3 mo pre-intervention: 4 h 21 min vs 1 mo post-intervention: 2 h 55 min for ED patients (ssnr), and 2 h 9 min vs 1 h 10 min for UC patients (ssnr).
Decreased by 27% for admitted patients, 31% for non-admitted patients, and 47% for UC patients when compared 3 mo pre-intervention with 6 mo post-intervention (ssnr).
No. of patients LWBS
Reduced 92% when compared 3 mo pre-intervention with 6 mo post-intervention (ssnr).
Patient satisfaction: Improved.

HTA Report #38 February 2006
57
Table C.1: Evidence from primary studies (cont�d)
Study objective Setting/target population Strategy Outcome
Staffing/reorganization (cont�d)
Green et al. 200546
USA
Pre- and post-intervention study
Objective: to evaluate the effectiveness of a queueing model in identifying provider staffing patterns to reduce the fraction of patients who LWBS
Location: an urban ED
ED annual visits: 25,000
Acuity of patients: not available
Inclusion: not available
Exclusion: not available
Intervention: changing entire weekly staffing schedule (ED physician or physician assistant hours) based on the results of the queueing analyses.
Team involved: ED physicians or physician assistants Period for comparison: 39 wks (August 26, 2002 to May 25, 2003) before vs 39 wks (September 1, 2003 to May 30, 2004)
ED visits: an increase of 1078 patient visits (6.3%) during post-intervention period
LWBS:
Full 7-day wk: 8.3% pre- vs 6.4% post-intervention (reduction of 22.9%)
Saturday to Tuesday: 9.2% pre- vs 7.2% post-intervention (reduction of 21.7%)
Weekdays: 8.9% pre- vs 5.8% post-intervention (reduction of 34.8%)
Weekend: 6.7% pre- vs 8.2% post-intervention (increase of 22.4%)

HTA Report #38 February 2006
58
Table C.1: Evidence from primary studies (cont�d)
Study objective Setting/target population Strategy Outcome
Staffing/reorganization (cont�d)
Moss et al. 200247
Australia
Pre- and post-intervention study
Objective: to evaluate the Care Coordination Team (CCT) service that was established to ensure that ED patients were provided with services to facilitate their return to, or maintenance in, the community
Location: a major metropolitan tertiary referral hospital
ED annual visits*: 45,000
Acuity of patients: not available
Inclusion: frail elderly, those living alone, the homeless, frequent ED visitors, and those with complex medical or drug and alcohol problems
Exclusion: not available
*Mrs C Flower, personal communication, August 2004.
Intervention: implementing a multidisciplinary CCT to prevent unnecessary admissions by utilizing community support. The care coordinators undertook a comprehensive discharge risk assessment of suitable patients. Priority is given first to patients for whom unnecessary or inappropriate admission could be prevented, and then to patients awaiting admission who require complex discharge planning. The risk assessment involves documentation of expected discharge date and destination, as well as existing services and supports, and includes prompatients for referral to internal and external health professionals.
Team involved: nursing and allied health personnel
Period for comparison: 12 mo pre- vs 12 mo post-intervention
Hospital admission: Pre-: 14217 patients (32.6%, 95% CI 32.2% to 33.0%) vs post-intervention: 13420 patients (30.9%, 95% CI 30.5% to 31.3%) (P< .001)
Re-presenting to ED: Pre-: 3856 patients (8.8%, 95% CI 8.6% to 9.1%) vs post-intervention: 3744 patients (8.6%, 95% CI 8.4% to 8.9%) (P = 0.28).
Satisfaction surveys:
Positive responses were received from ED staff, patients/caregivers, and community service providers. The majority of surveyed people stated that the CCT could be recommended to other EDs.

HTA Report #38 February 2006
59
Table C.1: Evidence from primary studies (cont�d)
Study objective Setting/target population Strategy Outcome
Staffing/reorganization (cont�d)
Partovi et al. 200135
USA
Non-randomized Comparative study
Objective: to determine whether faculty triage activities can shorten ED length of stay (LOS)
Location: urban county teaching hospital
ED annual visits: 52,000
Acuity of patients: medical/trauma level 1 (2.9%), medical/trauma level 2 (38.1%), medical/trauma level 3 (22.6%), routine level 4 (36.4%)
Inclusion: not available
Exclusion: not available
Intervention: adding a faculty member to ED triage to facilitate the triage process by rapidly evaluating and moving serious patients to patient care areas, ordering diagnostic tests and fluid hydration, discharging patients who had simple problems directly from triage, and encouraging rapid registration of new patients. Comparator: regular triage by 2 nurses and 1 emergency medical technician Team involved: ED faculty member Period for comparison: 16 consecutive Mondays from Aug. 2 to Nov 15, 1999, 8 Mondays with regular triage compared with 8 Mondays with addition of a faculty member to the regular triage
ED visits:
920 patients during intervention days vs 814 patients during regular days (ssnr)
ED LOS:
Mean 363 min with faculty triage vs 445 min without faculty triage (mean difference -82 min (95% CI: -111 to -54) (P = .005)
LWBS:
Mean 14.7% on days without faculty triage vs 7.9% on days with faculty triage (reduction of 46%, P = .068)

HTA Report #38 February 2006
60
Table C.1: Evidence from primary studies (cont�d)
Study objective Setting/target population Strategy Outcome
Staffing/reorganization (cont�d)
Donald et al. 200548
Australia
Pre- and post- intervention study
Retrospective
Objective: to assess the effect of having an emergency physician on-site at night in a rural base hospital in terms of ED LOS, waiting times, admissions, specialist consultations, the use of diagnostic tests, and ED revisit within 7 days
Location: a rural hospital (262 beds)
ED annual visits: 37,000
Acuity of patients: Triage category 2,3,4,5
Inclusion: not available Exclusion: patients with multi-trauma, which involves surgical registrar review, consultant call-back and radiographer call-back.
Intervention: an on-site emergency physician in the ED at night (from 22:30 pm to 8:00 am)
Team involved: emergency physicians Period for comparison: 7 days (January 28 to February 4, 2001) before vs 7 days ( January 28 to February 4, 2002) after the intervention
WT (min, median (25th to 75th percentile)) (the time between arrival and being seen by a doctor):
Pre-: 25 (7 to 97) v. post-intervention: 31 (12 to 101) (P = .33) ED LOS (min, median (25th to 75th percentile)) (the time between being seen by a doctor and disposition from the ED):
Pre-: 41 (28 to 118) vs post-intervention: 28 (15 to 54) (P = .0003)
For triage categories 2 & 3: pre-: 107 vs post-intervention: 59 (P < .0001)
For triage categories 4 & 5: pre-: 30 vs post-intervention: 22 (P < .0001)
ED return visit:
Scheduled: pre-: 7 vs post-intervention: 12 (P = .34)
Unscheduled: pre-: 2 vs post- intervention: 4 (P = .69)

HTA Report #38 February 2006
61
Table C.1: Evidence from primary studies (cont�d)
* Up to 20% of data on examination time and waiting times were missing in the protocols
Study objective Setting/target population Strategy Outcome
Staffing/reorganization (cont�d)
Bucheli & Martina 200449
Switzerland
Pre- and post-intervention study
Prospective
Objective: to determine whether additional physicians would reduce the ED LOS
Location: University hospital of Basel (1100 beds)
ED annual visits: 34,000
Acuity of patients: not available
Inclusion: all patients during the study period Exclusion: not available
Intervention: additional physicians during the evening shift (between 15:00 and 21:00 h)
Team involved: physicians
Period for comparison: 3 wks pre- vs 2 wks post-intervention
WT (min, mean ± SD) (from ED entry to the start of history taking and physical examination)*:
Pre-: 53 ± 66 (median 30) vs post- intervention: 28 ± 41 (median 15 for in- and outpatients between 15:00 and 21:00 h, P < .001) Duration of ED patient exam (min, mean ± SD)* (including history taking, physical exam, and first prescription by the EP):
Pre-: 22.0 ± 12.6 (median 20) vs post-intervention: 17.7 ± 13.4 (median 15) (P = .012) for outpatients
Pre-: 28.5 ± 12.9 (median 27.5) vs post- intervention: 22.0 ± 14.3 (median 20) (P = .003) for inpatients
ED LOS (min, mean ± SD) (from patient�s ED entry to
discharge from the ED triage division):
Pre-: 176±137 (median 140) vs post-intervention: 141±86
(median 120) (P = .012) for outpatients
Reduction in LOS in ED inpatients that were admitted for hospitalization did not reach a level of statistical significance.

HTA Report #38 February 2006
62
Table C.1: Evidence from primary studies (cont�d)
Study objective Setting/target population Strategy Outcome
Fast track
Cooke et al. 200250
UK
Pre- and post-intervention study
Objective: to assess whether a separate stream of minor injuries (�fast track�) care in an accident and emergency (A&E) department decreases the waiting time without delaying the care of those with more serious injuries
Location: a UK A&E department
ED annual visits*: 65,000
Acuity of patients: triage category 4 to 5**
Inclusion: patients with injuries not requiring an examination couch or an urgent intervention
Exclusion: not available
*Dr. M W Cooke, personal communication, August 2004 **Triage category Immediate 1 See within 10 min 2 See within 60 min 3 See within 120 min 4 See within 240 min 5
Intervention: Separate stream for non-urgent patients � fast track. One doctor was based in a desk-type consulting room and saw any ambulant patients with injuries not requiring an examination couch or an urgent intervention.
Team involved: a doctor
Period for comparison: 5 wk pre- vs 5 wk post-intervention
WT: The proportion of patients waiting less than 30 min and 60 min increased from 35.4% to 44.0% (P < .0001) and from 65.1% to 76.2% (P < .0001), respectively
Compared with the pre-intervention period, the relative risk of waiting more than 1 h fell by 54% during the first week of intervention and fell by 32% in the following 4 weeks.
Fernandes & Christenson 199561
Canada
Pre- and post-intervention study
Objective: to determine whether continuous quality improvement (CQI) could be used to minimize LOS for fast-track (FT) patients
Location: a tertiary care medical centre
ED annual visits: 50,000
Acuity of patients: non-urgent
Inclusion: not available
Exclusion: not available
Intervention: (1) An extra admitting clerk was provided for 8 h per day, 6 days a week; (2) the streamlined process for ambulatory patients (FT) was initiated, with elimination of unnecessary waits by reducing the nursing assessment to the recording of complete vital signs on all patients.
Team involved: an extra admitting clerk
Period for comparison: 2-day samples in July 1993 (before) vs 2-day sample in Jan 1994 (After-1) and 2-day sample in Feb 1994 (After-2)
ED LOS (time interval from triage contact to discharge from the ED): reduced from a mean of 163 170 min (before) to 115 86 (After-1) and 122 105 min (After-2) (P < .01 and P < .0001, respectively) for all patients. Chart generation (time interval from presentation to generation of a chart): reduced from 21 18 min (before) to 8 6 (After-1) (P < .0001)

HTA Report #38 February 2006
63
Table C.1: Evidence from primary studies (cont�d)
Study objective Setting/target population Strategy Outcome
Fast track (cont�d)
Fernandes et al. 199662
Canada
Pre- and post-intervention study
Objective: to demonstrate how CQI can identify rational and effective means to reduce LOS for minor illness/injury in an ED
Location: a tertiary care medical centre
ED annual visits: 54,000
Acuity of patients: non-urgent
Inclusion: all patients triaged to FT area who did not have a laboratory test, ECG, or an x-ray
Exclusion: patients who
- had incomplete charts,
- were hospitalized, - left the ED prior to completion of the workup.
Intervention:
Phase I: adding an extra admitting clerk (reported in a previous article, Fernandes & Christenson 199561)
Phase II: (1) expanded FT area to include more rooms and stretchers; (2) implemented a stricter, more detailed triage classification; (3) dedicated a nurse to the FT area whose previous responsibilities were poorly defined
Team involved: an FT nurse
Period for comparison: 2-day samples (before), two 2-day samples after phase I intervention (Sample-1 and Sample-2) vs 2-day sample after phase II intervention (Post-phase II)
ED LOS (time interval from triage contact to discharge from the ED):
Reduced significantly from a mean of 163 170 min (before) to 114 103 min after the intervention (Post-phase II) (P < .00001), from 115 86 min (Sample 1) to 114 103 min (Post-phase II) (P < .05), and from 122 min 80 min (Sample 2) to 114 103 min (Post-phase II) (P < .05) for all patients.
Fernandes et al. 199763
Canada
Pre- and post-intervention study
Objective: to determine whether the decreased LOS was associated with a concomitant decrease in the LWBS rate
Location: a tertiary care medical centre
ED annual visits: 55,000
Acuity of patients: non-urgent Inclusion*: all patients triaged to FT area who did not have a laboratory test, ECG, or an x-ray. Exclusion*: patients who - had incomplete charts, - were hospitalized, - left the ED prior to completion of the workup. * From Fernandes et al. 199662
Intervention:
(1) an extra admitting clerk
(2) streamlined FT process
(3) an expanded FT area
(4) a stricter, more detailed triage classification
(5) a nurse to the FT area
Team involved: an admitting clerk and an FT nurse
Period for comparison: 1 mo immediately before and after the intervention
ED LOS:
The median LOS for FT patients not requiring investigations decreased from 84 min to 46 min after the intervention (ssnr).
LWBS:
Proportion of LWBS to all patients significantly decreased from 2.4% to 1.1% after the intervention (P < .0001)
Proportion of urgent patients who LWBS to all urgent patients decreased from 1.6% to 0.8% after the intervention (P = .055)
Proportion of non-urgent patients who LWBS to all non-urgent patients decreased from 2.9% to 1.3% after the intervention (P < .001)

HTA Report #38 February 2006
64
Table C.1: Evidence from primary studies (cont�d)
Study objective Setting/target population Strategy Outcome
Observation unit/acute care unit
Kelen et al. 200151
USA
Pre- and post-intervention study
Objective: to determine the impact of an inpatient, ED-managed acute care unit (ACU) on ED overcrowding and the use of ambulance diversion
Location: a tertiary care academic hospital
ED annual visits: 54,000 in main ED and 18,000 in a separate pediatric emergency service annually Acuity of patients: acute
Inclusion: patients who required evaluation of management longer than 4 h
Exclusion not available
Intervention: a 14-bed monitored ACU with 3 additional procedure rooms, which was remote from the main ED and staffed by ED personnel
Team involved: emergency physician and midlevel provider (nurse practitioner, physician assistant) or resident
Period for comparison:
1) 1 year, 2 wk pre-intervention vs 10 wk post-intervention for LWBS
2) 6 wk pre- vs 8 wk post-intervention for AD
LWBS rate: 1 yr pre-intervention: 9.4%, 2 wk pre- intervention: 10.1% vs 10 wk post-intervention: 5.0 % (P < .05, respectively)
Frequency/duration of AD: 6 wk pre-intervention: a weekly mean 6.7 h (range 2.5 to 9.9h) per 100 patients vs 8 wk post-intervention: weekly mean of 2.8 h (range 1.9 to 4.1h) per 100 patients (P < .05)
Murray et al. 199952
Canada
RCT
Objective: to examine whether the careful introduction of POCT can result in reduced LOS in the ED
Location: a tertiary care teaching hospital
ED annual visits: 41,000
Acuity of patients: not available
Inclusion: patients seen in the ED who were suitable for POCT
Exclusion: eligible patients who were randomized while the POCT equipment was not working, or for whom the protocol was not adhered to in every respect, were excluded from the study.
Total number: 180 patients
EG: n = 93
CG: n = 87
Intervention: POCT for quantitative creatinine, sodium, potassium, chloride, total CO2, glucose, BUN, hematocrit, and qualitative CK-MB and myoglobin.
Comparator: central lab testing
Follow up: 5 mo
ED LOS (time from triage to disposition):
3 h, 28 min in EG vs 4 h, 22 min in CG (P = .02)

HTA Report #38 February 2006
65
Table C.1: Evidence from primary studies (cont�d)
Study objective Setting/target population Strategy Outcome
Access to diagnostic services (cont�d)
Lee-Lewandrowski et al. 20038
USA
Pre- and post-intervention study
Objective: to investigate the impact of a point-of-care testing (POCT) satellite
Location: a large university-associated urban ED
ED annual visits: 70,000
Acuity of patients: not available
Inclusion: patients who received glucose testing, urine dipstick, pregnancy testing, and cardiac markers
Exclusion: not available
Intervention: a POCT satellite laboratory located in the ED was staffed with a research nurse and laboratory technicians and was open from 8:00 am to 5:00 pm Monday through Friday. Team involved: a research nurse and laboratory technicians Period for comparison: before vs after the intervention (period not clear)
TAT (the time the sample was received in the central lab or in the ED lab until the results were posted in the hospital computer or called back to the care unit):
Except for whole-blood glucose, there was a substantial reduction in the average TAT for urinalysis, pregnancy testing, and cardiac markers. The decrease in lab TAT for all tests combined was significant (P = .02).
ED LOS (the time from registration in triage to the time of discharge or transport to the floor for admitted patients):
Overall, there was a trend toward decreased ED LOS during the POCT program, except for the patients who received rapid glucose testing.
Clinician/nurse satisfaction: There was a significant increase in satisfaction with the TAT (P < .001).

HTA Report #38 February 2006
66
Table C.1: Evidence from primary studies (cont�d)
Study objective Setting/target population Strategy Outcome
Access to diagnostic services
Cheung et al. 200210
Canada
Concurrent comparative study
Objective: to assess the efficacy of the Advance Triage system and its impact on patients� overall LOS
Location*: a community hospital
ED annual visits*: 40,000
Acuity of patients: not available
Inclusion: patients who met the established criteria for Advance Triage
Exclusion: not available
*Mrs W Cheung, personal communication, August 2004.
Intervention: the Advance Triage system involves the triage nurse�s
initiation of appropriate diagnostic tests for eligible patients based on an established set of protocols or algorithms. These diagnostic tests may be initiated by the triage nurse following triage assessment and are based on the patient�s chief complaint
and the triage nurse�s assessment of
the patient�s acuity and
appropriateness for Advance Triage. Team involved: nurse
Comparison: from a random sample of 250 ED patients, one group of patients who were Advance Triaged compared wiht the other group of patients who met the established criteria for Advance Triage but were triaged by the conventional method.
ED LOS:
For all patients There was a time saving of 46 min in total LOS in the ED and 73 min after the initial physician assessment (ssnr).
For emergent category There was a time saving of 40 min in total LOS in the ED and 62 min in the LOS after initial physician assessment (ssnr).
For urgent category There was a time saving of 74 min in total LOS in the ED and 89 min in the LOS after initial physician assessment (ssnr).
For non-urgent category There was a time saving of 10 min in total LOS in the ED and 60 min in the time from physician assessment to disposition (ssnr).

HTA Report #38 February 2006
67
Table C.1: Evidence form primary studies (cont�d)
Study objective Setting/target population Strategy Outcome
Inpatient beds
McConnell et al. 200553
USA
Pre- and post-intervention study
Objective: to determine the extent to which daily hours on ambulance diversion and patients� ED LOS
changes after an increase in ICU beds at the study hospital
Location: Level I trauma centre at an academic acute care hospital
ED annual visits: 42,000 Acuity of patients: not available
Inclusion: patients who visit the ED between Aug 7, 2001 and Aug 6, 2003
Exclusion: patients who
(1) were transferred into the ED or out of the ED to another hospital;
(2) LWBS by a physician or who LAMA;
(3) died in the ED;
(4) were admitted to the ED observation unit
Intervention: increased ICU capacity from 47 beds to 67 beds
Team involved: not applicable
Period for comparison: 12 mo before vs 12 mo after ICU expansion
ED LOS (min), unadjusted change (95% CI)*:
For adult patients admitted to ICU 90th percentile 523 pre vs 454 post, -69 (-125 to -10)�,
Mean 257 ± 203 pre vs 232 ± 177 post, -24.8 (-45.4 to -4.2)� For adult patients admitted to telemetry unit: 90th percentile 632 pre vs 567 post, -65 (-133.5 to �3.0)�
Mean 385 ± 208 pre vs 368 ± 165 post, -16.7 (-36.2 to 4.3) For adult patients admitted to ward: 90th percentile 650 pre vs 645 post, -5.0 (-40 to 28)
Mean 393 ± 216 pre vs 406 ± 205 post, 13.4 (1.0 to 25.6) For adult patients discharged home: 90th percentile 343 pre vs 354 post, 11.0 (5.0 to 17.0)�
Mean 186 ± 114 pre vs 193 ± 118 post,6.6 (4.3 to 8.9)
Time spent on AD (h/d); unadjusted change (95% CI)*:
Complete diversion: 90th percentile 3.2 pre vs 0.3 post, -5.5 (-8.2 to -2.8)� Mean 0.9 ± 2.8 pre vs 0.2±1.0 post, -2.4 (-3.3 to -1.7 )�
Critical care diversion: 90th percentile 10.4 pre vs 4.9 post, -9.3 (-13.4- to -5.8)� Mean 3.8 ± 5.4 pre vs 1.4± 2.5 post, -4.3 (-5.8 to -2.7)�
Trauma diversion: 90th percentile 22.1 pre vs 12.8 post, -2.9 (-4.7 to -0.8)�
Mean 7.1 ± 8.7 pre vs 2.8± 6.1 post, -0.7 (-1.2 to -0.3)�
* Results based on adjusted ED volumes were relatively close to the unadjusted average. Adjust for ED volume and other variables showed larger reduction in ED LOS for patients admitted to ICU and telemetry units, larger increase in ED LOS for patients discharged home, larger reduction in AD time (all categories), and no significant changes in ED LOS for patients admitted to ward units. � The change was statistically significant. Definition: ED LOS: from check-in at triage to disposition, that is, either admission to the hospital or discharge home; Complete AD: as a request by the hospital that all patients transported by ambulance be diverted to other community hospitals, except for that small designated subset of patients deemed too critical to be diverted (e.g., patients in cardiac arrest, patients with an impaired airway, non-injured patients too unstable to transport to another facility, patients refusing alternate facilities, obstetrics patients, prearranged inter-facility transfers); Critical care diversion: as a request to divert any ambulance transporting a pt who might require admission to an ICU; Trauma diversion: when the trauma centre has exceeded its capacity to manage trauma patients (because of insufficient personnel, equipment, surgical ICU beds, or other resources) and must divert to another regional trauma hospital

HTA Report #38 February 2006
68
Table C.1: Evidence from primary studies (cont�d)
Study objective Setting/target population Strategy Outcome
Inpatient beds
Dunn 200354
Australia
Pre- and post-intervention study
Objective: to determine if changes in hospital occupancy would affect ED occupancy and ED waiting time performance
Location: a public tertiary teaching hospital
ED annual visits: 36,000
Acuity of patients: not available
Inclusion: not available
Exclusion: not available
Intervention: reduction of hospital occupancy during the period of industrial action Team involved: not available
Period for comparison: 13 days during the intervention compared with 13 days prior and 13 days after the intervention. 8 days separated the study period from each of the comparison periods.
Hospital occupancy: Compared with the control period, mean hospital occupancy decreased from 94.9% to 89.0% (P < .001)
ED occupancy: Mean ED occupancy decreased from 19.1 to 14.8 patients (P < .001).
ED waiting time: Mean ED waiting time decreased from 58.5 to 37.1 min (P < .001).
Hemphill & Nole 200555
USA
Pre- and post-intervention study
Objective: not clearly stated
Location: a large tertiary care hospital and trauma centre, serves as a regional referral centre (700 beds)
ED annual visits: not available
Acuity of patients: not available
Inclusion: not available
Exclusion: not available
Intervention:
(1) Developing an Access Centre to handle the triage function as well as all unscheduled admissions. The Access Centre operates 24 h a day, 7 days a wk, and is staffed by 2 RNs during the day, 4 RNs on the PM shift and weekends, and 3 RNs on the night shifts.
(2) Identifying service line capacity using bed status color codes placed on the hospital intranet
(3) Adding a bed management coordinator who focuses entirely on the admission and discharge of patients
(4) Expediting bed assignments and minimizing ED diversionary status Team involved: registered nurses
Period for comparison: January to June, 2003 vs January to June, 2004
AD hours
Pre-: 385 h vs post-intervention: 141 h (reduction of 63%)(ssnr)

HTA Report #38 February 2006
69
Table C.1: Evidence from primary studies (cont�d)
Study objective Setting/target population Strategy Outcome
Inpatient beds
Burns et al. 200556
Australia
Pre- and post-intervention study
Objective: to assess the value of cusum analysis in hospital bed management
Location: an urban teaching hospital with 700 hospital beds in Brisbane, Australia
ED annual visits: 70,000
Acuity of patients: not available
Inclusion: not available
Exclusion: not available
Intervention:
A rigorous search for alternatives to admission by both ED and Internal Medicine Services (IMS) medical staff
Integrated daily multidisciplinary case review within IMS
Specific review of patients who had a prolonged LOS
Team involved: ED and IMS medical staff
Period for comparison:
March to August 2002 (pre-) vs March to August 2003 (post-intervention)
ED visits: statistically significant increase in the number of patients presenting to the ED
% of ED patients waiting more than 8 h for admission:
Pre-: 4.3 2.8 vs post-intervention: 6.4 4.2 (P = .002)

HTA Report #38 February 2006
70
Table C.1: Evidence from primary studies (cont�d)
Study objective Setting/target population Strategy Outcome
System-wide interventions
Cardin et al. 200357*
Canada
Pre- and post-intervention study
Objective: to evaluate the effect of a multifaceted intervention to decrease ED overcrowding on the quality of care provided to patients in the ED and hospital wards, as measured by the incidence of return visits after discharge
Location: a tertiary care adult hospital affiliated with McGill University in Montreal, Canada.
ED annual visits: 50,000
Acuity of patients: not available
Inclusion: patients discharged from ED or inpatient hospital wards
Exclusion: patients who - were discharged from obstetrics or neonatology wards; - died in the hospital at the initial visit; - transferred to other acute care hospitals or to the hospital long-term-care (LTC) unit; - discharged from the hospital LTC unit, or with an index hospitalization of longer than 60 days; - were already sampled during the same period
Intervention: a system-wide multifaceted intervention, including increased emergency physician coverage, the designation of physician coordinators, and new hospital policies regarding laboratory, consultation, and admission procedures
Team involved: not available
Period for comparison: 28 days during 12 mo (every 13th day between Aug 2, 1992 and Aug 1, 1993) pre- vs 28 corresponding days during 12 mo (Oct 17, 1993 and Oct 16, 1994) post- intervention.
All return visit (a visit to the ED or a direct hospitalization within 7 days of discharge):
Pre-: 11.0% vs post-intervention 12.4% (95% CI on difference: -1.5% to 4.3%) (nss)
Unscheduled visit (no indication in the chart that the pt was told to come back to the ED of the hospital on a special date):
Pre-: 6.8% vs post-intervention 6.9% (95% CI on difference: -2.2% to 2.4%) (nss)
Unscheduled-related visit (related visit defined as the presenting complaint or the principal diagnosis was the same as, or a consequence of the patient�s medical condition or any
intervention initiated at the index visit):
Pre-: 6.5% vs post-intervention 5.8% (95% CI on difference: -2.8% to1.6%)(nss)
* The results on rate of stretcher occupancy and ED LOS were reported previously in a French language article.65

HTA Report #38 February 2006
71
Table C.1: Evidence from primary studies (cont�d)
Study objective Setting/target population Strategy Outcome
System-wide interventions (cont�d)
Cameron et al. 200258 Australia
Pre- and post-intervention study
Objective: to conduct an observational study to reduce access block for emergency patients while maintaining elective throughput
Location: Melbourne Health consists of acute care hospital, rehabilitation centre, laboratory service, dialysis, and Mental Health service.
ED annual visits: not available
Acuity of patients: not available
Inclusion: not available
Exclusion: not available
Intervention: organizational changes including 51 actions to improve patient access from 4 areas:
(1) Emergency demand management (short stay unit, establish dressing clinic transit lounge/plastics ward, additional clerical and medical staff ED, PEG tubes /IDC insertion in community, ED bed card HITH, HITH in nursing home, hospital policy on direct admits to ward, streamline ED to inpatient referrals, determine RMH boundary line for primary referrals, review timelines and establish KPIs for psychiatric review and radiological procedures in ED, additional ICU beds, review bed management function, emergency review clinic in outpatients for each specialty, increase care coordination function in ED.
(2) Elective surgery;
(3) Capacity management;
(4) Subacute processes Team involved: senior clinicians
Period for comparison: 3 mo before vs 3 mo after the intervention
Ambulance diversion: Reduced by more than 50% (ssnr).
No. of patients waiting 12 h: Reduced by 40% for admitted patients (ssnr).
Elective throughput:
Maintained despite a significant decrease in staffed multi-day beds in the hospital.

HTA Report #38 February 2006
72
Table C.1: Evidence from primary studies (cont�d)
Study objective Setting/target population Strategy Outcome
System-wide interventions (cont�d)
Cameron et al. 199959 Australia
Pre- and post-intervention study
Objective: to review and analyze the system effects of the Emergency Service Enhancement Program (ESEP): bonus payments made to public hospitals to improve access to care for patients attending EDs
Location: 21 public hospital EDs in Victoria, Australia
ED annual visits: 700,000
Acuity of patients: *category 1, 2, 3
Inclusion: *category 1, 2, 3 patients
Exclusion: *category 4, 5 patients
*Category 1: resuscitation
Category 2: emergency
Category 3: urgent
Category 4: semi-urgent
Category 5: non-urgent
Intervention: introduction of bonus payment system � ESEP.
Starting in 1995, a bonus payment is made to each hospital at the beginning of the financial year. The bonus pool consisted initially of $7.2 million per year and increased to $17 million for 1997 to 1998. Some of the funds are directed to improving the ED and resources for bed management. The bonus payment can be reduced or lost if the targets for access block, AD, or WT are not met. Team involved: not applicable
Period for comparison: 1 yr pre- vs 2 yr post-intervention
ED visits:
Increased from 23% to 31% for category 1, 2, 3 patients
AD:
The number of occasions of bypass across the 21 hospitals decreased from over 600 per quarter in 1994 to less than 100 in 1997 (P < .001, R2 = 0.53)
WT: For category 1 patients: Zero WT was considerably achieved. For category 2 patients: The proportion of patients receiving attention within the threshold time improved significantly (P < .001, R2 = 0.74). For category 3 patients: The proportion of patients receiving attention within the threshold time improved significantly (P = .035, R2 = 0.37).
No. of patients waiting 12 h in EDs for inpatient beds:
Decreased since the introduction of the ESEP (nss) (p=.3, R2 = 0.1).
The last 6 mo of 1997 showed a marked increase in 12-h stays.

HTA Report #38 February 2006
73
Table C.1: Evidence from primary studies (cont�d)
Study objective Setting/target population Strategy Outcome
System-wide interventions
Hoffenberg et al. 200160 USA
Pre- and post-intervention study
Objective: to assess the ability of the best demonstrated processes (BDP) methodology to decrease ED patient LOS in EDs in a large multi-hospital system
Location: 291 Healthcare Company hospital EDs
ED annual visits: not available
Acuity of patients: not available
Inclusion: not available
Exclusion: not available
Intervention: using the BDP approach to identify meaningful process differences between the best-performing EDs and the worst-performing EDs and share those processes of the better-performing EDs with all participating EDs
Team involved: physicians, nurses, clerical personnel, and outside consultant Period for comparison: pre- vs 19 mo post-intervention
ED visits: not available ED LOS (mean, in min):
For all EDs:
Pre-: 147 vs post-intervention: 139 (ssnr)
For the slowest third:
Pre: 186 vs post-intervention: 157 (ssnr)
Time interval from arrival to examination room (mean, in min): For all EDs:
Pre-: 27 vs post-intervention: 22 (P < .001)
For the slowest one third:
Pre-: 37 vs post-intervention: 24 (P < .001)
Time interval from examination room to physician evaluation (mean, in min):
For all EDs:
Pre-: 20 vs post-intervention: 18 (P < .001)
For the slowest one third:
Pre-: 25 vs post-intervention: 20 (P < .001)
Time interval from physician evaluation to discharge (mean, in min):
For all EDs:
Pre-: 100 vs post-intervention: 99 (P = .33)
For the slowest one third:
Pre-: 124 vs post-intervention: 113 (P < .001)

HTA Report #38 February 2006
74
APPENDIX D: INTERVENTIONS IN AN AUSTRALIAN STUDY58 Emergency demand management
Short stay unit
Establish dressing clinic transit lounge/plastics ward
Additional clerical and medical staff ED
PEG tubes/Indwelling Catheter (IDC) insertion in community
ED bed card HITH
HITH in nursing home
Hospital policy on direct admits to ward
Streamline ED to inpatient referrals
Determine Royal Melbourne Hospital (RMH) boundary line for primary referrals
Review timelines and establish KPIs for psychiatric review and radiological procedures in ED
Additional ICU beds
Review bed management function
Emergency review clinic in outpatients for each specialty
Increase care coordination function in ED
Elective surgery
10-12 orthopedic quarantined elective beds (25% of orthopedic beds)
Increase use of day beds in plastics, radiology
Increase emergency theatre availability
Recovery � two extra boys� KPIs regarding collection of patients from wards
Equipment inventory
Increase day of surgery admissions (DOSA) to >85%
Review theatre utilization
Review delays in theatre set up
Review theatre mix and start times
Review theatre scheduling
Seasonalize demand
Review elective/emergency mix
Review preadmission clinic process

HTA Report #38 February 2006
75
Central elective waiting list
Capacity management
Day beds � neurology ward
Discharge coordinators for ward
Improved Allied Health cover
Mixed/direct HITH (utilization, efficacy)
Review scope for expansion
GP liaison officer to coordinate discharge and support admission substantiation by GPs
Length-of-stay project (studying reasons for long inpatient stays)
Disease management project (studying CCF and COAD case mix strategies)
Frequent flier package (studying reasons for frequent representations)
Workforce planning review
Review outpatient structure/booking system
Review waiting times for ultrasound, MRI, CT scan
Subacute processes
Orthopaedic rehabilitation unit within orthopaedic ward
Integrated medical staffing across acute/subacute
Tracheostomy unit/service to coordinate management plan
Establish KPIs for time from referral to assessment
PEG management team
ACRRAT Project � electronic referral and assessment software to overcome process blockages between RMH and Aged/Rehab facility
Standby system for transfer of subacute patients from RMH to Aged/Rehab facility
Establish dialysis rehabilitation unit Aged/Rehab facility
Suspended
Develop policy around admission of in-region patients only
Increased subacute capacity:
Additional beds for aged care
Additional home rehabilitation beds
In-home transition packages
Subacute precinct RMH

HTA Report #38 February 2006
76
APPENDIX E: GUIDELINES/POSITION STATEMENT
In 2000, the CAEP and NENA25 recommended the following strategies:
Primary solutions
Provincial Ministries of Health should link hospital funding to promote admission of emergency patients to hospital.
Provincial waiting time standards for admitted patients in the ED would need to be developed and enforced.
Hospitals may need to open �swing beds� or expand their permanent bed complement to meet waiting time standards.
Secondary solutions
Implementation of Canadian Triage and Acuity Scale (CTAS) in all Canadian EDs.
Implementation of computer databases so that ED managers can analyze visit volumes, acuity profiles, admission rates, waiting times and length of stay. Implement real time Emergency Department Information System in all EDs, so that nurses and physicians can use computerized data to help patients through their ED stay more efficiently.
Link current efforts in Primary Care Reform to ED overcrowding. ED waiting times should be a measure of the success of a primary care initiative. For example, 24-hour, seven-day managed access to services was emphasized in the recently released new agreement among Alberta Health, the Alberta Medical Association, and Regional Health Authorities.
Development of pilot projects in innovative ED care, including rapid diagnostic units, use of a nurse practitioner, bedside registration, point-of-care testing, and linkage to community health centres.
Increase access to immediate diagnostic testing to improve patient flow.
Expansion of long-term care facilities to reduce the number of patients in hospital awaiting placement.
Development of innovative home care models to safely discharge patients from the ED and hospital.
Expand available training and education programs for emergency physicians and nurses.
Create research funding opportunities for ED physicians and nurses to study the issue of overcrowding in a scientifically valid and timely fashion.

HTA Report #38 February 2006
77
Develop programs by which the public can be informed about current healthcare system issues, so that they can understand which services can be reasonably expected from the ED.
The 2003 CAEP/NENA joint position statement15 identified a number of potential strategies to deal with ED overcrowding:
Control input wherever possible
Create regional or provincial bed access management to ensure that inter-hospital transfers are directed to hospitals that have the capacity to manage the patient requiring transfer;
Develop pre-hospital care policies to divert Level II and III patients to appropriate nearby hospitals during periods of severe overcrowding;
Avoid unnecessary admissions;
Support ED-based programs that reduce the need for hospitalization;
Create 12- to 24-hour rapid diagnosis and treatment units that aggressively investigate, treat, and discharge patients who would, in the past, have been admitted to hospital. These units may be based in EDs;
Increase ED access to diagnostic tests when these tests preclude the need for inpatient investigation;
Assign a discharge coordinator for the ED;
Establish multidisciplinary ED-based rapid response teams to coordinate community supports and enable discharge of patients who will not benefit from hospitalization;
Nurture closer liaisons with primary care providers to assist with patient disposition;
Develop information systems to facilitate the transfer of valuable patient information from the community to the ED and from the ED to the community;
Enhance the flow of sick patients from the ED to the ward;
Assign top priority to emergency admissions;
Distribute supernumerary (i.e., hallway) patients equally between all wards, including the ED;
Institute �daily quota� beds;
Designate �flex beds� that can be used by different services on the basis of daily needs;
Establish �admission units� during peak daytime hours;

HTA Report #38 February 2006
78
Allow direct admission to the floor for stable patients being transferred from another facility when a bed is open on the floor;
Invoke a �30-minute rule� for transfer to the floor when a bed is assigned;
Automatically assign patients to �off-service beds� when defined ED thresholds are reached;
Establish acceptable consultation time frames to avoid disposition and treatment delays;
Electronically capture key process times, including time to ED stretcher, time to physician, time to disposition decision, consultation delay, LOS, or admitted and discharged patients; and
Identify and open over-census beds when specified ED thresholds are surpassed.
Optimize inpatient acute care LOS
Assign a utilization coordinator for the hospital;
Ensure there is a Most Responsible Physician accountable for every admission;
Identify LOS benchmarks for key case-mix groups, establish LOS targets, and measure performance;
Estimate expected LOS for patients at the time of admission;
Begin discharge planning at the time of admission. This includes a discharge notification process;
Electronically monitor key discharge processes, including time from discharge to bed availability and time from bed availability to transfer;
Provide alternate levels of care (ALC) for ALC patients;
Lobby for appropriate availability and utilization of community subacute and alternative level of care beds;
Move patients who are �just waiting� out of hospital areas that are staffed for acute care;
Designate a discharge lounge and suitable waiting areas; and
Match care provided to care required.
HTA Report #38 February 2006
79
REFERENCES
1. Australian College for Emergency Medicine. Policy document - standard terminology. Available from: http://www.medeserv.com.au/acem/open/ documents/standard.pdf (accessed 2005 Jul 19)
2. Saunders D, Alibahai A, Alberta Services for Health Services Research Utilization. Understanding emergency department pressures in Capital Health: preliminary findings, 2001. Available from: http://www.health.gov.ab.ca/key/research/ 07_Report.pdf.
3. United States General Accounting Office. Hospital emergency departments. Crowded conditions vary among hospitals and communities. Washington: US General Accounting Office; 2003. Report No. GAO-03-460.
4. New Zealand Health Technology Assessment. Emergency department attendance. A critical appraisal of the key literature. New Zealand Health Technology Assessment (NZHTA), editor. Christchurch, New Zealand: The Clearing House for Health Outcomes and Health Technology Assessment, 1998; Report No. 8.
5. Canadian Institute for Health Information. Understanding emergency department wait times. Who is using emergency departments and how long are they waiting? Canadian Institute for Health Information, editor. Ottawa, ON: Canadian Institute for Health Information; 2005.
6. Washington DL, Stevens CD, Shekelle PG, Henneman PL, Brook RH. Next-day care for emergency department users with nonacute conditions. A randomized, controlled trial. Annals of Internal Medicine 2002;137(9):707-14.
7. Miró Ò, Sanchez M, Espinosa G, Coll-Vinent B, Bragulat E, Milla J. Analysis of patient flow in the emergency department and the effect of an extensive reorganisation. Emergency Medicine Journal 2003;20(2):143-8.
8. Lee-Lewandrowski E, Corboy D, Lewandrowski K, Sinclair J, McDermot S, Benzer TI. Implementation of a point-of-care satellite laboratory in the emergency department of an academic medical center: Impact on test turnaround time and patient emergency department length of stay. Archives of Pathology & Laboratory Medicine 2003;127(4):456-60.
9. Beveridge R, Clarke B, Janes L, Savage N, Thompson J, Dodd G, et al. Canadian ED Triage & Acuity Scale, 1998. Report No. CTAS16.DOC.
10. Cheung WW, Heeney L, Pound JL. An advance triage system. Accident and Emergency Nursing 2002;10(1):10-6.
11. Knapp JF, Bojko T, Dolan MA, Frush KS, Furnival RA, Isaacman DJ, et al. Overcrowding crisis in our nation's emergency departments: Is our safety net unraveling? Pediatrics 2004;114(3):878-88.

HTA Report #38 February 2006
80
12. Weiss SJ, Arndahl J, Ernst AA, Derlet R, Richards J, Nick TG. Development of a site sampling form for evaluation of ED overcrowding. Medical Science Monitor 2002;8(8):CR549-CR553.
13. Schull MJ, Szalai JP, Schwartz B, Redelmeier DA. Emergency department overcrowding following systematic hospital restructuring: trends at twenty hospitals over ten years. Academic Emergency Medicine 2001;8(11):1037-43.
14. Sedlak SK, Roberts A. Implementation of best practices to reduce overall emergency department length of stay. Topics in Emergency Medicine 2004;2004 OctDec; 26(4):312-21.
15. Canadian Association of Emergency Physicians (CAEP) and the National Emergency Nurses Affiliation (NENA). Access to acute care in the setting of emergency department overcrowding, 2003. Available from: http://www.caep.ca/002.policies/002-01.guidelines/.
16. Crowding Resources Task Force, American College of Emergency Physicians. Responding to emergency department crowding: A guidebook for chapters. American College of Emergency Physicians, editor. American College of Emergency Physicians; 2002.
17. Weiss SJ, Derlet R, Arndahl J, Ernst AA, Richards J, Fernandez-Frackelton M, et al. Estimating the degree of emergency department overcrowding in academic medical centers: results of the National ED Overcrowding Study (NEDOCS). Academic Emergency Medicine 2004;11(1):38-50.
18. Canadian Association of Emergency Physicians (CAEP). Submission to the Commission on the Future of Health Care in Canada. The case for national standards for hospital emergency services. Available from: http://www.caep.ca/002.policies/ 002-04.romanow-07.htm (accessed 2003 Dec 5).
19. Noseworthy SB. Emergency department overcrowding: waiting for disaster. Outlook 2004;2004 Spring; 27(1):12-7.
20. Velianoff GD. Overcrowding and diversion in the emergency department: the health care safety net unravels. Nursing Clinics of North America 2002;37(1):59-66, vi.
21. Derlet R, Richards J, Kravitz R. Frequent overcrowding in U.S. emergency departments. Academic Emergency Medicine 2001;8(2):151-5.
22. Eckstein M, Isaacs SM, Slovis CM, Kaufman BJ, Loflin JR, O'Connor RE, et al. Facilitating EMS turnaround intervals at hospitals in the face of receiving facility overcrowding. Prehospital Emergency Care 2005;9(3):267-75.
23. Australasian College for Emergency Medicine. Access block and overcrowding in emergency departments. Australasian College for Emergency Medicine, editor.

HTA Report #38 February 2006
81
West Melbourne, Australia: Australasian College for Emergency Medicine; 2004. Available from: http://www.acem.org.au/media/access_Block1.pdf.
24. Minister of Justice and Attorney General, Alberta. In the matter of a public inquiry into the death of Vincenzo Dominic Motta Pursuant to the fatality inquiries Act. Calgary AB: publisher; 2003. Report 2003.
25. Canadian Association of Emergency Physicians (CAEP) and National Emergency Nurses Affiliation (NENA). Position statement - Emergency department overcrowding, 2000. Available from: www.caep.ca/002.policies/002-01.guidelines/overcrowding.htm.
26. Schafermeyer RW, Asplin BR. Hospital and emergency department crowding in the United States. Emergency Medicine 2003;15(1):22-7.
27. Rondeau KV, Francescutti LH. Emergency department overcrowding: the impact of resource scarcity on physician job satisfaction... including commentary by Zandardelli JJ. Journal of Healthcare Management 2005 Sep-Oct; 50(5):327-42.
28. Derlet RW, Richards JR. Overcrowding in the nation's emergency departments: complex causes and disturbing effects. Annals of Emergency Medicine 2000;35(1):63-8.
29. Afilalo M, Guttman A, Colacone A, Dankoff J, Tselios C, Beaudet M, et al. Emergency department use and misuse. Journal of Emergency Medicine 1995;13(2):259-64.
30. Wienick R, Billings J, Burstin H. What is the role of primary care in emergency department overcrowding? Wienick R, Billings J, Burstin H, editors. Report 2004.
31. Fatovich DM, Nagree Y, Sprivulis P. Access block causes emergency department overcrowding and ambulance diversion in Perth, Western Australia. Emergency Medical Journal 2005;22(5):351-4.
32. Bullard M, Holroyd B, Craig W, Klassen T, Yiannakoulias N, Johnson D. Patients who leave without being seen in the emergency department. Canadian Journal of Emergency Medicine 2001;3;136.
33. Fernandes CM, Daya MR, Barry S, Palmer N. Emergency department patients who leave without seeing a physician: the Toronto Hospital experience. Annals of Emergency Medicine 1994;24(6):1092-6.
34. Anderson P. Building on success. Academic emergency department leverages clinical automation to reduce overcrowding, streamline workflow and enhance revenue. Health Management Technology 2005;26(5):32-4.
35. Partovi SN, Nelson BK, Bryan ED, Walsh MJ. Faculty triage shortens emergency department length of stay. Academic Emergency Medicine 2001;8(10):990-5.

HTA Report #38 February 2006
82
36. Baker DW, Stevens CD, Brook RH. Patients who leave a public hospital emergency department without being seen by a physician. Causes and consequences. Journal of the American Medical Association 1991;266(8):1085-90.
37. Rowe BH, Channan P, Bullard M AA, Saunders LD. Reasons why patients leave without being seen from the emergency department. Academic Emergency Medicine 2003;10;513.
38. Schull MJ, Vermeulen M, Slaughter G, Morrison L, Daly P. Emergency department crowding and thrombolysis delays in acute myocardial infarction. Annals of Emergency Medicine 2004;44(6):577-85.
39. Asplin BR. Does ambulance diversion matter? Annals of Emergency Medicine 2003;41(4):477-80.
40. Asplin BR, Magid DJ, Rhodes KV, Solberg LI, Lurie N, Camargo CA, Jr. A conceptual model of emergency department crowding. Annals of Emergency Medicine 2003;42(2):173-80.
41. Schull MJ, Slaughter PM, Redelmeier DA. Urban emergency department overcrowding: defining the problem and eliminating misconceptions. Canadian Journal of Emergency Medicine 2002;4(2):76-83.
42. Cooke M, Fisher J, Dale J, McLeod E, Szczepura A, Walley P, et al. Reducing attendances and waits in emergency departments. A systematic review of present innovations. A report to the National Co-ordinating Centre for NHS Service Delivery and Organisation R & D (NCCSDO); London, UK; 2004. Available from: http://www.sdo.lshtm.ac.uk/pdf/evalmodels_cooks_final.pdf.
43. Sprivulis P, Gerrard B. Internet-accessible emergency department workload information reduces ambulance diversion. Prehospital Emergency Care 2005;9(3):285-91.
44. Vilke GM, Brown L, Skogland P, Simmons C, Guss DA. Approach to decreasing emergency department ambulance diversion hours. Journal of Emergency Medicine 2004;26(2):189-92.
45. Spaite DW, Bartholomeaux F, Guisto J, Lindberg E, Hull B, Eyherabide A, et al. Rapid process redesign in a university-based emergency department: decreasing waiting time intervals and improving patient satisfaction. Annals of Emergency Medicine 2002;39(2):168-77.
46. Green LV, Soares J, Giglio JF, Green RA. Using queueing theory to increase the effectiveness of emergency department provider staffing. Academic Emergency Medicine 2005;13(1):61-8.

HTA Report #38 February 2006
83
47. Moss JE, Flower CL, Houghton LM, Moss DL, Nielsen DA, Taylor DM. A multidisciplinary Care Coordination Team improves emergency department discharge planning practice. Medical Journal of Australia 2002;177(8):435-9.
48. Donald KJ, Smith AN, Doherty S, Sundararajan V. Effect of an on-site emergency physician in a rural emergency department at night. Rural Remote Health 2005;5(3):380.
49. Bucheli B, Martina B. Reduced length of stay in medical emergency department patients: a prospective controlled study on emergency physician staffing. European Journal of Emergency Medicine 2004;11(1):29-34.
50. Cooke MW, Wilson S, Pearson S. The effect of a separate stream for minor injuries on accident and emergency department waiting times. Emergency Medicine Journal 2002;19(1):28-30.
51. Kelen GD, Scheulen JJ, Hill PM. Effect of an emergency department (ED) managed acute care unit on ED overcrowding and emergency medical services diversion. Academic Emergency Medicine 2001;8(11):1095-100.
52. Murray RP, Leroux M, Sabga E, Palatnick W, Ludwig L. Effect of point of care testing on length of stay in an adult emergency department. Journal of Emergency Medicine 1999;17(5):811-4.
53. McConnell KJ, Richards CF, Daya M, Bernell SL, Weathers CC, Lowe RA. Effect of increased ICU capacity on emergency department length of stay and ambulance diversion. Annals of Emergency Medicine 2005;45(5):471-8.
54. Dunn R. Reduced access block causes shorter emergency department waiting times: A historical control observational study. Emergency Medicine 2003;15(3):232-8.
55. Hemphill R, Nole B. Relieving an overcrowded ED and increasing capacity for regional transfers: one hospital's bed management strategies. Journal of Emergency Nursing 2005;31(3):243-6.
56. Burns CM, Bennett CJ, Myers CT, Ward M. The use of cusum analysis in the early detection and management of hospital bed occupancy crises. Medical Journal of Australia 2005;183(6):291-4.
57. Cardin S, Afilalo M, Lang E, Collet JP, Colacone A, Tselios C, et al. Intervention to decrease emergency department crowding: does it have an effect on return visits and hospital readmissions? Annals of Emergency Medicine 2003;41(2):173-85.
58. Cameron P, Scown P, Campbell D. Managing access block. Australian Health Review 2002;25(4):59-68.

HTA Report #38 February 2006
84
59. Cameron PA, Kennedy MP, McNeil JJ. The effects of bonus payments on emergency service performance in Victoria. Medical Journal of Australia 1999;171(5):243-6.
60. Hoffenberg S, Hill MB, Houry D. Does sharing process differences reduce patient length of stay in the emergency department? Academic Emergency Medicine 2001;38(5):533-40.
61. Fernandes CM, Christenson JM. Use of continuous quality improvement to facilitate patient flow through the triage and fast-track areas of an emergency department. Journal of Emergency Medicine 1995;13(6):847-55.
62. Fernandes CM, Christenson JM, Price A. Continuous quality improvement reduces length of stay for fast-track patients in an emergency department. Academic Emergency Medicine 1996;3(3):258-63.
63. Fernandes CM, Price A, Christenson JM. Does reduced length of stay decrease the number of emergency department patients who leave without seeing a physician? Journal of Emergency Medicine 1997;15(3):397-9.
64. Diesburg-Stanwood A, Scott J, Oman K, Whitehill C. Nonemergent ED patients referred to community resources after medical screening examination: characteristics, medical condition after 72 hours, and use of follow-up services. Journal of Emergency Nursing 2004;30(4):312-7.
65. Grandjean P. Depuis un an, I'urgence de I'Hôpital Général Juif n'est plus congestionnée. L'actualité Médicale 1994;15(42):6.
66. Estey A, Ness K, Saunders LD, Alibhai A, Bear RA. Understanding the causes of overcrowding in emergency departments in the Capital Health Region in Alberta: a focus group study. Canadian Journal of Emergency Medical Care 1981;5(2):87-94.
67. Alberta Medical Association. Status of the trilateral master agreement between Alberta Health and Wellness, Alberta Medical Association, Alberta's Regional Health Authorities. Available from: http://www.albertadoctors.org/bcm/ama/ama-website.nsf (accessed 2006 Jan 31).
68. The Alberta Medical Association. Master agreement regarding the tri-lateral relationship and budget management process for strategic physician agreements. Made effective April 1, 2003. Edmonton AB: The Alberta Medical Association; 2003.
69. Alberti G, Colin-Thome D. Transforming emergency care in England. Department of Health, editor. London UK: DH Publications; 2004.
70. Forster AJ. An agenda for reducing emergency department crowding. Annals of Emergency Medicine 2005;45(5):479-81.
71. Campbell SG, Sinclair DE. Strategies for managing a busy emergency department. Canadian Journal of Emergency Medicine 2004;6(4):271-6.
HTA Report #38 February 2006
85
72. Hwang U, Concato J. Care in the emergency department: how crowded is overcrowded? Academic Emergency Medicine 2004;11(10):1097-101.
73. Drummond AJ. No room at the inn: overcrowding in Ontario's emergency departments. Available from: http://www.caep.ca/004.cjem-jcmu/004-00.cjem/vol-4.2002/v42-091.htm (accessed 2003 Dec 5).
74. Bernstein SL, Verghese V, Leung W, Lunney AT, Perez I. Development and validation of a new index to measure emergency department crowding. Academic Emergency Medicine 2003;10(9):938-42.
75. Richards JR, Navarro ML, Derlet RW. Survey of directors of emergency departments in California on overcrowding. The Western Journal of Medicine 2000;172(6):385-8.
76. Richardson SK, Ardagh M, Gee P. Emergency department overcrowding: the Emergency Department Cardiac Analogy Model (EDCAM). Accident and Emergency Nursing 2005;13(1):18-23.
77. Downs SH, Black N. The feasibility of creating a checklist for the assessment of the methodological quality both of randomised and non-randomised studies of health care interventions. Journal of Epidemiology and Community Health 1998;52(6):377-84.
78. Robson LS. Guide to evaluating the effectiveness of strategies for preventing work injuries. How to show whether a safety intervention really works. Department of Health and Human Services, Centers for Disease Control and Prevention, editor. Cincinnati, OH: National Institute for Occupational Safety and Health, 2001; Report No. 1.
79. Norman GR, Streiner DL, editors. PDQ. PrettyDarnedQuick Statistics, 3rd Edition. Hamilton, ON: BC Decker Inc.; 2003.
80. Rosner B, editor. Fundamentals of Biostatistics, 4th Edition. Belmont, CA: Wadsworth Publishing Company; 1995.
81. Anderson J, Bernath V, Davies J, Greene L, Ludolf S. Literature review on integrated bed and patient management. Available from: http://www.health.vic.gov.au/hdms/ibpmview.pdf 2006 (accessed 2006 Feb 7).
82. Cook DJ, Mulrow CD, Haynes RB. Synthesis of best evidence for clinical decisions. Annals of Internal Medicine 1997;126(5):376-80.
83. Cooke MW, Higgins J, Kidd P. Use of emergency observation and assessment wards: a systematic literature review. Emergency Medicine J 2003;20(2):138-42.
84. Haby MM, Waters E, Robertson CF, Gibson PG, Ducharme FM. Interventions for educating children who have attended the emergency room for asthma. Cochrane Database System Review 2001;(1):CD001290.

HTA Report #38 February 2006
86
85. Hassan TB. Clinical decision units in the emergency department: old concepts, new paradigms, and refined gate keeping. Emergency Medical Journal 2003;20(2):123-5.
86. Stacey D, Noorani HZ, Fisher A, Robinson D, Joyce J, Pong RW. Telephone triage services: systematic review and a survey of Canadian call centre programs. Canadian Coordinating Office for Health Technology Assessment, editor. Ottawa, ON: CCOHTA; 2003. Report No. 43.
87. Anantharaman V, Swee HL. Hospital and emergency ambulance link: using IT to enhance emergency pre-hospital care. International Journal of Medical Information 2001;61(2-3):147-61.
88. Barthell EN, Foldy SL, Pemble KR, Felton CW, Greischar PJ, Pirrallo RG, et al. Assuring community emergency care capacity with collaborative Internet tools: the Milwaukee experience. Journal of Public Health Management and Practice 2003;9(1):35-42.
89. Bond GR. Home use of syrup of ipecac is associated with a reduction in pediatric emergency department visits. Annals of Emergency Medicine 1995;25(3):338-43.
90. Bond GR. Home syrup of ipecac use does not reduce emergency department use or improve outcome. Pediatrics 2003;112(5):1061-4.
91. Browne G, Lam L, Giles H, McCaskill M, Exley B, Fasher B. The effects of a seamless model of management on the quality of care for emergency department patients. Journal of Qualitative Clinical Practice 2000;20(4):120-6.
92. Cain P, Waldrop RD, Jones J. Improved pediatric patient flow in a general emergency department by altering triage criteria. Academic Emergency Medicine 1996;3(1):65-71.
93. Cooke MW, Arora P, Mason S. Discharge from triage: modelling the potential in different types of emergency department. Emergency Medical Journal 2003;20(2):131-3.
94. Cornwell III EE, Chang DC, Phillips J, Campbell KA, Velmahos GC, Mullins RJ, et al. Enhanced trauma program commitment at a level I trauma center: Effect on the process and outcome of care. Archives of Surgery 2003;138(8):838-43.
95. Derlet RW, Kinser D, Ray L, Hamilton B, McKenzie J. Prospective identification and triage of nonemergency patients out of an emergency department: a 5-year study. Annals of Emergency Medicine 1995;25(2):215-23.
96. Doxzon G, Howard-Ducsay J. ED overcrowding: successful action plans of a Southern California community hospital. Journal of Emergency Nursing 2004;30(4):325-9.

HTA Report #38 February 2006
87
97. France DJ, Levin S, Hemphill R, Chen K, Rickard D, Makowski R, et al. Emergency physicians' behaviors and workload in the presence of an electronic whiteboard. International Journal of Medical Information 2005;74(10):827-37.
98. Fry M. Triage nurses order x-rays for patients with isolated distal limb injuries: A 12-month ED study. Journal of Emergency Nursing 2001;27(1):17-22.
99. Ganapathy S, Zwemer FL, Jr. Coping with a crowded ED: an expanded unique role for midlevel providers. American Journal of Emergency Medicine 2003;21(2):125-8.
100. Hu SC. Computerized monitoring of emergency department patient flow. American Journal of Emergency Medicine 1993;11(1):8-11.
101. Kilic YA, Agalar FA, Kunt M, Cakmakci M. Prospective, double-blind, comparative fast-tracking trial in an academic emergency department during a period of limited resources. European Journal of Emergency Medicine 1998;5(4):403-6.
102. Krakau I, Hassler E. Provision for clinic patients in the ED produces more nonemergency visits. American Journal of Emergency Medicine 1999;17(1):18-20.
103. Lewandrowski K. How the clinical laboratory and the emergency department can work together to move patients through quickly. Clinical Leadership & Management Review 2004;2004 May-Jun; 18(3):155-9.
104. McCarthy L. Hospital crowding and ED delays: a case study. Trustee 2005;58(7):30-1, 1.
105. Redelmeier DA, Molin JP, Tibshirani RJ. A randomised trial of compassionate care for the homeless in an emergency department. Lancet 1995;345(8958):1131-4.
106. Rehmani R. Emergency Section and overcrowding in a University Hospital of Karachi, Pakistan. Journal of the Pakistan Medical Association 2004;54(5):233-7.
107. Rinderer ZM. A study of factors influencing ED patients' length of stay at one community hospital. Journal of Emergency Nursing 1996;22(2):105-10.
108. Richardson DB. The access-block effect: relationship between delay to reaching an inpatient bed and inpatient length of stay. Medical Journal of Australia 2002;177(9):492-5.
109. Ross MA, Naylor S, Compton S, Gibb KA, Wilson AG. Maximizing use of the emergency department observation unit: a novel hybrid design. Annals o f Emergency Medicine 2001;37(3):267-74.
110. Rotstein Z, Wilf-Miron R, Lavi B, Seidman DS, Shahaf P, Shahar A, et al. Management by constraints: considering patient volume when adding medical staff to the emergency department. Israeli Medical Association Journal 2002;4(3):170-3.

HTA Report #38 February 2006
88
111. Ryan J, Ghani M, Staniforth P, Bryant G, Edwards S. "Fast tracking" patients with a proximal femoral fracture. Journal of Accident and Emergency Medicine 1996;13(2):108-10.
112. Schneider S, Zwemer F, Doniger A, Dick R, Czapranski T, Davis E. Rochester, New York: a decade of emergency department overcrowding. Academic Emergency Medicine 2001;8(11):1044-50.
113. Shaw KN, Lavelle JM. VESAS: a solution to seasonal fluctuations in emergency department census. Annals of Emergency Medicine 1998;32(6):698-702.
114. Simon HK, McLario D, Daily R, Lanese C, Castillo J, Wright J. "Fast tracking" patients in an urban pediatric emergency department. American Journal of Emergency Medicine 1996;14(3):242-4.
115. Tran TP, Schutte WP, Muelleman RL, Wadman MC. Provision of clinically based information improves patients' perceived length of stay and satisfaction with EP. American Journal of Emergency Medicine 2002;20(6):506-9.

HTA Report #20 An assessment of routine telepsychiatry services HTA Report #21 Mammography screening: mortality rate reduction and screening interval HTA Report #22 Conductive education for children with cerebral palsy HTA Report #23 Patient diabetes education in the management of adult type 2 diabetes HTA Report #24 Vagus nerve stimulation for refractory epilepsy HTA Report #25 Accuracy and reliability of using computerized interpretation of electrocardiograms for
routine examinations HTA Report #26 Efficacy of suicide prevention programs for children and youth HTA Report #27 Acupuncture: evidence from systematic reviews and meta-analyses HTA Report #28 Suicide prevention strategies: evidence from systematic reviews HTA Report #29 Prevalence of chronic pain: an overview HTA Report #30 Multidisciplinary pain programs for chronic pain: evidence from systematic reviews HTA Report #31 Islet cell transplantation for the treatment of non-uremic type 1 diabetic patients with
severe hypoglycemia HTA Report #32 Surgical treatments for deep venous incompetence HTA Report #33 Ovulation induction drug therapy for anovulatory infertility associated with polycystic
ovary syndrome HTA Report #34 Evidence for the benefits of telecardiology applications: a systematic review HTA Report #35 Trigger point injections for chronic non-malignant musculoskeletal pain HTA Report #36 Protocols for stillbirth investigation HTA Report #37 Gastric electrical stimulation (EnterraTM Therapy system) for the treatment of
gastroparesis


![UvA-DARE (Digital Academic Repository) Emergency ...€¦ · [2, 3]. Three international emergency medicine societies [2, 4, 5] have published definitions of crowding or overcrowding](https://static.fdocuments.us/doc/165x107/5eab50f2be75a51ecd73134a/uva-dare-digital-academic-repository-emergency-2-3-three-international.jpg)