Strategies to Reduce Bat Fatalities at Wind Energy Facilities Working Together to Resolve...
24
Strategies to Reduce Bat Fatalities at Wind Energy Facilities Working Together to Resolve Environmental Effects of Wind Energy Cris Hein International Energy Agency’s Wind Task 34 Webinar 28–29 August 2014
-
Upload
nora-mathews -
Category
Documents
-
view
213 -
download
0
Transcript of Strategies to Reduce Bat Fatalities at Wind Energy Facilities Working Together to Resolve...

Strategies to Reduce Bat Fatalities at Wind Energy
FacilitiesWorking Together to
Resolve Environmental Effects of Wind Energy
Cris Hein
International Energy Agency’s Wind Task 34 Webinar
28–29 August 2014

Impact of Wind Energy Development on Bats in the U.S. &
Canada (Arnett & Baerwald 2013)
• 840,486–1,690,696 bats between 2000–2011
• 196,190–395,886 bats in 2012
• 79% of fatalities are migratory tree-roosting bats– hoary (38%), eastern red (22%), silver-haired (19%)– Free-tailed species also a concern
• ½ of species (n = 23) in U.S.
Operational Minimization

Definitions
• Cut-in speed– The wind speed at which the generator is
connected to the grid and producing electricity– The manufacturer’s set cut-in speed for most
contemporary turbines is between 3.0 and 4.0 m/s. For some turbines, their blades will spin at full or partial RPMs below cut-in speed when no electricity is being produced.
• Feathering– Adjusting the angle of the rotor blade parallel to
the wind, or turning the whole unit out of the wind, to slow or stop blade rotation

Operational Minimization
• Consistent patterns of bat fatalities across studies – Bats only active at night (1/2 the day)– Peak fatalities occur in late summer–fall (limited
time of year)– Higher fatalities on low wind nights (under specific
conditions)
• No bats killed at non-moving turbines
• Altering turbine operations to reduce bat fatalities– Raise cut-in speed & feather blades below cut-in
when bats are at greatest risk

Arnett et al. 2011, Mid-Atlantic, USA
Randomly assigned 3 cut-in speeds (3.5, 5.0, & 6.5 m/s)12 turbines rotated nightly, daily searches44–93% fewer bats killed No difference between treatments0.3–1% annual power
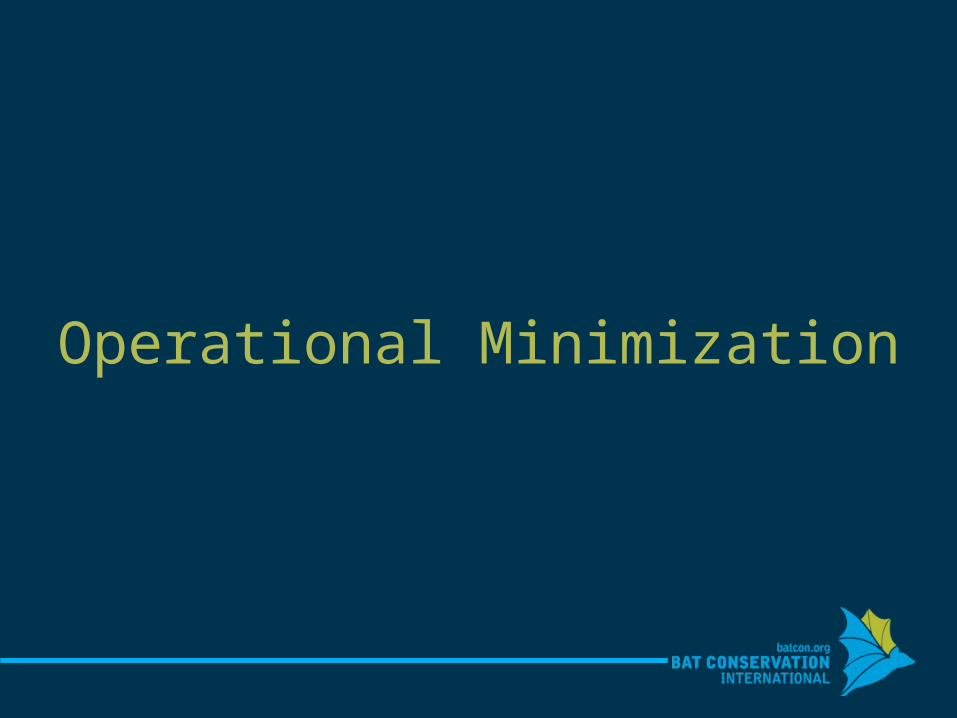
Similar treatments as Casselman – changed cut-in speeds 5.0, 6.5 m/s & control (9 turbines/treatment)
Treatments rotated on a weekly basis
50% fewer bats killed at 5.0 m/s & 78% fewer bats killed at 6.5 m/s
1st to demonstrate differences in between 5.0 & 6.5 m/s
Good et al. 2011, Midwest, USA
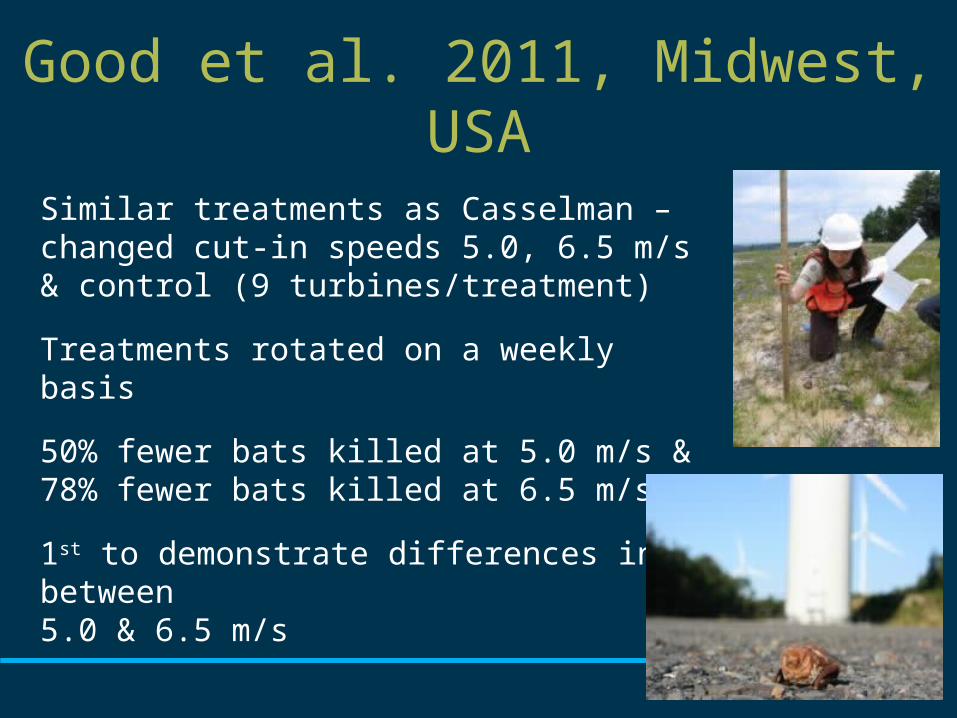
Changed cut in speeds and feathered below3.5, 4.5, 5.5 m/s and controls (42 turbines/treatment)
Treatments rotated nightly
36% fewer bats killed at 3.5 m/s56% fewer bats at 4.5 m/s 73% fewer bats killed at 5.5 m/s
*Anonymous study in the Midwest USA found similar results with <1% annual production loss
Good et al. 2012, Midwest, USA
*

Anonymous 2012, Southwest, USA
Control, ½ night for 4, 5, 6 m/s & 5 m/s all night (8 turbines/treatment)
Nightly treatments and daily searches
20.1% fewer bats at 4 m/s ½ night
34.5% fewer bats at 5 m/s ½ night*
32.6% fewer at 5 m/s all night*
38% fewer bats at 6 m/s ½ night*
*No difference between control & treatment groups
Almost 75% of fatalities were Brazilian free-tailed
bats
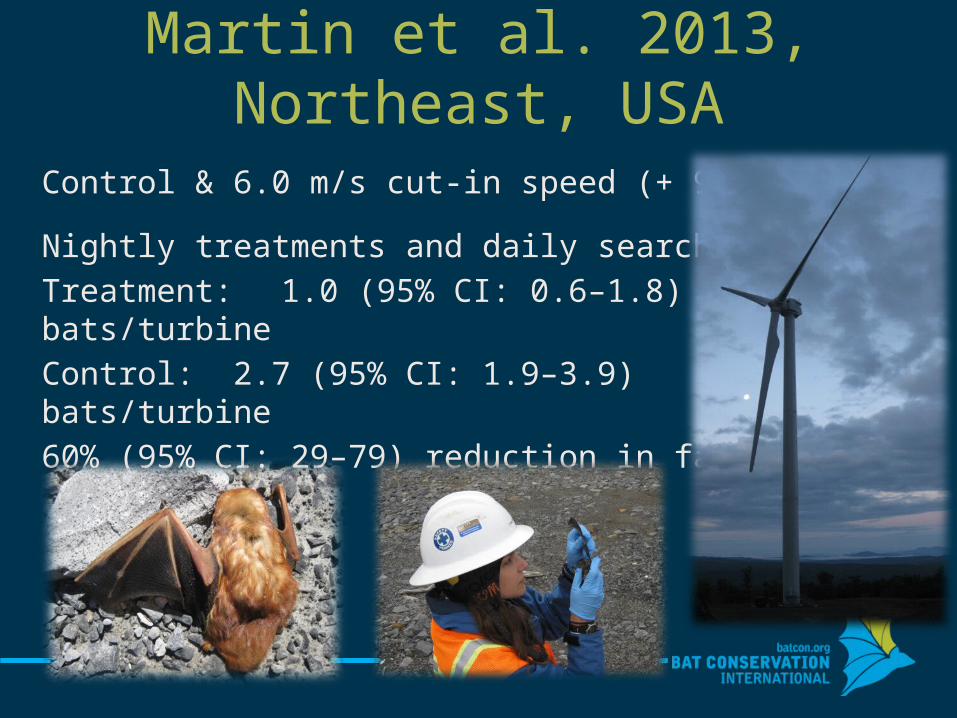
Martin et al. 2013, Northeast, USA
Control & 6.0 m/s cut-in speed (+ 9.5 °C)
Nightly treatments and daily searches Treatment: 1.0 (95% CI: 0.6–1.8) bats/turbine Control: 2.7 (95% CI: 1.9–3.9) bats/turbine60% (95% CI: 29–79) reduction in fatalities

Operational Minimization-Next Steps
• At minimum, feather up to manufacturer’s cut-in speed
• Incorporate additional weather variables
• Test in different regions & species compositions
• Ultimately “bat friendly” turbine automation that self regulates based on several variables– Date (July 15 to September 30)– Time of day (sunset to sunrise)– Wind speed (<6.0 m/s)– Temperature (>50oF)

Limitations of Operational Minimization
• Industry Perspective– Economic costs variable & relatively unknown– Impact to turbines relatively unknown
• Conservation Perspective– Not applicable in low wind regions– May not meet conservation goals for all species
• Mutually beneficial to have an alternative minimization strategy

Ultrasonic Acoustic Deterrents
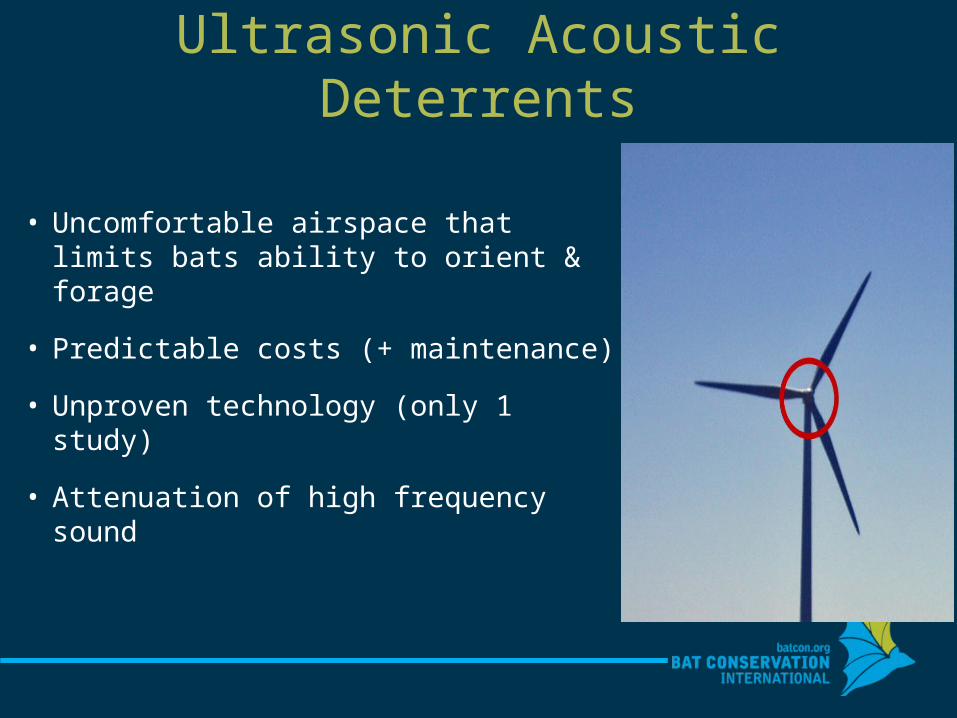
Ultrasonic Acoustic Deterrents
• Uncomfortable airspace that limits bats ability to orient & forage
• Predictable costs (+ maintenance)
• Unproven technology (only 1 study)
• Attenuation of high frequency sound
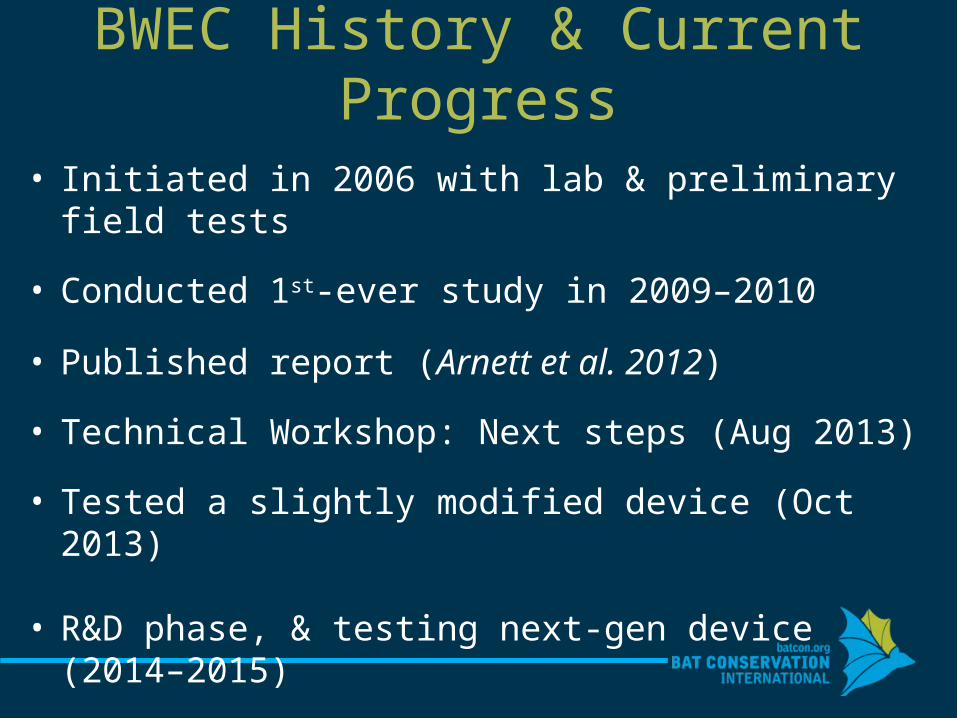
BWEC History & Current Progress
• Initiated in 2006 with lab & preliminary field tests
• Conducted 1st-ever study in 2009–2010
• Published report (Arnett et al. 2012)
• Technical Workshop: Next steps (Aug 2013)
• Tested a slightly modified device (Oct 2013)
• R&D phase, & testing next-gen device (2014–2015)
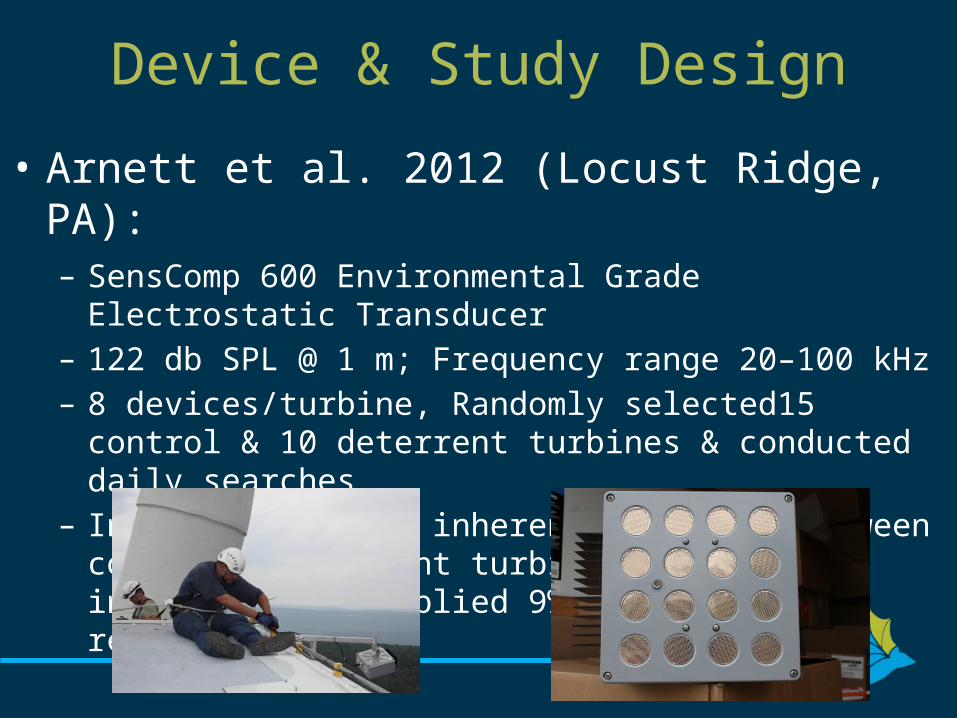
Device & Study Design
• Arnett et al. 2012 (Locust Ridge, PA):– SensComp 600 Environmental Grade Electrostatic
Transducer– 122 db SPL @ 1 m; Frequency range 20–100 kHz– 8 devices/turbine, Randomly selected15 control & 10
deterrent turbines & conducted daily searches– In 2010, assessed inherent variation between control
& treatment turbines. Though insignificant, applied 9% variation to results

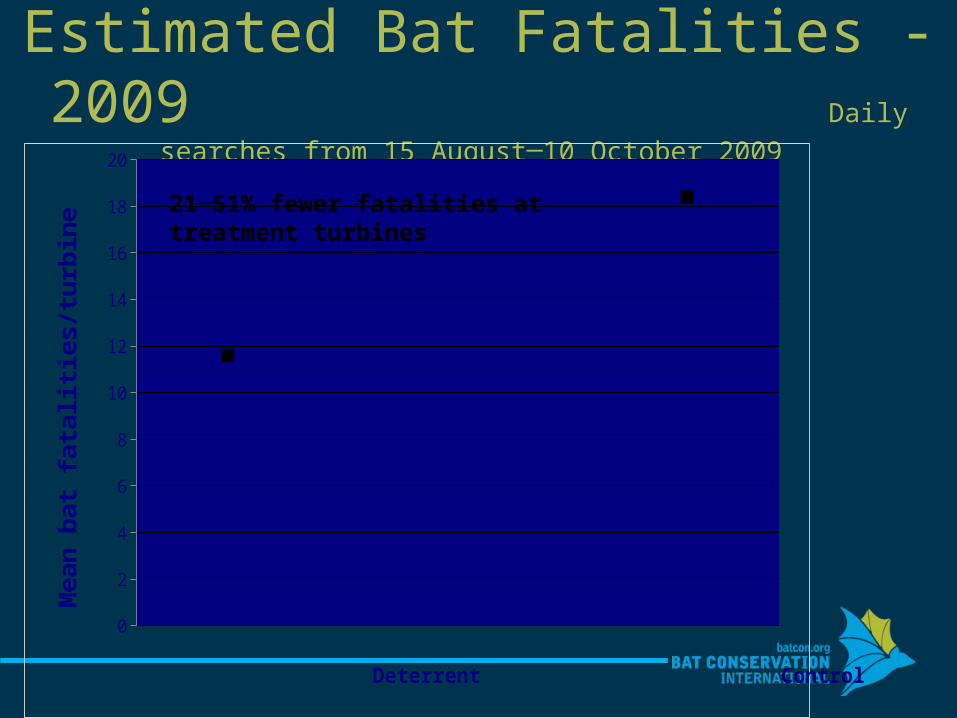
Estimated Bat Fatalities - 2009 Daily searches from 15 August─10 October 2009
0
2
4
6
8
10
12
14
16
18
20
Deterrent Control
Mean
bat
fata
liti
es/t
urb
ine 21─51% fewer fatalities at
treatment turbines

Estimated Bat Fatalities - 2010 Daily searches from 31 July─9 October 2010
1.26 to 2.04 times more fatalities at controls compared to treatments
0
5
10
15
20
25
Deterrent Control
Mean
bat
fata
liti
es/t
urb
ine 18─62% fewer fatalities at
treatment turbines
However…when factoring in a 9% inherent difference…yields ~2% more to 64% fewer bats killed at treatment turbines
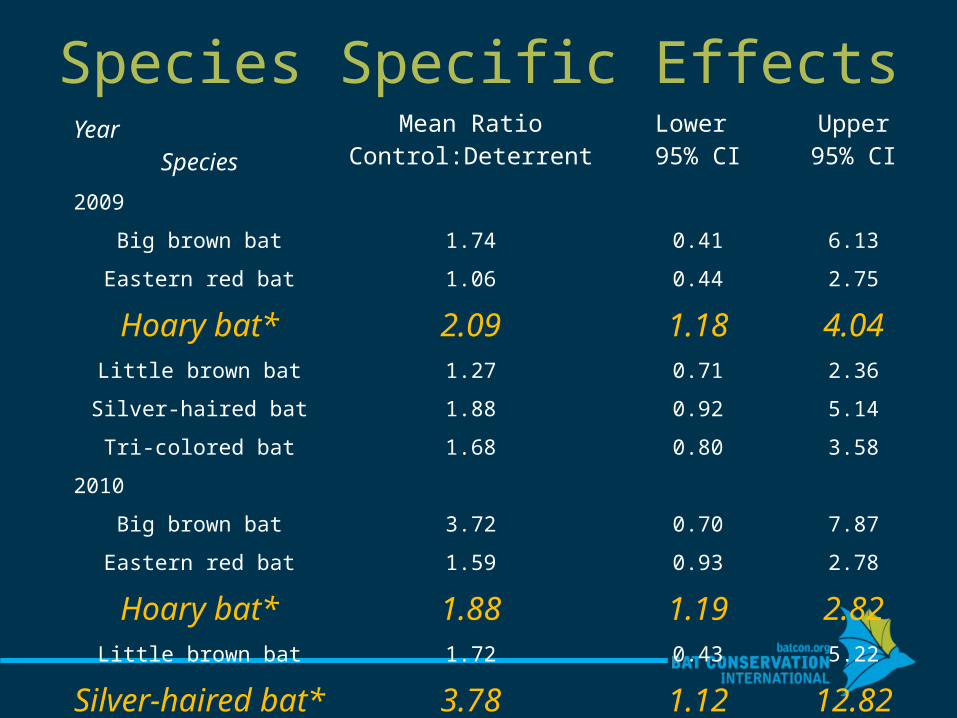
Species Specific EffectsYear
Species
Mean Ratio Control:Deterrent
Lower 95% CI
Upper95% CI
2009
Big brown bat 1.74 0.41 6.13
Eastern red bat 1.06 0.44 2.75
Hoary bat* 2.09 1.18 4.04Little brown bat 1.27 0.71 2.36
Silver-haired bat 1.88 0.92 5.14
Tri-colored bat 1.68 0.80 3.58
2010
Big brown bat 3.72 0.70 7.87
Eastern red bat 1.59 0.93 2.78
Hoary bat* 1.88 1.19 2.82Little brown bat 1.72 0.43 5.22
Silver-haired bat* 3.78 1.12 12.82
Tri-colored bat 1.59 0.84 2.96
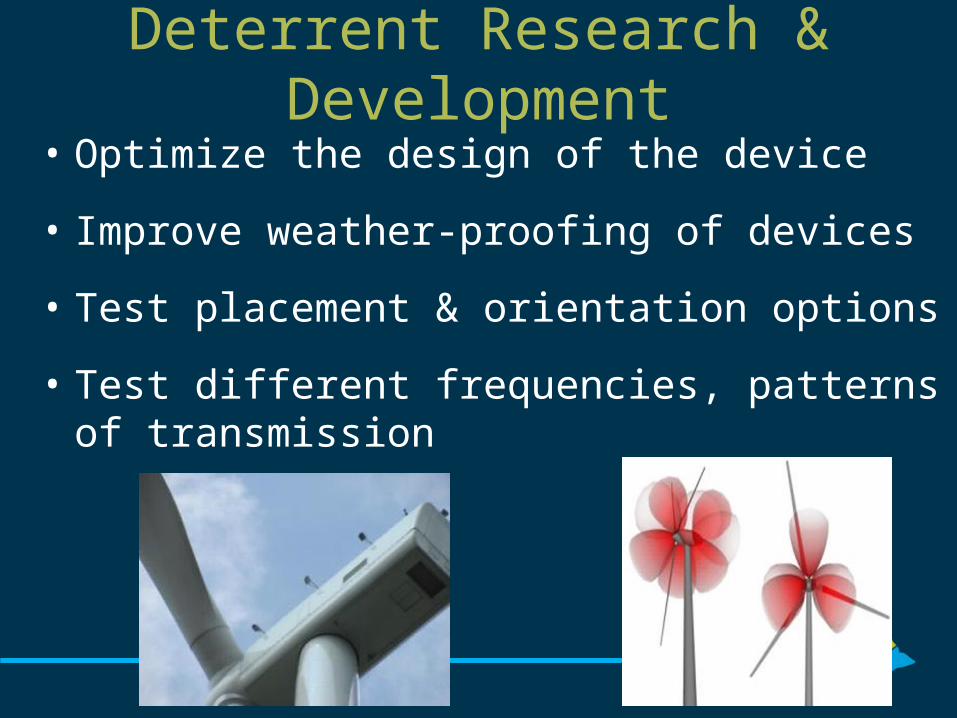
Deterrent Research & Development
• Optimize the design of the device
• Improve weather-proofing of devices
• Test placement & orientation options
• Test different frequencies, patterns of transmission

Comparison of Strategies• Operational
Minimization–Multiple studies – Reduction 44–93%– Turbine impacts? – Power purchase
agreement – Species-specific
• Myotis• Brazilian free-tailed bats
– Implementation needed• Feathering up to
manufacturer cut-in speed!
• Efforts to refine strategy
• Acoustic Deterrent– 1 study– Reduction 2% more–
64% fewer–Maintenance costs?– Up front cost– Species-specific
• Myotis • Hawaiian hoary bats
– R&D needed• Transmission pattern &
frequency• Placement & orientation
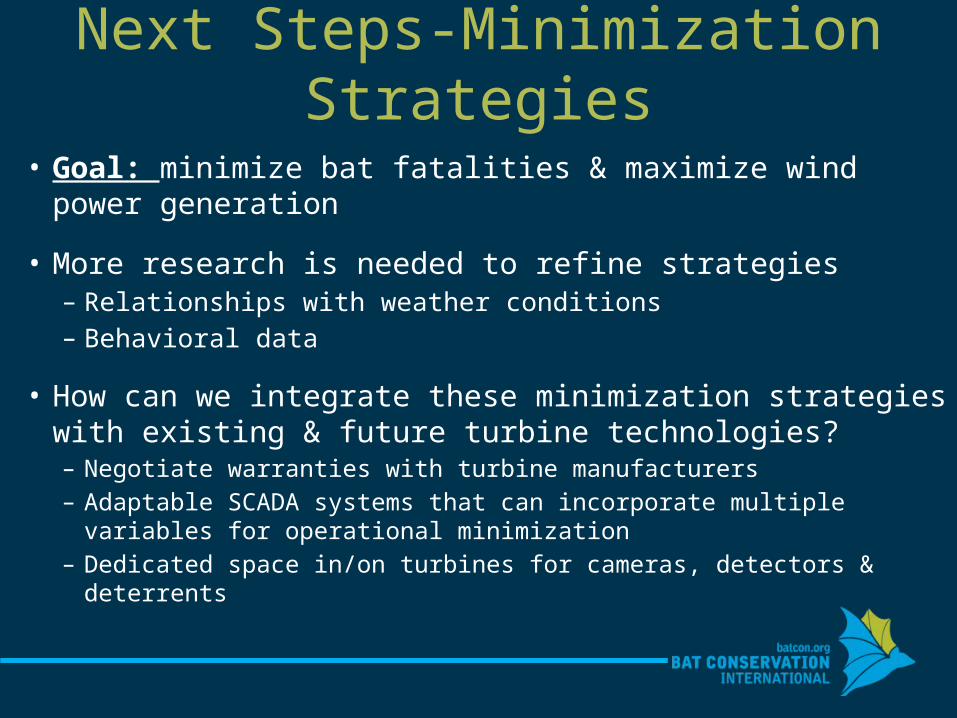
Next Steps-Minimization Strategies
• Goal: minimize bat fatalities & maximize wind power generation
• More research is needed to refine strategies– Relationships with weather conditions– Behavioral data
• How can we integrate these minimization strategies with existing & future turbine technologies?– Negotiate warranties with turbine manufacturers– Adaptable SCADA systems that can incorporate multiple
variables for operational minimization– Dedicated space in/on turbines for cameras, detectors &
deterrents
We Thank All Our Past, Current & Future Partners!
www.batsandwind.org
[email protected]; (706) 621-1975