
Strategies to Assess and Ensure Encounter Data Completeness & Accuracy · 2020-01-01 · Ensure...
46
California Association of Health Plans, Burbank, CA February 27, 2019 Strategies to Assess and Ensure Encounter Data Completeness & Accuracy James Dalen, MA - QMetrics Suzan Mora Dalen, MA, CHCA - QMetrics Manoj K. Mathew, MD, SFHM – agilon health
Transcript of Strategies to Assess and Ensure Encounter Data Completeness & Accuracy · 2020-01-01 · Ensure...

California Association of Health Plans, Burbank, CA
February 27, 2019
Strategies to Assess and Ensure Encounter Data Completeness & Accuracy
James Dalen, MA - QMetrics
Suzan Mora Dalen, MA, CHCA - QMetrics
Manoj K. Mathew, MD, SFHM – agilon health

▪ About QMetrics
▪ Value of Complete and Accurate Encounter Data
▪ Multi-Modal Approach for Maximum Effectiveness
▪ Leveraging Root Cause Analysis Through Targeted Case Studies
▪ Understanding the Full Claim/Encounter Data Flow
▪ Systematic Analysis & Reporting Enabled by Data Marts
▪ Dashboard Reporting
▪ Value Realized
▪ Key Takeaways
Presentation Outline
2

▪ Boutique consulting organization
▪ Been working in the CA market for 16 + years
▪ Principals come from health plans and are current or former Certified HEDIS® Compliance Auditors
▪ Responsive, trusted partners
▪ We maintain a flexible posture
▪ We strive for an innovative approach that yields precise results to provide actionable insight for your business
About QMetrics – Background & Overview
® HEDIS is a registered Trademark of the National Committee for Quality Assurance (NCQA)
3

▪ Encounter Data Completeness Assessment & Improvement
▪ Provider Appointment AvailabilitySurveys (PAAS)
▪ Provider Satisfaction & After Hours Surveys
▪ HEDIS and Stars Improvement
▪ Pay for Performance (Align.Measure.Perform)
▪ Quality Reporting
▪ Advanced Analytics
▪ Predictive Modeling
▪ Managed Care Data & Reporting
▪ Regulatory Compliance & Oversight
▪ Risk Score Optimization
▪ Supplemental Data Capture & Review
About QMetrics – Our Services
4
About QMetrics – A Few of Our Clients
5

▪ Founded in 2016, agilon health is a national company headquartered in Long Beach with MSO operations in California supporting owned IPAs in California, Hawaii and joint ventures in multiple other states.
▪ In California, agilon health acquired multiple small IPAs with delegation for over 300,000 Medi-Cal and MA members.
▪ The acquired groups had significant challenges due to outdated software platforms and unmanaged data streams.
▪ A HealthNet funded grant partially funded the engagement with QMetrics in 2018 to improve the legacy systems and establish best practices and workflows.
6
QMetrics and agilon health

Despite being “Zero Dollar Claims” encounters have a significant impact on Provider, Health Plan & MSO revenue.
Incomplete and inaccurate encounter data result in:
▪ Lower quality metric scores• Reduced Star payments• Reduced health plan quality incentive payments
▪ Lower risk scores• Reduced shared Medicare Advantage member payments• Reduced shared Commercial Exchange member payments
▪ Lower premium payments• Capitation from health plans• From reduced shared Medicaid payments
Value of Complete and Accurate Encounter Data
7

Multi-modal approach of targeted interventions and systematic monitoring
▪ Implement a targeted in-depth case study approach • Focus on root cause analysis• Couple quick fixes with system improvement
▪ Comprehensive monitoring enabled by data marts at all points of the data flow• Dashboard reporting with comparisons• Creation of benchmarks• PMPY reporting at actionable levels
▪ Bi-directional approach to error solving• Case study → new systematic reporting• Systematic reporting → new case studies
Our Approach
8

Leveraging Root Cause Analysis Through Targeted Case Studies
for Actionable Insights
9

▪ Structured approach to seemingly isolated claim/encounter gaps at a provider level• Provider initiated concerns
• Health plan initiated concerns
• Performance reporting identified concerns
▪ Multi-disciplinary team approach• Provider Relations
• Claims/Encounter Subject Matter Experts
• IT/Analytics resources
• Project Management
▪ Identify and implement multi-level solutions • Determine and correct root cause via systematic solutions
• Correct precipitating event while systematic fix is underway
Targeted Case Studies
10

▪Provider contacted provider relations because they had not received a quality care bonus from a health plan, and felt they should have.
▪Provider had clearinghouse records indicating submission of many visits that were not reflected in Health Plan system.
▪ In-depth root cause analysis found that some preventive care visits have CPT codes that require an NDC be indicated on the claim and the NDC codes had not been submitted.
Case Studies: Example #1 Coding Issues
11

▪Missing NDC values held back entire encounter in the outgoing encounter and reporting process to health plan.
▪Additional investigation revealed this problem to extend across many providers in part due to inconsistent coding and varying health plan requirements and edits.
▪A two part remediation was undertaken• A correction process was preformed on already submitted claims without the
NDC• Provider relations began an educational campaign to help providers understand
these documentation requirements.
Case Studies: Example #1 Coding Issues
12

▪While developing provider PMPY reporting, a number of unprocessed claims/encounters were discovered.
▪ Investigation revealed that system configuration logic changes caused member matching issues resulting in “Member Not Found”
• Inbound clearinghouse to operational system issues → “Member Not Found”
• Medi-Cal and Medicare members impacted; Medi-Medi
• Newborns
Case Studies: Example #2 Stuck Claims
13
▪A variety of algorithmic approaches were applied to the data and more than 10,000 Medi-Cal and 10,000 Medicare claims were able to be processed.
▪ This had a positive impact on Health Plan quality metrics as well as MA member risk scores.▪ ROI analysis forthcoming
Case Studies: Example #2 Stuck Claims
14

▪ Provider contacted Provider Relations because the did not receive expected health plan preventive care visit bonus payments.
▪ Targeted research revealed that the biller for a group of providers was using a clearinghouse not previously identified as a submitter of provider claims/encounters
▪ Some practice management systems / EMRs had automated feeds to other clearinghouses with no direct feed to the MSO.
▪ There may be several layers of clearinghouse routing before the encounter reaches the intended destination.
Case Studies: Example #3 Encounters in Limbo
15

▪ Action plan included identification of provider operational systems to determine practice management / EMR routing and billing flow.
▪ Identify encounters in limbo and close leakage gap by establishing a clearinghouse feed.
Case Studies: Example #3 Encounters in Limbo
16

▪ Don’t be afraid to dig into the claim itself and follow it through from provider submission through receipt.
▪ Most provider issues are not situational, rather systemic issues that are effecting other providers that have not yet been identified.
▪ Seek dialogue with providers, MSO, and health plans to understand encounter current and new edits so that appropriate system checks and validation can be performed.
▪ Share health plan incentive programs with MSO so they are able to monitor specific services and aspects of care
▪ Work with clearinghouses to understand their edits compared to health plan edits. They are not the same and vary.
▪ Communicate with the MSO as they have many masters, each health plan.
Case Studies: Key Learnings
17

▪ Educate providers
▪ Partner with Provider Relations closely as they hear the voice of the provider
▪ Reach out to clearinghouses and understand their processes, technology, edits, and reporting back to the provider.
▪ A large area of discovery are REJECTIONS:▪ How are these monitored?
▪ Is the provider working these especially for capitated services?
▪ Even with established rejection thresholds, are there providers that are always the frequent fliers that need intervention.
▪ A rejected encounter at the clearinghouse level that does not get worked is missed encounter forever.
Case Studies: Key Learnings
18

Systematic Analysis & Dashboard Reporting Enabled Through
Data Marts
19

Let’s Consider the Complete Flow of Claims & Encounters
20

Billing
Service
Paper
Clearinghouse
# 1
Office
Practice
System
EDI
Clearinghouse
# 1
EDI
Clearinghouse
# 2
MSO Administrative
System
Outbound
Clearinghouse
#1
Health Plan
Administrative
System
21

Billing
Service
Paper
Clearinghouse
# 1
Office
Practice
System
EDI
Clearinghouse
# 1
EDI
Clearinghouse
# 2
MSO Administrative
System
Outbound
Clearinghouse
#1
Health Plan
Administrative
System
Potential
Point of
Leakage
22

Billing
Service
Paper
Clearinghouse
# 1
Office
Practice
System
EDI
Clearinghouse
# 1
EDI
Clearinghouse
# 2
MSO Administrative
System
Outbound
Clearinghouse
#1
Health Plan
Administrative
System
Organizational Decision
Support & Reporting
System
23

▪ Most Provider Organizations, MSO’s, and Health Plans base their analytic decision support and reporting system using data from their administrative systems, generally using post-adjudicated data.
▪ Some will include all claims & encounters regardless of adjudication status. However, this still only includes information after it reaches the administrative system.
▪ Many of these decision support and reporting systems are very good with comprehensive filtering, sophisticated statistical analysis tools, and advanced presentation features.
▪ However, colorful graphs or complex math can’t lead to appropriate decision making if the underlying data are incomplete or inaccurate.
Traditional Approach
24

Consider the full data flow to identify all potential points of data leakage
▪ Include all inbound and outbound clearinghouses
• Work with Provider Relations and Contracting to make sure all clearinghouses are identified and data captured
▪Structure data for reporting (wide, flat files)
▪ Include reference files
▪Work with IT on volume monitoring and trending
Data Marts
25
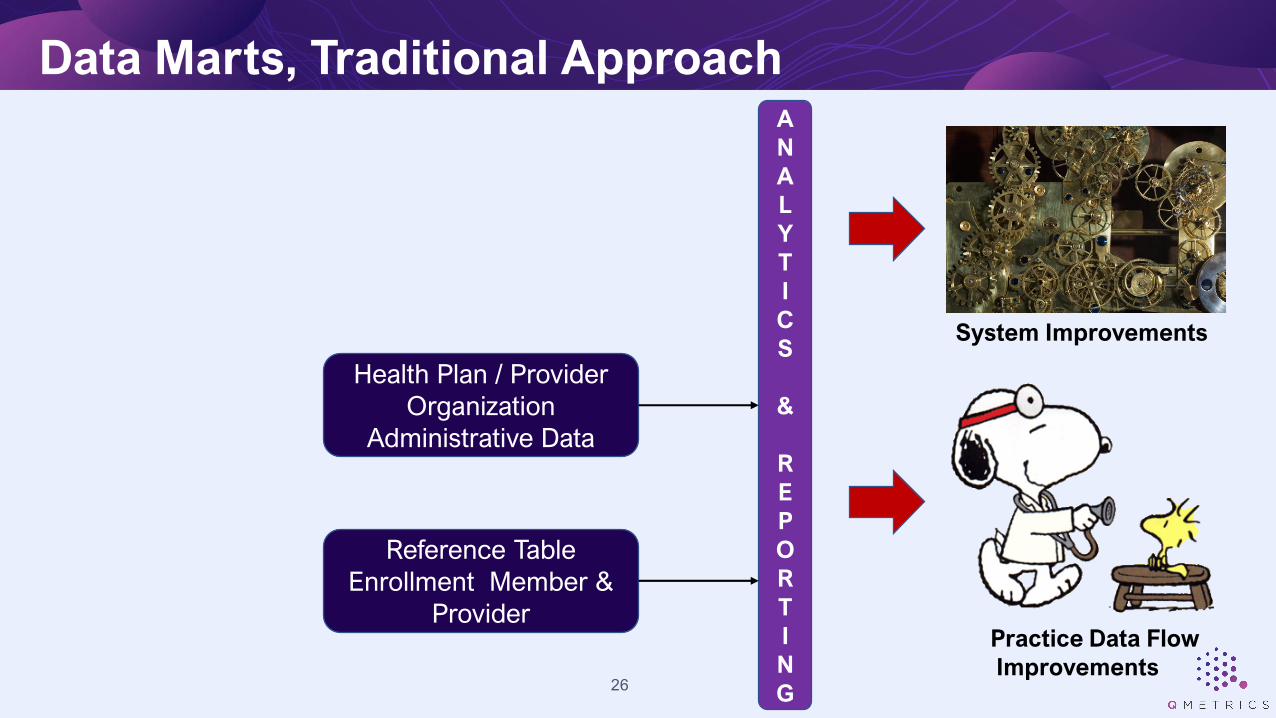
Data Marts, Traditional Approach
Health Plan / Provider
Organization
Administrative Data
Reference Table
Enrollment Member &
Provider
A
N
A
L
Y
T
I
C
S
&
R
E
P
O
R
T
I
N
G
System Improvements
Practice Data Flow
Improvements26

Data Marts, Recommended Approach
Outbound
Clearinghouse
Health Plan / Provider
Organization
Administrative Data
Inbound Paper
Clearinghouse
Inbound EDI
Clearinghouse #3
Inbound EDI
Clearinghouse #2
Inbound EDI
Clearinghouse #1
Reference Table
Enrollment Member &
Provider
A
N
A
L
Y
T
I
C
S
&
R
E
P
O
R
T
I
N
G
System Improvements
Practice Data Flow
Improvements27

▪Consider metrics at each and every step in the data flow• This is only way to discover and correct data leakages where they occur
▪Couple trend metrics with current performance metrics
▪Report key metrics at all actionable levels of aggregation• Provider, clinic, provider group, region, etc.
▪ Avoid “What does this mean to me?” reports• Always have a point of reference or comparison
▪Calculate and use benchmarks• Consider demographics, specialty, and panel condition profile when
possible
Dashboard Reporting
28
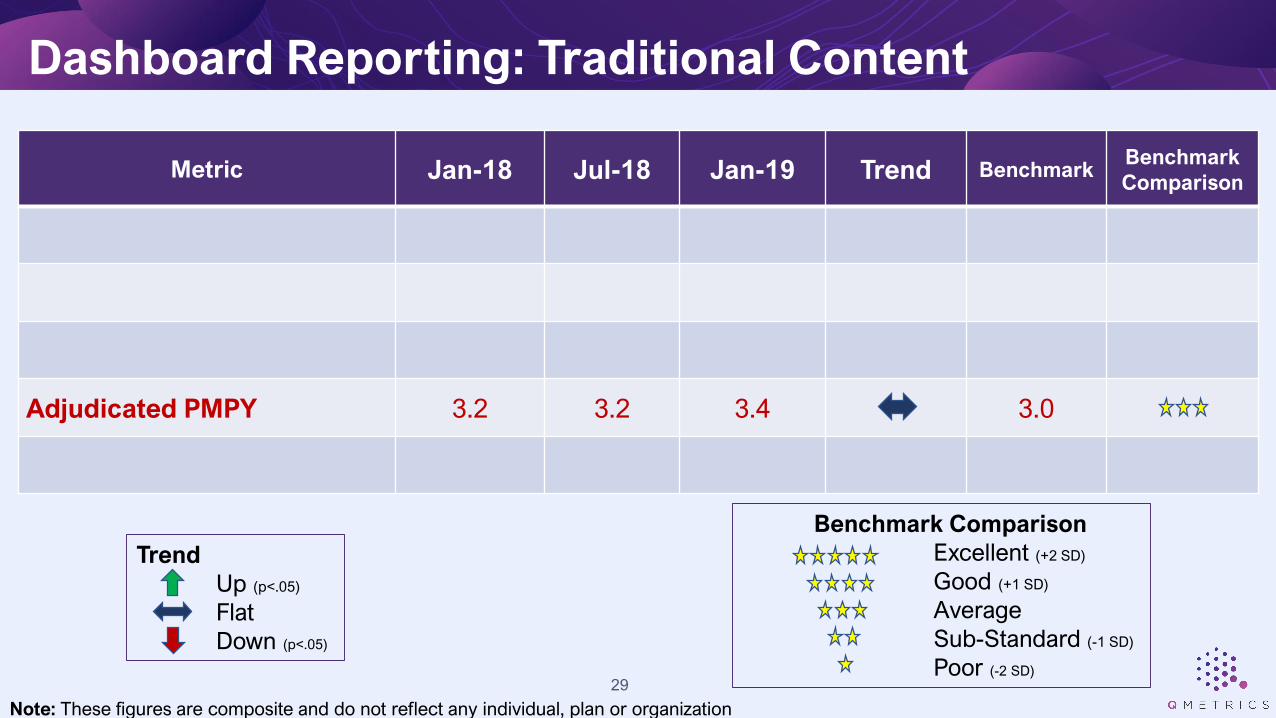
Metric Jan-18 Jul-18 Jan-19 Trend BenchmarkBenchmark
Comparison
Adjudicated PMPY 3.2 3.2 3.4 3.0
Benchmark Comparison
Excellent (+2 SD)
Good (+1 SD)
Average
Sub-Standard (-1 SD)
Poor (-2 SD)
Trend
Up (p<.05)
Flat
Down (p<.05)
Dashboard Reporting: Traditional Content
29
Note: These figures are composite and do not reflect any individual, plan or organization
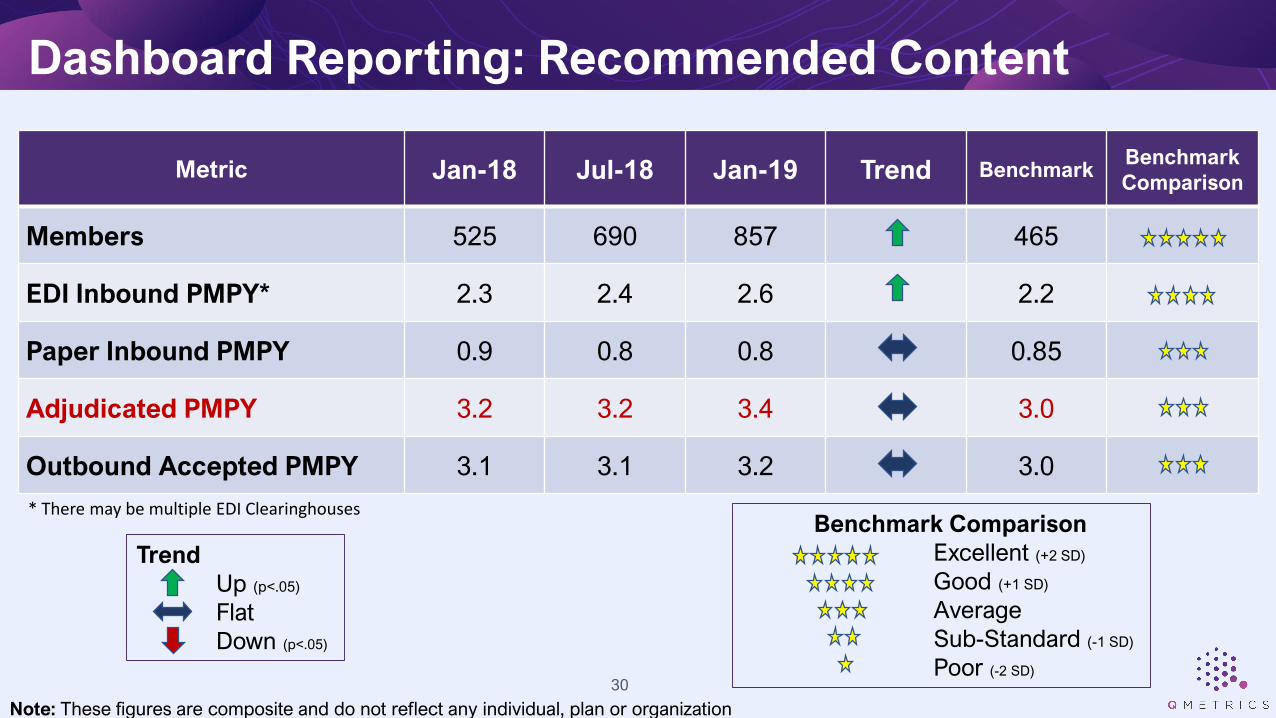
Metric Jan-18 Jul-18 Jan-19 Trend BenchmarkBenchmark
Comparison
Members 525 690 857 465
EDI Inbound PMPY* 2.3 2.4 2.6 2.2
Paper Inbound PMPY 0.9 0.8 0.8 0.85
Adjudicated PMPY 3.2 3.2 3.4 3.0
Outbound Accepted PMPY 3.1 3.1 3.2 3.0
Trend
Up (p<.05)
Flat
Down (p<.05)
Dashboard Reporting: Recommended Content
* There may be multiple EDI Clearinghouses
30
Note: These figures are composite and do not reflect any individual, plan or organization
Benchmark Comparison
Excellent (+2 SD)
Good (+1 SD)
Average
Sub-Standard (-1 SD)
Poor (-2 SD)

Trend
Up (p<.05)
Flat
Down (p<.05)
Dashboard Reporting: Example #1 Dr. Spock
Metric Jan-18 Jul-18 Jan-19 Trend BenchmarkBenchmark
Comparison
Members 495 510 750 465
EDI Inbound PMPY* 2.2 2.3 2.5 2.2
Paper Inbound PMPY 0.9 0.9 0.9 0.85
Adjudicated PMPY 3.2 3.1 2.4 3.0
Outbound Accepted PMPY 3.1 3.0 2.3 3.0
* There may be multiple EDI Clearinghouses
31
Note: These figures are composite and do not reflect any individual, plan or organization
Benchmark Comparison
Excellent (+2 SD)
Good (+1 SD)
Average
Sub-Standard (-1 SD)
Poor (-2 SD)

Trend
Up (p<.05)
Flat
Down (p<.05)
Dashboard Reporting: Example #1 Dr. Spock
Metric Jan-18 Jul-18 Jan-19 Trend BenchmarkBenchmark
Comparison
Members 495 510 750 465
EDI Inbound PMPY* 2.2 2.3 2.5 2.2
Paper Inbound PMPY 0.9 0.9 0.9 0.85
Adjudicated PMPY 3.2 3.1 2.4 3.0
Outbound Accepted PMPY 3.1 3.0 2.3 3.0
* There may be multiple EDI Clearinghouses
32
Note: These figures are composite and do not reflect any individual, plan or organization
Benchmark Comparison
Excellent (+2 SD)
Good (+1 SD)
Average
Sub-Standard (-1 SD)
Poor (-2 SD)

▪ The standard adjudicated claims based PMPY is showing Dr. Spock is now showing a visit rate significantly below benchmark. • Have his practice patterns changed?• Is he overwhelmed by the patients?• Is he not submitting all encounters?
▪We better send Provider Relations out there with our report to show him and get him back into shape.
▪OOOPS – it is not Dr. Spock’s fault. The inbound clearing house is erroneously rejecting a large proportion of inbound encounters.• Dr. Spock is unhappy with the Health Plan and may terminate
Dashboard Reporting: Example #1 Dr. Spock
33
Trend
Up (p<.05)
Flat
Down (p<.05)
Dashboard Reporting: Example #2 Dr. Taussig
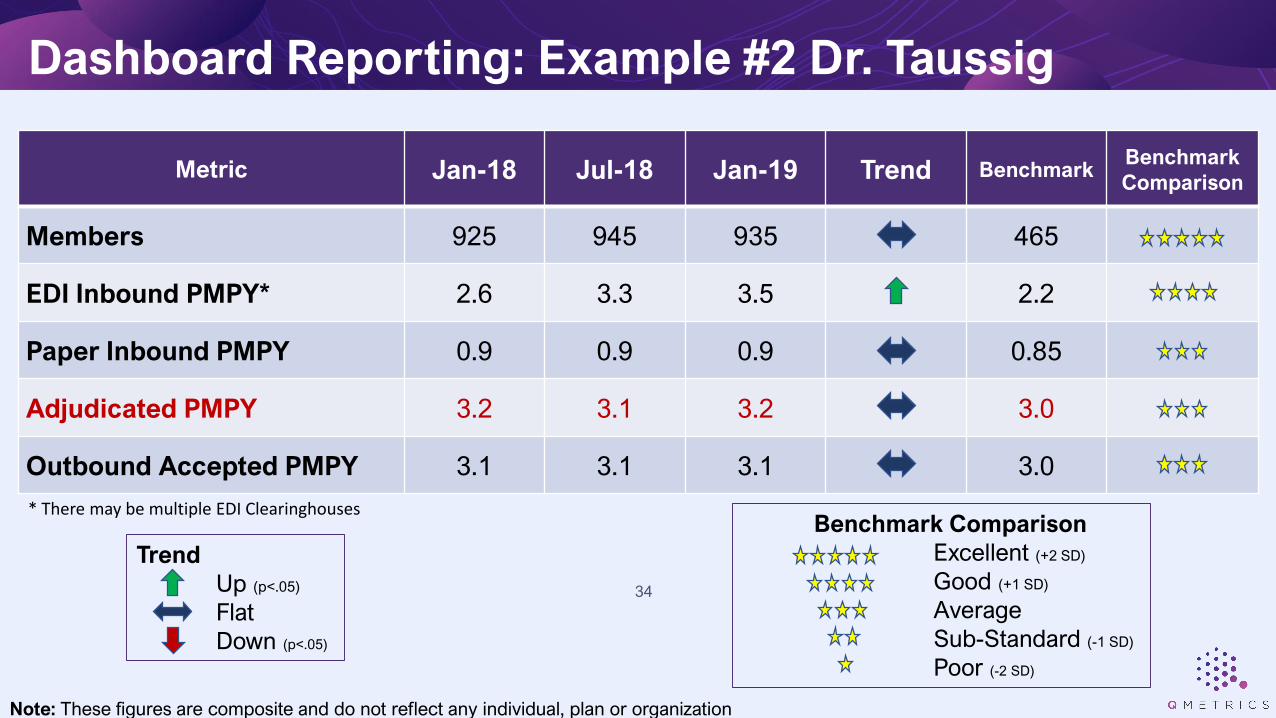
Metric Jan-18 Jul-18 Jan-19 Trend BenchmarkBenchmark
Comparison
Members 925 945 935 465
EDI Inbound PMPY* 2.6 3.3 3.5 2.2
Paper Inbound PMPY 0.9 0.9 0.9 0.85
Adjudicated PMPY 3.2 3.1 3.2 3.0
Outbound Accepted PMPY 3.1 3.1 3.1 3.0
* There may be multiple EDI Clearinghouses
34
Note: These figures are composite and do not reflect any individual, plan or organization
Benchmark Comparison
Excellent (+2 SD)
Good (+1 SD)
Average
Sub-Standard (-1 SD)
Poor (-2 SD)
Trend
Up (p<.05)
Flat
Down (p<.05)
Dashboard Reporting: Example #2 Dr. Taussig
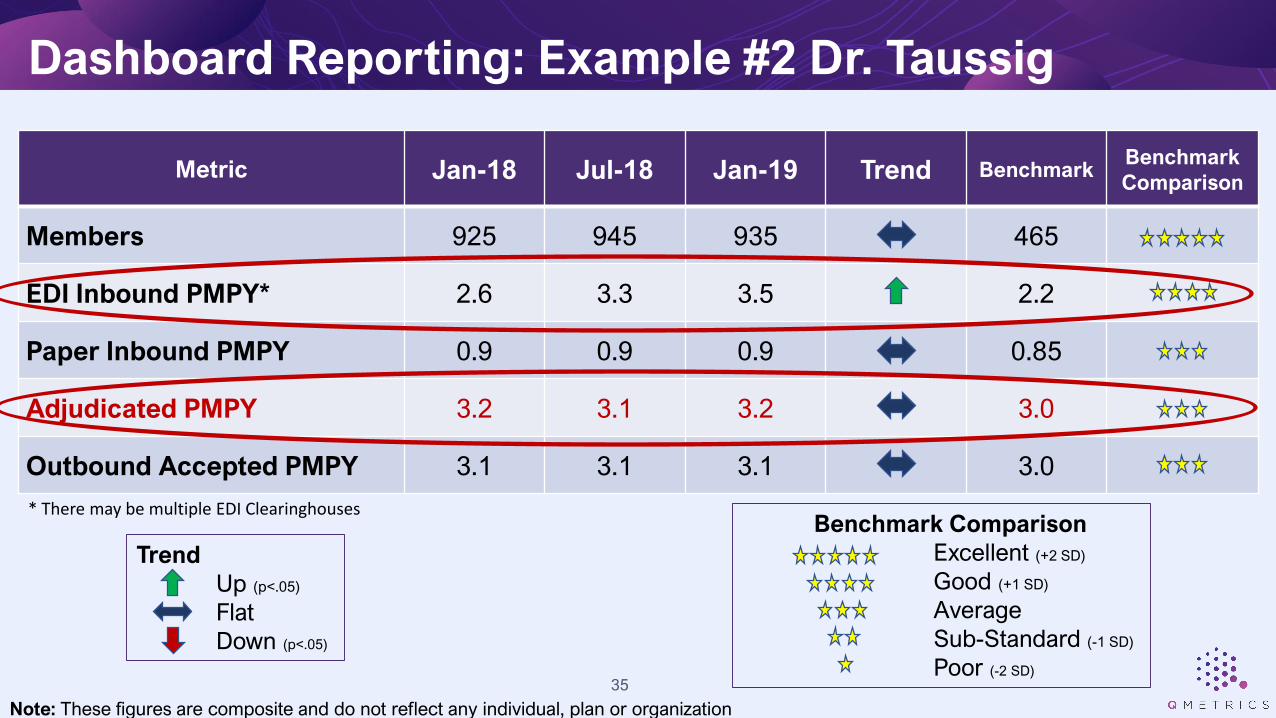
Metric Jan-18 Jul-18 Jan-19 Trend BenchmarkBenchmark
Comparison
Members 925 945 935 465
EDI Inbound PMPY* 2.6 3.3 3.5 2.2
Paper Inbound PMPY 0.9 0.9 0.9 0.85
Adjudicated PMPY 3.2 3.1 3.2 3.0
Outbound Accepted PMPY 3.1 3.1 3.1 3.0
* There may be multiple EDI Clearinghouses
35
Note: These figures are composite and do not reflect any individual, plan or organization
Benchmark Comparison
Excellent (+2 SD)
Good (+1 SD)
Average
Sub-Standard (-1 SD)
Poor (-2 SD)

▪ The standard adjudicated claims based PMPY is shows all is well with Dr. Taussig’s practice pattern and encounter submission rate.
▪ But it is NOT All Well! • Adjudicated claims PMPY < (EDI PMPY + Paper PMPY)• EDI PMPY has increased by 35% • Something is impacting the encounter flow AFTER Dr. Taussig submits them.
▪ The Health Plan calculated quality metrics for Dr. Taussig are well below what they would be with complete data• Dr. Taussig is not going to receive her quality bonus, when she should
• Dr. Taussig is not happy with the Health Plan
Dashboard Reporting: Example #2 Dr. Taussig
36

Trend
Up (p<.05)
Flat
Down (p<.05)
Dashboard Reporting: Example #3 Dr. No
Metric Jan-18 Jul-18 Jan-19 Trend BenchmarkBenchmark
Comparison
Members 525 490 400 465
EDI Inbound PMPY* 2.3 2.4 2.3 2.2
Paper Inbound PMPY 0.9 0.9 0.9 0.85
Adjudicated PMPY 3.2 3.1 3.2 3.0
Outbound Accepted PMPY 3.0 2.8 2.2 3.0
* There may be multiple EDI Clearinghouses
37
Note: These figures are composite and do not reflect any individual, plan or organization
Benchmark Comparison
Excellent (+2 SD)
Good (+1 SD)
Average
Sub-Standard (-1 SD)
Poor (-2 SD)

Trend
Up (p<.05)
Flat
Down (p<.05)
Dashboard Reporting: Example #3 Dr. No
Metric Jan-18 Jul-18 Jan-19 Trend BenchmarkBenchmark
Comparison
Members 525 490 400 465
EDI Inbound PMPY* 2.3 2.4 2.3 2.2
Paper Inbound PMPY 0.9 0.9 0.9 0.85
Adjudicated PMPY 3.2 3.1 3.2 3.0
Outbound Accepted PMPY 3.0 2.8 2.2 3.0
* There may be multiple EDI Clearinghouses
38
Note: These figures are composite and do not reflect any individual, plan or organization
Benchmark Comparison
Excellent (+2 SD)
Good (+1 SD)
Average
Sub-Standard (-1 SD)
Poor (-2 SD)

▪ The MSO’s standard adjudicated claims based PMPY shows all is well with Dr. No’s practice pattern and encounter submission rate. • The MSO thinks everything is fine.
▪ But the Health Plan is not happy. They are seeing a reduced PMPY from Dr. No, and their QI department is noting a large number of Care Gaps for his quality measures.
▪ The MSO thinks Health Plan is the problem. The Health Plan thinks the MSO is the problem.
• The outbound clearinghouse has a new EDI specialist who made some changes to the edits to Dr. No’s encounters acceptance process to make it more efficient without considering the impact of the changes. Many encounters are now being rejected.
Dashboard Reporting: Example #3 Dr. No
39

Value Realized From Enhanced Oversight of Encounters
40

Value Realized, PMPY Trend With CQI Approach Implemented
-
1.0
2.0
3.0
4.0
5.0
6.0
7.0
2017-01 2017-04 2017-07 2017-10 2018-01 2018-04 2018-07
PM
PY
Cla
im/E
nco
un
ter
Rat
e
Plan A - Medicaid Plan B - Commercial Plan C - Medicaid41
Note: These figures are composite and do not reflect any individual, plan or organization

Value Realized, Systematic Error Correction Process Implemented
18% 19%
58%
74%
57%
84% 84%
90%
0%
10%
20%
30%
40%
50%
60%
70%
80%
90%
100%
2017-1 2017-2 2017-3 2017-4 2018-1 2018-2 2018-3 2018-4
Pro
po
rtio
n o
f T
ran
sa
cti
on
s A
cc
ep
ted
Proportion of Outgoing Clearinghouse Transactions Accepted
Initial Implementation Period
42
Note: These figures are composite and do not reflect any individual, plan or organization

▪Complete and accurate Encounter Data have a diverse impact
• Quality metrics → quality bonuses
• Population condition profile → targeted improvement activities
• Risk scores → adjusted PMPM payments
• Rate setting → base PMPM payments
▪Couple targeted analysis & interventions with systematic monitoring
▪ Focus on determining root cause while researching issues
Key Takeaways
43

▪Couple the immediate fix of the issue at hand with systematic improvements
▪ There are many steps in the flow of claims/encounters, consider practice management systems, EMRs, and ALL potential clearinghouses
▪ Establish a multi-disciplinary team with Provider Relations for ongoing encounter issue identification and communication
▪Supplement traditional reporting data bases with those from all points in the encounter data flow.
Key Takeaways
44

▪Monitoring reports should include comparative benchmarks
• Report key metrics at all actionable levels of aggregation
▪Understand provider operational systems and encounter routing to identify potential leakage points
▪Understand clearinghouses and their processes
▪ Identify rejection rate reporting by clearinghouse and determine encounter leakage of uncorrected rejected encounters
Key Takeaways
45

THANK YOU
WWW.QMETRICS.US