
Strategies to Address the 10 Most Commonly Cited … Cited Home Care Standards April 14, ... (Latest...
43
© Copyright, The Joint Commission Strategies to Address the 10 Most Commonly Cited Home Care Standards April 14, 2015 Margherita Labson BSN, MS, CPHQ, CCM Executive Director Home Care Program Deatrice Greathouse RN, MSHA Associate Director Standards Group
Transcript of Strategies to Address the 10 Most Commonly Cited … Cited Home Care Standards April 14, ... (Latest...

© C
opyr
ight, T
he J
oin
t C
om
mis
sio
n
Strategies to Address the 10 Most
Commonly Cited Home Care
Standards
April 14, 2015
Margherita Labson BSN, MS, CPHQ, CCM
Executive Director Home Care Program
Deatrice Greathouse RN, MSHA
Associate Director Standards Group

© C
opyr
ight, T
he J
oin
t C
om
mis
sio
n
Objectives
At the conclusion of the presentation
participants will be able to:
– Identify the 10 most commonly cited home care
standards.
– Describe methods that can be used to uncover
process failures
– Explore strategies that can be used to address
process failures.

© C
opyr
ight, T
he J
oin
t C
om
mis
sio
n
Yes and No
Yes to:– Raising awareness
– Looking at problems
differently
– Getting to the root of the
problem
– Engaging staff in solutions
– Embedding solutions in
standard work
No to:– Doing the same thing
and expecting a different
outcome
– Making this QAs job
– Creating additional work
– Re-educating the staff,
again
– Endless audits

© C
opyr
ight, T
he J
oin
t C
om
mis
sio
n
This much we know:
Frequently mirror CMS findings
Involves one or more processes
Root cause likely one of 3 things:
– Communication
– Human Factors
– Leadership

© C
opyr
ight, T
he J
oin
t C
om
mis
sio
n
Learn from highly reliable organizations
Preoccupation with failure
Reluctance to simplify interpretation
Sensitivity to operations
Commitment to resilience
Deference to expertise

© C
opyr
ight, T
he J
oin
t C
om
mis
sio
n
Strategic Approach:
Drill down to where and when this is
happening most frequently - be specific
What error occurs most often?
Talk with the people most often affected
Listen for cues re: human factors
Work on the issue where you generate
the greatest ROI
© C
opyr
ight, T
he J
oin
t C
om
mis
sio
n
PC.02.01.03 The organization provides care,
treatment, or services in accordance with orders or
prescriptions, as required by law and regulation.
Chief areas of non-compliance– Providing care without a physician’s order
– Prescribed frequency of visits not followed
– Aides provide services not listed on care plan
42%
Aha! You’re only looking at the outcome if you’re just
auditing the health record and comparing doctor’s orders
to documented care in the notes.

© C
opyr
ight, T
he J
oin
t C
om
mis
sio
n
Applied Strategy:
Drill down discover what care is provided without orders
– Use a Pareto chart to find out how to get the greatest impact
Observe the process used to obtain and record orders
– Verbal order read-back
– How do staff document a physician’s order?
Implement self-accountability for visit frequency
– Use visual cues to alarm user of over/under usage
– Qualitatively evaluate performance
Evaluate the process used to supervise staff
– Written process, observe behavior, trace the activity

© C
opyr
ight, T
he J
oin
t C
om
mis
sio
n
Useful tool to help you:
Pareto Chart

© C
opyr
ight, T
he J
oin
t C
om
mis
sio
n
PC.01.03.01 The organization plans the
patient’s care
Chief areas of non-compliance
– Plan doesn’t reflect unique needs of the
patient
– Plan is not revised as patient needs change
– No individualized approach to patient care
31%

© C
opyr
ight, T
he J
oin
t C
om
mis
sio
n
Applied Strategy:
Explore how staff identify and prioritize patient
problems– Address problems that are identified on assessment
– For every problem there is a goal
– Reference OBQI and QBQM report
Observe the process used by staff to plan
patient care and frequency of services.– Does policy effectively guide practice?
Evaluate the ability of staff to record/customize
the responses in the EMR– Look for facilitation and hindrance
© C
opyr
ight, T
he J
oin
t C
om
mis
sio
n
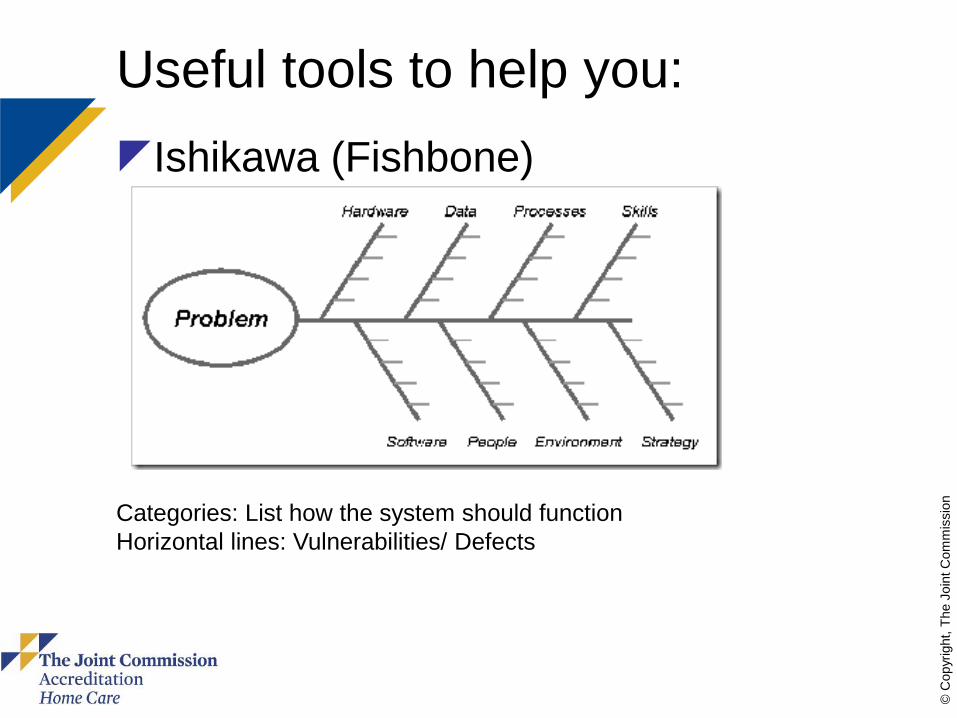
Useful tools to help you:
Ishikawa (Fishbone)
Categories: List how the system should function
Horizontal lines: Vulnerabilities/ Defects

© C
opyr
ight, T
he J
oin
t C
om
mis
sio
n
IC.02.04.01 The organization offers vaccination against
influenza to licensed independent practitioners and staff.
Chief areas of non-compliance
– No credible plan for influenza vaccination
program
–No written plan
–No data collected to determine
reasonable compliance goals
–No information available to support the
value of the program
30%

© C
opyr
ight, T
he J
oin
t C
om
mis
sio
n
Applied Strategy:
Use the CDC website for information on
influenza vaccinations for all staff, contract
staff and LIP’s
Collect data between October and March on
who has been vaccinated, regardless of
where it happened
Check the National Quality Forum (NQF)
website for information that supports the
value of these programs
© C
opyr
ight, T
he J
oin
t C
om
mis
sio
n
Useful resources for you:
www.cdc.gov
http://jccms2/www.JointCommission.or
g/PatientSafety/InfectionControl/H1N1_
podcast.htm
http://www.quality forum.org/WorkArea

© C
opyr
ight, T
he J
oin
t C
om
mis
sio
n
Useful tools to help you
FMEA: Failure Mode Effects Analysis– It only looks complicated, it is actually POWERFUL
– Have the stakeholders in the room
– Important scores: Severity, Detectability and
– RPI- Risk Priority Number
http://www.qimacros.com/lean-six-sigma-articles/fmea-template/
Design Failure Modes and Effects Analysis (DFMEA)
Item or Process ..enter info here Process Responsibility ..enter info here Prepared by: …enter information here.
Unit of Improvement ..enter info here Key Date ..enter info here DFMEA Dates: (Originated) 00/00/00 (Latest Revision Date) 00/00/00
Core team ..enter info here Action Results
Solution Potential Failure Mode Potential Effect(s) of Failure
Se
ve
rity
Cla
ss Potential Cause(s)/Mechanisms of
Failure
Oc
cu
rre
nc
e
Current Process
Controls PreventionCurrent Process Controls Detection
De
tec
tio
n
RPNRecommended
Actions(s)
Responsible
Person
Target
Completion
DateActions Taken
S
E
V
O
C
C
D
E
T
R
P
N
10 10 1 100
Check
Check
Check
Check

© C
opyr
ight, T
he J
oin
t C
om
mis
sio
n
RC.02.01.01 The patient record contains
information that reflects the patient’s care,
treatment, or services.
Chief areas of non-compliance
– Missing documentation
– Delayed filing and records management
– Delayed submission of documents from
subcontractors
24%

© C
opyr
ight, T
he J
oin
t C
om
mis
sio
n
Applied Strategy:
Automate the documentation submission
process
Monitor and measure the flow of information
in and out of the organization
Effectively manage contract services:
– Awareness: Written in contract
– Compliance: Monitor and measure
– Transparency: Report on outcomes

© C
opyr
ight, T
he J
oin
t C
om
mis
sio
n
Helpful Tools to Use: Value Stream Map Value is defined by the ‘Customer’
TIM WOODS = 8 Ways of WASTE
T – Transport
I – Inventory
M – Motion
W – Waiting
O – Over production
O – Over processing
D – Defects
S – Skills

© C
opyr
ight, T
he J
oin
t C
om
mis
sio
n
HR.01.02.05 The organization verifies staff
qualifications
Chief areas of non compliance
– Lack of primary source verification upon
hire and expiration of license
– Verification and documentation of
experience and education
– Criminal background checks
– Health screenings documentation
24%

© C
opyr
ight, T
he J
oin
t C
om
mis
sio
n
Applied Strategy:
Evaluate the process used to obtain
verification
Automate the process used to notify
staff when verification nears expiration
Embed the process for criminal
background checks and health
screenings as standard work during
orientation

© C
opyr
ight, T
he J
oin
t C
om
mis
sio
n
Useful tool: SIPOC
High level overview of the process
– Helps identify critical risk points
– Helps identify gaps/workarounds in the process
– Focuses attention on what matters most
© C
opyr
ight, T
he J
oin
t C
om
mis
sio
n
IC.02.01.01 The organization implements
the infection prevention and control activities it
has planned.
Chief areas of non compliance
– Breaks in hand hygiene technique
– Not providing PPE or hand hygiene
supplies
– Collection of surveillance activities,
aggregation, and analysis to reduce risk of
infections

© C
opyr
ight, T
he J
oin
t C
om
mis
sio
n
Applied Strategy:
Evaluate the effectiveness of the process
used to determine compliance w/ hand
hygiene.
– Written program clearly defines expectations
– PPE is readily available and management is
unwavering in its commitment to use
– Data collection is routine, analysis occurs
frequently and reports are posted in real time

© C
opyr
ight, T
he J
oin
t C
om
mis
sio
n
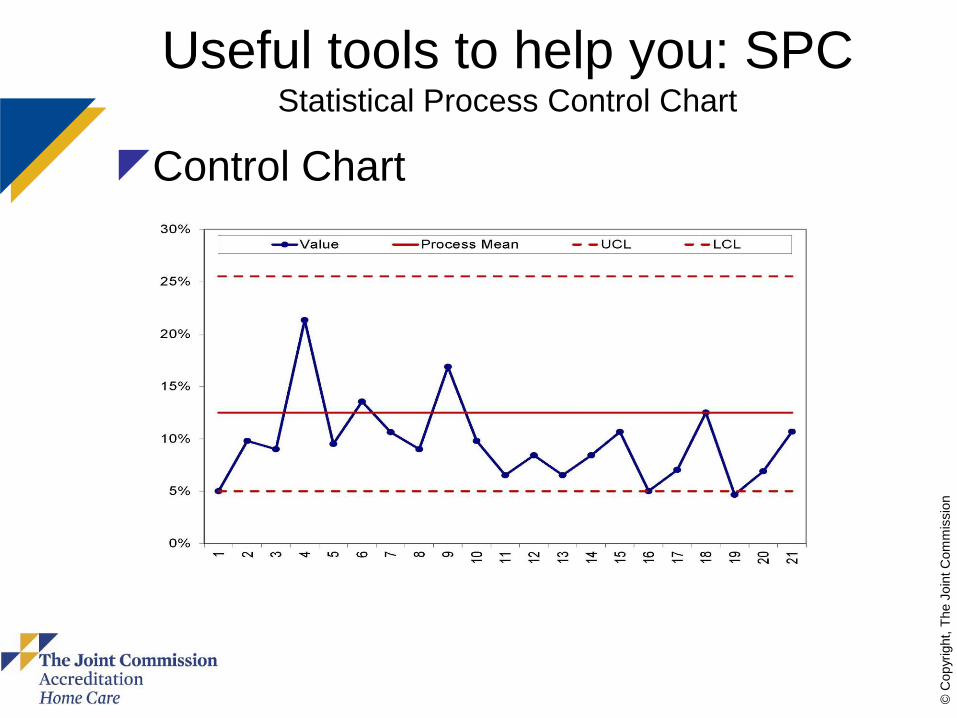
Key Resource to help you:
CDC Morbidity and Mortality Weekly
Report for Hand Hygiene– Discusses Hand Hygiene practices among
HCW’s.
– Types of activities resulting in cross
contamination
– Efficacy of plain soap, antiseptic soap/detergent
and alcohols
– Methods used to promote improved Hand
hygiene
© C
opyr
ight, T
he J
oin
t C
om
mis
sio
n
Useful tools to help you: SPCStatistical Process Control Chart
Control Chart

© C
opyr
ight, T
he J
oin
t C
om
mis
sio
n
HR.01.06.01 Staff are competent to
perform their responsibilities
Chief areas of non compliance
- No defined competencies
- Lack methods of assessment
- Competencies are not done upon
hire or per policy
23%

© C
opyr
ight, T
he J
oin
t C
om
mis
sio
n
Applied Strategy:
Evaluate the process used to
determine the competency of staff– Define the required competencies necessary to
perform the position duties.
– Determine the most effective method to evaluate
the identified competency
– Automate the process used to notify supervisors
a competency is due
– Define and implement remediation activities
necessary to restore competency when
performance is unsatisfactory.
© C
opyr
ight, T
he J
oin
t C
om
mis
sio
n
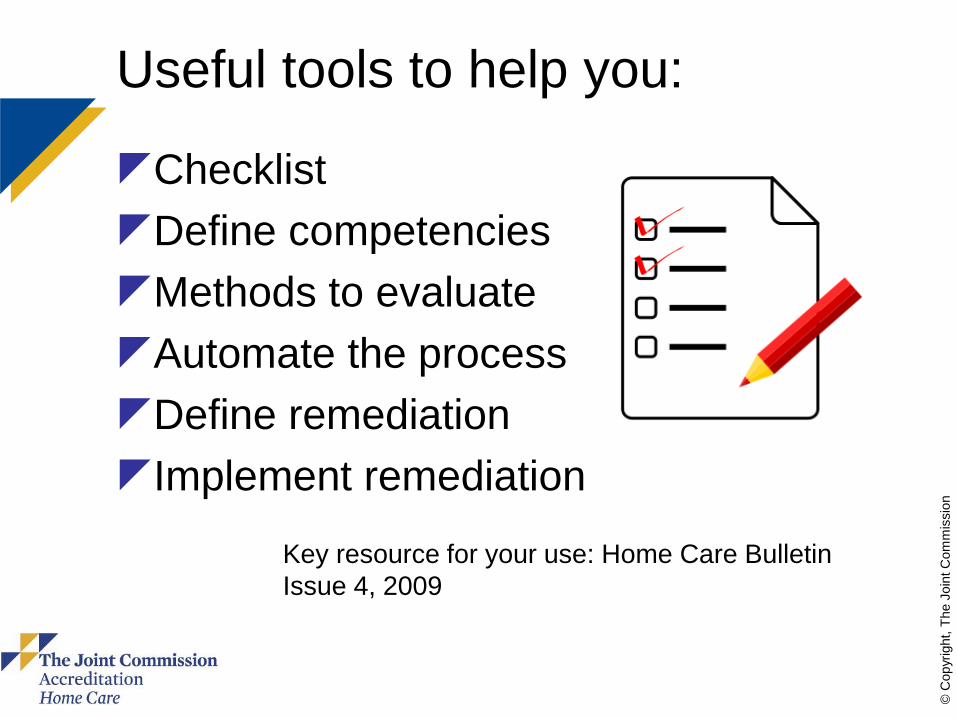
Useful tools to help you:
Checklist
Define competencies
Methods to evaluate
Automate the process
Define remediation
Implement remediation
Key resource for your use: Home Care Bulletin
Issue 4, 2009

© C
opyr
ight, T
he J
oin
t C
om
mis
sio
n
NPSG.07.01.01 Comply with either the
current Centers for Disease Control and Prevention
(CDC) hand hygiene guidelines or the current World
Health Organization (WHO) hand hygiene guidelines
Chief areas of non compliance
– Unclear choice of CDC or WHO guidelines
– Setting a goal, numerical and measurable
– Improving compliance with hand hygiene
against the chosen goal
22%

© C
opyr
ight, T
he J
oin
t C
om
mis
sio
n
Applied Strategy:
Review and choose either the CDC or WHO
guidelines for hand hygiene
– Evaluate current rate of performance
– Implement monitoring to measure ongoing
compliance rate compliance
– Set a credible goal (%) based on performance
Best practice includes direct observations of staff at
set points in time measured against a realistic
stretch goal.

© C
opyr
ight, T
he J
oin
t C
om
mis
sio
n
Useful resources to help you:
MEASURING HAND HYGIENE
ADHERENCE: OVERCOMING THE
CHALLENGES © 2009 The Joint
Commissionhttp://www.jointcommission.org/PatientS
afety/InfectionControl/hh_monograph.htm
Center for Transforming Healthcare Web site
Standards FAQ for NPSG.07.01.01

© C
opyr
ight, T
he J
oin
t C
om
mis
sio
n
Useful tools to use: Gap Analysis
Quantifiably measures difference between
desired state and actual state– Critically important to define the issue: process or outcome?
– Create a safe environment to measure actual state
– Design a SMART goal to promote success
– Measure frequently, report out often
– Leaders must be engaged and involved throughout the process

© C
opyr
ight, T
he J
oin
t C
om
mis
sio
n
EM.03.01.03 The organization evaluates
the effectiveness of its Emergency Operations
Plan.
Chief areas of non compliance
– Performing a drill each year
– Documentation of the evaluation of the
drill to include the deficiencies and
opportunities for improvement
– Stress the plan to identify weaknesses in
key areas such as patient acuity,
equipment and supplies
19%

© C
opyr
ight, T
he J
oin
t C
om
mis
sio
n
Applied Strategy:
Conduct a credible risk analysis
Perform a drill that is appropriate to a risk in your
area and the patient population served.
At the conclusion of the drill key participants and
leaders meet and identify which activities occurred
as expected and which required improvement.
Determine if the needs of high risk patients and
activities were met consistent with the planned
response.

© C
opyr
ight, T
he J
oin
t C
om
mis
sio
n
Useful resources to help you:
State websites for Emergency Management
Standards FAQ for EM.03.01.03
Enviroment of Care publications
http://www.jcrinc.com/2015-environment-of-
care-essentials-for-health-care/
Emergency Management section under
Topics on the Joint Commission home page

© C
opyr
ight, T
he J
oin
t C
om
mis
sio
n
PI.02.01.01 The organization compiles and
analyzes data
Chief areas of non compliance
– Implementation of the PI plan
– Analysis of the data collected
– Identification of areas of improvement
16%

© C
opyr
ight, T
he J
oin
t C
om
mis
sio
n
Applied Strategy:
Evaluate leadership role in defining PI priorities
Conduct a gap analysis between plan
expectations and current rate of
implementation.
Drill down to determine issues and trends
driving non-compliance.
Collect relevant data, perform credible
analysis, report frequently and transparently to
all key stakeholders

© C
opyr
ight, T
he J
oin
t C
om
mis
sio
n
Useful tools
ARMI analysis
Key Stakeholders
Define role
Approver, Resource,
Member or Interested Party
Stake holders may play different roles
in different phases

© C
opyr
ight, T
he J
oin
t C
om
mis
sio
n
Resources for TJC accredited
Experts in Standards Group
Leading Practice Library link on your
Extranet site
Experts in RPI at TJC
The Center for Transforming Healthcare
Perspectives
Your Surveyor
Your Account Executive

© C
opyr
ight, T
he J
oin
t C
om
mis
sio
n
Contribute to The Joint Commission
leading practice library
External company recognition
Contribute to industry expertise
Validate to staff that their work is valuable
Ignites employee interest and engagement
Familiarity breeds expertise

© C
opyr
ight, T
he J
oin
t C
om
mis
sio
n
SummaryStop doing:
Treating the symptom to
cure the condition
Convincing people these
issues have no solution
Thinking accreditation is
an event that occurs
triennially
Thinking you don’t have
the time for these tools
Thinking the problem is
outside your control
Start doing:
Get to the root and
eliminate the defect
Become a part of the
movement to improve the
system
Making accreditation
work for you!
Realizing that these tools
will help you save time
Effectively manage
processes.

© C
opyr
ight, T
he J
oin
t C
om
mis
sio
n
Account Executive
Standards Interpretation Help Desk: 630-792-5900
Joint Commission Resources: 877-223-6866 or www.jcrinc.com
Brenda Lamberti, BS
Senior Business Development
Specialist
630-792-5252 or
Home Care Team ContactsJoint Commission Home Care Program
Help Desk: 630-792-5070 or [email protected]
www.jointcommission.org/accreditation/home_care.aspx
Margherita Labson
BSN, MSHSA, CPHQ, CCM, CGB
Executive Director
630-792-5284 or
Julia Finken
BSN, MBA, CPHQ, CSSBB
Associate Director
630-792-5283 or
Monnette Geronimo
Business Development Specialist
630-792-5251 or


