Strategies for Supporting Access to High-Quality Early ...
20
Michael Katz November 2017 Every year, over 600,000 children are born in the six Great Lakes states. These children play a key role in the region’s future growth and prosperity, and early education is crucial to their success. Financing and expanding access to quality early education programs will pay dividends, as it can increase educational attainment, improve the sustainable workforce for the region, and boost local economies. State policies and programs should focus on expectant mothers and babies because the most crucial cognitive and physical development phase for children starts before birth (USAID 2017). Experiences from pregnancy through a child’s second birthday can influence a child’s ability to learn, develop social skills, self-regulate, and respond to stress with resilience (Center on the Developing Child 2015). Ensuring early brain development is particularly essential for children from low-income families, as inequities develop quickly. Vocabulary disparities between wealthy and low-income children appear as early as 18 months (Center on the Developing Child, n.d.). Crucial brain development continues from ages 3 to 5, when children learn essential cognitive, physical, behavioral, social, and emotional skills that prepare them to succeed in their formative years. Investing in children from birth through age 5 affects the long-term health and productivity of children and their communities. In this brief, we explore the benefits for children, families, and communities of two early education and care programs: home visiting and preschool. For both program areas, we identify how the Great Lakes states vary in their approaches and results. Finally, we offer recommendations for state leaders and local stakeholders looking to improve their programs through increased funding and realize the benefits of quality early childhood education. POLICY ADVISORY GROUP BUILDING LADDERS OF OPPORTUNITY FOR YOUNG PEOPLE IN THE GREAT LAKES STATES, BRIEF 1 Strategies for Supporting Access to High-Quality Early Education Programs
Transcript of Strategies for Supporting Access to High-Quality Early ...
Michael Katz
November 2017
Every year, over 600,000 children are born in the six Great Lakes states. These children
play a key role in the region’s future growth and prosperity, and early education is
crucial to their success. Financing and expanding access to quality early education
programs will pay dividends, as it can increase educational attainment, improve the
sustainable workforce for the region, and boost local economies.
State policies and programs should focus on expectant mothers and babies because the most crucial
cognitive and physical development phase for children starts before birth (USAID 2017). Experiences
from pregnancy through a child’s second birthday can influence a child’s ability to learn, develop social
skills, self-regulate, and respond to stress with resilience (Center on the Developing Child 2015).
Ensuring early brain development is particularly essential for children from low-income families, as
inequities develop quickly. Vocabulary disparities between wealthy and low-income children appear as
early as 18 months (Center on the Developing Child, n.d.). Crucial brain development continues from
ages 3 to 5, when children learn essential cognitive, physical, behavioral, social, and emotional skills that
prepare them to succeed in their formative years. Investing in children from birth through age 5 affects
the long-term health and productivity of children and their communities.
In this brief, we explore the benefits for children, families, and communities of two early education
and care programs: home visiting and preschool. For both program areas, we identify how the Great
Lakes states vary in their approaches and results. Finally, we offer recommendations for state leaders
and local stakeholders looking to improve their programs through increased funding and realize the
benefits of quality early childhood education.
P O L I C Y A D V I S O R Y G R O U P
BUILDING LADDERS OF OPPORTUNITY FOR YOUNG PEOPLE IN THE GREAT LAKES STATES, BRIEF 1
Strategies for Supporting Access to
High-Quality Early Education Programs

2 B U I L D I N G L A D D E R S O F O P P O R T U N I T Y F O R Y O U N G P E O P L E I N T H E G R E A T L A K E S S T A T E S
BOX 1
About This Policy Brief Series
This brief is part of a series recommending policies that will build ladders of opportunity and economic mobility for young people in the six state Great Lakes region—Illinois, Indiana, Michigan, Minnesota, Ohio, and Wisconsin.
The series of policy briefs follows a framing paper that detailed the challenges and opportunities facing the Great Lakes region (Pendall et al. 2017). During the first decade of the 2000s, manufacturing employment and incomes fell substantially, government revenues declined, and young people moved away from the region. Manufacturing has begun to rebound, but communities throughout the region are still dealing with the direct and ripple effects of this unprecedented blow to their economic base. Despite these severe challenges, ample evidence suggests the Great Lakes region has significant assets and a strong foundation that can sustain future economic and population growth and higher levels of prosperity. Ensuring the future productivity, stability, and prosperity of the region, though, requires policies and investments that bolster the people currently living in the Great Lakes states, especially young people.
The series includes five policy briefs with strategies for the following:
supporting access to high-quality child development and preschool programs (this brief)
eliminating gaps in K–12 education so all can read by third grade and graduate from high school ready for college or career (Gallagher and Chingos 2017)
promoting successful transitions to adulthood, higher education, and the workforce (Spaulding 2017)
reducing criminal and juvenile justice involvement for young people (Jannetta and Okeke 2017)
supporting basic needs to promote opportunity and economic mobility for young people (Hahn 2017)
The in-depth policy analyses and recommendations in these briefs shed light on what needs to be done and what decisionmakers can do to invest in young people and ensure broad-based prosperity and a high quality of life in the Great Lakes region for coming generations.
Home Visiting Programs: What Are
They and Whom Do They Benefit?
Home visiting programs provide parent and child services focused on child health and well-being, child
development and school readiness, positive parent-child relationships, parental health and well-being,
family economic self-sufficiency, and family functioning. Typically, a trained nurse, social worker, or
early childhood specialist provides these services at a family’s home (National Home Visiting Resource
Center 2017). The quality of home visiting programs can vary greatly. The US Department of Health and
Human Services has so far approved 20 evidence-based programs. In 2015, evidence-based home
visiting programs served 311,976 children nationwide. The majority of those children came from low-

S T R A T E G I E S F O R S U P P O R T I N G A C C E S S T O H I G H - Q U A L I T Y E A R L Y E D U C A T I O N P R O G R A M S 3
income families, and more than two-thirds were younger than 3 years old (National Home Visiting
Resource Center 2017).1
Evidence of Impact
Home visiting programs positively affect children, families, and their communities. This is especially true
for low-income families. Research demonstrates the need for quality evidenced-based programs to
yield positive outcomes. Research proves that high-quality home visiting programs can have positive
short- and long-term outcomes for children and families, as well as cost savings for the community.
▪ Low-income children who participated in one home visiting program in two large cities
demonstrated significantly better language development, impulse control, and academic
achievement than their peers in preschool and early grades (Kitzman et al. 2010; Olds et al.
2004).
▪ Seventy-nine percent of home visiting programs approved by the Department of Health and
Human Services show significant positive effects on child health (Sama-Miller et al. 2017).
▪ Eighty-eight percent of home visiting programs approved by the Department of Health and
Human Services show significant effects on positive parenting practices (Sama-Miller et al.
2017).
▪ A home visiting program in Durham, North Carolina, recouped initial costs by the time children
were 3 months old by reducing government medical assistance (Dodge and Goodman 2012).
▪ The Nurse-Family Partnership, active in all six Great Lakes states, yields an estimated $5.70 for
every dollar spent for high-risk children (Karoly, Kilburn, and Cannon 2005).
▪ The Parents as Teachers home visiting program had an estimated cost-benefit ratio of $3.39
per dollar invested (Kay and Pennucci 2014).
▪ Durham Connects has a community benefit of $3.01 per dollar invested by the time
participating children are 6 months old (Dodge et al. 2013).
Federal Mandates, Grants, and Encouragement
Before 2010, home visiting was a more fragmented system. States often did not target the highest-need
populations, fund the highest-quality programs, or carefully monitor spending or programs (Schmit et al.
2015). In 2010, the federal Maternal, Infant, and Early Childhood Home Visiting program changed the
home visiting landscape. The program provides funding to states to support evidence-based home
visiting programs for at-risk families and children. The program has awarded over $1.8 billion to states
since 2010, and the number of families served has increased five-fold over the past five years. Each
state has been awarded grant funds, with the requirement that 75 percent of the grant go toward
evidence-based programs and 25 percent go toward new promising programs that are being evaluated.

4 B U I L D I N G L A D D E R S O F O P P O R T U N I T Y F O R Y O U N G P E O P L E I N T H E G R E A T L A K E S S T A T E S
States now use a mix of Maternal, Infant, and Early Childhood Home Visiting program and categorical
and broad-based funding for their home visiting programs (Pew Center on the States 2011).
Home Visiting in the Great Lakes States
The home visiting landscape in each of the Great Lakes states varies based on the types of program,
target population, staff competencies, service providers, and funding. The 2017 Home Visiting Yearbook
provides important information regarding how the six states match up on home visiting efforts
(National Home Visiting Resource Center 2017). A relatively small share of children younger than 6 in
each state is served based on need and the availability of other care (e.g., family or relative care,
subsidized child care, private child care, public preschool). Figure 1 shows the ratio of eligible families to
families served in each state.
FIGURE 1
Ratio of Eligible Families to Families Served in Home Visiting Programs
Source: Data were extracted from the National Home Visiting Resource Center, Home Visiting Yearbook 2017 (Arlington, VA:
James Bell Associates and Urban Institute, 2017).
Indiana and Ohio stand out as serving a higher share of eligible families than the other states, while
Minnesota serves less than 1 out of 120 eligible families. Though ratios are helpful in visualizing the
state landscape, they do not account for states’ targeted efforts. Each of the six states focuses on the
youngest and highest-risk children, a strategy supported by research. In each state, over 75 percent of
children served in home visiting programs are newborn to age 2. States also target resources to low-
income and working-class families. Figure 2 shows the insurance status of children served.
0
15
30
45
60
75
90
105
120
135
Illinois Indiana Michigan Minnesota Ohio Wisconsin
Ratio in number of families

S T R A T E G I E S F O R S U P P O R T I N G A C C E S S T O H I G H - Q U A L I T Y E A R L Y E D U C A T I O N P R O G R A M S 5
FIGURE 2
Health Insurance Status of Children Served by Home Visiting
Source: Data were extracted from the National Home Visiting Resource Center, Home Visiting Yearbook 2017 (Arlington, VA:
James Bell Associates and Urban Institute, 2017).
States also differ on the average number of home visits per family served. This variation is likely
because of multiple factors, including the intensity and requirements of each program and the location
of programs in the state (figure 3).
FIGURE 3
Average Number of Home Visits per Family Served
Source: Data were extracted from the National Home Visiting Resource Center, Home Visiting Yearbook 2017 (Arlington, VA:
James Bell Associates and Urban Institute, 2017).
0%
10%
20%
30%
40%
50%
60%
70%
80%
90%
100%
Illinois Indiana Michigan Minnesota Ohio Wisconsin
No health insurance Private health insurance Public health insurance
0
2
4
6
8
10
12
14
Illinois Indiana Michigan Minnesota Ohio Wisconsin

6 B U I L D I N G L A D D E R S O F O P P O R T U N I T Y F O R Y O U N G P E O P L E I N T H E G R E A T L A K E S S T A T E S
For local and state governments, financing home visiting programs has proven to be a wise that can
pay dividends in the short and long term. Recent changes to federal spending approaches have also
provided a platform for states to expand their evidence-based home visiting programs.
Preschool: What Is It and Who Benefits?
Preschool programs provide early education and care for 3- to 5-year-olds before the start of
kindergarten. Programs focus on child development through teaching cognitive, language, social and
emotional, and physical skills. Preschool programs vary based on type of target population, curriculum,
service provider, quality, and funding. Though the federal government offers some funding for early
education (mainly through nonentitlement programs, Head Start, Individuals with Disabilities Education
Act, Preschool Development Grants), most of the money comes from state and local governments. That
provides an important opportunity for state governors and legislators. Many programs target low-
income children to reduce inequities and close the achievement gap. Great Lakes states are primed to
make policy changes that can bolster a well-educated and well-trained workforce and spark economic
prosperity.
Evidence of Impact
Preschool programs have a rich evidence base that documents the value of preschool. But this value
depends on the program’s quality. Research shows that poor and low-performing prekindergarten can
have an adverse effect on children’s kindergarten readiness. Only high-quality prekindergarten has
demonstrated significant effects on children’s short- and long-term outcomes (Minervino 2014).
Research has explored many types of preschool programs that vary in size, funding source, quality, and
other key factors. The level of evidence differs on long-term key outcomes based on the type of
program, but ample support remains for the academic, societal, and economic effects of high-quality
preschool.
Academic Effect
Preschool can be an important building block for children’s development and academic success. These
academic effects are realized in the short and long term.
▪ High-quality preschool programs have a positive effect on cognitive development and school
readiness for all children, but they have a relatively larger effect for black and Hispanic children
and for children from low-income families (Ahmad and Hamm 2013; Phillips et al. 2017;
Yoshikawa et al. 2013).
▪ High-quality preschool has been linked to higher assessment scores, lower special education
placement, and lower grade retention through all grades (O’Brien and Dervarics 2007).
▪ Students enrolled in preschool have higher rates of high school graduation (Reynolds et al.
2002).

S T R A T E G I E S F O R S U P P O R T I N G A C C E S S T O H I G H - Q U A L I T Y E A R L Y E D U C A T I O N P R O G R A M S 7
Societal and Economic Effects
Investment in preschool has also shown long-term effects that are relevant to public spending and local
economies. Three of the most prominent longitudinal studies—Perry Preschool Study, Abecedarian
Project, and Chicago Child-Parent Centers—demonstrate the potential long-term effects of preschool.
The three studies found that participants in high-quality prekindergarten were less likely to be arrested
in adulthood and more likely to attend college, be employed, and earn higher wages (García et al. 2016;
Heckman et al. 2009; Reynolds et al. 2011). Though these three studies offer important lessons, critics
have pointed out that those programs differ greatly from today’s prekindergarten programs.2
Nonetheless, more recent studies have reaffirmed some of the findings on long-term outcomes (e.g.,
criminal activity, higher education) for programs that resemble today’s models.
▪ The Oklahoma universal prekindergarten program reduced the likelihood that black 18- and
19-year-olds would commit misdemeanor (7 percent reduction) and felony (5 percent
reduction) crimes (Smith 2015).
▪ Adults who attended Head Start were more likely to graduate high school and attend college
compared with their peers (Garces, Thomas, and Currie 2002).
Economic gain is not limited to participants. Studies use a variety of measures to calculate the
financial benefits of early education. Some of the common components of such analyses are tied to
increases in higher education and income of participants, as well as reductions in criminal activity,
health care costs, and safety net participation. Many cost-benefit analyses have determined that each
dollar invested in early education yields large long-term savings.
▪ Researchers estimated that current state and district prekindergarten programs for low-
income 3- and 4-year-olds have a benefit-to-cost ratio of $4.20 (Kay and Pennucci 2014).
▪ Researchers estimated that universal preschool in California would have 2.6:1 benefit-to-cost
ratio for the state and society (Karoly and Bigelow 2005).
▪ A cost-benefit analysis of providing universal preschool to all children in the US yielded an
estimate of $8.90 for every dollar spent, or $304.7 billion in total benefit by 2050 (Lynch and
Vaghul 2015).
Others have highlighted how expanded access can create a more educated and qualified workforce
and ultimately boost local economies (Bartik 2012). Expanded early education can particularly benefit
low-income and working families, as they have the greatest need for free or even subsidized care to
maintain financial stability and employment (Aspen Institute 2013).
The evidence on preschool demonstrates the positive spillover effect of programs into many
different sectors. This makes preschool expansion a worthy goal to spark growth in the Great Lakes
region. But states must consider how to fund and balance competing needs of quality and access.

8 B U I L D I N G L A D D E R S O F O P P O R T U N I T Y F O R Y O U N G P E O P L E I N T H E G R E A T L A K E S S T A T E S
Federal Involvement in Preschool
Financing preschool expansion and improving its quality involves many funding streams and strategies.
Funding for preschool programs is difficult to secure for a few reasons: preschool programs are
discretionary, and funding is vulnerable and inconsistent; preschool is typically voluntary, unlike
compulsory 1st through 12th grade nationwide; and the benefits of preschool accrue over time and
often occur in other sectors (e.g., crime reductions) (Kreeger and Massey 2016).
Traditional federal funding for preschool includes money for Head Start and Early Head Start, early
intervention and special education through Individuals with Disabilities Education Act (also known as
IDEA), and Title 1 of the No Child Left Behind Act. Federal grants including the Preschool Development
Grant (PDG) program broken into three categories (development, expansion, and pay for success
grants) also offer some funds. Illinois has a preschool expansion grant, which offers financial support
and a corresponding evaluation focused on providing and expanding high-quality, full-day
prekindergarten programs in 18 communities.3 The Minnesota Department of Education and Cuyahoga
County, Ohio, receive pay-for-success feasibility grants that ultimately aim to leverage public and
private funds. This approach involves investors funding the expansion and improvement of programs to
meet specific outcomes (e.g., kindergarten readiness, third grade reading). Investors are repaid if
participants achieve those outcomes.
Federal programs target children with special needs and children from low-income families.
Programs funded through federal dollars are held to high standards in terms of quality, safety, inclusion
of students with special needs, and continuous quality improvement.
Preschool in the Great Lakes States
Where do the Great Lakes states stand in terms of preschool access, funding, and quality? We look at
available data from the National Institute Early Education Research’s State of Preschool 2016 yearbook
to answer that question (Barnett et al. 2017).
Access
Wisconsin’s high level of enrollment stands out, as it has a long-standing state-funded prekindergarten
program (figure 4). In contrast, Indiana and Minnesota are in earlier stages of growing their state
prekindergarten programs. Both have piloted prekindergarten programs in 2014 and 2016,
respectively, but they still serve just over 1 percent of 4-year-olds in state prekindergarten programs.
Two of the Great Lakes states have no state programs for 3-year-olds, and two others have programs
for 3-year-olds that serve well below the US average.

S T R A T E G I E S F O R S U P P O R T I N G A C C E S S T O H I G H - Q U A L I T Y E A R L Y E D U C A T I O N P R O G R A M S 9
FIGURE 4
Share of 3- and 4-Year-Olds Enrolled in State Prekindergarten
2015–16 school year
Source: Data extracted from W. Steven Barnett, Allison H. Friedman-Krauss, G. G. Weisenfeld, Michelle Horowitz, Richard
Kasmin, and James H. Squires, The State of Preschool 2016 (New Brunswick, NJ: National Institute for Early Education Research,
2017).
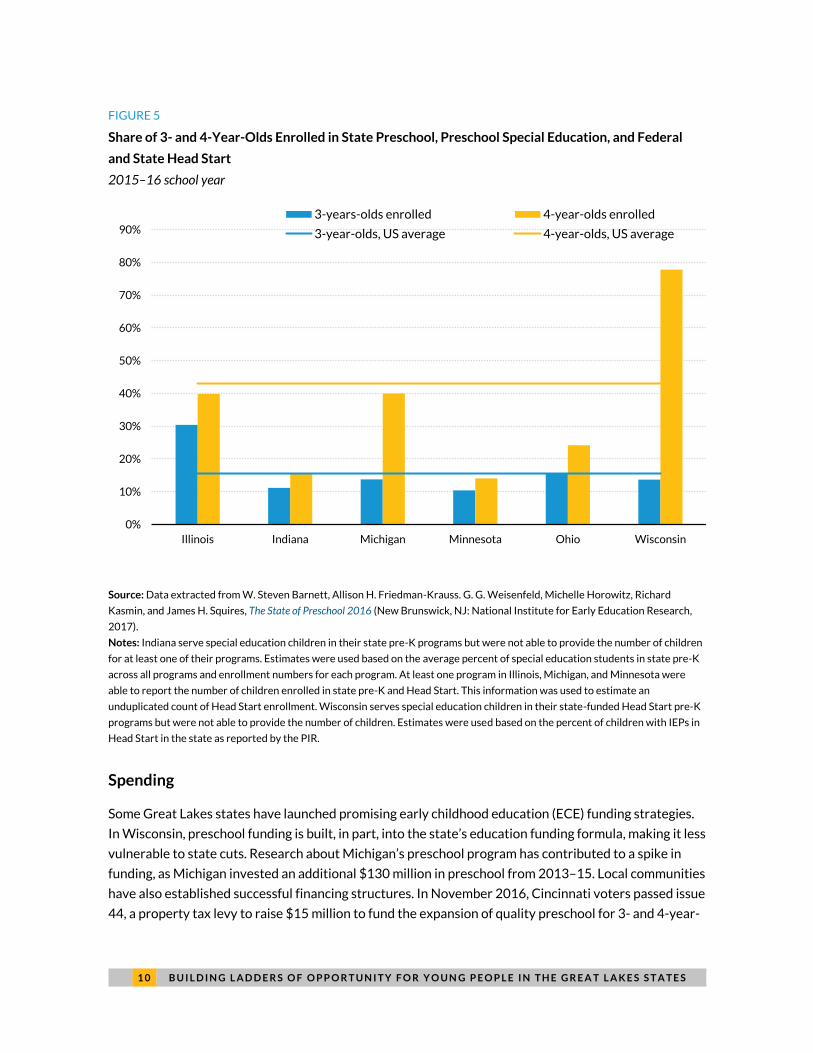
Figure 5 shows the combination of slots provided by state-funded preschool, the Head Start
program, and the Individuals with Disabilities Education Act for students with special needs. In this
figure, all states, with the exception of Wisconsin, serve less than the national average of 4-year-olds
through these programs, and only Illinois serves more than the national average of 3-year-olds.
0%
10%
20%
30%
40%
50%
60%
70%
Illinois Indiana Michigan Minnesota Ohio Wisconsin
4-year-olds enrolled 3-year-olds enrolled
4-year-olds, US average 3-year-olds, US average
1 0 B U I L D I N G L A D D E R S O F O P P O R T U N I T Y F O R Y O U N G P E O P L E I N T H E G R E A T L A K E S S T A T E S
FIGURE 5
Share of 3- and 4-Year-Olds Enrolled in State Preschool, Preschool Special Education, and Federal
and State Head Start
2015–16 school year
Source: Data extracted from W. Steven Barnett, Allison H. Friedman-Krauss. G. G. Weisenfeld, Michelle Horowitz, Richard
Kasmin, and James H. Squires, The State of Preschool 2016 (New Brunswick, NJ: National Institute for Early Education Research,
2017).
Notes: Indiana serve special education children in their state pre-K programs but were not able to provide the number of children
for at least one of their programs. Estimates were used based on the average percent of special education students in state pre-K
across all programs and enrollment numbers for each program. At least one program in Illinois, Michigan, and Minnesota were
able to report the number of children enrolled in state pre-K and Head Start. This information was used to estimate an
unduplicated count of Head Start enrollment. Wisconsin serves special education children in their state-funded Head Start pre-K
programs but were not able to provide the number of children. Estimates were used based on the percent of children with IEPs in
Head Start in the state as reported by the PIR.
Spending
Some Great Lakes states have launched promising early childhood education (ECE) funding strategies.
In Wisconsin, preschool funding is built, in part, into the state’s education funding formula, making it less
vulnerable to state cuts. Research about Michigan’s preschool program has contributed to a spike in
funding, as Michigan invested an additional $130 million in preschool from 2013–15. Local communities
have also established successful financing structures. In November 2016, Cincinnati voters passed issue
44, a property tax levy to raise $15 million to fund the expansion of quality preschool for 3- and 4-year-
0%
10%
20%
30%
40%
50%
60%
70%
80%
90%
Illinois Indiana Michigan Minnesota Ohio Wisconsin
3-years-olds enrolled 4-year-olds enrolled
3-year-olds, US average 4-year-olds, US average

S T R A T E G I E S F O R S U P P O R T I N G A C C E S S T O H I G H - Q U A L I T Y E A R L Y E D U C A T I O N P R O G R A M S 1 1
olds.4 The Rockford Public School District in Illinois coordinated a $13.8 million budget for preschool
that combines funding from state prekindergarten, federal PDG program local funds, and Head Start.
Despite these promising strategies, preschool is still underfunded in most of the Great Lakes states.
Minnesota is the only Great Lakes state in the top third of spending per student among all states, and
three of the states fall below the US average. Additionally, state spending decreased in three of the six
Great Lakes states between the 2014–15 and 2015–16 school years (figure 6).
FIGURE 6
State Funding per 4-Year-Old Child Enrolled in State Prekindergarten
Source: Data extracted from W. Steven Barnett, Allison H. Friedman-Krauss, G. G. Weisenfeld, Michelle Horowitz, Richard
Kasmin, and James H. Squires, The State of Preschool 2016 (New Brunswick, NJ: National Institute for Early Education Research,
2017).
($1,000)
$0
$1,000
$2,000
$3,000
$4,000
$5,000
$6,000
$7,000
$8,000
$9,000
Illinois Indiana Michigan Minnesota Ohio Wisconsin
Per child enrolled Change per child 2014–15 to 2015–16
US average per child enrolled

1 2 B U I L D I N G L A D D E R S O F O P P O R T U N I T Y F O R Y O U N G P E O P L E I N T H E G R E A T L A K E S S T A T E S
Though many policymakers agree that preschool is an essential building block for student
achievement and success and that education should be considered in a prekindergarten-through-12th-
grade spectrum, preschool funding pales in comparison with K–12 (figure 7). K–12 spending is
sometimes triple (i.e., Illinois and Ohio) the amount spent for preschool.
FIGURE 7
State Funding Per 4-Year-Old Child Enrolled in State Prekindergarten
Sources: Data extracted from W. Steven Barnett, Allison H. Friedman-Krauss, G. G. Weisenfeld, Michelle Horowitz, Richard
Kasmin, and James H. Squires, The State of Preschool 2016 (New Brunswick, NJ: National Institute for Early Education Research,
2017); and “Education Spending per Student,” Governing, accessed September 5, 2017, http://www.governing.com/gov-
data/education-data/state-education-spending-per-pupil-data.html.
Quality
Based on the new quality standard rating in the Barnett and colleagues report (2017), three of the state
programs rank below average in terms of the program quality as defined by a variety of criteria (e.g.,
teacher qualifications, teacher-to-child ratio, curriculum), and all show room for improvement,
especially in staff professional development (table 1). The framework for analyzing high-quality early
education programs, developed by Jim Minervino (2014), also highlights where the Great Lakes states
can improve. This framework considers enabling environment, rigorous policies, and strong practices.
An assessment of this framework shows that the early education programs in the six Great Lakes states
have strengths but still need substantial improvement, especially in political will (e.g., political
$0
$2,000
$4,000
$6,000
$8,000
$10,000
$12,000
$14,000
Illinois Indiana Michigan Minnesota Ohio Wisconsin
K–12 per pupil spending Preschool per pupil spending

S T R A T E G I E S F O R S U P P O R T I N G A C C E S S T O H I G H - Q U A L I T Y E A R L Y E D U C A T I O N P R O G R A M S 1 3
leadership, ballot initiatives, court orders) and integrated systems (i.e., state’s activities to align
standards, curricula, professional development, and assessment) (Barnett et al. 2016).
TABLE 1
State Performance on Quality Standards
IL IN MI MN OH WI
Early learning and development standards X X X X X
Curriculum supports X X X X X
Teacher has bachelor’s degree X X X
Specialized training in pre-K X X X X X
Assistant teacher has CDA or equivalent X X
Staff professional development
Class size 20 or fewer X X X
Staff-child ratio 1:10 or better X X X
Vision, hearing, and health screening and referral X X X X
Continuous quality improvement X X
New quality standards checklist sum 7 1 9 7 5 3
Note: CDA = Child Development Associate.
Michigan has showcased a long-standing commitment to quality standards since the inception of its
preschool program in the 1980s.5 Michigan has updated these standards to match research and
evidence in the field and, since 2011, has worked to bring all ECE programs under one umbrella to
improve administration, measurement, and continual quality improvement (Wechsler et al. 2016).
Recommendations
The Great Lakes states have made strides in developing home visiting and preschool programs, but they
still fall short. Home visiting programs are fragmented and financed primarily by federal funds, and they
are only one of many services (e.g., infant and toddler child care, Special Supplemental Nutrition
Program for Women, Infants, and Children) that support child development and health. States should
assess how to leverage evidence of impact, partners, and increased federal funding on home visiting to
expand these initiatives and cultivate new evidence-based programs that meet their needs. States can
also look for areas to integrate services or systems for newborns to 2-, 3-, and 4-year-olds.
Preschool offers even more opportunity for concrete policy change. Particularly, the Great Lakes
states must focus on building political and legislative support to improve preschool access, quality, and
funding streams.

1 4 B U I L D I N G L A D D E R S O F O P P O R T U N I T Y F O R Y O U N G P E O P L E I N T H E G R E A T L A K E S S T A T E S
Garner Bipartisan Political and Legislative Support
State and local legislators play a key role in determining the use of tax funds and in passing legislation
with important budget implications. Therefore, the value of preschool must be framed correctly to
garner necessary support among countless other priorities:
Refine strategic plans for garnering bipartisan political and legislative support around the
sustainable expansion of preschool using evidence, effective framing and messaging of the
topic, and collaboration with key stakeholders. States must be opportunistic about when and
how to introduce legislation or ballot initiatives focused on expanding high-quality preschool.
States should use the relevant evidence base on short- and long-term benefits for participants
and communities to strengthen their case and garner bipartisan support. For example, Michigan
used positive evaluation results demonstrating the impact of its Great Start Readiness Program
to catalyze a $130 million increase in funding over two years.6 This push for new funding was
championed by Republican governor Rick Snyder and garnered bipartisan support in the
legislature. Despite a difficult negotiation and sometimes contentious debate, Minnesota also
struck a bipartisan deal for $25 million to launch a free preschool program in public and charter
schools in 2016.7 In Cincinnati, a strong broad-based coalition of local stakeholders,
organizations, and legislators from both parties led the Preschool Promise campaign. They
championed the expansion of high-quality preschool and helped win by a resounding 44-vote
margin.
Support and disseminate research and evaluation of preschool expansion efforts to enhance
campaigns for increased funding. Preschool expansion evaluations can demonstrate the
program’s value and be a crucial fundraising tool, as seen in the Michigan example above.
Evaluations that focus on short- and long-term outcomes across sectors as well as financial
costs and benefits resonate most with policy experts and voters.
Finance Expanded Access to High-Quality Preschool
Financing preschool expansion and improving quality is not a one-size-fits-all solution and requires
foresight about state and local context and short- and long-term trade-offs. Blended funding streams
are a key aspect of preschool finance. Evidence from current programs and strategies from many states
and localities nationwide can provide important ideas for shaping financing tactics. The following are
ways states can improve upon funding strategies:
▪ Build preschool funding into the state’s education formula. In Wisconsin; Washington, DC; and
states with high access rates, preschool funding is partially built in to the state’s education
funding formula. This funding structure is less vulnerable and can be expanded or enhanced
with improvements to the K–12 formula. It also strengthens the opportunity to create a more
integrated prekindergarten–12 system in terms of funding, data, and rules and regulations.

S T R A T E G I E S F O R S U P P O R T I N G A C C E S S T O H I G H - Q U A L I T Y E A R L Y E D U C A T I O N P R O G R A M S 1 5
Identify local and state tax and revenue sources that can be earmarked for preschool
expansion. In Georgia, where about 60 percent of 4-year-olds are enrolled in state
prekindergarten, the program is funded by state lottery revenues. Five other states have
prekindergarten budgets that are funded in part or entirely through lottery revenue, while
multiple states use tobacco settlement funds to cover the cost of prekindergarten (Stone 2008).
These funding streams are relatively consistent and are a strong starting point for financing
programs.
Develop policies to support and encourage local funding strategies and the goal of expanded
or universal high-quality preschool in cities. Many large cities across the country have moved
toward expanding preschool in their districts through local or blended funding streams. A study
of 10 large districts with expanded or universal prekindergarten showed diverse funding
strategies, including increased sales taxes and property taxes (Muenchow and Weinberg 2016).
Cincinnati provides a strong example of this strategy as it passed a property tax levy for $15
million to fund the expansion of quality preschool for 3- and 4-year-olds in the district.8
Explore creative funding possibilities to support the expansion of high-quality preschool and
infrastructure, including blended funding streams, private-public partnerships, and new local
tax sources. State leaders and legislators must think outside the box about how to leverage new
and existing funds to build a high-quality early education system. Funding strategies for
prekindergarten, including pay for success, as well as blending different funding sources
provide promising solutions to enhance programs’ sustainability. In Washington, DC, officials
developed a blended funding model using Head Start and local funding from the state education
formula. This financing structure supports their unique Head Start schoolwide model, which
serves 81 percent of 4-year-olds and 70 percent of 3-year-olds in the district (Barnett et al.
2017). In Illinois, the Rockford Public School District coordinates a $13.8 million budget for
preschool that combines funding from the state prekindergarten, federal PDG program, local
funds, and Head Start. The full-day program is operated through the child care center and a
Head Start program (Fonseca 2015).
Improve Quality
Program quality is essential in realizing the positive effects of ECE on children, families, and the
community and is intertwined with financing. Quality is a shared goal across the field, but there is a lack
of consensus regarding which aspects of quality (e.g., teacher training, professional development, class
size, staff-child ratios) are most important and what are the best trade-offs given limited resources.
Measuring some of these quality components can also present a challenge. For this reason, much of the
discussion on quality often focuses on measurable regulation components, including well-defined
standards and the successful delivery and monitoring of strong evidence-based curricula. Standards for
program quality focus on classroom environment, instruction, and teacher preparation and training. The
following are recommendations for states to improve program quality:

1 6 B U I L D I N G L A D D E R S O F O P P O R T U N I T Y F O R Y O U N G P E O P L E I N T H E G R E A T L A K E S S T A T E S
Focus on clear-cut quality standards and goals that match federal guidance and high-
performing states, and use them to encourage ECE staff training and maintenance of high-
quality programs. States should look to adopt and adapt high standards developed for federal
grants, such as the PDG program or those used in high-performing states (e.g., Michigan). They
should use these examples to refine quality rating systems to meet unique state needs and
contextual factors. In drawing from strong program examples, states should emphasize
developing and supporting the early childhood workforce. This can be accomplished through
tailored and multifaceted approaches involving standardized and competitive rates,
opportunities for career growth, effective coaching and training, continuing education, and
other professional development opportunities (Ullrich, Hamm, and Schochet 2017).
Competitive grants, awards, and similar mechanisms can support the push for quality. For
example, Illinois is using the Race to the Top funding to help improve and enhance early learning
standards, align vision and goals, and push districts to adopt high-quality approaches.
Invest in the growth of promising programs that meet state standards and allow local
communities to innovate to match their specific needs. Some districts, such as Boston, have
found value in developing integrated curricula that combine different evidence-based curricula
to meet multiple objectives along with focusing on coaching and professional development
(Weiland and Yoshikawa 2013). States should encourage innovation at the local level.
Conclusions
Expanding preschool requires a sizeable investment, but evidence has shown this investment can pay
dividends in terms of improving children’s academic success, reducing the achievement gap, and saving
money in the long run. States and localities must assess how their goals for preschool match up with
their goals and efforts for academic improvement, workforce development, and economic growth. The
Great Lakes states are at different phases of their preschool initiatives, but they all can take concrete
steps to enhance policy and expand high-quality preschool programs.
Notes
1. More than three-quarters of households served through the Maternal, Infant, and Early Childhood Home Visiting program reported annual family incomes below the federal poverty guidelines (approximately $20,000 for a family of three in 2015).
2. Grover J. Whitehurst, “Does Pre-K Work? It Depends How Picky You Are,” Brown Center Chalkboard (blog), Brookings Institution, February 26, 2014, https://www.brookings.edu/research/does-pre-k-work-it-depends-how-picky-you-are/.
3. “Early Childhood: Preschool Expansion Model,” Illinois State Board of Education, accessed September 5, 2017, https://www.isbe.net/Pages/Preschool-Development-Grant-Expansion-Grant.aspx.
4. “CPS and Preschool Promise,” Cincinnati Public Schools, accessed September 5, 2017, https://www.cps-k12.org/about-cps/financial-information/preschool-promise.

S T R A T E G I E S F O R S U P P O R T I N G A C C E S S T O H I G H - Q U A L I T Y E A R L Y E D U C A T I O N P R O G R A M S 1 7
5. Tomoko Wakabayashi, Richard Lower, and Beth Hardin, “High-Quality, Statewide Preschool Is Possible—Just Look to Michigan,” Brown Center Chalkboard (blog), Brookings Institution, January 25, 2017, https://www.brookings.edu/blog/brown-center-chalkboard/2017/01/25/high-quality-statewide-preschool-is-possible-just-look-to-michigan/.
6. See note 5 above.
7. David Loewenberg, “Hope and Caution with Minnesota’s ‘Universal’ Pre-K Rollout,” New America, September 12, 2016, https://www.newamerica.org/education-policy/edcentral/hope-and-caution-minnesota-universal-pre-k-rollout/.
8. See note 4 above.
References
Ahmad, Farah Z., and Katie Hamm. 2013. “The School-Readiness Gap and Preschool Benefits for Children of Color.” Washington, DC: Center for American Progress.
Aspen Institute. 2013. “Two Generations, One Future: Innovations in Early Childhood.” Washington, DC: Aspen Institute.
Barnett, W. Steven, Allison H. Friedman-Krauss, G. G. Weisenfeld, Michelle Horowitz, Richard Kasmin, and James H. Squires. 2017. The State of Preschool 2016: State Preschool Yearbook. New Brunswick, NJ: Rutgers University, Graduate School of Education, National Institute for Early Education Research.
Barnett, W. Steven, G. G. Weisenfeld, Kirsty Brown, Jim Squires, and Michelle Horowitz. 2016. Implementing 15 Essential Elements for High Quality: A State and Local Policy Scan. New Brunswick, NJ: Rutgers University, Graduate School of Education, National Institute for Early Education Research.
Bartik, Timothy. 2012. “The Economic Case for Preschool.” Lecture given at TEDxMiamiUniversity, Oxford, OH, September.
Center on the Developing Child. 2015. “Supportive Relationships and Active Skill-Building Strengthen the Foundations of Resilience.” Working Paper 13. Cambridge, MA: Harvard University, Center on the Developing Child.
———. n.d. “Five Numbers to Remember about Early Childhood Development.” Cambridge, MA: Harvard University, Center on the Developing Child.
Dodge, Kenneth A., and Ben Goodman. 2012. Durham Connects Impact Evaluation Final Report. Washington, DC: Pew Center on the States.
Dodge, Kenneth A., W. Benjamin Goodman, Robert A. Murphy, Karen O'Donnell, and Jeannine Sato. 2013. “Randomized Controlled Trial of Universal Postnatal Nurse Home Visiting: Impact on Emergency Care.” Pediatrics 132 (2): S140–46.
Fonseca, Manuela. 2015. Braiding, Blending, and Layering Funding Sources to Increase Access to Quality Preschool. Herndon, VA: AEM Corporation.
Gallagher, Megan, and Matthew M. Chingos. 2017. “Strategies for Supporting Early Reading Proficiency to Close Achievement Gaps.” Building Ladders of Opportunity for Young People in the Great Lakes States, brief 2. Washington, DC: Urban Institute.
Garces, Eliana, Duncan Thomas, and Janet Currie. 2002. “Longer-Term Effects of Head Start.” American Economic Review 92 (4): 999–1012.
García, Jorge Luis, James J. Heckman, Duncan Ermini Leaf, and María José Prados. 2016. “The Life-Cycle Benefits of an Influential Early Childhood Program.” Discussion Paper 10456. Bonn, Germany: IZA Institute of Labor Economics.
Hahn, Heather. 2017. “Strategies for Supporting Basic Needs to Promote Opportunity and Economic Mobility.” Building Ladders of Opportunity for Young People in the Great Lakes States, brief 5. Washington, DC: Urban Institute.

1 8 B U I L D I N G L A D D E R S O F O P P O R T U N I T Y F O R Y O U N G P E O P L E I N T H E G R E A T L A K E S S T A T E S
Heckman, James J., Seong Hyeok Moon, Rodrigo Pinto, Peter A. Savelyev, and Adam Yavitz. 2009. “The Rate of Return to the High/Scope Perry Preschool Program.” Working Paper 15471. Cambridge, MA: National Bureau of Economic Research.
Jannetta, Jesse, and Cameron Okeke. 2017. “Strategies for Reducing Criminal and Juvenile Justice Involvement.” Building Ladders of Opportunity for Young People in the Great Lakes States, brief 4. Washington, DC: Urban Institute.
Karoly, Lynn A., and James H. Bigelow. 2005. “The Economics of Investing in Universal Preschool Education in California.” Santa Monica, CA: RAND Corporation.
Karoly, Lynn A., M. Rebecca Kilburn, and Jill S. Cannon. 2005. Early Childhood Interventions: Proven Results, Future Promise. Santa Monica, CA: RAND Corporation.
Kay, Noa, and Annie Pennucci. 2014. Early Childhood Education for Low-Income Students: A Review of the Evidence and Benefit-Cost Analysis. Olympia: Washington State Institute for Public Policy.
Kitzman Harriet J., David L. Olds, Robert E. Cole, Carole A. Hanks, Elizabeth A. Anson, Kimberly Arcoleo, Dennis W. Luckey, et al. 2010. “Enduring Effects of Prenatal and Infancy Home Visiting by Nurses on Children: Follow-Up of a Randomized Trial among Children at Age 12 Years.” Archives of Pediatrics and Adolescent Medicine 164 (5): 412–18.
Kreeger, Arden, and Meg Massey. 2016. “Program Funding and Financing.” Washington, DC: Urban Institute.
Lynch, Robert, and Kavya Vaghul. 2015. The Benefits and Costs of Investing in Early Childhood Education: The Fiscal, Economic, and Societal Gains of a Universal Prekindergarten Program in the United States, 2016–2050. Washington, DC: Washington Center for Equitable Growth.
Minervino, Jim. 2014. Lessons from Research and the Classroom: Implementing High-Quality Pre-K That Makes a Difference for Young Children. Seattle: Bill & Melinda Gates Foundation.
Muenchow, Susan, and Emily Weinberg. 2016. “Ten Questions Local Policymakers Should Ask about Expanding Access to Preschool.” Washington, DC: American Institutes for Research.
National Home Visiting Resource Center. 2017. 2017 Home Visiting Yearbook. Arlington, VA: James Bell Associates and Urban Institute.
O’Brien, Eileen M., and Chuck Dervarics. 2007. “Prekindergarten: What the Research Shows.” Alexandria, VA: Center for Public Education.
Olds, David L., JoAnn Robinson, Lisa Pettitt, Dennis W. Luckey, John Holmberg, Rosanna K. Ng, Kathy Isacks, et al. 2004. “Effects of Home Visits by Paraprofessionals and by Nurses: Age 4 Follow-Up of a Randomized Trial.” Pediatrics 114 (6): 1560–68.
Pendall, Rolf, Erika Poethig, Mark Treskon, and Emily Blumenthal. 2017. The Future of the Great Lakes Region. Washington, DC: Urban Institute.
Pew Center on the States. 2011. States and the New Federal Home Visiting Initiative: An Assessment from the Starting Line. Washington, DC: Pew Center on the States.
Phillips, Deborah A., Mark W. Lipsey, Kenneth A. Dodge, Ron Haskins, Daphna Bassok, Margaret R. Burchinal, Greg J. Duncan, et al. 2017. Puzzling It Out: The Current State of Scientific Knowledge on Prekindergarten Effects. Washington, DC: Brookings Institution.
Reynolds, Arthur J., Judy A. Temple, Suh-Ruu Ou, Irma A. Artaega, and Barry A. B. White. 2011. “School-Based Early Childhood Education and Age-28 Well-Being: Effects by Timing, Dosage, and Subgroups.” Science 333 (6040): 360–64.
Reynolds, Arthur J., Judy A. Temple, Dylan L. Robertson, and Emily A. Mann. 2002. “Age 21 Cost-Benefit Analysis of the Title I Chicago Child-Parent Centers.” Educational Evaluation and Policy Analysis 24 (4): 267–303.
Sama-Miller, Emily, Lauren Akers, Andrea Mraz-Esposito, Marykate Zukiewicz, Sarah Avellar, Diane Paulsell, and Patricia Del Grosso. 2017. “Home Visiting Evidence of Effectiveness Review: Executive Summary.” Washington, DC: US Department of Health and Human Services, Administration for Children and Families, Office of Planning, Research, and Evaluation.

S T R A T E G I E S F O R S U P P O R T I N G A C C E S S T O H I G H - Q U A L I T Y E A R L Y E D U C A T I O N P R O G R A M S 1 9
Schmit, Stephanie, Liz Schott, LaDonna Pavetti, and Hannah Matthews. 2015. “Effective, Evidence-Based Home Visiting Programs in Every State at Risk if Congress Does Not Extend Funding.” Washington, DC: Center on Budget and Policy Priorities.
Smith, Alex. 2015. The Long-Run Effects of Universal Pre-K on Criminal Activity. Working Paper. West Point, NY: US Military Academy.
Spaulding, Shayne. 2017. “Strategies for Promoting Successful Transitions to Adulthood, Higher Education, and the Workforce.” Building Ladders of Opportunity for Young People in the Great Lakes States, brief 3. Washington, DC: Urban Institute.
Stone, Diane. 2008. Funding the Future: States’ Approaches to Pre-K Finance - 2008 Update. Washington, DC: Pre-K Now.
Ullrich, Rebecca, Katie Hamm, and Leila Schochet. 2017. 6 Policies to Support the Early Childhood Workforce. Washington, DC: Center for American Progress.
USAID (United States Agency for International Development). 2017. “The 1,000-Day Window of Opportunity: Technical Guidance Brief.” Washington, DC: USAID.
Wechsler, Marjorie, David Kirp, Titilayo Tinubu Ali, Madelyn Gardner, Anna Maier, Hanna Melnick, and Patrick M. Shields. 2016. The Road to High-Quality Early Learning Lessons from the States. Palo Alto, CA: Learning Policy Institute.
Weiland, Christina, and Hirokazu Yoshikawa. 2013. “Impacts of a Prekindergarten Program on Children’s Mathematics, Language, Literacy, Executive Function, and Emotional Skills.” Child Development 84 (6): 2112–30.
Yoshikawa, Hirokazu, Christina Weiland, Jeanne Brooks-Gunn, Margaret R. Burchinal, Linda M. Espinosa, William T. Gormley, Jens Ludwig, et al. 2013. “Investing in Our Future: The Evidence Base on Preschool.” New York: Foundation for Child Development.

2 0 B U I L D I N G L A D D E R S O F O P P O R T U N I T Y F O R Y O U N G P E O P L E I N T H E G R E A T L A K E S S T A T E S
About the Author
Michael Katz is a research associate in the Center on Labor, Human Services, and
Population at the Urban Institute, where he helps lead and manage projects evaluating
alternatives to school discipline, school choice for low-income families, and
prekindergarten access and expansion.
Acknowledgments
This brief was funded by the Joyce Foundation. We are grateful to them and to all our funders, who
make it possible for Urban to advance its mission.
The views expressed are those of the author and should not be attributed to the Urban Institute, its
trustees, or its funders. Funders do not determine research findings or the insights and
recommendations of Urban experts. Further information on the Urban Institute’s funding principles is
available at www.urban.org/support.
ABOUT THE URBAN INST IT UTE The nonprofit Urban Institute is dedicated to elevating the debate on social and economic policy. For nearly five decades, Urban scholars have conducted research and offered evidence-based solutions that improve lives and strengthen communities across a rapidly urbanizing world. Their objective research helps expand opportunities for all, reduce hardship among the most vulnerable, and strengthen the effectiveness of the public sector.
Copyright © November 2017. Urban Institute. Permission is granted for reproduction of this file, with attribution to the Urban Institute.
2100 M Street NW Washington, DC 20037
www.urban.org