Strategies for Addressing Fixed Cost Recovery Issues Dan Hansen Christensen Associates Energy...
29
Strategies for Strategies for Addressing Fixed Cost Addressing Fixed Cost Recovery Issues Recovery Issues Dan Hansen Christensen Associates Energy Consulting October 2014 October 2014 1
-
Upload
annis-floyd -
Category
Documents
-
view
213 -
download
0
Transcript of Strategies for Addressing Fixed Cost Recovery Issues Dan Hansen Christensen Associates Energy...
Strategies for Addressing Strategies for Addressing Fixed Cost Recovery IssuesFixed Cost Recovery Issues
Dan HansenChristensen Associates Energy
ConsultingOctober 2014
October 2014 1

October 2014 2
OutlineOutline
Overview of issue Regulatory strategies
Revenue decoupling Forecast test years Lost fixed cost recovery mechanisms Riders / Cost Trackers
Rate design solutions Higher fixed charges Residential demand charges Declining block rates DG rates (access charges, buy all / sell all) Time-differentiated rates
October 2014 3
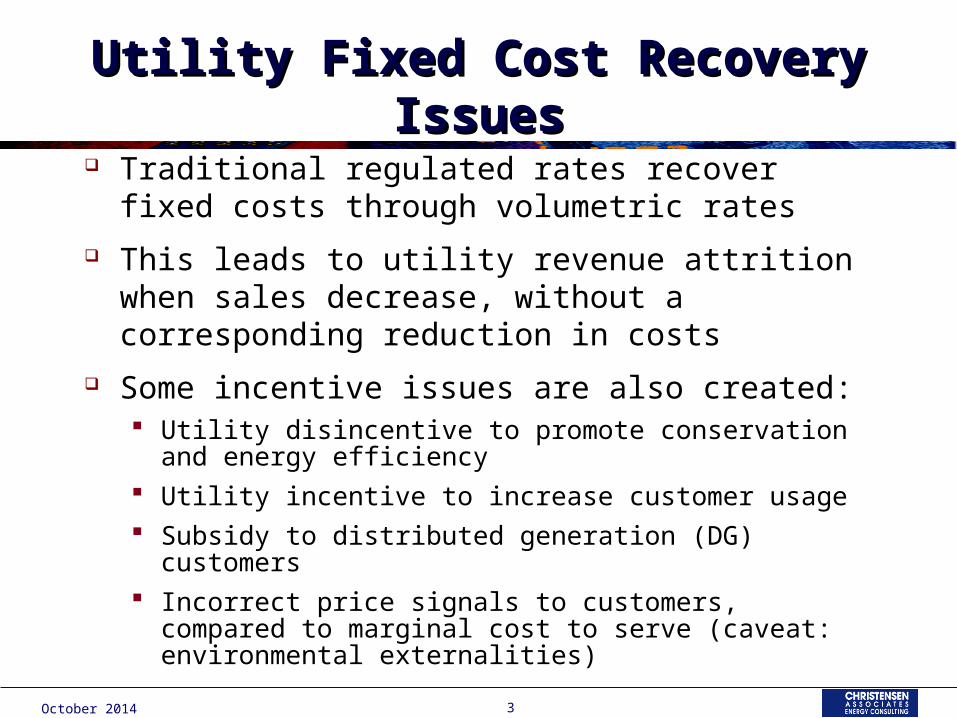
Utility Fixed Cost Recovery IssuesUtility Fixed Cost Recovery Issues
Traditional regulated rates recover fixed costs through volumetric rates
This leads to utility revenue attrition when sales decrease, without a corresponding reduction in costs
Some incentive issues are also created: Utility disincentive to promote conservation and
energy efficiency Utility incentive to increase customer usage Subsidy to distributed generation (DG) customers Incorrect price signals to customers, compared to
marginal cost to serve (caveat: environmental externalities)

October 2014 4
Sources of Utility Fixed Cost Sources of Utility Fixed Cost Under-recoveryUnder-recovery
Distributed generation (residential solar) Conservation and energy efficiency
“Naturally” occurring or based on customer initiative
– Improved appliance efficiency
– Phasing out incandescent light bulbs
– Building standards
As caused by conservation mandates
Poor economic conditions Mild weather conditions
Stakeholders will not necessarily want to treat all of these causes equally

October 2014 5
Consequences of Utility Fixed Cost Consequences of Utility Fixed Cost Under-recoveryUnder-recovery
In the absence of other solutions, the utility will likely file a rate case to increase rates in order to mitigate under-recovery going forward Does not allow the utility to recover lost revenues in
between rate cases In some situations, cross-subsidies may be created
– Non-solar customers subsidizing solar customers
– Non-conserving customers subsidizing conserving customers
– There is disagreement on the extent to which such cross-subsidies occur, if at all
Rate cases may be filed more frequently

October 2014 6
Potential Solutions for Utility Fixed Potential Solutions for Utility Fixed Cost Under-recovery IssuesCost Under-recovery Issues
The following slides present a variety of potential solutions to the issue described here
Each is summarized in terms of how it addresses the following issues: Conservation-induced sales reductions Sales lost to distributed generation Sales changes due to economic conditions Sales changes due to weather conditions Effect on low-use customers, who some believe are
more likely to be low-income customers Discussion, as applicable, of whether cross-
subsidies are affected (created or removed)

Regulatory SolutionsRegulatory Solutions
October 2014 7
October 2014 8
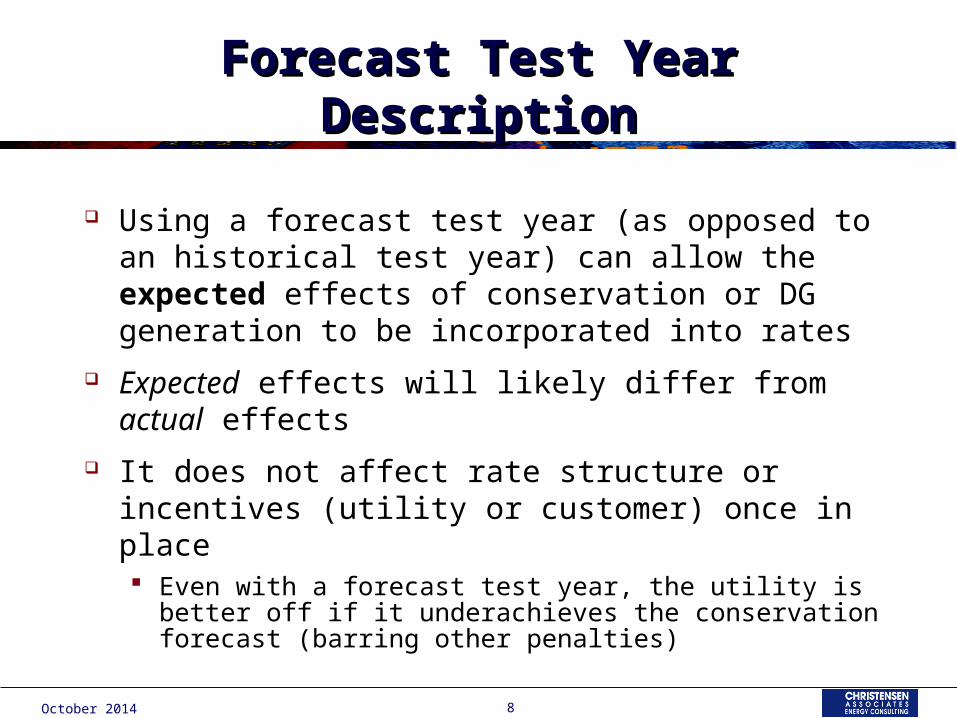
Forecast Test Year DescriptionForecast Test Year Description
Using a forecast test year (as opposed to an historical test year) can allow the expected effects of conservation or DG generation to be incorporated into rates
Expected effects will likely differ from actual effects
It does not affect rate structure or incentives (utility or customer) once in place Even with a forecast test year, the utility is better
off if it underachieves the conservation forecast (barring other penalties)

October 2014 9
Future Test Year ScorecardFuture Test Year Scorecard
Conservation Does not remove the utility’s disincentive to promote
conservation Does not affect customer-level incentive to conserve
Distributed Generation Makes utility whole for expected (not actual) net metering
revenue losses Does not end cross-subsidies to DG customers
Economy No effect
Weather No effect
Low-use customer effect No effect

October 2014 10
Revenue Decoupling DescriptionRevenue Decoupling Description
Revenue decoupling is intended to remove the link between sales and utility revenues
This link exists because some fixed costs are recovered through volumetric (e.g., $ per kWh) rates
By removing the link, the utility is made indifferent to customer usage levels
Does not provide the utility with an incentive to promote conservation A separate mechanism can do that, if desired

October 2014 11
Basic Decoupling ConceptBasic Decoupling Concept
Basic concept of revenue decoupling (RD):
RD Deferral = Allowed Revenue – Actual Revenue
A positive number means the utility under-recovered, and will lead to a future rate increase
A negative number means the utility over-recovered, and will lead to a future rate decrease

October 2014 12
Basic Decoupling Concept (2)Basic Decoupling Concept (2)
Typically every 6 or 12 months, the RD deferral is rolled into rates as follows:
Rate change from RD = RD Deferral / E(Usage)
Revenue is usually “re-coupled” to other (non-sales) factors, such as The number of customers served (called
revenue per customer decoupling, or RPCD) Allowed revenue can be linked to inflation
factors, which can incorporate performance-based regulation components
October 2014 13
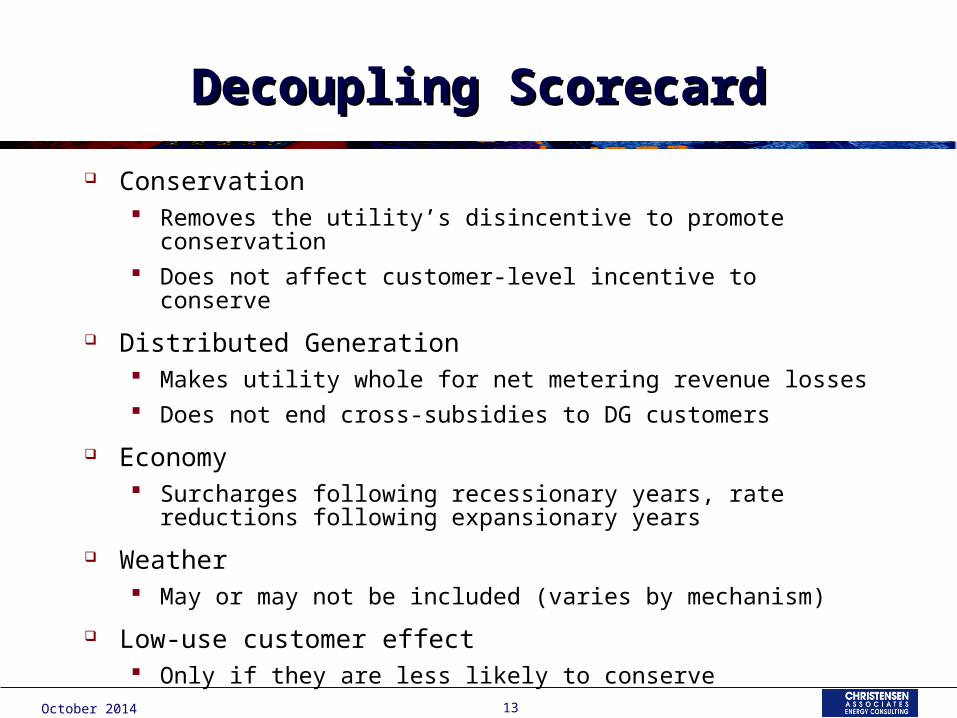
Decoupling ScorecardDecoupling Scorecard
Conservation Removes the utility’s disincentive to promote conservation Does not affect customer-level incentive to conserve
Distributed Generation Makes utility whole for net metering revenue losses Does not end cross-subsidies to DG customers
Economy Surcharges following recessionary years, rate reductions
following expansionary years
Weather May or may not be included (varies by mechanism)
Low-use customer effect Only if they are less likely to conserve

October 2014 14
Lost Revenue Adjustment Lost Revenue Adjustment Mechanisms (LRAMs) DescriptionMechanisms (LRAMs) Description
LRAMs compensate the utility for lost revenues due to utility-sponsored conservation programs Fixed amount per kWh conserved, as measured in the
program evaluation process
LRAMs are more narrow in focus than decoupling Do not adjust revenues for weather, economic factors Does not address the utility’s incentive to increase sales Cannot lead to a rate reduction Utility may not want to promote programs for which the
effects are not easily measured Can be significant disputes regarding kWh savings
estimates

October 2014 15
LRAM ScorecardLRAM Scorecard
Conservation Addresses revenue loss from utility-sponsored programs Does not otherwise affect conservation / load growth
incentives
Distributed Generation No effect
Economy No effect
Weather No effect
Low-use customer effect Bill increase for low-use customers who do not participate
in conservation programs (because they pay the LRAM adder)
October 2014 16
Riders / Cost Trackers: Riders / Cost Trackers: DescriptionDescription
Riders may be used to track specific costs and recover them through rates, without the need to file a rate case
E.g., commonly applied to fuel costs In the context of this discussion, a rider could be used
to track revenue attrition from net metering (if DG is separately metered) for recovery across all sales
Decoupling is a form of a rider Because riders can vary so much, we do not provide a
scorecard

Rate Design Rate Design SolutionsSolutions
October 2014 17
October 2014 18
Higher Fixed Charges:Higher Fixed Charges:DescriptionDescription
The fixed cost recovery issue is caused by the recovery of fixed costs through volumetric rates
The problem can be mitigated or eliminated by increasing the amount of revenue recovered through fixed charges
Straight-fixed variable (SFV) pricing: recover all fixed costs through the monthly customer charge Substitute for decoupling Can lead to very large % bill impacts for low-use
customers
Graduated facilities charges (GFCs): the monthly customer charge varies with usage (e.g., based on the 12-month average) Can allow for an increase in the average customer charge
while mitigating the effect on low-use customers

October 2014 19
Higher Fixed Charges:Higher Fixed Charges:Example Bill ImpactsExample Bill Impacts
-20.0%
-10.0%
0.0%
10.0%
20.0%
30.0%
40.0%
50.0%
60.0%
0 500 1,000 1,500 2,000 2,500 3,000 3,500
Average Monthly kWh
% S
FV
Bil
l Im
pa
ct

October 2014 20
Higher Fixed Charges ScorecardHigher Fixed Charges Scorecard
Conservation Removes the utility’s disincentive to promote conservation Reduces the customer-level incentive to conserve
Distributed Generation Removes DG subsidy Removes utility revenue loss from net metering
Economy Utility fixed-cost revenue (and customer bills) do not vary
with economic conditions
Weather Utility fixed-cost revenue (and customer bills) do not vary
with weather conditions
Low-use customer effect Potential for very high % bill impacts unless GFCs are
employed

October 2014 21
Residential Demand Charges:Residential Demand Charges:DescriptionDescription
Residential rates typically only include energy rates ($/kWh) and customer charges ($ per customer month)
Demand charges are based on the highest amount of usage during a small interval of time, usually 15 minutes or 1 hour May include a “ratchet”, in which the billing is based on demand in
previous months and the current month
Demand charges have not historically been feasible for residential customers due to higher metering costs
Proliferation of “smart” meters makes demand charges feasible
The demand charge can recover distribution costs Customers pay for the size of the distribution network needed to
serve them during their time of greatest need May reduce cross-subsidies between intermittent DG customers
and other customers that arise from net metering under standard rates
October 2014 22
Residential Demand Charge Residential Demand Charge ScorecardScorecard
Conservation Customer still benefits from all-hours conservation
Distributed Generation Reduces or eliminates DG subsidy Reduces or eliminates utility revenue loss from net
metering
Economy Depends on presence of ratchet and how economic
conditions affect demand
Weather Likely to cause utility fixed-cost revenue (and customer
bills) to vary less with weather conditions
Low-use customer effect If low-use customers are low-demand customers, should
be little to no effect

October 2014 23
Declining Block Rates:Declining Block Rates:DescriptionDescription
The rate decreases as usage increases, for example: 0 to 300 kWh/mo = 10 cents/kWh 301 to 600 kWh/mo = 8 cents/kWh Over 600 kWh/mo = 6 cents/kWh
Recovers fixed costs in the initial pricing block, in which all customers consume energy
For higher-use customers, the marginal price more closely reflects the marginal cost to serve
Compared to a flat rate: Reduces customer-level incentive to conserve for high-use
customers Increases customer-level incentive to conserve for low-use
customers
Inclining block rates are more fashionable because of the conservation incentives
October 2014 24
Declining Block Rate ScorecardDeclining Block Rate Scorecard
Conservation Reduces the utility’s disincentive to promote conservation Customer-level incentive effects vary by usage level
Distributed Generation Reduces DG subsidy Reduces utility revenue loss from net metering
Economy Utility fixed-cost revenue (and customer bills) vary less
with economic conditions
Weather Utility fixed-cost revenue (and customer bills) vary less
with weather conditions
Low-use customer effect Potential for high % bill impacts
October 2014 25
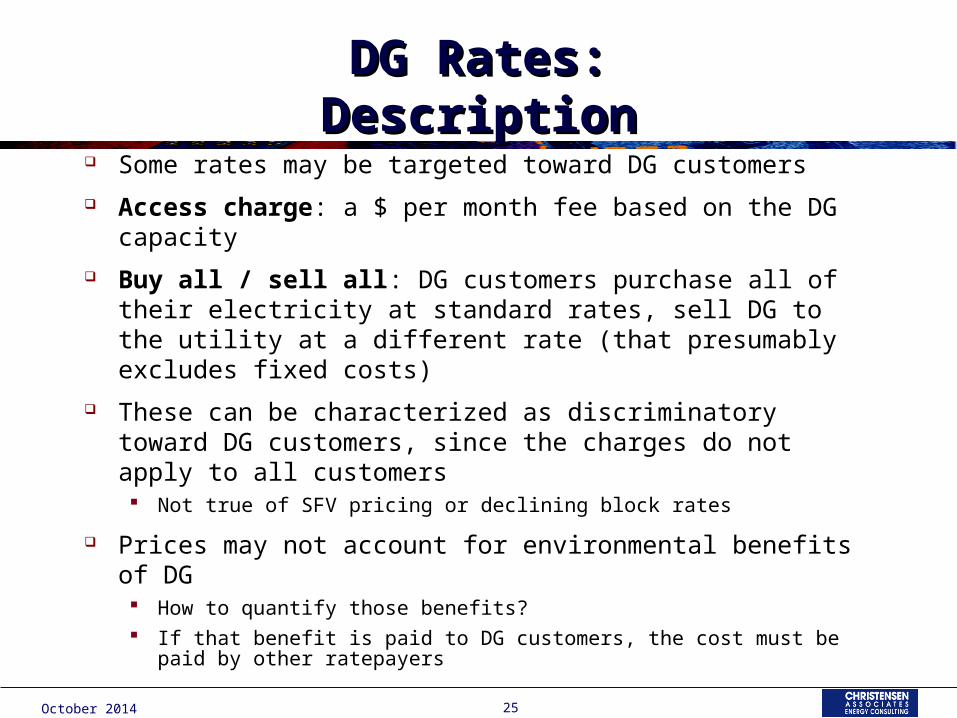
DG Rates:DG Rates:DescriptionDescription
Some rates may be targeted toward DG customers Access charge: a $ per month fee based on the DG
capacity Buy all / sell all: DG customers purchase all of their
electricity at standard rates, sell DG to the utility at a different rate (that presumably excludes fixed costs)
These can be characterized as discriminatory toward DG customers, since the charges do not apply to all customers Not true of SFV pricing or declining block rates
Prices may not account for environmental benefits of DG How to quantify those benefits? If that benefit is paid to DG customers, the cost must be paid by
other ratepayers
October 2014 26
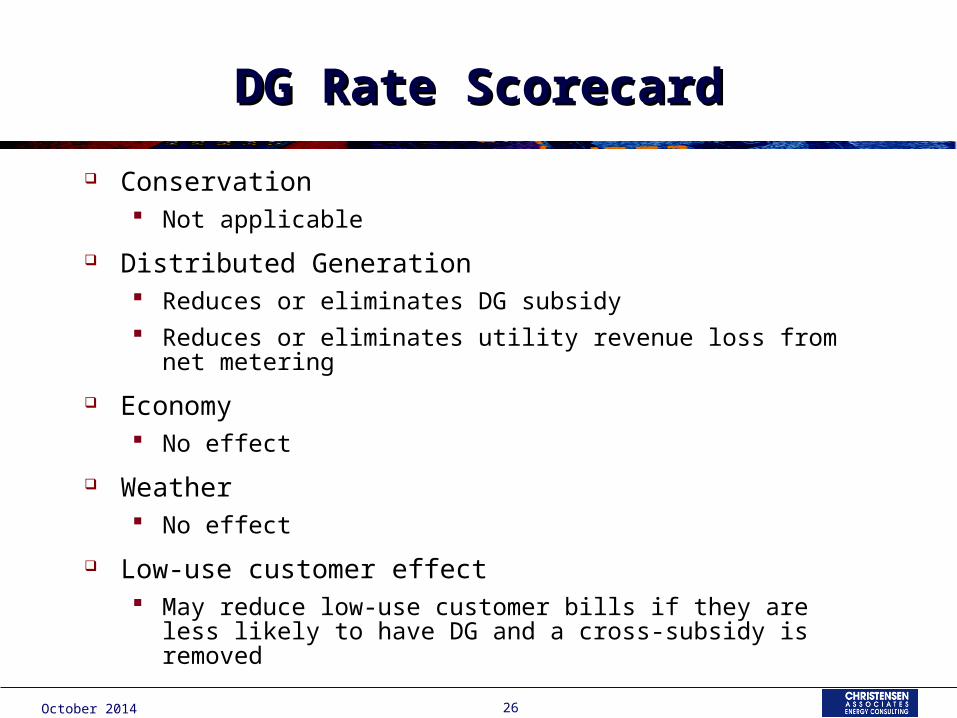
DG Rate ScorecardDG Rate Scorecard
Conservation Not applicable
Distributed Generation Reduces or eliminates DG subsidy Reduces or eliminates utility revenue loss from net
metering
Economy No effect
Weather No effect
Low-use customer effect May reduce low-use customer bills if they are less likely to
have DG and a cross-subsidy is removed
October 2014 27
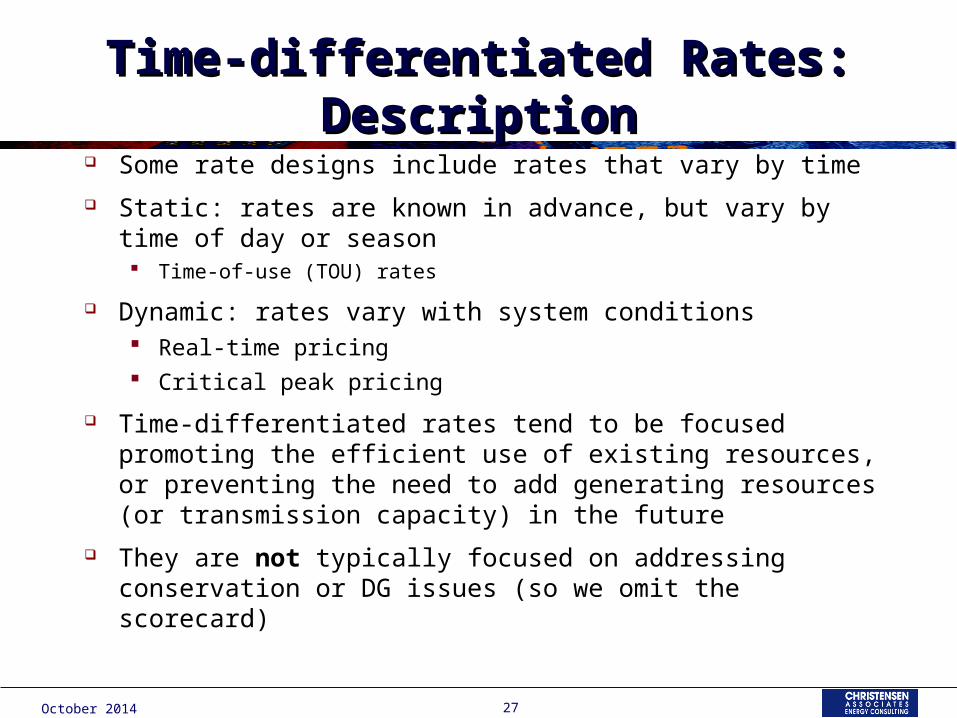
Time-differentiated Rates:Time-differentiated Rates:DescriptionDescription
Some rate designs include rates that vary by time Static: rates are known in advance, but vary by time of
day or season Time-of-use (TOU) rates
Dynamic: rates vary with system conditions Real-time pricing Critical peak pricing
Time-differentiated rates tend to be focused promoting the efficient use of existing resources, or preventing the need to add generating resources (or transmission capacity) in the future
They are not typically focused on addressing conservation or DG issues (so we omit the scorecard)

October 2014 28
SummarySummary Decoupling:
Addresses fixed cost recovery issues due to conservation in a way that minimizes bill impacts (relative to SFV pricing)
Makes the utility whole for revenue loss from DG net metering, but does not address cross-subsidies (still a death spiral!)
LRAMs Address fixed cost recovery issues from utility-sponsored
conservation programs Is not intended to address DG issues
SFV Pricing Addresses fixed cost recovery issues due to conservation and DG Removes DG cross-subsidies Can have very large bill impacts (bill increase for low-use
customers, bill decrease for high-use customers)
DG rates Can address DG cross-subsidies and utility fixed cost recovery
issues Not intended to address conservation issues
October 2014 29
Questions?Questions?
If you have questions, please contact Dan Hansen at [email protected]