Strategic UK CCS Storage Appraisal Project, funded by DECC ...
78
Strategic UK CCS Storage Appraisal Project, funded by DECC - ETI Open Licence for Materials © 2016 Energy Technologies Institute LLP. The information in this document is the property of Energy Technologies Institute LLP and may not be copied or communicated to a third party or used for any purpose other than that for which it is supplied without the express written consent of Energy Technologies Institute LLP. www.eti.co.uk Delivering the UK’s Future Energy Technologies 1 ETI Open Licence for the Strategic UK CCS Storage Appraisal Project The Energy Technologies Institute (the “ETI”) is making materials from the Strategic UK CCS Storage Appraisal Project available to use under the following conditions. This is intended to make this information available on a similar basis as under the Open Government Licence but it is not Crown Copyright and it is owned and licenced separately by the ETI. You are encouraged to use and re-use the Information that is available under this licence freely and flexibly, with only a few conditions. Using Information under this licence Use of copyright and database right material expressly made available under this licence (the ‘Information’) indicates your acceptance of the terms and conditions below. The ETI grants you a worldwide, royalty-free, perpetual, non-exclusive licence to use the Information subject to the conditions below. This licence does not affect your freedom under fair dealing or fair use or any other copyright or database right exceptions and limitations. You are free to: copy, publish, distribute and transmit the Information; adapt the Information; exploit the Information commercially and non-commercially for example, by combining it with other Information, or by including it in your own product or application. You must, where you do any of the above: acknowledge the source of the Information by including the following acknowledgement: “Information taken from the Strategic UK CCS Storage Appraisal Project, funded by DECC, commissioned by the ETI and delivered by Pale Blue Dot Energy, Axis Well Technology and Costain” Provide a copy of or a link to this licence;
Transcript of Strategic UK CCS Storage Appraisal Project, funded by DECC ...

Strategic UK CCS Storage Appraisal Project,
funded by DECC - ETI Open Licence for
Materials
© 2016 Energy Technologies Institute LLP. The information in this document is the property of Energy Technologies Institute LLP and may not be copied or communicated to a third party or used for any purpose other than that for which it is supplied without the express written consent of Energy Technologies Institute LLP.
www.eti.co.uk Delivering the UK’s Future Energy Technologies 1
ETI Open Licence for the Strategic UK CCS Storage Appraisal Project
The Energy Technologies Institute (the “ETI”) is making materials from the Strategic UK CCS
Storage Appraisal Project available to use under the following conditions. This is intended to make
this information available on a similar basis as under the Open Government Licence but it is not
Crown Copyright and it is owned and licenced separately by the ETI.
You are encouraged to use and re-use the Information that is available under this licence freely and
flexibly, with only a few conditions.
Using Information under this licence
Use of copyright and database right material expressly made available under this licence (the
‘Information’) indicates your acceptance of the terms and conditions below.
The ETI grants you a worldwide, royalty-free, perpetual, non-exclusive licence to use the
Information subject to the conditions below.
This licence does not affect your freedom under fair dealing or fair use or any other copyright or
database right exceptions and limitations.
You are free to:
copy, publish, distribute and transmit the Information;
adapt the Information;
exploit the Information commercially and non-commercially for example, by combining it with
other Information, or by including it in your own product or application.
You must, where you do any of the above:
acknowledge the source of the Information by including the following acknowledgement:
“Information taken from the Strategic UK CCS Storage Appraisal Project,
funded by DECC, commissioned by the ETI and delivered by Pale Blue Dot
Energy, Axis Well Technology and Costain”
Provide a copy of or a link to this licence;

Strategic UK CCS Storage Appraisal Project, funded by DECC - ETI Open Licence for Materials
Energy Technologies Institute
© 2016 Energy Technologies Institute LLP. The information in this document is the property of Energy Technologies Institute LLP and may not be copied or communicated to a third party or used for any purpose other than that for which it is supplied without the express written consent of Energy Technologies Institute LLP.
www.eti.co.uk Delivering the UK’s Future Energy Technologies 2
State that the Information contains copyright information licensed under this ETI Open
Licence.
Acquire and maintain all necessary licences for any Third Party needed to use the
Information.
These are important conditions of this licence and if you fail to comply with them the rights granted
to you under this licence, or any similar licence granted by the ETI, will end automatically.
Exemptions
This licence only covers the Information and does not cover:
personal data in the Information;
trade marks of the ETI, DECC, Pale Blue Dot Energy, Axis Well Technology or Costain; and
any other intellectual property rights, including patents, trade marks, and design rights.
Non-endorsement
This licence does not grant you any right to use the Information in a way that suggests any official
status or that the ETI endorses you or your use of the Information.
Non warranty and liability
The Information is made available for use without charge. In downloading the Information, you
accept the basis on which the ETI makes it available.
The Information is licensed ‘as is’ and the ETI excludes all representations, warranties, obligations
and liabilities in relation to the Information to the maximum extent permitted by law.
The ETI is not liable for any errors or omissions in the Information and shall not be liable for any
loss, injury or damage of any kind caused by its use. This exclusion of liability includes, but is not
limited to, any direct, indirect, special, incidental, consequential, punitive, or exemplary damages in
each case such as loss of revenue, data, anticipated profits, and lost business.
The ETI does not guarantee the continued supply of the Information.
Governing Law
This Agreement and any dispute or claim arising out of or in connection with it (including any non-
contractual claims or disputes) shall be governed by and construed in accordance with the laws of
England and Wales and the parties irrevocably submit to the non-exclusive jurisdiction of the
English courts.
Definitions
In this licence, the terms below have the following meanings:
‘Information’ means information protected by copyright or by database right (for example, literary
and artistic works, content, data and source code) offered for use under the terms of this licence.
‘DECC’ means the Department of Energy and Climate Change or any other successor
department(s) or agency(ies) from time to time.

Strategic UK CCS Storage Appraisal Project, funded by DECC - ETI Open Licence for Materials
Energy Technologies Institute
© 2016 Energy Technologies Institute LLP. The information in this document is the property of Energy Technologies Institute LLP and may not be copied or communicated to a third party or used for any purpose other than that for which it is supplied without the express written consent of Energy Technologies Institute LLP.
www.eti.co.uk Delivering the UK’s Future Energy Technologies 3
‘ETI’ means the Energy Technologies Institute, a limited liability partnership (OC333553), whose
registered office is at Holywell Building, Holywell Park, Loughborough, LE11 3UZ.
“Third Party Software” means any third party software identified in or associated with the
Information which is required by you to use the Information.
‘Use’ means doing any act which is restricted by copyright or database right, whether in the original
medium or in any other medium, and includes without limitation distributing, copying, adapting,
modifying as may be technically necessary to use it in a different mode or format.
‘You’ means the natural or legal person, or body of persons corporate or incorporate, acquiring
rights under this licence.
ETI April 2016 v2.1

D04: Initial Screening & Down-Select 10113ETIS-Rep-03-2.0
February 2016
2015
www.pale-blu.com
www.axis-wt.com

D04: Initial Screening & Down-Select Contents
Pale Blue Dot Energy | Axis Well Technology Page 1 of 74
Contents
Document Summary
Client The Energy Technologies Institute
Project Title DECC Strategic UK CCS Storage Appraisal Project
Title: D04: Initial Screening & Down-Select
Distribution: A Green, D Gammer Classification: Client Confidential
Date of Issue: 19th February 2016
Name Role Signature
Prepared by: A James, S Baines & S McCollough Chief Technologist, Scientific Advisor & Subsurface Lead
Approved by: S J Murphy Project Manager
Disclaimer:
While the authors consider that the data and opinions contained in this report are sound, all parties must rely upon their own skill and judgement when using it. The authors do not make
any representation or warranty, expressed or implied, as to the accuracy or completeness of the report. There is considerable uncertainty around the development of CO2 stores and
the available data are extremely limited. The authors assume no liability for any loss or damage arising from decisions made on the basis of this report. The views and judgements
expressed here are the opinions of the authors and do not reflect those of the ETI or any of the stakeholders consulted during the course of this project.
Amendment Record
Rev Date Description Issued By Checked By Approved By Client Approval
V00 07/07/15 Draft S Baines
V02 09/07/15 Draft A James
V07 20/07/15 Issued for Review A James S Baines, S McCollough, F Harding
S Gomersall
V1.0 03/08/15 Final A T James S J Murphy S J Murphy
V2.0 19/02/16 Final (incorporating Jan’16 comments) D Pilbeam S J Murphy A T James A Green
D04: Initial Screening & Down-Select Contents
Pale Blue Dot Energy | Axis Well Technology Page 2 of 74
Table of Contents
CONTENTS .................................................................................................................................................................................................................................................... I
1.0 EXECUTIVE SUMMARY ......................................................................................................................................................................................................................... 6
2.0 OBJECTIVES ........................................................................................................................................................................................................................................ 10
3.0 METHODOLOGY .................................................................................................................................................................................................................................. 11
4.0 INVENTORY AND DATA SOURCES ................................................................................................................................................................................................... 14
5.0 QUALIFICATION ................................................................................................................................................................................................................................... 18
5.1 QUALIFICATION CRITERIA ................................................................................................................................................................................................................ 19
5.2 RECOMMENDED PRACTICE .............................................................................................................................................................................................................. 28
5.3 RESULTS .............................................................................................................................................................................................................................................. 32
6.0 RANKING .............................................................................................................................................................................................................................................. 38
6.1 CRITERIA .............................................................................................................................................................................................................................................. 40
6.2 CRITERIA WEIGHTING ........................................................................................................................................................................................................................ 43
6.3 BENCHMARKING ................................................................................................................................................................................................................................. 45
6.4 RESULTS .............................................................................................................................................................................................................................................. 46
6.5 SENSITIVITIES ..................................................................................................................................................................................................................................... 51
7.0 CONCLUSIONS .................................................................................................................................................................................................................................... 55
8.0 RECOMMENDATIONS ......................................................................................................................................................................................................................... 57
9.0 REFERENCES ...................................................................................................................................................................................................................................... 61
APP. 1 KEY VALUATION ASSUMPTIONS – WOOD MACKENZIE 2Q 2015 .......................................................................................................................................... 62

D04: Initial Screening & Down-Select Contents
Pale Blue Dot Energy | Axis Well Technology Page 3 of 74
APP. 2 STAKEHOLDER MEETING REPORT – 2ND JULY 2015 ............................................................................................................................................................... 64
D04: Initial Screening & Down-Select Contents
Pale Blue Dot Energy | Axis Well Technology Page 4 of 74
Figures
FIGURE 1 - WORKFLOW FOR WP3 .................................................................................................................................................................................................................. 11
FIGURE 2 – IMPACT OF QUALIFICATION ON SITE NUMBERS. .............................................................................................................................................................................. 32
FIGURE 3 - IMPACT OF QUALIFICATION ON THEORETICAL CAPACITY. ................................................................................................................................................................. 32
FIGURE 4 - IMPACT OF INDIVIDUAL QUALIFICATION CRITERIA ON INVENTORY NUMBER AND TOTAL THEORETICAL CAPACITY, CODED BY STORE UNIT TYPE. ....................................... 34
FIGURE 5 - IMPACT OF THE THEORETICAL CAPACITY (>50MT) QUALIFICATION CRITERIA ON TOTAL CAPACITY. ..................................................................................................... 35
FIGURE 6 - QUALIFICATION SENSITIVITY TO PERMEABILITY THRESHOLD ............................................................................................................................................................ 36
FIGURE 7 - ILLUSTRATION OF THE TOPSIS METHOD ........................................................................................................................................................................................ 39
FIGURE 8 - RANKING FACTOR INDEPENDENCE CHECK ...................................................................................................................................................................................... 42
FIGURE 9 - DEVELOPMENT OF INITIAL RANKING CRITERIA WEIGHTING .............................................................................................................................................................. 44
FIGURE 10 - INPUT TO TOPSIS SCORE FOR QUALIFIED INVENTORY ................................................................................................................................................................. 47
FIGURE 11 - SITE RANKING RESULTS FOR THE "ROUNDED VIEW" CASE ............................................................................................................................................................ 48
FIGURE 12 - RANKING METHOD PERFORMANCE CHECK ................................................................................................................................................................................... 49
FIGURE 13 - FINAL SELECTION OF TOP 20 SITES - "ROUNDED VIEW" ................................................................................................................................................................ 50
FIGURE 14 - WP3 DOWN-SELECT RECOMMENDATION ...................................................................................................................................................................................... 54

D04: Initial Screening & Down-Select Contents
Pale Blue Dot Energy | Axis Well Technology Page 5 of 74
Tables
TABLE 1 - THE RECOMMENDED SELECT INVENTORY .......................................................................................................................................................................................... 8
TABLE 2 - SUMMARY OF SITES IN THE CO2STORED DATABASE. ........................................................................................................................................................................ 14
TABLE 3 – TOTAL HYDROCARBON FIELD INVENTORY ........................................................................................................................................................................................ 15
TABLE 4 – HYDROCARBON FIELDS CONSIDERED FOR ADDITION TO INITIAL INVENTORY ....................................................................................................................................... 16
TABLE 5 - PROJECT-SPECIFIC QUALIFICATION CRITERIA ARE BASED UPON THE PROJECT OBJECTIVES AND BASIS OF DESIGN ............................................................................... 20
TABLE 6 - QUALIFICATION CRITERIA DRAWN FROM RECOMMENDED GUIDELINES AND BEST PRACTICE .................................................................................................................. 22
TABLE 7 - EXTRACT FROM IEAGHG GUIDELINES FOR SALINE AQUIFER SITE SELECTION (IEA GREENHOUSE GAS R&D PROGRAMME, 2009) ....................................................... 23
TABLE 8 - LIST OF FIELDS WITH COP DATES BEYOND 2030 – SOURCE WOOD MACKENZIE ................................................................................................................................ 24
TABLE 9 - NORTH SEA OILFIELDS IDENTIFIED AS HAVING CO2-EOR POTENTIAL (ELEMENT ENERGY LTD, 2012) .................................................................................................. 25
TABLE 10 - CONTAINMENT RISK FAILURE RATE ............................................................................................................................................................................................... 26
TABLE 11 - CONTAINMENT ATTRIBUTE FAILURE FREQUENCY ............................................................................................................................................................................ 27
TABLE 12 - RP-J203 SCREENING BASIS - MAPPING ........................................................................................................................................................................................ 30
TABLE 13 - RP-J203 REQUIREMENTS AND APPLICABLE WORK PACKAGES ........................................................................................................................................................ 31
TABLE 14 – QUALIFIED INVENTORY CHARACTERISATION .................................................................................................................................................................................. 37
TABLE 15 - RANKING CRITERIA ....................................................................................................................................................................................................................... 40
TABLE 16 – EXAMPLES OF GEORISK CONTAINMENT QUANTIFICATION................................................................................................................................................................ 41
TABLE 17 - OPTIMAL POSITIVE AND NEGATIVE IDEAL SOLUTIONS FOR EACH RANKING CRITERIA ........................................................................................................................... 41
TABLE 18 - SELECT INVENTORY SITES BY GEOLOGICAL AGE ............................................................................................................................................................................ 52
TABLE 19 - SELECT INVENTORY SITES BY UNIT DESIGNATION .......................................................................................................................................................................... 53
TABLE 20 - SELECT INVENTORY SITES BY STORAGE TYPE ............................................................................................................................................................................... 53
TABLE 21 - SELECT INVENTORY SITES BY NEAREST BEACHHEAD ..................................................................................................................................................................... 53
TABLE 22 - BEACHHEAD DISTRIBUTION OF DISTANCE WEIGHTED CAPACITY IN THE SELECT INVENTORY ............................................................................................................. 53
TABLE 23 - SELECT INVENTORY - FULL DETAILS .............................................................................................................................................................................................. 58
TABLE 24 - RESERVE INVENTORY - FULL DETAILS ............................................................................................................................................................................................ 59

D04: Initial Screening & Down-Select 1.0 Executive Summary
Pale Blue Dot Energy | Axis Well Technology Page 6 of 74
1.0 Executive Summary
This Energy Technologies Institute (ETI) Strategic UK CCS Storage Appraisal
project has been commissioned on behalf of the Department of Energy and
Climate Change. The project brings together existing storage appraisal
initiatives, accelerates the development of strategically important storage
capacity and leverages further investment in the building this capacity to meet
UK needs.
The primary objective of the overall project is to down-select and materially
progress the appraisal of five potential CO2 storage sites on their path towards
final investment decision (FID) readiness from an initial site inventory of over
500. The desired outcome is the delivery of a mature set of high quality CO2
storage options for the developers of major power and industrial CCS project
developers to access in the future. The work will add significantly to the de-
risking of these stores and be transferable to storage developers to complete
the more capital intensive parts of storage development.
This is the report for Work Package 3 (WP3) of the project. The objective of
WP3 was to deliver a Select Inventory of 20 potential CO2 Storage sites from an
Initial Inventory of over 500 sites. In addition a Reserve Inventory of 5 sites was
identified as a potential backup. The Initial Inventory was developed primarily
from the CO2Stored database (Energy Technologies Institute, 2010). It was
augmented with further hydrocarbon fields for which DECC hold production
records (DECC - UK Government, 2015). Whilst there were over 207 oil and
gas fields in the DECC list which were not in CO2Stored, these are almost
entirely small satellite fields which had little potential CO2 storage capacity to
Twenty sites have been selected from 579 for
further due diligence. Key features of the Select
Inventory are:
Significant overall capacity target of 6.8GT.
Strong balance between saline formations and
depleted hydrocarbon fields with good
geographic diversity.
Strong compliance with IEAGHG screening
guidelines and the Project BoD qualifications.
Proximal sites to 5/42 and Goldeneye.
Strong technical diversity of sites.
Deselection of sites with high risk high
confidence containment issues.
D04: Initial Screening & Down-Select 1.0 Executive Summary
Pale Blue Dot Energy | Axis Well Technology Page 7 of 74
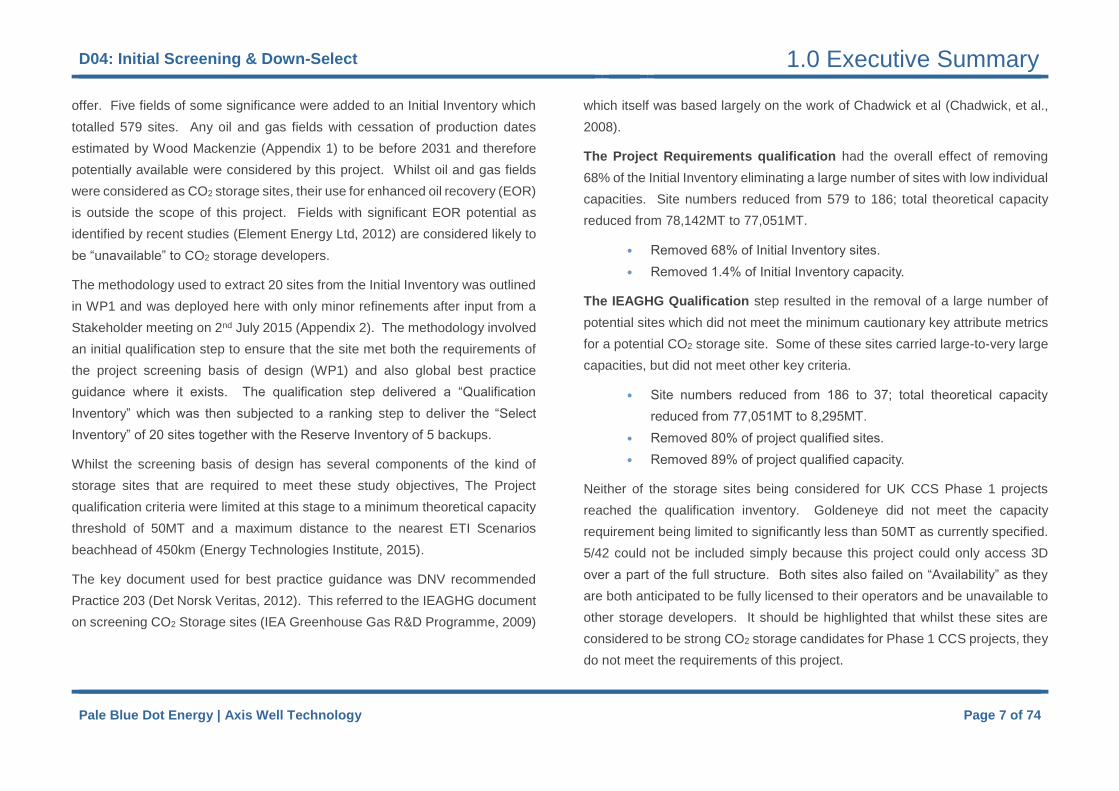
offer. Five fields of some significance were added to an Initial Inventory which
totalled 579 sites. Any oil and gas fields with cessation of production dates
estimated by Wood Mackenzie (Appendix 1) to be before 2031 and therefore
potentially available were considered by this project. Whilst oil and gas fields
were considered as CO2 storage sites, their use for enhanced oil recovery (EOR)
is outside the scope of this project. Fields with significant EOR potential as
identified by recent studies (Element Energy Ltd, 2012) are considered likely to
be “unavailable” to CO2 storage developers.
The methodology used to extract 20 sites from the Initial Inventory was outlined
in WP1 and was deployed here with only minor refinements after input from a
Stakeholder meeting on 2nd July 2015 (Appendix 2). The methodology involved
an initial qualification step to ensure that the site met both the requirements of
the project screening basis of design (WP1) and also global best practice
guidance where it exists. The qualification step delivered a “Qualification
Inventory” which was then subjected to a ranking step to deliver the “Select
Inventory” of 20 sites together with the Reserve Inventory of 5 backups.
Whilst the screening basis of design has several components of the kind of
storage sites that are required to meet these study objectives, The Project
qualification criteria were limited at this stage to a minimum theoretical capacity
threshold of 50MT and a maximum distance to the nearest ETI Scenarios
beachhead of 450km (Energy Technologies Institute, 2015).
The key document used for best practice guidance was DNV recommended
Practice 203 (Det Norsk Veritas, 2012). This referred to the IEAGHG document
on screening CO2 Storage sites (IEA Greenhouse Gas R&D Programme, 2009)
which itself was based largely on the work of Chadwick et al (Chadwick, et al.,
2008).
The Project Requirements qualification had the overall effect of removing
68% of the Initial Inventory eliminating a large number of sites with low individual
capacities. Site numbers reduced from 579 to 186; total theoretical capacity
reduced from 78,142MT to 77,051MT.
• Removed 68% of Initial Inventory sites.
• Removed 1.4% of Initial Inventory capacity.
The IEAGHG Qualification step resulted in the removal of a large number of
potential sites which did not meet the minimum cautionary key attribute metrics
for a potential CO2 storage site. Some of these sites carried large-to-very large
capacities, but did not meet other key criteria.
• Site numbers reduced from 186 to 37; total theoretical capacity
reduced from 77,051MT to 8,295MT.
• Removed 80% of project qualified sites.
• Removed 89% of project qualified capacity.
Neither of the storage sites being considered for UK CCS Phase 1 projects
reached the qualification inventory. Goldeneye did not meet the capacity
requirement being limited to significantly less than 50MT as currently specified.
5/42 could not be included simply because this project could only access 3D
over a part of the full structure. Both sites also failed on “Availability” as they
are both anticipated to be fully licensed to their operators and be unavailable to
other storage developers. It should be highlighted that whilst these sites are
considered to be strong CO2 storage candidates for Phase 1 CCS projects, they
do not meet the requirements of this project.
D04: Initial Screening & Down-Select 1.0 Executive Summary
Pale Blue Dot Energy | Axis Well Technology Page 8 of 74
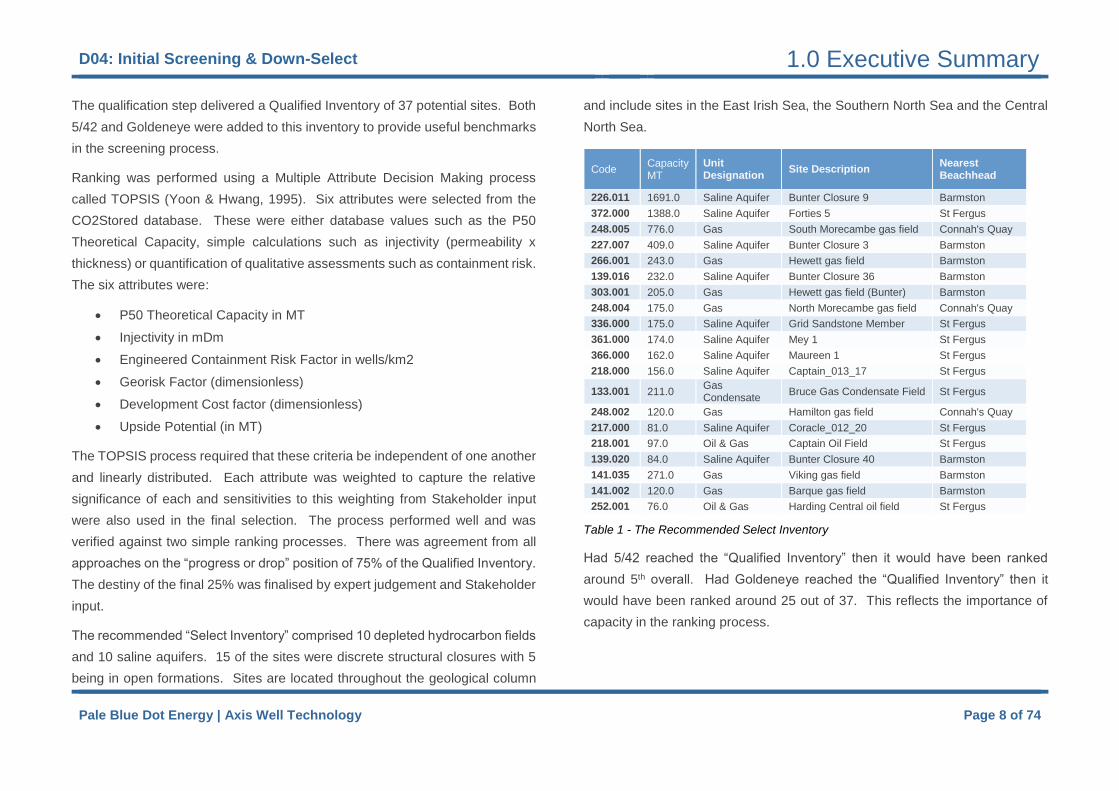
The qualification step delivered a Qualified Inventory of 37 potential sites. Both
5/42 and Goldeneye were added to this inventory to provide useful benchmarks
in the screening process.
Ranking was performed using a Multiple Attribute Decision Making process
called TOPSIS (Yoon & Hwang, 1995). Six attributes were selected from the
CO2Stored database. These were either database values such as the P50
Theoretical Capacity, simple calculations such as injectivity (permeability x
thickness) or quantification of qualitative assessments such as containment risk.
The six attributes were:
P50 Theoretical Capacity in MT
Injectivity in mDm
Engineered Containment Risk Factor in wells/km2
Georisk Factor (dimensionless)
Development Cost factor (dimensionless)
Upside Potential (in MT)
The TOPSIS process required that these criteria be independent of one another
and linearly distributed. Each attribute was weighted to capture the relative
significance of each and sensitivities to this weighting from Stakeholder input
were also used in the final selection. The process performed well and was
verified against two simple ranking processes. There was agreement from all
approaches on the “progress or drop” position of 75% of the Qualified Inventory.
The destiny of the final 25% was finalised by expert judgement and Stakeholder
input.
The recommended “Select Inventory” comprised 10 depleted hydrocarbon fields
and 10 saline aquifers. 15 of the sites were discrete structural closures with 5
being in open formations. Sites are located throughout the geological column
and include sites in the East Irish Sea, the Southern North Sea and the Central
North Sea.
Code Capacity MT
Unit Designation
Site Description Nearest Beachhead
226.011 1691.0 Saline Aquifer Bunter Closure 9 Barmston
372.000 1388.0 Saline Aquifer Forties 5 St Fergus
248.005 776.0 Gas South Morecambe gas field Connah's Quay
227.007 409.0 Saline Aquifer Bunter Closure 3 Barmston
266.001 243.0 Gas Hewett gas field Barmston
139.016 232.0 Saline Aquifer Bunter Closure 36 Barmston
303.001 205.0 Gas Hewett gas field (Bunter) Barmston
248.004 175.0 Gas North Morecambe gas field Connah's Quay
336.000 175.0 Saline Aquifer Grid Sandstone Member St Fergus
361.000 174.0 Saline Aquifer Mey 1 St Fergus
366.000 162.0 Saline Aquifer Maureen 1 St Fergus
218.000 156.0 Saline Aquifer Captain_013_17 St Fergus
133.001 211.0 Gas Condensate
Bruce Gas Condensate Field St Fergus
248.002 120.0 Gas Hamilton gas field Connah's Quay
217.000 81.0 Saline Aquifer Coracle_012_20 St Fergus
218.001 97.0 Oil & Gas Captain Oil Field St Fergus
139.020 84.0 Saline Aquifer Bunter Closure 40 Barmston
141.035 271.0 Gas Viking gas field Barmston
141.002 120.0 Gas Barque gas field Barmston
252.001 76.0 Oil & Gas Harding Central oil field St Fergus
Table 1 - The Recommended Select Inventory
Had 5/42 reached the “Qualified Inventory” then it would have been ranked
around 5th overall. Had Goldeneye reached the “Qualified Inventory” then it
would have been ranked around 25 out of 37. This reflects the importance of
capacity in the ranking process.
D04: Initial Screening & Down-Select 1.0 Executive Summary
Pale Blue Dot Energy | Axis Well Technology Page 9 of 74
Key features of the Top Twenty Select Inventory are:
• Significant overall capacity target of 6.8GT.
• Strong balance between saline formations and depleted
hydrocarbon fields.
• Deselection of sites with high risk high confidence containment
issues.
• Strong compliance with IEAGHG screening guidelines and the
Project BoD qualifications.
• A strong portfolio with a broad geographic spread:
o SNS, CNS and EIS.
o Proximal sites to 5/42 and Goldeneye.
o Strong technical diversity of sites.
The results have been shared and tested with a broad group of Stakeholders at
an event in London on 2nd July. The authors of the report appreciated the
constructive engagement from all those involved.

D04: Initial Screening & Down-Select 2.0 Objectives
Pale Blue Dot Energy | Axis Well Technology Page 10 of 74
2.0 Objectives
The primary objectives for this project are to identify and materially progress the
appraisal of five high potential CO2 Storage sites on their path towards FID
readiness. The desired outcome is the delivery of a mature set of high quality
CO2 Storage options for the developers of major power and industrial CCS
projects to access in the future. The work will add significantly to the de-risking
of these five stores and will be available to storage developers as a basis for
them to commission the more capital intensive parts of storage site appraisal.
The focus of this Work Package 3 (WP3) is to select a pool of twenty storage
sites with five reserves on the UKCS from which the project requirements can
be met. This "Many to Twenty" down-selection follows a screening process,
based on both physical character and geographic location, designed to generate
a portfolio of five sites with the greatest potential for safe, material and long term
storage of CO2. The workflow for selection complies appropriately with the
requirements of the EU Directive 2009/31/EC (THE EUROPEAN PARLIAMENT
AND THE COUNCIL OF THE EUROPEAN UNION,, 2009) on the Geological
Storage of Carbon Dioxide and other key recommended practice guidelines
such as DNV-RP-J203 Geological Storage of Carbon Dioxide. (Det Norsk
Veritas, 2012) and IEAGHG Recommended Practice (IEA Greenhouse Gas
R&D Programme, 2009).
Further details of the overall methodology and approach to this challenge are
described in the WP1 report. Minor aspects of this approach have been
modified following a detailed review of the site inventory available via the
CO2Stored database and Stakeholder review but the general method remains
the same. Methodology refinements are included in this report.
The scope of work for this WP3 has been divided into the following 4 tasks:
1. Procure screening data and build the Initial Inventory of potential
storage sites.
2. Deliver a "Select Inventory" of twenty sites with five reserves.
3. Document the screening results and develop a presentation.
4. Present the results to Stakeholders and gain approval of the Select
Inventory.
This report documents the process and results of this WP3 down select. The
report is organised into a series of sections which mirror the work flow for this
stage of the project as presented in WP1.

D04: Initial Screening & Down-Select 3.0 Methodology
Pale Blue Dot Energy | Axis Well Technology Page 11 of 74
3.0 Methodology
Approach
A five step work flow for the WP3 "Many to Twenty" site selection was presented
in WP1 and is shown here in Figure 1.
The planned approach generally fitted well to the data available at this stage
and was retained in full. Some further refinements of the details of the
methodology for qualification and ranking are described in Sections 5.0 and 6.0
of this report.
The “Screening Basis” is a common set of requirements against which all
potential storage sites will be assessed. Specifically this defines the
requirements to be fulfilled during the project screening in order to be able to
Figure 1 - Workflow for WP3

D04: Initial Screening & Down-Select 3.0 Methodology
Pale Blue Dot Energy | Axis Well Technology Page 12 of 74
regard a storage site as both prospective and qualified for considered appraisal.
Here, the two key elements of the “Screening Basis” are:-
1. Qualification and Compliance – Here the Initial Inventory was
subject to two tests to check whether the site could meet basic
project requirements outlined in a preliminary basis of design
and then meet basic International Energy Agency Greenhouse
Gas (IEAGHG) guidance for CO2 storage sites. The output of
this was a "Qualified Inventory".
2. The second step involved ranking the "Qualified Inventory" against a
series of attributes that reflected the interests of the project as a whole.
The output from this was a “Select Inventory”.
Finally – some key sensitivities were run to check the robustness of the
proposed selection.
The approach applied in the work package is primarily based upon information
held within the CO2Stored database, focusing on the technical attributes of each
potential site (location, capacity, injectivity and containment), plus a
“Development Cost Factor” and a view of proximal upside potential.
Prior to deploying the data in the CO2Stored dataset, the UKSAP report (Energy
Technologies Institue, 2011) was reviewed to develop a good understanding of
the database contents and methods used to derive both the capacity estimates
and qualify other aspects such as risk factors. This was augmented by helpful
discussions with the database authors at BGS. The available data files were
downloaded as excel files and a 'master' excel dataset created. Using the
guidance in the UKSAP report and Appendices, the capacity calculations were
repeated to ensure the data could be matched.
Capacity Estimates
Several capacity estimates are present in the CO2Stored database. Following
a review of the reports and data, and a brief discussion with the BGS, the P50
'theoretical capacity' values, available for both saline aquifers and hydrocarbon
fields, were selected as these are the best representation of the site capacity,
albeit still a value with high degree of uncertainty attached to it, especially with
regard to the saline aquifers.
Limitations of Methodology
A number of limitations and issues exist with the proposed methodology. These
were highlighted in the WP1 report and are primarily related to establishing the
Initial Inventory. Whilst CO2Stored represents the most comprehensive and
consistent data package available in the public domain, there are, a number of
limitations with both saline aquifer and hydrocarbon field data:
• The database values are sometimes based on limited information -
average values e.g. for porosity, permeability or depth, are in some
cases derived from a small number of wells but applied to a very
large rock volume.
• As with all subsurface analysis, most of the data inputs are not direct
measurements but are estimates derived from other data or
correlations which are then extrapolated as averages across the full
volume of the site.
• Key inputs for calculating saline aquifer pore volume are based on
data for which a 'low' measure of confidence is sometimes assigned.
• With so many sites to assess, it was not feasible to use dynamic
simulation models for each site to develop saline aquifer storage

D04: Initial Screening & Down-Select 3.0 Methodology
Pale Blue Dot Energy | Axis Well Technology Page 13 of 74
efficiency factors (E). This also contributes significant uncertainty to
the capacity estimates, although the use of dynamic model
exemplars in UKSAP on some sites has helped to calibrate this.
• Capacity estimates for the hydrocarbon fields are based on the net
volume of fluids produced from the reservoir for each field using
cumulative production data made available by DECC. UKSAP used
production data up to end-2010 and so the capacity estimates only
represents the pore volume available for CO2 storage based on
historical production to that date. Further capacity would result from
a further 4 years production data (to 2015). The assessment here
suggests that this is generally a minor contributor to uncertainty at
this point.
• The uncertainty range applied to some of the inputs to the saline
aquifer data in CO2Stored have been set at +/-10% across the
dataset. This implies an unrealistic consistency of uncertainty levels.
In oil and gas, +/- 10% often does not even capture direct
measurement error for some attributes and so it is possible that the
uncertainty in capacity estimates may have been under estimated.
This raises some concerns about the reliability of the P90 (too big?)
and P10 (too small?) theoretical capacity estimates which arise from
the Monte Carlo analysis.
Data Sources
Bearing these limitations in mind, CO2Stored is the best place from which to
start this screening process given:
• UKSAP and the CO2Stored database were designed to develop a
standardised methodology for CO2 storage capacity estimation.
• No other extensive, internally-consistent dataset exists.
• CO2Stored is subject to update and refinement and improvement
through a separate project.
CO2Stored will primarily be used for this “Many to Twenty” work package.
Subsequent WP4 and WP5 will collect and apply site specific data. The
qualifying and ranking criteria used in this work package attempt both to
recognise these complex uncertainty limitations within the database and to limit
the use of data which carry greatest uncertainty or lowest confidence.
Finally, it was decided not to deploy economic assessments from CO2Nomica
at this stage in the project. It was considered that simple metrics very close to
the database should be used to provide clarity and direct linkage with screening
decisions. Furthermore it was considered that the deployment of the
sophisticated modelling of CO2Nomica may enhance confidence in site
outcomes where such confidence is not merited by the UKSAP assessment at
this time. CO2Nomica will be considered within WP4.

D04: Initial Screening & Down-Select 4.0 Inventory and Data Sources
Pale Blue Dot Energy | Axis Well Technology Page 14 of 74
4.0 Inventory and Data Sources
The backbone of the Initial Inventory is the CO2Stored database and its 574
identified offshore storage units around the UKCS derived from the ETI-funded
UK Storage Appraisal Project (UKSAP) (Table 2). CO2Stored provides the first
comprehensive, auditable and defensible estimates of CO2 storage capacity in
the UK using standardised methodologies for both depleted hydrocarbon fields
and saline aquifers. As such it provides a source of recent and internally
consistent data for use in this project (subject to the limitations discussed in the
previous section).
Site numbers Unit Designation
Storage Unit Type Saline
Aquifer Oil & Gas
Gas Condensate
Gas Total
Fully confined (closed box)
228 3 1 8 240
Open, with identified structural/stratigraphic confinement
20 0 0 0 20
Open, no identified structural/stratigraphic confinement
62 0 0 0 62
Structural/Stratigraphic confinement
50 85 15 101 251
Uncategorised 1 0 0 0 1
Total 361 88 16 109 574
Table 2 - Summary of sites in the CO2Stored database.
This project does not consider (nor did the parent UKSAP) any storage options
in the area West of Shetland due to the large distance to both a suitable
beachhead and a significant source of CO2. The uncategorized unit represents
a site encompassing the extent of the Triassic Bunter Sandstone Formation and
is an empty data entry.
Data Sources
The data sources used for WP3 did not change from the initial plan. These are
detailed in the WP2 report. This was supplemented by up to date cumulative
production figures to February 2015 from DECC and also 2015 estimates of
Cessation of Production dates from Wood Mackenzie (discussed in more detail
below). The assumptions behind these estimates are included as Appendix 1
to this report. Additional sources of information include Element Energy's report
'Economic Impacts of CO2-EOR for Scotland, Final Report' (Element Energy Ltd,
2012) which was used as the most up-to-date source of information on oilfields
considered to have strong EOR potential.
Update to Store Inventory
A full review and update of the CO2Stored database is neither required or within
the scope of this project. However not all UK registered hydrocarbon fields are
explicitly identified as potential CO2 Storage units within the UKSAP study
(Table 3). It is also clear that where such sites are included in the database they
are not always well populated with information.
D04: Initial Screening & Down-Select 4.0 Inventory and Data Sources
Pale Blue Dot Energy | Axis Well Technology Page 15 of 74
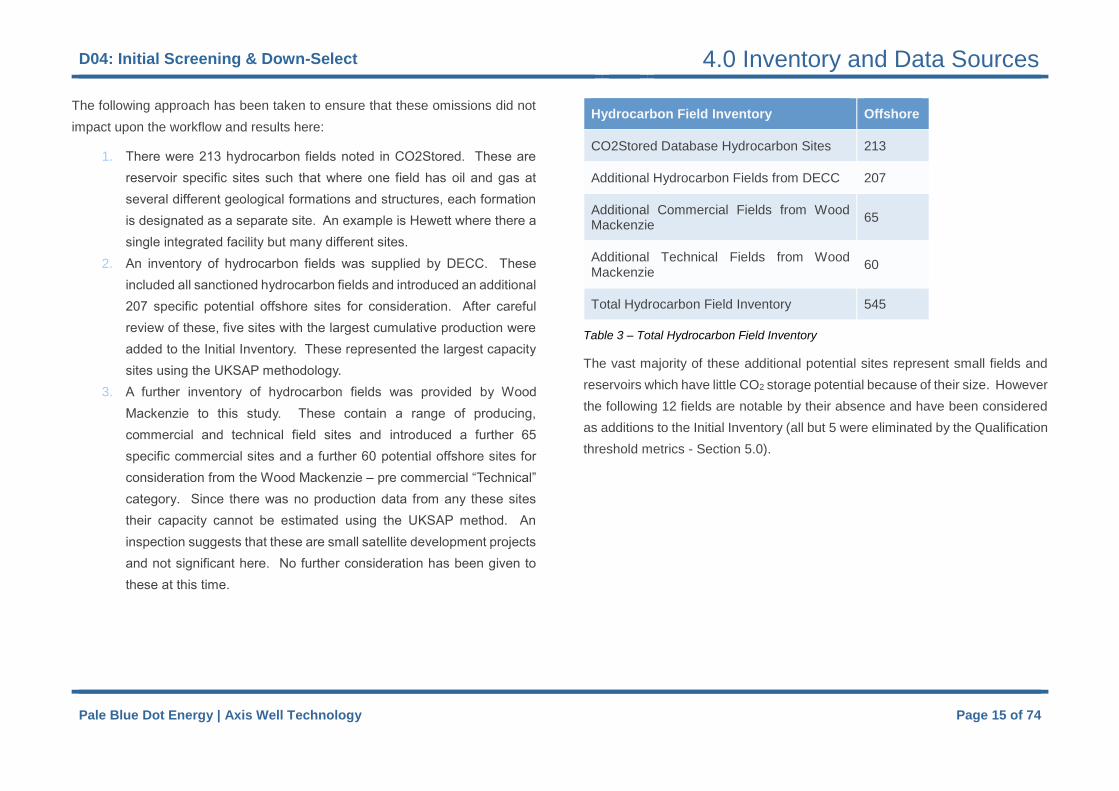
The following approach has been taken to ensure that these omissions did not
impact upon the workflow and results here:
1. There were 213 hydrocarbon fields noted in CO2Stored. These are
reservoir specific sites such that where one field has oil and gas at
several different geological formations and structures, each formation
is designated as a separate site. An example is Hewett where there a
single integrated facility but many different sites.
2. An inventory of hydrocarbon fields was supplied by DECC. These
included all sanctioned hydrocarbon fields and introduced an additional
207 specific potential offshore sites for consideration. After careful
review of these, five sites with the largest cumulative production were
added to the Initial Inventory. These represented the largest capacity
sites using the UKSAP methodology.
3. A further inventory of hydrocarbon fields was provided by Wood
Mackenzie to this study. These contain a range of producing,
commercial and technical field sites and introduced a further 65
specific commercial sites and a further 60 potential offshore sites for
consideration from the Wood Mackenzie – pre commercial “Technical”
category. Since there was no production data from any these sites
their capacity cannot be estimated using the UKSAP method. An
inspection suggests that these are small satellite development projects
and not significant here. No further consideration has been given to
these at this time.
Hydrocarbon Field Inventory Offshore
CO2Stored Database Hydrocarbon Sites 213
Additional Hydrocarbon Fields from DECC 207
Additional Commercial Fields from Wood Mackenzie
65
Additional Technical Fields from Wood Mackenzie
60
Total Hydrocarbon Field Inventory 545
Table 3 – Total Hydrocarbon Field Inventory
The vast majority of these additional potential sites represent small fields and
reservoirs which have little CO2 storage potential because of their size. However
the following 12 fields are notable by their absence and have been considered
as additions to the Initial Inventory (all but 5 were eliminated by the Qualification
threshold metrics - Section 5.0).

D04: Initial Screening & Down-Select 4.0 Inventory and Data Sources
Pale Blue Dot Energy | Axis Well Technology Page 16 of 74
Field Reservoir
Stratigraphy Screening Result*
Alba Tertiary Include
Foinaven Tertiary Exclude - because of West of Shetland location
Schiehallion Tertiary Exclude - because of West of Shetland location
Elgin Jurassic Exclude - because of depth
Maureen Palaeocene Include
Mungo Cretaceous Exclude - because of complex chalk reservoir
Franklin Jurassic Exclude - because of depth
Bittern Tertiary Include
Braemar Jurassic Include
Gryphon Tertiary Include
Mariner Tertiary Exclude - because of 2055 Cessation of Production
Table 4 – Hydrocarbon fields considered for addition to Initial Inventory
Screening data for these potential sites including depth and area have been
accessed from publically available papers such as the Millennium Volume.
Where containment risk data was not available for hydrocarbon fields, the most
frequently occurring risk assessments for hydrocarbon fields were used. In
CO2Stored there are six important containment factors, each of which has been
rated as low, medium or high risk with low, medium or high confidence. Three
of these factors are seal related (Fracture pressure capacity, Seal chemical
reactivity and Seal degradation) and three are fault related (Fault Density, Fault
Throw and seal and Fault vertical extent). These were reviewed for oil and gas
fields and the mode values assigned to fields where such data was missing.
This was deemed appropriate at this stage since it is most unlikely that any
hydrocarbon field would be eliminated on the grounds of containment risk at this
early stage given the substantial containment demonstrated by their ability to
trap and hold oil and gas over geological time.
The final Initial Inventory, therefore, contained the 574 possible storage units
from CO2Stored together with the additional 5 hydrocarbon field sites making
an Initial Inventory of 579. A full list is provided in Appendix 3.
Hydrocarbon Field Capacity Updates
Since the analysis for the UKSAP project was delivered in 2010, existing oil and
gas fields have continued to produce. These values of cumulative production
are important as the theoretical CO2 storage capacity in CO2Stored is linked to
the volumes of hydrocarbons produced. Whilst the production from small, new
fields is not significant, continued additional production on the larger fields was
checked to assess whether the capacity estimates required updating. This was
approached as follows:
• Overall, oil fields that had produced over 100 mmstb of oil by the end
of February 2015 had incremented recovered volumes by 5% since
the end of 2010. Whilst this overall figure is insufficient to warrant a
recalculation of CO2 Storage capacities, there are individual fields
where production growth has been much more significant. These
include the Buzzard, Braemar and Captain fields.

D04: Initial Screening & Down-Select 4.0 Inventory and Data Sources
Pale Blue Dot Energy | Axis Well Technology Page 17 of 74
• In gas fields that had produced over 200 bcf of gas by the end of
February 2015, recovered volumes had incremented on average by
8% since the end of 2010. Again this overall figure is insufficient to
warrant a recalculation of CO2 storage capacities for all fields at this
stage, there are individual fields where production growth has been
much more significant. These include the Ketch, Saturn, Carrack
and Sean fields.
After consideration of these factors and also the lowering of the qualification
hurdle for capacity from 75MT to 50MT, it was concluded that a recalculation
and refinement of capacity using the UKSAP process was no longer useful for
this project as it would not change the fields under consideration.
.
D04: Initial Screening & Down-Select 5.0 Qualification
Pale Blue Dot Energy | Axis Well Technology Page 18 of 74
5.0 Qualification
The Initial Inventory of potential sites stands at 579 (574 from CO2Stored
together with an additional 5 hydrocarbon field sites). The initial qualification
and compliance step seeks to ensure compliance with project needs and
recommended screening practice whilst at the same time reducing the Initial
Inventory to a more manageable size.
The final 'threshold' criteria were selected to meet two sets of requirements:
1. Project-specific qualification requirements which were selected to
ensure compliance with both the project objectives and the Screening
Basis of Design.
2. Established carbon storage screening protocols, in this case DNV-RP-
J203 Screening Basis (Det Norsk Veritas, 2012); to ensure the
screening and site selection processes are as rigorous as possible.
It should be noted that, to ensure that a strong population of sites survived the
qualification step, the theoretical capacity threshold set by the Basis of Design
for Screening was relaxed from 75MT to 50MT. This maintained a stronger
inventory into the ranking process. It also helped to ensure that those sites or
larger hydrocarbon fields which might have been eliminated through a marginal
failure to meet a 75MT threshold with uncertain capacity estimates would not be
eliminated too early in the process.

D04: Initial Screening & Down-Select 5.1 Qualification Criteria
Pale Blue Dot Energy | Axis Well Technology Page 19 of 74
5.1 Qualification Criteria
Project Specific Qualification Criteria
The following Project-Specific qualification criteria are based upon the project objectives and Basis of Design (Table 5).
Qualification Criteria
Threshold Description Rationale Data Source Impact in the
inventory
Distance to Beachhead
<450km
Sites must lie within 450km of one of the beachheads noted in the BoD.
This is a practical threshold to ensure Phase 2 sites do not cost escalate through the need for extended pipeline infrastructure.
Latitude / Longitude coordinates from CO2Stored. (Energy Technologies Institute, 2010)
14 sites failed this test, these are mostly located north of the Statfjord field in the Northern north sea.
Capacity >50MT
The P50 estimate of Theoretical Capacity in CO2Stored must be at least 50MT.
The project is seeking to materially progress significant storage sites to meet Phase 2 and Phase 3 demand. These will require sites with capacities of at least 50MT and ideally over 100MT. Larger threshold values were considered (75MT), but higher values start to remove a very significant proportion of the total capacity inventory.
The P50 Theoretical capacity estimate in CO2Stored database. (Energy Technologies Institute, 2010)
387 sites failed this test. This represents over two thirds of the inventory and is the subject of further sensitivity analysis.
Reservoir Pressure
No Routine Pressure management through water production wells.
Phase 2 sites will not rely upon water production to create significant essential storage capacity. The sites need to be large and low cost.
The early requirement of pressure management wells to achieve basic capacity thresholds is considered to be a significant additional cost (potentially doubling the offshore development costs). Whilst it is envisaged that many sites will benefit from local pressure management to optimise the development, at this stage, water production from the start of injection to create essential voidage is not being considered.
Theoretical capacity estimates for Fully Confined units in CO2Stored database. (Energy Technologies Institute, 2010)
No sites were excluded by this criteria.
Store Type
All Unit Designations will be considered.
Saline aquifers, oil and gas fields, gas fields, gas condensate fields.
There was no exclusion of a site based simply upon its designation or storage type in order to try to preserve diversity within the Select Inventory.
Assigned 'Unit Designation' in CO2Stored database. (Energy Technologies Institute, 2010)
No sites were excluded by this criteria.

D04: Initial Screening & Down-Select 5.1 Qualification Criteria
Pale Blue Dot Energy | Axis Well Technology Page 20 of 74
Qualification Criteria
Threshold Description Rationale Data Source Impact in the
inventory
Reservoir Type
Complex dual porosity reservoir systems will not be considered.
Sites with good quality, primary pore systems will be considered.
A simplified play fairway consideration has indicated that there are several reservoir intervals whose complexity does not suggest them as ideal DECC 'Phase 2' sites. Examples include Chalk and Zechstein carbonate reservoirs and also fractured Devonian sandstones, both with complex dual porosity systems.
Geological description provided in CO2Stored database. (Energy Technologies Institute, 2010)
No sites were eliminated as a result of this criteria directly. Most complex reservoirs failing on many other criteria.
Table 5 - Project-Specific qualification criteria are based upon the project objectives and Basis of Design
Qualification Criteria from Recommended Guidelines
A second set of qualification criteria drawn from recommended guidelines and best practice was also used (Table 6).
These ensure that the Qualified Inventory only held sites which meet recognised minimum screening criteria (i.e. DNV RP 203 Screening Basis guidelines (Det Norsk
Veritas, 2012)) in addition to the project requirements. The DNV RP-J203_2012-04 Recommended Practice cites the IEA GHG 2009 report (IEA Greenhouse Gas R&D
Programme, 2009) with selection criteria recommended by (Chadwick, et al., 2008) for screening requirements for saline aquifers. It is recognised that many of these
criteria are time dependent (e.g. availability, data availability) or are indications but not proof of unsuitability (e.g. fault throws) and therefore deselection knowing what
we know today does not necessarily mean they will be deselected in the future.
Qualification Criteria
Threshold Description Rationale
Data Source Impact on the Inventory
Availability
COP<2031 and no significant EOR potential.
Not currently licensed for storage.
The site should have reasonable availability for use by a prospective developer in the 2015 to 2030 timeframe.
Some oilfields which have been identified by significant studies as having high potential for miscible CO2-EOR projects were excluded on the basis that when CO2 is flowing into the offshore area then they might reasonably be considered for CO2 EOR by their license owners. As such they would be unavailable for CO2 storage. Goldeneye and 5/42 are also assumed to be unavailable as it is assumed they will already be licensed. Finally some of the recent and larger hydrocarbon fields are forecast to continue operations past 2030 and these are considered unavailable for the purposes of this project.
Wood MacKenzie data (Appendix 1).
Economic Impacts of
CO2-EOR for
Scotland, Final Report (Element Energy Ltd, 2012)
14 sites failed this test, 9 through EOR potential, 3 through COP constraints
and 2 through CO2
Storage licensing.

D04: Initial Screening & Down-Select 5.1 Qualification Criteria
Pale Blue Dot Energy | Axis Well Technology Page 21 of 74
Qualification Criteria
Threshold Description Rationale
Data Source Impact on the Inventory
Data Availability
3D seismic plus >1 well
Must have good 3D seismic coverage and at least one well with good log data.
The authority is likely to require that 3D seismic data and geological information from drilling is available ahead of filing any storage development plan.
PGS dataset coverage. (PGS, 2015)
Well count in CO2Stored. (Energy Technologies Institute, 2010)
25 sites failed this test because of lack of well data with a further 8 sites failed because of limited 3D seismic access by this project.
Centroid Depth
>800m and < 2500m
The saline aquifer formation centroid depth must be below 800m in depth and no more than 2500m in depth.
Positive indicators >1000m and <2500m, cautionary indicators <800m and >2500m - (Chadwick, et al., 2008). These limits are driven by CO2 phase control at the shallow limit and reservoir quality degradation at the deeper limit.
CO2Stored database (centroid depth). (Energy Technologies Institute, 2010)
243 sites failed this test (42% of the initial inventory). 20 were less than 800m but 223 were between 2500m and 6000m.
This criteria was not applied to oil & gas fields, 73 of which are below 2500m
Trans-national Migration Risk
High Risk elements
Sites given a 'High' risk which are located close (<1km) to median lines with a high trans-national migration risk are not considered further.
EU Directive 2009/31/EC on the Geological Storage of Carbon Dioxide. (THE EUROPEAN PARLIAMENT AND THE COUNCIL OF THE EUROPEAN UNION,, 2009)
The Carbon Dioxide (Licensing etc.) Regulations 2010 (SI 2010/2221). (UK Government, 2010)
CO2Stored database. (Energy Technologies Institute, 2010)
UKSAP Final Report Appendix A6.2. (Energy Technologies Institue, 2011)
91 sites failed this test being assessed as a high transnational migration risk in CO2Stored database.
Permeability >50mD
The formations should have an average permeability in excess of 50mD.
Positive indicators >300mD, cautionary indicators <10-100mD - (Chadwick, et al., 2008)
CO2Stored database (saline aquifers). (Energy Technologies Institute, 2010)
Published data (hydrocarbon fields). (DECC - UK Government, 2015)
188 sites failed this test (32% of the Initial Inventory). This was the subject of a further sensitivity study.

D04: Initial Screening & Down-Select 5.1 Qualification Criteria
Pale Blue Dot Energy | Axis Well Technology Page 22 of 74
Qualification Criteria
Threshold Description Rationale
Data Source Impact on the Inventory
Thickness >20m
The formations should have an average net thickness in excess of 20m.
Positive indicators >50m, cautionary indicators <20m - (Chadwick, et al., 2008).
CO2Stored database (saline aquifers). (Energy Technologies Institute, 2010)
Only 9 sites failed to meet this test.
Porosity >10%
The formations should have an average porosity in excess of 10%.
Positive indicators >20%, cautionary indicators <10% - (Chadwick, et al., 2008)
CO2Stored database (saline aquifers). (Energy Technologies Institute, 2010)
11 sites failed this test. They included tight Triassic and Devonian sandstones and some Permian limestones.
Salinity >30,000mg/l
The formations should have a water salinity in excess of 30,000mg/l to avoid potable water sources.
Positive indicators >100,000mg/l, cautionary indicators < 30,000 mg/l - (Chadwick, et al., 2008)
CO2Stored database (saline aquifers). (Energy Technologies Institute, 2010)
31 sites failed this test and have fresher formation water than 30,000mg/l. These were all formations deeper than 2500m.
Geological Containment
High risk / High confidence containment risk elements.
A saline aquifer site with any containment element considered to be high risk and high confidence will not be considered further. Hydrocarbon fields are considered to meet this requirement.
Positive indicators: >100m thick unfaulted caprock, Cautionary indicators: lateral caprock variability with overburden faulting and thin seal formations <20m.
UKSAP (Energy Technologies Institue, 2011)& CO2Stored 'Security of Storage' analysis of saline aquifers. (Energy Technologies Institute, 2010)
147 sites failed this test on at least one of six containment factors. This represents 25% of the initial inventory.31 sites failed on 2 or more factors.
Table 6 - Qualification criteria drawn from recommended guidelines and best practice
D04: Initial Screening & Down-Select 5.1 Qualification Criteria
Pale Blue Dot Energy | Axis Well Technology Page 23 of 74
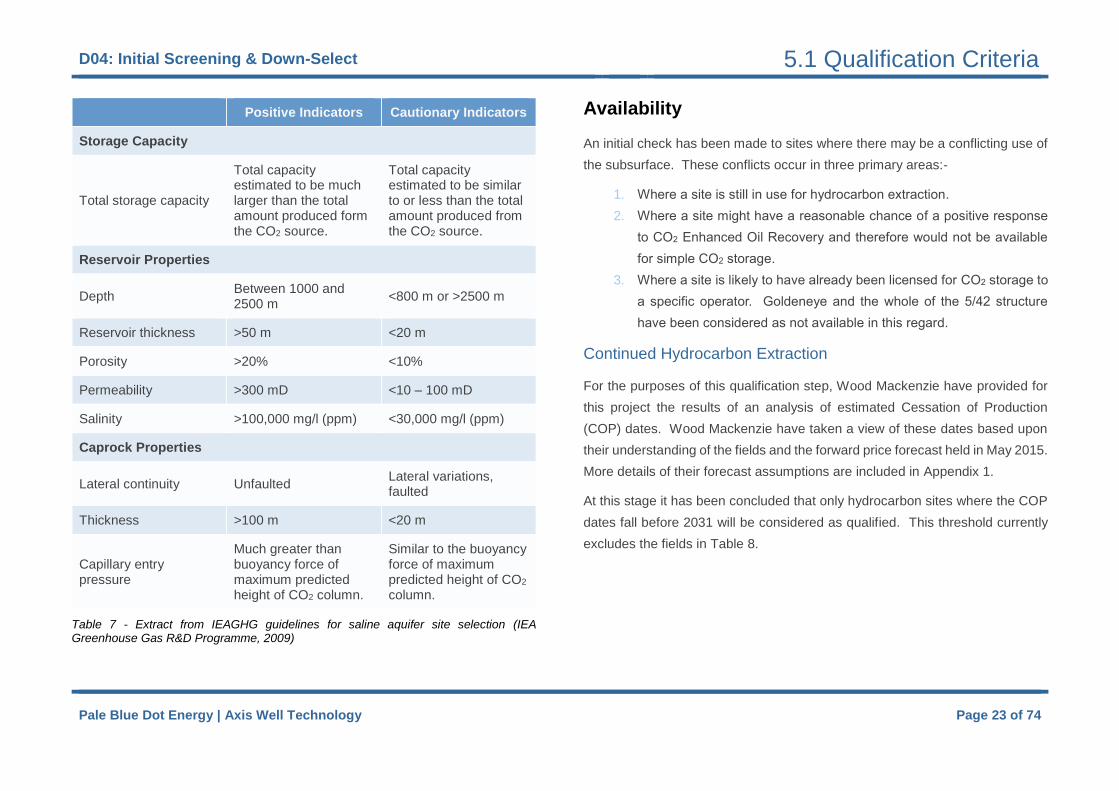
Positive Indicators Cautionary Indicators
Storage Capacity
Total storage capacity
Total capacity estimated to be much larger than the total amount produced form the CO2 source.
Total capacity estimated to be similar to or less than the total amount produced from the CO2 source.
Reservoir Properties
Depth Between 1000 and 2500 m
<800 m or >2500 m
Reservoir thickness >50 m <20 m
Porosity >20% <10%
Permeability >300 mD <10 – 100 mD
Salinity >100,000 mg/l (ppm) <30,000 mg/l (ppm)
Caprock Properties
Lateral continuity Unfaulted Lateral variations, faulted
Thickness >100 m <20 m
Capillary entry pressure
Much greater than buoyancy force of maximum predicted height of CO2 column.
Similar to the buoyancy force of maximum predicted height of CO2 column.
Table 7 - Extract from IEAGHG guidelines for saline aquifer site selection (IEA Greenhouse Gas R&D Programme, 2009)
Availability
An initial check has been made to sites where there may be a conflicting use of
the subsurface. These conflicts occur in three primary areas:-
1. Where a site is still in use for hydrocarbon extraction.
2. Where a site might have a reasonable chance of a positive response
to CO2 Enhanced Oil Recovery and therefore would not be available
for simple CO2 storage.
3. Where a site is likely to have already been licensed for CO2 storage to
a specific operator. Goldeneye and the whole of the 5/42 structure
have been considered as not available in this regard.
Continued Hydrocarbon Extraction
For the purposes of this qualification step, Wood Mackenzie have provided for
this project the results of an analysis of estimated Cessation of Production
(COP) dates. Wood Mackenzie have taken a view of these dates based upon
their understanding of the fields and the forward price forecast held in May 2015.
More details of their forecast assumptions are included in Appendix 1.
At this stage it has been concluded that only hydrocarbon sites where the COP
dates fall before 2031 will be considered as qualified. This threshold currently
excludes the fields in Table 8.

D04: Initial Screening & Down-Select 5.1 Qualification Criteria
Pale Blue Dot Energy | Axis Well Technology Page 24 of 74
Field Type Status Estimated COP
MARINER Oil Commercial 2055
BENTLEY Oil Commercial 2051
BRESSAY Oil Commercial 2051
CLAIR Oil Commercial 2050
CAMBO Oil Technical 2043
LOCHNAGAR Oil Technical 2042
TORNADO Gas Technical 2040
KRAKEN Oil Commercial 2039
KRAKEN NORTH Oil Commercial 2039
ROSEBANK Oil Commercial 2039
BREAGH Gas Commercial 2037
CULZEAN Gas Commercial 2037
COURAGEOUS Gas/condensate Technical 2036
JACKDAW Gas/condensate Commercial 2036
LANCASTER Oil Technical 2036
LOYAL Oil Commercial 2035
SCHIEHALLION Oil Commercial 2035
ALLIGIN Oil Commercial 2035
J2 Oil Technical 2035
PERTH Oil Commercial 2035
SUILVEN Oil & Gas Technical 2035
FRAM Oil & Gas Commercial 2034
JOCELYN Oil & Gas Technical 2034
ELGIN Gas/condensate Commercial 2033
FRANKLIN Gas/condensate Commercial 2033
Field Type Status Estimated COP
APPLETON BETA Oil Technical 2033
CONQUERER Gas Technical 2033
GLENN (JURASSIC) Oil Technical 2033
KILDRUMMY Oil Technical 2033
SEAGULL Oil Technical 2033
SOLAN Oil Commercial 2033
WEST FRANKLIN Gas/condensate Commercial 2033
WHIRLWIND Oil Technical 2033
ARBROATH Oil Commercial 2032
ARKWRIGHT Oil Commercial 2032
MONTROSE Oil Commercial 2032
WOOD Oil Commercial 2032
CAYLEY Gas Commercial 2032
CRAWFORD REDEVELOPMENT
Oil Technical 2032
MARCONI Oil & Gas Technical 2032
PEACH Gas/condensate Technical 2032
SHAW Oil Commercial 2032
TALBOT Oil & Gas Technical 2032
APPLETON Oil & Gas Technical 2031
CROSGAN Gas Technical 2031
FARADAY Gas/condensate Technical 2031
FULHAM Gas Technical 2031
PUFFIN Gas/condensate Technical 2031
Table 8 - List of Fields with COP dates beyond 2030 – Source Wood Mackenzie
D04: Initial Screening & Down-Select 5.1 Qualification Criteria
Pale Blue Dot Energy | Axis Well Technology Page 25 of 74
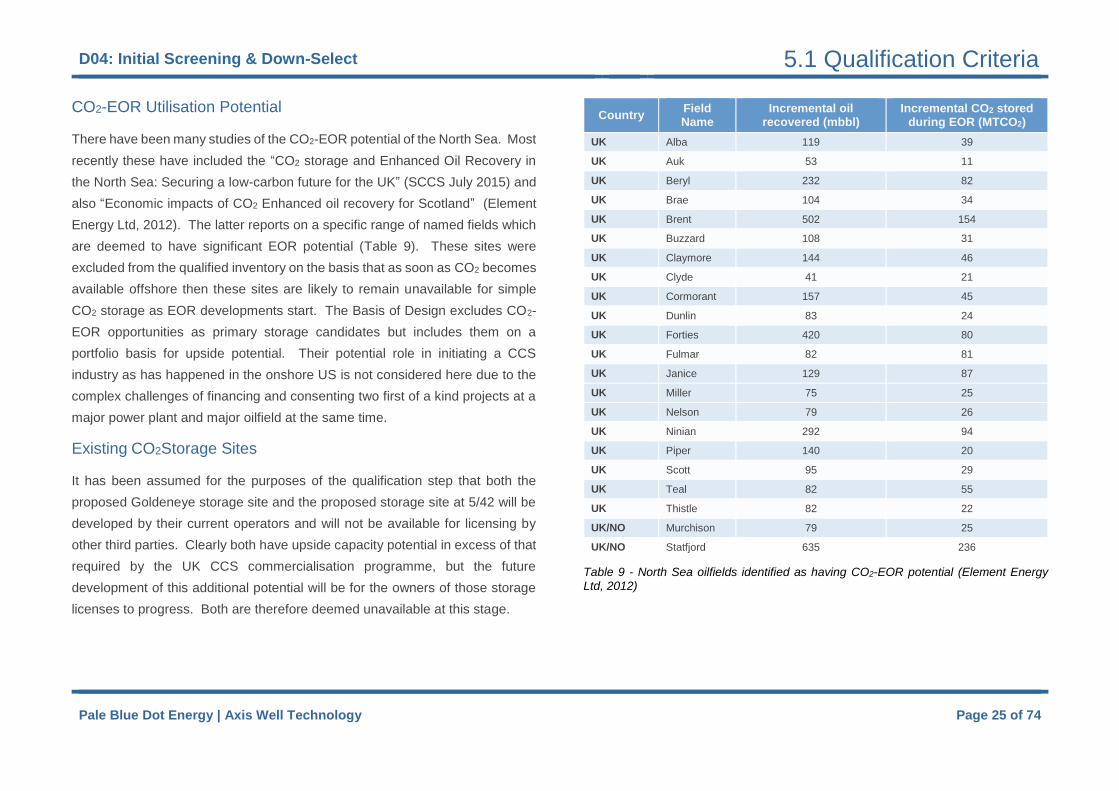
CO2-EOR Utilisation Potential
There have been many studies of the CO2-EOR potential of the North Sea. Most
recently these have included the “CO2 storage and Enhanced Oil Recovery in
the North Sea: Securing a low-carbon future for the UK” (SCCS July 2015) and
also “Economic impacts of CO2 Enhanced oil recovery for Scotland” (Element
Energy Ltd, 2012). The latter reports on a specific range of named fields which
are deemed to have significant EOR potential (Table 9). These sites were
excluded from the qualified inventory on the basis that as soon as CO2 becomes
available offshore then these sites are likely to remain unavailable for simple
CO2 storage as EOR developments start. The Basis of Design excludes CO2-
EOR opportunities as primary storage candidates but includes them on a
portfolio basis for upside potential. Their potential role in initiating a CCS
industry as has happened in the onshore US is not considered here due to the
complex challenges of financing and consenting two first of a kind projects at a
major power plant and major oilfield at the same time.
Existing CO2Storage Sites
It has been assumed for the purposes of the qualification step that both the
proposed Goldeneye storage site and the proposed storage site at 5/42 will be
developed by their current operators and will not be available for licensing by
other third parties. Clearly both have upside capacity potential in excess of that
required by the UK CCS commercialisation programme, but the future
development of this additional potential will be for the owners of those storage
licenses to progress. Both are therefore deemed unavailable at this stage.
Country Field Name
Incremental oil recovered (mbbl)
Incremental CO2 stored during EOR (MTCO2)
UK Alba 119 39
UK Auk 53 11
UK Beryl 232 82
UK Brae 104 34
UK Brent 502 154
UK Buzzard 108 31
UK Claymore 144 46
UK Clyde 41 21
UK Cormorant 157 45
UK Dunlin 83 24
UK Forties 420 80
UK Fulmar 82 81
UK Janice 129 87
UK Miller 75 25
UK Nelson 79 26
UK Ninian 292 94
UK Piper 140 20
UK Scott 95 29
UK Teal 82 55
UK Thistle 82 22
UK/NO Murchison 79 25
UK/NO Statfjord 635 236
Table 9 - North Sea oilfields identified as having CO2-EOR potential (Element Energy Ltd, 2012)
D04: Initial Screening & Down-Select 5.1 Qualification Criteria
Pale Blue Dot Energy | Axis Well Technology Page 26 of 74
Data Availability
Appropriate data is an essential part of any appraisal programme. To this end
it has been concluded that for qualification purposes, a site must have at least
one well with data available and also good 3D seismic coverage available to the
project. Of course a simple well count cannot fully describe the quality of the
information available since one well with a good data acquisition programme
purpose drilled for the task of appraising a CO2 storage site will often have far
more value than a site with several old wells which have drilled through the target
storage reservoir on the way to a deeper hydrocarbon target with very little data
acquisition focussed upon the potential storage interval. At this stage however
a single well is required to qualify. Later on in WP4 the quality of the available
data will be assessed.
Geological Containment
Whilst all the sites in the Initial Inventory possessed the basic attributes to be
considered as a potential viable CO2 storage site, the IEAGHG guidance rightly
stresses the importance of containment risk in any selection process. Within the
CO2Stored database, there are six geological containment attributes. Three are
linked to the caprock system and three relate to the fault related structures in
the caprock and overburden geology.
Fracture Pressure Capacity
Seal Chemical Reactivity
Seal Degradation
Fault Density
Fault Throw and Fault Seal
Fault Vertical Extent
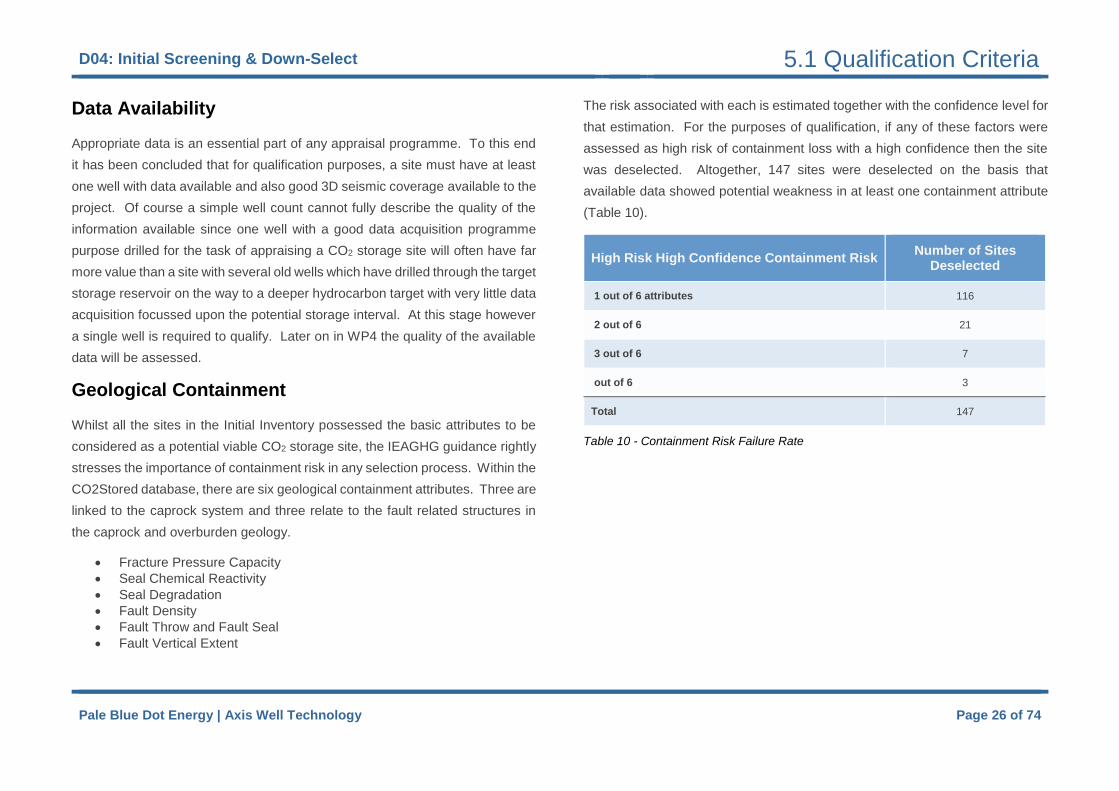
The risk associated with each is estimated together with the confidence level for
that estimation. For the purposes of qualification, if any of these factors were
assessed as high risk of containment loss with a high confidence then the site
was deselected. Altogether, 147 sites were deselected on the basis that
available data showed potential weakness in at least one containment attribute
(Table 10).
High Risk High Confidence Containment Risk Number of Sites
Deselected
1 out of 6 attributes 116
2 out of 6 21
3 out of 6 7
out of 6 3
Total 147
Table 10 - Containment Risk Failure Rate

D04: Initial Screening & Down-Select 5.1 Qualification Criteria
Pale Blue Dot Energy | Axis Well Technology Page 27 of 74
Of these, the most frequently occurring high risk elements carrying a high
degree of confidence are shown in (Table 11).
Containment Attribute Number of Site Deslections
Fracture Pressure Capacity 88
Fault Density 67
Fault Vertical Extent 29
Seal Chemical Reactivity 27
Fault Throw and Fault Seal 25
Seal Degradation 0
Table 11 - Containment Attribute Failure Frequency

D04: Initial Screening & Down-Select 5.2 Recommended Practice
Pale Blue Dot Energy | Axis Well Technology Page 28 of 74
5.2 Recommended Practice
While the most important compliance process for CO2 storage sites on the
UKCS is with the EU Directive (THE EUROPEAN PARLIAMENT AND THE
COUNCIL OF THE EUROPEAN UNION,, 2009) and UK Carbon Dioxide
Regulations 2010 (UK Government, 2010), the project methodology also aims
to comply with the broad set of recommended steps set out by Det Norske
Veritas: Geological Storage of Carbon Dioxide: Recommended Practice (Det
Norsk Veritas, 2012) which provides guidance on site selection and appraisal.
At present, there is no regulatory requirement to comply with this Recommended
Practice, however it represents both a useful reference and is close to being an
accepted industry standard at this time. It is therefore considered useful to map
the site selection work flows for this project onto RP-J203 to help ensure
technical rigour and communicate the processes used.
The DNV Recommended Practice (RP) for geological storage sites (RP-J203)
was developed to provide “a systemic approach to the selection, qualification
and management…. of sites” (Det Norsk Veritas, 2012), specifying what DNV
regard as the best industry practice. The RP (J203) is fairly broad-ranging
however it contains one performance requirement and procedure pertinent to
this work programme: the selection and qualification of geological storage sites
for long-term storage of CO2. Other RP requirements and procedures exist
which, may be applied to later work programmes (WP4 and WP5) of this project.
The storage site screening process is rolled-up in the “Screening Basis”, a
“document that defines the requirements to be fulfilled during the project
screening stage in order to be able to regard a storage site as prospective and
thereby qualify for appraisal” (Det Norsk Veritas, 2012). This document is
designed to be used at the key milestone, Site Selection, in the DNV life cycle
for CO2 geological storage. Table 12 summarises the RP-J203 Screening Basis
requirements and context items and demonstrates how the screening and site
appraisal methodologies for this project map to them.

D04: Initial Screening & Down-Select 5.2 Recommended Practice
Pale Blue Dot Energy | Axis Well Technology Page 29 of 74
DNV Screening Basis Requirement Description Rationale UKSTORE Screening Basis Compliance
Quantitative requirement for minimum total CAPACITY (MT)
BoD: (minimum practical capacity >50MT)
Project Requirements: portfolio leading to 1500MT capacity by 2030.
Quantitative requirement for minimum annual INJECTION(MT/annum)
BoD (3-15MT for a minimum of 15 years)
Project Requirements: 50MT/yr by 2030 across five sites.
Positive indicators of long term CONTAINMENT (documented
evidence)
Depth: CO2 remains in dense phase condition (>300kg/m3) under reservoir conditions.
Depth Qualification: threshold >800m and <2500m.
Seal presence: presence of laterally-extensive seal above the injection zone.
UKSAP/CO2Stored qualification criteria for inclusion in the Initial Inventory.
Well integrity: confidence that well integrity can be established and maintained.
High Well Density contributed to lower site ranking in WP3.
Geological Faults. Containment will not be jeopardized by natural tectonic activity
Georisk Qualification: high geological containment risk/high data confidence sites are excluded.
Absence of existing fault-related flow paths penetrating storage complex.
Georisk Qualification: high geological containment risk/high data confidence sites are excluded.
Positive indicators of the potential to monitor and deploy risk treatment
Legal availability of the storage site over expected life cycle.
WP3-5 provide input for UK storage license and permit process.
Physical accessibility to the storage site over expected life cycle.
Availability Qualification: CoP dates <= 2030.
Screening Basis Context Location of source of CO2. BoD: Beachhead locations defined.
Mass rates and composition of CO2 steam(s) . BoD: representative composition applied. ETI Scenarios used for mass flow rates.
Expected rates of supply and lifetime of CO2 sources.
BoD (3-15MT for a minimum of 15 years).

D04: Initial Screening & Down-Select 5.2 Recommended Practice
Pale Blue Dot Energy | Axis Well Technology Page 30 of 74
DNV Screening Basis Requirement Description Rationale UKSTORE Screening Basis Compliance
Natural environment interaction potential with storage complex or leakage.
Resource/activity conflict potential. Availability Qualification criteria.
Social and cultural context of storage site. All sites are offshore.
Legal and regulatory environment.
EU Directive 2009/31/EC. (THE EUROPEAN PARLIAMENT AND THE COUNCIL OF THE EUROPEAN UNION,, 2009)
UK Carbon Dioxide Regulations (UK Government, 2010)
Expectations of operator, regulators and stakeholders to screening process.
Project Design: stakeholder meetings and workshops.
Project requirements: portfolio management & compliance with UK CCS 'development scenarios'. (Energy Technologies Institute, 2015)
Table 12 - RP-J203 Screening Basis - Mapping

D04: Initial Screening & Down-Select 5.2 Recommended Practice
Pale Blue Dot Energy | Axis Well Technology Page 31 of 74
RP-J203 also requires that the methodology and activities planned to achieve
the Screening Basis are reported in a 'Screening Plan' ('to describe the scope
of each screening step and the activities to be carried out'). Table 13
summarises the main requirements and maps the work packages in this project
which will provide compliance.
DNV Screening Plan Requirement UKSTORE Screening Plan
Compliance
Data to be used for screening WP2
How data will be obtained WP2 / WP5
Application of data to identify potential storage sites
WP1 / WP3 / WP4 / WP5
Calculation of storage capacity methodology
WP3: CO2Stored database (UKSAP project results)
Identification and risk assessment of existing wells
WP3 (CO2Stored database) / WP4 / WP5
Identification and risk assessment of potential leakage risks
WP3 (CO2Stored high level screening) / WP5
Identification of resource/usage conflicts WP3
Evaluation of source-site location WP3
Identification of stakeholders for inclusion in project
N/A
Communication strategy and rationale with stakeholders
N/A
Assessment of legal and physical accessibility to storage sites
WP3 (CoP dates);
Table 13 - RP-J203 Requirements and applicable Work Packages

D04: Initial Screening & Down-Select 5.3 Results
Pale Blue Dot Energy | Axis Well Technology Page 32 of 74
5.3 Results
Figure 2 summarises the results of the Qualification Screening process. From
the starting Initial Inventory of 579 sites, a Qualified Inventory of 37 sites has
been developed. This “Qualified Inventory” passes all of the threshold metrics
for both the project Basis of Design and the established recommended
guidelines for carbon storage.
Figure 3 summarises the effect of the same qualification process but on the total
theoretical capacity of the inventory. Note that some deselection criteria are
temporal and others based on indicative rather than conclusive properties, and
so deselection now does not mean deselection in the future.
Figure 3 - Impact of Qualification on Theoretical Capacity. Figure 2 – Impact of Qualification on Site Numbers.
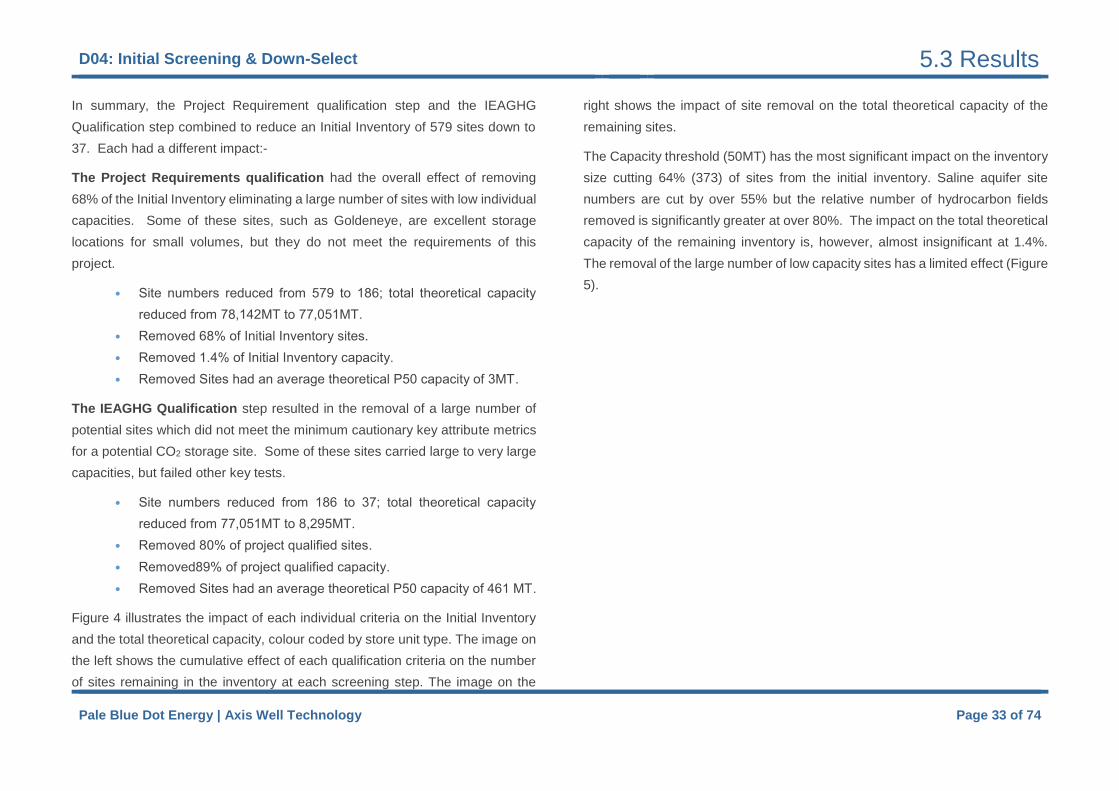
D04: Initial Screening & Down-Select 5.3 Results
Pale Blue Dot Energy | Axis Well Technology Page 33 of 74
In summary, the Project Requirement qualification step and the IEAGHG
Qualification step combined to reduce an Initial Inventory of 579 sites down to
37. Each had a different impact:-
The Project Requirements qualification had the overall effect of removing
68% of the Initial Inventory eliminating a large number of sites with low individual
capacities. Some of these sites, such as Goldeneye, are excellent storage
locations for small volumes, but they do not meet the requirements of this
project.
• Site numbers reduced from 579 to 186; total theoretical capacity
reduced from 78,142MT to 77,051MT.
• Removed 68% of Initial Inventory sites.
• Removed 1.4% of Initial Inventory capacity.
• Removed Sites had an average theoretical P50 capacity of 3MT.
The IEAGHG Qualification step resulted in the removal of a large number of
potential sites which did not meet the minimum cautionary key attribute metrics
for a potential CO2 storage site. Some of these sites carried large to very large
capacities, but failed other key tests.
• Site numbers reduced from 186 to 37; total theoretical capacity
reduced from 77,051MT to 8,295MT.
• Removed 80% of project qualified sites.
• Removed89% of project qualified capacity.
• Removed Sites had an average theoretical P50 capacity of 461 MT.
Figure 4 illustrates the impact of each individual criteria on the Initial Inventory
and the total theoretical capacity, colour coded by store unit type. The image on
the left shows the cumulative effect of each qualification criteria on the number
of sites remaining in the inventory at each screening step. The image on the
right shows the impact of site removal on the total theoretical capacity of the
remaining sites.
The Capacity threshold (50MT) has the most significant impact on the inventory
size cutting 64% (373) of sites from the initial inventory. Saline aquifer site
numbers are cut by over 55% but the relative number of hydrocarbon fields
removed is significantly greater at over 80%. The impact on the total theoretical
capacity of the remaining inventory is, however, almost insignificant at 1.4%.
The removal of the large number of low capacity sites has a limited effect (Figure
5).

D04: Initial Screening & Down-Select 5.3 Results
Pale Blue Dot Energy | Axis Well Technology Page 34 of 74
Figure 4 - Impact of individual qualification criteria on inventory number and total theoretical capacity, coded by store unit type.
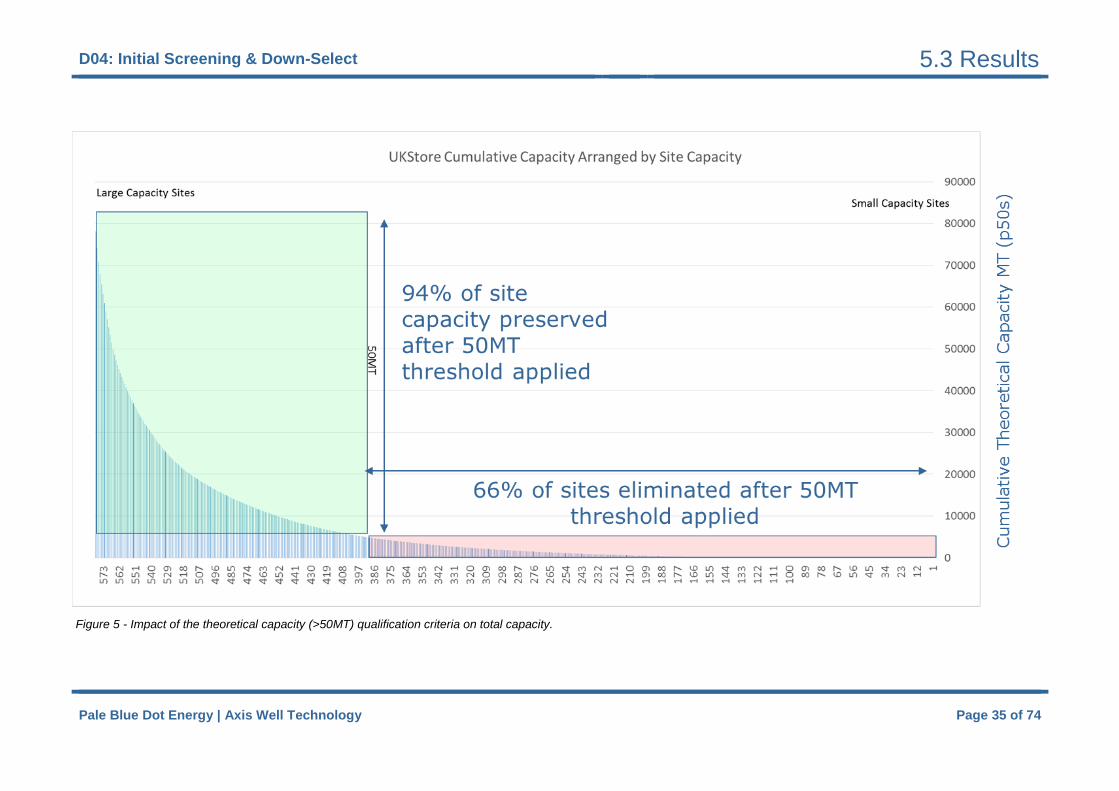
D04: Initial Screening & Down-Select 5.3 Results
Pale Blue Dot Energy | Axis Well Technology Page 35 of 74
Figure 5 - Impact of the theoretical capacity (>50MT) qualification criteria on total capacity.

D04: Initial Screening & Down-Select 5.3 Results
Pale Blue Dot Energy | Axis Well Technology Page 36 of 74
It is worth noting at this point that the P50 theoretical capacity estimate in
CO2Stored does not equate to a true dynamic capacity of each site. As such, it
is anticipated that the capacity values for each qualified site will change (most
likely fall) as the site progresses further through evaluation and appraisal -
experience indicates that capacity tends to decrease as knowledge increases.
The 50MT threshold is very much a minimum cut-off value.
Figure 4 indicates that Georisk, or the geological risk to secure containment (as
opposed to the engineered containment risk associated with existing and new-
drill wells) was effective at cutting the saline aquifer site number by 51 which
were considered to have both a high risk factor linked to secure, long term
containment and high confidence in the data used to assign that risk. This was
considered a key qualification criterion - there being little point in investing
development money to investigate and derisk such stores when an abundance
of less risky candidate stores are available.. Hydrocarbon sites were excluded
from Georisk qualification at this stage and so show no impact to this cut.
The permeability cut-off (>50mD) was also selected to allow for the significant
uncertainty associated with the values held within the CO2Stored database
(Energy Technologies Institute, 2010) while also removing the 51 sites which
are unlikely to support the required injection rate (as per the Basis of Design).
The IEAGHG (2009) guidelines actually suggest >300mD is required for a site
to have 'positive indicators' for carbon storage; a 10-100mD range is a
cautionary indicator (IEA Greenhouse Gas R&D Programme, 2009). The
selection of 50mD provides for the level of uncertainty associated with the
permeability values reported. A sensitivity analysis suggests that of 118 sites
remaining before the permeability cut off was applied just over 40% were lost
with a 50mD threshold whilst only a further 10% were lost with a 100mD
threshold (Figure 6). WP4 will begin to verify the permeability ranges where
possible for each selected site.
Figure 6 - Qualification Sensitivity to Permeability Threshold
The removal of the lower permeability sites also has a significant impact on the
total inventory capacity, dropping from around 45000 MT by over 50% to 19350
MT. These losses arise from the elimination of 43 deep saline aquifers (average
depth 2940m) and 6 large low permeability Leman Sandstone gas fields.
It is noted that permeability effects cost more than security, and cost is also
correlated with other fundamentals (depth, water depth, distance from shore
etc).

D04: Initial Screening & Down-Select 5.3 Results
Pale Blue Dot Energy | Axis Well Technology Page 37 of 74
The Qualified Inventory
The final result of the Qualification screening process is a “Qualified Inventory”
containing sites which carry the greatest potential for long term, secure storage
and have good potential to meet the project objectives. The qualified inventory
of 37 sites has a total theoretical capacity of 8295 MT held in a broad portfolio.
Figure 14 illustrates the full Qualified Inventory plus two additional
Benchmarking sites. Table 14 summarises the distribution of unit designations,
store types and nearest Beachheads for the Qualified Inventory.
Table 14 – Qualified Inventory Characterisation
This Qualified Inventory was then progressed to the Ranking phase of this work
programme to produce the final selection of the Top 20 sites to move into WP4
where each will be subject to detailed due diligence.
Unit Designation Store Type Nearest Beachhead
Saline Aquifer 16
Structural /
Stratigraphic Trap
27 Barmston 12
Gas Field 10 Fully Confined 4 St. Fergus 20
Oil & Gas Field 7 Open (no confinement)
4 Connah's Quay 4
Gas Condensate Field
4 Open (with confinement)
2 Redcar
Medway 1
Total 37 Total 37 Total 37
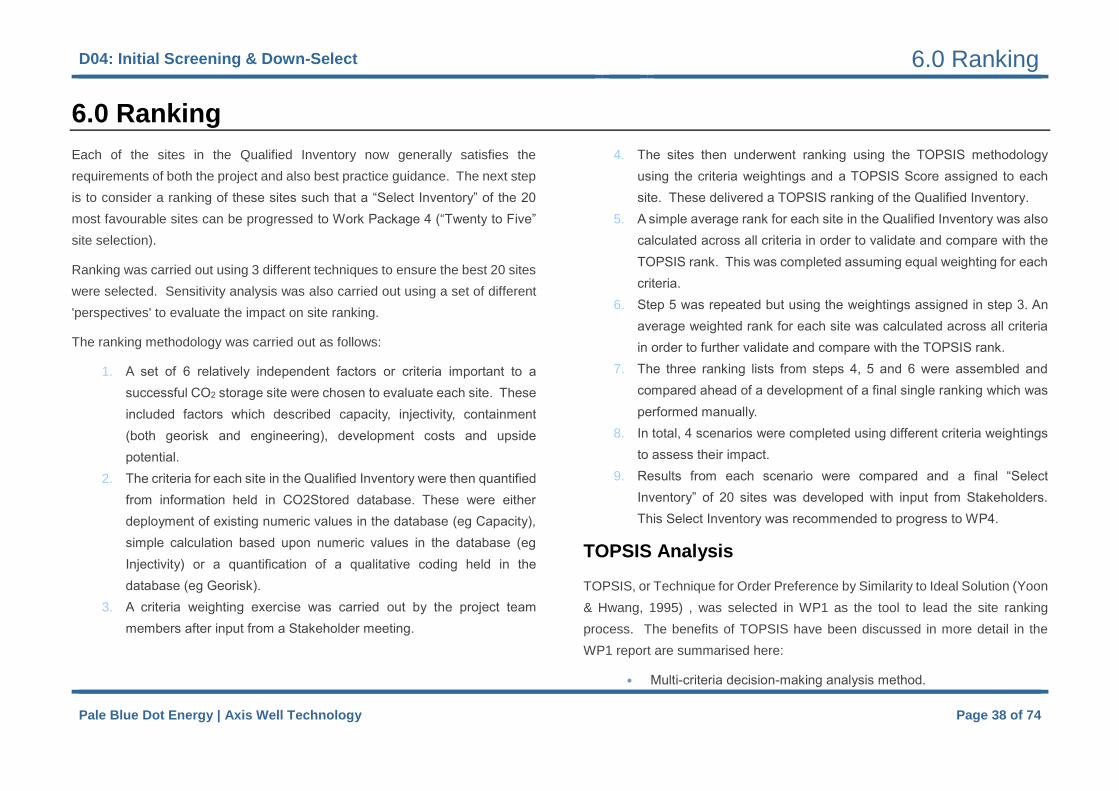
D04: Initial Screening & Down-Select 6.0 Ranking
Pale Blue Dot Energy | Axis Well Technology Page 38 of 74
6.0 Ranking
Each of the sites in the Qualified Inventory now generally satisfies the
requirements of both the project and also best practice guidance. The next step
is to consider a ranking of these sites such that a “Select Inventory” of the 20
most favourable sites can be progressed to Work Package 4 (“Twenty to Five”
site selection).
Ranking was carried out using 3 different techniques to ensure the best 20 sites
were selected. Sensitivity analysis was also carried out using a set of different
'perspectives' to evaluate the impact on site ranking.
The ranking methodology was carried out as follows:
1. A set of 6 relatively independent factors or criteria important to a
successful CO2 storage site were chosen to evaluate each site. These
included factors which described capacity, injectivity, containment
(both georisk and engineering), development costs and upside
potential.
2. The criteria for each site in the Qualified Inventory were then quantified
from information held in CO2Stored database. These were either
deployment of existing numeric values in the database (eg Capacity),
simple calculation based upon numeric values in the database (eg
Injectivity) or a quantification of a qualitative coding held in the
database (eg Georisk).
3. A criteria weighting exercise was carried out by the project team
members after input from a Stakeholder meeting.
4. The sites then underwent ranking using the TOPSIS methodology
using the criteria weightings and a TOPSIS Score assigned to each
site. These delivered a TOPSIS ranking of the Qualified Inventory.
5. A simple average rank for each site in the Qualified Inventory was also
calculated across all criteria in order to validate and compare with the
TOPSIS rank. This was completed assuming equal weighting for each
criteria.
6. Step 5 was repeated but using the weightings assigned in step 3. An
average weighted rank for each site was calculated across all criteria
in order to further validate and compare with the TOPSIS rank.
7. The three ranking lists from steps 4, 5 and 6 were assembled and
compared ahead of a development of a final single ranking which was
performed manually.
8. In total, 4 scenarios were completed using different criteria weightings
to assess their impact.
9. Results from each scenario were compared and a final “Select
Inventory” of 20 sites was developed with input from Stakeholders.
This Select Inventory was recommended to progress to WP4.
TOPSIS Analysis
TOPSIS, or Technique for Order Preference by Similarity to Ideal Solution (Yoon
& Hwang, 1995) , was selected in WP1 as the tool to lead the site ranking
process. The benefits of TOPSIS have been discussed in more detail in the
WP1 report are summarised here:
• Multi-criteria decision-making analysis method.
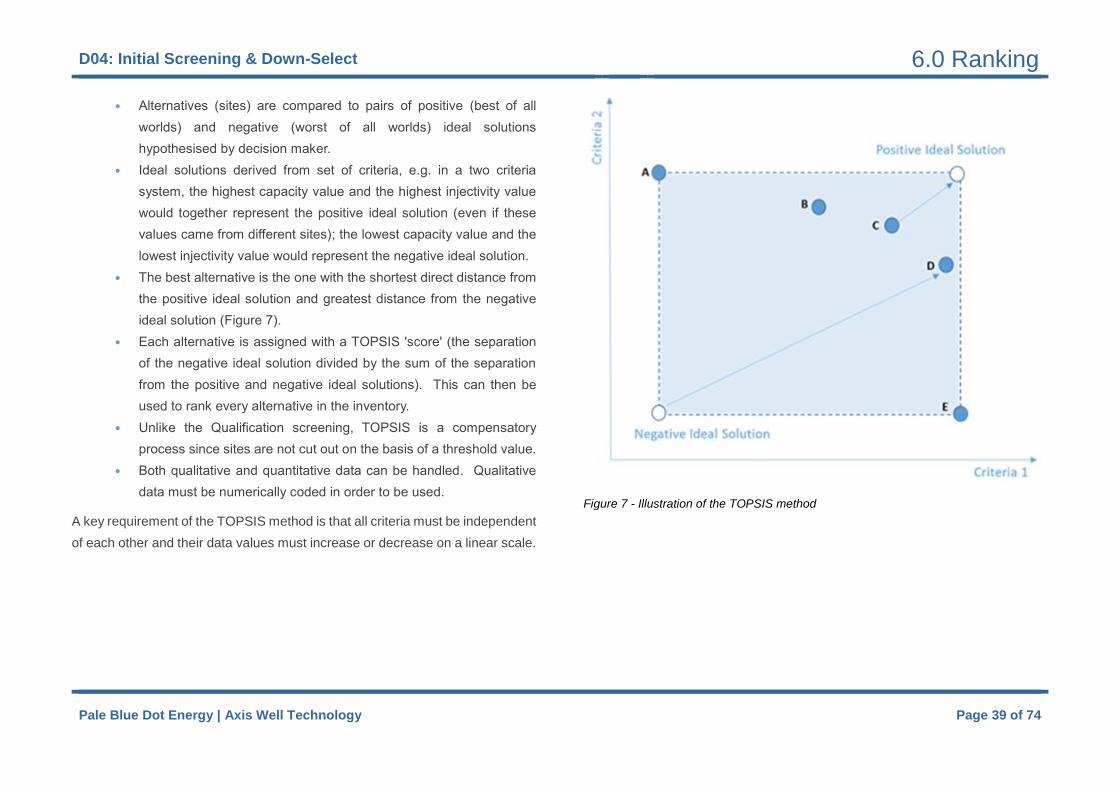
D04: Initial Screening & Down-Select 6.0 Ranking
Pale Blue Dot Energy | Axis Well Technology Page 39 of 74
• Alternatives (sites) are compared to pairs of positive (best of all
worlds) and negative (worst of all worlds) ideal solutions
hypothesised by decision maker.
• Ideal solutions derived from set of criteria, e.g. in a two criteria
system, the highest capacity value and the highest injectivity value
would together represent the positive ideal solution (even if these
values came from different sites); the lowest capacity value and the
lowest injectivity value would represent the negative ideal solution.
• The best alternative is the one with the shortest direct distance from
the positive ideal solution and greatest distance from the negative
ideal solution (Figure 7).
• Each alternative is assigned with a TOPSIS 'score' (the separation
of the negative ideal solution divided by the sum of the separation
from the positive and negative ideal solutions). This can then be
used to rank every alternative in the inventory.
• Unlike the Qualification screening, TOPSIS is a compensatory
process since sites are not cut out on the basis of a threshold value.
• Both qualitative and quantitative data can be handled. Qualitative
data must be numerically coded in order to be used.
A key requirement of the TOPSIS method is that all criteria must be independent
of each other and their data values must increase or decrease on a linear scale.
Figure 7 - Illustration of the TOPSIS method

D04: Initial Screening & Down-Select 6.1 Criteria
Pale Blue Dot Energy | Axis Well Technology Page 40 of 74
6.1 Criteria
The six ranking criteria selected are described in Table 15 below. In a complex system such as a CO2 storage site, it is very difficult to find totally independent
parameters. For example, capacity and permeability are both related to porosity, injectivity is dependent upon permeability and even development cost is dependent
upon depth which also controls pressure – a key element of capacity. As a result, each criterion has undergone careful consideration to ensure the set are relatively
independent. This was tested later quantitatively through a correlation search.
Ranking Criteria Description Data Source
1 Theoretical capacity Database Value - P50 theoretical capacity in MT. CO2Stored database. (Energy Technologies Institute, 2010)
2 Injectivity Calculated Value - The product permeability and thickness mid case values as a proxy for injectivity index.
CO2Stored database. (Energy Technologies Institute, 2010)
3 Containment: Engineered
Calculated Value - The density of existing and legacy wells (number of wells/km2).
CO2Stored database (area estimates and well count). (Energy Technologies Institute, 2010)
4 Containment: Georisk
Quantification Value - A quantification of the three caprock seal factors and three fault risk factors assigned to each site (Table 16).
CO2Stored database.
5 Development Cost Factor
Calculated Value – A proxy cost factor based on approximate pipeline and well cost for a standardised development of a store 5 wells based only on geographic location and reservoir depth. This approach is required to ensure that the cost factor is independent of all other factors (as required by TOPSIS) and in particular capacity and injectivity. In reality of course the development cost is dependent upon both capacity and injectivity as well as a range of other items. Estimating factors of £1.1m/ km of installed pipeline and £17m/km of well depth were used, these are derived from the Data Sources quoted.
DCF(£m) = (distance to beachhead in km)*£1.1m/km + 5*(depth of well in metres)*£17m/km
CO2Stored site coordinates
TVU report (pipeline). (Pale Blue Dot Energy Ltd, 2015)
Aspen Conceptual Well Design Options (spd, 2012)
6 Upside Potential Summation of all the P50 theoretical capacity estimates from the full Initial Inventory sites with centroid positions within 20 km radius of site in question.
CO2Stored database (full inventory minus specific site). (Energy Technologies Institute, 2010)
Table 15 - Ranking Criteria
While the majority of the criteria are quantitative, it was necessary to quantify a
qualitative value for the Georisk Containment criteria. The information available
in CO2Stored for containment is a consistent qualitative risk assessment ranked
as high, medium or low. It was based on a methodology which had undergone

D04: Initial Screening & Down-Select 6.1 Criteria
Pale Blue Dot Energy | Axis Well Technology Page 41 of 74
a benchmarking process. Here these risk assessments were quantified by
replacing the high, medium and low risks with scores of 3, 2 and 1 for each of
the six containment factors and then summing these scores. The resulting
Georisk factor ranges from a minimum of 6 to a maximum of 18 (Table 16).
Table 16 – Examples of Georisk Containment quantification.
Finally, to be confident that the criteria being used in the ranking process were
independent of each other (a requirement of TOPSIS), a simple correlation
search was completed. This was achieved by plotting the data for each of the
37 sites in the qualified inventory for each pair of criteria. Figure 8 shows a
matrix of scatter plots each of which displays either poorly or completely
uncorrelated clouds of points. This provides further confidence that the selected
criteria are indeed largely independent of one another.
TOPSIS Ideal Solutions
The ideal positive and negative solutions for the TOPSIS analysis are shown in
Table 17. For the ranking criteria selected, capacity, injectivity and upside
potential are normal criteria while both containment criteria and the development
cost factor are reverse criteria (lowest value is optimal).
Criteria Criteria Label
Positive Ideal Solution
Negative Ideal Solution
1 Capacity 1691MT 50MT
2 Injectivity 1,286,651 mDm 2,743mDm
3 Containment (Engineered)
0.013 wells/km2 18.378 wells/km2
4 Containment (Georisk)
6 (dimensionless) 16 (dimensionless)
5 Development Cost Factor
116 (dimensionless) 751 (dimensionless)
6 Upside Potential
10016MT 421MT
Table 17 - Optimal positive and negative ideal solutions for each ranking criteria
Fracture
pressure
capacity
Seal
chemical
reactivity
Seal
degradation
Fault
Density
Throw and
fault seal
Fault
vertical
extent
Site A low high medium high high medium 14
Site B low low low low low low 6
Site C medium medium medium medium medium medium 12
Site D high high high high high high 18
low = 1 medium = 2 high = 3
Seal Characterisation Fault CharacterisationGeorisk
Factor

D04: Initial Screening & Down-Select 6.1 Criteria
Pale Blue Dot Energy | Axis Well Technology Page 42 of 74
Figure 8 - Ranking Factor Independence Check
Capacity InjectivityEngineering
Containment RiskGeo Containment Risk
Development Cost
Factor
Inje
ctiv
ity
Engi
nee
rin
g
Co
nta
inm
ent
Ris
kG
eo C
on
tain
men
t R
isk
Dev
elo
pm
ent
Co
st
Fact
or
Up
sid
e P
ote
nti
al12345678
910111213141516
1716171819202122
23
242526
27
28
293031
32
33
34
35
36
370
2
4
6
8
10
12
14
16
18
20
0 1000 2000
1234
567891011
12
1314
15
16
1716
17
18
19202122
23
2425
26
27
28
29
30313233
34
35
36
370
500000
1000000
1500000
0 1000 2000
1
2
3
4
5
67
8
910
11
12
13
14
15
1617
161718
1920
21
22
2324
25
26
27
28293031
32
3334
3536
37
0
2
4
6
8
10
12
14
16
18
0 1000 2000
1
2
34
5
6
78
9
10
11
12
1314
15
16171617
18
19
20
21
22
23
24
25
26
27
28
29
30
3132
33
34
35
36
37
0
100
200
300
400
500
600
700
800
0 1000 2000
1
2
3
4
5
67
8
910
11
12
131415
16
17
1617
181920
2122
2324
25
26
2728
29
30313233
34
35
36
37
0
2000
4000
6000
8000
10000
12000
0 1000 2000
1234567891011
121314 1516
1716171819202122
23
2425 26
27
28
293031
32
33
34
35
36
370
2
4
6
8
10
12
14
16
18
20
0 1000000 2000000
1
2
3
4
5
67
8
910
11
12
13
14
15
1617
161718
1920
21
22
2324
25
26
27
282930
31
32
3334
35 36
37
0
2
4
6
8
10
12
14
16
18
0 1000000 2000000
1
2
3
4
5
67
8
910
11
12
13
14
15
1617
161718
1920
21
22
2324
25
26
27
28293031
32
3334
35 36
37
0
2
4
6
8
10
12
14
16
18
0 10 20
1
2
34
5
6
78
9
10
11
12
1314
15
16171617
18
19
20
21
22
23
24
25
26
27
28
29
30
3132
33
34
35
36
37
0
100
200
300
400
500
600
700
800
0 1000000 2000000
1
2
34
5
6
78
9
10
11
12
1314
15
16171617
18
19
20
21
22
23
24
25
26
27
28
29
30
31 32
33
34
35
36
37
0
100
200
300
400
500
600
700
800
0 10 20
1
2
34
5
6
78
9
10
11
12
1314
15
16171617
18
19
20
21
22
23
24
25
26
27
28
29
30
3132
33
34
35
36
37
0
100
200
300
400
500
600
700
800
0 10 20
1
2
3
4
5
67
8
910
11
12
131415
16
17
1617
181920
2122
2324
25
26
27 28
29
30313233
34
35
36
37
0
2000
4000
6000
8000
10000
12000
0 1000000 2000000
1
2
3
4
5
67
8
910
11
12
131415
16
17
1617
181920
2122
2324
25
26
2728
29
3031
3233
34
35
36
37
0
2000
4000
6000
8000
10000
12000
0 10 20
1
2
3
4
5
67
8
910
11
12
13 1415
16
17
1617
18 1920
21 22
2324
25
26
27 28
29
3031
3233
34
35
36
37
0
2000
4000
6000
8000
10000
12000
0 10 20
1
2
3
4
5
67
8
910
11
12
131415
16
17
1617
181920
2122
2324
25
26
2728
29
303132
33
34
35
36
37
0
2000
4000
6000
8000
10000
12000
0 500 1000

D04: Initial Screening & Down-Select 6.2 Criteria Weighting
Pale Blue Dot Energy | Axis Well Technology Page 43 of 74
6.2 Criteria Weighting
Both the TOPSIS analytical process and the average ranking process allow
each criteria to have a different weight or relative importance assigned to them.
A base case set of criteria weights was developed using a pairwise
consideration matrix. Here each criteria was compared to each other to consider
their relative importance of each to the project objectives (safe, long term,
economically-viable storage). The results are outlined in Figure 9. In the plot,
Theoretical Capacity is considered to be moderately more important than
injectivity with a score of 3 for example. A weight for each criterion was rolled
up from the process with Georisk containment being the dominant criterion
(46%) followed by theoretical capacity (21%). The input into the matrix was
controlled by the project team using expert judgement and so is subjective in
nature. The impact of the weightings on the site selections was tested further
during the sensitivity analysis.
The Stakeholder Workshop on 2nd July 2015 included a session on criteria,
weighting and ranking. The insights from the session were used to develop four
alternative weighting scenarios. These were used to ensure robustness in the
ranking process and are summarized below.
1. Rounded View – Uses all six criteria and initial weighting from a
pairwise consideration matrix
2. Equal Weighting - Uses all six criteria with equal weighting
3. Container View – Uses the four subsurface characteristics (Capacity,
Injectivity and 2x Containment) equally weighted
4. Simple View – Uses only capacity and development cost to focus on a
“keep it simple” approach and taking advantage of all “qualified sites”
having passed the IEAGHG site characterization guidelines (IEA
Greenhouse Gas R&D Programme, 2009).

D04: Initial Screening & Down-Select 6.2 Criteria Weighting
Pale Blue Dot Energy | Axis Well Technology Page 44 of 74
Figure 9 - Development of Initial Ranking Criteria Weighting

D04: Initial Screening & Down-Select 6.3 Benchmarking
Pale Blue Dot Energy | Axis Well Technology Page 45 of 74
6.3 Benchmarking
Following the ranking process, and feedback from stakeholders, it was
concluded that it would be useful to benchmark the ranking using some of the
well-known CO2 storage targets in the UKCS which have been significantly
invested in and matured through FEED programmes. The key benchmark sites
for consideration included:-
1. 5/42 – Prospective Phase 1 storage site, a saline aquifer Triassic
Bunter Formation structural trap in the Southern North Sea.
2. Goldeneye – Prospective Phase 1 storage site, a depleted Lower
Cretaceous gas field in the Central North Sea.
3. Hewett – Prospective Demo1 FEED storage site, a depleted Bunter
gas field in the Southern North Sea.
All of these sites were part of the Initial Inventory, however neither 5/42 nor
Goldeneye were able to pass the qualification requirements for this project. 5/42
was eliminated because there was not enough 3D seismic coverage available
to this project to consider it further. New 3D is available to the Operator over
the whole structure, but access to this is commercially beyond the budget for
this project. Goldeneye was eliminated because it did not meet the requirement
to have a P50 theoretical capacity of at least 50MT. Furthermore it is assumed
that both of these sites will be licensed long term to the respective CO2 Storage
operators and will therefore be unavailable to other prospective storage
developers.
It is very important to stress that the absence of these two specific sites in the
Qualified Inventory does not imply they are in any way technically unsuitable for
CO2 storage, but merely that they did not qualify under the metrics applied to
this project.
The Hewett field is another potential storage site which has also undergone
significant evaluation and early appraisal through projects which were partly
publically funded. Hewett has made the Qualified Inventory by passing the
threshold tests.
In addition to Hewett, both 5/42 and Goldeneye have been used as Benchmarks
to provide useful reference points in the ranking process.
Stakeholder Input
Stakeholder input has been an important part of bringing the focus of a wide
range of expertise from industry, policymakers and academic research together
to help sense check and inform the process and outputs from the project to date.
In the course of WP3 a workshop was completed around the detailed screening
methodology and first pass results. A short workshop report is included as
Appendix 2 to this report
.

D04: Initial Screening & Down-Select 6.4 Results
Pale Blue Dot Energy | Axis Well Technology Page 46 of 74
6.4 Results
The input data and the TOPSIS score for each site in the Qualified Inventory is
illustrated in Figure 10. At this stage the site identity remains hidden to minimise
any bias influence. Only three sites are identified. These are the benchmarks
of 5/42, Goldeneye and Hewett. Of these only Hewett is actually a part of the
Qualified Inventory. The sites are simply ordered by their P50 Theoretical
Capacity. In the plot, the green bars denote normal criteria where larger
numbers are favourable, and the red bars denote reverse criteria where smaller
numbers are favourable.
The data set was then used to calculate a TOPSIS score with the base case
criteria weights in place. This base case or Rounded View TOPSIS score is
also shown in Figure 10. A key to the site number and identifiers is given at the
end of the ranking and sensitivity analysis in Figure 14.
Two additional ranking methods were added as a result of Stakeholder
feedback. These have been used to validate and sense check the TOPSIS
approach. The first of these simply looked at the rank that each site achieved
for each criteria (Capacity, Injectivity, Development Cost Factor etc) and then
averaged this position. The second performed this same calculation again, but
this time accounted for the relative weights assigned to each criteria. The results
of these ranking methods are shown alongside the TOPSIS ranks in Figure 11.
The ranks for all criteria & sites are colour-coded by whether they fall into the
top 5 sites (green), the next 15 sites (white) or sites in the drop zone below
position 20 to allow easy visual comparison of results.
Comparison of Results and Ranking Methods
An initial review of the three ranking methods suggests strong agreement
regarding the bulk of the Top 20 sites. At the site rank level, there is more
variation, particularly amongst the Top 10 sites. The two plots shown in Figure
12 compare the TOPSIS site ranking with both the "Average Rank' and
'Weighted Average Rank'. As would be expected, the TOPSIS and Weighted
Average Ranks (using the same criteria weighting values) are significantly better
correlated. Two outliers are circled in Figure 12, representing sites 15 and 16.
This highlights the importance of using expert judgement to ultimately decide
whether to keep the site in the final selection or whether to place on-hold. Other
than these outliers, the results provide confidence that TOPSIS performed well
as a tool and the ranking process is both useful and comparable between
methods and, as such, is ready for advancing to sensitivity analysis.

D04: Initial Screening & Down-Select 6.4 Results
Pale Blue Dot Energy | Axis Well Technology Page 47 of 74
Figure 10 - Input to TOPSIS Score for Qualified Inventory
Basic Select Data Capacity InjectivityEngineering
Containment Risk
Geo Containment
Risk
Development Cost
FactorUpside Potential
Weight-> 21 11 46 8 8 4 1
Site 1 1691.0 33380.0 0.6 9.0 292.1 3898.0
Site 2 1388.0 19012.0 0.1 16.0 396.2 2534.0
Site 3 776.0 90753.0 0.4 10.0 167.1 4429.0
Bmk 5/42 554.0 98052.0 0.0 6.0 210.4 1057.0
Site 4 409.0 23926.0 0.2 9.0 313.7 4287.0
Site 5 271.0 8350.0 0.4 11.0 423.5 2711.0
Site 6 - Bmk Hewett 243.0 20500.0 0.3 11.0 299.5 3812.0
Site 7 232.0 11051.5 0.2 6.0 301.5 1179.0
Site 8 211.0 36540.0 1.2 8.0 685.2 3923.0
Site 9 205.0 82749.2 0.3 8.0 276.9 3856.0
Site 10 175.0 109728.0 0.6 10.0 193.8 5958.0
Site 11 175.0 612500.0 2.0 8.0 304.1 9624.1
Site 12 174.0 48906.0 0.1 13.0 476.6 7140.0
Site 13 162.0 10978.0 0.1 15.0 434.9 6868.0
Site 14 156.0 430010.0 0.1 12.0 194.8 5777.0
Site 15 137.0 177000.0 0.1 10.0 562.8 421.0
Site 16 130.0 4572.0 1.4 10.0 548.2 10016.1
Site 17 128.0 10500.0 2.3 8.0 576.0 1495.5
Site 18 122.0 178560.0 2.1 8.0 625.7 1825.5
Site 20 120.0 11430.0 0.6 9.0 359.4 4019.0
Site 19 120.0 175715.0 0.5 11.0 116.1 3946.0
Site 21 114.0 46288.0 0.1 12.0 555.4 3379.0
Site 22 104.0 81600.0 1.0 8.0 751.3 1947.0
Site 23 99.0 64860.0 0.2 12.0 412.1 1889.5
Site 24 97.0 630000.0 4.6 8.0 167.1 5746.0
Site 25 85.0 5720.0 0.4 8.0 432.7 5102.0
Site 26 84.0 22673.0 0.0 6.0 278.0 2127.0
Site 27 81.0 378585.0 0.1 11.0 177.5 5946.0
Site 28 76.0 723900.0 18.4 8.0 443.1 4139.6
Site 29 72.0 1286651.3 3.5 12.0 163.9 3982.0
Site 30 64.0 424080.0 0.2 11.0 432.0 6947.1
Site 31 63.0 19068.0 0.3 11.0 271.3 2978.0
Site 32 62.0 24888.4 0.3 12.0 410.9 3928.0
Site 33 60.0 27800.0 7.3 6.0 435.8 3285.5
Site 34 56.0 35476.0 0.5 9.0 317.5 4179.0
Site 35 53.0 182500.0 4.5 8.0 578.7 7543.0
Site 36 50.0 2743.0 0.4 6.0 315.7 1420.0
Site 37 50.0 228600.0 3.1 6.0 442.4 4165.6
Bmk GY 37.0 79000.0 0.6 8.0 331.4 6113.0
0.0 0.1 0.2 0.3 0.4 0.5 0.6 0.7 0.8 0.9
1
2
3
4
5
6
7
8
9
10
11
12
13
14
15
16
17
18
19
20
21
22
23
24
25
26
27
28
29
30
31
32
33
34
35
36
37
38
39
TOPSIS SCORE
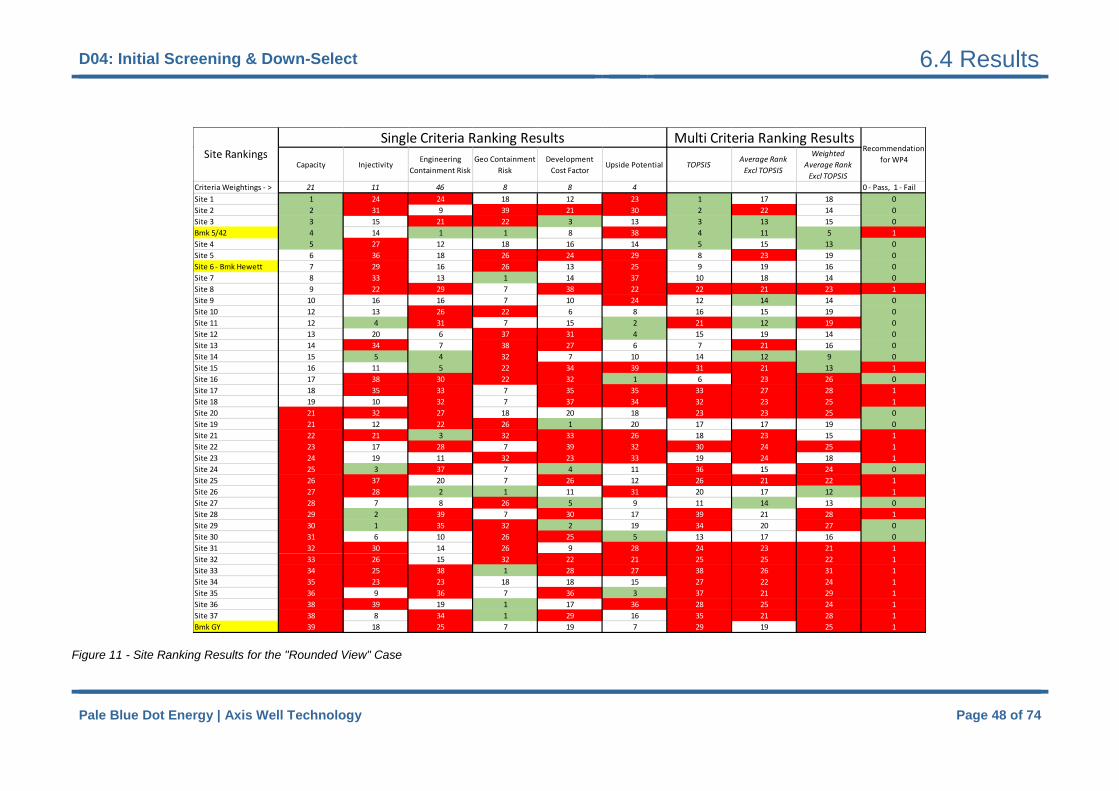
D04: Initial Screening & Down-Select 6.4 Results
Pale Blue Dot Energy | Axis Well Technology Page 48 of 74
Figure 11 - Site Ranking Results for the "Rounded View" Case
Capacity InjectivityEngineering
Containment Risk
Geo Containment
Risk
Development
Cost FactorUpside Potential TOPSIS
Average Rank
Excl TOPSIS
Weighted
Average Rank
Excl TOPSIS
Criteria Weightings - > 21 11 46 8 8 4 0 - Pass, 1 - Fail
Site 1 1 24 24 18 12 23 1 17 18 0
Site 2 2 31 9 39 21 30 2 22 14 0
Site 3 3 15 21 22 3 13 3 13 15 0
Bmk 5/42 4 14 1 1 8 38 4 11 5 1
Site 4 5 27 12 18 16 14 5 15 13 0
Site 5 6 36 18 26 24 29 8 23 19 0
Site 6 - Bmk Hewett 7 29 16 26 13 25 9 19 16 0
Site 7 8 33 13 1 14 37 10 18 14 0
Site 8 9 22 29 7 38 22 22 21 23 1
Site 9 10 16 16 7 10 24 12 14 14 0
Site 10 12 13 26 22 6 8 16 15 19 0
Site 11 12 4 31 7 15 2 21 12 19 0
Site 12 13 20 6 37 31 4 15 19 14 0
Site 13 14 34 7 38 27 6 7 21 16 0
Site 14 15 5 4 32 7 10 14 12 9 0
Site 15 16 11 5 22 34 39 31 21 13 1
Site 16 17 38 30 22 32 1 6 23 26 0
Site 17 18 35 33 7 35 35 33 27 28 1
Site 18 19 10 32 7 37 34 32 23 25 1
Site 20 21 32 27 18 20 18 23 23 25 0
Site 19 21 12 22 26 1 20 17 17 19 0
Site 21 22 21 3 32 33 26 18 23 15 1
Site 22 23 17 28 7 39 32 30 24 25 1
Site 23 24 19 11 32 23 33 19 24 18 1
Site 24 25 3 37 7 4 11 36 15 24 0
Site 25 26 37 20 7 26 12 26 21 22 1
Site 26 27 28 2 1 11 31 20 17 12 1
Site 27 28 7 8 26 5 9 11 14 13 0
Site 28 29 2 39 7 30 17 39 21 28 1
Site 29 30 1 35 32 2 19 34 20 27 0
Site 30 31 6 10 26 25 5 13 17 16 0
Site 31 32 30 14 26 9 28 24 23 21 1
Site 32 33 26 15 32 22 21 25 25 22 1
Site 33 34 25 38 1 28 27 38 26 31 1
Site 34 35 23 23 18 18 15 27 22 24 1
Site 35 36 9 36 7 36 3 37 21 29 1
Site 36 38 39 19 1 17 36 28 25 24 1
Site 37 38 8 34 1 29 16 35 21 28 1
Bmk GY 39 18 25 7 19 7 29 19 25 1
Single Criteria Ranking Results Multi Criteria Ranking ResultsSite Rankings
Recommendation
for WP4

D04: Initial Screening & Down-Select 6.4 Results
Pale Blue Dot Energy | Axis Well Technology Page 49 of 74
Figure 12 - Ranking Method Performance Check
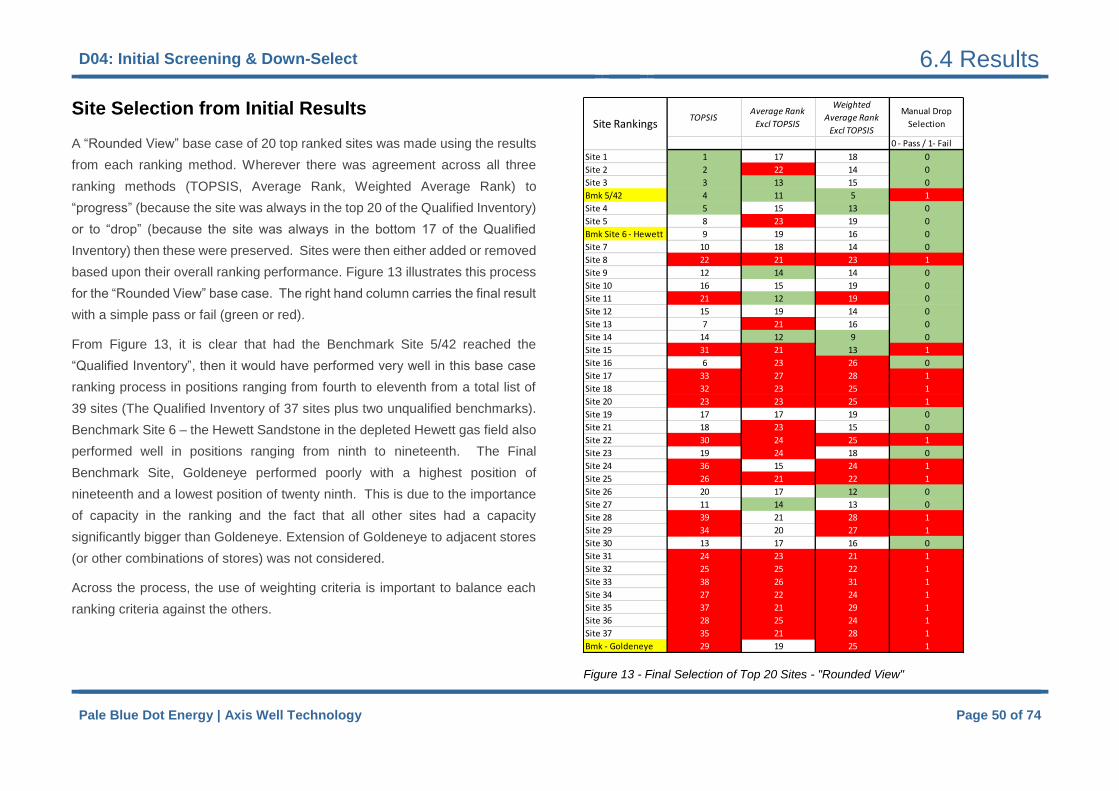
D04: Initial Screening & Down-Select 6.4 Results
Pale Blue Dot Energy | Axis Well Technology Page 50 of 74
Site Selection from Initial Results
A “Rounded View” base case of 20 top ranked sites was made using the results
from each ranking method. Wherever there was agreement across all three
ranking methods (TOPSIS, Average Rank, Weighted Average Rank) to
“progress” (because the site was always in the top 20 of the Qualified Inventory)
or to “drop” (because the site was always in the bottom 17 of the Qualified
Inventory) then these were preserved. Sites were then either added or removed
based upon their overall ranking performance. Figure 13 illustrates this process
for the “Rounded View” base case. The right hand column carries the final result
with a simple pass or fail (green or red).
From Figure 13, it is clear that had the Benchmark Site 5/42 reached the
“Qualified Inventory”, then it would have performed very well in this base case
ranking process in positions ranging from fourth to eleventh from a total list of
39 sites (The Qualified Inventory of 37 sites plus two unqualified benchmarks).
Benchmark Site 6 – the Hewett Sandstone in the depleted Hewett gas field also
performed well in positions ranging from ninth to nineteenth. The Final
Benchmark Site, Goldeneye performed poorly with a highest position of
nineteenth and a lowest position of twenty ninth. This is due to the importance
of capacity in the ranking and the fact that all other sites had a capacity
significantly bigger than Goldeneye. Extension of Goldeneye to adjacent stores
(or other combinations of stores) was not considered.
Across the process, the use of weighting criteria is important to balance each
ranking criteria against the others.
Figure 13 - Final Selection of Top 20 Sites - "Rounded View"
TOPSISAverage Rank
Excl TOPSIS
Weighted
Average Rank
Excl TOPSIS
Manual Drop
Selection
0 - Pass / 1- Fail
Site 1 1 17 18 0
Site 2 2 22 14 0
Site 3 3 13 15 0
Bmk 5/42 4 11 5 1
Site 4 5 15 13 0
Site 5 8 23 19 0
Bmk Site 6 - Hewett 9 19 16 0
Site 7 10 18 14 0
Site 8 22 21 23 1
Site 9 12 14 14 0
Site 10 16 15 19 0
Site 11 21 12 19 0
Site 12 15 19 14 0
Site 13 7 21 16 0
Site 14 14 12 9 0
Site 15 31 21 13 1
Site 16 6 23 26 0
Site 17 33 27 28 1
Site 18 32 23 25 1
Site 20 23 23 25 1
Site 19 17 17 19 0
Site 21 18 23 15 0
Site 22 30 24 25 1
Site 23 19 24 18 0
Site 24 36 15 24 1
Site 25 26 21 22 1
Site 26 20 17 12 0
Site 27 11 14 13 0
Site 28 39 21 28 1
Site 29 34 20 27 1
Site 30 13 17 16 0
Site 31 24 23 21 1
Site 32 25 25 22 1
Site 33 38 26 31 1
Site 34 27 22 24 1
Site 35 37 21 29 1
Site 36 28 25 24 1
Site 37 35 21 28 1
Bmk - Goldeneye 29 19 25 1
Site Rankings

D04: Initial Screening & Down-Select 6.5 Sensitivities
Pale Blue Dot Energy | Axis Well Technology Page 51 of 74
6.5 Sensitivities
A set of four scenarios was developed to test the robustness of the ranking
process and evaluate the sensitivity of the site rankings to different criteria
weightings:
1. Rounded View (Base Case) – This uses all six criteria and the initial
weighting from a pairwise consideration matrix.
2. Equal Weighting - Uses all six criteria with equal weighting.
3. Container View – This puts the technical aspects of the store first and
foremost and uses the four subsurface characteristics (Capacity,
Injectivity and both Containment criteria) equally weighted.
4. Simple View – This focuses on capacity and unit cost by using only
theoretical capacity, Development cost factor and the Upside Potential
as a proxy for a “keep it simple” or 'large and low-cost' approach
advocated by some stakeholders.
Results of Sensitivity Analysis
The results for these cases were developed in exactly the same way as
described in the previous section. Figure 14 shows the results for each
sensitivity case together with the recommended decision in the column on the
far right for progression to WP4 of this project.
The analysis shows that there is full agreement to progress 14 top sites to the
Select Inventory and also full agreement to drop a further 14 sites from further
consideration at this time. Stakeholder review and input helped to resolve the
position of the further six sites that would be progressed and the 5 sites that
would not progress, but would be held on a reserve list.
Overall given the nature of the screening data available and the uncertainties
present, the Simple View case gained most support from the Stakeholder Group.
However specific questions and suggestions led to the following modifications
in the final Selected Inventory:-
1. Site 8 (Bruce Field) was taken forward in place of Site 16 (Britannia
Field). The rationale behind this was that whilst Britannia has
significantly more potential upside and was closer to both St Fergus
and Goldeneye, Bruce had a P50 Theoretical Capacity that was over
60% larger and a forecasted COP date several years before that of
Britannia.
2. Site 29 (Lennox Field) was removed as the weakest qualified site in
the East Irish Sea to improve the balance with the ETI Scenarios plan.
It was replaced by the next strongest candidate in the Qualified
Inventory which was Site 26, a Bunter saline aquifer closure in the
Southern North Sea.
3. Site 28 (Harding Central Field) was promoted and displaced Site 30
into the reserve list. This was done despite the high well density on
Site 28 because the Harding reservoir is known to contain injected
sandstones which require a higher well density to characterise
effectively and may have a significant Georisk issue which may not be
perceived with poor well data coverage..
The outcome of the final Top 20 recommended selection is a portfolio of sites
which pass all the qualification screening thresholds and represent the sites with
the greatest potential for success with respect to the objectives of this project.

D04: Initial Screening & Down-Select 6.5 Sensitivities
Pale Blue Dot Energy | Axis Well Technology Page 52 of 74
The ranking process has taken the Qualified Inventory of 37 sites to a Select
Inventory of 20 sites: a reduction of 46% of the fully qualified sites. Total
theoretical capacity has, however, decreased from 8,295 MT at the end of
qualification (37 sites) to 6,765MT, a reduction of only 19%, reflecting the focus
upon capacity and cost in the 'Simple View'. The average theoretical site
capacity rose by over 50% from 224MT in the Qualified Inventory to 342MT in
the Select Inventory. This remains in line with the overall project objectives.
Table 18 through Table 21 highlight the diversity of the Select Inventory. The
target storage reservoirs are distributed from the Permian to the Paleogene, but
interestingly include only one Jurassic reservoir. Many of the Jurassic reservoirs
failed to qualify on the basis of small capacity levels and deep reservoirs often
below 3000m. Further Northern Brent Province sites were excluded as they are
beyond the 450km threshold set out in this project basis of design.
The Select Inventory has a 50:50 balance of saline aquifers and depleted
hydrocarbon fields. Most of the hydrocarbon fields are gas fields in the Southern
North Sea. Bruce is the gas condensate field with Captain and Harding Central
representing the oilfields after those with significant CO2 EOR potential have
been removed.
70% of the Select Inventory comprises structural traps, with the remaining 30%
representing large open aquifer systems with or without associated structural
confinement. It is anticipated that the presence or absence of structural or
stratigraphic potential on these may well be refined in WP4.
Finally, the Select Inventory provides a portfolio of sites that can service all the
major emission centres and beachheads identified in the ETI scenarios plan
(Energy Technologies Institute, 2015). With 3 sites in the East Irish Sea, 8 sites
in the Southern North Sea and 9 in the Central North Sea. Whilst there are no
sites in the Select Inventory for which Redcar on Teesside or Medway in the
Thames area are the nearest landfall, both have sites within relatively short
transport distance. Table 22 presents a view of the distance weighted Capacity
in the Select Inventory for each of the key beachheads. This in effect describes
the Theoretical Capacity in the Select Inventory divided by the Distance to the
Beachhead. This highlights the very strong position of Barmston on the
Yorkshire coast, Connah’s Quay on the North Wales and Redcar on Teesside.
Top 20 sites by Geological Age
1. Paleogene 5
3. Lower Cretaceous 3
5. Lower Jurassic 1
6. Triassic 9
7. Permian 2
Table 18 - Select Inventory Sites by Geological Age

D04: Initial Screening & Down-Select 6.5 Sensitivities
Pale Blue Dot Energy | Axis Well Technology Page 53 of 74
Top 20 sites by Unit Designation
Saline Aquifer 10
Gas 7
Oil & Gas 2
Gas Condensate 1
Table 19 - Select Inventory Sites by Unit Designation
Top 20 sites by Storage Type
Structural/Stratigraphic Trap 14
Fully Confined (closed box) 0
Open, no identified structural/ stratigraphic confinement 4
Open, with identified trap 2
Table 20 - Select Inventory Sites by Storage Type
Top 20 sites by Beachhead
Medway 0
Barmston 8
St Fergus 9
Connah's Quay 3
Redcar 0
Table 21 - Select Inventory Sites by Nearest Beachhead
Top 20 sites by Distance Weighted Capacity (MT/km)
Medway 20.9
Barmston 29.5
St Fergus 23.6
Connah's Quay 28.5
Redcar 25.3
Table 22 - Beachhead Distribution of Distance Weighted Capacity in the Select Inventory

D04: Initial Screening & Down-Select 6.5 Sensitivities
Pale Blue Dot Energy | Axis Well Technology Page 54 of 74
Figure 14 - WP3 Down-select Recommendation
Top 20 Theoretical Capacity -> 6749 6510 6645 6741 6765 MT
Normal Normal Reversed Reversed Reversed Normal "Rounded View""Equal
Weighting""Container View" "Simple View" "Final Recommendation"
Criteria 1 Criteria 2 Criteria 3 Criteria 4 Criteria 5 Criteria 6
Code Site Number Capacity MT Injectivity mDm
Engineering
Containment Risk
per sq km
Geo Containment
Risk
Development
Cost Factor $M
Proximal Upside
Potential MTUnit Designation Geological Age Geological Formation Storage Type Site Description Nearest Beachhead
Manual Drop
Selection
Manual Drop
Selection
Manual Drop
Selection
Manual Drop
SelectionRecommended Action
1 2 3 4
226.011 Site 1 1691.0 33380.0 0.6 9.0 292.1 3898.0 Saline Aquifer 6. Triassic Bunter Sandstone Fm Structural/Stratigraphic Trap Bunter Closure 9 Barmston 0 0 0 0 Progress to WP4
372.000 Site 2 1388.0 19012.0 0.1 16.0 396.2 2534.0 Saline Aquifer 1. Paleogene Sele FmOpen, with identified structural/
stratigraphic confinementForties 5 St Fergus 0 0 0 0 Progress to WP4
248.005 Site 3 776.0 90753.0 0.4 10.0 167.1 4429.0 Gas 6. Triassic Ormskirk Sandstone FmStructural/Stratigraphic Trap South Morecambe gas field Connah's Quay 0 0 0 0 Progress to WP4
227.007 Site 4 409.0 23926.0 0.2 9.0 313.7 4287.0 Saline Aquifer 6. Triassic Bunter Sandstone Fm Structural/Stratigraphic Trap Bunter Closure 3 Barmston 0 0 0 0 Progress to WP4
266.001 Bmk Site 6 - Hewett 243.0 20500.0 0.3 11.0 299.5 3812.0 Gas 6. Triassic Bunter Shale Fm Structural/Stratigraphic Trap Hewett gas field Barmston 0 0 0 0 Progress to WP4
139.016 Site 7 232.0 11051.5 0.2 6.0 301.5 1179.0 Saline Aquifer 6. Triassic Bunter Sandstone Fm Structural/Stratigraphic Trap Bunter Closure 36 Barmston 0 0 0 0 Progress to WP4
303.001 Site 9 205.0 82749.2 0.3 8.0 276.9 3856.0 Gas 6. Triassic Bunter Sandstone Fm Structural/Stratigraphic Trap Hewett gas field (Bunter) Barmston 0 0 0 0 Progress to WP4
248.004 Site 10 175.0 109728.0 0.6 10.0 193.8 5958.0 Gas 6. Triassic Ormskirk Sandstone FmStructural/Stratigraphic Trap North Morecambe gas field Connah's Quay 0 0 0 0 Progress to WP4
336.000 Site 11 175.0 612500.0 2.0 8.0 304.1 9624.1 Saline Aquifer 1. Paleogene Horda FmOpen, no identified structural/
stratigraphic confinementGrid Sandstone Member St Fergus 0 0 0 0 Progress to WP4
361.000 Site 12 174.0 48906.0 0.1 13.0 476.6 7140.0 Saline Aquifer 1. Paleogene Lista FmOpen, no identified structural/
stratigraphic confinementMey 1 St Fergus 0 0 0 0 Progress to WP4
366.000 Site 13 162.0 10978.0 0.1 15.0 434.9 6868.0 Saline Aquifer 1. Paleogene Maureen FmOpen, no identified structural/
stratigraphic confinementMaureen 1 St Fergus 0 0 0 0 Progress to WP4
218.000 Site 14 156.0 430010.0 0.1 12.0 194.8 5777.0 Saline Aquifer 3. Lower Cretaceous Wick Sandstone FmOpen, with identified structural/
stratigraphic confinementCaptain_013_17 St Fergus 0 0 0 0 Progress to WP4
133.001 Site 8 211.0 36540.0 1.2 8.0 685.2 3923.0 Gas Condensate 5. Lower Jurassic Statfjord Fm Structural/Stratigraphic Trap Bruce Gas Condensate Field St Fergus 1 1 0 1 Progress to WP5
248.002 Site 19 120.0 175715.0 0.5 11.0 116.1 3946.0 Gas 6. Triassic Ormskirk Sandstone FmStructural/Stratigraphic Trap Hamilton gas field Connah's Quay 0 0 0 0 Progress to WP6
217.000 Site 27 81.0 378585.0 0.1 11.0 177.5 5946.0 Saline Aquifer 3. Lower Cretaceous Wick Sandstone FmOpen, no identified structural/
stratigraphic confinementCoracle_012_20 St Fergus 0 0 0 0 Progress to WP4
218.001 Site 24 97.0 630000.0 4.6 8.0 167.1 5746.0 Oil & Gas 3. Lower Cretaceous Wick Sandstone Fm Structural/Stratigraphic Trap Captain Oil Field St Fergus 1 0 0 0 Progress to WP4
139.020 Site 26 84.0 22673.0 0.0 6.0 278.0 2127.0 Saline Aquifer 6. Triassic Bunter Sandstone Fm Structural/Stratigraphic Trap Bunter Closure 40 Barmston 0 0 0 1 Progress to WP4
141.035 Site 5 271.0 8350.0 0.4 11.0 423.5 2711.0 Gas 7. Permian Leman Sandstone Fm Structural/Stratigraphic Trap Viking gas fields Barmston 0 1 1 0 Progress to WP4
141.002 Site 20 120.0 11430.0 0.6 9.0 359.4 4019.0 Gas 7. Permian Leman Sandstone Fm Structural/Stratigraphic Trap Barque gas field Barmston 1 1 1 0 Progress to WP4
252.001 Site 28 76.0 723900.0 18.4 8.0 443.1 4139.6 Oil & Gas 1. Paleogene Balder Fm Structural/Stratigraphic Trap Harding Central oil field St Fergus 1 0 1 1 Progress to WP4
248.007 Site 29 72.0 1286651.3 3.5 12.0 163.9 3982.0 Oil & Gas 6. Triassic Ormskirk Sandstone FmStructural/Stratigraphic Trap Lennox oil & gas field Connah's Quay 1 0 0 0 Reserve List
220.001 Site 16 130.0 4572.0 1.4 10.0 548.2 10016.1 Gas Condensate 3. Lower Cretaceous Britannia Sandstone Fm Structural/Stratigraphic Trap Britannia Condensate Field St Fergus 0 0 0 0 Reserve List
252.000 Site 30 64.0 424080.0 0.2 11.0 432.0 6947.1 Saline Aquifer 1. Paleogene Balder Fm Fully Confined (closed box) Balder Sandstone Member 1 St Fergus 0 0 0 0 Reserve List
244.000 Site 21 114.0 46288.0 0.1 12.0 555.4 3379.0 Saline Aquifer 1. Paleogene Sele Fm Fully Confined (closed box) Teal Sandstone Member St Fergus 0 1 1 1 Reserve List
241.000 Site 23 99.0 64860.0 0.2 12.0 412.1 1889.5 Saline Aquifer 1. Paleogene Sele Fm Fully Confined (closed box) Flugga Sandstone Member St Fergus 0 1 1 1 Reserve List
139.015 Bmk 5/42 554.0 98052.0 0.0 6.0 210.4 1057.0 Saline Aquifer 6. Triassic Bunter Sandstone Fm Structural/Stratigraphic Trap Bunter Closure 35 (5/42) Barmston 1 1 1 1 BENCHMARK ONLY
232.000 Site 15 137.0 177000.0 0.1 10.0 562.8 421.0 Saline Aquifer 1. Paleogene Horda Fm Fully Confined (closed box) Frigg Sandstone Member St Fergus 1 1 1 1 Hold
129.004 Site 17 128.0 10500.0 2.3 8.0 576.0 1495.5 Gas Condensate 4. Mid/Upper Jurassic Brae Fm Structural/Stratigraphic Trap Brae North Condensate Field St Fergus 1 1 1 1 Hold
129.003 Site 18 122.0 178560.0 2.1 8.0 625.7 1825.5 Gas Condensate 4. Mid/Upper Jurassic Brae Fm Structural/Stratigraphic Trap Brae East Condensate Field St Fergus 1 1 1 1 Hold
166.002 Site 22 104.0 81600.0 1.0 8.0 751.3 1947.0 Oil & Gas 4. Mid/Upper Jurassic Tarbert Fm Structural/Stratigraphic Trap Alwyn North Oil Field St Fergus 1 1 1 1 Hold
141.058 Site 25 85.0 5720.0 0.4 8.0 432.7 5102.0 Gas 7. Permian Leman Sandstone Fm Structural/Stratigraphic Trap Victor gas field Barmston 1 1 1 1 Hold
226.007 Site 31 63.0 19068.0 0.3 11.0 271.3 2978.0 Saline Aquifer 6. Triassic Bunter Sandstone Fm Structural/Stratigraphic Trap Bunter Closure 24 Barmston 1 1 1 1 Hold
141.038 Site 32 62.0 24888.4 0.3 12.0 410.9 3928.0 Gas 7. Permian Leman Sandstone Fm Structural/Stratigraphic Trap Audrey gas field Barmston 1 1 1 1 Hold
365.001 Site 33 60.0 27800.0 7.3 6.0 435.8 3285.5 Oil & Gas 1. Paleogene Lista Fm Structural/Stratigraphic Trap Andrew oil field St Fergus 1 1 1 1 Hold
226.002 Site 34 56.0 35476.0 0.5 9.0 317.5 4179.0 Saline Aquifer 6. Triassic Bunter Sandstone Fm Structural/Stratigraphic Trap Bunter Closure 18 Medway 1 1 1 1 Hold
82.002 Site 35 53.0 182500.0 4.5 8.0 578.7 7543.0 Oil & Gas 4. Mid/Upper Jurassic Fulmar Fm Structural/Stratigraphic Trap Fulmar Oil Field St Fergus 1 1 1 1 Hold
141.003 Site 36 50.0 2743.0 0.4 6.0 315.7 1420.0 Gas 7. Permian Leman Sandstone Fm Structural/Stratigraphic Trap Amethyst East gas field Barmston 1 1 1 1 Hold
252.002 Site 37 50.0 228600.0 3.1 6.0 442.4 4165.6 Oil & Gas 1. Paleogene Balder Fm Structural/Stratigraphic Trap Harding South oil field St Fergus 1 1 1 1 Hold
218.002 Bmk - Goldeneye 37.0 79000.0 0.6 8.0 331.4 6113.0 Gas Condensate 3. Lower Cretaceous Wick Sandstone Fm Structural/Stratigraphic Trap Goldeneye Gas Condensate Field St Fergus 1 1 1 1 BENCHMARK ONLY
1. Paleogene 5 Saline Aquifer 10 14 Medway 0
3. Lower Cretaceous 3 Gas 7 0 Barmston 8
6. Triassic 9 Oil & Gas 2 4 St Fergus 9
7. Permian 2 Gas Condensate 1 2 Connah's Quay 3
Redcar 0
Focu
s o
f W
P3
Dec
isio
n
Open, with identified structural/ stratigraphic confinement
Top 20 sites by Geological Age Top 20 sites by Storage Type
Strategic United Kingdom CCS Storage Appraisal Project - WP3 Downselect Recommendation 8th July 2015
Top 20 sites by Beachhead
Structural/Stratigraphic Trap
Fully Confined (closed box)
Open, no identified structural/ stratigraphic confinement
Top 20 sites by Unit Designation
D04: Initial Screening & Down-Select 7.0 Conclusions
Pale Blue Dot Energy | Axis Well Technology Page 55 of 74
7.0 Conclusions
1. CO2Stored is an excellent basis for this study and represents a single
consistent source of site storage attributes, albeit with challenging
uncertainty issues. This project could not progress in the time and
scope in the absence of the CO2Stored database.
2. The methodology outlined in WP1 has been successfully deployed with
only minor refinements to achieve the WP3 objective.
3. The recommended Top 20 sites for progression to work package 4
(“Twenty to Five”) represent a broad portfolio covering a strong
diversity of unit type, store type and geography (beachhead); this is
illustrated in Table 18 to Table 22.
4. The selection and screening process used here is fully compliant with
DNV (Det Norsk Veritas, 2012) and IEAGHG (IEA Greenhouse Gas
R&D Programme, 2009) recommended best practice.
5. The many to twenty down-select was based substantially upon the data
in CO2Stored, augmented by information from Wood Mackenzie
regarding estimated Cessation of Production for oil and gas fields and
general publications such as the Millennium Volume (Gluyas &
Hitchens, 2003). CO2Nomica (The ETI’s storage costing tool) was not
used at this stage of the project.
6. A large number of small hydrocarbon fields were missing from
CO2Stored. Five additional sites were added to the Initial Inventory,
but all were subsequently screened out on the basis of capacity.
7. The methodology has navigated issues of data uncertainty to minimise
the risk of site exclusion because of data uncertainty.
8. Both the threshold for Theoretical Capacity and permeability were
maintained at low levels to accommodate data uncertainty in these key
factors.
9. The Identification of the sites was hidden from stakeholders until the
end of the project to try to minimise any bias.
10. The 50MT capacity and 50mD permeability threshold were the most
impactful criteria in the qualification process. 387 sites failing the
capacity test and 188 sites failing the permeability test. Both are
indicative of cost rather than security.
11. Neither Goldeneye nor 5/42 reached the Qualified Inventory.
Goldeneye was smaller than the threshold and 5/42 lacked the
required data availability test (the project did not have access to 3D
seismic over most of the structure). Furthermore both sites fail on the
availability criterion because they either are or expect to be licensed to
Phase1 participants.
12. After careful consideration, it was concluded that updating the
CO2Stored capacities for hydrocarbon field production between 2010
and 2015 could not be justified as only the very largest fields had
enough capacity to meet the project qualification criteria, and many of
these either had produced very little in the period or were younger
fields and were unavailable until after 2030.
13. The Project Requirements qualification had the overall effect of
removing 68% of the Initial Inventory eliminating a large number of
sites with low individual capacities. Some of these sites, such as
D04: Initial Screening & Down-Select 7.0 Conclusions
Pale Blue Dot Energy | Axis Well Technology Page 56 of 74
Goldeneye are excellent storage locations for small volumes, but they
do not meet the requirements of this project.
Site numbers reduced from 579 to 186; total theoretical capacity
reduced from 78,142MT to 77,051MT.
Removed 68% of Initial Inventory sites.
Removed1.4% of Initial Inventory capacity.
Removed Sites had an average theoretical P50 capacity of
3MT.
14. The IEAGHG Qualification step resulted in the removal of a large
number of potential sites which did not meet the minimum cautionary
key attribute metrics for a potential CO2 storage site. Some of these
sites carried large to very large capacities, but failed other key tests.
Site numbers reduced from 186 to 37; total theoretical capacity
reduced from 77,051MT to 8,295MT.
Removed 80% of project qualified sites.
Removed89% of project qualified capacity.
Removed Sites had an average theoretical P50 capacity of 461
MT.
Some of these tests are temporal or use indicative criteria, and so
deselection now does not necessarily mean deselection in the future.
In any case, 8MT exceeds the UKs likely needs for many decades.
15. IEAGHG cautionary screening thresholds alone removed 396 (68%)
sites from the Initial Inventory and 87% of the P50 Theoretical capacity
within the Initial Inventory. Some of these effects cost rather than
security.
16. The TOPSIS method worked well in handling the multiple criteria for
ranking. Meeting the independence requirements for the criteria was
achievable with care, although the method was impacted by very high
or very low value outliers.
17. The weighting of the criteria was important to create a balanced
ranking.
18. The Stakeholder group expressed a preference for the “Simple View”
ranking which focussed upon Capacity and Development Cost Factor
(including Upside Potential).
19. Ranking sensitivities agreed on whether to maintain or drop sites
across 76% of the Qualified Inventory (28 out of 37).
20. If 5/42 and Goldeneye had been qualified then 5/42 would have ranked
around 5th out of 37 and Goldeneye would have ranked around 27th out
of 37 (because of its small capacity).
21. There is a 50:50 balance of saline aquifers and depleted hydrocarbon
fields in the recommended Select Inventory of twenty sites.
22. 70% of the recommended Select Inventory are structural traps.
23. Neither of Redcar or Medway are the closest landfall to any of the sites
in the recommended Select Inventory, but both Redcar and Medway
are serviced by the Select Inventory.

D04: Initial Screening & Down-Select 8.0 Recommendations
Pale Blue Dot Energy | Axis Well Technology Page 57 of 74
8.0 Recommendations
The following twenty sites are recommended for progression to WP4 and for further consideration:-
CO2stored
Code
Site Number
Capacity MT
Injectivity mDm
En
gin
eeri
ng
Co
nta
inm
ent
Ris
k p
er s
q k
m
Geo
C
on
tain
men
t
Ris
k
Dev
elo
pm
ent
Co
st F
acto
r $M
Proximal Upside Potential MT
Unit Designation
Geological Age Geological Formation Storage Type Site Description Nearest Beachhead
226.011 Site 1 1691 33380 0.6 9 292 3898 Saline Aquifer 6. Triassic Bunter Sandstone Fm Structural/Stratigraphic Trap
Bunter Closure 9 Barmston
372.000 Site 2 1388 19012 0.1 16 396 2534 Saline Aquifer 1. Paleogene Sele Fm Open, with identified structural/ stratigraphic confinement
Forties 5 St Fergus
248.005 Site 3 776 90753 0.4 10 167 4429 Gas 6. Triassic Ormskirk Sandstone Fm Structural/Stratigraphic Trap
South Morecambe gas field
Connah's Quay
227.007 Site 4 409 23926 0.2 9 314 4287 Saline Aquifer 6. Triassic Bunter Sandstone Fm Structural/Stratigraphic Trap
Bunter Closure 3 Barmston
266.001 Site 6 243 20500 0.3 11 299 3812 Gas 6. Triassic Bunter Shale Fm Structural/Stratigraphic Trap
Hewett gas field Barmston
139.016 Site 7 232 11052 0.2 6 302 1179 Saline Aquifer 6. Triassic Bunter Sandstone Fm Structural/Stratigraphic Trap
Bunter Closure 36 Barmston
303.001 Site 9 205 82749 0.3 8 277 3856 Gas 6. Triassic Bunter Sandstone Fm Structural/Stratigraphic Trap
Hewett gas field (Bunter)
Barmston
248.004 Site 10 175 109728 0.6 10 194 5958 Gas 6. Triassic Ormskirk Sandstone Fm Structural/Stratigraphic Trap
North Morecambe gas field
Connah's Quay
336.000 Site 11 175 612500 2.0 8 304 9624 Saline Aquifer 1. Paleogene Horda Fm Open, no identified structural/ stratigraphic confinement
Grid Sandstone Member
St Fergus
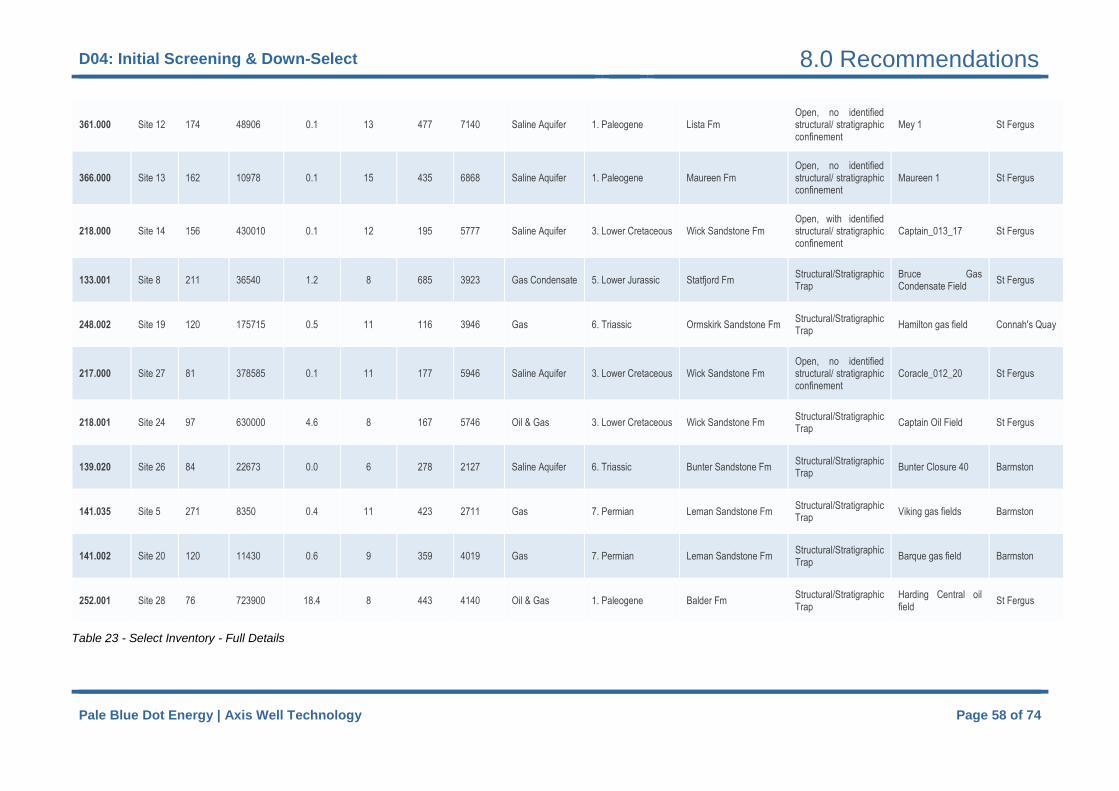
D04: Initial Screening & Down-Select 8.0 Recommendations
Pale Blue Dot Energy | Axis Well Technology Page 58 of 74
361.000 Site 12 174 48906 0.1 13 477 7140 Saline Aquifer 1. Paleogene Lista Fm Open, no identified structural/ stratigraphic confinement
Mey 1 St Fergus
366.000 Site 13 162 10978 0.1 15 435 6868 Saline Aquifer 1. Paleogene Maureen Fm Open, no identified structural/ stratigraphic confinement
Maureen 1 St Fergus
218.000 Site 14 156 430010 0.1 12 195 5777 Saline Aquifer 3. Lower Cretaceous Wick Sandstone Fm Open, with identified structural/ stratigraphic confinement
Captain_013_17 St Fergus
133.001 Site 8 211 36540 1.2 8 685 3923 Gas Condensate 5. Lower Jurassic Statfjord Fm Structural/Stratigraphic Trap
Bruce Gas Condensate Field
St Fergus
248.002 Site 19 120 175715 0.5 11 116 3946 Gas 6. Triassic Ormskirk Sandstone Fm Structural/Stratigraphic Trap
Hamilton gas field Connah's Quay
217.000 Site 27 81 378585 0.1 11 177 5946 Saline Aquifer 3. Lower Cretaceous Wick Sandstone Fm Open, no identified structural/ stratigraphic confinement
Coracle_012_20 St Fergus
218.001 Site 24 97 630000 4.6 8 167 5746 Oil & Gas 3. Lower Cretaceous Wick Sandstone Fm Structural/Stratigraphic Trap
Captain Oil Field St Fergus
139.020 Site 26 84 22673 0.0 6 278 2127 Saline Aquifer 6. Triassic Bunter Sandstone Fm Structural/Stratigraphic Trap
Bunter Closure 40 Barmston
141.035 Site 5 271 8350 0.4 11 423 2711 Gas 7. Permian Leman Sandstone Fm Structural/Stratigraphic Trap
Viking gas fields Barmston
141.002 Site 20 120 11430 0.6 9 359 4019 Gas 7. Permian Leman Sandstone Fm Structural/Stratigraphic Trap
Barque gas field Barmston
252.001 Site 28 76 723900 18.4 8 443 4140 Oil & Gas 1. Paleogene Balder Fm Structural/Stratigraphic Trap
Harding Central oil field
St Fergus
Table 23 - Select Inventory - Full Details

D04: Initial Screening & Down-Select 8.0 Recommendations
Pale Blue Dot Energy | Axis Well Technology Page 59 of 74
The following five sites are recommended as reserve list sites and will only be progressed if due diligence in WP4 fails one of the Select Inventory
Code Site Number
Capacity MT
Injectivity mDm
Eng
inee
ring
Con
tain
men
t R
isk
per
sq k
m
Geo
C
onta
inm
ent
Ris
k
Dev
elop
men
t Cos
t F
acto
r $M
Proximal Upside Potential MT
Unit Designation Geological Age Geological Formation Storage Type Site Description Nearest Beachhead
248.007 Site 29 72 1286651 3.5 12 164 3982 Oil & Gas 6. Triassic Ormskirk Sandstone Fm Structural/Stratigraphic Trap
Lennox oil & gas field Connah's Quay
220.001 Site 16 130 4572 1.4 10 548 10016 Gas Condensate 3. Lower Cretaceous Britannia Sandstone Fm Structural/Stratigraphic Trap
Britannia Condensate Field
St Fergus
252.000 Site 30 64 424080 0.2 11 432 6947 Saline Aquifer 1. Paleogene Balder Fm Fully Confined (closed box)
Balder Sandstone Member 1
St Fergus
244.000 Site 21 114 46288 0.1 12 555 3379 Saline Aquifer 1. Paleogene Sele Fm Fully Confined (closed box)
Teal Sandstone Member
St Fergus
241.000 Site 23 99 64860 0.2 12 412 1890 Saline Aquifer 1. Paleogene Sele Fm Fully Confined (closed box)
Flugga Sandstone Member
St Fergus
Table 24 - Reserve Inventory - Full Details
Key features of the Top Twenty are:
• Significant overall capacity target of 6.8GT.
• Strong balance between saline formations and depleted
hydrocarbon fields.
• Elimination of sites with high risk high confidence containment
issues.
• Strong compliance with IEAGHG screening guidelines.
• Compliance with Project BoD qualifications.
• A strong portfolio with a broad geographic spread:
o SNS, CNS and EIS.
o Proximal sites to 5/42 and 5/42
o .
o Strong technical diversity of sites.
Further recommendations drawn from this work include:-
D04: Initial Screening & Down-Select 8.0 Recommendations
Pale Blue Dot Energy | Axis Well Technology Page 60 of 74
1. The sites that do not meet IEAGHG cautionary thresholds should be
clearly flagged within the CO2Stored database.
2. Careful consideration should be given regarding the merits of further
investment into the CO2Stored database entries that do not meet
IEAGHG cautionary criteria.
3. Any future consideration of the CO2 storage resource potential of the
UKCS should deploy a more rigorous handling of uncertainty to capture
a more realistic range.
4. The staged approach used in the screening process worked well and
allowed effort to be focussed on the sites that had some potential to
meet the project objectives.
5. The TOPSIS ranking methodology was an effective and robust way of
considering multiple attributes to help discriminate between sites. This
was enhanced by considering two additional and simpler ranking
methods. Care should be taken with data sets that contain outlier
values as these tend to reduce the effectiveness of the technique.

D04: Initial Screening & Down-Select 9.0 References
Pale Blue Dot Energy | Axis Well Technology Page 61 of 74
9.0 References
Chadwick, A., Arts, R., Bernstone, C., May, F., Thibeau, S., & Zweigel, P.
(2008). Best Practice for the CO2 Storage in Saline Aquifers -
Observations and Guidelines from the SACS and CO2STORE projects.
Nottingham: British Geological Survey.
DECC - UK Government. (2015, March). UK Detailed Monthly OIl Production.
Retrieved from https://www.og.decc.gov.uk/pprs/full_production.htm
Det Norsk Veritas. (2012). DNV-RP-J203 Geological Storage of Carbon Dioxide.
Det Norsk Veritas. Retrieved from http://www2.dnvgl.com/dnv-rp-j203
Element Energy Ltd. (2012). Economic impacts of CO2-enhanced oil recovery
for Scotland. Scottish Enterprise.
Energy Technologies Institue. (2011). UK Storage Appraisal Project. Energy
Technologies Institute.
Energy Technologies Institute. (2010). CO2Stored. Retrieved from
http://www.co2stored.co.uk/home.php
Energy Technologies Institute. (2015). Carbon capture and storage - Building
the UK carbon capture and storage sector by 2030 - Scenanrios and
actions. Loughborough: Energy Technologies Institute.
Gluyas, J. G., & Hitchens, H. M. (2003). United Kingdom Oil and Gas Fields
Commemorative Millenium Volume. London: Geological Society.
IEA Greenhouse Gas R&D Programme. (2009). CCS SIte Characterisation
Criteria. IEA.
Pale Blue Dot Energy Ltd. (2015). A Blueprint for Industrial CCS in the UK -
Business Case. Retrieved from http://www.teessidecollective.co.uk/wp-
content/uploads/2015/06/Teesside-Collective-Business-Case1.pdf
PGS. (2015). The PGS Mega surveys. Retrieved from
http://www.pgs.com/upload/31007/MegaSurvey%20(1366Kb).pdf
spd. (2012). Aspen Conceptual Well Design Options - SPD-BOD-MP-CODS-
0069. Aberdeen: CO2DeepStore Ltd.
THE EUROPEAN PARLIAMENT AND THE COUNCIL OF THE EUROPEAN
UNION,. (2009). DIRECTIVE 2009/31/EC OF THE EUROPEAN
PARLIAMENT AND OF THE COUNCIL ON THE GEOLOGICAL
STORAGE OF CARBON DIOXIDE. Official Journal of the European
Union, 114-135.
UK Government. (2010). The Storage of Carbon Dioxide 9Licensing etc.)
Regulations 2010. Retrieved from
http://www.legislation.gov.uk/uksi/2010/2221/pdfs/uksi_20102221_en.
Yoon, P. K., & Hwang, C. L. (1995). Mutliple Attribute Decision Making - An
Introduction. Sage Publications Inc.
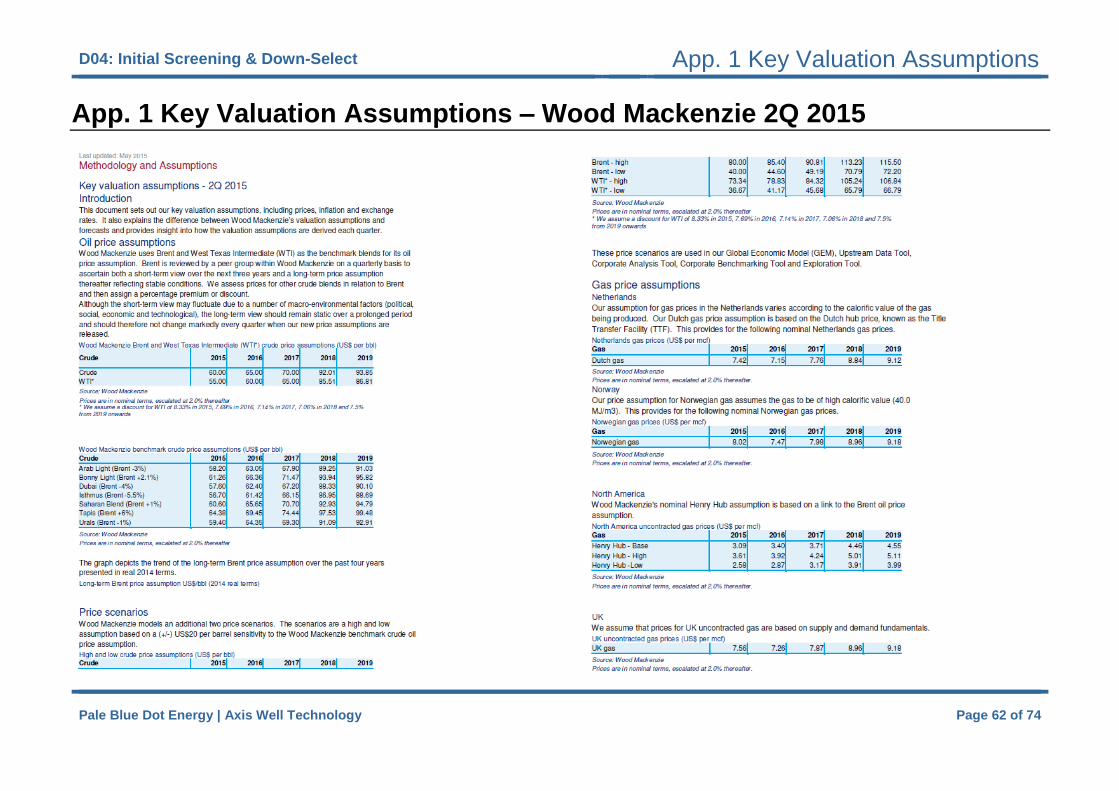
D04: Initial Screening & Down-Select App. 1 Key Valuation Assumptions – Wood Mackenzie 2Q 2015
Pale Blue Dot Energy | Axis Well Technology Page 62 of 74
App. 1 Key Valuation Assumptions – Wood Mackenzie 2Q 2015

D04: Initial Screening & Down-Select App. 1 Key Valuation Assumptions – Wood Mackenzie 2Q 2015
Pale Blue Dot Energy | Axis Well Technology Page 63 of 74

D04: Initial Screening & Down-Select App. 2 Stakeholder Meeting Report – 2nd July 2015
Pale Blue Dot Energy | Axis Well Technology Page 64 of 74
App. 2 Stakeholder Meeting Report – 2nd July 2015
A Stakeholder workshop (02) was held on 2nd July in London and hosted by
Pinsent Masons. The objectives of this workshop were:-
To keep CO2 Storage stakeholders appraised of project progress and
enrol interest from the CCS stakeholder community
Stimulate debate around the selected top twenty candidate sites &
gather input to the process.
The materials assembled here represent a workshop report and were “work in
progress” as of 2nd July.
Participants
Jeb Tyrie APEC Ltd Ken Johnson Axis Well Technology Stephen Cawley BP Don Reid Capture Power Brian Allison DECC Graham Dawe DNV GL Den Gammer ETI Andrew Green ETI Benjamin Court GCCSI Bill Senior Ind Nick Reeves National Grid Eva Halland NPD David Hartney OGA Frances Harding Pale Blue Dot Energy Alan James Pale Blue Dot Energy Steve Murphy Pale Blue Dot Energy Chris McGarvey Pinsent Masons
Agenda
09:30 Welcome & Safety Briefing SJM 09:35 Purpose of Workshop SJM 09:40 Strategic UK CCS Storage Appraisal Project SJM 09:55 Screening & Selection ATJ 10:15 Results ATJ 10:45 Break All 11:00 Workshop Session All 12:00 Feedback 12:20 Next Steps SJM 12:30 Close SJM
D04: Initial Screening & Down-Select App. 2 Stakeholder Meeting Report – 2nd July 2015
Pale Blue Dot Energy | Axis Well Technology Page 65 of 74
Output
The following comments arose after group review and discussion of the process
adopted for down-select and also the preliminary results of the work:-
Group A
1. Suggestion to be clear that the “Development Cost Factor” is not a true
cost but a high level proxy for cost at this point. Perhaps consider
finding an alternative label for this.
2. Suggest swap sites 30 and 28 – although that would lose the only “fully
confined box” in the top 20
3. Concern that the Upside potential has played too much of a role in the
selection. Suggest testing selection without the inclusion of the upside
potential
4. Also suggested another sensitivity just using the “Qualified Inventory” in
the Upside potential (ie exclude all capacity from outside the “Qualified
Inventory”
5. The group has some concerns about site 16 and suggested perhaps
promoting site 8 in its place.
Group B
1. Agree with the broad focus on the “Simple View”.
2. From a portfolio perspective it is good to see East Irish Sea sites in
the Top 20, but suggest reducing this to keep storage site
distribution proportionate with thee regional emissions picture.
3. Notes that two of the Top 20 sites are representing the Hewett field
and suggest that these could be amalgamated to simplify things
4. Suggest that the ranked sites would benefit from adding some well-
known benchmarks including 5/42 and Goldeneye
5. Happy with the diversity of store types – note that there are a
number of open aquifers without structural confinement and
suggest careful treatment of these going forwards.
6. Suggest swap sites 28 and 33
7. Suggest start to look for hybrid sites where confidence from a
depleted hydrocarbon field might be coupled with the capacity
afforded by a saline aquifer build out. Noted that this effect is
reflected in the Upside potential available within a 20km radius of a
site.
8. Note that there is a good diversity of geological ages of potentials
storage sites, but that the Jurassic is missing from the Top 20.
9. Important to look at the build out scenarios in WP4 and how sites
might be connected together.

D04: Initial Screening & Down-Select App. 2 Stakeholder Meeting Report – 2nd July 2015
Pale Blue Dot Energy | Axis Well Technology Page 66 of 74

D04: Initial Screening & Down-Select App. 2 Stakeholder Meeting Report – 2nd July 2015
Pale Blue Dot Energy | Axis Well Technology Page 67 of 74
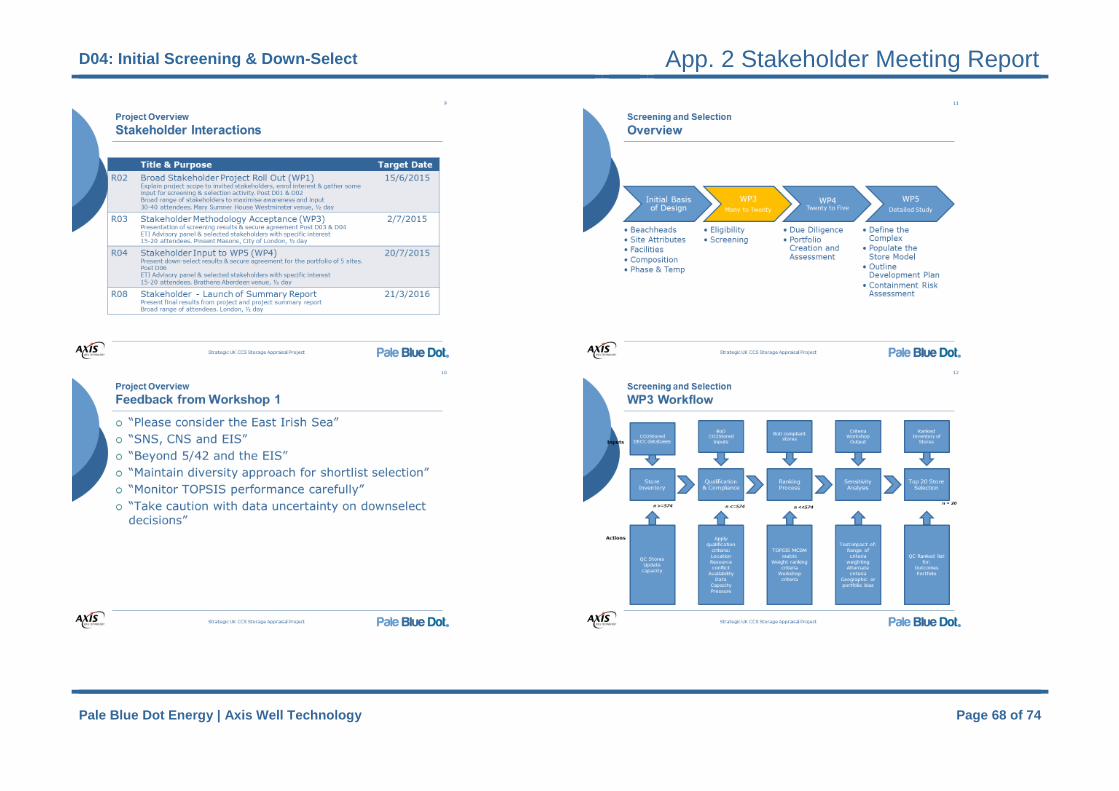
D04: Initial Screening & Down-Select App. 2 Stakeholder Meeting Report – 2nd July 2015
Pale Blue Dot Energy | Axis Well Technology Page 68 of 74

D04: Initial Screening & Down-Select App. 2 Stakeholder Meeting Report – 2nd July 2015
Pale Blue Dot Energy | Axis Well Technology Page 69 of 74
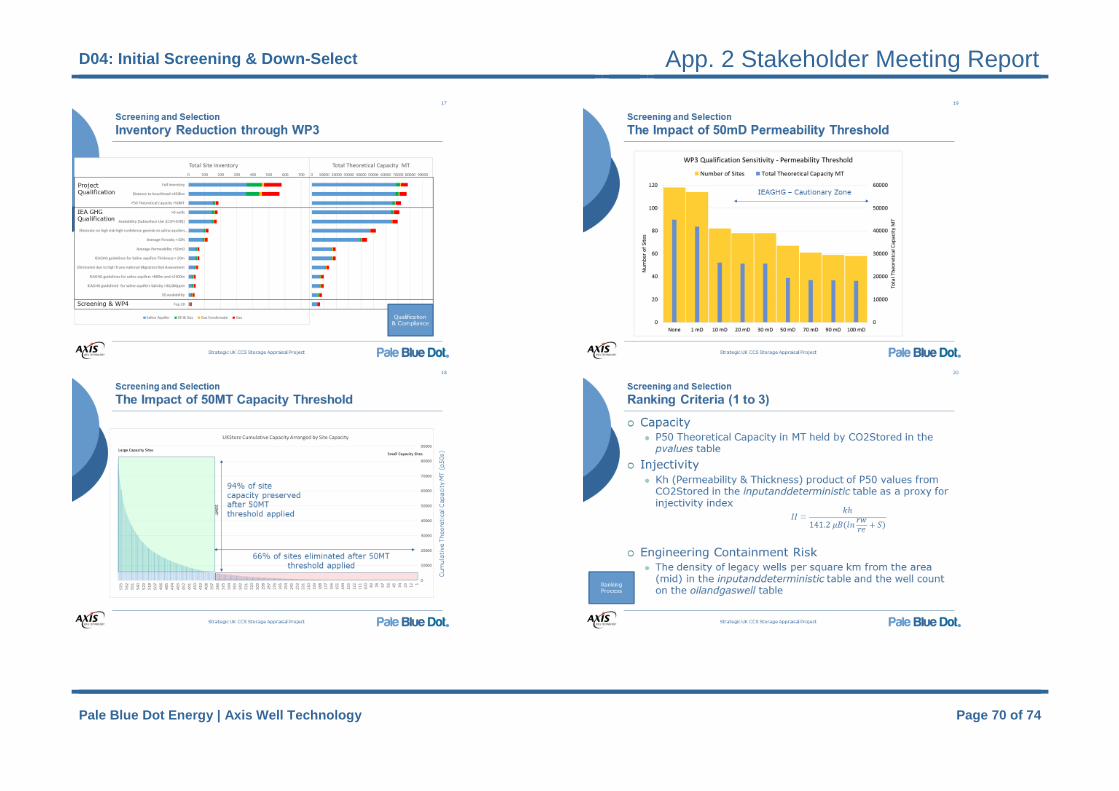
D04: Initial Screening & Down-Select App. 2 Stakeholder Meeting Report – 2nd July 2015
Pale Blue Dot Energy | Axis Well Technology Page 70 of 74

D04: Initial Screening & Down-Select App. 2 Stakeholder Meeting Report – 2nd July 2015
Pale Blue Dot Energy | Axis Well Technology Page 71 of 74
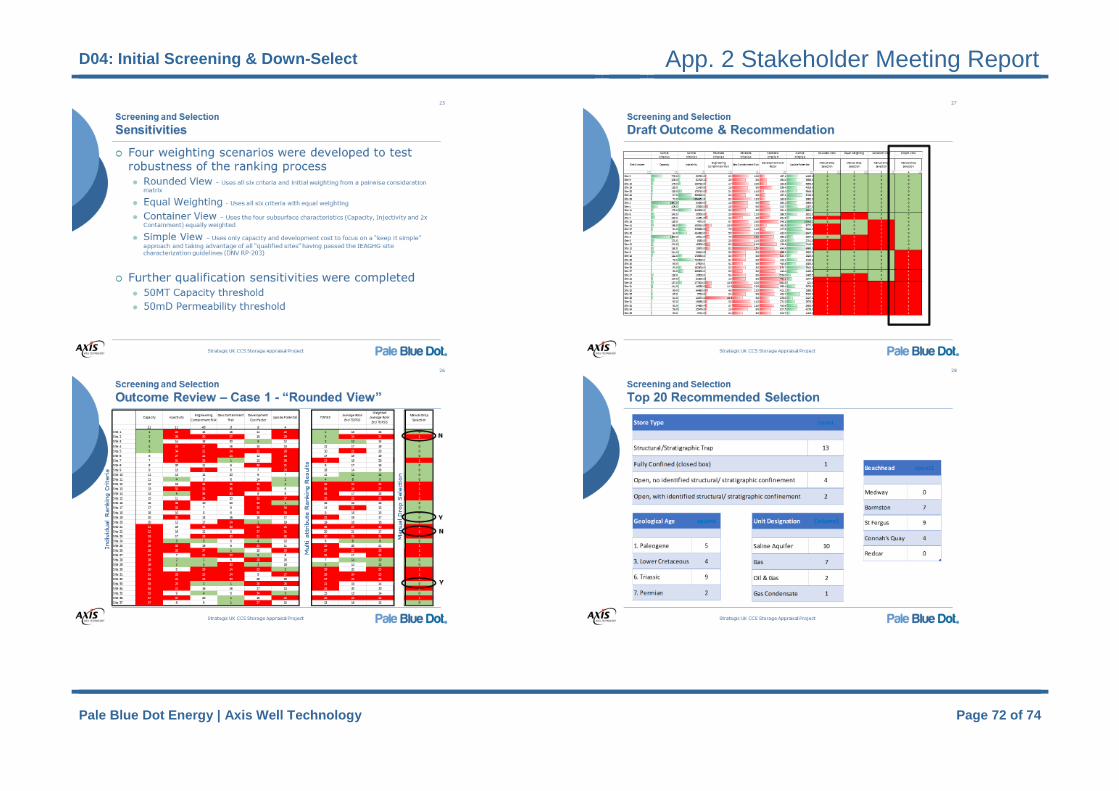
D04: Initial Screening & Down-Select App. 2 Stakeholder Meeting Report – 2nd July 2015
Pale Blue Dot Energy | Axis Well Technology Page 72 of 74

D04: Initial Screening & Down-Select App. 2 Stakeholder Meeting Report – 2nd July 2015
Pale Blue Dot Energy | Axis Well Technology Page 73 of 74
D04: Initial Screening & Down-Select App. 2 Stakeholder Meeting Report – 2nd July 2015
Pale Blue Dot Energy | Axis Well Technology Page 74 of 74