Strategic supply chain management
338
-
Upload
cakrawala-peternakan -
Category
Science
-
view
293 -
download
3
Transcript of Strategic supply chain management


Want to learn more?We hope you enjoy this McGraw-Hill eBook! If
you’d like more information about this book, its author, or related books and websites, please click here.

Critical Acclaim for Strategic Supply Chain Management
Cohen and Roussel effectively capture and communicate the critical elements androadmap of world-class supply chain management. Put into practice, this bookwill serve as a timeless tool for those looking to transform their organization’ssupply chain into a sustainable competitive advantage.
Jim MillerVice President, Operations, Cisco Systems
The five core principles behind this book are deceptively simple. Yet few supplychain practitioners have the authors’ depth and breadth of experience. Cohen andRoussel take the topic far beyond the theoretical, offering numerous examples ofhow companies have adopted and adapted these principles. Senior executives canuse this book to structure a supply chain strategy that will result in immediate top- and bottom-line benefits.
Geoffrey MooreAuthor, Crossing the Chasm, Inside the Tornado, Living on the Fault Line
Cohen and Roussel successfully balance the “why” with the “what” of supplychain management. This practical book assembles the components of an effectivesupply chain in a clear, well-supported way. Those who want to drive supplychain success would be well-served in reading this book and learning from itsmany examples.
Dick HunterVice President, Dell Americas Operations, Dell, Inc.
It is rare to find a book that covers both the supply chain principles and theorganizational and practical aspects so well. Cohen and Roussel have givenmanagement and practitioners a most insightful treatment of the secrets to supply chain success.
Hau LeeThoma Professor of Operations, Information, and Technology,
Graduate School of Business, Stanford University
The authors successfully describe the many complex trade-offs that companiesmust consider in developing a winning supply chain strategy. Consequently,their book is as relevant and useful to the company CEO and CFO as it is to theCOO, who should use it as the “how-to” guide to develop an operations strategyfor the corporation.
Gary McIlraith Supply Chain Director, British Sky Broadcasting Ltd

Cohen and Roussel provide a valuable overview for any CEO who intends tomake supply chain management a competitive advantage. Whether you’re theCEO of an established global company or the founder of a start-up, StrategicSupply Chain Management can provide you with the guiding principles and aroadmap to get your company moving in the right direction.
Guerrino De LucaPresident and CEO, Logitech International
The authors have captured the essential elements of how a company can drivesuperior performance by positioning supply chain management as a core man-agement discipline. The book creates a template for how you can align an orga-nization to transfer a winning strategy into meaningful results.
Bill CantwellVice President, Supply Chain, Air Products and Chemicals, Inc.
Cohen and Roussel take a rich set of strategies and explain them in a way that arelative newcomer could understand, yet retain the necessary depth to benefit sea-soned professionals. Throughout this book, the authors provide powerful methodsfor organizing and implementing supply chain improvements. Their linkage ofthese strategies back to elements of the Supply-Chain Council’s SCOR modelprovides the practitioner with a thorough approach to drive tangible results. Thereal-life examples are invaluable.
Steven G. MillerChairman, Supply-Chain Council
The supply chain presents a significant opportunity for cost reduction and cus-tomer value creation. This is the underpinning theme of this easy-to-read andpractical book. Cohen and Roussel have skillfully drawn from their extensiveexperience working with organizations in diverse industries to synthesize bestpractices in supply chain management. Of the many books that discuss supplychain management, this is one of the better ones.
Martin ChristopherProfessor, Cranfield University, United Kingdom
Finally, a practical guide that links the latest in supply chain management think-ing with relevant examples of how successful practitioners apply these principlesin the real world. A must read for all supply chain professionals attempting to taketheir supply chain performance to the next level.
David J. McGregorSenior Vice President, NAFTA Logistics, BASF Corporation
Cohen and Roussel provide a disciplined, practical, and insightful approach toachieving a world-class supply chain structure. Their book’s concepts are rele-vant to the many challenges corporations face today, and consistent with ourexperiences at HP. This book is transformational, and should help any supplychain professional achieve excellence.
Dick ConradSenior Vice President, Global Operations, Supply Chain, HP

STRATEGIC SUPPLY CHAIN MANAGEMENTThe Five Disciplines for Top Performance
SHOSHANAH COHEN
JOSEPH ROUSSEL
McGraw-HillNew York Chicago San Francisco Lisbon London MadridMexico City Milan New Delhi San Juan SeoulSingapore Sydney Toronto
Copyright © 2005 by The McGraw-Hill Companies, Inc. All rights reserved.Manufactured in the United States of America. Except as permitted under the UnitedStates Copyright Act of 1976, no part of this publication may be reproduced or distributedin any form or by any means, or stored in a database or retrieval system, without the priorwritten permission of the publisher.
0-07-145449-7
The material in this eBook also appears in the print version of this title: 0-07-143217-5.
All trademarks are trademarks of their respective owners. Rather than put a trademarksymbol after every occurrence of a trademarked name, we use names in an editorial fash-ion only, and to the benefit of the trademark owner, with no intention of infringement ofthe trademark. Where such designations appear in this book, they have been printed withinitial caps.
McGraw-Hill eBooks are available at special quantity discounts to use as premiums andsales promotions, or for use in corporate training programs. For more information, pleasecontact George Hoare, Special Sales, at [email protected] or (212) 904-4069.
TERMS OF USE
This is a copyrighted work and The McGraw-Hill Companies, Inc. (“McGraw-Hill”) andits licensors reserve all rights in and to the work. Use of this work is subject to these terms.Except as permitted under the Copyright Act of 1976 and the right to store and retrieve onecopy of the work, you may not decompile, disassemble, reverse engineer, reproduce, mod-ify, create derivative works based upon, transmit, distribute, disseminate, sell, publish orsublicense the work or any part of it without McGraw-Hill’s prior consent. You may usethe work for your own noncommercial and personal use; any other use of the work isstrictly prohibited. Your right to use the work may be terminated if you fail to comply withthese terms.
THE WORK IS PROVIDED “AS IS.” McGRAW-HILL AND ITS LICENSORS MAKENO GUARANTEES OR WARRANTIES AS TO THE ACCURACY, ADEQUACY ORCOMPLETENESS OF OR RESULTS TO BE OBTAINED FROM USING THE WORK,INCLUDING ANY INFORMATION THAT CAN BE ACCESSED THROUGH THEWORK VIA HYPERLINK OR OTHERWISE, AND EXPRESSLY DISCLAIM ANYWARRANTY, EXPRESS OR IMPLIED, INCLUDING BUT NOT LIMITED TOIMPLIED WARRANTIES OF MERCHANTABILITY OR FITNESS FOR A PARTICU-LAR PURPOSE. McGraw-Hill and its licensors do not warrant or guarantee that the func-tions contained in the work will meet your requirements or that its operation will beuninterrupted or error free. Neither McGraw-Hill nor its licensors shall be liable to you oranyone else for any inaccuracy, error or omission, regardless of cause, in the work or forany damages resulting therefrom. McGraw-Hill has no responsibility for the content of anyinformation accessed through the work. Under no circumstances shall McGraw-Hilland/or its licensors be liable for any indirect, incidental, special, punitive, consequential orsimilar damages that result from the use of or inability to use the work, even if any of themhas been advised of the possibility of such damages. This limitation of liability shall applyto any claim or cause whatsoever whether such claim or cause arises in contract, tort orotherwise.
DOI: 10.1036/0071454497

We dedicate this book to our families: to husbandCollin and children Meredith and Riley for
Shoshanah Cohen and to wife Jana and childrenRobert and Claire for Joseph Roussel. Thank you foryour loving support over the months of labor during
2003. We couldn’t have dedicated the time and energyto writing this book without your understanding and
teamwork on the home front.

This page intentionally left blank.

C O N T E N T S
Foreword by Gordon Stewart and Mike Aghajanian ixAcknowledgments xvii
ELI LILLY PROFILE: Supporting Product Lifecycles with Supply ChainManagement 1
Chapter 1
Core Discipline 1: View Your Supply Chain as a Strategic Asset 9
Five Key Configuration Components 10
Four Criteria of a Good Supply Chain Strategy 20
Next-Generation Strategy 36
AUTOLIV PROFILE: Applying Rocket Science to the Supply Chain 39
Chapter 2
Core Discipline 2: Develop an End-to-End Process Architecture 49
Four Tests of Supply Chain Architecture 50
Architectural Toolkits 66
Top Three Levels of the SCOR Model 70
Five Processes for End-to-End Supply Chain Management 78
Next-Generation Processes 88
AVON PROFILE: Calling on Customers Cost-Effectively 91
Chapter 3
Core Discipline 3: Design Your Organization for Performance 101
Organizational Change Is an Ongoing Process 102
Evolution of the Supply Chain Organization 108
Guiding Principles for Organizational Design 111
Gaining Respect for the Supply Chain Discipline 122
Next-Generation Organizational Design 128
vii
For more information about this title, click here.

OWENS CORNING PROFILE: Reorganizing for “a Bright Future” 131
Chapter 4
Core Discipline 4: Build the Right Collaborative Model 139
Collaboration Is a Spectrum 143
Finding the Right Place on the Spectrum 147
The Path to Successful Collaboration 148
Next-Generation Collaboration 164
U.S. DEPARTMENT OF DEFENSE PROFILE: Making the Tail Smaller andthe Tooth Stronger 169
Chapter 5
Core Discipline 5: Use Metrics to Drive Business Success 185
Why Measure? 186
Managing Performance with Metrics 188
Which Metrics? 205
Case in Point: Performance Management at 3Com 210
Next-Generation Performance Management 213
GENERAL MOTORS PROFILE: Driving Customer Satisfaction 217
Chapter 6
A Roadmap to Change 229
Advanced Systems Aren’t Enough 230
Characteristics of the Next Generation 232
Developing a Roadmap 236
SEAGATE TECHNOLOGY PROFILE: Real-Time Response to Demand 249
Appendix A: Source and Methodology for Benchmarking Data 259Appendix B: The Supply Chain Maturity Model 273Appendix C: Comparison of Characteristics for Levels 2 and Level 3 SCOR Metrics 279Notes 301Index 307
viii CONTENTS

F O R E W O R D
In many ways this book is overdue. It is the book that we at PRTM wantedto write almost a decade ago, and yet at that time we merely would havebeen speculating about the future development of supply chain managementas a core management discipline. For instance, we very likely would haveunderestimated the impact of information technology and ignored someemerging best practices. This book is the result of a 15-year history ofresearch, benchmarking, and client results in this discipline at PRTM and anequivalent level of experience by the authors, PRTM partners ShoshanahCohen (Mountain View, California) and Joseph Roussel (Paris, France).
In this book we set out to offer readers our understanding of the cur-rent state of supply chain management theory and practice based on ourexperience and observations from engagements on supply chain projects at over 600 organizations. We also offer profiles of recent transformativesupply chain initiatives at major companies and the U.S. Department ofDefense (the largest supply chain in the world). Finally, we offer our per-spective on future challenges in the development of competitive, customer-facing supply chains.
This book focuses rightly on the present and the future; it is here inthe Foreword that we hope to provide some historic perspective on howsupply chain management came to be the dominating management disci-pline of the late 1990s and how it has become the root of huge invest-ments in enterprise resource planning (ERP) and advanced planning andscheduling (APS) systems implementations in almost every major globalcorporation.
We can trace the origins of good supply chain management disciplineto the late 1800s. The following extract dates from Bremner’s Industries ofScotland (1869):
Gartsherrie Ironworks are the largest in Scotland. . . . More than 1,000tonnes of coal are consumed every 24 hours; and, as showing how well-chosen is the site of the works, it may be mentioned that 19/20ths of thecoal required is obtained within a distance of half-a-mile from the fur-naces. One coal-pit is situated close to the furnaces. . . . The coal from thispit is conveyed to the furnaces by means of a self-acting incline. Most ofthe ironstone was at one time obtained from pits in the neighborhood, but
ix
Copyright © 2005 by The McGraw-Hill Companies, Inc. Click here for terms of use.

now it has to be brought from a distance of two to twenty miles; and acomplete system of railways connects the pits with the works. . . .
The establishment is also connected with the great railway systems ofthe country, and possess additional facilities for transport in a branch of theMonklands Canal, which has been carried through the centre of the works.. . . A great proportion of the manufactured iron is sent out by the canal.
The furnaces, sixteen in number, stand in two rows, one on each side ofthe canal. . . . A constant supply of coal and ironstone can be reckonedupon, and therefore only a small stock is kept at the works. The mineraltrains are worked with unfailing regularity, and their cargoes are depositedconveniently for immediate use.
From this description of an integrated supply chain infrastructure inVictorian Scotland we learn that integrated inbound and outbound logis-tics, efficient inventory management, and delivery to point of use are sup-ply chain disciplines that are more than 150 years old. For most readers,Ford Motor Company is a better-known example of the historical devel-opment of efficient supply chain and manufacturing practices. The historyof Henry Ford’s manufacturing innovation is widely known, as are theproductivity gains achieved on the Model T assembly line, but what maybe less well understood is how the supply chain that supported Model Tproduction was developed.
Ford’s “division of labor” approach to Model T production createdthe need for both industrial engineers and material planners to ensurethat the right material was delivered to the manufacturing line in the rightquantities at the right time. The efficiencies gained by the division oflabor in mass production were enabled by the creation of a new manage-ment discipline: the discipline of procuring and delivering parts directlyto the assembly line.
As Womack, Jones, and Ross explain in their 1991 book, TheMachine That Changed the World:
Henry Ford was still very much an assembler when he opened HighlandPark. He bought his engines and chassis from the Dodge Brothers, thenadded a host of items from a host of other firms to make a complete vehicle.By 1915 Ford had taken all these functions in house and was well on the wayto achieving vertical integration. . . . Ford wanted to produce the entire carin one place and sell it to the world. But the shipping systems of the daywere unable to transport high volumes of finished automobiles economicallywithout damaging them. . . . By 1926 Ford automobiles were assembled inmore than 36 cities in the United States and in 19 foreign countries.
The problem of efficiently satisfying global demand for technologi-cally advanced products became a driving force in the story of supply chain
x FOREWORD
management as a core management discipline. During the 50 years of massproduction as the main feature of the industrial landscape (1920–1970), thepursuit of quality and materials and labor efficiency dominated manage-ment thinking.
It was at this stage of development of the global industrial landscapethat PRTM came on the scene in 1976. At our beginnings, we worked pri-marily with the emerging high-technology sector to address its problemsof high-volume production, rapid innovation, and globalization. The chal-lenges faced by our clients forced our consultants to leverage and integratemany of the disciplines of the time in both innovative and practical ways.For example, we realized early on that MRPII, just-in-time (JIT) manu-facturing, kanban, statistical process control, total quality management,and process management all could be brought together intelligently toyield a superior result. In the mid-1980s, under the topic of “operationsstrategy” in a series of executive seminars that PRTM conducted on behalfof the then-fledgling American Electronics Association, we talked about across-functional set of integrated processes that we called supply chainmanagement.
In 1986 we conducted a client-sponsored study of the global manu-facturing strategies of almost 100 major high-tech manufacturers. (Thestudy was refreshed in 1989–1990 and was titled, “The Emergence of theGlobally Integrated Corporation.”) It concluded that we were entering anage of global integration between major economic regions and identifiedthe competitive importance of what are now thought of as core supplychain processes.
In 1988 George Stalk, Jr., published a seminal article entitled,“Time—The Next Source of Competitive Advantage,” in Harvard BusinessReview. Stalk’s article added the dimension of time to the other process-management dimensions of cost and quality. And by 1989 the empiricaland conceptual bases for competitive, customer-focused, cross-functionalsupply chain management were in place.
These disparate threads of emerging practice came together in onesignificant client project of PRTM. In 1989–1990, Rick Hoole, a PRTMdirector, began work with Fred Hewitt of Xerox Corporation to examinethe opportunities that might be available to Xerox through globally inte-grated cross-functional process management. The joint PRTM-Xerox pro-ject team concluded that there were four core supply chain processes thatXerox needed to manage—plan, source, make, and deliver. Xerox thenformed a project team to deliver results based on the findings of the studyand realized benefits amounting to 2 percent of revenue over the course ofthe next few years.
FOREWORD xi

Another “early adopter” of supply chain management as a disci-pline was Digital Equipment Corporation (DEC). It contracted withPRTM in 1991 to launch the first of what became a series of “integratedsupply chain performance” benchmarking studies sponsored by IBM,DEC, Xerox, Lotus Development Corporation, and NCR. To ensure thatthis study did not simply become a compendium of functional metrics,PRTM sought to create a new set of truly cross-functional supply chainmetrics. It is remarkable to reflect that it was just 13 years ago that the activity-based definition of total supply chain management cost was first designed and the now-widespread metric of cash-to-cash cycle timewas created.
With a process definition (plan/source/make/deliver) and with per-formance benchmarks available, PRTM was able to introduce a newapproach to managing global operations—an approach that yielded tangi-ble benefits but required much change at companies.
Industry’s early adopters, together with sponsors and participants inthe early benchmarking studies by PRTM, came together with us and threeleading academic institutions (MIT, Stanford University, and PennsylvaniaState University) in June 1994 to form the Supply-Chain Consortium. Itsaim was to promote the success of supply chain integration and imple-mentation efforts across industries. The consortium had four objectives forthe first phase of its work:
◆ To establish a common baseline definition of the supply chain◆ To define a common set of critical supply chain performance
metrics◆ To adopt a framework for consideration, presentation, and appli-
cation of supply chain metrics◆ To promote sharing of supply chain best practices and imple-
mentation approaches
PRTM’s leadership of this body resulted in creation of the metricsthat would define the new Supply-Chain Operations Reference-model(SCOR) developed two years later and now adopted widely by industrythrough the Supply-Chain Council.
While most of this pioneering work was being done in the UnitedStates, January 1992 was the scheduled date for the dismantling of trade barriers (which included product specifications, mobility of labor, and border delays) between member states of the European Economic Com-munity. This dateline encouraged many companies to look at the opportunitiesto create integrated European manufacturing and distribution operations
xii FOREWORD

to replace the country-based strategies that had been the standard operatingmodel since Ford Motor Company established operations in Europe in the1920s. Working with the emerging supply chain management frameworksand metrics, PRTM helped many clients to use the cross-functional plan,source, make, and deliver framework to create a vision of integratedEuropean operations.
One early adopter of the integrated supply chain methodology wasPitney Bowes. At that time, it had a complex manufacturing and cus-tomization operation that not only was costly but also resulted in longorder fulfillment lead times. Integrated ERP systems functionality was notavailable in 1992; in fact, most companies had inherited country-basedmodels that led to islands of information about customer orders and in-country inventory levels. To deliver cross-functional (and cross-entity)integration with a focus on time-based competition, Pitney Bowes devel-oped a “technology” solution for a pilot program for postal frankingmachines destined for the German market. The solution was to install afax machine on the manufacturing floor in England. This enabled country-specific machine variants to be configured to order, which reduced cus-tomer order lead times by weeks and eliminated finished goods inventoryand configuration activity in country warehouses.
In 1994, PRTM also worked with ICL Computers and SiemensNixdorf, Ltd., in the United Kingdom to define future integrated supplychain architectures using the plan, source, make, and deliver processframework. In both these projects we used a top-down process designapproach, applying the four-level process logical data modeling at the coreof the Structured Systems Analysis Design Method (SSADM), an earlyCASE methodology that we applied to integrated process design. Thismodeling approach became part of PRTM’s supply chain project toolkit.
By 1995 it was clear that no standards existed by which our clientscould objectively assess the value of the functionality of the new ERP sys-tems that were emerging. In collaboration with AMR and a representativegroup of companies drawn from our respective client lists, we began todevelop a supply chain process reference model. Many of our clients par-ticipated in giving design input to and reviewing the output of the work-ing parties engaged in development of the model. In Boston, in November1996, the SCOR model was presented to an audience of almost 100 majorcompanies. This meeting resulted in formation of the Supply-ChainCouncil (SCC), formally launched in the spring of 1997 as an indepen-dent, not-for-profit organization. The SCOR model was transferred subse-quently to the SCC, which is charged with supporting its development
FOREWORD xiii
through research, use, and education. The SCC now numbers over 800 cor-porations worldwide.
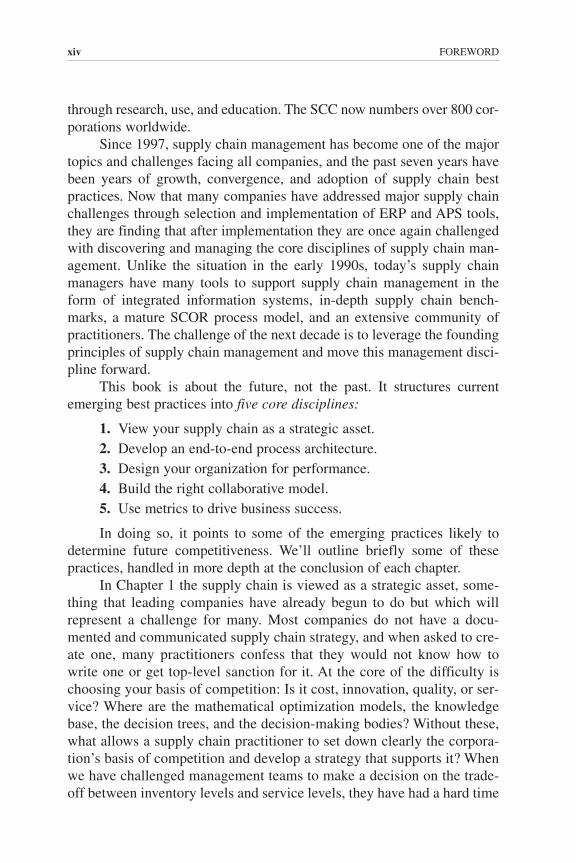
Since 1997, supply chain management has become one of the majortopics and challenges facing all companies, and the past seven years havebeen years of growth, convergence, and adoption of supply chain bestpractices. Now that many companies have addressed major supply chainchallenges through selection and implementation of ERP and APS tools,they are finding that after implementation they are once again challengedwith discovering and managing the core disciplines of supply chain man-agement. Unlike the situation in the early 1990s, today’s supply chainmanagers have many tools to support supply chain management in theform of integrated information systems, in-depth supply chain bench-marks, a mature SCOR process model, and an extensive community ofpractitioners. The challenge of the next decade is to leverage the foundingprinciples of supply chain management and move this management disci-pline forward.
This book is about the future, not the past. It structures currentemerging best practices into five core disciplines:
1. View your supply chain as a strategic asset.2. Develop an end-to-end process architecture.3. Design your organization for performance.4. Build the right collaborative model.5. Use metrics to drive business success.
In doing so, it points to some of the emerging practices likely todetermine future competitiveness. We’ll outline briefly some of thesepractices, handled in more depth at the conclusion of each chapter.
In Chapter 1 the supply chain is viewed as a strategic asset, some-thing that leading companies have already begun to do but which willrepresent a challenge for many. Most companies do not have a docu-mented and communicated supply chain strategy, and when asked to cre-ate one, many practitioners confess that they would not know how towrite one or get top-level sanction for it. At the core of the difficulty ischoosing your basis of competition: Is it cost, innovation, quality, or ser-vice? Where are the mathematical optimization models, the knowledgebase, the decision trees, and the decision-making bodies? Without these,what allows a supply chain practitioner to set down clearly the corpora-tion’s basis of competition and develop a strategy that supports it? Whenwe have challenged management teams to make a decision on the trade-off between inventory levels and service levels, they have had a hard time
xiv FOREWORD
doing so. How much more difficult is it, then, to decide on the true basisfor competition.
If developing and documenting a strategy represent a challenge, thenext tough step is to develop a supply chain strategy that integrates withboth the product strategy and the marketing strategy. When these threeare aligned, a company can expect to generate additional revenues duringthe product life cycle, deliver superior customer response, and operatefrom a lower cost base than competitors. The authors talk about becom-ing adaptive—a much-needed capability driven not just by changes in thecustomer base or by competitors but also by the need to integrate strate-gies internally.
In the second core discipline—developing an end-to-end processarchitecture—we recognize that many companies (again exemplified bythe cases in this book) have made great strides to achieve what the authorshave identified in Chapter 2 as “simplicity.” This has been especially truein corporations with a long industrial past and with a global footprint asthey have simplified their processes in order to be competitive.
As we look at future challenges, we can identify product and serviceproliferation as a driver of cost and inefficiency in many companies, yetfrequently there is no ongoing management process in place to containthis phenomenon. Perhaps the absence of an integrated strategy makesmanagement of proliferation impossible for many companies.
What are the skills that will be needed to manage the supply chain ofthe future? In Chapter 3 the authors have given us frameworks and exam-ples for the third core discipline—designing your organization for perfor-mance. This is an area of great challenge for both supply chain and humanresources functions, for it is only in recent years that we have seen compa-nies really tackle this topic seriously. Until recently, supply chain organi-zation design simply was a case of putting previously disparate operationalfunctions under single-point accountability and leadership. Many compa-nies have established at least a baseline supply chain organization and haveseen it settle and mature, but there is much more to do to develop the sup-ply chain organization of the future. How will you identify the next gener-ation of skills that will be required to develop and manage the infinitelymore complex and more rapidly changing supply chains of the future?What will those skills be? How will they be acquired or developed? Howmuch should you outsource without “thinning the core”? These are someof the critical questions that must be answered.
In Chapter 4, on the fourth core discipline—building the right col-laborative model—the authors rightly bring to our attention that the emerg-ing practice of supply chain collaboration has failed in many cases to deliver
FOREWORD xv
on its promise. Is this the case because there was more promise than couldever be delivered? Or is it perhaps because there was, again, an incompletemanagement framework on which to build a management process? Or per-haps collaborative partners never were realistic about the underlying eco-nomic assumptions that drove them to collaborate. Perhaps a good startingpoint would be to ensure that everyone (external as well as internal to yourcompany) who manages or interacts with collaboration partners shouldread Chapter 4 and then assess honestly the current state of their collabo-rative relationship.
How well is your supply chain performing? How can you tell? Thefifth discipline—use metrics to drive business success—teaches about thepower of measurement as a management tool. Far from being simply a col-lection of numbers, the right set of metrics can provide information aboutthe health of each core supply chain process and identify problem areas onwhich to focus. As important, the right performance management approachwill drive behaviors in accordance with your overall business strategy.
In Chapter 5 the authors show how to choose the metrics that willinspire desired performance and how to establish worthwhile goals. Theauthors emphasize the importance of balance—the need to look at perfor-mance both internally and from your customers’ perspectives and the needto develop a portfolio that includes a selection of financial and nonfinancialand functional and cross-functional metrics, as well as metrics designed toassess innovation and ongoing improvements within the supply chain.
When you are engaged in managing supply chains day-to-day amidthe operational challenges of quarterly and annual business cycles, indus-try economic cycles, and shifting management emphasis, it is difficult tolift your eyes up from the printout, the computer screen, or the factoryfloor and envision your supply chain in the future. We believe that thisbook will help readers to lift their eyes and dream a little. It will encour-age you to know that no matter what you have achieved until now, thereremains more opportunity and challenge ahead.
End-to-end supply chain management is not just about logistics; it’sabout building a core competency that will lead to your future competi-tiveness and contribute mightily to your top and bottom lines.
Gordon Stewart and Mike Aghajanian, Managing DirectorsPRTM
xvi FOREWORD

A C K N O W L E D G M E N T S
Ever since its founding in 1976, PRTM has shone the spotlight on oper-ations—the component of the business world that often goes unheralded.But as one of the executives interviewed for the General Motors profile inthese pages notes, it’s the operations staff that are the “oaks” of any orga-nization—providing the solid support for manufacturing and supply chainmanagement that makes for progress in the gross national product of everycountry worldwide.
We hope we’ve captured some of the esprit de corps of supply chainmanagement in these pages, especially in the seven organizations thatagreed to be profiled for this book: Eli Lilly, Autoliv, Avon, OwensCorning, the U.S. Department of Defense (the largest supply chain in theworld), General Motors, and Seagate Technology. We’d like to thank allthe executives we interviewed at these organizations for their candor, theirpassion for their work, and their desire to share the state of their art withothers. These companies were chosen by us because they understand thestrategic role the supply chain plays in their businesses and are engagedtoday in large-scale transformative initiatives to wring more value fromsupply-chain investments, create better return on investment from processand technology improvements, and establish an end-to-end supply chainat their enterprises.
These interviews were made all the more lively by the facilitationand expertise of our stellar internal marketing communications staff atPRTM. Victoria Cooper, our director of corporate communications, ledthis book project from start to finish, establishing an early vision for itsstructure and content, managing all aspects of the project, and integratingall the strands of the book. She also conducted many of the interviews forthe profiles. We also are indebted to Martha Craumer, our Atlantic Regioneditor, who shared the development role on the book, also leading severalinterviews, but most important, continually driving us to clarify our think-ing. Martha made the book much more readable through her editing andrewriting skills.
We’d like to thank Sherrie Good, our Pacific Region editor, whoendured the lengthy process of fact-checking the statements pertaining to client and other company examples in the text with good grace. We also
xviiCopyright © 2005 by The McGraw-Hill Companies, Inc. Click here for terms of use.
xviii ACKNOWLEDGMENTS
owe thanks to our assistant editor, Bridget Brace, who ensured that ourmanuscript met the publisher’s guidelines for style and format and whokept all the files straight over the many months of discovery and revision.We’d also like to thank Erik Schubert, PRTM’s art director, for making thecharts for this book.
The following directors made the company profiles possible because oftheir relationships: Shoshanah Cohen and Jan Paul Zonnenberg for Lilly;Bob Pethick for Autoliv and GM; Brian Gibbs for Avon; Amram Shapiro andSteve Pillsbury for Owens Corning; Jeff Berg and Mike Finley for the U.S.Department of Defense; and Mike Anthony for Seagate Technology. We arealso indebted to Jennifer Parkhurst for her contributions to the Lilly profile.
And we thank PRTM business analysts Pranay Agarwal, Paul Ibarra,Amanda Jenkins, Chris Barrett, Neil Kansari, and Andrew Yiu for earlyresearch on these and other companies’ strength and history in supply chainmanagement. We’d also like to thank the following freelance writers:Michael Cohen and Michael Lecky, for their contributions to the Autolivand DoD profiles respectively.
This book would not have come into existence without the champi-onship of Craig Divino, a recently retired director of PRTM who workedon many supply chain challenges at companies in Europe and the UnitedStates during his 25-year tenure at the firm. We are also indebted toGordon Stewart, PRTM’s Atlantic Region managing director, for hisexploration of PRTM’s history of leadership in supply chain managementin the Foreword.
As for the creation of the five disciplines explored in this book, thereare many contributors from the many worldwide offices of PRTM:
◆ For the strategy chapter, we are grateful to Tom Godward, BobMoncrieff, Craig Divino, Jim Welch, and Brad Householder.
◆ For the process chapter, we are grateful to Didier Givert, JakubWawszczak, Craig Divino, Torsten Becker, Hans Kuehn, andBrad Householder, who provided significant input for the defini-tion of the five processes plan, source, make, deliver, and returnand how they work together to form an end-to-end supply chain.We also thank Paul Cantrell, who researched some of the exam-ples in the chapter, and Peter Vickers, who provided significantinput for the four tests of supply-chain architecture.
◆ For the organization chapter, we are grateful to Kate Fickle,Gordon Stewart, Bob Moncrieff, and especially Craig Kerr,who provided the framework for the evolution of the supplychain organization.

◆ For the collaboration chapter, we thank Steve Palagyi, GordonStewart, and Tony Paolini.
◆ For the chapter on performance measurement, we thank GaryGalensky, Robert Chwalik, and Rick Hoole for research onexamples given in the chapter.
◆ For the chapter on the roadmap to change, we are grateful toDidier Givert, Craig Divino, Craig Kerr, Jakub Wawszczak,Harald Geimer, and Brad Householder for their contributions to our thinking.
One of PRTM’s great strengths is its benchmarking capability. Wehave been benchmarking performance in the high-tech sector since the mid-1980s and have expanded into other sectors—such as consumer products—in the last few years. We couldn’t have fulfilled on our promise of “resultsand fact-based consulting” without the ongoing support of our benchmark-ing subsidiary, the Performance Measurement Group, LLC, led by MichelleRoloff. She paid particular attention to the chapters on process and mea-surement, contributing significantly to their content. We wouldn’t have allthe data and analysis in this book either without the expertise of Julie Cesati,PMG’s senior analyst for supply chain studies, with early support fromPRTM business analyst Neil Kansari.
A book of this scope would not have been possible without the yearsof cumulative experience available at PRTM. Our over 600 engagements insupply chain work with clients have helped us understand what’s state ofthe art, what’s emerging, and what the next generation of supply chainpractices is likely to promise in technology and process enablement. Wethank all the companies with whom it has been our privilege to work.
ACKNOWLEDGMENTS xix

This page intentionally left blank.

Eli Lilly Profile:Supporting ProductLifecycles with SupplyChain Management
Pharmaceutical companies must do two things well: Invent new products,and create and supply demand for them in the marketplace. And when anew product makes it through the complexities of development—an extraor-dinary long shot—the number one rule is to never run out. This is wherethe supply chain comes in.
Eli Lilly is one of the world’s leading pharmaceutical companies. With $11billion in revenues, it markets its products in 159 countries and has 43,000employees. The Indianapolis-based company creates pharmaceutical prod-ucts that treat a broad range of ailments, including depression, schizophrenia,cancer, and osteoporosis.
Lilly is committed to product innovation, spending about 19 percent ofits annual revenue, or $2 billion, on research and development every year. Thehigh risk and enormous expense of inventing, developing, and testing phar-maceutical products mean that companies in the industry often depend on justone or two flagship products for the bulk of their income. When the patent forthose products expires, the financial consequences can be profound.
Lilly suffered a potentially devastating setback when a judge unex-pectedly ruled in 2000 that the company’spatent on Prozac, a classic blockbuster thatmade up over 20 percent of sales, wouldexpire in 2001—three years earlier thanexpected. Within six months, generic com-petitors had siphoned off more than half ofProzac’s sales.
Lilly spends about 19percent of its annualrevenue on R&D.
1
Copyright © 2005 by The McGraw-Hill Companies, Inc. Click here for terms of use.
2 Strategic Supply Chain Management
In anticipation of this possibility, Lilly turbocharged its R&D effortsduring the late 1990s. Today, the company has what is widely acknowl-edged as the industry’s strongest pipeline, with products in every stage ofdevelopment—from early-stage molecules through late-stage clinical tri-als. Lilly’s ambitious plans for the future include launching two to four newproducts per year over the next several years and doubling sales revenue.
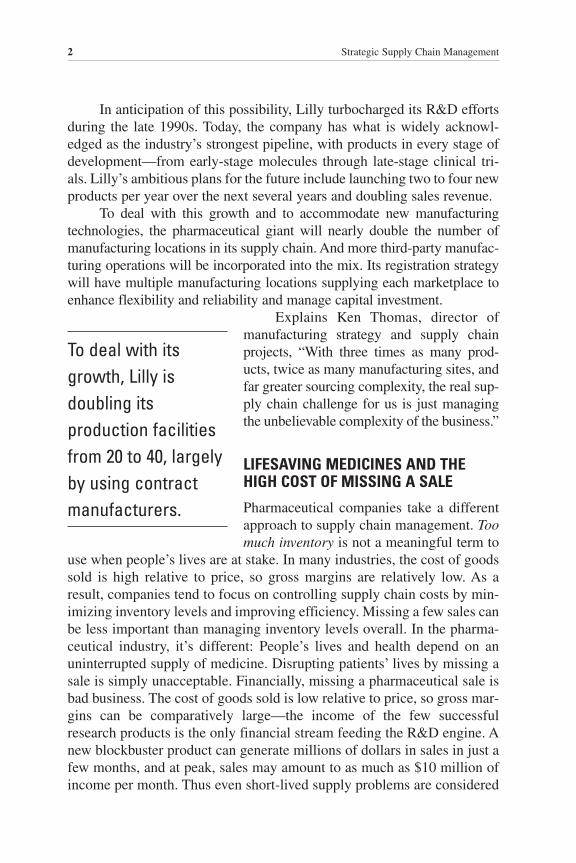
To deal with this growth and to accommodate new manufacturingtechnologies, the pharmaceutical giant will nearly double the number ofmanufacturing locations in its supply chain. And more third-party manufac-turing operations will be incorporated into the mix. Its registration strategywill have multiple manufacturing locations supplying each marketplace toenhance flexibility and reliability and manage capital investment.
Explains Ken Thomas, director ofmanufacturing strategy and supply chainprojects, “With three times as many prod-ucts, twice as many manufacturing sites, andfar greater sourcing complexity, the real sup-ply chain challenge for us is just managingthe unbelievable complexity of the business.”
LIFESAVING MEDICINES AND THEHIGH COST OF MISSING A SALE
Pharmaceutical companies take a differentapproach to supply chain management. Toomuch inventory is not a meaningful term to
use when people’s lives are at stake. In many industries, the cost of goodssold is high relative to price, so gross margins are relatively low. As aresult, companies tend to focus on controlling supply chain costs by min-imizing inventory levels and improving efficiency. Missing a few sales canbe less important than managing inventory levels overall. In the pharma-ceutical industry, it’s different: People’s lives and health depend on anuninterrupted supply of medicine. Disrupting patients’ lives by missing asale is simply unacceptable. Financially, missing a pharmaceutical sale isbad business. The cost of goods sold is low relative to price, so gross mar-gins can be comparatively large—the income of the few successfulresearch products is the only financial stream feeding the R&D engine. Anew blockbuster product can generate millions of dollars in sales in just afew months, and at peak, sales may amount to as much as $10 million ofincome per month. Thus even short-lived supply problems are considered
To deal with itsgrowth, Lilly isdoubling itsproduction facilitiesfrom 20 to 40, largelyby using contractmanufacturers.

ELI LILLY PROFILE: Supporting Product Lifecycles with Supply Chain Management 3
very seriously. This is why Lilly focuses its supply chain managementefforts primarily on never missing a sale and only secondarily on keepinginventory levels low.
This is not to say that inventory levelsdon’t matter. Expired products are costly.So is squandering manufacturing capacityon low-demand, low-margin products. As a result, accurate forecasting and demandmanagement are critical to Lilly’s supplychain operations. The company conse-quently takes a global approach to supplychain management—especially given itsaggressive growth plans. Explains StephanBancel, executive director of global manu-facturing strategy, global supply chain, andU.S. distribution, “If we want to scale thiscompany, we have no choice but to havecommon, global processes.”
STANDARDIZED GLOBAL PROCESSES
During the 1980s and 1990s, each site planned and scheduled its ownoperation with a focus on optimizing local results. This approach didn’trecognize the additional efficiency and productivity that could be gainedfrom a global supply chain focus—especially as the business grew largerand more complex. Consequently, in 1997, Lilly began developing globalsupply chain management capabilities with standardized processes, met-rics, and terminology throughout the world, capturing this knowledge inits Operational Standards Supply Chain Excellence (OSSCE) program. Asa part of OSSCE standards, for example, market affiliates and plants aregraded on their adherence to these standards. This standardized approachmeans that the activities required to convert raw materials into final prod-ucts that are distributed to customers are planned and scheduled in thesame way around the world.
Additionally, Lilly has put in place a series of manufacturing net-works—groups of plants with standard equipment and processes geared tospecific product types, such as dry products, freeze-dried products, andparenteral products. As a result, development of processes prior to thelaunch of a new product is consistent from product to product. Each newdrug being developed fits within an established “toolkit” environment.
Lilly focuses itssupply chainmanagement effortson never missing asale—and onlysecondarily onkeeping inventorylevels low.
4 Strategic Supply Chain Management
This approach saves millions of dollarseach year while boosting productivity andefficiency. It also results in greater securitybecause redundant facilities can back eachother up.
Common processes also help demandforecasting—a critical element of Lilly’snever-miss-a-sale approach. The company’s
global demand management center is the link between sales, marketing, andmanufacturing around the world. The center owns the forecasting processesand tools and ensures that the 159 marketing affiliates around the world deliver accurate forecasts to manufacturing. All plants useManugistics’ Web-enabled global planning system.
Other companies may predict demand accurately in a particularcountry or region, but Lilly has established truly global precision. Overall,the company forecasts demand with 76 percent accuracy, and in theUnited States, that figure soars to 90 percent. What is the key to this capa-bility? Notes Allison Leer, manager of global demand management, “Wehave extremely good, experienced people working in this area, who stayon the job forever.” Well-documented processes, good training materials,and sound practices supplement the group’s expertise. Vigilance helps,too. Forecast accuracy is measured monthly. If a market submits an errantor incomplete forecast, someone calls to find out why.
LAUNCHING NEW PRODUCTS
Bancel led an effort over the past few years to look at the full contributionof supply chain management to business success. As he describes it, thismeant focusing on supply chain design first and operations second. Bydesigning the supply chain during development, and not afterward, thecompany could support regulatory requirements. It could balance the riskof clinical failure with speed to market and enable a robust and responsivesupply after launch.
Another major concern was supply chain optimization. Lilly deter-mined to maximize the value of manufacturing by selecting the best prod-uct mix for its networks. It determined to explore contract manufacturingwhenever it could enhance revenue.
Lilly’s supply chain management efforts start well before the launchof a new product, about four years before supply chain design is begun,according to Bancel. About one year before Lilly submits a new product
Each new drug beingdeveloped fits withinan established“toolkit” environment.
ELI LILLY PROFILE: Supporting Product Lifecycles with Supply Chain Management 5
to the Food and Drug Administration (FDA) for approval, a global launchleader is assigned to the case. The launch leader’s job is to maximize long-term margins during the very critical early days of the launch by deter-mining the global sequence of the release and creating an integratedlaunch plan for all aspects of the launch—including product flow, labelapproval, and sales-force training.
During the same period of time, the supply chain management teamstarts planning for the new product, answering such questions as whenand where to make the new product and how to get it to wholesalers andretailers—all with an eye toward the long-term success of the new prod-uct while optimizing manufacturing and distribution. The launch leaderintegrates the manufacturing and supply chain plans and aligns them withplans from the marketing, sales, clinical, and regulatory departments.
Despite these measures, there’s always uncertainty around a newproduct launch. Lilly always prepares to accommodate the “upside fore-cast,” but when a drug is much more popular than expected, finding extramanufacturing capacity or making other arrangements can take some creativity. For instance, when demand in Europe for Cialis—a treatmentfor erectile dysfunction—exceeded Lilly’s upside forecast, the companydelayed introducing the drug in some countries to ensure that initial sup-plies were adequate where launch had already been initiated.
OPTIMIZING CAPACITY
Lilly has a corporate group that provides global supply chain managementacross the company. The group works with local sites to help optimize globalcapacity and inventory allocation by determining what product will be madewhere and for which markets. This often means making short-term sourcingchanges within a framework provided by the Strategic Facilities PlanningTeam, which, in turn, makes long-term sourcing and capacity decisions.Since it takes somewhere between two and five years to bring on new capac-ity, Lilly must make the best use of the capacity it has at any given time.
Because of its standardized manufacturing processes, Lilly can opti-mize capacity by shifting work among plants. If the Spanish plant is mak-ing a particular product at 90 percent capacity, whereas the Indianapolisand U.K. factories are only at 60 percent, the company can distribute partof that work to other plants in the manufacturing network.
Taking work away from plants can be a concern for plant managersbecause they are judged in part on their production levels. However, ongo-ing efforts by the corporate supply chain management group are helping

6 Strategic Supply Chain Management
people to realize that such production shifts are for the greater good of thecompany. “We bring our manufacturing management together monthly toreview and approve how some moves can benefit the organization as awhole, even though they may cause a temporary ‘adverse variance in a sin-gle plant,’” explains Jon Rucker, director of supply chain. “It’s a consensus-driven exercise. All the plants are involved in optimizing global capacity inthe two- to five-year horizon.”
ORGANIZATIONAL CHANGE
The central supply chain management group makes business decisions aswell as manufacturing decisions. For example, it may make sense from amanufacturing standpoint to discontinue an old, off-patent drug that takesup valuable capacity that could be better used for a more profitable prod-uct. From a business standpoint, though, the legacy drug may be an inte-gral part of a product portfolio for a therapeutic need that patients rely on.Some products are more valuable than the bottom line indicates. Gainingthis degree of insight means looking beyond the manufacturing function.
During the late 1990s, Lilly set up an organizational structure of globalproduct teams to enhance speed-to-market capabilities. Product teams are
cross-functional teams of development, med-ical, clinical, marketing, and regulatory staffwho focus on a single product. The team cre-ates a global, integrated plan for the productover its entire life cycle, including new indi-cations, line extensions, and marketing pro-grams. A supply chain steward, acting as aliaison between the product team and the sup-ply chain, interprets and translates that planinto supply chain tactics and targets. In thisway, widely dispersed manufacturing units
around the world are provided with very clear objectives that align preciselywith the global marketing strategy for every product.
Lilly is also making the transition to running the manufacturingorganization globally instead of regionally or locally. Until recently, thecompany created short-term materials requirements planning (MRP)plans at each site and attempted to reconcile the plans using supply chainmodels designed for single products. After experiencing a number of chal-lenges for which this approach was clearly insufficient, Lilly realized thatthe only way to resolve them was to optimize networks of sites instead of
A supply chainsteward acts as aliaison between theproduct team andthe supply chain.
ELI LILLY PROFILE: Supporting Product Lifecycles with Supply Chain Management 7
individual sites and to optimize families of products instead of singleproducts. To this end, the company created a global sales and operationsplanning (GS&OP) process and model that create one long-term plan permanufacturing network. Once approved, the plan provides input to the siteGS&OP process.
Each site reconciles the long-term global network view with short-term local demand and supply signals. The goal is to optimize capacityand inventory across the network of plant sites and the supply chainswhile ensuring an uninterrupted supply of medicine. Lilly believes that theonly way to do this is with a GS&OP process.
Of course, managing complex global operations is easier with inte-grated information systems. In the 1980s and 1990s, Lilly had a widerange of computer systems throughout its local and regional branches.Today, the company is in the midst of a global ERP rollout to all manu-facturing sites and most of the major sales offices as well. This will allowmanagers to see production plans, sales forecasts, inventory levels, andcapacity utilization across the enterprise. Until the rollout is complete,however, pulling together the performance data needed for global supplychain management is a major undertaking.
If the past is any indication, Lilly will continue to improve its sup-ply chain management organization and capabilities in response to chang-ing market conditions. The company’s supply chain management structurehas gone through three different organizational forms in the last fouryears, a continuous evolution to better align the structure with businessneeds. The company believes that this ongoing alignment is the key tosupply chain management in the pharmaceutical industry.

This page intentionally left blank.

1 C H A P T E R
Core Discipline 1:View Your Supply Chain as a Strategic Asset
9
If you’re like many companies, you only think about changing your sup-ply chain when something’s broken—inventory levels are too high, cus-tomers are complaining about poor service, or a supplier is late with acritical shipment. Or maybe a benchmarking analysis shows that your sup-ply chain performance is subpar relative to others in your industry.
If you only think about changing your supply chain when there’s aproblem, chances are that you don’t see it as a valuable asset that can giveyour company a competitive advantage. And if this is the case, you riskbeing blindsided by companies that use their supply chain as a strategicweapon. Companies such as Dell, Amazon, Shell Chemical, and Airbusare rewriting the rules of competition in their industries—and forcing thelaggards to play catch-up.
Market leaders such as Wal-Mart and Dell understand that the sup-ply chain can be a strategic differentiator. They constantly search for newways to add value and push the boundaries of performance. And they keeprefining their supply chains so they stay one step ahead of the competition.They know that today’s competitive edge is tomorrow’s price of entry.
Michael Dell is widely viewed as a pioneer in the personal computer(PC) business. He transformed Dell from struggling PC maker to marketleader by introducing supply chain innovations such as direct-to-consumer
Copyright © 2005 by The McGraw-Hill Companies, Inc. Click here for terms of use.

10 Strategic Supply Chain Management
sales and build-to-order manufacturing to the computer industry. In truth,Michael Dell is a visionary in supply chain management. PCs simply werethe medium he used to introduce his idea for a competitive supply chain:Sell direct, build to order, and ship direct. Sam Walton was another supplychain visionary. Wal-Mart’s legendary partnership with Procter & Gambleto replenish inventory automatically showed the power of integrating withkey suppliers. To further reduce inefficiencies and costs, Wal-Mart shiftedfrom buying from distributors to buying directly from manufacturers for abroad range of merchandise. These and other supply chain actions combineto deliver on the promise of “always low prices”—the strategy that hashelped Wal-Mart become the world’s largest retailer.
FIVE KEY CONFIGURATION COMPONENTS
Strategic supply chain management is more than just innovation for thesake of being innovative. It’s creating a unique supply chain configurationthat drives your strategic objectives forward. To get the most from yoursupply chain, you need to consider five critical configuration components:
◆ Operations strategy◆ Outsourcing strategy◆ Channel strategy◆ Customer service strategy◆ Asset network
Your decisions around these components and how they play together defineyour supply chain strategy.
Until now, companies tended to either address these componentsinformally or make decisions about them in isolation—often as part of afunctional strategy related to sales, purchasing, or manufacturing.However, companies that view the supply chain as a strategic asset seetheir components as interdependent—part of an integrated whole. Let’slook at each more closely.
Operations Strategy
Your decisions about how you’ll produce goods and services form youroperations strategy. Will you choose make to stock, make to order, engi-neer to order, or some combination? Will you outsource manufacturing?Will you pursue a low-cost offshore manufacturing strategy? Will youcomplete your final configuration outside the manufacturing plant and
CHAPTER 1 Core Discipline 1: View Your Supply Chain as a Strategic Asset 11
closer to the customer? These are criticaldecisions because they influence and shapethe whole supply chain and the investmentsyou make. Your operations strategy deter-mines how you staff and run your factories,warehouses, and order desks—as well ashow you design your processes and infor-mation systems.
◆ Make to stock is the best strategyfor standardized products that sellin high volume. Larger productionbatches keep manufacturing costsdown, and having these products ininventory means that customerdemand can be met quickly.
◆ Make to order is the preferredstrategy for customized products orproducts with infrequent demand.Companies following this strategyproduce a shippable product only with a customer order in hand.This keeps inventory levels low while allowing for a wide rangeof product options.
◆ Configure to order is a hybrid strategy in which a product is par-tially completed to a generic level and then finished when anorder is received. This is the preferred strategy when there aremany variations of the end product and you want to achieve lowfinished-goods inventory and shorter customer lead times thanmake to order can deliver.
◆ Engineer to order, which shares many of the characteristics ofmake to order, is used in industries where complex products andservices are created to unique customer specifications.
Changing your operations strategy can be a key source of perfor-mance advantage (see Figures 1-1 and 1-2). Several of our clients in con-sumer packaged goods, for instance, found that moving from make tostock to configure to order improved service levels while reducing inven-tory. In the past, these companies manufactured and shipped productsdirectly to the end market. Small pack size, combined with the need forlocal language variants, meant that products were dedicated to a givenmarket very early in the production process.
Strategic supplychain managementis more than justinnovation for thesake of beinginnovative. It’screating a uniquesupply chainconfiguration thatdrives forward yourstrategic objectives.

12 Strategic Supply Chain Management
For products requiringmany variations
Configure to order Customization;reduced inventory;improved servicelevels
StrategyWhen to Choose
This Strategy
For complex productsthat meet uniquecustomer needs
Benefits
Make to stock For standardizedproducts selling inhigh volume
Low manufacturingcosts; meetingcustomer demandsquickly
Make to order For customizedproducts or productswith infrequentdemand
Low inventory levels;wide range of productoptions; simplifiedplanning
Engineer to order Enables response tospecific customerrequirements
F I G U R E 1–1
Types of operations strategies.
F I G U R E 1–2
Operations strategies by industry.
0% 10% 20% 30% 40% 50% 60% 70% 80% 90% 100%
Telecom, Electronics
Medical Devices
Computers
A&D, Auto, Industrial
Semiconductors
Chemicals, Pharma
Consumer PackagedGoods
Make to Stock Configure to Order Make to Order Engineer to Order© Copyright 2004 The Performance Measurement Group, LLC
CHAPTER 1 Core Discipline 1: View Your Supply Chain as a Strategic Asset 13
We worked with these companies to combine make-to-stock andconfigure-to-order strategies. “Vanilla” products were produced and storedin a central distribution center. When orders came in from each market,products were customized and shipped accordingly. Availability shot upand inventory went down in part due to the central inventory but alsobecause the new approach simplified supply chain planning since procure-ment and manufacturing could focus on generic products instead of hun-dreds of language variants.
It may be to your advantage to choose different operations strategiesfor different products or market segments. Automobile makers have longpursued a make-to-stock strategy, but some—especially European manu-facturers of high-end vehicles—have aggressively pursued make-to-orderand configure-to-order strategies, an approach we call “Dell on Wheels.”1
However, make to order has its limits, as automobile makers are finding.Offering passenger cars on a make-to-order basis while maintaining a com-petitive lead time is a tremendous challenge given the millions of potentialend configurations. Unless suppliers can be fully integrated into the make-to-order supply chain, the inventory risk is very high. In addition, chang-ing the manufacturing process to allow each car to match a unique set ofcharacteristics is a very costly undertaking that few OEMs have been will-ing to embrace. In 2002, only about 20 percent of passenger cars sold inNorth America were made to order. The rest were made to stock and soldfrom dealer lots. In Europe, the percentage of made-to-order vehicles wasgreater. In the German domestic market, for instance, about 60 percent ofthe high-end cars made by BMW, Audi, Porsche, and Mercedes were madeto order.
Like the other supply chain configuration components, operationsstrategy is dynamic. A key driver is the product life cycle. As demand forproducts peaks and then decreases, companies can move from make tostock to make to order to reduce inventory risk while still ensuring avail-ability at a competitive price. Another driver is the number of product vari-ants. It is not unusual to find that 80 percent of volume shipments comesfrom just 20 percent (yes, Pareto at work again) of your sales item numbers(or possible configurations). In this circumstance, a hybrid make-to-stockand make-to-order strategy may be more appropriate.
Channel Strategy
Your channel strategy has to do with how you’ll get your products and ser-vices to buyers or end users. These decisions address such issues as whether
14 Strategic Supply Chain Management
you’ll sell indirectly through distributors or retailers or directly to customersvia the Internet or a direct sales force. The market segments and geographiesyou’re targeting will drive your decisions in this area. Since profit marginsvary depending on which channels are used, you have to decide on the opti-mal channel mix—and who gets the goods in times of product shortages orhigh demand.
Market leaders use effective channel strategies to reap significantgains. Dell, with its direct-sales model, and Wal-Mart, with its superstoremodel, offer compelling examples of how channel choices can deliver acompetitive advantage. Novell’s value-added reseller channel, one of thebest early examples of a technology-oriented channel, helped prop the com-pany up at a time when it had serious technological problems to overcome.And Microsoft’s dealer channels provide a range of services to buyers fromleasing to training and help-desk support.
Consider the multi-billion-dollar bottled water industry and its twomajor markets: spring water and distilled water. While spring water requireson-site bottling, distilled water can be bottled at any municipal water sourceusing any local bottling company. The industry uses three different distri-bution methods to serve its three major consumer segments: Traditional retaildistributors serve the retail customers, vending machines serve the individ-ual consumer market, and service agents install, maintain, and replenish on-site water units for home and office users. Each segment requires differentsupply chain processes, assets, channels, and supplier relationships and per-formance levels.
If you were a new player in the bottled water industry, would yousell your product through distributors that already have relationships withkey retailers or distribute directly to those retailers? If you chose the dis-tributor channel, would you integrate your order management and inven-tory management systems with the distributors’ systems? If so, to whatextent, and who should pay for it? Would you maintain dedicated inven-tory for all distributors or only those distributors which you consider to bestrategic partners? These decisions drive your company’s asset and costperformance and must be a part of your overall channel strategy—alongwith decisions on pricing, vendor financing policies, promotions, andother terms and conditions.
Outsourcing Strategy
Outsourcing decisions begin with an analysis of your company’s existingsupply chain skills and expertise. What is your company really good at?

CHAPTER 1 Core Discipline 1: View Your Supply Chain as a Strategic Asset 15
What areas of expertise are—or have the potential to become—strategicdifferentiators? These are the activities you should keep in-house andmake even better. Consider outsourcing activities with low strategicimportance or that a third party could do better, faster, or more cheaply.
Outsourcing allows companies toramp up or down quickly, build new prod-ucts, or reposition themselves in the mar-ketplace—all by leveraging the expertiseand capacity of other companies. Thisadded flexibility and agility can make anenormous difference in today’s competitiveglobal markets. Most important, though,outsourcing allows companies to focus ontheir core competencies and enhance theircompetitive positioning.
Before moving forward, however, besure to carefully consider the risks andstrategic ramifications of your outsourcingdecisions. Introducing new products, man-aging inventory levels, and ensuring that thesupply chain configuration supports competitive customer lead times—these are strategic activities that cannot be delegated to a third party. Besure to consider other key questions that will drive your decision. Shouldoutsourced skills also be maintained internally, or are they no longerneeded? Which existing skills should be strengthened? Will new tools orskills be needed, such as the ability to manage inventory across theextended supply chain?
Thinking only in terms of “Can it be done more cheaply outside?” isunlikely to provide a strategic solution.
Outside partners can deliver three potential advantages:
◆ Scale—Third-party providers often can offer services morecheaply because of a large customer base that keeps utilizationrates high and unit costs low. External partners also can helpcompanies to scale up production quickly without having toinvest in new manufacturing capacity.
◆ Scope—For companies that want to expand into new marketsor geographies, outsourcing partners can provide access tooperations in new locations which would not be economical to replicate internally at current business volumes.
Consideroutsourcingactivities with lowstrategic importanceor that a third partycould do better,faster, or morecheaply.

16 Strategic Supply Chain Management
◆ Technology expertise—Outsourcing partners may have mastereda product or process technology that would require a sizableinvestment to develop internally.
Despite these benefits, outsourcing isn’t always the right decision.Before turning to external providers, consider four things: your source ofdifferentiation, your operating scale, your power position, and the unique-ness of your operations.
First, know how your company differentiates itself. What gives you acompetitive edge? If your product or process technology is a source of dif-ferentiation, don’t outsource that aspect of your operations. Consider thecase of one of the world’s leading brands in watches. The Manufacture desMontres Rolex SA, known around the world for its Rolex brand, not onlyproduces the components for its watches, but also produces machines,tools, and supplies for the manufacture of movements and other products.2
Manufacturing is an integral part of ensuring the high standards of qualitythat set Rolex apart as a premium watchmaker.
For many companies, however, manu-facturing is not strategic. Cisco, Compaq,and IBM outsource most of their productionto contract electronics manufacturers suchas Flextronics, Solectron, and Celestica.And most industries use third-party logisticsproviders for transportation, customs, ware-housing, and other value-added services,such as final packaging, configuration test-ing, software loading, and site installation.
Next, compare the scale of your internaloperations against your requirements. If youroperations are at or near full capacity utiliza-tion—with no plans to boost production—
you’re unlikely to gain any cost benefit from outsourcing. For smallerplayers that want to expand, however, working with a partner can be the bestsolution. Outsourcing manufacturing operations to lower fixed and totalcosts is common practice across many industries. Top performers have setup these practices to yield other benefits as well.
Tellabs, a U.S. manufacturer of communications equipment, pro-vides an example. This company’s approach to external manufacturingprovides benefits to strategies in procurement, design, repair operations,and market penetration, in addition to reducing manufactured cost. Throughexternal agreements and integration of internal practice disciplines, Tellabs
If your product orprocess technologyis a source ofdifferentiation, don’toutsource thataspect of youroperations.

CHAPTER 1 Core Discipline 1: View Your Supply Chain as a Strategic Asset 17
is leveraging manufacturing partners’ common parts lists, engaging in col-laborative product design reviews, and leveraging partner repair capacityin its own spare-parts and service network. Additionally, Tellabs hasestablished its manufacturing agreements to allow for movement of pro-duction and repair operations into countries where a local presence bene-fits market-share growth goals.
Third, consider the uniqueness of your internal operations. Do youhave business processes or unusual product characteristics that would bedifficult for an outsider to replicate? If so, you have little to gain by goingoutside—an outsourcer’s scale advantage won’t apply to your unusualrequirements. Wal-Mart, for example, has developed a highly customizedinternal logistics operation that manages inbound inventory flows from itscentral distribution centers to the shelves of its retail locations. As theowner of one of the largest warehousing operations in the world, Wal-Mart has nothing to gain—and everything to lose—by outsourcing thisaspect of its operations.
Fourth, consider the balance of power between you and your out-sourcing partner. Many providers of manufacturing, distribution, and cus-tomer-fulfillment services are already larger than their customers. Asthese service providers consolidate further, they’ll gain even more power.Will you get the services that you need at a competitive price if your vol-ume of business isn’t high enough?
To choose the best service provider, go beyond technical criteria andconsider the overall business context. Weigh the volume you representagainst the service provider’s strategy and overall size. You may end upchanging your decision about which service providers to use, how todivide the volume among them, and even whether to outsource at all.
Customer Service Strategy
Customer service strategy is another key configuration component. Yourcustomer service strategy should be based on two things: the overall vol-ume and profitability of your customer accounts and an understanding ofwhat your customers really want. Both pieces of knowledge are integralto your supply chain strategy because they help you to prioritize andfocus your capabilities.
Should all customers get same-day delivery, or should you aim fordifferent service levels depending on customer importance? Should allproducts be equally available, or should some customers have quicker,easier access? If your company never examines its service strategy, you
18 Strategic Supply Chain Management
may be providing more costly levels of service than your customers need—or you may be missing important market opportunities.
Not all customers warrant the same level of service, but it’s criticalto know who your high-value customers are. For instance, an Internet ser-vice provider (ISP) was planning to raise the level of customer serviceacross the board in response to complaints about slow problem resolution.We suggested a more strategic approach—basing service levels on eachcustomer’s value to the company. By analyzing each customer’s total rev-enue potential and strategic relationship value, the company learned thatjust 5 percent of its clients were high-value customers.
What these high-value customers wanted most was rapid problemresolution. Therefore, for this subset of customers, the company set up a customer care account team with highly trained technical people and adedicated account manager. For the remaining 95 percent of customers,service problems were routed to a separate, cost-efficient service center,with specific resolution pathways depending on the technical complexityof the problem.
Problem-resolution time for high-value customers was cut dramati-cally, with the percentage of problems resolved at first contact improvingfrom less than 5 percent to 80 percent. Even for the lowest-priorityaccounts, service issues typically were resolved on the same day. In addi-tion, the new setup reduced total customer care costs by 30 percent.
More important, the new service levels meant that the company wasbetter able to compete in its chosen market—a market increasingly madeup of sophisticated customers with higher service expectations.3
The lesson? Tailoring your customer service strategy to deliver thebest cost/service trade-off by customer segment can pay big dividends,especially as you design your supply chain for strategic advantage.
Asset NetworkThe final component of your supply chain configuration includes the deci-sions you make regarding your company’s asset network—the factories,warehouses, production equipment, order desks, and service centers thatmake up your business. The location, size, and mission of these assetshave a major impact on supply chain performance.
Most companies choose one of three network models based on suchfactors as business size, customer service requirements, tax advantages,supplier base, local content rules, and labor costs:
◆ Global model—Manufacturing of a given product line is done inone location for the global market. The choice of this model is
CHAPTER 1 Core Discipline 1: View Your Supply Chain as a Strategic Asset 19
driven by factors such as the need to colocate manufacturingwith research and development (R&D), the need to control unitmanufacturing costs for very capital-intensive products, or theneed for highly specialized manufacturing skills.
◆ Regional model—Manufacturing is done primarily in the regionwhere the products are sold, although some cross-regional flowsmay exist based on production-center specialization. Theregional model is often chosen based on a mix of factors, includ-ing customer service levels, import duty levels, and the need toadapt products to specific regional requirements.
◆ Country model—Manufacturing is done primarily in the countrywhere the market is. This is the model of choice for goods thatare prohibitively expensive to transport. Other factors includeduties and tariffs and market access that is conditional on in-country manufacturing.
Due to price competition, many companies are manufacturing inlow-cost countries to lower unit production costs. When choosing such alocation, key considerations include manufacturing costs, corporate taxrate, export incentives, the presence of key suppliers or duty-free imports,infrastructure, and skilled labor. While unit costs are important, supplychain leaders know that supply chain flexibility and total supply chaincost are also critical considerations when designing an asset network,particularly for products with highly variable demand and short productlife cycles.
China has emerged as a favored lost-cost manufacturing spot amongelectronics companies because of the presence of component suppliersand contract electronics manufacturers, as well as the quality of its infra-structure (roads, electricity, etc.). Although electronics assembly may takeonly one to two days, transporting goods by ship between China andEurope takes three weeks. Add to this the time needed to reach theregional or country distribution centers, and the total fulfillment cycle canbe six weeks. In a highly volatile market, these long fulfillment times can result in inventory that is out of sync with market demand—the prob-lem that Michael Dell designed out of his supply chain.
Companies can reduce this risk with several different options. Oneapproach is to increase manufacturing flexibility to ensure that the supplychain plan is refreshed weekly instead of monthly to better meet changingmarket demand. Another approach—in-market postponement—createsstandard products in the low-cost production center but does final config-uration and packaging at a distribution point closer to the customer. Yet
20 Strategic Supply Chain Management
another option is to move to a low-cost manufacturing base closer to thetarget market. For example, many companies serving the European mar-ket have moved production from Asia to central European locations suchas Romania and Hungary. This approach lowers both production costs andin-transit inventory levels.
The product life cycle drives many asset network decisions. In rapidlyevolving industries such as consumer electronics, companies may startwith a global model during new product ramp-up to test the manufacturingprocess or to benefit from colocation with R&D and then transition to aregional model to improve customer service. At the end of the product lifecycle, the global model once again may be a better choice as a way to ful-fill demand at the lowest product cost and inventory investment.
FOUR CRITERIA OF A GOOD SUPPLY CHAIN STRATEGY
The configuration components—operations strategy, channel strategy, out-sourcing strategy, customer service strategy, and asset network—are the fun-damental building blocks of your supply chain strategy. However, to driveforward your strategic business objectives and really gain a competitive edge,these components and the choices you make about each one must be
◆ Aligned with your business strategy◆ Aligned with your customers’ needs◆ Aligned with your power position (your influence)◆ Adaptive, because competitive advantage is temporary and market
conditions change
These four criteria may sound elementary, but few companies actu-ally follow them. In fact, the practice of developing and managing a sup-ply chain strategy is not widespread. Many of our clients over the yearshave had only the most rudimentary supply chain strategy process inplace, indicating that these concepts are either not well understood or dif-ficult to implement. Let’s examine them one by one.
Align with Your Business Strategy
Your supply chain strategy should directly support and drive forward yourbusiness strategy. We believe that an effective business strategy beginswith a core strategic vision (see Figure 1-3) that lays down the boundaryconditions for your business: what you are, what you’ll do, and—just asimportant—what you are not and what you won’t do.

CHAPTER 1 Core Discipline 1: View Your Supply Chain as a Strategic Asset 21
The core strategic vision clarifies the answers to key business strat-egy questions such as: What are your overall strategic objectives? Whatvalue do you deliver to your customers? How does your company differ-entiate itself in the marketplace? Unless the answers to these key ques-tions drive your supply chain strategy and configuration, your supplychain will be operating in a vacuum.
Here’s one example of many. We worked with an electronics com-pany that had spent millions to improve production and order-fulfillmenttimes. The company’s on-time delivery performance was excellent. Therewas only one problem—delivery performance was no longer the key toprofitable growth. Increased competition meant that customers weredemanding, and getting, lower prices. What’s more, a slowdown in severalof the company’s primary markets was cutting into revenues and sharplyreducing return on assets. The company’s president recognized the needto move to a much lower breakeven point, but supply chain operationswere focusing on yesterday’s priority—customer delivery excellence.
Where does this type of disconnect come from? Simply put, the newbusiness vision of the company’s president had not been translated intonew objectives for the supply chain. Although the overall business planclearly showed the volume and price declines and their impact on mar-gins, the implications for supply chain operations had not been consid-ered. It was only when the company began to lose money that a majorsupply chain reorganization occurred, which led to factory closures, facil-ity consolidation, and outsourcing of manufacturing.
F I G U R E 1–3
Boundary conditions of the core strategic vision.
Financial Goals
Core Competencies
Market Size and Competition
Competitive Situation
External
Internal
Customer Requirements
Key Business Policies
CoreStrategic
Vision

22 Strategic Supply Chain Management
Translating your business strategy into an effective plan of actionrequires communication and discipline. The matrix in Figure 1-4 offers aframework for thinking broadly about four typical ways that companiescompete—on innovation, cost, service, and quality—otherwise known asthe basis of competition. The matrix shows the key supply chain contri-bution for each strategy.
Some aspect of innovation, cost, service, and quality is a part ofalmost every company’s strategy. But leading companies focus on just oneof these as a primary strategy—their basis of competition for winning ina chosen market. From a supply chain perspective, each basis of competi-tion requires distinct structure, processes, information systems, and skills.
Competing on CostCompanies that compete on cost offer low prices to attract cost-sensitivebuyers or to maintain share in a commodity market. This strategydemands highly efficient, integrated operations, and the supply chainplays a critical role in keeping both product and supply chain costs down.The low-cost supply chain focuses on efficiency-based metrics such asasset utilization, inventory days of supply, product costs, and total supplychain costs. Product standardization and process standardization are criti-cal, as are supplier and production quality and inventory control.
F I G U R E 1–4
Supply chain contribution to business strategy.
Innovation
Cost
Service
Quality
Source ofAdvantage
PrimaryStrategy
Brand anduniquetechnology
Cost-efficientoperations
Superb service
Safest, mostreliableproducts
Basis ofCompetition
Desirable andinnovativeproducts
Lowest prices inthe product-category
Tailored to meetcustomer-specific needs
Product you cancount on
KeySupply ChainContributor
Time to marketand time tovolume
Efficient, low-costinfrastructure
Designed “fromthe customer in”
Supply chainexcellence andquality control

CHAPTER 1 Core Discipline 1: View Your Supply Chain as a Strategic Asset 23
Hewlett-Packard (HP) traditionally pursued an innovation-basedstrategy—until an upstart competitor changed the industry dynamics. In1997, HP and other printer manufacturers were taken by surprise byLexmark’s launch of a below-$100 printer. When Lexmark had doubledits market share by mid-1999, HP embarked on an ambitious programcalled “Big Bang” to sharply reduce product costs through new design andsupply chain changes. The goal? To compete directly with Lexmark onprice. “Big Bang” was a big success. By 2002, HP had won back its mar-ket share.4
Efficiency and low cost are good things—but not at the expense ofservice, innovation, or quality if one of those is a key element of your busi-ness strategy. Consider the low-cost offshore manufacturing that we dis-cussed earlier. Most apparel manufacturers outsource their production toSoutheast Asia, where contract manufacturers insist on fixed productionschedules to minimize costs. This low-cost approach also results in lowflexibility and can hurt margins at the retail level. If one style lags whileanother takes off, the retailers are limited in their ability to change volumesand mix. With too many of the wrong garments, the stores end up withmarked-down inventory and eroded margins. Too often the missed revenueand reduced margins associated with a poorly aligned supply chain strat-egy are not included when assessing the total impact of supply chain strate-gic choices.
Zara, the retailer owned by Spanish textile giant Inditex, chose a verydifferent model. Zara positioned itself as the designer-boutique alternativefor the price-conscious but trendy consumer. To deliver its strategy, it man-ufactures almost 50 percent of its garments in-house—an industry excep-tion. Although its manufacturing costs are15 to 20 percent higher than the competi-tion, Zara more than makes up for the costdifferential by using its supply chain toensure that merchandise in the storesmatches what customers want.5
Competing on InnovationCompanies whose primary strategy is inno-vation focus on developing categorykillers—“must have” products that benefitfrom significant consumer pull. And becausetheir products are category killers, thesecompanies can command a price premium,
Companies whoseprimary strategy isinnovation focus ondeveloping categorykillers—“must have”products that benefitfrom significantconsumer pull.

24 Strategic Supply Chain Management
the innovator’s advantage. Companies such as Sony, Nike, and L’Oréalseem to have a finger on the pulse of the consumer and are fast to marketwith new products that buyers want. The underlying source of power forsuch companies is unparalleled marketing and product development.
How does the supply chain support a company that competes oninnovation? For new products and services, the window of opportunity—before the fast followers start taking market share—can be small.Innovative companies are acutely aware of the benefits of getting into amarket early and gaining first-mover advantage, so new product introduc-tion (NPI) is key. By getting new products to market faster, the supplychain can boost revenues and profits. This is why it’s important for a com-pany with innovation as a primary strategy to integrate the supply chainwith the design chain, which we define as all the parties—both inside andoutside the enterprise—that participate in defining and designing a newproduct or service.
The challenge isn’t just time to market, however. Time to volume iscritical too. The faster a company can pump up production to meetdemand, the greater are the profits, and the less likely imitators are tocatch up. Creating strong demand for a new product and then being unableto meet that demand is one of the worst things that can happen to an inno-vation-driven company. Achieving that time-to-volume advantage is amajor competitive weapon.
Design chain/supply chain integration6 is critical to innovation-driven companies, ensuring the fast and sustainable launch of new prod-ucts. Moving from product development to volume production at the targetlevel of quality requires management of processes, assets, products, andinformation. Design chain/supply chain integration also ensures that whendemand cranks up, the whole supply chain is ready—that suppliers canhandle your needs, that order-management systems support the new prod-uct information, and that sales channels and service people are trained.
Consider again the example of clothing retailer Zara. While most ofthe industry focuses the supply chain on delivering the lowest purchaseprice, Zara’s supply chain supports its primary innovation strategy.Designers and planners use point-of-sale information to adjust productionplans and designs to focus on bestsellers. This translates into a muchshorter time to market, higher revenues, and fewer markdowns.7 Between2001 and 2002, when many fashion retailers were struggling to breakeven, Zara’s performance translated into steady double-digit growth andhealthy EBIT (earnings before income taxes) margins, growing from 18.1to 18.5 percent.8 By combining innovation and cost performance, Zara

CHAPTER 1 Core Discipline 1: View Your Supply Chain as a Strategic Asset 25
created an NPI-focused supply chain that delivers spectacular results forthe company and its investors.
Competing on QualityCompanies that compete on quality are known for the premium nature oftheir products and services, as well as consistent and reliable performance.Quality products include well-known names such as Lexus automobiles,Maytag appliances, and Tropicana juices. Product development is obvi-ously critical to quality, but so are key supply chain processes such asmanufacturing, sourcing, quality assurance, and return. And if a productis perishable or fragile, transportation and storage play an integral role.
One key supply chain attribute relative to quality is traceability—theability to trace a product back to its point of origin—a growing require-ment in a number of industries. Concerns about food safety and the boom-ing market for organic and “ethical” products mean that consumers wantto be able to trace a product from “farm to plate.” In the U.S. tire market,for example, traceability back to the point of manufacture is a legalrequirement. Moreover, counterfeiting has emerged in a growing numberof sectors, such as luxury goods, entertainment, and pharmaceuticals. Tooffset this risk, manufacturers increasingly use special tags, such as RFID(radio frequency identification), that identify merchandise as genuine andclosely control product flows to consumers.
The example of Barlean’s OrganicOils shows how a supply chain strategy candeliver quality as a basis of competition.Barlean’s is a $22 million family-ownedcompany that sells health supplements. Thecompany’s flagship product, flaxseed oil,outsells the competition 20 to 1. Freshnessmakes the difference. Barlean’s oil carriesa four-month expiration date, comparedwith other oils that can be up to fivemonths old before they even hit storeshelves. Barlean’s manufacturing and dis-tribution processes give the company itsedge. Conventional manufacturing tech-niques expose flax seeds to heat, light, air,and overpressing, all of which compromisequality. Barlean’s designed a manufactur-ing process that protects its seeds from the
One key supply chainattribute relative toquality istraceability—theability to trace aproduct back to itspoint of origin—agrowing requirementin a number ofindustries.

26 Strategic Supply Chain Management
elements. The company doesn’t even press the seeds until an order comesin—a “press-to-order” production method. Barlean’s also uses ExpressMail to ship orders so that they arrive faster and fresher—a more expen-sive choice, but one that further supports the company’s commitment toquality. In the crowded health supplements market, Barlean’s uses thesupply chain to deliver on its commitment to quality, profitably growingsales every year by 40 percent since 1999.9
Competing on ServiceCompanies that compete on service tailor their offerings to their cus-tomers’ specific needs and are known for exceptional customer service.These companies customize their products and services to build customerloyalty and lock in repeat sales. To excel at service, all of a company’scustomer-touching processes and information systems such as order cap-ture, order fulfillment, and invoicing must be fast, consistent, and trouble-free. The ability to integrate internal processes and systems with those ofkey customers is a core skill.
Our research shows that best-in-class deliver companies—those withexceptional order-fulfillment processes overall—are more than 20 percentmore profitable than average companies and are growing their top-linesales 25 percent faster.10 Why does better service lead to such strikingfinancial gains? On a basic level, companies with superior customer ser-vice processes avoid the costs related to expediting and the short-termchurn that other, less adept companies face.
On a more strategic level, companies that excel at customer servicedevelop the ability to segment their customers. They understand the rela-tionship between cost to serve and profitability and can assess the cost ofoffering customized services. As a result, they avoid offering customizedservices to customers who don’t meet hard business criteria. They alsotend to focus on the higher-value segments of an industry and on devel-oping relationships with their priority customers, resulting in loweraccount turnover and a decrease in customer retention costs—all of whichadd to the bottom line.
A case in point is Shell Chemical. It offers its manufacturing cus-tomers an inventory-management solution called SIMON (supplier inven-tory management order network) that simplifies their purchasing processand cuts costs from the supply chain at the same time. With Shell’s auto-mated replenishment system, customers no longer place orders, run out ofinventory, or build “safety cushions” of stock. Instead, they’ve integratedtheir information technology (IT) systems with Shell’s so that they can

CHAPTER 1 Core Discipline 1: View Your Supply Chain as a Strategic Asset 27
share information. Every night, data on consumption, inventory levels,and usage forecasts are recorded at the customer’s site and forwarded toShell. At predetermined inventory trigger points, Shell places a refill orderfor the customer, schedules order transport, and tracks the shipment untilit arrives. The system is invoiceless. Each month, based on consumptionfigures that both parties share, the customer sends payment electronically.
Shell’s solution makes life easier for everyone. By cutting adminis-trative costs for customers and the safety cushions of stock that result fromforecast uncertainty, the solution reduces the total amount of inventory inthe supply chain and vastly simplifies inventory management. Shell gainsan added bonus. In exchange for using the company’s service, andbecause the solution couldn’t work if inventory from different supplierswere mixed in the same tanks, customers agree to use Shell as their exclu-sive vendor for products managed under SIMON. By offering a value-added service and integrating with its customers’ IT systems, Shell is ableto forge extremely tight relationships with its customers—a powerful sup-ply chain-driven, strategic advantage.11
The best companies understand that they can’t be all things to allpeople. They identify how they will differentiate themselves and drivetheir supply chain to best-in-class performance for that basis of competi-tion. This sharp focus sets them apart from the competition and helps themgain a competitive edge.
The supply chain supports every business strategy, so make alignmenta top priority. Remember, though, that strategy is a balancing act. No costleader can afford to ignore customer service. Nor can an innovator ignorethe price ceiling of a market. Supply chain performance leaders understandthe trade-offs among service levels, lead times, assets, and costs and makedecisions that best fit their overall strategic mission. By choosing where tofocus and achieving best-in-class supply chain performance in those keyareas, companies can set themselves apart from the competition.
Align with Your Customers’ Needs
Barlean’s Organic Oils identified freshness as a key differentiator. ShellChemical realized the advantage of providing a new service concept to itscustomers. Zara understood the market for high fashion at attractive pricepoints. Each of these companies identified solutions that would create acompetitive advantage and aligned their supply chains accordingly.
Do you really know what your customers want? Are there opportu-nities that you’re not exploiting simply because you can’t envision them?

28 Strategic Supply Chain Management
Answering these questions can be a challenge. Often our assumptionsabout what customers want are wrong. Just as often customers areunaware of or can’t fully articulate their needs. Voice of the customer(VoC) is a methodology we use that helps our clients really listen to theircustomers and understand their environment. VoC can help uncover andtranslate customer needs into requirements for new products and servicesthat leverage your existing supply chain capabilities or pinpoint changesyou can make to exploit new business opportunities.12
Aligning with customer needs also means identifying the particularrequirements of different market segments. As we shall see, Michelin’spassenger-car tire business has two different market segments—automo-bile makers and the after-market customers. The automobile makers arefar more demanding, requiring that tires be delivered directly to theassembly lines right on time because any delay can back up productionschedules. Besides being more demanding, the automobile makers deliveronly razor-thin margins, compared with healthier margins for the less-demanding replacement market. Thus, you’d think that the after-marketsegment would be a priority, right? Wrong. Tire manufacturers such asMichelin always put the automobile makers first because being on a newcar creates a pull for replacement sales and because supply contracts contain severe penalties.
If you’re a tire manufacturer, you have to play according to theautomobile makers’ rules. If reliability and timeliness are key customerrequirements, as they are for manufacturers such as Michelin, then you’llmake it a priority to continually improve all the supply chain activitiesthat support those performance goals—or pay the price with high levelsof finished-goods inventory.
If customers don’t get what they need, you’ll lose market share. Ifyou don’t know what your customers want, then, ask them. Or use VoCto find out. And check back periodically to understand how their needsare changing.
Multiple Segments, Multiple Supply Chains?For some companies, one supply chain with a single set of physical assets,processes, and information systems makes the most sense, even with dif-ferent products, suppliers, and customers. A company with very flexibleoperations can “design anywhere, build anywhere,” so product assignmentsare made based on available capacity, product costs, and target markets.
Some companies, however, find that they can serve their markets bet-ter with separate supply chains. Why? Different products, market segments,

CHAPTER 1 Core Discipline 1: View Your Supply Chain as a Strategic Asset 29
or regions may call for very different approaches. Or separate business unitsmay want their own supply chains so that they can have the business con-trol needed to achieve their specific business objectives.
There are inherent risks in trying to manage disparate requirementssuch as increased complexity, increased costs, or unmanageableprocesses, organizations, and information systems in one total supplychain. When managed correctly, however, these risks can be mitigatedwhile achieving significant benefits through tailoring key supply chainsteps to enhance specific business unit (or product line) performance.
One positive example of this approach is Seiko Epson Corporation’s(Epson’s) European Group company. Epson is a global leader in printer andimaging products for both home and business based on its strong technol-ogy, brand recognition, and reputation for quality. Behind Epson’s overallleadership on imaging products there is a wide range of diversity of tech-nology within its product portfolio. Products include inkjet printers, scan-ners, laser products, ink and toner cartridges, point-of-sale printers, andliquid-crystal display (LCD) projectors, to name a few.
The back-end supply chain for these various product lines and busi-nesses is often made up of separate global supply chains, each with itsown suppliers, factories, and logistics routings. But the front end of thesupply chain—encompassing the processes that touch the customer, suchas order management and distribution—is common. This derivativeapproach allows Epson to optimize its back-end supply chain and gainsubstantial efficiencies in the production processes of its varied products.It also ensures that its customers interact with “one Epson” at the front endand can easily do business with Epson regardless of the mix of productsthey wish to purchase. According to Ramon Ollé, Epson Europe chairmanand chief executive officer (CEO), this combination allows Epson toachieve an overall efficiency in its end-to-end supply chain while increas-ing customer satisfaction.
Another example is Michelin. A capital-intensive manufacturer,Michelin uses the same factories for customers in both its automobilemakers’ segment and the after-market segment to increase capacity uti-lization, along with a single production planning process. Once the tiresleave the factory, however, everything else—from demand planning, orderentry, and shipping to invoicing and warehousing—is different. The com-pany uses two separate supply chains to meet the needs of two differentmarkets. For automobile makers, the company delivers tires to mountingcenters, which move them directly to the assembly line, because timeli-ness and reliability are critical. By contrast, tires for the after-market are

30 Strategic Supply Chain Management
shipped to distributors and a variety of retailers, such as auto repair shops,car dealerships, and other retail outlets, where on-time delivery is less critical because most hold some level of inventory.
Companies with both new product sales and after-sales support busi-nesses often have different supply chains. Besides managing different activ-ities, such as returns, repairs, and refurbishment, the after-sales supportsupply chain must meet very different customer service expectations.Although new product sales and after-sales support are usually structured astwo distinct business units, both typically use the same production centers togain economies of scale. Yet customer-facing processes, including demandplanning, order entry, and invoicing, are tailored to the two different markets.
If your company has multiple business units, identify your greatestpoint of shared leverage and use that as a starting point. For Michelin’spassenger car business, the answer was raw materials and manufacturingassets, so the company structured its supply chains accordingly. If you canstandardize within a single supply chain and avoid additional fixed assetsand unnecessary variations in processes and information systems, do so.
If different processes or multiple locations performing similar activ-ities are the result of acquisitions or historically independent geographicor business units, check to see if these duplications are still needed. Inmany industries, converging customer requirements and the emergence ofregional and global logistics service providers have opened the door tomore streamlined and standardized supply chains. Leverage any synergiesthat you can.
Here’s a general rule of thumb: If you can meet the needs of yourmost profitable customer segments at an acceptable service level and at areasonable cost with a single supply chain, then do so. If supply chain per-
formance targets such as cost, lead time, anddelivery for different products or marketsegments are truly at odds with each other,or if business control is an issue, then con-sider partially or completely separate supplychains.
Align with Your Power Position
A good supply chain strategy is grounded inan understanding of your power and influ-ence relative to customers and suppliers.Why is this so important? Your relative
A good supply chainstrategy is groundedin an understandingof your power andinfluence relative tocustomers andsuppliers.

CHAPTER 1 Core Discipline 1: View Your Supply Chain as a Strategic Asset 31
power determines what can be achieved realistically in terms of reconfig-uring the supply chain to meet your overall strategic objectives.
The reality is that many of the supply chain innovators you readabout are in an enviable position: They’re big, with enormous marketclout. But not every company is a Wal-Mart, able to strong-arm its sup-pliers to eliminate inefficiencies. When it comes to making fundamentalchanges in your extended supply chain, you need to understand how muchpower and influence you really have.
Scale matters. Big companies can leverage their volume of output tobuy inputs more cheaply, boost asset utilization, and reduce the cost ofeverything from information systems to transportation. Just as important,they can impose their own processes and rules on suppliers and customers.In the automobile industry, any supplier who shuts down the productionline by not delivering on time can be subject to a penalty up to the equiv-alent of the revenue lost while the line is down. It’s written into the sup-ply contract. Of course, not every company can do this. It requirespower—the power of scale.
Companies with scale can exercise a high degree of control over thesupply chain and structure it in a way that supports their own strategicobjectives. When a company is bigger than its suppliers or its customersand they need it more than it needs them, the company calls the shots. Butscale is relative. Companies often underestimate their own power becausethey’re thinking in broad, global terms instead of narrowing their scope toa country or market segment. Even relatively small companies can findways to work strategically with select suppliers or customers to gain acompetitive edge. The key is to segment, focus, and consolidate.
If you’re not a priority for your suppliers and aren’t getting adequatecollaboration and service, rethink your supplier relationships. Considershifting the power equation by focusing on a few, smaller suppliers andgiving them an opportunity to grow their business in exchange for work-ing with you more collaboratively over time to cut costs, boost efficiency,and improve overall performance.
Brand also can be a major source of supply chain power, especiallyin the consumer markets. If your products are highly desired by con-sumers, you’ll have more clout with retailers and other channel partners.Think of Louis Vuitton bags or Rolex watches. Lack of availability onlyheightens the brand’s prestige. Customer service, fast delivery, or squeez-ing out supply chain costs and inefficiency can seem irrelevant to compa-nies with the hottest brands or products. Buyers of highly desirableproducts have learned to wait—and to pay a premium.
32 Strategic Supply Chain Management
Make sure that you understand your relative position before trying toexercise your supply chain power. Even consumer packaged-goods brandleaders, those whose product dominates a product category, are modifyingtheir physical logistics to satisfy the demands of key retail accounts.Manufacturers that occupy the less desirable second position on theretailer’s shelf typically have to go even further to contribute to the logis-tics efficiency of their key accounts by, for example, modifying productpackaging and providing very high supply flexibility. The hard reality isthat second-tier branded-goods suppliers just don’t have the supply chainpower of category leaders. Changes to their supply chain must accommo-date the retailer requirements, even to the detriment of manufacturer sup-ply chain cost and inventory performance.
When you’re developing your supply chain strategy, take some timeto assess the situation. Is your supply chain brand-led, channel-led, or sup-plier-led? Do you need your channels more than they need you? Howabout your suppliers? Who has the power? If you’re a supplier in an indus-try that’s fragmented on the sell side but concentrated on the buy side, likethe automobile industry, your power may be limited. The same is true ifyou’re one buyer among many in an industry with just a few suppliers—such as an electronics buyer of specialty components.
As we’ve seen from these examples, supply chain control is a possi-bility. For most companies, though, collaboration is the best bet. Therefore,analyze your position in the supply chain. Explore how you can rethinkyour interactions to cut costs, eliminate inefficiencies, boost satisfaction, oradd value. And since collaboration is tough to do well, pick your targetscarefully. Focus on key customers or suppliers, and look for opportunitieswhere collaboration will have a real strategic impact (see Chapter 4 on theFourth Discipline).
Become Adaptive
Change is a given. Market conditions shift, business strategies evolve, andnew technologies emerge. If you’re not paying attention, your supply
chain can get out of sync. Your supply chainstrategy, just like your business strategy, hasto adapt.
Although change is constant, the fre-quency of significant change will differ byindustry. In the PC industry, companiesmake fundamental changes to their supplychains about every three to five years, driven
Your supply chainstrategy, just like yourbusiness strategy,has to adapt.

CHAPTER 1 Core Discipline 1: View Your Supply Chain as a Strategic Asset 33
by the constant pursuit of lower costs and the need for rapid new productintroductions. Companies have adopted new operating strategies such asmake to order, white-box packaging, and resale from low-cost producersand are opening their own stores, selling directly through the Internet, andexploring other new channels.
In other industries, such as aerospace, fundamental supply chainchanges can occur less often—every 10 years or so—and have major con-sequences. Consider the supply chain strategies of Boeing and Airbus.Airbus’s network of partners delivers finished subassemblies direct to thecompany’s assembly line in Toulouse, France, where fewer than 500workers do final assembly.13 Airbus’s production model requires lowercapital spending, spreads development risks, and leverages the know-howof many partners.
Boeing today is in a state of continual change. The company isachieving marked improvements in efficiency by reducing its supply baseand is working within the company and with suppliers to implement tech-niques of lean manufacturing. At the same time, the company is involvingmore risk-sharing supplier partners in its business and making greatprogress toward large-scale systems integration.
Given the major changes experienced by the airline industry in thelate 1990s and early 2000s, including bankruptcies, mergers, and acquisi-tions, and the impressive growth of low-cost carriers, it is likely that thesupply chain strategies of major commercial aircraft manufacturers willevolve further to meet the airline industry’s demand for cost-efficient solu-tions and to deliver profitable growth.
Both internal and external factors determine your supply chain’sshelf life and can trigger a need for a change in configuration. These fac-tors include
◆ A new technology that transforms the dynamics of your industry.The Internet, for instance, created a direct link to customers sothat companies such as Amazon could sell direct and cut out themiddleman.
◆ A change in the scope of your business. If your company is offer-ing new products or services, targeting new markets, or expand-ing geographically, you may need to expand your manufacturingcapacity, add new distribution capabilities, develop new chan-nels, find new suppliers, and rethink your supply chain strategyoverall.
◆ A change in your basis of competition. Perhaps a new competitorhas emerged with a stronger value proposition, or you need to
34 Strategic Supply Chain Management
change the type of service you offer to increase market share, oryou want to compete in a new market that requires faster deliv-ery, greater flexibility, or higher quality. Any major change toyour company’s basis of competition should drive a reexamina-tion of your supply chain strategy and components.
◆ The need to assimilate a new acquisition. Mergers and acquisi-tions can create a need to reconfigure the supply chain. You’llhave to see where it makes sense to eliminate redundancies,where to keep operations separate, and where to integrate.
A company’s growth trajectory can have major implications, too. Isyour sales volume increasing or decreasing? Is your industry expanding orcontracting? An organization and processes designed to manage and sup-port a growing company may no longer be appropriate during retrench-ment, when the focus is on cost control. In either case, your company mayneed to adjust supplier requirements and resize fixed assets.
As an example, consider Nokia. Nokia Mobile Phones was facing acrisis in 1995–1996. After ending 1995 with a massive shortfall in prof-its versus plan, the business was operating at a loss in early 1996, withcosts spiraling out of control. Business conditions weren’t good either,with a sales slowdown and continuing handset price erosion. Pekka Ala-Pietala, Nokia’s president, announced the need to move the company’sfocus from market share to profitability. Specifically, the company had toreview its product portfolio with a critical eye and take actions on a num-ber of supply chain issues, including product quality, forecasting, andmanufacturing productivity. As Nokia discovered, producing 100,000mobile phones a month is not the same as producing 100,000 phones aday. Explained Pertti Korhonen, vice president of global logistics at thetime, “We weren’t ready for the transition to a high-volume business andrapidly found ourselves with excess inventory and quality problems withkey suppliers.”
Nokia turned the situation around by implementing new supplychain disciplines in Europe, Asia, and the United States that includedimprovements in manufacturing productivity and quality, supplier devel-opment, supply chain planning, and integration. The results were impres-sive. For example, on-hand inventory was reduced from 154 to 68 days innine months, releasing €450 million in cash. Taken together, these actionsput the company back on track for profitable growth. Supply chain exper-tise was developed and maintained to build a foundation for future growth.Today, Nokia’s supply chain is recognized by the rest of the industry as atrue source of competitive advantage.14
CHAPTER 1 Core Discipline 1: View Your Supply Chain as a Strategic Asset 35
Cisco is another interesting example. In May 2001, Cisco shockedthe markets by announcing a $2.2 billion provision for inventory write-offs.15 As the star player of the fast-growing networking equipment sec-tor, Cisco had developed a reputation as one of the most savvy supplychain managers in the world. Outsourcing partners provide Cisco withmanufacturing, materials management, warehousing, and transporta-tion services, allowing the company to focus on its core strategy ofrapid innovation and rapid growth—without increasing fixed assets. In2001, when the whole networking equipment sector experienced anunprecedented collapse in demand, few expected that Cisco would suf-fer as much as other industry players. But the company had built a com-plex global supply chain without robust supply chain planning betweenitself and its partners. This led to duplication of planning based on “sec-ond guess” estimates and an inability to see and respond quickly tochanges in market demand, which resulted in excess inventory acrossthe supply chain.
To minimize the impact of future boom-bust scenarios, Cisco turnedto a private Internet-based network called eHub. The result was an innov-ative, shared environment with top-tier suppliers, distributors, and con-tract manufacturers.16 In so doing, Cisco hopes to build one of the mosteffective supply chain networks in industry.
Given the dynamic nature of industries, businesses, and productlife cycles, creating and putting in place a supply chain strategy are notan annual or biannual exercise but an ongoing orchestration of deci-sions and actions. New opportunities and threats emerge every day. If you can’t keep up with these new realities, you risk becoming a footnote in some dusty management text. It’s also a fact of life thatmajor supply chain innovations can be copied. Even if you’re first outof the gate, your edge will dissipate with time. So stay vigilant, and keep looking for ways to improve and differentiate your supply chain performance.
As shown in Figure 1-1, a supply chain strategy involves many inter-locking facets and hundreds of decisions, large and small. Michael Porter,strategy guru and author of Competitive Advantage, discusses the notionof fit—when a group of activities all support a chosen competitive strat-egy. Any single activity can be copied, but taken together they form a sys-tem that is virtually impossible to duplicate.17 The same concept holds truefor your supply chain strategy. Taken together, the choices you make cre-ate a supply chain that is uniquely yours—and tough for others to repli-cate. And that’s a source of competitive advantage.
36 Strategic Supply Chain Management
NEXT-GENERATION STRATEGY
Today’s supply chain architectures are designed predominately for excel-lence in cost reduction through a focus on back-end processes, such aspurchasing, manufacturing, and physical distribution. This can translateinto efficient supply chains that often don’t truly support overall businessstrategy.
Next-generation supply chain strategies will support continuingimprovements in productivity but also will drive the achievement of busi-ness-level outcomes—with a strong focus on the customer. It will beimportant in the future to identify these objectives, which will includenew revenue-generating services and time-to-market, time-to-volume,and customer-segment-specific capabilities.
In the future, supply chain strategy also naturally will consider thesupply chain as part of an extended business architecture and considerkey targeted outcomes with suppliers, customers, and partners as coreelements. We expect to see the changes shown in Figure 1-5.

CHAPTER 1 Core Discipline 1: View Your Supply Chain as a Strategic Asset 37
F I G U R E 1–5
Next-generation characteristics of supply chain strategy.
Theme
Supply ChainStrategy Scope
Supply ChainStrategyContent
Supply ChainSupport ofOverallBusiness Strategy
Supply ChainSegmentation
Cross-EnterpriseExtension
Current DominantPractice
Focus is on the internalorganization
Focus is on functionalexcellence, withcorrespondingemphasis on functionalmetrics such as unitmanufacturing costsand purchasing pricevariance
Supply chain strategy isfocused on core (plan,source, make, deliver,and return) capabilitiesand performanceobjectives
One supply chainmodel (a set of supplychain capabilities andperformanceobjectives) is dominant,with alternativeapproaches managedon an exception basis
External relationshipswith customers andsuppliers are managedusing existing roles,processes, and metrics
Next GenerationDominant Practice
Focus is extended to keycustomers and suppliers
Functional strategies areintegrated as part of the overallsupply chain strategy toachieve enterprise-levelperformance improvements inareas such as supply chainmanagement costs, orderfulfillment lead time, on-timedelivery, and inventory days ofsupply
Supply chain capabilities andperformance objectives arealigned with marketing andsales, technology, service, andproduct development strategies
Multiple supply chain modelsare developed and optimizedbased on customer andsupplier segmentation
Effective external relationshipmanagement is nurtured as acore competency and enabledby new roles, processes, andmetrics

This page intentionally left blank.

Autoliv Profile: Applying Rocket Scienceto the Supply Chain
Through rapid growth and acquisitions, Autoliv captured a third of theglobal airbag market. But constant price pressure from the automakersand the economic slowdown of the late 1990s stretched the company’ssupply chain to the breaking point.
Stockholm-based Autoliv is the world’s largest manufacturer of auto safetysystems. The company operates in 30 countries, developing and producingairbags, seatbelts, safety electronics, antiwhiplash seats, and related safetysystems and components for all the major automotive makers worldwide.Autoliv employs 35,000 people and posts annual sales in excess of $4 billion.
Autoliv’s current global operation was created in 1997 by the mergerof Autoliv AB of Sweden, then Europe’s leading automotive safety com-pany, and U.S.-based Morton ASP, the largest airbag manufacturer inNorth America and Asia. Innovation is Autoliv’s hallmark. From its pio-neering work in seatbelts in the 1950s to the first antisliding airbagslaunched in 2002—to keep drivers from slipping down under the dash-board in a head-on crash—Autoliv is responsible for nearly every majorinnovation in automotive safety systems.
During the 1990s, the business units that now make up Autoliv pros-pered as safety became a strong selling feature in the minds of car buyers.Led by the marketing strategies of Volvo and Chrysler and then driven bygovernment regulations, airbags evolved from a luxury item in high-endvehicles to standard equipment for nearly every car on the road. Autoliv
39
Copyright © 2005 by The McGraw-Hill Companies, Inc. Click here for terms of use.

40 Strategic Supply Chain Management
grew with that trend, but it was growth that came with significant priceerosion in its core products as airbags moved from a specialty item thatcould command a premium to near-commodity status.
By 1998 it was clear that Autoliv was under stress. It faced annualprice reductions for its products, mandated by the clout of the big auto-motive makers. Autoliv’s supply chain, which ran through numerous inde-pendently operating business units with disparate systems and processes,was having trouble meeting customer requirements for production anddelivery. Then the economic slowdown at the end of the decade hit theautomotive industry, and demand for Autoliv’s products softened.
With price and demand trending down, Autoliv needed to find majorcost savings to remain profitable and generate enough margin to fundinnovation and maintain shareholder value. Most important, it had to cutcosts without eroding the quality of its products.
Mindful of the magnitude of the chal-lenge, the company saw its supply chain asthe key strategic asset that it could use toachieve its business objectives. “One of themajor drivers in our business, and really the thing that differentiates us, is our highstandard for quality and performance,” saysNorm Markert, president of Autoliv NorthAmerica. “We’re not making a cosmeticelement of the vehicle. This is about lifeand death. So we need to have an extremely
high level of performance, and we understand that the robustness of oursupply chain is vital to that performance.”
Beginning in 1998, Autoliv embarked on a strategic supply chain ini-tiative that would change the way the company does business. The changebegan at Autoliv’s operations in Utah. The results were so stunning thatthe new operating paradigm, dubbed the Autoliv Production System(APS), is now being rolled out around the globe. “The way we are build-ing equipment today is different [from] the way we built it a year ago, andthat change is giving us competitive advantage,” Markert says.
ACTUALLY, IT IS ROCKET SCIENCE
Autoliv’s largest airbag assembly plant is in Ogden, Utah. The plant pro-duces more than 13 million airbag modules a year, supplying automotivemakers in North America and Asia. The Ogden plant sits at the end of a
By 1998, Autolivrealized that it had tocut costs withouteroding the quality ofits products.
AUTOLIV PROFILE: Applying Rocket Science to the Supply Chain 41
50-mile supply chain linking operations that handle bulk chemicals, tex-tiles, and sophisticated electronic components. The Utah facilities wereMorton plants prior to the merger, and they trace their roots to the rocketfuel industry. Morton ASP spun off from Morton Thiokol, which builtsolid rocket boosters for NASA. Looking to expand into new markets,engineers at Morton Thiokol began exploring airbag technology as a newuse for the company’s rocket fuel.
An airbag works by the split-second inflation of a textile cushionthat, in turn, softens the blow of passenger impact during a crash. Thetechnology required to inflate that cushion precisely when needed, at theright internal pressure, in time to protect the occupants of a car in a crashis the core element of an airbag system. Morton used its chemical exper-tise to develop an inflator that was, essentially, a small rocket enginemounted within the steering wheel. During an accident, electronic sensorssignal the airbag to deploy, starting a pyrotechnic chain reaction. The gasgenerant pellets inside the inflator burn, generating a rush of exhaust gas that inflates the airbag.
In Utah, Autoliv runs a chemical plant that produces combustiblefuel for the airbag systems. The fuel is trucked to a facility where Autolivmanufactures the inflators. Then the inflators are shipped to Autoliv’sassembly plant in Ogden, where they are integrated with textile cushionsand numerous electronic components to create complete airbag modulesfor installation in vehicles. This supply chain worked well for years, butin the mid-1990s Autoliv’s Utah operation reached the limits of its abilityto improve. Autoliv was no longer seeing progress in its key operationalmetrics, such as defect rate, inventory turns, labor minutes per part, leadtime, and the like. With annual price reductions built into its customercontracts, the company could not afford to plateau.
Realizing the dilemma, Autoliv embarked on several internal projectsin the mid-1990s to boost efficiency and reduce costs at its Utah opera-tions, but none yielded the desired results. In 1998, the company lookedoutside for help. It turned to one of its most successful customers, Toyota,which was well established as a pioneer in efficient manufacturing.
Autoliv had a long-standing relationship with Toyota and by 1998 wassupplying the automobile maker with nearly 70 percent of its airbag require-ments, even though Autoliv faced growing difficulties in getting Toyotaexactly what it needed, when it needed it. When Autoliv asked for assistance,Toyota was quick to agree. The automobile maker sent one of its top manu-facturing experts, Takashi Harada, to Utah for two years to work with Autolivmanagers and teach them the fundamentals of the Toyota Production System.

42 Strategic Supply Chain Management
Toyota paid Harada’s salary while on assignment at Autoliv becausethe automobile maker believed that helping a key supplier adopt and adaptbest practices for manufacturing ultimately would be to its benefit. Withinthree years of Harada’s arrival in Utah, Autoliv’s manufacturing processwould be completely transformed. The changes began on the shop floor inOgden and rippled back to reshape the company’s internal and extendedsupply chains.
CHOPPING UP THE ASSEMBLY LINES
The Ogden plant was designed originally with 200-foot-long assemblylines. Conveyor systems moved components through the long, linear production process. The lines built airbag modules in large batches.Automated storage and retrieval systems moved 500-pound containers ofparts, delivering them from stock areas to stations along the productionlines, where they sat until needed. The assembly lines were grouped bycustomer and tooled up for the needs of that particular automobile maker.
No two cars use the exact same airbag system—not even very simi-lar cars such as the Chevrolet Camaro and the Pontiac Firebird. And sub-tle variations in design create different crash profiles, requiring differentairbag system configurations for every car model. As a result, the produc-tion process at the Ogden plant uses hundreds of parts and is subject tofrequent changeover, depending on customer demand.
Modeling itself after the Toyota system, Autoliv chopped up thoseassembly lines and converted the plant to clusters of 20-foot, U-shapedmanufacturing cells. Each cell contains all the connected processes thatproduce a particular airbag module. A typical cell is staffed by four or fiveworkers, all cross-trained to handle each job in the cell. The cells aregrouped by product and customer, with significant cross-training amongworkers on related cells, so shop-floor managers can shift resources tocells where customer demand is the highest.
Gone is some $15 million worth of automated equipment Autolivhad installed to supply the old assembly lines. Now the manufacturingcells are supplied by tuggers delivering small-quantity totes, with eachtote containing everything needed for the processes in the cell. When atote is opened and its contents removed for assembly, an electronic signalis sent back to the supply area so that another tote can be sent to replen-ish the cell. Based on the kanban system developed in Japan, the wholeidea is to pull one product through the plant at a time, driven by actual cus-tomer demand. It’s build to order, not build to stock.

AUTOLIV PROFILE: Applying Rocket Science to the Supply Chain 43
The cell system carries several important advantages. Moving fromlarge-batch production to the very small batches built in cells dramaticallyincreases the plant’s flexibility to change from one product mix to another.The bigger the batch run, the more materials are involved, and the longerit takes to change. It’s comparable to the difference between turning acruise ship around and turning a racing car around. “The ability to changeover to a new product quickly drives up our asset utilization, drives downlead time, and improves space utilization in our plants,” Markert says.
The visual cues inherent in small-cell production have a tremendousimpact on efficiency. On a long assembly line designed to build product inlarge batches, it is impossible actually to “see” the totality of the produc-tion process in one glance. This lack of visibility of materials and con-nected processes made it difficult for Autoliv managers to know how muchmaterial was on the floor at any one time and how much needed to beordered to fulfill customer demand. The plant’s legacy enterprise resourceplanning (ERP) system was running daily, batch-oriented reports, so real-time production data were not available continuously to help managersspot anomalies. As a result, often there were times of excess inventory bothof materials and of finished goods, and there were frequent unexpectedshortages that forced Autoliv to scramble and ship parts by special freightto avoid shutting down a customer’s assembly line.
In contrast, small-cell configurations allow workers and productionmanagers to see the entire manufacturing process at a glance. They can seeproblems arise and act immediately to address them. The new system makesit much easier for Autoliv to set and monitor precise standards for time andmaterials in each cell. “Having standards and visual cues is important, so youcan tell normal from abnormal,” says Tim Ambrey, production control man-ager for the module facility in Ogden. “The big principle here is having a sys-tem in place whereby I can see, just by walking around and looking, if thereis an abnormality that needs to be addressed. If I have a criterion for ship-ment five times a day, with 100 parts in each, and I walk by the loading dockand can see more than 100 parts in a lot, I know there’s an abnormality.”
Autoliv also has invested in new software that builds on its ERPbackbone and provides a continuous flow of production data, monitoringmaterials as they move through the plant, in order to help manage inven-tory in near real time instead of by daily reporting. The production data areintegrated with advanced forecasting and planning modules, which Autolivis now implementing globally.
The sequencing of production cells and the design of the componentsthat are assembled in those cells are also vital to the flow of Autoliv’s new

44 Strategic Supply Chain Management
system. “Our goal is to minimize what’s special and increase what’s stan-dardized,” Markert says. “When you standardize something, you takedown cost and reduce cycle time. For each piece we use, we work to buildin standard interfaces to enable quick changeovers.”
Essential to this approach is collab-oration between the people who build the products and the engineers who design the products (both internal and from the sup-ply base). Cross-functional teams are set upto make sure that new products are designedwith standards that increase modularity andfit well into the APS. In that process, Autolivincludes early input from people who actu-ally will build the airbags. “Before we bringa new product to the floor, we have celldesign workshops where the product designengineers, the process engineers, the machinepeople, and the production people gettogether as a team and design the production
line,” says David B. Johnson, forecasting and planning manager forAutoliv’s Airbag Module Facility. “Who better than the operators to tellyou what works well and what doesn’t? They know what motion is hard todo or what process produces a lot of scrap. We’re getting user input, andsome of the better improvements we’ve seen on the floor have come fromthose line operators who are doing the work day in, day out.”
After the new production system was fully operational at the Ogdenplant, the results were dramatic. Defect rate for parts shipped to the cus-tomer dropped 67 percent over two years. Inventory turns increased by 79percent. Productivity improved 45 percent by reducing labor minutes perpart. Total cost per unit dropped 30 percent over four years. Tonnageshipped to landfills was reduced by 41 percent.
The early success in Ogden prompted Autoliv to implement the newproduction system at its Utah inflator plants, with similar results. Thecombined accomplishments of the inflator and airbag assembly plantsearned Autoliv the 2002 Shingo Prize for Excellence in Manufacturing.
THE UPSTREAM IMPACT ON SUPPLY
Seeing its supply chain as a strategic asset is nothing new for Autoliv. Thecompany has a history of long-term productive relationships with its sup-
“Our goal is tominimize what’sspecial and increasewhat’sstandardized,” saysNorm Markert,president of AutolivNorth America.

AUTOLIV PROFILE: Applying Rocket Science to the Supply Chain 45
pliers. “Our supply base represents over 60 percent of the total manufac-turing costs for our products,” says Markert. “So we recognize [that] ourextended supply chain is vital both from a day-to-day operations senseand for our future process and product development.”
For years, Autoliv used all the tradi-tional approaches to manage its extendedsupply chain. Commodity teams aggregateddemand across business units and monitoredthe global supply markets. Prospective sup-pliers were qualified carefully, and onceengaged, their performance was monitoredclosely. To support Autoliv’s transformationto the new production system modeled afterToyota’s, however, the company’s supplychain strategy had to evolve.
Beyond just tracking cost and performance of each component ofthe supply chain, Autoliv had to expand its focus and look at the biggerpicture—the total cost of ownership of its products and the flow of goodsand information from one end of the supply chain to the other. “What weare finding, in many cases, is that there is not a lot of money to be savedin individual parts. The real money to be saved is in the interfaces alongthe supply chain,” Markert says. “There are trade-offs that can be made torealize substantial savings in a system that aren’t readily apparent whenyou are looking at a component level. So that has led us to increased col-laboration, both within the company and with our supply base, to iden-tify these interface costs and take them out of the supply chain.”
For example, Autoliv’s inflator business and its airbag design andassembly business had always operated separately. The inflator unit“sold” products to the airbag unit, and that was the essence of their rela-tionship. The units each worked to cut costs and maximize efficiency, buttheir individual strategies did not align for the overall benefit of the com-pany. Design changes were made in the inflator technology that savedpennies but forced the airbag designers to make changes that ultimatelyincreased the finished product’s cost.
As a result, in the summer of 2002 Autoliv consolidated the manu-facturing units into one structure, with all the design teams and assemblyunits “incentivized” to reduce the total cost of production. “By bringingthe systems together, we can make the trade-offs that make sense for theentire enterprise. Now we design the inflator in a way that costs penniesmore but captures savings down the line as we integrate it in the airbag,”
Autoliv’s supply baserepresents over 60percent of the totalmanufacturing costsfor its products.

46 Strategic Supply Chain Management
Markert explains. “We see many opportunities like that, and we’re alreadycapturing substantial savings.”
Internal changes, however, would not be sufficient to make Autoliv’snew production system work effectively. To meet its objectives, the com-pany had to convince its suppliers to change the way they did businesswith it. It invested significant resources in supplier development initia-tives, precisely as Toyota had done with it. “Because our supply baseaccounts for 60 percent of the cost of our product, the way they engineertheir products, the way they launch their products, the way they assessdemand and execute to that demand represents 60 percent of our potentialfor improvement,” says Brett Skinner, director of supplier integration andprocess development for Autoliv inflators.
At a fundamental level, the suppliers had to agree to make smaller,more frequent deliveries, typically through a cross-dock facility.“Delivery is the key step for the suppliers,” Skinner says. “Once we getthem to understand why small, frequent deliveries are needed and whyit’s better for them, then we increase the likelihood for success. If we canget quality and delivery, then we’ll work on the systems, and price willfollow. And we tell our suppliers straight upfront, we’re looking for sav-ings, we’re coming after money year in and year out, and we’ll help youget there.”
As Autoliv executives often say, “Variability costs money.” Large-batch production and large shipments are, by definition, subject to largercosts and more waste when demand shifts. This is true for the Ogdenplant, as well as for the companies that supply that plant. So Skinner hasused the example of the major gains in performance of the Utah operationto develop training programs that will help suppliers make similarimprovements. “Our whole approach is to eliminate waste. We focus onquality and delivery, and we take it back upstream to our suppliers—andto our suppliers’ suppliers—until we solve the problem that caused thewaste,” Skinner says. “And when we solve the problem, we have a formalprocess in place to share the savings with our suppliers.”
FROM ONE TIER TO ANOTHER
The case of Greening Donald exemplifies Autoliv’s collaborative approachwith its suppliers. Based in Ontario, Canada, Greening Donald makes wire-mesh filters for airbag inflators, a key component for Autoliv’s products.Autoliv is Greening Donald’s biggest customer, but Skinner’s team did notuse its market clout to dictate the terms of a new relationship with this

AUTOLIV PROFILE: Applying Rocket Science to the Supply Chain 47
supplier. Instead, it proposed a collaborative effort that has paid off hand-somely for both companies.
“When I first heard that my big customer was going to send a supply-development group to help me run my shop, it wasn’t something that I wasreally looking forward to,” says John Rosbottom, production director atGreening Donald. “But now I have nothing but good things to say about it.”
Skinner’s team helped Greening Donald move from a large-batchproduction model to a small-batch model and establish standards for everyconnected process in the production line. A system using cards, or kan-bans, to pull product through the process was instituted. Within just 14months of accepting Autoliv’s offer to help optimize its productionprocess, Greening Donald cut its scrap volume in half and reduced itsinventory of finished goods by 30 percent. “Of all the companies I haveever visited that claimed to be running a lean manufacturing system,Autoliv is by far and away the most impressive,” Rosbottom says. “Theway that they came to us, understood our processes, and helped usimprove the flow of products throughout our facility has really paid off.”
The Greening Donald example has been replicated, in varyingdegrees, with many of Autoliv’s biggest suppliers. To further support andenhance collaborative efforts with the supply base and to smooth the inter-faces along the supply chain, Autoliv rolled out a new Web-based tool in2002 called the Autoliv Partner Portal. The portal gives its suppliers visi-bility to all Autoliv’s purchasing requirements, standards, production fore-casts, terms and conditions, and the status of materials flowing along thesupply chain.
IT WORKS, BUT IT’S NOT EASY
From start to finish, including the modest efforts at reform before it turnedto Toyota for help, it took Autoliv nearly ten years to fully transform itsmanufacturing and supply systems. Becauseof the organizational learning it internalizedfrom that experience, it is helping its suppli-ers improve at a faster rate. But senior man-agement at Autoliv is quick to point out thatchange of this magnitude is very hard toachieve and requires complete and activesupport from the entire organization. “It can’tjust be an edict,” Markert says. “A companyhas to be willing to invest in a comprehensive
It took Autoliv nearlyten years to fullytransform itsmanufacturing andsupply systems.
48 Strategic Supply Chain Management
plan that’s local at each site to develop and train the people and put the systems in place.”
Autoliv invested millions of dollars and thousands of staff hours intraining and organizational development to support its movement to theAPS. Furthermore, the initiative is never really over, Markert says. Autolivis always pushing its people and systems to improve. The companyencourages employees to suggest changes and pays a cash bonus for sug-gestions that improve a process. “We have a lot of open-ended programswhere folks come together and work on improvement opportunities. Oneof our key metrics in human resources is the number of suggestions forimprovements that employees put in,” Markert says. “Then the trick is tohave a structured process to identify what the best practices are and pro-grams to spread those best practices throughout the organization.”

2 C H A P T E R
Core Discipline 2:Develop an End-to-EndProcess Architecture
49
Like any major construction project, your supply chain improvementefforts need a blueprint to succeed. Without a blueprint, you won’t be ableto envision how the many pieces fit together within the existing infrastruc-ture to form an integrated whole—and you’ll encounter delays, rework,and escalating costs. In supply chain management, that blueprint is yoursupply chain architecture. (See Chapter 6 for an understanding of theessential features of an all-encompassing roadmap to change.)
Your supply chain architecture details the process, applications, andinformation needed to improve and evolve your supply chain. It integratesrules about the process relationships between business entities and ensuresalignment between process and supply chain infrastructure (informationtechnology and physical assets, such as warehouses, factories, etc.).
Companies with supply chain architectures in sync with their busi-ness goals have better overall business performance. Their supply chainsare “fit for purpose.” They’re easier to implement and operate. And per-haps most important, they can be reconfigured quickly as business needschange—a valuable source of competitive advantage (see Figure 2-1).
Let’s now focus on the process architecture, which includes four pri-mary components:
Copyright © 2005 by The McGraw-Hill Companies, Inc. Click here for terms of use.

50 Strategic Supply Chain Management
◆ A description of all supply chain processes (plan, source, make,deliver, and return) and how they relate to each other
◆ A view of the interactions between the supply chain processesand other core enterprise processes
◆ A description of the applications required to support supplychain processes, including the data and performance indicatorsneeded for process execution and control
◆ A description of how the applications will be integrated, includ-ing specific data and frequency of communications
FOUR TESTS OF SUPPLY CHAIN ARCHITECTURE
We find that an effective supply chain process architecture satisfies four tests:1. The test of strategic fit. Your company’s overall supply chain
strategy must drive the choices you make in your supply chain architec-ture. Although state-of-the-art practices in supply chain management maybe important, your priority should be practices that truly support yourbasis of competition.
2. The test of end-to-end focus. Your supply chain processes mustensure end-to-end management. This requires having an architecture thatprovides an end-to-end vision of the supply chain and a set of sharedobjectives that orchestrates the work of each player in your supply chain.
F I G U R E 2–1
Components of the supply chain architecture.
Process DataProcess &Applications
Applications
Infrastructure Information Technology
Physical Assets
Business Entity 1 Entity 2 Entity 3
CHAPTER 2 Core Discipline 2: Develop an End-to-End Process Architecture 51
3. The simplicity test. A good supply chain architecture is made upof simple, streamlined processes that minimize the complexity that addscost and reduces manageability. Processes should be clear and easilyunderstood by those who use them.
4. The integrity test. Your architecture must be highly reliable,ensuring coherent and robust links among processes, data, and informa-tion systems.
Let’s look at each of these tests more closely.
Strategic Fit
Some highly touted supply chain practices have been proven to supporteffective, efficient performance—practices such as only entering customerorder data once, considering the total cost of ownership when selectingsuppliers, and using a cross-functional scorecard to measure supply chainperformance. While these “best practices” may be highly correlated withsuperior performance, they won’t necessarily deliver on your company’ssupply chain strategy. It’s important before deciding how you want tooperate to think critically about why you need to operate a certain way.Market leaders are set apart by their deep understanding of the criticalsupply chain practices at which they must excel—those which truly sup-port competitive and brand differentiation.
Figure 2-2 shows examples of the crit-ical supply chain practices that enable eachof the primary supply chain strategies thatwe identified in Chapter 1. Although anyorganization may adopt these practices,their relative importance is determined by acompany’s specific supply chain strategy.
As you think of what practices andprocesses to make part of your supplychain, consider to what extent they’ll driveforward your supply chain strategy. Just asnot all supply chain strategies make sensegiven the overall business strategy, not allpractices are equally important given your supply chain strategy.
Amazon, billed as having the “Earth’s Biggest Selection,” providesa good example of how to select business practices that align with supplychain strategy. The company, which sells millions of different products,stocks only those items designated as top sellers; the vast majority of
It’s important beforedeciding how youwant to operate tothink critically aboutwhy you need tooperate a certainway.

52 Strategic Supply Chain Management
products are offered through partner companies or purchased from dis-tributors when needed to satisfy a customer order. Since this businessmodel means that Amazon does not have direct control over the deliveryschedule for most products, it is not possible to conform to the best prac-tice of giving customers an exact delivery date when they place theirorders. Providing a shipment date is easy when the product is in stock:The customer is informed that the product “usually ships within 24 hours.”Commitments for other products, however, are based on recent actual leadtimes and are quoted as “usually ships in x days,” where x is consistentwith recent activity.
Given this failure on the part of Amazon to perform in a “best prac-tice” way, how does the company maintain extremely high customer sat-isfaction ratings? For one thing, Amazon allows the customer to checkorder status at any time after an order has been placed and proactivelynotifies the customer when each product has been shipped. Amazon alsoprovides a link to the carrier’s Web site that allows the customer to trackorder status and the scheduled delivery date after the product has beenshipped. The result? Customers benefit from an unparalleled array ofproducts, and Amazon optimizes its inventory investment and keeps sup-ply chain costs low.
F I G U R E 2–2
Aligning supply chain practices with the basis of competition.
• Design chain / supply chain integration• Collaborative innovation with suppliers• Dedicated NPI supply chain
Innovation
Critical Supply Chain PracticesPrimaryStrategy
• Integrated factory planning and scheduling• Raw materials and manufacturing process standardization• Design for manufacturing, procurement, order management
Cost
• Customer collaborative planning• Customer segmentation• Postponement
Service
• Product and lot-level traceability• Life cycle tracking of sold products
Quality
CHAPTER 2 Core Discipline 2: Develop an End-to-End Process Architecture 53
The relevance of specific supply chain practices will change as yoursupply chain strategy changes. When Amazon was founded, developing acore competency in order-fulfillment management was not a key elementof the company’s strategy. Amazon’s original business model was to ownno inventory and simply order products directly from manufacturers ordistributors as customers placed orders. The supply chain and associatedprocesses were designed to take advantage of the fact that warehousing ofthe primary product—books—was done already by book distributioncompanies. Amazon planned simply to place orders to these warehousesand not worry about managing inventory.
However, the company found that this model did not provide ade-quate control over the supply chain, the customer’s experience, and theassociated transactions. So it made the decision to build and operate itsown warehouses. The company has invested in some costly physical assetsbut also has become an expert at warehousing. Between 1999 and 2003,through automation and a persistent focus on productivity-enhancing prac-tices, Amazon was able to triple warehouse output productivity. Operatingcosts fell from nearly 20 percent of total revenues to less than 10 percent.Warehousing performance became so good that Amazon started a sidebusiness of running the e-commerce back end of other retailers, includingToys “R” Us and Target.1
Allan Lyall, Amazon’s vice president of European operations, notesthat keeping Amazon’s supply chain strategy in line with the company’sbusiness strategy is a constant challenge. “It’s not like we make funda-mental changes to our strategy all the time,” he says, “but we do maketweaks. That means we need to tweak the associated supply chainprocesses. For example, we started experimenting with next-day deliveryin certain locations. Everything we had done until that time was based ona model where trucks leave our distribution facilities at 8:00 P.M. With thenew strategy, suddenly we had to rethink some of our most basicprocesses—one pickup per day was not good enough.”2
Mark Mastandrea, director of fulfillment, explains how constantprocess improvements are managed: “We place an emphasis on under-standing each element of the end-to-end process. So even though we havewarehouses that were built at different times and therefore have differentlevels of automation, we break the process into small enough incrementsthat we can get to the point where we have common denominators thatapply across all facilities. Then we do internal benchmarking to under-stand the best way to perform that particular process, and put those prac-tices in place in the other facilities.”

54 Strategic Supply Chain Management
Amazon calls this a structured methodology and uses teams consistingof industrial engineers, Six Sigma experts, and representatives from all majorfunctions continuously to “cut” the overall process into increments that canbe shared across the company. Mastandrea notes that this approach is effec-tive, even though the warehouse infrastructures can vary significantly. “Onewarehouse might use processes A and B, and another might use processes Aand C. We want to focus on optimizing how we do A [and] then do it thesame way in each location.”
Today, Amazon has moved to a mixed approach consisting of stock-ing high-volume products and using partners to inventory lower-volumeitems, as well as large or irregularly shaped items that use warehousespace inefficiently. The disadvantage of this strategy is maintaining single-shipment orders when items originate in multiple locations. Cus-tomers can choose to consolidate all items into a single shipment or havethe products ship as each becomes available. If the second option isselected, products are shipped directly from the locations in which theyare stocked. In some cases, Amazon may not allow the customer to con-solidate all items and will ship certain purchases directly from a partner.
With the consolidation option, customers pay only for a single ship-ment, but the cost to Amazon actually may be higher than sending multi-ple shipments. Each nonstocked item is shipped to one distribution center,held until all items are received, and then repackaged and shipped to thecustomer. Amazon uses highly sophisticated algorithms to plan stockinglevels and locations to minimize these split shipments; these algorithmsare reviewed and enhanced continuously.
Allowing the customer to choose the delivery mode clearly enhancesthe customer’s experience and also has a significant impact on supply
chain processes. Amazon’s process designemphasizes the importance of demand plan-ning to predict sales and to determine theappropriate inventory levels to stock at eachlocation. This focus has allowed the com-pany to become highly efficient at organiz-ing warehouses to stock items closetogether that tend to be purchased at thesame time. One indication of the success oftailoring processes to the strategy has beena reduction in order-fulfillment costs to 9.6percent of sales in the first quarter of 2003from 10.6 percent in first quarter 2002.3
We caution you toavoid the trap ofchoosing costlyleading-edgepractices thatprovide onlymarginal support.

CHAPTER 2 Core Discipline 2: Develop an End-to-End Process Architecture 55
While numerous practices can support your chosen strategy effec-tively, we caution you to avoid the trap of choosing costly leading-edgepractices that provide only marginal support. Analyze the contribution thatnew business practices actually will make, letting your supply chain strat-egy determine best-practice priorities. These are the practices that youshould focus on optimizing.
You know that your architecture has met the test of strategic fit when
◆ The value of new practices is quantified before they are integratedinto the supply chain architecture.
◆ New business practices are prioritized based on their ability todrive forward the supply chain strategy.
◆ The supply chain architecture is reviewed regularly to ensurealignment with current strategic direction.
End-to-End Focus
A supply chain architecture with an end-to-end focus identifies whereintegration—both internal and external—can create value for the companyas a whole. By integration, we mean shared goals and alignment of theprocesses, systems, and organizations needed to achieve those goals.
One of our clients, a global manufacturer of computer peripherals,had poor delivery performance relative to its competitors despite main-taining high levels of inventory. The management team did not understandthis dichotomy. The company had invested in a costly, worldwide enter-prise resource planning (ERP) system to better manage orders, manufac-turing, procurement, and accounting and had completed a number ofsupply chain improvement projects. Despite all this, it still had poor per-formance and wondered what was accounting for it.
A close look at operating practices revealed that areas such aspurchasing, manufacturing, logistics, and sales were focused on achiev-ing their functional objectives—at the expense of enterprise-level out-comes. For example, manufacturing had redesigned its productionfacilities, set up just-in-time (JIT) supplier deliveries, and boosted pro-duction quality with impressive results. Total production time, forinstance, had been cut to less than four hours, best in class for the indus-try. Similarly, the company’s logistics department had achieved industry-leading transportation costs by putting in place such practices as allowingonly full truckloads to move product from manufacturing facilities to dis-tribution centers.
56 Strategic Supply Chain Management
Because the company didn’t have an end-to-end view of the supplychain, however, these “good” practices actually were hurting its deliveryperformance. The company’s order-management system assumed that prod-uct was shipped shortly after production and confirmed customer deliverydates based on the end-production date plus a fixed transportation lead time.As a result, customer orders were being confirmed with delivery dates thatcouldn’t be met. Without a focus on end-to-end supply chain processes,overall results suffered: Despite having more than 80 days of finished-goodsinventory, on-time delivery performance to customer commit date was only75 percent, compared with 85 percent for the industry leader.
To fix the problem, the company put in place new supply chainprocesses with a focus on overall business performance. One of the firststeps was to define company-level cross-functional objectives—what wecall end-to-end targets. To set the targets, the project team created a sup-ply chain scorecard (which we discuss in more detail in Chapter 5). Thecritical need to improve customer service and working capital led to tar-gets based on four metrics:
◆ On-time delivery (to commit date). The percentage of orders ful-filled on or before the internal commit date. Delivery measure-ments are based on the date a complete order is shipped.
◆ Order fulfillment lead time. Average, consistently achieved leadtime (in calendar days) from customer order origination to cus-tomer order receipt.
◆ Cash-to-cash cycle time. The time it takes for cash to flow backinto the company after it has been spent on external purchases.Cash-to-cash cycle time is calculated as total inventory days ofsupply plus days of sales outstanding minus average paymentperiod for materials.
◆ Total supply chain management cost. Total cost to manageorders, acquire materials, manage and hold inventory, and man-age supply chain finance, planning, and information technologycosts, represented as a percent of revenue.
Targets for each of these metrics were based on industry bench-marks, and goals for each function were then aligned to these business-level objectives (see Figure 2-3).
Within each region, finished-goods inventory was held at both theregional distribution center and the country warehouses. Each countrymanaged its own supply chain operations. This practice led to differentwork practices and dedicated inventory in each country. As a result, there

CHAPTER 2 Core Discipline 2: Develop an End-to-End Process Architecture 57
was no inventory visibility at the regional level, and there could be a short-age in one country and excess inventory in another for the same product.In addition, although each region was up and running on the worldwideERP implementation, different countries used their own stand-alone infor-mation systems to manage warehousing and transportation.
To put in place an end-to-end management capability, the companyhad to redesign its supply chain processes and embrace many new prac-tices. One of the first goals was to make better use of the ERP system byconsolidating country-level inventory data into a single database to pro-vide inventory visibility at the regional level. Given the promotion-drivennature and short product life cycles of consumer electronics, the companyalso focused on shortening order-fulfillment times. By consolidatingproduct-customization activities—previously done in each country—intoone regional center and shipping directly to customers, the company wasable to shorten lead times and eliminate the need for country-basedinventories.
The company reduced the supply chain planning cycle dramaticallyby redefining the sales forecasting and supply planning processes. Theprevious processes were based on monthly cycles and provided limitedvisibility into actual customer demand patterns. The project team set up aweekly cross-functional supply chain planning process using the existing
F I G U R E 2–3
Collaborative planning within the enterprise.
Plan
Plan Plan PlanPlan
Make Deliver DeliverSource
•
•
Unit Prod.Cost
UtilizationRate
•
•
LogisticsCosts
ScheduleAdherence
•
•
OrderQuality
OrderCycle Time
• PurchasePriceVariance
• On Time Delivery • Order Fulfillment Lead Time• Cash-to-Cash Cycle Time • Supply Chain Management Cost
Su
pp
liers
Internal Integration
Cu
sto
mer
s
ManufacturingManufacturing LogisticsLogistics SalesSalesPurchasingPurchasing Manufacturing Logistics SalesPurchasing
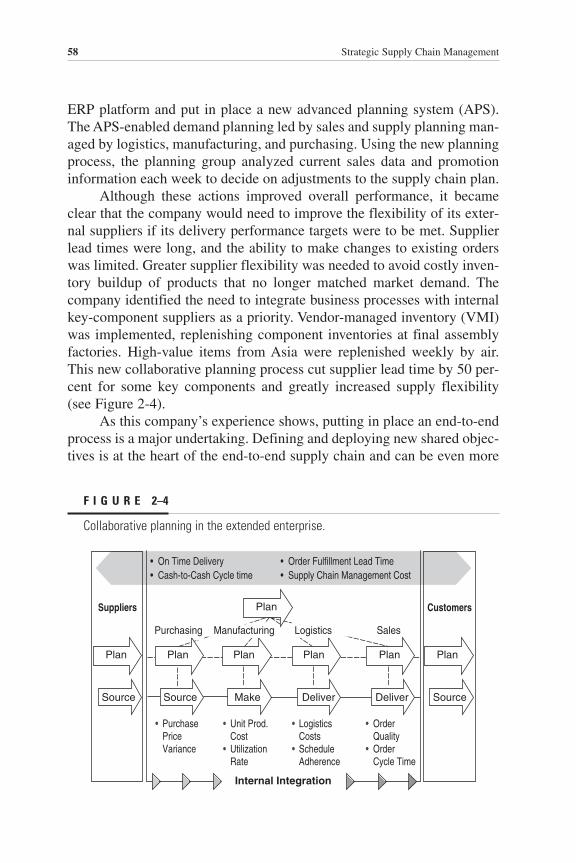
58 Strategic Supply Chain Management
ERP platform and put in place a new advanced planning system (APS).The APS-enabled demand planning led by sales and supply planning man-aged by logistics, manufacturing, and purchasing. Using the new planningprocess, the planning group analyzed current sales data and promotioninformation each week to decide on adjustments to the supply chain plan.
Although these actions improved overall performance, it becameclear that the company would need to improve the flexibility of its exter-nal suppliers if its delivery performance targets were to be met. Supplierlead times were long, and the ability to make changes to existing orderswas limited. Greater supplier flexibility was needed to avoid costly inven-tory buildup of products that no longer matched market demand. Thecompany identified the need to integrate business processes with internalkey-component suppliers as a priority. Vendor-managed inventory (VMI)was implemented, replenishing component inventories at final assemblyfactories. High-value items from Asia were replenished weekly by air.This new collaborative planning process cut supplier lead time by 50 per-cent for some key components and greatly increased supply flexibility(see Figure 2-4).
As this company’s experience shows, putting in place an end-to-endprocess is a major undertaking. Defining and deploying new shared objec-tives is at the heart of the end-to-end supply chain and can be even more
F I G U R E 2–4
Collaborative planning in the extended enterprise.
Plan Plan PlanPlan
Make Deliver DeliverSource
Plan
Source
Plan
Source
•
•
Unit Prod.CostUtilizationRate
•
•
LogisticsCostsScheduleAdherence
•
•
OrderQualityOrderCycle Time
• PurchasePriceVariance
• On Time Delivery • Order Fulfillment Lead Time• Cash-to-Cash Cycle time • Supply Chain Management Cost
Suppliers
Internal Integration
Customers
ManufacturingManufacturing LogisticsLogistics SalesSalesPurchasingPurchasing Manufacturing Logistics SalesPurchasing
Plan

CHAPTER 2 Core Discipline 2: Develop an End-to-End Process Architecture 59
challenging than defining and implementing new practices and informa-tion systems. It’s critical that companies take the time to define thoseshared objectives, whether for internal integration among functions or forexternal integration with customers and suppliers. Without shared objec-tives, it doesn’t make sense to invest in end-to-end processes.
When a supply chain architecture meets the test of end-to-end focus
◆ Processes and supporting informa-tion systems are integrated withinand beyond the enterprise—reach-ing key suppliers and customers.
◆ Supply chain resources such ascapacity and inventory are opti-mized across the organization andwith key suppliers and customers.
◆ Standard metrics and quantitativeobjectives are shared across theorganization and with key suppliers and customers.
◆ Performance visibility and management are shared across theorganization and with key suppliers and customers.
Simplicity
Complex supply chains are hard to understand, improve, and managebecause complexity obstructs the “line of sight” needed to identify whatis and what is not working. The costs and risks of complexity are highestwhen companies integrate their processes and systems with those of theircustomers and suppliers. When effective supply chain management isdependent on managing beyond your company’s borders, each process,data element, and system must be clearly defined and agreed to. And ifyour internal processes, data, and systems are complex or convoluted, thelikelihood of your being able to reach consensus with your supply chainpartners is greatly reduced. Simplicity is the solution. But before we seehow this complexity can be simplified, let’s examine the different driversof complexity. We see four:
◆ Supply chain configuration◆ Product and service proliferation◆ Process and information systems inconsistency◆ Overautomation
Without sharedobjectives, it doesn’tmake sense to investin end-to-endprocesses.

60 Strategic Supply Chain Management
Supply Chain ConfigurationThe first source of complexity is your supply chain configuration—howyou’ve structured your network of physical assets and distributed activi-ties within that network. The decisions you make to support your channelstrategy, operations strategy, and other components of your supply chainstrategy can lead to complex supply chain configurations. And complexconfigurations drive process complexity. Do you have a large number oforder-entry desks, warehouses, factories, engineering centers, and otherphysical locations? Are you trying to manage too many customer and sup-plier relationships directly? Each location and relationship is another nodein the supply chain that must be designed and managed.
Consider how Alcatel Enterprise, Europe’s largest provider of busi-ness voice and data Internet Protocol (IP) servers, simplified its supplychain configuration for business advantage. In the late 1990s, Alcatelmanagement realized that the market for its products—business handsetsand PBXs—was maturing. The company had to find a way to improvecustomer service without increasing costs. Alcatel wanted to providefaster transactions with better traceability while reducing inventory levelsand eliminating the need for multiple suppliers across different geo-graphic regions.4
For Alcatel, the answer was to adopt a cost-based supply chainstrategy with a much simpler supply chain configuration; in its case,this meant outsourcing supply chain operations not considered corecompetencies.
Many of these activities were part of the deliver process—gettingequipment to customers, having it installed, and then initiating service.The company decided to move most sales, installation, and service activ-ities to its channel partners, resulting in the percentage of indirect salesgrowing from 25 percent in 2001 to 95 percent in 2002. In addition,Alcatel worked on simplifying the interactions with channel partners, cre-ating an extranet, the Alcatel Business Partner Web site, that sharplyreduced order-management costs by replacing electronic data interchange(EDI), fax, and mail orders with self-service processes.
Alcatel used the move to indirect sales as an opportunity to stream-line physical distribution of its products around the world. The companymanaged a huge number of logistics service providers—more than 30 inEurope alone. This complexity made it difficult to measure and improvesupply chain performance, so it decided to move all final packaging anddistribution from internal operations to a fourth-party logistics provider(4PL). Alcatel chose UPS Logistics, and UPS now manages relationships

CHAPTER 2 Core Discipline 2: Develop an End-to-End Process Architecture 61
with logistics specialists covering such operations as kitting, storage,inspection, final tests, picking and packing, and customer delivery.5
Alcatel Enterprise created four standard processes to guide UPS and toensure integration with its manufacturing, sourcing, and sales departments.Instead of producing to stock based on forecasts, Alcatel used demand fre-quency, volume, and item value to design differentiated processes that mini-mized inventory risks while meeting service requirements:
◆ Configure to order applies to telephones with documentation,cables, accessories, etc.
◆ Build to customer order applies to complete systems (chassis andboards) built and integrated per customer order and requirements.
◆ Pick to order applies to high-volume printed circuit boards (PCBs).◆ Purchase to consumer order applies to high-value peripherals
procured from external suppliers.
As a result of these changes, customer delivery-to-commit-date per-formance improved from 65 percent in 1999 to 95 percent in 2001, whereastotal supply chain costs declined from 5.8 to 5.1 percent of revenue.6
Product and Service ProliferationAnother key driver of supply chain complexity is product and service pro-liferation. There are two primary causes. The first is a failure to phase outor retire certain products as they are replaced by newly introduced alter-natives. The other cause is related to the availability of technologies thatallow organizations to “mass customize” their product offerings. Thesesystems, combined with increasingly high customer expectations forproducts tailored to specific requirements, can lead to an enormous num-ber of product and service offerings. Most companies, therefore, find thatthey tend to carry an ever-increasing number of products and services.This means more items to plan, source, make, and deliver—all of whichdrive supply chain costs and inventory.
Motorola’s mobile phone division wrestled with product prolifera-tion. Mobile phones have hundreds of components—aerials, battery con-nectors, PCBs, connectors, integrated circuits, keyboards, liquid-crystaldisplay (LCD) screens, lenses, microphones, phone housings, screws,speakers, and more. Planning for and procuring these components is a chal-lenge in this fast-moving market. Because of this complexity and the grow-ing cost of high inventory levels, Motorola analyzed its component mix,seeking ways to cut back. As it turned out, the company was using far toomany nonstandard and product-specific components, many of which could
62 Strategic Supply Chain Management
not be justified. By standardizing components to a greater degree, Motorolawas able to greatly improve flexibility and sharply reduce inventory obso-lescence and rework costs.7
Process and Systems InconsistencyA third driver of complexity is inconsistent processes and information sys-tems throughout the supply chain. We often find that different locationswithin the same company have different, incompatible processes. Evenwhen the same software package is installed, it’s often configured differ-ently, in keeping with each location’s process. Inconsistency can resultfrom acquisitions, but more typically it arises because companies are sim-
ply not aware of the benefits of a standardprocess architecture—or haven’t investedthe resources needed to create one.
When different locations have differentprocesses and systems, the company losesspeed and efficiency and is less able to lever-age knowledge across the organization. Andeach location means added investment andmaintenance costs. Inconsistency also cre-ates inflexibility. Work can’t be transferredamong locations as demand shifts becauseeach site works differently. Moreover, cross-site leverage in terms of shared back-officeactivities, such as strategic sourcing, isharder to achieve. Finally, process and infor-mation inconsistency makes it difficult tointegrate with customers, suppliers, andother business partners.
OverautomationThe emergence of decision-making applications for supply chain planningand performance management has led to a new driver of supply chaincomplexity: overautomation. Overautomated processes are difficult tomanage because the people who use them don’t completely understandhow they work. Without this understanding, users can’t judge the qualityof their output or improve their performance.
Supply chain planning tools offer powerful functionality, but rulesand algorithms need to be selected carefully, for these systems contain farmore features than are needed by most organizations, with some func-
Inconsistency canresult fromacquisitions, butmore typically itarises becausecompanies aresimply not aware ofthe benefits of astandard processarchitecture.

CHAPTER 2 Core Discipline 2: Develop an End-to-End Process Architecture 63
tionality better adapted to some industries than to others. And trying tobuild models that represent very complex operating environments canitself be a cause of failure. One leading company in the semiconductorindustry simply turned off its system after a two-year effort at building amodel that represented its multitier global manufacturing network.
No matter how you focus your improvement efforts, address supplychain complexity as a priority. Complexity is the single greatest cause ofpoor investment returns in supply chain management. Even without majorchanges to business practices, companies can improve performance greatlyjust by making their operations more manageable and creating the visibil-ity that comes with simplification. In addition, simplifying the existingsupply chain is a necessary first step toward more advanced supply chainpractices, especially in supplier and customer collaboration.
You’ll know that your supply chainarchitecture meets the simplicity test if
◆ Supply chain process architecturestandardization rules are definedand enforced.
◆ Product and service complexityand related costs are measured andtightly managed.
◆ Standards for components and mate-rials are defined and adhered to.
◆ The physical supply chain configu-ration (warehouses, order desks,factories, supplier locations, distribution centers) is reviewed reg-ularly and simplified where possible.
Integrity
Your improvement efforts will encounter major delays and budget over-runs if your supply chain architecture doesn’t have integrity in the form ofintegrated applications, accurate data, and documented processes. Youcan’t introduce new supply chain practices without a solid foundation.
During the IT investment boom of the late 1990s, many companiesadded new best-in-breed applications such as advanced planning and sched-uling, customer relationship management (CRM), and supplier relationshipmanagement (SRM) to their portfolios of systems. These applications oftenwere added without fully reworking the underlying business processes and
Complexity is thesingle greatestcause of poorinvestment returns insupply chainmanagement.
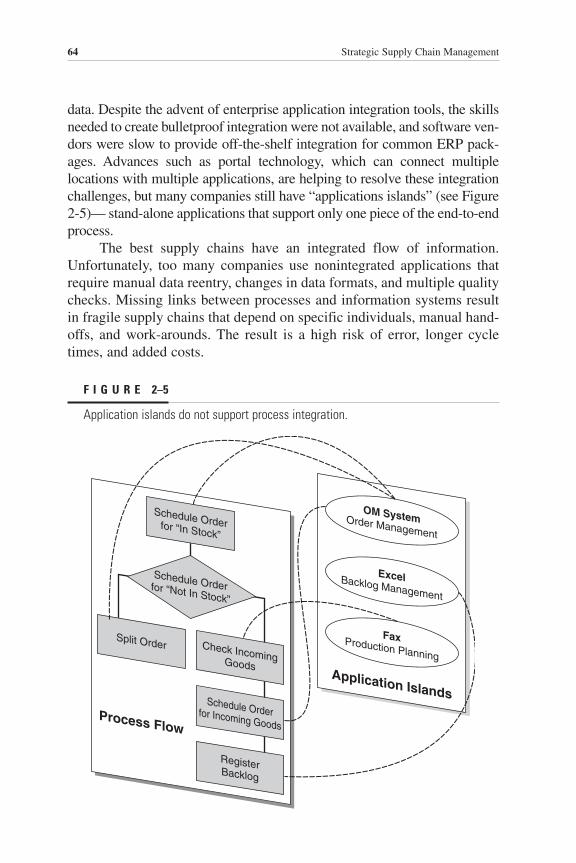
64 Strategic Supply Chain Management
data. Despite the advent of enterprise application integration tools, the skillsneeded to create bulletproof integration were not available, and software ven-dors were slow to provide off-the-shelf integration for common ERP pack-ages. Advances such as portal technology, which can connect multiplelocations with multiple applications, are helping to resolve these integrationchallenges, but many companies still have “applications islands” (see Figure2-5)— stand-alone applications that support only one piece of the end-to-endprocess.
The best supply chains have an integrated flow of information.Unfortunately, too many companies use nonintegrated applications thatrequire manual data reentry, changes in data formats, and multiple qualitychecks. Missing links between processes and information systems resultin fragile supply chains that depend on specific individuals, manual hand-offs, and work-arounds. The result is a high risk of error, longer cycletimes, and added costs.
F I G U R E 2–5
Application islands do not support process integration.
Schedule Orderfor “In Stock”
Schedule Orderfor “Not In Stock”
Split Order Check IncomingGoods
Schedule Orderfor Incoming Goods
RegisterBacklog
Process Flow
Application Islands
OM SystemOrder Management
ExcelBacklog Management
FaxProduction Planning
CHAPTER 2 Core Discipline 2: Develop an End-to-End Process Architecture 65
For example, one of our clients was implementing new demand/supply planning processes, supported by a supply chain planning applica-tion. As part of the new process, the company wanted to track forecast con-sumption over time to ensure that demand and supply were balanced on anongoing basis. This required gathering data from two separate sources—anexisting CRM application, which held data related to customer orders, andthe new supply chain planning application, which contained informationabout incoming supply. Unfortunately, the ordering information describedproducts one way, whereas the planning application used different data todescribe products for the purpose of planning. The chief information offi-cer was concerned that resolving this disconnect would require restructur-ing the entire data model, a major undertaking. In the end, an answer wasfound that integrated the flow of information between the two applications.A translation table was developed that took the elements of a customer’sorder and translated them into planning items.
Data quality and availability are as important as integration betweenapplications. The typical company orchestrates hundreds, if not thou-sands, of supply chain activities and decisions every day, each dependingon a wide range of data: master data (supplier lead times, material mas-ters, prices, terms and conditions), transaction data (sales orders, inven-tory data, purchase orders, etc.), and analytics (which compare actualperformance with target performance to ensure process management).Despite the importance of accurate data, one study estimates that between15 and 20 percent of a typical organization’s data are wrong or unusable.8
Inaccurate or missing data lead to errors and ineffective execution.Consider the example of a procurement system that captures quantitiesordered and confirmed by suppliers but doesn’t capture backorders—quantities ordered but not confirmed. Backorder management must bedone either manually, at the risk of error, or not at all, which could easilylead to overordering and excess inventory.
Inaccurate or unusable data also create manual work, reducing speedand efficiency and adding costs to the supply chain. In the worst case,inaccurate data can drive poor performance. As an example, we had aclient that felt the repercussions of inaccurate data for almost a year afterit first implemented a supply chain planning solution. When preparing forthe cutover to the new system, it had entered standard defaults for supplylead times, with every intention of updating the data before the “go live”date. Unfortunately, day-to-day tasks took precedence, and no one gotaround to updating the supplier lead-time data—resulting in an increase inmaterials inventory (lead times too short) for some materials and inven-tory shortages (lead times too long) for others.
66 Strategic Supply Chain Management
As cleaning and structuring data become top priorities for a growingnumber of companies, applications that support data quality control arebecoming more popular. At many companies, data maintenance is a partof ongoing management processes; data administration positions evenhave been created specifically to maintain data quality.
A key driver behind this push for data quality is a growing aware-ness of the costs associated with poor data in transactions such as order-ing and invoicing. A study of the electronics industry by the U.S.-basedNational Electrical Manufacturers Association (NEMA) revealed thatproduct and pricing inaccuracies were costing manufacturers and distrib-utors 1 and 0.75 percent of sales, respectively.9 These percentages maynot sound particularly alarming, but for a $200 million manufacturingcompany, that’s an added cost of $2 million.
New industry initiatives to address data quality continue to emerge.In the retail industry, for instance, the Uniform Code Council started anorganization called UCCnet to provide item data synchronization, stan-dards validation, and a global item registry for retailers and their suppli-ers. By creating a single set of data usable by all, UCCnet plans to driveout the costs associated with invoice and order errors and the time spent ondata quality. NEMA has created the Industry Data Exchange Association(IDEA) to do the same for its industry.
When a supply chain architecture meets the test for integrity
◆ Required integration between applications is defined in the sup-ply chain process architecture, and the impact of applicationintegration issues on business performance is measured.
◆ Processes are documented at each level of the supply chainarchitecture, with clear descriptions of the data required to exe-cute each process.
◆ Data quality is measured and managed, with clear ownership fordata creation and maintenance.
ARCHITECTURAL TOOLKITS
Just as a blueprint describes the construct of a building and how each ele-ment fits together, your supply chain architecture should describe the con-struct of your processes and how they interact. In order to be effective, thisneeds to be done using clear, unambiguous terms. Just agreeing on a def-inition of what “the supply chain is,” though, can be a major challenge.This task has been complicated by the use of many similar-sounding and

CHAPTER 2 Core Discipline 2: Develop an End-to-End Process Architecture 67
interrelated terms—supply chain, demand chain, supply network,demand/supply network, value chain—many of which sound as thoughthey could mean the same thing but in factdo not.
It is difficult to say exactly when theterm supply chain came into vogue and evenmore difficult to find a universally accept-able definition for exactly what a supplychain is. In our work with client companiesin the past, we found that many were unableto reach agreement on a supply chain defin-ition. And even when there was agreementinside the enterprise, customers and suppli-ers might have a very different interpreta-tion. This lack of common understandingled to inconsistencies in how processes were executed and frequent mis-communication about what was expected by one organization of another.
This problem clearly was evident in the 1990s, as issues associatedwith operational planning and execution beyond the boundaries of a spe-cific organization became a major focus for executive management teams.In the past, most operational process-improvement efforts had focusedprimarily on improving the performance of internal processes. But newtechnologies, outsourcing, and the increasing customization of supplychains to meet the needs of key customers meant that supply chain devel-opment increasingly looked outside the “four walls.”
It became clear that a set of standard definitions for each supplychain planning, execution, and enabling activity was needed. In the mid-1990s, PRTM developed a framework, or process reference model, thatincluded descriptions of supply chain processes and key performanceindicators to help our clients benefit from the emerging “science” of sup-ply chain management.10 We were well aware of the value of process ref-erence models, having earlier created PACE® (Product And Cycle-timeExcellence®), which has been adopted widely by companies worldwide toget better products to market faster.11
In our supply chain framework, we defined the supply chain as con-sisting of four processes: plan, source, make, and deliver. For target set-ting and performance management, we defined metrics for each of theseprocesses and for overall supply chain performance. We defined the scopeof the supply chain as all interactions “from the supplier’s supplier to thecustomer’s customer”—a network of organizations linked together by
Your supply chainarchitecture shoulddescribe theconstruct of yourprocesses and howthey interact.
68 Strategic Supply Chain Management
physical, informational, and financial flows designed to satisfy end-cus-tomer requirements. Our goal was to ensure that supply chains could bedescribed unambiguously, communicated consistently, redesigned toachieve competitive advantage, and measured, managed, controlled, andrefined to meet a specific purpose.
Recognizing the need for a true cross-industry standard, in 1995PRTM joined forces with AMR Research, an independent research firmcommitted to providing unbiased analysis of the enterprise software sec-tor. Together, PRTM and AMR founded the Supply-Chain Council (SCC),which initially included 69 member companies. Over the course of a year,the three organizations further developed and refined this standard, calledthe Supply-Chain Operations Reference-model (SCOR) that defined bestpractices, performance metrics, and software functionality requirementsfor each core supply chain process, subprocess, and activity.12 The SCORmodel provides a framework and standardized terminology to help orga-nizations integrate a number of management tools, such as businessprocess reengineering, benchmarking, and best-practice analysis. TheSCOR toolbox enables organizations to develop and manage effectivesupply chain architectures.
Using the SCOR model’s top-down design method, an organizationcan quickly gain an understanding of its current supply chain performanceand architecture. It also can compare its own architecture with that ofother organizations, identify improvements based on best practices, anddesign its future supply chain architecture. Since its release in 1996, morethan 700 companies have adopted the SCOR model.
In 1996, the Supply Chain Council became an independent, not-for-profit professional association, and the SCOR model was entrusted to it.Since launch of the SCC, the council has grown, establishing internationalchapters in Europe, Japan, Australia/New Zealand, Southeast Asia, andsouthern Africa, in addition to North America. Members have continuedto advance the SCOR model, adding the return process in 2001 and peri-odically updating recommended practices and metrics. We expect that themodel will continue to evolve as the “science” of supply chain manage-ment advances (see Figure 2-6 for the top two levels of the SCOR modeland Appendix C for a complete listing of metrics in levels 2 and 3).
While the SCOR model is the only framework of its kind for devel-oping a supply chain architecture, other complementary initiatives haveemerged that focus on industry-specific practices and implementation-level detail, such as data standards. Two such initiatives that have beenadopted widely in recent years are Collaborative Planning, Forecasting,and Replenishment (CPFR) and RosettaNet.

CHAPTER 2 Core Discipline 2: Develop an End-to-End Process Architecture 69
CPFR focuses on the packaged goods and retail sectors. It was createdin 1997 through a collaborative effort involving over 30 companies and ismanaged by the Collaborative Commerce Standards Institute. The CPFRstandard is made up of detailed process definitions, required data elements,and metrics for the customer-supplier interface. CPFR’s objective is to
F I G U R E 2–6
SCOR version 6.0 level 2 toolbox.
Plan
Source
Enable1. Establish and Manage Rules2. Assess Performance3. Manage Data4. Manage Inventory5. Manage Capital Assets6. Manage Transportation7. Manage Supply Chain Configuration8. Manage Regulatory Compliance9. Process Specific Elements
Plan Source
Align SC/Financials
SupplierAgreements
Make Deliver Return
Make Deliver
P1 Plan Supply Chain
P2 Plan Source
S1 Source StockedProduct
S2 Source Make-to-Order Product
S3 Source Engineer-to-Order Product
SR1 Return Defective ProductSR2 Return MRO ProductSR3 Return Excess Product
M1 Make-to-Stock
M2 Make-to-Order
M3 Engineer-to-Order
D1 Deliver StockedProduct
D2 Deliver Make-to-Order Product
D3 Deliver Engineer-to-Order Product
D4 Deliver Retail Product
P3 Plan Make P4 Plan Deliver P5 Plan Return
Suppliers Customers
Source ReturnDR1 Return Defective ProductDR2 Return MRO ProductDR3 Return Excess Product
Deliver Return
70 Strategic Supply Chain Management
improve the partnership between retailers and vendor merchants throughshared information.13
Formed in 1998, the RosettaNet consortium is composed mainly ofcompanies in the electronics and telecommunications industries and ismanaged by the Uniform Code Council, a leading commerce standardsorganization. RosettaNet develops Internet-based business standards toalign processes through standard data definitions called partner-interfaceprocesses (PIPs). Widely adopted by the technology sector, PIPs supportautomated real-time information exchange between companies and covera broad range of transactions, including inventory management, ordermanagement, and ship from stock.14
We will be focusing on the SCOR model in this chapter because, toour knowledge, it is the most widely accepted supply chain referencemodel in use. In fact, it is being adopted by the largest supply chain orga-nization in the world, the U.S. Department of Defense (see Department ofDefense profile).
Through its structure and method, the SCOR model makes whatmight be a monumental undertaking—creating a supply chain architec-ture—a manageable task. As in a construction project, the SCOR modelprovides a set of tools to be used in developing the supply chain blueprint.
THE TOP THREE LEVELS OF THE SCOR MODEL
The SCOR model has four levels of detail, the first three of which—processes, subprocesses, and activities—are described in the model.Operable processes, or level 4, are detailed workflow-level tasks and arealways customized to an organization’s specific strategy and requirements.As such, they are not included in the published version of the model.
Starting with level 1 and ending with level 3, the content of theSCOR model can be used to translate business strategy into a supply chainarchitecture designed to achieve your specific business objectives. Theexact order in which you use the different levels of the SCOR model willdepend on your specific business needs and starting point. We will bedescribing the operational and business benefits that result from configur-ing supply chains using the SCOR model in this chapter.
SCOR Level 1
At level 1, you confirm how business processes will align with your high-level business structure (business units, regions, etc.) and supply chain

CHAPTER 2 Core Discipline 2: Develop an End-to-End Process Architecture 71
partners and refine your supply chain’s strategic objectives—the businesspriorities that your supply chain must support. Level 1 focuses on the fivemajor supply chain processes (plan, source, make, deliver, and return).Using these processes, the alignment between process and organizationaldomains can be established to describe where processes must be stan-dardized across entities. Choices at level 1 drive information systems costsbecause different processes across business units typically involve multi-ple applications and the associated implementation and maintenancecosts. In addition, level 1 decisions also will determine whether an orga-nization will be able to implement certain business practices. For exam-ple, does the source process need to be standardized between two businessunits or are differences justified? If the goal is to consolidate volumeacross multiple business units to gain leverage with suppliers, standard-ization of a good part of the source process will be needed.
Once business processes and organizational domains are aligned,setting performance targets for these key process areas is an importantnext step. The SCOR model provides a supply chain scorecard for settingand managing supply chain performance targets across the organization.The specific metrics are described in Chapter 5. This step is one of themost critical—and difficult—activities in supply chain design because ofthe need to gain internal consensus on targets and priorities. It is driven byyour supply chain strategy, as discussed in Chapter 1.
As an example, one of our clients, aleader in the consumer electronics industry,was losing market share to competitors witha strong focus on specific market segments.The company had long been organized as asingle, centralized business structure andrecognized the need to transform to multi-ple, market-facing business units in order tocompete effectively.
Once the new business units had beenestablished, executive management reviewedboth the strategic vision and the related sup-ply chain requirements for each. Prior to thereorganization, all supply chain processes(plan, source, make, deliver, and return),supporting information systems, and assets had been shared. The companyalso had outsourcing policies that limited contract manufacturing to end-of-life products, as well as other rules that limited product customization to
The SCOR modelprovides a supplychain scorecard forsetting andmanaging supplychain performancetargets across theorganization.

72 Strategic Supply Chain Management
control unit costs and maximize inventory flexibility. Deciding which ofthese policies to keep and which to change was critical to establishing thenew strategic boundaries for supply chain design.
In order to establish these boundaries, each business unit developedits own business strategy and performance objectives and then summa-rized the resulting implications for its supply chain. Given the criticalimportance of materials costs (up to 85 percent of product cost), productquality, and time to market, it was decided to maintain the shared plan,source, make, deliver, and return processes and assets while changes weremade to inventory policies for each business unit to meet the specific ser-vice requirements of the different end markets.
SCOR Level 2
At level 2, you refine your choice of supply chain processes and confirmhow supply chain processes align with your infrastructure (physical loca-tions and information technology). Also called the configuration level,level 2 involves developing and evaluating high-level options for the supplychain process architecture by choosing the “flavors” of plan, source, make,deliver, and return. This is done by selecting the relevant subprocesses—or process categories—based on your supply chain strategy, The selectionof process categories will drive level 3 design because each categoryrequires very different detailed activities.
For example, manufacturing companies have a number of options forhow they will produce their products. They can build in anticipation of cus-tomer orders (make to stock), build only after a firm customer order is inhand (make to order), build to a semifinished level and complete the buildafter an order is received (configure to order), or build the product basedon specifications that are unique to the customer and therefore requiredetailed engagement in advance of starting any work (engineer to order).
Once the process categories are chosen, they are used to describeexisting supply chain configurations. This typically takes the form of ageographic map showing where your customers, suppliers, warehouses,factories, and order desks are and using the process categories to describethe major physical and informational flows. In essence, this is like takingan inventory of the processes in use today and where they occur.
Once you understand the current configurations, you can develop andtest “to be” options. Be aware, however, that the SCOR level 2 analysismay show you that you cannot optimize what you want because of exist-ing limitations, such as excessive transportation costs. In other words, you
CHAPTER 2 Core Discipline 2: Develop an End-to-End Process Architecture 73
may not be able to execute all your “to be” requirements in the near termand will need to develop a roadmap to move progressively toward your tar-get configuration (see Chapter 6).
One of our clients, an international aerospace company, was strug-gling to manage a complex web of relationships among its own sales,logistics, and manufacturing operations; several key subcontractors; and amajor customer, an aircraft manufacturer. The company was a prime con-tractor in a commercial aircraft program. Ensuring on-time delivery of itssubsystem to the customer’s final assembly and testing facility requiredcoordinating material, information, and financial flows with subcontrac-tors located on three continents.
Supplier deliveries for the commercial jet program were increasinglylate. And when the aircraft manufacturer asked to reschedule orders, thecompany had to contact its suppliers before providing a confirmationdate—a process that took several weeks. Because of these problems, thecompany was struggling to maintain its credibility with a key account. Itused the SCOR model to gain a greater understanding of the underlyingproblems.
The project team used the SCOR model to map order management,procurement, physical distribution, supply chain planning, and financialflows at the company, as well as all key interfaces with subcontractors.Each activity was associated with a SCOR level 2 process category. Forthe first time, the company had clear visibility of the subsystem’s supplychain as a whole and was able to see which activities were performed bythe company, the customer, and subcontractors. In addition, the use ofstandard process category definitions meant that each constituent wasusing the same definition for the processes for the first time.
Opportunities to simplify the supply chain were quickly apparent.For example, major subassemblies moved through multiple internal ware-houses before being made available for final assembly. This caused sig-nificant delay yet added no additional value to the product. The level 2process map showed the reason for this. All products were routed to aregional consolidation platform. Once they entered the platform, therewas an official transfer of ownership from internal manufacturing to theaircraft program. The team realized that a change in process and support-ing information systems would allow some product to be shipped directlyto the final preparation point near the customer’s assembly line, eliminat-ing several weeks in the delivery cycle.
Interestingly, the visibility created by the SCOR process map alsoforced the company to rethink some long-held beliefs about what was

74 Strategic Supply Chain Management
causing customer service to be below desired levels. It had long thoughtthat the order-management process—where orders were transferred auto-matically from the customer into one system and then manually rekeyedinto another system for financial management before communication tosuppliers—was the cause of order delays. The analysis showed thatalthough rekeying added costs and introduced potential errors, the man-agement of subcontractors was a much larger problem. The existingprocess included communication of planned requirements to key subcon-tractors as part of a formal ordering process, where the suppliers also con-firmed quantities and delivery dates. But supplier updates regardingschedule slippages, as well as communication of changes in order volumefrom the prime contractor, were managed in a less formal manner. Someof the major changes defined by the team included new roles for procure-ment, monthly subcontractor planning reviews, a process to adjust previ-ously agreed-on plans, and business rules to guide manufacturingschedule changes at the subcontractor. The company’s multimonth effortdelivered dramatic results: Supplier on-time deliveries improved by morethan 20 percent, and order confirmation times were cut sharply. Today, thecompany can confirm customer orders in two to three days rather than twoto three weeks, and customer confidence has been restored.
SCOR Level 3
SCOR level 3 is also called the process-element level; this is where youcan complete your supply chain architecture by adding operational detailto your SCOR level 2 design. Within SCOR level 3 you will find specificbusiness practices, associated metrics, and guidance about the informationsystems needed to support the process—in terms of both functionality andsupporting data. The tools you’ll need to do this work have been assem-bled for you already. You will develop “as is” maps illustrating the align-ment between processes, locations, and organizations. These mapstypically will show where inventory is located, the lead times betweenprocess elements, and the alignment between process elements and sup-ply chain information systems.
By applying basic lean principles, the level 3 “as is” analysis canreveal a number of improvement opportunities driven by the configura-tion, including reducing process and information systems complexity, cre-ating better linkages between end-customer demand and end production,eliminating similar activities conducted in multiple locations, and reduc-ing wait time and the associated inventory and customer lead times.

CHAPTER 2 Core Discipline 2: Develop an End-to-End Process Architecture 75
In addition to analyzing the overall configuration, you also will con-sider best practices, applications, metrics, and organizational models aspart of your level 3 “to be” design. By analyzing your current capabilitiesversus your “to be” design, you’ll understand the implications for theexisting processes and information systems. Typical information systemsimplications include system gaps, missing data, and insufficient integra-tion between information systems. Then you can evaluate each “to be”option based on the business criteria set at SCOR level 1 and choosewhich to develop at the operable level (level 4) of detail needed for a realworking solution.
Case in point: We worked with a large retailer that needed toreduce inventory levels without sacrificing service. The company hashundreds of retail locations, ranging from megastores to neighborhoodgrocery outlets. It had grown through acquisition, and as new acquisi-tions were made, the acquired businesses were established as indepen-dent business units. Some functions were shared, including purchasing,warehouse management, and accounting. For the most part, however,each business unit was allowed to operate independently, maintaining itsown processes and information systems. This practice led to very highinformation-systems costs due to different applications, each requiringdedicated, ongoing support.
The company had been frustrated by several failed efforts to improveits overall performance; it had spent months mapping its key processesand analyzing the resulting improvement opportunities. Still, the projectteam was not able to reach agreement on the “to be” supply chain. Themajor roadblock was the lack of an overall architecture. Team memberswere not even able to agree on which processes were part of the supplychain and which were not! Moreover, processes within specific functionswere well defined, but those which cut across functions, such as supplychain planning, were not.
To break the deadlock, the team used SCOR level 3 to map its currentprocesses. An analysis of the deliver process elements showed that thephysical supply chain was highly optimized in terms of warehousing oper-ations and that highly developed processes were in place to ensure the besthandling of its products from suppliers to retail locations. Examination ofwarehouse practices revealed the adoption of many leading-edge ware-house management practices, such as picking and order preparation usingvoice-recognition technology.
An analysis of the plan and source process elements revealed thatthe supply chain had been optimized to move high volumes of consumer

76 Strategic Supply Chain Management
favorites that were purchased every day in predictable volumes. The teamclosely examined how demand was calculated at each level of the supplychain, starting with the retail store, moving back to the warehouse, andfinally moving on to the supplier.
Using plan source process elements (see Figure 2-7), the team real-ized that information on actual sell-through at the store was not used inplanning requirements for suppliers and that each store placed orders onthe warehouses based on its best view of demand. Using the P 2.1 processelement—identify, prioritize, and aggregate product requirements—theteam saw that distribution warehouses that supplied the retail outlets werepulling inventory from suppliers based on historical demand patterns forall products—which was fine as long as demand was consistent with his-torical levels.
In actuality, of course, demand patterns for many products werehighly variable, particularly in the cases of new products, store-level pro-motions, and the periodic introduction of seasonal merchandise. Theseevents distorted demand patterns, creating a baseline demand that wasappropriate only for a specific time period. This meant undersupply at the
F I G U R E 2–7
Using plan source for better performance.
P2 Plan Source•
••
Establish and communicate supply chain plansProduction plansDelivery plans
••
•
Planning dataItem master, bill of materials, product routingsReserve resources and determine delivery date
••••
Product availabilityInventory availabilitySourced production on orderPlanning data
• Planning decision policies
• Sourcing plans
P 2.2Identify, assess, andaggregate product
resources
P 2.1Identify, prioritize,
and aggregateproduct requirements
P 2.3Balance productresources with
product requirements
P 2.4Establish sourcing
plans
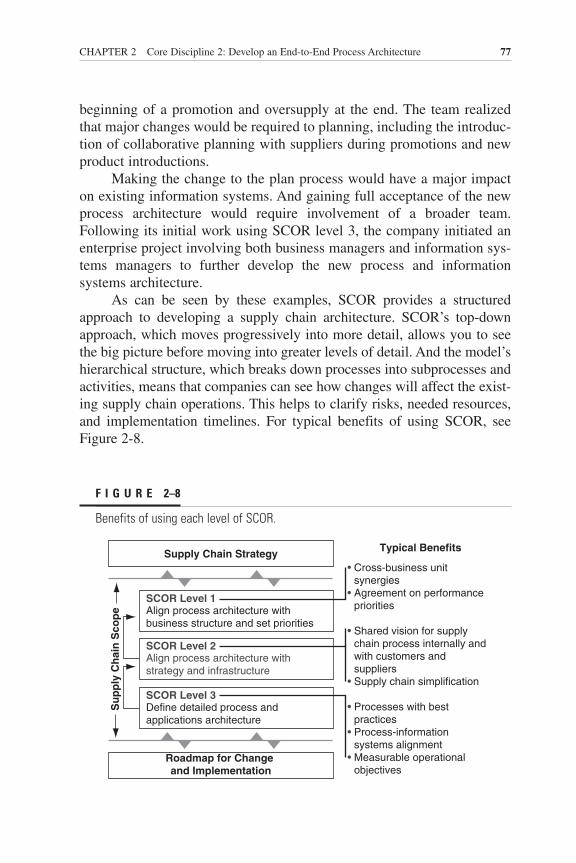
CHAPTER 2 Core Discipline 2: Develop an End-to-End Process Architecture 77
beginning of a promotion and oversupply at the end. The team realizedthat major changes would be required to planning, including the introduc-tion of collaborative planning with suppliers during promotions and newproduct introductions.
Making the change to the plan process would have a major impacton existing information systems. And gaining full acceptance of the newprocess architecture would require involvement of a broader team.Following its initial work using SCOR level 3, the company initiated anenterprise project involving both business managers and information sys-tems managers to further develop the new process and information systems architecture.
As can be seen by these examples, SCOR provides a structuredapproach to developing a supply chain architecture. SCOR’s top-downapproach, which moves progressively into more detail, allows you to seethe big picture before moving into greater levels of detail. And the model’shierarchical structure, which breaks down processes into subprocesses andactivities, means that companies can see how changes will affect the exist-ing supply chain operations. This helps to clarify risks, needed resources,and implementation timelines. For typical benefits of using SCOR, seeFigure 2-8.
F I G U R E 2–8
Benefits of using each level of SCOR.
Supply Chain Strategy
Roadmap for Change and Implementation
Su
pp
ly C
hai
n S
cop
e
SCOR Level 1Align process architecture with business structure and set priorities
SCOR Level 2Align process architecture with strategy and infrastructure
SCOR Level 3Define detailed process andapplications architecture
Typical Benefits
Cross-business unit synergiesAgreement on performancepriorities
Shared vision for supply chain process internally andwith customers and suppliersSupply chain simplification
Processes with best practicesProcess-information systems alignmentMeasurable operational objectives
•
•
•
•
•
•
•

78 Strategic Supply Chain Management
FIVE PROCESSES FOR END-TO-END SUPPLY CHAINMANAGEMENT
As you develop your own supply chain process architecture, you willneed to ensure that each process is integrated not only with the othersupply chain processes but also with other enterprise processes such astechnology, product and service development, marketing and sales, cus-tomer support, and finance. We’ll be discussing a number of principlesspecific to each process design that will help you to drive best-in-classperformance.
Plan
Every supply chain process has inputs and outputs. Plan’s input is infor-mation on demand, supply, and supply chain resources. This informationenables better decision making and guides all supply chain activitiesrelated to the execution processes—source, make, deliver, and return.Each of the execution processes has a planning element. For example,plan source and plan make outline the raw materials needed, the source ofthose materials, and the quantities of inventory to be produced. Plandeliver provides the information needed to commit to customer orders.And plan return provides the information needed to schedule returns andreplacement orders.
Planning-process excellence contributes to superior business perfor-mance by ensuring that decisions are timely and well prepared and thattheir implications are understood, agreed on, and feasible. Planning excel-lence has five key principles:
◆ Use timely, accurate information. From a demand standpoint,this means information on real-time customer and marketdemand based on such factors as end-user consumption, down-stream inventory levels, economic conditions, and market intelli-gence. Use data from key customers when possible. From asupply standpoint, it means understanding the critical internaland external resources needed to satisfy demand, such as labor,inventory, manufacturing capacity, suppliers, and warehouses. To develop a full view of needed resources, it is necessary to getinformation from each of the execution processes—source,make, deliver, and return. Since both demand and supply aredynamic, what’s accurate today probably won’t be tomorrow.This is why timely information is so critical.

CHAPTER 2 Core Discipline 2: Develop an End-to-End Process Architecture 79
◆ Focus resources on business priorities. Plan is the supply chainprocess that balances internal objectives (inventory, cost, andasset utilization) with external objectives (service levels, volumeflexibility, etc.) while ensuring that decisions support customer-and market-segment priorities.
◆ Aim for simplicity. Make your plan processes as simple as possi-ble. Realistic and executable outputs typically require taking intoaccount different views of demand (country, market segment,product, brand, etc.). In addition, different resources (materials,capacity, labor, etc.) across multiple locations (multiple internalplants, partner locations, etc.) need to be considered. Realize thatit may become unmanageable, however, to optimize all resourcesacross the supply chain. A focus on critical or “bottleneck”resources is required.
◆ Integrate all supply chain requirements. Source, make, deliver,and return are all interdependent processes, so be sure to createan integrated plan for their individual resource and executionrequirements, a plan that extends from “the customer’s customerto the supplier’s supplier.” Otherwise, imbalances will occur,adding costs and tying up inventory in the supply chain. Forexample, if you purchase (source) more materials than produc-tion (make) needs, you’ll end up with excess raw materials.
◆ Create explicit actions and accountabilities. The plan processmust create courses of action that are agreed to internally—byoperations, sales, marketing, and all other internal stakeholders—and externally by key suppliers and customers. Performanceagainst these action plans should be visible to all involved andmeasured as part of an ongoing effort to improve planning quality.
To achieve your company’s business objectives, be sure to integrateplanning with other enterprise business processes. For instance, inte-grate with marketing and sales processes for the best view of customerdemand, to get input on customer and market priorities, and to evaluatethe need for and impact of promotional activities. Integrate with thetechnology, product, and service development processes to ensure thatkey programs have the needed resources. This also will improve time tomarket and time to volume of new products and services. Integrate planwith the finance process to ensure the quality of financial information.Revenue projections must be based on the most credible informationpossible, and all supply chain liabilities—both internal and external—

80 Strategic Supply Chain Management
must be recognized and reported in line with company and regulatoryrequirements.
Figure 2-9 shows the metrics of top performance in the plan process.
Source
Using the plan generated by plan source, the supply chain source processprocures all needed materials and services, performing the operationalactivities of purchasing, scheduling, receiving, inspecting, and authorizingsupplier payment. The source activity also involves supplier selection andrelationship management.
Process excellence in source is built on four key principles:
◆ Aim for the lowest total cost of ownership (TCO). Getting thelowest purchase price on a service or asset is less important thanachieving the lowest total cost of ownership. A cheap vehicle, forinstance, isn’t a bargain if it breaks down more often or has ashorter useful life. Be sure to consider both direct and indirectcosts when determining the value of a purchase or contract.Many supply chain costs—such as supplier ordering, inspection,payment, and inventory holding—are driven by supplier prac-tices, quality, and capability. To reduce TCO, set cost-improve-ment objectives not just for the product or service but also fortotal supply chain costs as well. Work with your suppliers toredefine processes with a goal of reducing or eliminating activi-ties that drive up costs. For instance, “ready for use” products
F I G U R E 2–9
Metrics of top performance in plan.
Plan
Forecast Accuracy
Customer Service (on time delivery to commit)
Total Inventory Daysof Supply
Discrete
Process
Discrete
Process
Discrete
Process
Best Performer AdvantageOver Median/Average
25% more accurate
19% more accurate
9% more accurate
7% more accurate
1/3 the inventory
1/2 the inventory
© Copyright 2004 The Performance Measurement Group, LLC

CHAPTER 2 Core Discipline 2: Develop an End-to-End Process Architecture 81
eliminate the need for inspection or preparation. Another way tolower costs is to automate manual, paper-based transactions suchas purchase orders or to replace them with a more efficient prac-tice, such as setting up automatic replenishment to do away withpurchase orders entirely.
◆ Set procurement strategies according to category. Procurementstrategies set the boundaries for supplier agreements, competitivecontracts, and global sourcing agreements based on the need forrobustness in the supply network. Different categories have dif-ferent supply-market complexities and business impacts. In addi-tion, sourcing activities, organization, and tools should bedifferentiated based on these specific strategies. For example, forstandard products where cost is the primary selection criterion,focus on global supply-base management and techniques such asonline bidding, whereas for more strategic products, partnershipmanagement and collaborative workspaces will be needed.
◆ Maintain an enterprisewide focus. This means choosing suppli-ers that can service the organization across its different locationsand consolidating purchase volume across the enterprise, wherepossible, for greater leverage with suppliers. It also requiresmanaging the supply base at the enterprise level using standardspecifications, common tools (profiles, ratings, and evaluationcriteria), and appropriate organizational structures, such as globalcommodity managers and teams. Managing the global supplybase ensures that suppliers use best practices—those which drivelower costs and greater flexibility—whenever possible and thatprocesses are standardized for a more efficient and robust supplychain. Spend management is also a critical part of source excel-lence, ensuring that your company tracks spending, uses onlyapproved suppliers and standards (approved vendors lists, cata-logs, etc.), and has delegation-of-authority processes in place forapproving purchases.
◆ Measure and manage performance. You won’t know if you’reachieving the objectives of your category strategies unless youtrack sourcing performance. For example, visibility on spendacross all locations (on volumes purchased by suppliers and termsand conditions applied) is needed for contract enforcement. Inaddition, explicit performance review points should be built intosupplier contracts and be based on standard supplier scorecards.Supplier scorecards should include the key performance indicators

82 Strategic Supply Chain Management
needed to support the achievement of mutually agreed TCOobjectives. In addition to reviews, two-way visibility of perfor-mance to the scorecard metrics should support day-to-day per-formance management.
For the supply chain to operate effectively, be sure to integratesource with the plan, deliver, make, and return processes both within theorganization and with suppliers. The integration points with suppliers aremultiple because a company’s source process integrates with a supplier’sdeliver processes for many activities (ordering, goods receipt, and pay-ment). Working with suppliers to design a seamless, integrated flow ofthese inputs and outputs can lower total cost of ownership significantly.
To achieve your company’s business objectives, also integrate sourc-ing with other core business processes. For instance, by integrating withtechnology, product, and service development processes, you can ensurethat suppliers apply design for manufacturing and design for supply chainpractices. These practices improve quality; optimize production, testing,and packaging; and get new products to market faster.
Figure 2-10 shows the metrics of top performance in the sourceprocess.
Make
The supply chain make process transforms the resources procured bysource into goods and services according to agreed-on specifications andany regulatory requirements. To increase flexibility, minimize costs, or
F I G U R E 2–10
Metrics of top performance in source.
Source
Materials Availability (daysto increase by 20%)
Raw Materials Inventory Days of Supply
Materials AcquisitionCosts
Discrete
Process
Discrete
Process
Discrete
Process
Best Performer AdvantageOver Median/Average
6 times faster
18 times faster
1/5 the inventory
1/4 the inventory
Spend 50% less
Spend 20% less
© Copyright 2004 The Performance Measurement Group, LLC
CHAPTER 2 Core Discipline 2: Develop an End-to-End Process Architecture 83
boost asset utilization, more and more companies are using external part-ners to execute some or all of their make activities, such as production,testing, certification, and packaging. This requires sharing performanceobjectives and processes across this extended network.
There are four principles for process excellence in make:
◆ Focus on business priorities. All make scheduling decisions shouldintegrate customer and market priorities. Your company’s businessmanagers should provide these priorities as formally defined busi-ness rules. Give priority to key accounts and higher-margin prod-ucts when resources and production capacity are limited.
◆ Aim for speed and flexibility, not just low costs. Reduce cycletimes and inventory levels with demand-pull and other lean man-ufacturing techniques. For example, when time or cost prohibitsmaking customized products, finish products to a generic leveland only finalize them on receipt of a customer order. Speed andflexibility require almost real-time visibility. Timely and accurateinformation on key areas, such as order status, production output,line stoppages, quality performance, and inventory levels, isneeded to support rapid adjustments to the production schedule.
◆ Set and monitor quality standards. Capture and review qualityinformation at each step of the production process based on pre-set standards. Timely data on quality must be accessible toeveryone involved in manufacturing activities and then analyzedusing a structured approach such as Six Sigma. This focus onquality should cover the whole product life cycle. Productsshould be traceable at the lot and unit levels to ensure that thesource of quality problems can be identified and corrected.
◆ Synchronize all manufacturing activities. Provide information onproduction schedules, consumption, and inventory levels to sup-pliers so that they can better monitor and respond to demand.Define and agree on rules to guide supplier decision making forreplenishment. To ensure that production schedules are both fea-sible and accurate, production rules, information, and perfor-mance data need to be managed; this requires defining andmaintaining formalized processes and accountabilities both inter-nally and with supply partners.
For the supply chain to operate effectively, make must be integratedwith the plan, source, deliver, and return processes. For example, planprovides make with a production plan stating the amount of product to be
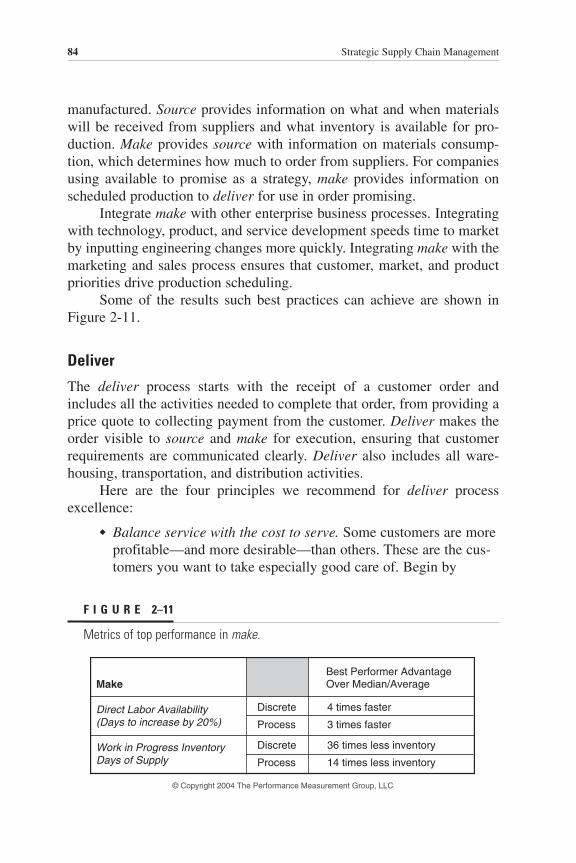
84 Strategic Supply Chain Management
manufactured. Source provides information on what and when materialswill be received from suppliers and what inventory is available for pro-duction. Make provides source with information on materials consump-tion, which determines how much to order from suppliers. For companiesusing available to promise as a strategy, make provides information onscheduled production to deliver for use in order promising.
Integrate make with other enterprise business processes. Integratingwith technology, product, and service development speeds time to marketby inputting engineering changes more quickly. Integrating make with themarketing and sales process ensures that customer, market, and productpriorities drive production scheduling.
Some of the results such best practices can achieve are shown inFigure 2-11.
Deliver
The deliver process starts with the receipt of a customer order andincludes all the activities needed to complete that order, from providing aprice quote to collecting payment from the customer. Deliver makes theorder visible to source and make for execution, ensuring that customerrequirements are communicated clearly. Deliver also includes all ware-housing, transportation, and distribution activities.
Here are the four principles we recommend for deliver processexcellence:
◆ Balance service with the cost to serve. Some customers are moreprofitable—and more desirable—than others. These are the cus-tomers you want to take especially good care of. Begin by
F I G U R E 2–11
Metrics of top performance in make.
Make
Direct Labor Availability(Days to increase by 20%)
Work in Progress InventoryDays of Supply
Discrete
Process
Discrete
Process
Best Performer AdvantageOver Median/Average
4 times faster
3 times faster
36 times less inventory
14 times less inventory
© Copyright 2004 The Performance Measurement Group, LLC

CHAPTER 2 Core Discipline 2: Develop an End-to-End Process Architecture 85
clearly defining customer segments, and then differentiate yourdeliver processes, business rules, and services accordingly. Forinstance, you may offer high-value customers several order-man-agement options while limiting other customers to self-serviceand other lower-cost order channels. You also may give priorityto your best customers when allocating inventory in times ofproduct shortages.
◆ Cut costs and time with straight-through processing. Send orderinformation to all relevant functions—credit approval, manufac-turing (for make to order), warehousing, transportation, andinvoicing—so that, where possible, execution activities can bedone simultaneously instead of sequentially, and all aspects ofdeliver can be organized for smoother, faster processing. As withinformation flows, design deliver physical flows for straight-through processing to minimize non-value-added wait time.Choose your physical network—production, warehousing, andtransportation—with an eye toward total costs and delivery time.
◆ Set up end-to-end tracking and traceability. The status of all cus-tomer orders and shipments, from order signal to cash collection,should be visible throughout the deliver process. For example,customers should be able to see where their orders are, and keyaccount managers should have access to full order informationfor each of their accounts. Moreover, managing supply chainrisks such as terrorism, counterfeiting, theft, and spoilagerequires being able to seal and track shipments from point ofproduction to point of delivery.
◆ Manage data for ongoing accuracy and timeliness. Good deliv-ery performance depends on excellent data management.Customer order creation and management require a broad rangeof information, including product attributes, technical configura-tions, prices, and customer addresses. All this information mustbe kept current to avoid errors. Otherwise, orders and invoiceswill be rejected and reworked, adding time and cost and tying upcash in the supply chain. In most companies, data creation andmaintenance are a challenge involving many departments. Thechallenge, though, is even greater beyond the enterprise, requir-ing data and process standards among customers, suppliers, andpartners—each of which may have different data structures, defi-nitions, and repositories.

86 Strategic Supply Chain Management
You won’t be able to follow all these principles without integratingdelivery with other core business processes. For example, data manage-ment requires getting product-related data from the technology, product,and service development processes. Customizing supply chain processesas part of customer collaboration will require adjustments to the market-ing and sales process so that customer contracts systematically take logis-tical aspects into account. Moreover, the marketing and sales process mustprovide deliver with information on pricing, customer-specific terms andconditions, and the clear guidelines on customer priorities needed to bal-ance service and the cost to serve.
To meet your customer delivery commitments consistently, you’llalso have to integrate delivery with your company’s other supply chainprocesses. Plan depends on the deliver process for information ondemand—based on order backlog and customer shipments—for bothresource and revenue planning. In addition, creating collaborative businessmodels and tailoring deliver processes can have significant implications onplan, source, and make. For instance, the make and the plan processes pro-vide deliver with the inventory and production scheduling data needed forcustomer order promising. Depending on the collaborative model chosen,the type of information needed and transaction frequency can change sig-nificantly. See Figure 2-12 for the metrics of top performance in deliver.
Return
The return process ensures that previously sold products are supported,collected, and dispositioned according to business policies and customer
F I G U R E 2–12
Metrics of top performance in deliver.
Deliver
Order Fulfillment Lead Timefor Make to Stock Products
Order Management Costs
Days Sales Outstanding
Discrete
Process
Discrete
Process
Discrete
Process
Best Performer AdvantageOver Median/Average
4 times faster
4 times faster
Spend 42% less
Spend 31% less
43% less days
36% less days
© Copyright 2004 The Performance Measurement Group, LLC

CHAPTER 2 Core Discipline 2: Develop an End-to-End Process Architecture 87
agreements and covers all activities from return authorization to financialsettlement. The primary drivers behind return differ by industry but typi-cally include the return of defective, wrong, or unsatisfactory products;maintenance, repair, and overhaul (MRO) based on service agreements;excess channel inventory returns; and recycling/refurbishment/reuse.Different activities may be associated with each of these return “types.”
Return is a reverse supply chain process and has specific require-ments and characteristics that differ from the forward supply chain. Forexample, return involves capturing item-level data from the point ofreturn, tracking a product until disposition, and managing warranties forthe complete product life cycle. It also requires capturing a range of ana-lytics, including the causes of returns, originating locations, costs, andcredits.
In addition, the return physical network entails specific challenges.For example, returns typically feature small volumes of many differentitems with irregular frequency. Companies must find a way to collect, sort,and distribute this array of items as efficiently and economically as possi-ble. Often, central collection points provide a way to aggregate volume ina cost-effective manner.
For return process excellence, follow these four key principles:
◆ Create a distinct supply chain for return, such as decidingwhether a product can be returned, how it will be disposed of,and how to manage supplier or customer credits and other finan-cial transactions. Return requires a separate supply chain, withits own end-to-end processes, information systems, performancescorecard, and organizational responsibilities.
◆ Feed back return information quickly. Provide timely informa-tion on returns to guide both disposal and preventive actions. Forexample, procurement will deal with suppliers appropriately,based on return information. Production, engineering, and logis-tics will learn from return information and use it to take correc-tive action in their respective areas. Return managers will usedata on costs, credits, and revenues to manage reverse supplychain operations.
◆ Base return policies on total cost of returns. Set up an explicitreturn policy for each item sold, whether manufactured internallyor purchased for resale. Consider using an external returns spe-cialist depending on the nature of the return, the total costs of thereturn—including assessment, collection, sorting, and disposal—and your company’s existing return capability.
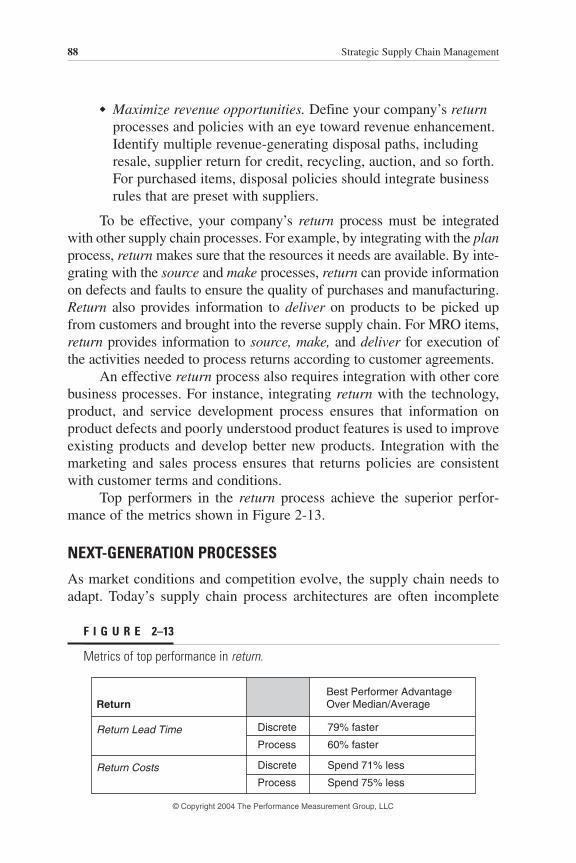
88 Strategic Supply Chain Management
◆ Maximize revenue opportunities. Define your company’s returnprocesses and policies with an eye toward revenue enhancement.Identify multiple revenue-generating disposal paths, includingresale, supplier return for credit, recycling, auction, and so forth.For purchased items, disposal policies should integrate businessrules that are preset with suppliers.
To be effective, your company’s return process must be integratedwith other supply chain processes. For example, by integrating with the planprocess, return makes sure that the resources it needs are available. By inte-grating with the source and make processes, return can provide informationon defects and faults to ensure the quality of purchases and manufacturing.Return also provides information to deliver on products to be picked upfrom customers and brought into the reverse supply chain. For MRO items,return provides information to source, make, and deliver for execution ofthe activities needed to process returns according to customer agreements.
An effective return process also requires integration with other corebusiness processes. For instance, integrating return with the technology,product, and service development process ensures that information onproduct defects and poorly understood product features is used to improveexisting products and develop better new products. Integration with themarketing and sales process ensures that returns policies are consistentwith customer terms and conditions.
Top performers in the return process achieve the superior perfor-mance of the metrics shown in Figure 2-13.
NEXT-GENERATION PROCESSES
As market conditions and competition evolve, the supply chain needs toadapt. Today’s supply chain process architectures are often incomplete
F I G U R E 2–13
Metrics of top performance in return.
Return
Return Lead Time
Return Costs
Discrete
Process
Discrete
Process
Best Performer AdvantageOver Median/Average
79% faster
60% faster
Spend 71% less
Spend 75% less
© Copyright 2004 The Performance Measurement Group, LLC
CHAPTER 2 Core Discipline 2: Develop an End-to-End Process Architecture 89
and defined in terms that are not widely understood. This means that theoverall impact of new strategies on existing operations is very difficult toassess. Deployment of new strategies is impaired, and potential competi-tive advantage is lost.
In the next generation of processarchitecture, companies will be able torapidly translate strategies into new supplychains. These architectures will seamlesslyintegrate business processes and informa-tion systems. And they’ll include the keyperformance indicators needed to ensurevalue creation and ongoing management.
Besides providing a unified view ofthe internal supply chain, the next genera-tion of process architecture will define theintegration points among suppliers, cus-tomers, and partners. Changes will includethe practices described in Figure 2-14.
In the nextgeneration ofprocess architecture,companies will beable to rapidlytranslate strategiesinto new supplychains.

90 Strategic Supply Chain Management
F I G U R E 2–14
Next-generation practices in process architecture.
Theme
ProcessArchitectureContent
DecisionSupport
ProcessAutomation
EnterpriseScope
Cross-EnterpriseScope
SCPA(SupplyChainProcessArchitecture)Ownership
Current DominantPractice
Detailed processes (plan,source, make, deliver,return) are described, butthe integration betweenthe processes, andbetween processes andapplications, is missing orincomplete.
The process architecturecontent focuses on execu-tion within the organizationof the subprocesses, withlimited integration of ana-lytics (performancemonitoring, reporting, reso-lution).
Manual intervention isused to resolve even rou-tine exceptions (e.g., latesupplier delivery, stock-outs, etc.) and eachexception typicallyrequires days or weeks toidentify and resolve.
Process architecture con-tent (activities, data,metrics, and applications)may differ by country orregion, based on history ororganizational control.
The focus is the organiza-tion, and processarchitecture structure,vocabulary, and contentare unique to each organi-zation.
The development andmaintenance of theprocess architecture areled and conducted by IT;seen as an “IT issue.”
Next-GenerationDominant Practice
The process architecture integrates allsupply chain process activities (plan,source, make, deliver and return), data,metrics, and applications.
The processes create visibility of adefined set of events and of actual per-formance versus plan, using standardmetrics, in order to support proactivemanagement, extending as required tosuppliers, partners, and customers.
For a defined set of critical businessevents, automated business rules, andproblem-solving propose solutions forapproval by business owners in real-timeenvironments.
Such content (activities, data, metrics,and applications) is standardized to sup-port the work of geographically dispersedvirtual teams and to enable the sharingand transfer of work between locations.
The process architecture integrates stan-dards such as SCOR® (Supply-ChainOperations Reference-model®) andensures the existence of commonprocesses, data, and metrics with suppli-ers, partners, and customers. Standardssupport the management of liabilities, crit-ical resources (inventories, capacities,etc.), and events in the extended supplychain.
The process architecture is seen as “anasset” and is co-managed by businessleaders (P&L responsibility) and IT inorder to balance business requirementsand the advantages of shared processand IT standards.

Avon Profile:Calling on Customers Cost-Effectively
What do you do when you have an enormous growth opportunity butcan’t capitalize on it with your existing supply chain? If you’re Avon,you embark on a radical transformation—a high-risk venture with noguaranteed returns.
Avon is the world’s leading direct seller of beauty and related products,with $6.2 billion in annual revenue. In addition to its cosmetics, skin careproducts, fragrances, and personal care products, the company offers awide range of gift items, including jewelry, lingerie, and fashion acces-sories. Avon sells to customers in 145 countries through 3.9 million inde-pendent sales representatives, providing an earnings opportunity to womenthroughout the world. Its Europe region (spanning Europe, the MiddleEast, and Africa) accounts for more than $1.2 billion of Avon’s sales, withoperations in 32 countries and more than 1 million sales representatives.
With a primary focus on marketing and sales, Avon had neglected itssupply chain for a number of years, never viewing it as a strategic lever.This presented acute problems for Avon Europe because the region’sstrong growth threatened to overwhelm the supply chain organization.
Back in the 1980s, Avon Europe had branches in only six countries,each with a separate factory and warehouse supplying the local market.These branches operated independently, with separate information sys-tems, no overall planning, and no shared manufacturing, marketing, or dis-tribution. On a small scale this worked quite well. Each entity could bevery responsive to local needs. In the early 1990s, the company beganglobalizing its key brands and embarked on a strategy to modernize itsimage through the launch of new products, packaging, and ad campaigns—a strategy aimed at more and younger consumers.
Avon planned to double sales revenue from $500 million in 1996to $1 billion in 2001 for the European region as a whole—growthfueled in large part by dramatic inroads in central and eastern Europe.But the company realized that replicating its supply chain model in
91
Copyright © 2005 by The McGraw-Hill Companies, Inc. Click here for terms of use.

92 Strategic Supply Chain Management
every new market would be expensive and unwieldy. The bottom line:Avon couldn’t achieve its aggressive growth target with its existing sup-ply chain. Explains Bob Toth, executive vice president, “Ten years agowe operated country to country, with a very decentralized financial-holding-company model. You just can’t compete that way now, espe-cially if you’re a fast-moving consumer-goods company.”
A GROWING BUSINESS—AND GROWING PROBLEMS
The first problem was a fundamental mismatch between the company’sselling cycle and its supply chain cycle. In most European markets Avonbegins a new sales campaign—complete with a new brochure, fresh prod-uct offerings, and promotions—every three weeks. This short selling cycleis a cornerstone of Avon’s direct-sales model. By regularly offering newproducts and promotions, the company gives its sales representatives a rea-son to call on their customers more often, strengthening those relationships
and driving sales.A short selling cycle demands a flexi-
ble, responsive supply chain. Here, Avon fellshort, especially as the company’s Europeanoperations grew larger. Avon’s factoriesmanufactured everything to forecast andthen shipped inventory to the country ware-houses before the start of each three-weekselling campaign. Inevitably, certain prod-ucts would be big hits, and the brancheswould send rush orders back to the factories
to make more inventory. However, it took an average of 12 weeks for prod-ucts to cycle through Avon’s supply chain from sourcing to manufacturingto distribution out to the branches—far too long for the short selling cycle.
This timing mismatch led to on-the-fly solutions and enormous ineffi-ciencies during the course of each sales campaign. Avon relied on the hero-ics of its people to meet customer needs—regardless of cost. This wasviable when Avon Europe was relatively small. But as the business grew,keeping up with the needs of the different markets and accurately forecast-ing demand for individual products became increasingly difficult, especiallysince Avon was entering new markets at a rate of two or three per year.
The rush orders destroyed manufacturing efficiency too. Since 40 to50 percent of the items offered in any campaign sold more than expected,the factories were constantly interrupting their manufacturing schedules to
In most Europeanmarkets, Avonbegins a new salescampaign everythree weeks.

AVON PROFILE: Calling on Customers Cost-Effectively 93
switch from one product to another. Changeover costs were high—espe-cially since the factories were set up for high-volume production.
Slow-selling products also were costly. In every selling cycle anumber of products would sell less than forecast, so Avon had a growingamount of unsold merchandise. Avon’s inventory levels were high—asmuch as 150 days’ worth was typical—far too high for a three-week sell-ing cycle. And most of this inventory consisted of unsold items. The cap-ital tied up in inventory would only increase as Avon’s business expandedin Europe.
Language variants presented another growth-related problem. Avonbought preprinted containers from its suppliers. With new markets camenew languages and a growing number of print variants. Given its manu-facture-to-forecast approach and the suppliers’ lead times, Avon had toorder a wide range of preprinted containers well before it knew what itssales volumes actually would be in the different markets. This was becom-ing increasingly complex—and wasteful. Avon often would have demandin one country that couldn’t be filled because the only containers on handwere printed in another language.
Fixing these problems and transforming the supply chain would bean enormous undertaking, one that needed support and a big financialcommitment from corporate management.
MAKING THE BUSINESS CASE AND MOVING FORWARD
It required a lengthy, detailed analysis to prove that Avon’s supply chainwouldn’t be able to handle the projected growth of the business. Eventhen, it took 18 months to build the business case and get executive buy-in to move forward with the far-reaching changes needed. Convincing theorganization to invest money that wouldn’t be recouped until the lateryears of the transformation was a tough sell. In fact, the first two yearswould result in a net loss. “This delayed payback was an uncomfortablenotion, especially given that Avon had never invested much in the supplychain before and wanted quicker results,” explains Michael Watson, direc-tor of Avon’s supply chain transformation. “It was very difficult gettingthat initial momentum going.”
By the time Avon started the project, however, corporate buy-in wasabsolute, and management had committed an extraordinary level ofresources. Notes Watson, “We took 45 of our best people in Europe out of their existing positions and put them into the project full time for 18months.” Removing these people from day-to-day operations was extremely

94 Strategic Supply Chain Management
painful, costly, and risky from a business perspective, but it was absolutelycritical to success. Explains Watson, “If we had tried to do this on the sidewith a small project team, it would never have worked—and we’d never beseeing the benefits we are now.”
RETHINKING THE SUPPLY CHAIN
Avon began by creating a centralized planning function—a critical prior-ity. Explains John Kitchener, head of the supply chain in Europe, “Therewas no way Avon would achieve its growth targets without a centralizedplanning group that could see demand and inventory levels across theregion and react very, very quickly.”
First, Avon had to create a common database. The team spent manymonths putting in place standardized product codes, descriptions, and otherinformation so that each country was speaking the same language. Thedatabase gave Avon visibility into sales trends and inventory so that man-agers could look across the region and see what was happening from bothdemand and supply perspectives. The company also installed Manugistics’supply chain planning and scheduling system to support integrated plan-ning and coordination across the whole European region.
To leverage this new capability andmanage the growing complexity of the busi-ness, Avon put in place a regional planninggroup empowered to make decisions aboutservice levels, inventory, and costs based ona bird’s-eye view of the whole supply chain.Other decisions regarding the new organi-zation, roles, and responsibilities were puton hold until later.
The next critical step was to redesignthe entire supply chain in a way that madesense operationally. Using the Supply-ChainOperations Reference-model (SCOR), the
team identified the key changes to plan, source, make, and deliver—thesupply chain processes that were most integral to Avon’s business. Avonkept a manufacturing plant in Germany but consolidated other productioninto its plant in Poland. This helped in two ways. First, it expanded manu-facturing capability in the heart of Avon’s emerging markets. And second,it delivered major cost efficiencies, mainly due to the lower cost of labor.Avon also created a centralized inventory hub in Poland—near the produc-tion facility—to service the company’s branches throughout Europe.
Avon put in place aregional planninggroup empowered to make decisionsabout service levels,inventory, and costs.

AVON PROFILE: Calling on Customers Cost-Effectively 95
With end-to-end visibility in place anda newly streamlined supply chain, Avon wasable to make truly dramatic changes to its business.
END-TO-END VISIBILITY
Once Avon was able to see the supply chainas a whole, decisions that didn’t seem tomake sense from a purely functional stand-point suddenly were shown to deliver sub-stantial—and often unexpected—benefits.For instance, Avon had considered the idea of labeling bottles itselfinstead of having suppliers preprint them, a postponement strategy thatwould delay the final decision about what language to put on a productuntil sales trends were clearer. For years, marketing had resisted this idea,convinced that the look of the products would suffer. Manufacturing wasn’tinterested in adding to its overhead cost structure either because the func-tion was run as a cost center. From a financial standpoint, the postpone-ment strategy didn’t seem to make sense. The added equipment and laborcosts involved in making labels and affixing them to bottles likely wouldoffset any savings. “All the accountants were telling us it was the wrongthing to do,” says Watson.
It was only when Avon stepped back and looked at the supply chainas an end-to-end process that the true benefits of the postponement strat-egy became clear. From a sourcing standpoint, Avon would only have tobuy one plain bottle for shampoo or lotion instead of five or six languagevariations. Avon’s manufacturing plants could make one long productionrun instead of repeatedly switching bottle stock. And customer servicewould improve sharply because the branches could be more responsive.Now, when inventory runs out in a given market, the warehouse canrespond quickly by labeling products with the right language and loadingup a truck.
The postponement strategy delivered improvements in cost, effi-ciency, and service all along the supply chain. Yet the strategy seemedcounterintuitive until Avon assessed the trade-offs in cost, flexibility, andcycle time across the total supply chain.
Very closely linked to the postponement strategy is a new inventory-hub strategy. Explains Kitchener, “The postponement strategy works well,but only in conjunction with a distribution hub that lets us quickly pushproducts out to the markets.” Avon’s two manufacturing plants supply the
Avon created acentralized inventoryhub in Poland toservice thecompany’s branchesthroughout Europe.

96 Strategic Supply Chain Management
one centralized warehouse in Poland which labels the products and putsloads together for distribution to the different branches. In the old world,Avon pushed products out to country warehouses in the different marketsbefore knowing what demand actually was. Now it holds products back inthe centralized hub and diverts them to the markets that need them oncesales trends become clear.
Avon is also working to standardizeits containers to cut costs and increase effi-ciency. Once convinced that every productshould have a distinct bottle and shape, thecompany now realizes that cap, color, andlabeling can be sources of differentiationtoo. As a result, Avon has cut back sharplyon the number of bottle styles and sizes ituses. This delivers a wide range of benefits.Manufacturing can be far more flexiblebecause changeover time is often zero fromproduct to product. Suppliers can now runAvon’s containers down the more efficient,high-speed lines in their factories. And prod-
uct costs are lower because of standardization. Avon has been able to rein-vest savings in improved product formulations and leading-edge packagedesign and marketing activities.
For years, Avon was unable to cost-justify these types of changes.Now, with an end-to-end view of the trade-offs among different actions, thecompany can see the full effect of pulling one or more levers—and makedecisions that improve the supply chain as a whole.
COLLABORATING WITH SUPPLIERS
This end-to-end view also changed how the company works with its sup-pliers. Avon used to seek out the least expensive materials and buy in largevolumes to keep costs low. But the company began to see that the lowestprice doesn’t necessarily equal the lowest total cost. For instance, Avonfound a supplier of inexpensive glass bottles in Mexico, but the deliverylead time from Mexico to Europe was long—8 to 12 weeks on a boat.When product demand was high and bottles were needed, Avon would flythem in, a costly solution. Even though the bottles themselves were inex-pensive, the lack of flexibility and high expediting costs more than offsetthose savings.
Avon is also workingto standardize itscontainers andpostpone labelingthem to cut costsand increaseefficiency.

AVON PROFILE: Calling on Customers Cost-Effectively 97
Based on these insights, Avon completely changed its sourcing strat-egy. The company reduced its supplier base by more than half, embracedthe concept of supplier partnerships, and focused on lowest total costinstead of lowest price. Today, Avon buys most of its inventory from sup-pliers that are close to its factories in Poland and Germany. Although thecompany may pay a slightly higher price on a per-unit basis, the benefitsof managing far fewer relationships with more flexible, responsive sup-pliers result in a lower total cost overall.
Dealing with a smaller number of suppliers delivered other dividendsas well. Explains Watson, “Because we have longer-term relationships, wecan invest together in new, better ways of working.” For example, Avonworked with its suppliers and a London-based design firm to create a bet-ter product design. In the process of standardizing the bottles for its differ-ent products, Avon asked its suppliers for help in designing new bottles inthe most cost-effective way. The suppliers were able to explain why certainapproaches were more costly than others—how a lighter-weight bottlesaves on materials, for instance, or how a bottle with a specific geometrycomes off the production line almost twice as quickly.
Avon also sat down with its suppliersand mapped out the whole manufacturingprocess, looking for ways to take out timeand money. Together they identified wherethere were inefficiencies and why. In manycases Avon had to change its own approachso that suppliers could manufacture its prod-ucts more cost-effectively. For instance, Avonagreed to change its order patterns to reducethe suppliers’ manufacturing setup costs.
Avon has stopped placing ordersentirely with some suppliers, instead givingthem access to production information via a Web-based system designedon the back of its own avon.com Web site. The suppliers just look at thefactories’ production schedules and deliver accordingly.
BUILDING ON SUCCESS: COLLABORATIVE DESIGN
Avon plans to extend the concept of collaboration throughout the supplychain organization. The company recently conducted a collaborative designworkshop that included suppliers, a design firm, and representatives frommarketing and the supply chain—40 people in a room trying to design a
Avon had to changeits own approach sothat suppliers couldmanufacture itsproducts more cost-effectively.

98 Strategic Supply Chain Management
product. Within three days the team had designed the concept for a newpackage that was stunning from marketing and design perspectives but alsominimized costs at each step of the supply chain. A key part of the processwas getting everyone’s input.
For example, the back of a truck can hold only so many pallets, butthe right box and bottle designs can optimize the number of boxes in eachpallet and the number of bottles in each box. If Avon could increase thenumber of boxes on each truck by 20 percent, the company would savehundreds of thousands of dollars in transportation costs each year. Onlythe person who loads the truck every day knows these things, but in thepast that person’s knowledge wasn’t considered in the design process.Instead, product costs were locked in early by someone making isolateddecisions in the design studio. Explains Watson of the new collaborativedesign approach, “This isn’t about any particular area of the supply chain.It’s about making sure that when we design products, we design them witheveryone in mind.”
The workshop was a major investment of time and people, but Avonexpects to save several million dollars over the next few years because ofdesigning the product right—and another $50 million with ongoing use of the strategy.
REORGANIZATION—AND THE CHANGE-MANAGEMENTCHALLENGE
Once the supply chain processes were redesigned, Avon turned its atten-tion to the new organization—and restructured it around the four keyprocesses of plan, source, make, and deliver. Now, instead of a large num-ber of people from different functions and countries reporting to him,Kitchener has just four direct reports—the four process heads. “Now wehave four megaprocesses and four people empowered to drive that acrossEurope,” says Kitchener. “As the person heading this up, I cannot tell youhow much less complex it is. It’s a far simpler model to manage than theold model.”
One of Avon’s biggest challenges has been making the concept of aprocess-driven, collaborative, regional organization in Europe work wellon a day-to-day basis. The redesign completely changed the roles andresponsibilities of the general managers across Europe. They once man-aged the inventory in their own markets, for instance, but now that prod-uct labeling is postponed until shipment, it no longer makes sense for theGMs to own inventory. Instead, Avon holds it farther back in the supply

AVON PROFILE: Calling on Customers Cost-Effectively 99
chain to better allocate it to where demand is greatest. As a result, the met-ric on inventory days that used to be the general managers’ responsibilitynow belongs to the supply chain organization, along with the other day-to-day supply chain activities. In the new organization, the GMs are pri-marily responsible for sales. This change, combined with the need forpeople to work cross-functionally and collaboratively, has been hard toimplement because of the major behavioral changes involved. Notes Toth,“It’s a cultural change—a cultural revolution, really.”
Avon did a lot of work to define primary responsibilities, sharedresponsibilities, and the supporting metrics. The transformation team real-ized that a regional, process-based organization demanded very differentmetrics than a country-based, functionally oriented organization. Settingup metrics early on and monitoring them often were critical to success—and helped keep everyone focused on what was important. These had tobe tangible metrics such as operating margin, service improvement, andinventory levels—metrics that linked back to the original business case,metrics that people could be measured against.
Many of the old metrics were backward-looking. Inventory days, forinstance, is a good end-of-month measure, but it doesn’t help with day-to-day operations. Avon developed metrics that are more operationallyfocused and can be influenced in the short term. As an example, the com-pany broke down the key drivers of inventory levels. One was supplierlead time, which Avon has taken steps to shorten by giving certain suppli-ers access to production schedules and making them responsible for deliv-ering materials on time.
By clearly communicating the redesigned structure and accountabil-ities and defining new performance metrics, Avon began to move the newsupply chain organization forward. Says Toth, “Once you change the rolesand responsibilities and set up clear KPIs [key performance indicators] forindividuals at the country level and at the regional level, it starts to becomeinstitutionalized.”
Education and training were another critical piece of Avon’s supplychain transformation. The company quickly saw that the skill levels inthe organization had to be upgraded. Avon analyzed all the critical jobsin the new supply chain and the competencies needed to do those jobs. Tofill the gaps, Avon partnered with Cranfield University, one of the lead-ing supply chain business schools in Europe, to develop a customizedcurriculum. Avon put 75 of its key supply chain associates through theprogram and offered a shorter version to the senior executives whoweren’t involved in the redesign. To introduce new thinking, the program

100 Strategic Supply Chain Management
brought in several experienced supply chain managers from other leadingcompanies in a range of industries. Avon plans to repeat the programevery year with new groups of people to ensure that everyone in the orga-nization understands what a world-class supply chain looks like.
The leaders of Avon’s transformation agree that communication isperhaps the single most critical success factor—and the one they mostunderestimated. Everyone in the organization must understand the change,why it’s happening, and his or her role in the new world. Even with thebest-laid plans, though, changing a culture and long-held behaviors doesn’thappen overnight. “You always read in books about how tough changemanagement is, but the reality is that it’s even harder,” notes Watson.
Avon was very clear on the fact that its supply chain transformationwould be process-driven, not systems-driven. Instead of overhauling itscomputer systems, the company focused on getting the processes rightfirst. The leadership team felt that doing both at once would be unman-ageable. Therefore, aside from creating the central data repository and theWeb-based system for suppliers, systems upgrades were put on hold—even though Avon’s country-based, entrepreneurial model had resulted ina jumble of systems and no integration.
This lack of integration is starting to cause problems now. Given thegrowing complexity of the business and the need for greater speed andresponsiveness, not having the system and information in place is frustrat-ing. Mindful of these problems, Avon has begun designing a new, globalplatform to replace the existing system and support the new processes.
In the meantime, the company is savoring the results of its transfor-mation effort. By rethinking the supply chain, increasing efficiency, and tak-ing out costs, Avon will save about $50 million annually—or two grossmargin points. Almost half these benefits are a direct result of the com-pany’s new approach to working with suppliers: the smaller supplier base,local sourcing strategy, supplier partnerships, and collaboration. Just asimportant, Avon Europe is far easier to manage now that it has a streamlinedorganization, upgraded skills, simplified processes, and the right metrics.
“I don’t say this lightly, but this has been the most challenging, themost rewarding, and the most fun thing that I’ve ever done,” says Kitchener,a 30-year veteran of the company. “The journey isn’t over, though. It’s never over.”
3 C H A P T E R
Core Discipline 3:Design Your Organizationfor Performance
101
Many companies still think of their supply chain organization as a set offunctions that complements manufacturing or as a set of “operations”departments such as receiving, production, and logistics. To provide effec-tive end-to-end supply chain management, however, the organizationshould include all the core supply chain processes—plan, source, make,deliver, and return—as well as the supporting infrastructure. That meansgrouping these processes under one senior manager and, more important,giving that manager a set of cross-functional performance objectives andthe resources needed to meet those objectives. This is the key characteris-tic of the integrated model of supply chain organization to be described inmore detail later in this chapter.
An integrated organization requires new skills and a new way ofthinking about organizational structure. The complexity of today’s supplychains and the advent of highly sophisticated technologies have funda-mentally changed the skills needed within the supply chain organization.As a result, companies face three primary challenges:
◆ Determining how to structure the organization◆ Defining roles and responsibilities◆ Finding the right people with the right skills
Copyright © 2005 by The McGraw-Hill Companies, Inc. Click here for terms of use.

102 Strategic Supply Chain Management
Moving to an integrated model doesn’t necessarily mean overhaul-ing your existing operations, creating a new department, or “inventing” anew vice president. It does mean ensuring that your supply chain organi-zation is a collection of departments and people clearly responsible forexecuting and continuously improving each of the core processes. Thus,even if you don’t plan to group these departments and people togetherthrough a large-scale reorganization, you most likely will need to considersome level of change to your existing organization to ensure that it is ableto support integrated, cross-functional process management. This maymean consolidating two departments to eliminate a functional boundary orprocess handoff, rescoping the responsibilities within a particular group,or realigning existing groups to focus on specific channels or customers.
You also may need to revaluate the skills within your current organi-zation. Certainly, a high degree of fluency with state-of-the-art informationsystems is a must for virtually any key supply chain position. Technicalskills aren’t enough, though. Only focused management skills will set yourorganization apart from the competition. Today’s supply chain requires peo-ple who can assimilate and interpret vast quantities of data and then makeeffective decisions. It requires people who have breadth of operational expe-rience and depth of process knowledge, people who have a passion for sat-isfying customers. It requires people who can embrace new measures astools to help improve overall performance. And, as if this were not enough,the cross-functional nature of the end-to-end supply chain also demandsconflict-resolution skills.
ORGANIZATIONAL CHANGE IS AN ONGOING PROCESS
Your supply chain organization should be evolving constantly, but severalconditions may drive more major change. Any significant supply chainimprovement effort, for instance, may make it necessary to redefine roles andresponsibilities to focus on the right objectives, modify organizational struc-tures to reduce process complexity, or develop new competencies and skills.Similarly, updates to your company’s overall strategy may render existingcompetencies obsolete or give rise to the need for new capabilities. Changesin the business environment, too, may make it necessary to improve specificsupply chain capabilities. Or you simply may have to “clean house” or rede-ploy resources that are underperforming.
Changes in how you evaluate supply chain performance also candrive organizational changes. In a traditional functional organization, met-rics often are designed to optimize performance within a specific depart-

CHAPTER 3 Core Discipline 3: Design Your Organization for Performance 103
ment or function. But as your supply chain strategy and processes evolve,you’ll need to embrace a new set of metrics designed to optimize perfor-mance for the company as a whole, as we’ll discuss in Core Discipline 5.If you don’t restructure and develop your organization in a way that sup-ports these new performance objectives, you’ll likely fall short of your targets and sabotage your supply chain strategy.
We rarely see a shift in strategy so major that it drives a fundamen-tal rethinking of needed skills and an organizational overhaul. Becauseyour supply chain organization is responsible for executing your supplychain strategy, you’ll need to consider them both in parallel.
Stratex Networks, a leading provider of digital microwave radios,provides a case in point, illustrating how capabilities within the supplychain organization can be developed and improved as the supply chainstrategy becomes more focused and corresponding process changes aremade. In early 2002, Stratex made a strategic decision to focus on improv-ing its return on assets and customer service levels by elevating order-delivery performance and reducing order-fulfillment cycle time. Amongother changes, this meant a fundamental overhaul of the company’s oper-ations strategy and a move to outsourced manufacturing. The companyembarked on an aggressive schedule for the transfer of production fromSan Jose, California, to a manufacturing partner in Taiwan.
In parallel with the transfer of manufacturing, Robert Schlaefli,Stratex vice president of global operations, launched an initiative to fun-damentally redesign the company’s core supply chain processes to supportthe new manufacturing model.1 The company needed to maintain strongrelationships with several key suppliers while transferring responsibilityfor most materials purchasing to its new manufacturing partner. Stratexalso was concerned about the communication challenges inherent in anoutsourcing relationship and wanted to ensure that customer requirementscould be collected, integrated, and acted on as quickly as possible.
Many of the new processes were designed to optimize the flow of anorder as it progressed through the configuration and manufacturingprocess—for example, the criteria for accepting a customer order wereupdated, and checklists were put in place to ensure that all critical infor-mation was available prior to order entry, eliminating the delays thatoccurred when required data had to be researched after the order wasalready in process. But Stratex still had information gaps between func-tional groups and confusion about which function ultimately was respon-sible for order-delivery performance. While regional sales administration,finance, order management, planning, procurement, and traffic were each

104 Strategic Supply Chain Management
responsible for a subset of the data included within each sales order, nonehad ultimate accountability for ensuring that commitments to the cus-tomer were made on a timely basis—or kept once they were made.
Stratex quickly concluded that the many handoffs inherent in itscurrent organizational structure would not support the new strategy. Theneed to improve delivery performance and the decision to outsource pro-duction really elevated the importance of the order-fulfillment process.Stratex needed to start thinking about the management and scheduling oforders, the configuration of the product, and the shipment to the customeras one process, not three or more.
Prior to the move to outsourcing, Stratex had a very traditional oper-ations organization, with distinct functional groups responsible for orderentry, order management, production, planning, sourcing, and logistics (seeFigure 3-1). While the groups interacted frequently, Schlaefli felt that hispeople were passing information back and forth, as opposed to sharingcommon information. Communication about delivery schedules betweenfunctional groups and when interacting with customers was inconsistent,and both salespeople and customers expressed frustration at being unableto get an accurate order status.
Stratex’s solution was to recraft the organization, with a new groupfocused on managing the entire order-execution process from the time anorder is entered to the time the product is shipped to the customer. Stratexcreated an order-fulfillment team and moved the traffic functions within
F I G U R E 3–1
Stratex operations before adopting the outsourcing model.
OrderFulfillment
ProductionMaterials
ManagementCustomerService
DemandManagement
GlobalOperations
Planning
Inventory Control
Procurement
Traffic
Shipping
Receiving
Configuration
Assembly
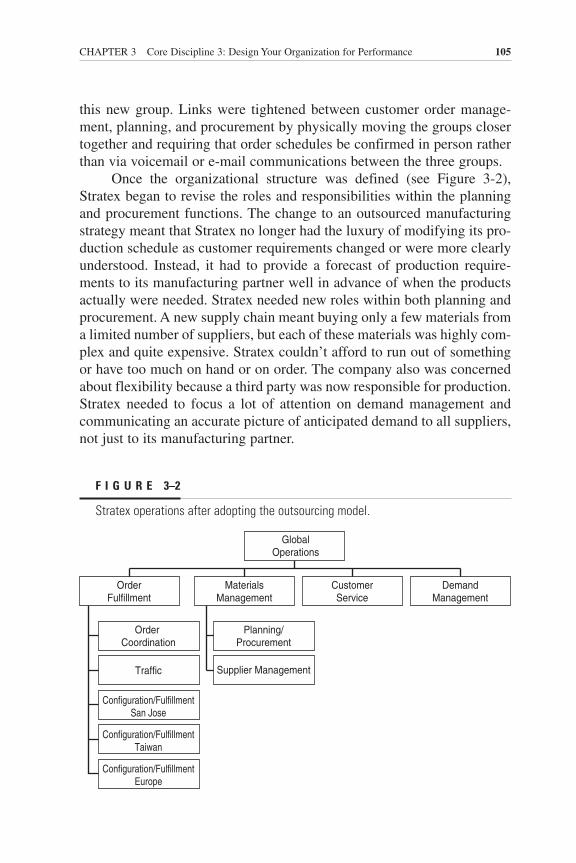
CHAPTER 3 Core Discipline 3: Design Your Organization for Performance 105
this new group. Links were tightened between customer order manage-ment, planning, and procurement by physically moving the groups closertogether and requiring that order schedules be confirmed in person ratherthan via voicemail or e-mail communications between the three groups.
Once the organizational structure was defined (see Figure 3-2),Stratex began to revise the roles and responsibilities within the planningand procurement functions. The change to an outsourced manufacturingstrategy meant that Stratex no longer had the luxury of modifying its pro-duction schedule as customer requirements changed or were more clearlyunderstood. Instead, it had to provide a forecast of production require-ments to its manufacturing partner well in advance of when the productsactually were needed. Stratex needed new roles within both planning andprocurement. A new supply chain meant buying only a few materials froma limited number of suppliers, but each of these materials was highly com-plex and quite expensive. Stratex couldn’t afford to run out of somethingor have too much on hand or on order. The company also was concernedabout flexibility because a third party was now responsible for production.Stratex needed to focus a lot of attention on demand management andcommunicating an accurate picture of anticipated demand to all suppliers,not just to its manufacturing partner.
F I G U R E 3–2
Stratex operations after adopting the outsourcing model.
OrderFulfillment
Planning/Procurement
Supplier Management
Order Coordination
Traffic
Configuration/FulfillmentSan Jose
Configuration/FulfillmentTaiwan
Configuration/FulfillmentEurope
MaterialsManagement
CustomerService
GlobalOperations
DemandManagement

106 Strategic Supply Chain Management
While the new organizational design was not put into place all at once,Stratex kept the end state in view as the company began to use the newprocesses. “Our new model meant that the buying and material planningtasks were going to blend,” says Schlaefli. “You can’t just take a tacticalbuyer who has been placing purchase orders by following system-generatedrecommendations and suddenly turn him into a planner who needs to beable to make decisions without completely concrete data. We had to do a lot of retraining and, in some cases, some strategic hiring to develop theorganization we wanted.” Stratex provided on-site APICS2 training for allbuyers and planners and hired several new employees with significantexperience in sourcing and master production scheduling processes.
The restructuring was completed over a period of several months,roughly following the schedule of the manufacturing transition. The com-pany met an aggressive schedule to ramp production at its manufacturingpartner—with no negative impact on customer service levels. At the sametime, the increased focus on the planning process and the associated upgradeof planning skills allowed Stratex to cut inventory liabilities dramatically.The new organization was a key factor in Stratex’s ability to realize the ben-efits of the company’s new strategy. “This didn’t happen overnight,” saysSchlaefli. “Having a map of where we wanted to go with the organization
made it a lot easier to implement the neces-sary process changes.”
As the Stratex example shows, overalldesign, combined with clearly defined rolesand responsibilities and skilled people, canhelp a company build an integrated supplychain organization that drives forward itsstrategy. Your organizational design shouldnot be static—it should evolve with yourcompany.
Sweeping changes to operationalprocesses are not a prerequisite for restructuring your supply chain orga-nization. Organizational changes can improve overall performance evenwithout major process changes. Even relatively minor process changesand an organizational adjustment can generate tremendous benefits.
Consider the case of Smith Bits, which uses state-of-the-art tech-nologies to design and manufacture a full line of drilling bits for the oil-field and mining industries. In late 2002, the company was struggling withrising field inventories despite growing customer demand. At the sametime, it was losing sales because the right bits were unavailable and order-
Your organizationaldesign should not bestatic—it shouldevolve with yourcompany.

CHAPTER 3 Core Discipline 3: Design Your Organization for Performance 107
fulfillment lead times for sold bits were increasing. Hurt by the lack ofproduct availability and long lead times, sales offices around the worldbegan hoarding bits to ensure product availability to meet customerdemand. Often a bit stocked in one region with no demand would not bemade available to another region with customer orders.3
Smith Bits had a functional organizational structure—sales, engi-neering, and operations all reported to the division president. Based onour recommendation, the company created a new supply chain organiza-tion charged with demand/supply balancing run by a director-level oper-ations manager. Everyone who manages inventory in the sales offices ispart of this group, which reports to the vice president of worldwide sales.
Once manufactured, the bits are the responsibility of this newgroup until they’re sold. The group reviews orders that can’t be filledlocally, reallocates inventory from one region to another as needed, andworks with manufacturing to get more bits made, deciding whichshould be stocked and which should be made to order. The group alsosets up weekly demand/supply balancing meetings with manufacturingand helps that organization improve production cycle times by priori-tizing field requirements. The results are impressive. By sharply reduc-ing inventory levels, Smith Bits substantially improved cash flow andallowed opportunities for added revenue through several strategicacquisitions.
The Smith Bits example shows how companies can make majorimprovements in their operations without changing their fundamentalstrategies. Smith Bits moved the plan and deliver processes out of opera-tions and created a new supply chain organization. This new group for-mally linked the make and source processes through its weekly meetingswith manufacturing and by setting up clear responsibilities for inventorylevels and customer service. By modifying operating processes andadjusting the organizational structure and roles, Smith Bits was able togain a strong competitive advantage and raised its customer service level.As Vice President Mike Pearce notes, “The organizational change had ahuge impact on how we thought about our supply chain and provided vis-ibility for the first time into how the actions within one region affect cus-tomer service in another.”
What makes for an effective supply chain organization? Just as thereis no universal definition for the supply chain organization, there is no one-size-fits-all approach to creating one. There are, however, several charac-teristics that increase the odds of success. Based on our observation andexperience, an effective organization:
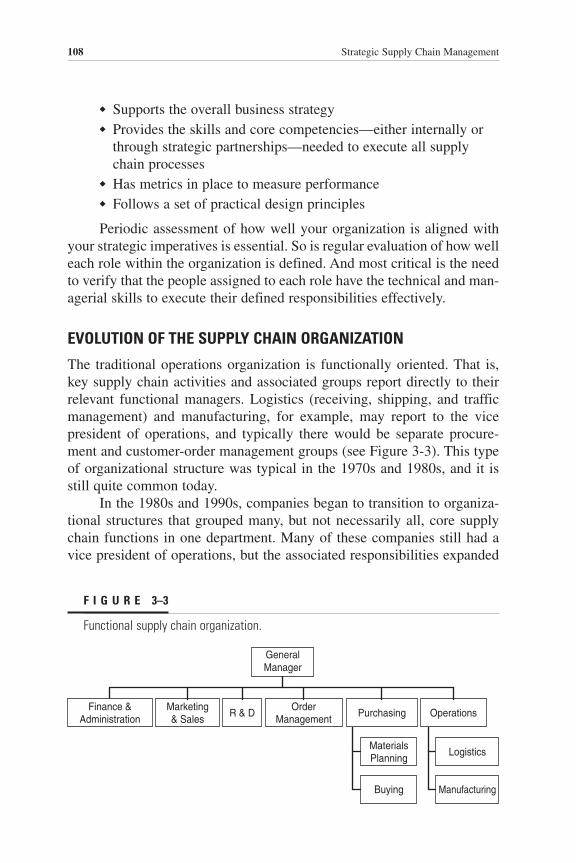
108 Strategic Supply Chain Management
◆ Supports the overall business strategy◆ Provides the skills and core competencies—either internally or
through strategic partnerships—needed to execute all supplychain processes
◆ Has metrics in place to measure performance◆ Follows a set of practical design principles
Periodic assessment of how well your organization is aligned withyour strategic imperatives is essential. So is regular evaluation of how welleach role within the organization is defined. And most critical is the needto verify that the people assigned to each role have the technical and man-agerial skills to execute their defined responsibilities effectively.
EVOLUTION OF THE SUPPLY CHAIN ORGANIZATION
The traditional operations organization is functionally oriented. That is,key supply chain activities and associated groups report directly to theirrelevant functional managers. Logistics (receiving, shipping, and trafficmanagement) and manufacturing, for example, may report to the vicepresident of operations, and typically there would be separate procure-ment and customer-order management groups (see Figure 3-3). This typeof organizational structure was typical in the 1970s and 1980s, and it isstill quite common today.
In the 1980s and 1990s, companies began to transition to organiza-tional structures that grouped many, but not necessarily all, core supplychain functions in one department. Many of these companies still had avice president of operations, but the associated responsibilities expanded
F I G U R E 3–3
Functional supply chain organization.
Marketing& Sales
R & DOrder
ManagementPurchasing
Buying Manufacturing
Operations
GeneralManager
Finance &Administration
MaterialsPlanning
Logistics
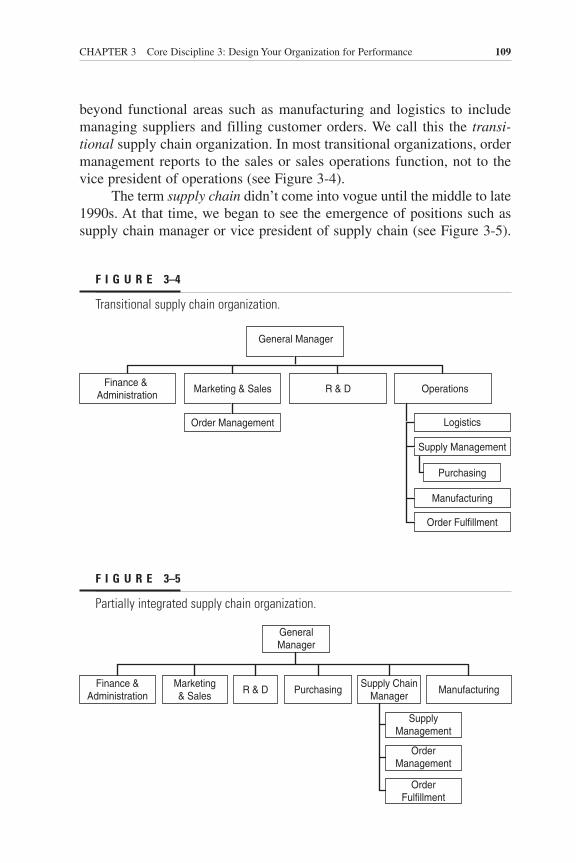
CHAPTER 3 Core Discipline 3: Design Your Organization for Performance 109
beyond functional areas such as manufacturing and logistics to includemanaging suppliers and filling customer orders. We call this the transi-tional supply chain organization. In most transitional organizations, ordermanagement reports to the sales or sales operations function, not to thevice president of operations (see Figure 3-4).
The term supply chain didn’t come into vogue until the middle to late1990s. At that time, we began to see the emergence of positions such assupply chain manager or vice president of supply chain (see Figure 3-5).
F I G U R E 3–4
Transitional supply chain organization.
Marketing & Sales
Order Management
Supply Management
Manufacturing
Order Fulfillment
R & D Operations
General Manager
Finance & Administration
Logistics
Purchasing
F I G U R E 3–5
Partially integrated supply chain organization.
GeneralManager
Marketing& Sales
R & D PurchasingSupply Chain
ManagerManufacturing
OrderManagement
OrderFulfillment
Finance &Administration
SupplyManagement

110 Strategic Supply Chain Management
This period also marked the beginning of the now-widespread philosophyof the supply chain as an end-to-end process.
What’s in a Name?
The actual titles used within an organization are far less important than theassociated roles, responsibilities, and span of control. Although we’re usingtitles such as operations vice president and vice president of supply chain,your company may choose any title you deem appropriate—depending onthe size of the organization, the existing hierarchy, and any policies relatedto the assignment of job titles.
We started this chapter with a discussion of the integrated model, inwhich the supply chain organization is a separate function or entity. Inthis model, a supply chain management group is responsible for cross-functional operational objectives, such as inventory days of supply, order-fulfillment lead time, or customer on-time delivery. In the integratedmodel, the supply chain manager has full control over the resourcesneeded to execute the supply chain strategy (see Figure 3-6).
At first glance, the transitional and integrated models may look verysimilar, but the difference is in much more than rearranging a few boxeson the organization chart or renaming functions. The concept of a “holis-tic” supply chain organization as depicted in the integrated model is rel-atively new.
F I G U R E 3–6
Integrated supply chain organization.
GeneralManager
Marketing & Sales R & D Supply Chain Manager
Supplier Management
Purchasing
Order Management
Order Fulfillment
Manufacturing
Finance &Administration

CHAPTER 3 Core Discipline 3: Design Your Organization for Performance 111
GUIDING PRINCIPLES FOR ORGANIZATIONAL DESIGN
There are many ways to structure an integrated organization, and hun-dreds of publications on organizational behavior, human resources man-agement, and organizational change management try to offer guidance.But there is no off-the-shelf blueprint for designing an effective supplychain organization. And to compound the difficulty, there is likely to belimited tolerance for an ineffective design because the supply chain runsat the core of the business’s ability to generate daily revenues.
The decision to set up an integrated supply chain organization isonly the first step of many, but it is a strategically important one with pro-found consequences. As you plan, design, develop, and implement yournew organization, keep in mind these four guiding principles:
◆ Form should follow function—that is, organization should mirrorprocess.
◆ For every process, assign an accountable function or individual.◆ Know, grow, and keep your core capabilities.◆ Organize around the skills you need, not the skills you have.
Let’s look at each of these principles more closely.
Form Follows Function
Many companies still use a traditional operations model. Yet improvingend-to-end supply chain performance is extremely difficult in an organi-zation with a functional structure and management responsibilities. Thisis why any integration of your supply chain processes likely will requiremajor organizational change to align your people, processes, and metricsto support your strategy.
Agere Systems is an example of a company that reorganized to sup-port a new top-down planning capability. Agere provides advanced inte-grated-circuit solutions to manufacturers of personal computers (PCs),wireless terminals, network equipment, and disc drives. In the mid-1990sthe company made major investments in supply chain systems for enter-prise resource planning (ERP) and advanced planning and order manage-ment. With the new systems in place, it was able to do fully integrated,automated planning—everything from high-level supply chain planning toproduction scheduling for each manufacturing facility—on a daily basis.
The goal was to greatly simplify planning, keep manual intervention toa minimum, and improve customer service while improving asset utilization.
112 Strategic Supply Chain Management
Agere management expected its planners to accept most of the system’s rec-ommendations. Instead, they were overriding the system more than 90 per-cent of the time.4
Why? Agere’s product-focused business units were responsible foracknowledging orders. Planners within these decentralized business unitschanged order due dates constantly—in response, they explained, to chang-ing customer needs. In other words, the planners’ information was more cur-rent than that of the planning system, and overrides were necessary to meetthe performance goals for order delivery.
Agere also had a centralized planning group responsible for allocatingproduction capacity to the various product groups. Not surprisingly, thisgroup had a hard time responding to the constant stream of changes in orderpriority. This turmoil spilled into manufacturing, where production man-agers had to reshuffle their production schedules constantly to respond tothe newest set of priorities—an inefficient approach, to say the least.
When he investigated the root cause of this inefficiency, Peter Kelly,executive vice president, global operations group, found that while somereschedules were indeed due to actual changes in customer requirements,in most cases planners were deliberately “gaming” the system to secure ahigher priority for the orders they were managing.
Kelly wanted a planning process that was optimized at the highestlevel of the supply chain, not one geared to the needs of the various busi-ness units. He felt that effective supply chain planning would never occuras long as localized business-unit pressures and incentives drove the plan-ners. To solve the problem, Kelly created a new supply chain planningorganization that centralized planning activities and the responsibility fororder management.
Within six months, plan overrides had declined from more than 90percent to less than 50 percent. And as the number of overrides decreased,the time spent by planners on manual calculations and reprioritization wasreduced greatly. The planning group became much more focused onensuring data accuracy within both the planning system and customerorders, dramatically improving shipping performance from 75 to 95 per-cent and inventory turns by two turns during the next 12 months.
Agere had a clear catalyst for undertaking a major organizationalrestructuring: a failure to leverage its technology investment and a process-driven operational improvement plan with clear ownership. But you don’thave to wait for an adverse event to prod you into refitting the organizationto your supply chain processes. Where should you start? First, put asideany organizational charts and focus instead on the activities within your

CHAPTER 3 Core Discipline 3: Design Your Organization for Performance 113
core supply chain processes. Group the major activities, keeping in mindthat every participant in each process is both a customer and a supplierand that every supply chain event or task has both an input and an output.Identify the people responsible for executing the plan, source, make,deliver, and return processes, focusing on the tasks they perform ratherthan on the name of the group to which they report.
As you begin to sketch the lines around the groups responsible for sup-ply chain planning and execution, remove the real or perceived boundariesbetween functions and bring complementary skill sets closer together. Bysetting up a new supply chain planning department, Agere was able to bothconsolidate planning activities within a centralized group and remove theboundaries between the business units and the supply chain organization.
Be aware that removing the borders between groups destroys thetraditional functional organization and may result in managers becomingindividual contributors, presidents reporting to managers, or whole groupsdispersed and reallocated elsewhere. In some cases you may create anentirely new division organized around supply chain processes.
IBM did just that in 2002, when it established the integrated supplychain (ISC) organization.5 Within just 12 months, IBM pulled together allthe pivotal functions of the supply chain, combining its front-end cus-tomer support teams, manufacturing, procurement, and logistics into anew unit. In so doing, it brought together about 19,000 employees in 100locations in 59 countries. IBM had long used a solutions-based businessmodel—one that combines technology, products, and services—andwanted to adapt its supply chain to support this model. It found that justchanging the reporting structure, moving like skills together, and breakingdown the walls between manufacturing, procurement, and distributionyielded immediate benefits. The next steps were to establish commongoals and objectives, well-defined roles and responsibilities, and a strongmanagement system with clear measurement and accountability.
Kraft Foods North America also created an organization designedaround core supply chain processes with the expectation that streamliningthe supply chain would reduce the cost of goods sold and improve thecompany’s bottom line.6 It structured an organization that encompasses allthe activities that go into delivering products to customers, from planningand production scheduling to transforming raw materials into finishedgoods and then packaging and distributing those goods.
The goal of an effective supply chain organization is to optimize the end-to-end order-fulfillment process—not individual functions—all the while achieving the lowest total cost. Kraft willingly invests in

114 Strategic Supply Chain Management
manufacturing, for instance, if it drivesequal or greater savings in transportation orwarehousing.
As these examples show, designing asupply chain organization is not aboutinventing new titles or creatively movingthe lines and boxes on an organizationalchart. It’s about form following function.Effective supply chain process designtightly integrates a series of disparate pro-cesses, whereas effective supply chainorganizational design tightly integrates thegroups and individuals responsible for exe-cuting those processes.
Every Process Requires Accountability
A functional or transitional organization islikely to promote activities that optimize performance within specificdepartments. In some companies, it’s not uncommon to find that supplychain metrics are used by one department to highlight the failings ofanother. These highlighted failings often serve to take focus away from lackof performance or improvement in the “accusing” department. These orga-nizational models also may leave gaps in terms of roles and responsibilities.By contrast, an integrated organization ensures that each essential role isdefined and that responsibility for executing each role is unambiguous.
In the integrated organization, it is critical to have a strong leader incharge of the overall supply chain and ultimately accountable for its suc-cess. Ideally, a senior-level manager on the executive team, this personmediates between functions and maintains an overall vision of the end-to-end process. Without this leadership role and clearly defined responsibil-ities throughout the supply chain, it will not deliver its full potential, andin some cases, serious performance problems can arise.
For example, we worked with a company that sells software toolsand related hardware in a crowded, competitive market dominated by fourmajor players. Despite the complexity of the products and a lengthy salesprocess, customers expected immediate product availability once the deci-sion to purchase was made. Our client wanted to differentiate itselfthrough superior order-delivery performance.
Although the products were technical, no custom configuration wasnecessary. The features and options purchased by the customer did have
The goal of aneffective supplychain organization is to optimize theend-to-end order-fulfillment process—not individualfunctions—all whileachieving the lowesttotal cost.

CHAPTER 3 Core Discipline 3: Design Your Organization for Performance 115
to be detailed in a custom contract, which a contract specialist had toreview and approve. The senior management team reviewed order-fulfill-ment cycle time on a monthly basis, and functional areas were diligentabout monitoring the cycle times associated with the major activitiesunder their jurisdiction.
The shipping department, for instance, was meticulous about track-ing the time needed to pick, pack, and prepare an order for shipment. Thisdepartment also tracked the various reasons why orders could not beprocessed and prepared a weekly report on those causes, which rangedfrom material shortages to obsolete product information to incorrect cus-tomer addresses.
Other departments used similar metrics to track the time an order satin their functional area and the causes of any delays. For example, theorder-entry group monitored how often orders arrived from the field withincomplete or erroneous information and how often customer orders ref-erenced products that had been phased out or were not yet available.Incomplete or incorrect orders were redirected to the function deemedbest suited to resolve the issue. Orders with more than one problem oftenmade multiple loops through the process before all issues could beaddressed (see Figure 3-7).
Department managers collected order-fulfillment metrics regularlybut used them mainly to justify or explain cycle times that were longerthan their functional targets and to redirect responsibility to the group(s)causing the problem. Rarely were metrics used as a tool to analyze theroot causes of delays or to correct errors early in the order-fulfillmentprocess. In effect, the metrics masked the problems within each functioninstead of clarifying them.
Faced with increasingly irritated customers and a sales force thatcomplained about time wasted chasing orders instead of developing newbusiness, the company’s executive team turned its attention to the supplychain and set an aggressive goal: to cut the average order-fulfillment cycletime from 25 days to 4 days or less.
We worked with the company to redesign its overall order-managementprocess and eliminate the functional boundaries that resulted in inefficienthandoffs. Using a RACI analysis (see the following page), we identifiedthe areas and processes with unclear or ambiguous accountability. Itquickly became apparent that no person or function had accountability forthe order-fulfillment process as a whole. No group had ultimate responsi-bility for ensuring accurate customer or product data or for shepherdingorders through the fulfillment process (see Figure 3-8 for results of aRACI analysis).

116 Strategic Supply Chain Management
RACI DefinedRACI is an acronym derived from the four potential roles that an individ-ual or function can play relative to a specific activity:
R—Responsible. Designates the person or function responsible forexecuting a particular activity. The accountable person determinesthe degree of responsibility. Responsibility can be shared.A—Accountable. Designates the person or function ultimatelyaccountable for completing the activity. There can be only oneaccountable person for a decision or activity, and accountabilitycannot be delegated.
F I G U R E 3–7
Order-fulfillment process at Company X before RACI analysis.
Yes
No
No
No
Yes
Yes
No
Yes
No
ReceiveOrder
Field SalesOffice
Sales OrderEntry
Sales OrderAdministration
ContractAdministration
Shipping
EnterOrder
VerifyCustomer
DataCorrect?
Correct?
UpdateOrder
Information
ApprovePricing
ApproveContract
ReleaseOrder
PickOrder
ValidProductData?
Pack &Ship
Order
VerifyProduct
Information
ReviewContract & Pricing
Standard Terms &Pricing?
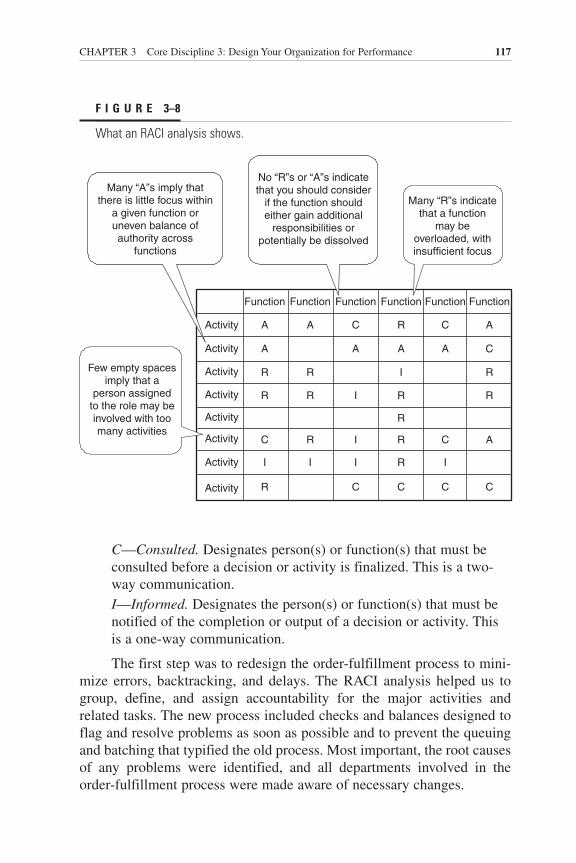
CHAPTER 3 Core Discipline 3: Design Your Organization for Performance 117
C—Consulted. Designates person(s) or function(s) that must beconsulted before a decision or activity is finalized. This is a two-way communication.I—Informed. Designates the person(s) or function(s) that must benotified of the completion or output of a decision or activity. Thisis a one-way communication.
The first step was to redesign the order-fulfillment process to mini-mize errors, backtracking, and delays. The RACI analysis helped us togroup, define, and assign accountability for the major activities andrelated tasks. The new process included checks and balances designed toflag and resolve problems as soon as possible and to prevent the queuingand batching that typified the old process. Most important, the root causesof any problems were identified, and all departments involved in theorder-fulfillment process were made aware of necessary changes.
F I G U R E 3–8
What an RACI analysis shows.
Activity
Activity
Activity
Activity
Activity
Activity
Activity
Activity R
I
C
R
R
A
A
Function
I
R
R
R
A
Function
C
I
I
I
A
C
Function
C
R
R
R
R
I
A
R
Function
C
I
C
A
C
Function
C
A
R
R
C
A
Function
No “R”s or “A”s indicate that you should consider
if the function should either gain additional
responsibilities or potentially be dissolved
Many “R”s indicate that a function
may be overloaded, with insufficient focus
Few empty spaces imply that a
person assigned to the role may be involved with too many activities
Many “A”s imply that there is little focus within
a given function or uneven balance of authority across
functions

118 Strategic Supply Chain Management
A new customer-order oversight position consolidated severaldepartments—order entry, contract administration, and order management—and had the added responsibility of being the primary liaison between thecustomer and the company. And the account manager’s responsibilities wereexpanded to include accountability for the accuracy of all customer and prod-uct data (see Figure 3-9).
At first, progress was slow. The tendency to shift blame for problemsto other functions was a hard habit to break, and some people resisted tak-ing responsibility for their new roles within the organization. After a fewmonths, however, the company began to accept the concept of joint own-ership and specific accountability.
As a result, errors were caught and resolved earlier in the process, andcycle times began to decline. The company continued to refine its supplychain processes and developed automated systems to address several of the newly apparent root causes of order delays. For example, a database of nonstandard but preapproved contract language was developed. Ithelped cut the time needed for contract reviews from over 5 days to lessthan 1 day. After 10 months, the company had exceeded its initial goal—order-fulfillment cycle time averaged just over 3 days (see Figure 5-4).
F I G U R E 3–9
Order-fulfillment process at Company X after RACI analysis.
Yes
No
No
Yes
ReceiveOrder
Field SalesOffice
Sales OrderManagement
Shipping
EnterOrder
VerifyCustomer
and Product
Data
ApprovalNeeded?
ApprovalExceptions
Correct?
UpdateOrder
Information
ReleaseOrder
PickOrder
Pack &Ship
Order
ReviewContract & Pricing
ValidateDeviations
fromStandard

CHAPTER 3 Core Discipline 3: Design Your Organization for Performance 119
This example shows that as supply chain strategy and associatedprocesses evolve, new metrics can help formalize accountability and driveoptimal company performance. The next step is to structure the organiza-tion in a way that supports these new metrics and ensures that each personhas a clearly defined role with a clear set of responsibilities.
In general, you should choose key metrics and define target perfor-mance levels before you finalize your supply chain process design. Onceyou’ve set performance objectives and the operating processes needed tomeet those objectives, you’re ready to rethink your supply chain organi-zation, choosing what to do, who should do it, and how. Finally, align yourorganizational accountability with your key metrics and target levels ofperformance.
Know and Grow Your Core
Before mapping an organizational design, it’s important to lay out bothcurrent and desired core competencies. These will serve as a foundationfor structuring the organization. Core competencies are defined in manyways, but internal capabilities can be considered core when they confer acompetitive advantage or are otherwise essential for achieving your com-pany’s strategic objectives.
Relating your company’s core competencies to your supply chainstrategy likely will be an iterative activity. Don’t try to force-fit existingcapabilities onto the needs dictated by your strategy—it won’t work. Norshould you let your organization’s capabilities limit your company’sstrategic objectives.
Is a core competency something you should be good at? Yes. Is acore competency something you are good at? Maybe. How do you know?First, take stock of what you have. In many cases metrics will tell youwhich activities your company excels at, but don’t assume that thoseactivities are core competencies or that subpar performance areas are“not core.”
As we saw in Chapter 1, the first step toward making an outsourcingdecision is deciding what you’re really good at and which areas are—orhave the potential to become—strategic differentiators. These are the activ-ities to keep in-house. Other activities may be better performed by third-party providers and their ever-expanding menu of services. For instance,Flextronics describes how it has upgraded its role as “vendor” to that of“virtual manufacturer” to technology companies by offering design, engi-neering, manufacturing, and logistics solutions.7 This approach reassuresOEM customers that by choosing Flextronics as a partner, they will be free

120 Strategic Supply Chain Management
to focus on their other core competencies—such as research and develop-ment, sales, marketing, and branding.
By jettisoning noncore activities, companies are promised manybenefits: greater focus on remaining activities, economies of scale, buyingpower, sophisticated planning tools and systems, and access to state-of-the-art production equipment—all without making large capital invest-ments. But what if what’s left after outsourcing is insufficient to driveeffective performance? We refer to this as thinning the core.
In some cases a company becomes increasingly reliant on supplychain partners, and the remaining core begins to shrink in unintendedways. The people left within the company may have little personal expe-rience with core operations processes, such as materials planning, supplierdevelopment and management, and demand management. This can resultin a vicious cycle: The company continues to lose internal operations tal-ent and becomes less effective. Companies simply may forget how to per-form activities once considered essential for day-to-day operations.
Mike McNamara, chief operating officer at Flextronics, sees manycompanies who have allowed their core to become too thin. “It’s impor-tant for us to have people within our customers’ companies with whom wecan ‘talk supply chain,’” he says. “We see a lot of companies who are nolonger capable of performing some very critical activities.”8
This is an issue for Flextronics when they work with customers todevelop the parameters that will govern the relationship between the twocompanies—and when they are attempting to execute on a day-to-daybasis. “If there is no one within the customer’s organization who candevelop a long-term demand plan,” says McNamara, “it’s very hard for usto get set up in the way that will serve them most efficiently.”
Companies can easily underestimate the complexity and competencebuilt into their operational processes or misread the ease with which thesecapabilities can be transferred to supply chain partners. Maintainingstrong links between newly outsourced operations and those kept in-housealso can be a challenge. Very often the decision to outsource one or moreof your core supply chain processes will require that you develop a newcore competency—the ability to manage partners effectively.
How do you know what your core competencies are or should be?Remember that all essential supply chain processes must exist some-where within your supply chain—whether inside your company orbeyond your borders in the extended supply chain (the chain of chains).Review your company’s basis of competition and understand the processelements that must be in place to support it. Ask yourself, “Is this activ-
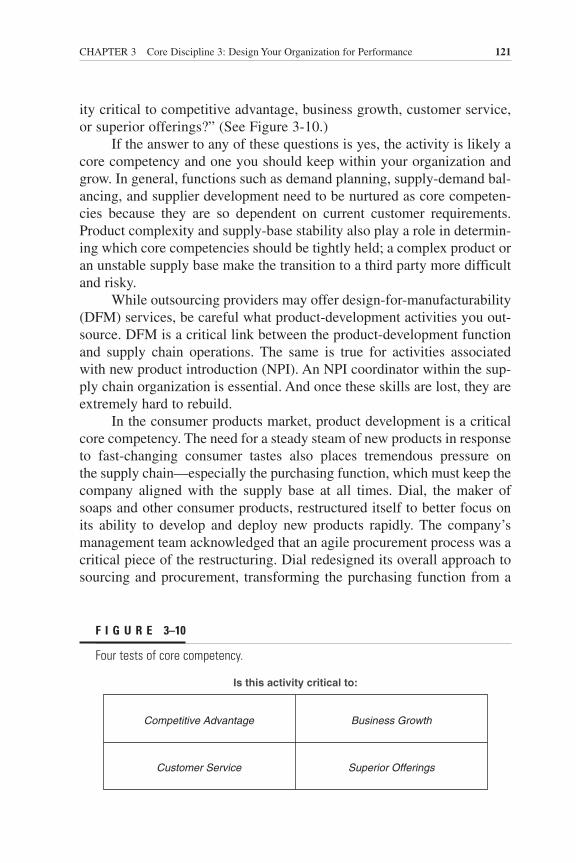
CHAPTER 3 Core Discipline 3: Design Your Organization for Performance 121
ity critical to competitive advantage, business growth, customer service,or superior offerings?” (See Figure 3-10.)
If the answer to any of these questions is yes, the activity is likely acore competency and one you should keep within your organization andgrow. In general, functions such as demand planning, supply-demand bal-ancing, and supplier development need to be nurtured as core competen-cies because they are so dependent on current customer requirements.Product complexity and supply-base stability also play a role in determin-ing which core competencies should be tightly held; a complex product oran unstable supply base make the transition to a third party more difficultand risky.
While outsourcing providers may offer design-for-manufacturability(DFM) services, be careful what product-development activities you out-source. DFM is a critical link between the product-development functionand supply chain operations. The same is true for activities associatedwith new product introduction (NPI). An NPI coordinator within the sup-ply chain organization is essential. And once these skills are lost, they areextremely hard to rebuild.
In the consumer products market, product development is a criticalcore competency. The need for a steady steam of new products in responseto fast-changing consumer tastes also places tremendous pressure on the supply chain—especially the purchasing function, which must keep thecompany aligned with the supply base at all times. Dial, the maker ofsoaps and other consumer products, restructured itself to better focus onits ability to develop and deploy new products rapidly. The company’smanagement team acknowledged that an agile procurement process was acritical piece of the restructuring. Dial redesigned its overall approach tosourcing and procurement, transforming the purchasing function from a
F I G U R E 3–10
Four tests of core competency.
Is this activity critical to:
Competitive Advantage Business Growth
Customer Service Superior Offerings

122 Strategic Supply Chain Management
decentralized organization operating at the site level to a central bodyheaded by a senior-level executive. The company combined all of Dial’spurchasing and put commodity experts in charge of buying raw materials.The chemical buyer, for instance, is a trained chemist who understands thedetails of chemical composition. Dial also simplified its supply base,working closely with a smaller number of key suppliers and consolidatingits buying power across different business units. Finally, the companydeveloped a system for implementing innovative cost-savings ideas. Whatwas the combined result of these actions? Total savings of $100 millionover five years.9
Dial is an excellent example of how to build core competencieswhile developing a supply chain organization. Management saw the needfor commodity experts with deep technical knowledge of the propertiesand characteristics of the materials for which they were responsible.Procurement expertise was identified as an area in which thinning wasunacceptable.
To apply a similar approach in your own company, start with a listof key supply chain processes and the core competencies needed to exe-cute those processes. Use your company’s longer-term strategy as a guideto establish this list of proficiencies. Summarize the skills that will beneeded to create or defend competitive advantage, to help grow the busi-ness, and to ensure customer satisfaction. Next, identify any gaps betweenthe skills needed and those already in place. Finally, get consensus onwhether to develop these skills in-house through training and targeted hir-ing or to use supply chain partners to fill the gaps.
GAINING RESPECT FOR THE SUPPLY CHAIN DISCIPLINE
To establish the supply chain as a strategic asset, the leader of the supplychain organization must be accorded status on a par with other membersof the executive management team. Many companies remain locked in a traditional paradigm in which sales, marketing, and development are considered the architects of the company’s strategic direction, whereaspurchasing, manufacturing, and distribution are thought of as tactical exe-cuters. While bemoaning high inventories, late shipments, or missed rev-enue opportunities, few companies see the potential value that effectivesupply chain management can deliver or view supply chain managementas a critical area of expertise. Without the support of the executive teamand a clear mandate for the supply chain leader to champion improvementefforts, major business-impacting opportunities are left underexploited.

CHAPTER 3 Core Discipline 3: Design Your Organization for Performance 123
The development of supply chain man-agement as a core competency and an orga-nizational imperative doesn’t just happen—aconscious effort is needed. As a discipline,supply chain management is constantlyevolving, and its impact on business perfor-mance is growing. Staying on top of bestpractices in supply chain management ischallenging enough; ensuring that the rest of your company does the same is even more difficult.
How do you ensure that an integratedsupply chain is viewed as being as critical tobusiness success as product development ormarketing and sales? An education andawareness program can be a key driver.Metrics also can be a powerful tool in communicating the benefits of ahighly integrated supply chain. Start with a quantitative gap analysisexpressed in terms that any executive can relate to—bottom-line impact. Forexample, research by PRTM’s benchmarking subsidiary, The PerformanceMeasurement Group, LLC, shows that best-in-class consumer productscompanies enjoy a whopping 5.5 percent (of revenue) advantage in totalsupply chain management cost over median performers. For a $150 millioncompany, that’s more than an $8 million difference in cost savings.10
Results are the ultimate attention-getter. Following the gap analysis,make a change to your supply chain that delivers a sustainable improve-ment in costs or service—and use it to get attention. This is what AngelMendez did at palmOne, Inc. palmOne is one of the world’s leading devel-opers of personal digital assistants (PDAs). When Mendez joined the com-pany in 2001 as senior vice president of global operations for the solutionsgroup, he was given the task of transforming the supply chain into a com-petitive differentiator—no small task considering that palmOne had justbeen forced to write off nearly $300 million of inventory.
The first item on his agenda: educating palmOne’s senior manage-ment on the critical role the supply chain plays in executing the company’sstrategy. “Before I arrived,” says Mendez, “palmOne had had eight con-secutive quarters where it was difficult to produce enough product to keepup with demand. The mind-set had always been building product, thenpushing it to the channel. The supply chain organization was viewed as themeans to get the product made. There were really no other expectations.”11
The development ofsupply chainmanagement as acore competencyand an organizationalimperative doesn’tjust happen—aconscious effort isneeded.

124 Strategic Supply Chain Management
Mendez aimed to raise the visibility of his organization and garnersupport from the senior management team. The recession that was in fullswing when he joined the company actually proved an advantage.“Sometimes it takes a shrinking economy to get the CEO to focus on thesupply chain,” he said. “Catastrophe can be a catalyst. Why not leveragethis fact to get what you need?” He quantified the financial benefits anupgraded supply chain would deliver to the company and its shareholders.Then he developed a clear roadmap for getting there.
Mendez’s roadmap included a fundamental overhaul of the supplychain processes and organization. “We had a lot to do,” he noted. “Theplan we put in place was iterative. It allowed us to prioritize, get some ini-tial wins, [and] then justify the resources it would take to execute the nextstep of the plan.” palmOne had a weak demand-management process,making it difficult to see the level of activity within the sales channel.Decisions to build product were based on inaccurate forecasts rather thanon current market activity. Manufacturing and material costs were highrelative to those of other consumer electronics companies. Relationshipswith key suppliers and customers were strained. And the company usedfour different service providers to repair returned units, resulting in feweconomies of scale, a high repair cost per unit, and a highly complexreturns-management process.
Still, Mendez didn’t “own” all the core supply chain processes.Product groups were responsible for demand management. Repair andsupport were managed on a regional basis within the sales organization.“The company had always focused on the ‘supply’ part of the supplychain,” says Mendez. “They weren’t used to thinking of an end-to-endprocess. So the supply chain organization was mostly focused on pro-curement, with enough planning capability to determine what needed tobe purchased. And not everyone within the organization was as highlyskilled as what was needed for the environment in which we operate.”
Mendez used the Supply-Chain Operations Reference-model(SCOR) (see Core Discipline 2), to build the roadmap for his organizationand for the group process-improvement efforts. He developed a three-phased plan to be executed over two years. Then he began to restructurethe supply chain organization, taking on responsibility for demand man-agement, repair, and product support. He knew that his title of senior vicepresident made the task easier. “My title helped me cut through a lot of redtape,” he says, “but so did the fact that I was able to clearly demonstratethe benefits of an integrated organization.”
palmOne’s new supply chain organization was set up as a globalorganization with localized capabilities. Mendez’s staff included a direc-
CHAPTER 3 Core Discipline 3: Design Your Organization for Performance 125
tor responsible for each of the core plan, source, make, deliver, and returnprocesses and a well-qualified set of individuals within each group. Theskills within the organization reflected the company’s strategic impera-tives: a demand-management process that could react quickly to currentmarket conditions, a supply base that could provide palmOne with the bestvalue in the materials and services it procures, and ongoing improvementsin cost-effectiveness, quality, and customer service.
palmOne’s approach is a good example of how to establish the impor-tance of your supply chain organization to ensure that it gets the resourcesit needs. The best way to gain support and respect for the supply chain asa strategic asset is to prove that it already is one. Simply put, results talk.
Focus on the Skills You Need
Clearly, balancing the competencies youneed with the competencies you have iscritical to executing your strategy. But whathappens when the demand for skills out-strips the supply? Should you change thestructure of your organization, change yourstrategy, or accept the imbalance?
Common sense tells us that compa-nies with well-trained, knowledgeable peo-ple can operate more efficiently, seizemarket opportunities more readily, andweather economic downturns more effec-tively. And despite claims to the contrary,state-of-the-art systems and tools that support supply chain managementare no replacement for human beings. Although they provide a degree ofdecision support that was not possible even a few years ago, these systemsdemand sophisticated users. In fact, today’s new knowledge economyrequires a new type of supply chain professional—one who can quicklyassimilate volumes of information and use it to make sound decisions. Ineffect, the bar has been raised, not lowered.12
Simply put, behind every world-class supply chain are world-classpeople. The same “total cost of ownership” principles that apply to yourmaterial assets also apply to your human assets. Procter & Gamble (P&G)is a case in point. P&G built an organization that merges manufacturing,engineering, purchasing, and customer service.13 The company sees thesefunctions as an integrated system whose principal purpose is to movematerials from suppliers to customers while adding value along the way.
Clearly, balancingthe competenciesyou need with thecompetencies youhave is critical toexecuting yourstrategy.

126 Strategic Supply Chain Management
P&G hires highly qualified, flexible people and pays them well, reason-ing that it will get more for its money than by hiring lower-cost peoplewith limited skills and higher turnover. In short, a more expensive work-force provides a lower total cost of ownership.
New technologies such as the Internetare transforming traditional business func-tions. But it’s important to remember, asyou design your organization, that tech-nologies don’t deliver success—people do.To get the most out of new technology,you’ll want to find and develop people whounderstand how to leverage it to improveoperations and the performance of suchroutine activities as purchasing, customerservice, and logistics management.
Advanced Fibre Communications, Inc.(AFC), understands this well. The Petaluma, California–based telecommu-nications equipment manufacturer is the leading provider of broadbandaccess solutions for the global telecommunications industry. And, althoughAFC had enjoyed eight years of steady growth, it still operated like astartup when Jeff Rosen joined the company in 2000 as vice president ofoperations. “The organization was set up to be effective in a startup mode,”explains Rosen, “but the processes in place were increasingly strained.Everything was done manually, and there was no focus on buildingprocesses and systems that would allow the company to scale.”14 AFC’sfocus on tactics and day-to-day execution was wholly consistent with thecompany’s strategy for many years. However, the market was changing,the strategy was changing, and the supply chain had to adapt to new busi-ness imperatives—immediate product availability, high service levels, andhigher product margins.
Rosen knew that he had to upgrade his organization and the systemsused for supply chain planning and execution. He also knew, though, thathe had to prove himself before he could get approval to make broad changesto his team. Thus he developed a plan to “get some wins and put somethingon the table to get attention.” His first efforts targeted the procurementgroup, where he replaced some people with more experienced commoditymanagers. These new hires were tasked with building cost models for keymaterials, restructuring the supply base, and negotiating with existing ven-dors to secure better pricing. Rosen avoided making very senior hires.“Reasonably experienced was fine for what we needed,” he explained.
As you design yourorganization, keep in mind thattechnologies don’tdeliver success—people do.

CHAPTER 3 Core Discipline 3: Design Your Organization for Performance 127
As a result of these initial efforts, customer service levels and timemargins began to improve. These improvements caught the attention ofAFC chairman, president, and CEO John Schofield, as well as the com-pany’s board of directors. Over the next two years, Rosen was given moreresponsibility and more resources to continue upgrading the supply chainorganization. He replaced many of the people who were focused on day-to-day transactions with people who could design entirely new supplychain processes. “My strategy was simple,” says Rosen. “Start by hiringsmart people capable of designing highly effective processes, [and] thenlet them run the process they helped architect.” His first key hires werechartered with defining new processes for procurement, asset manage-ment, planning, and order management.
Once the basic processes were in place, Rosen brought in severalvery senior managers tasked with putting in place a mind-set of continu-ous improvement. He also began a systematic update of the systems thatsupported AFC’s supply chain processes. Like many telecom companies,AFC outsources production to a contract manufacturer and uses sophisti-cated information systems to provide forecast data and to closely monitorthe status of customer orders.
Rosen notes that the outsourcing strategy and the new software toolsshaped the skills his organization needed. “When I started, I had a lot ofpeople who were good at day-to-day transactions and putting out fires.Many of them were uncomfortable with the idea of using technology forprocesses they were used to doing manually. I needed people who werenot afraid to use technology to do their job.”
Over a two-year period, Rosen completely restructured the organi-zation, merging procurement and materials planning and forming anumbrella organization that included plan, source, make, deliver, andreturn processes. Old positions were eliminated and new ones created.Rosen chose his team carefully. Today, his “cost per head” is somewhathigher than in the past, but there are far fewer people, and each one pro-vides critical skills the organization formerly lacked.
Matching the right people to vital roles is no easy task. Many managersare reluctant to jettison an employee who has served the company well, forexample, even if his or her skill set does not meet the needs of the redesignedsupply chain organization. Other companies view the prospect of finding,recruiting, hiring, and training the people they really need as too complicatedor time-consuming, so they transfer someone who did well in one positionbut is a poor fit for the slot being filled. It’s important to resist the temptationto force-fit a valued employee into a role for which he or she is not qualified.

128 Strategic Supply Chain Management
Even worse than making wrong fits is designing an organization thatis too strongly influenced by the skills and interests of existing employ-ees. We worked with a computer peripherals company that was moving toan outsourced production model. The company engaged two contractmanufacturers, each responsible for a major product line. The supplychain vice president created two relationship manager positions, knowingthat managing each of these new relationships would be a full-time job.
Not surprisingly, several current employees saw the new positions asan excellent opportunity. Although the new jobs called for a more sophis-ticated set of skills, the vice president found himself lobbied aggressivelyby internal candidates. He also was under tremendous pressure to “just getsomeone in here.” He ended up hiring both an internal candidate and anexternal hire—a seasoned industry expert who had been managing a con-tract manufacturing relationship for several years. Not surprisingly, the“home grown” relationship manager struggled with his new responsibili-ties. After six months, he was replaced by a more qualified individual.
The lesson? Your supply chain strategy and associated processes willfail to move your company forward if you don’t have the right people.Effective execution demands the right skills and capabilities. Define yourorganization around the end-to-end supply chain processes, identify theskills you need for each role, and then go shopping—both inside and out-side your company. Don’t let the “inventory on hand” limit the success ofyour organization.
NEXT-GENERATION ORGANIZATIONAL DESIGN
The end-to-end supply chain typically needs management skills and rolesthat did not exist previously (see Figure 3-11).
Given the relative newness of some of these positions, your humanresources department may not know how to find the people you need or howto screen them effectively without some support from your organization. Toensure that you have the right people in the right positions, put together a description of your supply chain strategy, a description of each key role, aclear definition of available career paths, and a comprehensive hiring plan.
This is not to say that every reorganization requires a major work-force turnover. Most supply chain organizations have only a few extremelycritical roles—before or after an overhaul. These are the jobs that requirespecific qualifications, and you shouldn’t settle for less. Current employ-ees, with appropriate retraining or coaching, can fill most of the other rolesin your new organization.

CHAPTER 3 Core Discipline 3: Design Your Organization for Performance 129
F I G U R E 3–11
New roles for end-to-end supply chain management.
New Role
OutsourcingPartnerRelationshipManager
GlobalCommodityManager
CustomerRelationshipManager
Supply ChainProcessImprovementManager
Supply ChainPerformanceAnalyst
Key Required Skills
• Ability to negotiate strategic alliances and partnerships• Ability to drive best-in-class performance from supply chain partners• Ability to inspire individuals within various organizations to work collaboratively
• Ability to manage across continents• Ability to manage ongoing relationships with key suppliers and to execute the global supply chain strategy for products purchased from these suppliers• Ability to structure the supply base to achieve the lowest total cost of ownership• Ability to manage suppliers through objective measurements and regular generation of formal supplier scorecards
• Deep understanding of the customer’s business and channels• Sufficient understanding of supply chain operations to ensure implementation of core processes that support customer requirements
• Thorough understanding of supply chain best practices• Ability to inspire individuals within multiple functions to work collaboratively• Ability to recognize opportunities for process improvement and appropriate automation
• Thorough understanding of supply chain metrics and appropriate methods for target-setting• Ability to institutionalize metrics-driven reviews and continuous improvement programs
Make
Source
Deliver
Plan
Plan

This page intentionally left blank.

Owens Corning Profile: Reorganizing for “a Bright Future”
The “big squeeze” of its core industry segments—cost inflation and pricedeflation—led Owens Corning to rethink its supply chain organizationand processes in order to understand the impact of these elements on itsability to be competitive and customer-facing enterprisewide.
Based in Toledo, Ohio, Owens Corning (OC) has manufacturing facilitiesin more than 25 countries and 165 distribution centers. It’s a $5 billionmarket leader in building-materials systems and composites solutionsknown for its innovative portfolio of products—it invented glass fiber andglass-fiber insulation over 50 years ago.
Approximately 80 percent of the company’s revenues come from itsbuilding-materials portfolio of products and systems that are sold throughdistributors, contractors, and large national retailers mainly in NorthAmerica. Composites account for the remainder of revenues and are usedin the automotive, telecommunications, electronics, and constructionindustries in a global market.
As big as it is and as well known as its brand is, however, OC hasfaced increasing competition within key markets because of globalizationand industry consolidation in recent years. “We must be able to compete onmore than price,” notes Sue Hatfield, the company’s director of strategyand integration for supply chain and technology. “Our greatest challenge isproviding low-cost flexibility to meet increased customer demands.”
This is a turnabout for the industry. Building products is a processmanufacturing industry and is highly asset-intensive, making use of assets
131
Copyright © 2005 by The McGraw-Hill Companies, Inc. Click here for terms of use.
132 Strategic Supply Chain Management
and production efficiency the primary success factors for competing in themarketplace. Traditionally, flexibility has not been considered a key fac-tor but increasingly is becoming one.
OC is organized into business units, each with its own commercial,sales, and supply chain processes and facilities. Having many businesssegments within the business units, the company struggled as supply chainrequirements got more demanding. In the past, the company had a sub-stantial level of redundancy in processes and personnel across businessunits and had inherited multiple legacy software applications that werepoorly integrated. These factors created a lack of data integrity/integrationat the enterprise level. This was seen as a key contributor to the increasingproblems that OC was experiencing, such as inaccurate demand forecasts,poor planning, overall customer dissatisfaction, and high-cost supplychain operations.
THE TECHNOLOGY SOLUTION WASN’T ENOUGH
In the mid-1990s, the company deployed SAP’s enterprise resource plan-ning (ERP) product across its global enterprise. At the time, OC believedthat a common global technology platform would resolve many of thebusiness issues relating to its product-driven, make-to-stock manufactur-ing environment. This was important because these process issues affectedOC’s forecasts, materials management, production scheduling, ability tomeet deadlines, and cost containment. According to Hatfield, “Our fore-cast accuracy was not good, we didn’t have the right linkage to productionschedules, and we weren’t doing the right level of demand-supply balanc-ing. Our planning problems were having downstream effects on our cus-
tomers, impacting on-time delivery andorder fill-rate performance.”
The SAP system eliminated 500 legacysystems, achieving one of the company’sprevailing goals—to keep it “simple, com-mon, and global.” OC then implementedSAP’s advanced planning and logistics soft-ware. However, the information technologyapplications only brought so much benefit.As David Johns, senior vice president andchief supply chain and information officer,notes: “The progress made was in the areasof back-office operations, logistics, and
A new SAP systemeliminated 500 legacysystems andachieved one of OC’sprevailing goals: tokeep it “simple,common, and global.”

OWENS CORNING PROFILE: Reorganizing for “a Bright Future” 133
materials management. But where we stilllacked real integration was with our manu-facturing and our sales and operations plan-ning processes.”
It became apparent that a more cus-tomer-centric, enterprise-level approachusing best practices and standards adoptedby top-performing companies was needed tomeet strategic goals. The biggest goal was“to operate as one company.” This wouldprove to be no small order. A supply chaintransformation initiative would become one of five top strategy principleschampioned by OC’s new chief executive officer, Dave Brown. OC wantedto make significant gains in customer service levels and a $250 millionimprovement in income from operations (IFO) and working capital over athree-year period. It wanted to create a brighter future for its employeesand stockholders.
Lifting supply chain transformation to the strategic level was justthe beginning of the three-year plan. As Hatfield explains, “What weneeded to do was to get better in each sup-ply chain process (plan, source, make,deliver), change our mind-set from manu-facturing efficiency to supply chain flexi-bility, and integrate our customers andsuppliers into our supply chain. We alsohad to expand our thinking beyond thefunctional level to the enterprise, integratedsupply chain level.”
ORGANIZATIONAL CHANGES
A first step was to integrate the functions having an impact on the cus-tomer experience—materials management, logistics and warehousing,customer service/call centers, receivables management, customer andproduct master data integrity—within a single group. Today, 350 employ-ees report to this department, headed by Vice President of CustomerSupply Chain Operations Meg Ressner.
“We intentionally put ‘customer’ in front of our organization’s nameto make sure that we were really driving the culture of the supply chain tobe end-to-end and externally focused,” she says. “The other thing we’re
OC wanted to see a$250 millionimprovement inincome fromoperations (IFO) overthree years.
“We needed tochange our mind-setfrom manufacturingefficiency to supplychain flexibility,”says Sue Hatfield.

134 Strategic Supply Chain Management
trying to do is distinguish the process of supply chain from the organiza-tion that operates many of the processes.” Ressner’s group sits inside abroader organization called Supply Chain and Technology Solutions(SCTS), headed by David Johns. The reason for the differentiation?“We’ve been trying to help our company see that the supply chain is abusiness process that touches everybody in the company. SCTS focuses onthe processes, by operating them, deploying technology that supportsthem, or encouraging process innovation and enhancements.”
OC has recognized the value in com-bining the technology and supply chainprocess function in one organization. Johnsexplains the rationale: “We wanted to lever-age the resources we have across the enter-prise, do things faster, and improve theservice we can provide.” The company alsowanted to be more flexible in its response tocustomers. Because OC had had a “doeverything for everybody” mentality adecade ago, company costs were too high,and, as Johns says, “We weren’t really ableto grow, because we didn’t have a consis-tent, coherent strategy.”
“In those earlier days, we did understand that ‘simple, common, andglobal’ were key operating principles—and they remain so today—butnow we understand that flexibility is the key competitive advantage,”Johns says. He contrasts this customer-facing perspective with OC’s his-torical focus on manufacturing efficiencies: “Our philosophy as a 60-year-old manufacturer was long product run times. And that strategy had allsorts of implications. But today, with a focus on flexibility, we’re lookingat market-driven lead times for product delivery and our ability to quicklyrespond to big changes in demand.”
THE VISION THING
In order to ensure that it could respond more flexibly to customer demand,OC conducted an end-to-end supply chain assessment using PRTM’s“stages of process maturity model for supply chain excellence” as a refer-ence point (see Chapter 6 and Appendix B). OC found that it was at earlystage 2 of functional excellence in process maturity yet aspired to achievesolid stage 3 status, designated “enterprise integration.” The company
OC has recognizedthe value incombining thetechnology andsupply chain processfunctions in oneorganization.
OWENS CORNING PROFILE: Reorganizing for “a Bright Future” 135
used the Supply-Chain Operations Reference-model (SCOR) to create acontext for understanding the relationships among business strategy, supplychain configuration, supply chain practices, and technology. It knew that it needed to define the value proposition before it could get buy-in by allstakeholders. “The transformation vision provided a common, overall road-map,” says Hatfield, “and provided an umbrella for enterprise-level improve-ment projects.”
The supply chain organization identified four areas for immediateimprovement: fixing the end-to-end planning process within materialsmanagement and instituting a sales and operations planning process inevery business, leveraging warehousing and transportation at an enterpriserather than an individual business level, improving overall service perfor-mance with customers, and building greater manufacturing effectivenessand flexibility.
At the start, OC benchmarked its then-current performance levelsagainst similar manufacturing organizations in three areas: customer ser-vice and responsiveness, cost performance, and asset performance. It setpriorities and targets for customer-facing processes such as on-time deliv-ery to request—a downstream result of greater alignment between demandand supply planning processes. Increasing the effectiveness of its 10-stepsales and operations planning (S&OP) process also enabled OC to reducecosts by operating in a more integrated way across global operations.
Early results have included lower inventory levels and higher inven-tory quality, improved on-time delivery and order fill-rate performance,and reduced logistics costs. OC estimates that it will generate more than$165 million in value within the initial three years of the plan.
FROM PRODUCT TO MARKET FOCUS
Another goal was moving the organizational mind-set and execution capa-bilities from a commodity-based product focus to a solutions-based marketfocus, even though, as Meg Ressner confirms, OC has customers of bothtypes: “It’s true that our customer demands are evolving,” she says, “andwe must have the capability to deliver on all those demands, which meansyou have to have a flexible platform.” To this end, account teams, trans-parent to the customer regardless of their request for service, were orga-nized around specific high-value/high-volume partners. The intent is toalign the right set of people, skills, and processes around customers’requirements. This might mean self-service for some customers, supportedby portal technology or electronic data interchange (EDI) transactions for
136 Strategic Supply Chain Management
order management and fulfillment. It might mean a dedicated customeraccount team for other customers. As Ressner notes, even though OC isexploring use of the Internet for ordering and other customer-facing activ-ities, the company also realizes that many of its major distributors andretailers have an emotional comfort level with their customer service representatives from OC.
The challenges are manifold. Customers want more customized ser-vice and more flexibility. They want tailored solutions that take cost outof their supply chains. “Many customers want us to be their partner—where we leverage the full resources of OC to help their business grow,”says Hatfield. In customer alliances, this means that OC needs to becomemore integrated into its customers’ supply chains—to understand what itscustomers are demanding and to create the processes that will ensure thatdemand is filled on time every time.
THE MECHANICS OF TRANSFORMATION
A key challenge of putting supply chain issues on everyone’s radar screenwas to redefine and educate employees on what the integrated supplychain meant for OC down to how each employee’s role and responsibilityfit into the supply chain. Says Hatfield, “We embarked on a whole educa-tional process. One of the most effective things we did, as simple as itsounds, was to hire a design firm to draw an illustration of all the high-level supply chain processes at OC. When they were finished, it was clearthat the supply chain is centered on our customers and really encompassesalmost everything that we do. Everyone has a role, and the key to successis integration.”
The supply chain organization realized that it would take three com-ponents to effect the transformational change it was aiming for: the peo-ple component, the process component, and the technology component.The people component would require education about the value of thesupply chain to create “fully engaged employees”—those who would betrained and certified to execute processes with a high level of account-ability for performance. A process architecture would have to be createdwith the unified goal of providing exceptional customer experiences. Andlast, the technology would have to be “fit for purpose”: the enablement ofhigher levels of performance through greater visibility of information atall levels of management.
Once viewed as the primary driver of business processes, technologywas now seen as an enabler of larger, more strategic goals. Evidence ofthis shift is apparent in the type of employee hired for the information sys-

OWENS CORNING PROFILE: Reorganizing for “a Bright Future” 137
tems organization. Don Kosanka, OC’s chief information officer, explains:“The IS folks that we have are really not the technical folks you find intypical IS organizations. They have a really good understanding of thebusiness processes that we operate, and their value comes in helping fig-ure out where technology can enable each process to become more effi-cient, precise, or accurate. We outsource the more routine technical skillsets required to operate the IT infrastructure.”
Kosanka is an example of the shift in thinking at OC. As he says,“When I first joined the firm 25 years ago, fresh out of college, I thoughttechnology was the important driver. After a few years here, I shifted myview to process. Now I see the equally critical importance of people.Without every employee’s buy-in, you can’t execute the process or realizethe value in the technology. So you might say I’ve moved to a much moreintegrated approach.”
What’s especially different about today’s perspective on the role oftechnology, says Kosanka, is that “we actually try to solve our processchallenges without technology, if possible, and use technology when it’srequired and when it actually enhances the project so [that] it justifies theinvestment.”
Kosanka has used IT to take costs out of the supply chain. “Our totalinvestment in IT over the last seven years has dropped every year, and asa percentage of sales it has dropped even faster,” he says. “While we’vedecreased the amount spent in the infrastructure, we’ve been maintainingor growing our investment in applications to help the business units oper-ate their processes better. Basically, we’ve done a good job of managingour costs to get higher performance for lower costs. We now have just ahandful of major systems that we use.” OC achieved these gains primar-ily by outsourcing many operational aspects of the IT infrastructure, fromhelp-desk and data-center operations to network management.
Now the organization looks at technology very differently from evenseven years ago. Ressner refers to the common set of technology andprocess elements as an enterprisewide toolkit. “Flexibility comes fromusing that toolkit and recognizing the unique characteristics of a particu-lar market segment or customer. Without having the process and IT foun-dation in place that we have today, it would be difficult, if not impossible,and certainly much more expensive, to customize an approach.”
GREATER COLLABORATION WITH SUPPLIERS
As it builds better partnerships with distributors and retailers, OC hasdeveloped a new perspective on its suppliers. “We have a point of view that

138 Strategic Supply Chain Management
our suppliers are as important to us as ourcustomers, so just as we want to be our cus-tomers’ best supplier, we want to be our sup-pliers’ best customer,” explains David Johns.“We are trying to make our systems, ourprocesses, etc., as transparent as possiblewith our suppliers and our customers, byeliminating as many inefficiencies as possi-ble in our dealings and taking the costs outof our shared supply chains.”
The company has established pro-grams and metrics for vendor relationship management and supplierdevelopment. Although its sourcing organization is separate from the sup-ply chain solutions organization, the two departments leverage resourcesin support of common goals. For example, both groups collaborated oncreating a portal structure that would facilitate interaction with vendors.
HORIZONTAL INTEGRATION
OC also has developed project review boards to help enforce the alignmentand integration of key business processes, such as customer operations,materials management, sourcing, production, research and development,IT, and logistics. Each has representation from the three functional areas oftechnology, process, and operations to jointly assess and monitor IFO ben-efits, working capital savings, return on net assets (RONA), supply chainperformance metrics, and overall allocation of people and capital resourcesfor approved initiatives. A new “stage gated” approach ensures that beforeresources are assigned to specific projects, each has to pass a stringent testfor business value.
This is another one of the building blocks to OC’s “one company”mantra these days. Currently in the process of coming out of a financialrestructuring process, it is reinventing its processes and internal organiza-tions to give customers the experience of a single company that is poisedfor the increased competitiveness of the future.
“We want to be ourcustomers’ bestsupplier and oursuppliers’ bestcustomer,” saysDavid Johns.

4 C H A P T E R
Core Discipline 4:Build the RightCollaborative Model
139
Collaboration is the cornerstone of effective supply chain management. Ascompanies continue to narrow their strategic focus to a smaller number ofcore competencies, the skills and talents of outside partners become morecritical. This creates a growing reliance on resources that you may not con-trol directly and on strategies that you may have no hand in developing.
A recent survey of more than 100 international business leadersfound that as companies migrate toward more extended supply chains, col-laboration becomes their most strategic activity.1 Despite its importance,there is little consensus about what collaboration means. If you asked 100supply chain executives for a definition, you’d likely get 100 differentanswers. Certainly most would agree that collaboration is important, thattechnology and relationship building are critical components, and thatcompanies with effective collaboration skills are likely to have a competi-tive edge. However, few executives would be able to offer a clear, unam-biguous definition.
Why is it so hard to define collaboration? Because it can be manythings and involve many types of partners. It can refer to a wide range ofjoint activities, from information sharing among business units to complex,long-term product development and marketing projects. We define collabo-ration as “the means by which companies within the supply chain work
Copyright © 2005 by The McGraw-Hill Companies, Inc. Click here for terms of use.
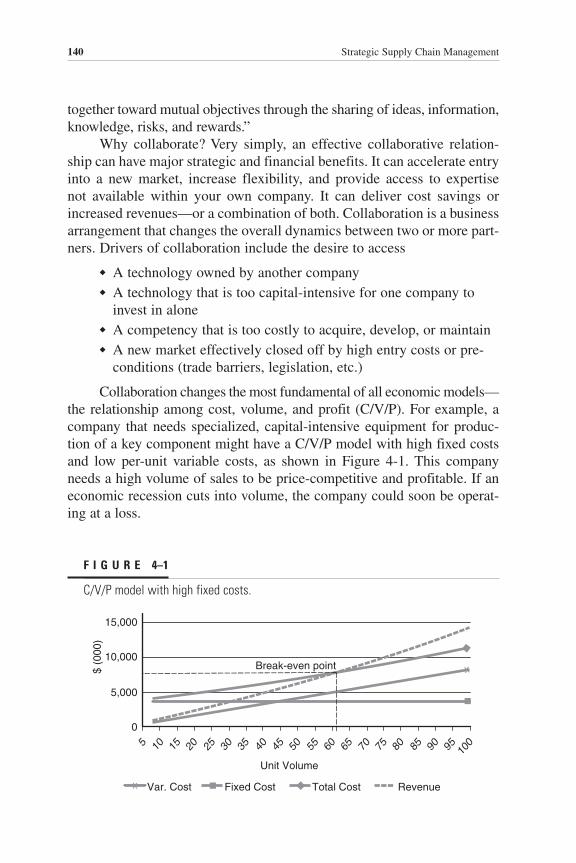
140 Strategic Supply Chain Management
together toward mutual objectives through the sharing of ideas, information,knowledge, risks, and rewards.”
Why collaborate? Very simply, an effective collaborative relation-ship can have major strategic and financial benefits. It can accelerate entryinto a new market, increase flexibility, and provide access to expertise not available within your own company. It can deliver cost savings orincreased revenues—or a combination of both. Collaboration is a businessarrangement that changes the overall dynamics between two or more part-ners. Drivers of collaboration include the desire to access
◆ A technology owned by another company◆ A technology that is too capital-intensive for one company to
invest in alone◆ A competency that is too costly to acquire, develop, or maintain◆ A new market effectively closed off by high entry costs or pre-
conditions (trade barriers, legislation, etc.)
Collaboration changes the most fundamental of all economic models—the relationship among cost, volume, and profit (C/V/P). For example, acompany that needs specialized, capital-intensive equipment for produc-tion of a key component might have a C/V/P model with high fixed costsand low per-unit variable costs, as shown in Figure 4-1. This companyneeds a high volume of sales to be price-competitive and profitable. If aneconomic recession cuts into volume, the company could soon be operat-ing at a loss.
F I G U R E 4–1
C/V/P model with high fixed costs.
RevenueVar. Costx Fixed Cost Total Cost
0
5,000
10,000
15,000
5 10 15 20 25 30 35 40 45 50 55 60 65 70 75 80 85 90 95 100
Break-even point x
Unit Volume
$ (0
00)

CHAPTER 4 Core Discipline 4: Build the Right Collaborative Model 141
Collaborating with a partner that focuses on the production of spe-cialized materials similar to the component might allow this company tooffload some of its fixed costs, as shown in Figure 4-2, but with an accom-panying increase in variable costs associated with the increase in the levelof external sourcing. To make this approach pay off, the company must be willing to share any proprietary technology needed to manufacture the component, and its collaboration partner must be willing to invest indeveloping the additional capabilities needed to produce it. Since break-even volume is lower, the company can compete across a wider range ofvolumes—albeit at the expense of gross margin at high volume.
Ongoing collaboration on product designs and production planningcan make the company even more agile while continuing to add volumeto the specialized manufacturer’s business. Both collaboration partnerswill benefit economically.
As you can see, collaboration is not analtruistic activity. While it may seem a bestpractice to provide “seamless integration”and “extended visibility” to your supplychain partners, the fact is that true collabora-tion is very difficult, and there’s no point indoing it unless you can achieve financial orstrategic gain. For collaboration to be trulysuccessful, therefore, it must deliver quan-tifiable economic benefit to all partners.
F I G U R E 4–2
C/V/P model after outsourcing some fixed costs.
RevenueVar. Costx Fixed Cost Total Cost
0
5,000
10,000
15,000
5 10 15 20 25 30 35 40 45 50 55 60 65 70 75 80 85 90 95 100
Break-even point
x
Unit Volume
$ (0
00)
True collaboration isvery difficult, andthere’s no point indoing it unless youcan achieve financialor strategic gain.

142 Strategic Supply Chain Management
Despite the highly touted benefits shown in Figure 4-3, supply chaincollaboration has the dubious distinction of being one of the most soughtafter but disappointing aspects of supply chain strategy. What’s going on?To start with, the promise of effective, efficient collaboration is based onInternet technology and its ability to provide new levels of visibility andinformation sharing. The Internet bubble of the late 1990s gave rise tohundreds of software products that promised seamless interaction andendless visibility among supply chain partners.
Do these tools work? Some do, and some don’t. Technology doesn’t ultimately determine the success or failure of a collaborativerelationship. Nor do the underlying processes that govern the use oftechnology—at least not on their own. Successful collaborationrequires two additional components: sharing information and sharingbenefits.
Information is at the heart of any collaborative relationship. To col-laborate effectively, all partners must provide timely, accurate, and com-plete information—whatever is needed to achieve their mutualobjectives. And each partner must respect the confidentiality and securityrequirements of the other. Mutual trust is key to a successful collabora-tion. Just as important, each partner must commit to a joint sharing ofbenefits—not necessarily an equal sharing but an equitable sharing. Thesuccess or failure of a collaborative relationship depends on clearly iden-tified mutual gain.
F I G U R E 4–3
Commonly cited benefits of collaboration.
• Improved customer service• More efficient use of human resources
Material Suppliers Service SuppliersCustomers
• Reduced inventory• Increased revenue• Lower order management costs• Higher gross margin• Better forecast accuracy• Better allocation of promotional budgets
• Reduced inventory• Lower warehousing costs• Lower material acquisition costs• Fewer stockouts
• Lower freight costs• Faster and more reliable delivery• Lower capital costs• Reduced depreciation • Lower fixed costs

CHAPTER 4 Core Discipline 4: Build the Right Collaborative Model 143
COLLABORATION IS A SPECTRUM
Potential collaboration partners in supply chain management can be clas-sified in three broad groups—customers, materials suppliers, and suppli-ers of services that support supply chain operations, such as manufacturingand logistics. Although each group requires a slightly different manage-ment approach, the relationships are established and maintained in simi-lar ways.
Not all collaborations are created equal. Relationships between supplychain partners can have very different characteristics and still be consideredcollaborative in nature. And the results of collaborative relationships mayvary widely from one set of partners to another. Figure 4-4 offers a frame-work for differentiating the various types of collaborative relationships anddefining the basic characteristics of each. The horizontal axis plots the rela-tive number of relationships, whereas the vertical axis measures the relativedepth of collaboration. Within this framework, we define four levels of collaboration:2 transactional, cooperative, coordinated, and synchronized.
Note that the boundaries between the different levels of collabora-tion are blurred. This is so because collaboration is a continuum, not a setof clearly delineated management practices. Note, too, that the dimen-sions of the two axes are inherently subjective and are used simply to
F I G U R E 4–4
The collaboration spectrum.
LowReturn
Not ViableExtensiveCollaboration
LimitedCollaboration
FewRelationships
ManyRelationships
TransactionalCollaboration
CooperativeCollaboration
CoordinatedCollaboration
SynchronizedCollaboration
144 Strategic Supply Chain Management
provide a clear graphic view of the collaboration spectrum. Other mod-els use different criteria, such as level of investment or dependence ontechnology, to describe the depth and breadth of collaborative relation-ships. It’s possible to create a matrix using any combination of these criteria or even to apply a multidimensional approach.3
The point is not to worry about picking the right labels for yourcollaborative relationships but to examine the various characteristicsthat differentiate each partnership. First, choose the degree to whicheach characteristic contributes to the likely success of the collaborativerelationship, and then put a plan in place to achieve it. Every customer-supplier relationship can involve some level of collaboration. The factthat you’re buying from a specific supplier or selling to a specific cus-tomer implies a relationship between your two companies, but it doesn’tnecessarily mean that you are collaborating. And just as not all rela-tionships are created equal, not all collaborations are created equal.
Before setting off to systematically establish collaborative relation-ships with your supply chain partners, take the time to understand thedegrees of collaboration along the spectrum and your company’s specificneeds. Often, a small number of deeply collaborative relationships ispreferable to multiple relationships with a wide range of partners. Later inthis chapter we’ll discuss how to decide which degree of collaboration toset up with each supply chain partner.
Transactional Collaboration
Transactional collaboration aims for the efficient and effective executionof transactions between partners. This isn’t to say that transactional rela-tionships between supply chain partners offer no strategic value. However,partners in a transactional relationship rarely focus on reducing supplychain management costs or increasing revenues. The focus is usually onimproving the ease at which transactions are conducted—for example, byeliminating the need for constant renegotiation. Transactional collabora-tion usually applies to customer-supplier relationships in which commonor maintenance, repair, and overhaul (MRO) materials are purchased, andthe decision to deal with a supplier is based mainly on price. With lessstrategically important supply chain partners, companies tend to focus onminimizing the effort associated with day-to-day transactions rather thanon developing long-term relationships.
Transactional relationships rarely require sophisticated informa-tion systems. Indeed, many companies involved in this type of rela-tionship lack the systems and infrastructure needed to provide and

CHAPTER 4 Core Discipline 4: Build the Right Collaborative Model 145
respond to information electronically. Because of this, many transactionsare manual.
An example of a transactional relationship is any time a customerand a supplier agree to a set price for a specific product over a set periodof time or until a certain purchase volume is reached. The buyer gets a fixed price over the life of the agreement in exchange for purchasing aminimum quantity of products; this also helps the seller’s production plan-ning. Transactional collaboration is the most basic and by far the mostwidely used collaboration model.
Cooperative Collaboration
Cooperative relationships have a higherlevel of information sharing. Supply chainpartners may provide automatic commit-ments and confirmations or share informa-tion on forecasts, inventory availability,purchase orders, or order and delivery sta-tus. Usually, one partner posts informationthat the other partner reviews and acts on—a one-way communication in which data are sent either manually or elec-tronically (“pushed”) from one partner to the other or published in amanner that’s accessible by the recipient (“pulled”).
In a cooperative collaboration, the type and format of data providedusually are standardized. While more sophisticated technologies are avail-able, electronic data interchange (EDI) is the primary method of commu-nication used today, through either a proprietary EDI network or theInternet. For companies without an EDI capability, Internet-based supplierportals or extranets are an excellent alternative. Most of these tools enabledocument and content management and include embedded workflows toautomate the routing of documents, forms, and certain data and tasks.
Coordinated Collaboration
In a coordinated relationship, supply chain partners work more closelytogether and rely more on each other’s capabilities. As such, a coordinatedrelationship requires a two-way flow of information between partners andtightly synchronized planning and execution processes. Because the infra-structure and processes needed to support this type of information sharingare more complex than in the cooperative model, coordinated collaborationusually is reserved for more strategically critical supply chain partners.
Cooperativerelationships have ahigher level ofinformation sharing.
146 Strategic Supply Chain Management
Unlike transactional and cooperativerelationships, coordinated collaborationrequires a high level of negotiation and com-promise. Given the more strategic nature of these partnerships and the high level ofdata sharing, proprietary systems are needed for exchanging information. Because of this complexity, a coordinated relationshiprequires a long-term commitment by bothpartners and is rarely undertaken lightly.
Putting the required processes and tools in place takes time and money; theexpectation is that both parties will benefit from the expected efficienciescreated as part of the ongoing execution of the relationship.
Vendor-managed inventory (VMI) programs are a commonly usedmethod of coordinated collaboration. In a VMI relationship, the supplier isresponsible for making sure that the customer never runs out of materials. While some VMI programs are manual—the supplier walksthrough the customer’s site to monitor inventory levels—most programs inplace today are automated. In some cases, the supplier can remotely manageinventory at the customer’s site based on forecasts and usage. In other cases,the supplier uses current consumption rates and inventory levels to determineif more inventory is needed. In either case, effective data transmission is thekey to successful VMI, a hallmark of coordinated collaboration.
Synchronized Collaboration
The greatest degree of collaboration on the spectrum occurs at the upper rightquadrant of our framework—synchronized collaboration. In this model, the
collaborative relationship moves beyond sup-ply chain operations to include other criticalbusiness processes. Partners may invest injoint research and development projects, sup-plier development, and intellectual property(IP) development. The sharing of both physi-cal and intellectual assets may even extend toshared personnel. Synchronized collab-orations are often called strategic alliances.
In a synchronized relationship, infor-mation is developed jointly rather than justtransmitted or exchanged. Moreover, syn-chronized collaboration tends to focus on a
Coordinatedcollaborationrequires a high levelof negotiation andcompromise.
In a synchronizedrelationship,information isdeveloped jointlyrather than justtransmitted orexchanged.

CHAPTER 4 Core Discipline 4: Build the Right Collaborative Model 147
strategic vision of the future rather than on near-term planning and tacti-cal execution. Long-term commercial commitment is a hallmark of thistype of collaboration.
Development projects that consider supply chain requirements whendeveloping the product strategy are good examples of synchronized col-laboration. A company that includes key materials suppliers or manufac-turing partners as an integral part of its development team is far morelikely to have product designs that are compatible with best-in-class sup-ply chain performance. Unlike other types of collaboration, in which part-ners are apt to exchange product data, synchronized relationships usuallyinclude a shared product data management system.
FINDING THE RIGHT PLACE ON THE SPECTRUM
Each relationship with a supply chain partner has its own place on the col-laboration spectrum. As you architect your collaboration strategy, youmust identify which partners are best suited for each type of relationship.The collaboration spectrum offers a set of options—there’s no “right” or“wrong” place to be along the diagonal. But there are areas within thematrix that should be avoided when choosing a collaboration model (seeFigure 4-4).
First, there’s the area labeled “Low Return.” In this quadrant, com-panies collaborate on a limited basis with a set of supply chain partners.The investment and risk involved in this model are relatively low—and sois the return. While financial benefits certainly can accrue from limitedcollaboration, the “Low Return” model is not a commercially effectivebasis for a collaboration strategy, for the benefits are not worth therequired investment.
The second area to avoid is that labeled “Not Viable.” In this quad-rant, the objective is deep collaborative relationships with many supplychain partners. Interestingly, developers of collaboration tools oftendescribe this as the optimal model, asserting that advanced technologiesenable collaboration that is both broad (many supply chain partners) anddeep (extensive collaboration with each). While this level of integration ispossible theoretically, it’s not practical—mainly because aligning a largegroup of partners with your business objectives is extremely difficult.
Despite the hype around technologies that claim to support flawlessintegration among supply chain partners, most of today’s collaborativerelationships are transactional or cooperative. They tend to focus on basicsupply chain activities—typically procurement and manufacturing. Andeven though transactional and cooperative relationships are considered

148 Strategic Supply Chain Management
“collaboration,” they rarely deliver the benefits of lower inventory levels,better customer service, more efficient use of human resources, and faster,more reliable delivery. Why not? Because the investment required of eachpartner is low, and the resulting value is not enough to advance eithercompany’s strategy, enable entry into new markets, or provide access tonew technologies or skill sets. Transactional collaboration and cooperativecollaboration simply deliver modest improvements in how day-to-daytransactions are executed.
This is not to say that transactional and cooperative relationships arewithout value. They’re merely a first step in developing more complex,strategic relationships that create a true bond between partners. Advancedcollaboration needs a greater investment, continuing maintenance, andongoing vigilance against circumstances that could harm the relationship.
As companies move away from the traditional model of vertical inte-gration, the need for deeper collaboration with select supply chain part-ners intensifies. Deciding to divest an internal competency doesn’teliminate the need—it simply moves the source of the competency beyondyour company’s direct control. As we saw in Core Discipline 3, the abil-ity to manage these external relationships successfully can become a crit-ical competency.
It’s a major challenge to balance what’s theoretically possible,what’s needed to support the business strategy, and what’s practical interms of managing day-to-day operations. The fact that the collaborationspectrum is different for every company means that what’s “optimal” interms of number and type of collaborative relationships varies widely.Although most companies today are still a long way from their optimalrange, the number of cooperative and coordinated relationships is growing(see Figure 4-5). The ability to reach an optimal state of collaboration islimited by the availability of partners prepared to work with you.
THE PATH TO SUCCESSFUL COLLABORATION
Your success depends on the ability of both you and your partner to exe-cute according to your mutual agreement. While every partnership is dif-ferent, the following guidelines for success apply to all:
◆ Master internal collaboration before trying to work with externalpartners.
◆ Define the appropriate degree of collaboration for each partnersegment.

CHAPTER 4 Core Discipline 4: Build the Right Collaborative Model 149
◆ Be sure that each party has a stake in the outcome of the collabo-ration. Share benefits, gains, losses, and risks.
◆ Be prepared to share information you once considered proprietary.Mutual trust is integral to successful collaboration.
◆ Set clear expectations for each party.◆ Use technology to support your collaborative relationships.
Master Internal Collaboration First
If you can’t collaborate within the four walls of your own company, yourchances of success with external partners are small. Internal collaborationhelps to test your company’s “readiness” to achieve common goals byaligning processes, systems, and organizational structures—all in a low-risk environment. And internal success provides proof positive that thebenefits of collaboration are real.
F I G U R E 4–5
The evolution of collaboration.
VerticallyIntegrated
LimitedCollaboration
Required
Core CompetencyFocused
ExtensiveCollaboration
Required
Historic
al
Theoretical
Actual
Optimal
Synchronized
Coordinated
Cooperative
Transactional
Internal
150 Strategic Supply Chain Management
The fact is that many companies don’tcollaborate particularly well, even internally.Departments or functions may be unwilling tocompromise, even if a proposed concession isfor the greater good of the company. The ideathat successful collaboration will result inlower overall costs or improved service levelscan be difficult to substantiate, so it may beviewed with skepticism. A key requirement ofeffective collaboration is shared metrics, butall too often these are missing.
Internal collaboration actually can be more difficult than external col-laboration due to a range of complicating factors. For instance, a drive atthe highest levels of a company to institute accountability for performanceat the business unit or functional level can hinder effective collaboration.Moreover, complex systems for setting transfer prices and cross-chargesare designed to allocate costs fairly across the company as a whole butoften promote functional performance at the expense of enterprisewidecost performance. And reward structures that link individual compensationto business-unit performance can reinforce business-unit autonomy. Thesemeasures can be counterproductive, eliminating many of the key benefitsof collaboration: economies of scale and scope, greater efficiency, knowl-edge sharing, and less duplication of effort.
Articulating the benefits of collaborating with external partners alsomay be easier than making the case internally. Collaborating with a cus-tomer, for instance, can increase revenues and deliver greater customersatisfaction. Collaborating with suppliers can decrease costs, shortenresponse times, improve reliability of supply, and lower inventory levels.Internally, the benefits may not be as clear.
Why forecast by item instead of product family, for instance? Thegreater the level of detail, the easier it is for the supply chain organizationto plan for material supply and ensure product availability. For the salesgroup that prepares the forecast, though, this added detail may seem likeextra work with no clear benefit. The supply chain organization needs toquantify the inherently qualitative reasons for changing the process and to get the sales force to buy into it.
Finally, business units or functions may have incompatible informationsystems. Without a common data platform, shared functionality, and stan-dardized metrics, these disparate systems can block effective collaboration.
Despite these challenges, internal collaboration is worth the effort. It can confer a competitive edge—and lay the groundwork for external
A key requirement of effectivecollaboration isshared metrics, butall too often theseare missing.

CHAPTER 4 Core Discipline 4: Build the Right Collaborative Model 151
collaboration. First you’ll need to dispel the perception of internal collab-oration as a zero-sum game, where one department’s gain is another’sloss. This means modeling and clearly articulating the benefits to yourcompany as a whole and making sure that your existing infrastructuredoesn’t discourage collaboration because of a real or perceived negativeimpact on a function or business unit.
Logitech is a company where the need for internal collaboration isobvious. It’s an international market leader in personal interface productssuch as computer mice, keyboards, interactive entertainment peripherals,and audio products. The company has a very strong brand presence, sell-ing its products in tens of thousands of retail outlets in over 100 countries,as well as on hundreds of Web-based retail sites and through relationshipswith original equipment manufacturers (OEMs). Logitech excels at high-volume manufacturing and distributes its products worldwide. The com-pany’s supply chain strategy mirrors its emphasis on award-winningdesigns and price performance and has led to the creation of a highly effi-cient company-owned manufacturing facility, as well as relationships withnumerous supply chain partners, including original device manufacturers(ODMs) and packaging houses. The company’s primary manufacturingfacility and the majority of its suppliers are located in Asia.
Logitech’s product line is both broad and deep. This complexity,combined with the fact that most production is done in a region of theworld far removed from many of the end customers, places tremendousemphasis on the need for excellent planning and efficient processes tomove products from manufacturing sites to regional distribution centers.
As is typical of many sellers of retail products, Logitech relies onattractive packaging to catch the customer’s eye. “Packaging is veryimportant to us,” explains Nolan Perry, director of project managementservices. “The package is really an extension of the product itself. It needsto showcase the product while projecting an image consistent with ourstrategy of high quality and ongoing innovation.” For many products, thismeans form-fitted, clear packaging that highlights the product’s look andfeel from any angle. The package also needs to be well suited to retailers’displays, for it may need to stand on a shelf or hang from a rack.
This emphasis on appearance can conflict with “efficient” supplychain operations. Moving product from Asia to other regions of the world isfacilitated by easy stacking on pallets and optimization of the quantity thatcan be accommodated in a standard shipping container. Gray Williams,Logitech’s vice president of worldwide supply chain, says, “Unfortunately,what is good for the retailer isn’t always good for product distribution.Retail packages come in odd sizes and shapes, and this can make them hard

152 Strategic Supply Chain Management
to fit on a pallet or in a shipping container. Sometimes, a very small adjust-ment in the packaging dimension can make the difference between fitting200 units on a pallet or fitting 250.”
This sounds like an easy change to make, but at Logitech, decisionsabout the look and feel of packaging are the domain of marketing, not thesupply chain group. As Perry notes, “Everyone understands the need tokeep operations costs low, but not if it means the products don’t sell as aresult.” Not only that, but once a product has been sold in a particular pack-age, it is very difficult to modify the design. “Retailers see a packagingchange as a whole new product,” says Perry, “so they may want toexchange anything they already have on hand for the ‘updated’ version ofthe product. That can be extremely expensive for us. We need to get it rightthe first time—and that wasn’t always happening.”
The process for packaging design was never intended to be serial,with a handoff from marketing to the supply chain group after the designwas finalized; it just evolved that way. The solution for Logitech was closecollaboration between the supply chain and marketing functions and earlyinvolvement of the supply chain group in the product developmentprocess. It also meant compromises on both sides. “Our job is to take thedesired packaging design and find the most cost-effective way to sourceand distribute it,” says Williams. “It isn’t to second-guess the design. Butwe want the marketing team to be open to making concessions that canmake distributing the product more efficient.”4
A focus on collaboration between the marketing and supply chainorganizations resulted in packaging that allows Logitech to get productsto customers as efficiently as possible while remaining a reflection of theinnovation and quality of the products within.
Define the Appropriate Degrees of Collaboration (i.e., Segment)
A world in which your company is tightly linked to all its supply chainpartners—customers and suppliers alike—is highly appealing but virtuallyimpossible and not likely to be very cost-effective. Intensive collaborationis complicated, challenging, and costly, requiring a major investment inresources, processes, and systems. Moreover, not all customers are equallyprofitable and not all suppliers are equally valuable. And many potentialpartners may not be capable or even willing to support the level of collab-oration you want. Therefore it makes sense to segment your partners beforeembarking on a collaboration program—much like marketing profession-als segment their target customers.
CHAPTER 4 Core Discipline 4: Build the Right Collaborative Model 153
This means deciding on a segmentation approach. No doubt you havea list of customers, suppliers, or commodities that you consider “key” or“strategic.” But what factors cause you to label them as such? Size of com-pany? Price of materials or services? Their dependence on you—or you on them—as a buyer or supplier? Their value to you in terms of revenuegeneration?
Segmenting supply chain partners is critical to effective collabora-tion. No matter how much or how little value they contribute to your com-pany, all potential partners have an appropriate place along thecollaboration spectrum. Basing your decision of whom to collaborate withon a simple ranking of who your most valuable suppliers, serviceproviders, and customers are is inherently risky.5
A better approach is to consider several partner-selection criteriaweighted according to your specific needs:
◆ Strategic importance. How essential are the potential partner’ssize, business volume, technology, expertise, materials/components, or market position?
◆ Cultural fit. How compatible are your people and values, andhow well will you work together? Are you equally committed tothe relationship, even though business conditions may change? Is there mutual trust?
◆ Organizational fit. Can the partner respond quickly and fully torequests for information and materials? Is the partner flexibleenough to adapt to changes in demand or supply? Are the roles andresponsibilities in place for managing a long-term relationship?
◆ Technology fit. Are your systems compatible and easily inte-grated? Do you have the same degree of technical sophistication?Are you equally willing to share technologies and innovativesolutions? Can your partner provide accessible, integrated data?
Choosing partners is made much more complex by the need to assessthe selection criteria along two dimensions: the category of relationship(customer, material supplier, or service supplier) and collaboration type(transactional, cooperative, coordinated, or synchronized).
The best approach is to create an assessment framework beforeapproaching any partners. Start by listing the conditions that a partnermust meet to be considered for each collaboration type. To make sure thatyou’re being objective, develop criteria that are clear and unambiguous.Know how many partners of each type you want to have, based on theneeds of your business or previous experience with collaboration. Then

154 Strategic Supply Chain Management
rank the prospective partners by how well they meet the different criteria.You may create a list of “must haves” and eliminate any partners that failto meet these criteria.
Alcatel, a global manufacturer of telecommunication products andservices, applied a deliberate segmentation strategy when it set up collabo-rative relationships with several major customers and suppliers. In the com-pany’s own words, a relationship with Alcatel “can enable a partner to focuson its own core competencies rather than worrying about the reliability ofits telecommunications infrastructure.”6
In late 2001, in the midst of a contracting telecommunications equip-ment market, Alcatel management conducted a comprehensive assessmentof its existing planning process. The assessment showed that componentsuppliers often relied on outdated information from Alcatel in their ownproduction plans. The problem stemmed from a serial, disjointed forecast-ing process that involved multiple supply chain partners. Alcatel fed itscustomers’ forecasts into its demand-planning cycle. Planning data werethen provided to the company’s contract manufacturers, who had their ownplanning processes. Finally, up to six weeks after the customers’ forecastswere received, the data—by then out of date—were sent to component sup-pliers. Moreover, the participants in the process all applied their own inter-pretations of what actually was needed. By the time responses werereceived from suppliers, the perceived reality and the accompanying sup-ply plan had very little relationship to the original marketplace demand.
The company had a clear opportunity to better match supply withdemand by improving collaboration with its supply chain partners. NotesBurt Rabinowitz, Alcatel’s vice president of sourcing and procurement,“We realized that our supply chain can only respond when it is synchro-nized with the supply chains of our key trading partners. We needed tojointly address the ‘pinch points’ in the supply chain—the points at whichinformation flows from one supply chain partner to another. To do that, weneeded to involve our key trading partners.”
The management team developed a short list of companies consid-ered highly important because they either provided a large volume of busi-ness or supplied unique or critical materials to the company. The teamthen ranked prospective collaboration partners based on three primary cri-teria: business volume, technical sophistication and innovation, and part-ner loyalty and willingness. The partners chosen included a majorcustomer and its primary contract manufacturer, primary electronics dis-tributor, and several suppliers of custom ASICs (application-specific inte-grated circuits) and optical devices.

CHAPTER 4 Core Discipline 4: Build the Right Collaborative Model 155
To initiate the relationships, Alcatel management invited executivesfrom each prospective partner to participate in a business outlook forum.The executives discussed the impact of the severe market changes on theirbusiness and how their companies could better collaborate to streamlineprocesses and lower costs. Another goal of the forum was to assess moresubjective criteria—including cultural fit and seeming willingness to com-mit to a collaborative relationship.
“We knew that the key to greater supply chain flexibility would beto better understand the process handoffs and then augment the existingsystems with deeper, collaborative processes,” says Danny Wade, seniorvice president for quality. Wade notes that applying this approach to allcustomers and suppliers would not have been practical. “We were verydeliberate in crafting our ‘guest list.’ We needed to make sure each part-ner recognized that we were all in this together, and we needed to avoidunnecessary complexity.”
By the end of the forum, each executive had committed to find-ing better ways to collaborate and to developing a conceptual designfor a coordinated collaboration model to address forecasting, ordermanagement, inventory visibility, and performance measurement. Themodel would include roles and responsibilities, process flows, busi-ness interfaces, and operating rules, in addition to information tech-nology (IT).
Then Alcatel senior managers worked with the partners to define thedetailed guidelines needed to support the conceptual design. Finally,Alcatel piloted the collaboration model with a key product that createddemand for the partner companies, had market momentum, and requiredthe coordination of both internal and external manufacturing operations.Some of the partners helped Alcatel with supporting IT solutions to aug-ment the process guidelines, including new reports, additional logic, andWeb-enabled views into work in process. All partners agreed to share data,synchronize their planning calendars, and respond to standard demandrequests within three business days.
The new collaboration model reduced planning cycle times by 50percent and sharply reduced end-to-end inventories. “We’re able to bettermatch our supply to our customer’s demand,” says Mike Quigley, chiefexecutive officer of Alcatel USA. “More important, by involving cus-tomers in the problem definition, solution, and pilot, we increased theircommitment to broader improvement initiatives. They’re excited aboutworking with us, and we’re enjoying a closer business relationship—onebased on facts, not feelings.”7
156 Strategic Supply Chain Management
Share Benefits, Gains, and Losses
Our definition of collaboration includes the concepts of mutual objectivesand of sharing risks and rewards. Formal gain sharing is a well-knownway to distribute the financial benefits of a business relationship. In gainsharing, each partner agrees to work toward lower overall costs and toshare the savings. The specifics usually are detailed in a legal contract.
Gain sharing can be a highly effective incentive for continual costreduction and improvement of services, and there are numerous approachesfor implementing a gain-sharing strategy. While we have seen many exam-ples of effective partnerships based on gain sharing, a collaborative rela-tionship can be mutually beneficial even when it is not based on tangiblecost savings.
Consider the relationship between Dow Corning and Cabot Cor-poration. Dow Corning is equally owned by the Dow Chemical Companyand Corning, Inc., and is one of the world’s largest producers of siliconand silicone-based technologies, offering more than 7000 products andservices.8 Cabot is a $1.5 billion plus global specialty-chemicals company.Its primary products are carbon black, fumed silica, inkjet colorants, plas-tic masterbatch, oilfield drilling fluids, and tantalum capacitor materials.9
In the world of specialty chemicals, one company’s by-product isanother company’s key ingredient. Such is the case with Dow Corning andCabot, and the two companies have established a collaborative relationshipthat demonstrates clearly how each company’s results can be tied to itstrading partner’s performance.
Dow Corning is a major producer of purified silicon for the siliconwafer industry using a process that results in a by-product known as sili-con tetrachloride or chlorosilane. Silicon tetrachloride is a key ingredientused in the manufacture of fumed silica, one of Cabot’s key products.Dow Corning uses 20 different grades of fumed silica as a key “filler”ingredient in its sealant (silicone caulking) product line.
The relationship between the two companies is so strong that two ofCabot’s primary plants are located directly adjacent to Dow Corning’s,and material is transferred between the two entities through a shared infra-structure. To make the process work properly, Dow Corning and Cabotproduction managers meet to discuss production plans on a daily basis.Dow Corning managers identify the expected amount of silicon tetrachlo-ride that will be made available and the amount and grade of fumed silicathat will be required. In response, Cabot identifies the amount of silicontetrachloride that it will be drawing from Dow Corning and the grades offumed silica that will be available. If sufficient quantities of the desired

CHAPTER 4 Core Discipline 4: Build the Right Collaborative Model 157
grade are not available, both sides negotiate until a mutually acceptablesolution can be developed. The production schedules for each companyare then adjusted in response to these inputs.
An additional indication of how tight this relationship is can befound in how each partner pays for the material used. Each company mon-itors the volume of product flowing between the factories. At the end ofeach month, the aggregate data are reviewed, any discrepancies are rec-onciled, and a summary invoice is produced. Since prices are set duringnegotiation, only the volume requires reconciliation.
An Example of Mutual GainToday’s technologies offer the opportunity to manage business in wayspreviously thought impossible or, at the very least, implausible. Eventhough a capability may be technically feasible, setting up a process thatleverages that capability is not always necessary. Indeed, in many cases itis not at all appropriate.
Many effective collaboration strategies are not reliant on technology.Despite the hype associated with business-to-business (B2B) solutionsthat seems to envelop many supply chain professionals, most companiesfind that many of their prospective partners simply lack the technicalsophistication required to participate in a collaboration process that isbased on the use of complex information systems. Remember that trans-actional relationships are still considered collaborative; just because yoursystems are not “seamlessly integrated” with every sheet-metal shop andplastics molder who supplies your manufacturing operation doesn’t meanthat you are not working collaboratively. In fact, relationships all along thecollaboration spectrum may be extremely effective but make little or nouse of the advanced capabilities offered by supply chain collaboration sys-tems vendors.
Jamba Juice is a San Francisco–based retailer that operates stores in25 states throughout the United States. The menu at Jamba Juice stores issimple; the chain sells made-to-order all-natural smoothies, as well as avariety of freshly squeezed juices, baked goods, and other snacks. Allitems are created with the goal of balancing “great flavor” with “powerfulnutrition.”10
Jamba Juice’s suppliers include large fruit and vegetable growers.The company establishes long-term contracts in order to ensure availabil-ity of supply. “We can’t strike a deal with Mother Nature herself,” explainsJoe O’Neill, Jamba Juice’s chief financial officer, “so we have to get cre-ative when it comes to getting as close as possible to guaranteed avail-ability of the produce we need.” And Jamba needs a lot of produce—the
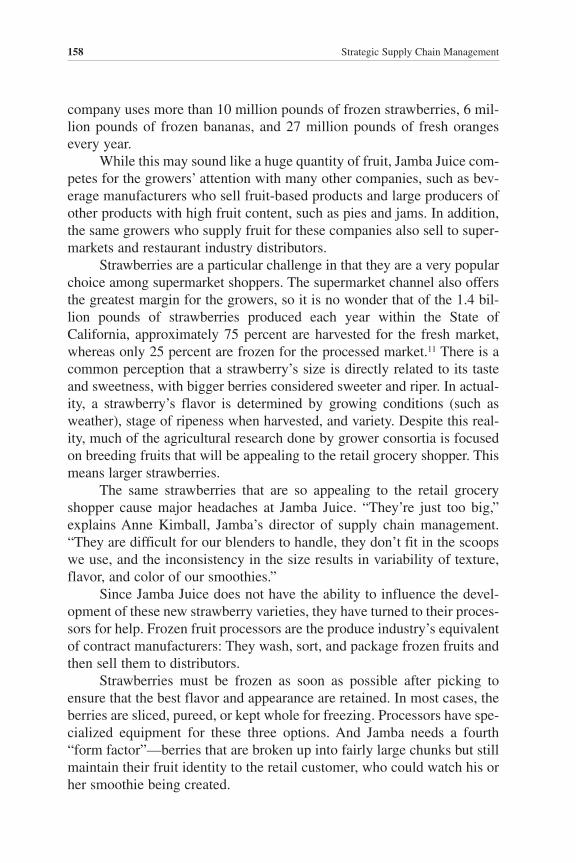
158 Strategic Supply Chain Management
company uses more than 10 million pounds of frozen strawberries, 6 mil-lion pounds of frozen bananas, and 27 million pounds of fresh orangesevery year.
While this may sound like a huge quantity of fruit, Jamba Juice com-petes for the growers’ attention with many other companies, such as bev-erage manufacturers who sell fruit-based products and large producers ofother products with high fruit content, such as pies and jams. In addition,the same growers who supply fruit for these companies also sell to super-markets and restaurant industry distributors.
Strawberries are a particular challenge in that they are a very popularchoice among supermarket shoppers. The supermarket channel also offersthe greatest margin for the growers, so it is no wonder that of the 1.4 bil-lion pounds of strawberries produced each year within the State ofCalifornia, approximately 75 percent are harvested for the fresh market,whereas only 25 percent are frozen for the processed market.11 There is acommon perception that a strawberry’s size is directly related to its tasteand sweetness, with bigger berries considered sweeter and riper. In actual-ity, a strawberry’s flavor is determined by growing conditions (such asweather), stage of ripeness when harvested, and variety. Despite this real-ity, much of the agricultural research done by grower consortia is focusedon breeding fruits that will be appealing to the retail grocery shopper. Thismeans larger strawberries.
The same strawberries that are so appealing to the retail groceryshopper cause major headaches at Jamba Juice. “They’re just too big,”explains Anne Kimball, Jamba’s director of supply chain management.“They are difficult for our blenders to handle, they don’t fit in the scoopswe use, and the inconsistency in the size results in variability of texture,flavor, and color of our smoothies.”
Since Jamba Juice does not have the ability to influence the devel-opment of these new strawberry varieties, they have turned to their proces-sors for help. Frozen fruit processors are the produce industry’s equivalentof contract manufacturers: They wash, sort, and package frozen fruits andthen sell them to distributors.
Strawberries must be frozen as soon as possible after picking toensure that the best flavor and appearance are retained. In most cases, theberries are sliced, pureed, or kept whole for freezing. Processors have spe-cialized equipment for these three options. And Jamba needs a fourth“form factor”—berries that are broken up into fairly large chunks but stillmaintain their fruit identity to the retail customer, who could watch his orher smoothie being created.

CHAPTER 4 Core Discipline 4: Build the Right Collaborative Model 159
“I know it sounds simple,” says Kimball, “but this required a creativeprocess for ensuring that there was a sufficient quantity of frozen berriescoming off the processing line that met our growing volume requirements.”Jamba’s supply chain and R&D organizations worked closely withCleugh’s Frozen Foods, Inc., to develop a proprietary technology to breakup the berries prior to freezing in a way that suits the in-store productionprocess. “This was not a small investment by Cleugh’s,” notes Kimball.“However, their ability to ensure that we had fruit that could be portionedsolidified our existing partnership with this long-term supplier partner.”12
The relationship between Jamba Juice and its strawberry packer is agreat example of coordinated collaboration. It’s an example that is not atall reliant on the availability or use of sophisticated information systems.
Trust Your Partners, but Protect Your Interests
Effective collaboration is based on building relationships and on sharingboth information and the benefits gained as the relationship progresses.This means that you can’t ask your partners for something without givingthem something in return: That “something” can be price concessions,value-added services, or in most cases, information. If you’re willing to setup an infrastructure to automatically send purchase requirements to yoursuppliers but don’t want to provide your sales projections for the next ninemonths, ask yourself why not. Sharing information requires trust; it maybe that you don’t have the necessary confidence in your partner.
There’s a good reason that many companies are skeptical about mak-ing highly strategic information available to collaboration partners: Trustis violated all the time! Confidential pricing data make their way into thehands of competitors, engineering specs are copied, or the “best” supplierterms and conditions are found to be less favorable than those granted toother customers.
Take the experience of a leading network equipment company withhealthy margins—due in no small part to its extremely aggressive suppliermanagement. The company demands the lowest price on its key compo-nents and insists that these pricing arrangements be kept confidential. Toshield prices from competitors, it buys these key components through acentral procurement group, which delivers them to a contract manufac-turer. The company had established a close relationship with a major sup-plier and was confident that it was getting the lowest price on an importantelectronics component—until it acquired a company and found that it hadbeen buying the same component from the same supplier for 10 percent

160 Strategic Supply Chain Management
less! This occurred despite a commitment from the supplier that the pricebeing paid by the network equipment company was the lowest offered toany customer.
Violations of trust related to pricing are not news to Greg Frazier,executive vice president of Avnet Supply Chain Services (ASCS). He seesexamples of failed collaboration “all the time.” ASCS is the services armof Avnet Electronics Marketing, a global distributor of electronic compo-nents. Frazier’s organization provides end-to-end supply chain services tooriginal equipment manufacturers (OEMs), electronic manufacturing ser-vice (EMS) providers, and electronic component manufacturers. Fraziernotes that the pricing problem may stem from the definition provided bythe supplier, which may have promised the lowest price, but with fineprint clarifying “for a company exactly your size, serving your exact cus-tomer base.” Notes Frazier, “In many cases the idea that a ‘best price’exists is an illusion.”
The fact is that trust does get violated. Instead of using this as an excuseto avoid collaboration, set up your partnership so that you’ll be protected.
The concept of protecting a company from a confidentiality breachalso has matured in the last few years. As more companies share forecasts,production levels, delivery schedules, pricing, and product data, securityof information becomes a critical issue—and no longer just an internalone. Your collaborative partnerships typically should include a contract orconfidentiality agreement that provides a level of legal data protection thattranscends the “fuzzier” concept of trust. While a structured contract canminimize risk, don’t assume that it will provide a source of legal recourseshould the relationship fail. Instead, use the contract as a tool for clarify-ing how the relationship will be governed and for specifying roles andresponsibilities.
Another concern is transmitting data. Although many technologiescan encode data to arrive uninterrupted and uncompromised, the risk oftechnology failure is very real. As a result, more companies are using com-prehensive, pricey security services to minimize this risk. These oftenrequire that partners follow certain security practices that specify passwordtypes, for instance, and limit access to networked servers and workstations.Although approaches vary, business and IT executives scrupulously ana-lyze their partners’ security as well as their own. 13
To help companies manage information security risk, the InternationalOrganization for Standardization (ISO) created ISO/IEC 17799, a com-prehensive set of controls that dictates best practices in 10 critical areas ranging from security policy to business continuity management. Some

CHAPTER 4 Core Discipline 4: Build the Right Collaborative Model 161
companies require that their collaboration partners adhere to ISO/IEC17799. Because the standard is a framework for best practices in informa-tion security rather than a methodology, these companies generally use it toframe the specifics of what they require of their partners. These specificsmay include such measures as disaster-recovery plans or the consistent useof antivirus protection within all network-connected devices.
Eliminating all information-security risk is virtually impossible. Yourcompany’s supply chain is dynamic. New customers and suppliers areadded constantly, and the level of collaboration in current relationships isalways evolving. To set the right level of security, first identify the situa-tions that would cause the greatest business disruption. This might be theunavailability of critical systems, loss of data integrity, or disruptions inongoing communications with your partners. Then assess and put in placethe steps or tools needed to minimize the odds of these events occurring.
Use Technology to Support Your Collaborative Relationships
Technology allows you to communicate with your supply chain partners.It breaks down barriers between companies, improves the flow of infor-mation, and converts data into useful information. Given the conceptualappeal of end-to-end supply chain management and the ready availabilityof technology to make it happen, then, why have companies been so slowto embrace real collaboration? We think the answer is simple: They’ve notbeen ready.
At the peak of the Internet bubble, many software companiesbelieved that if they installed the right supply chain applications and systems, sales would follow. But things didn’t work out that way. Many companies expected to reap the promised benefits without doing the pre-liminary legwork—the analysis, process redesign, and alignment with thenew applications needed to gain the full functionality.
Most early e-commerce systems addressed large, long-term collabora-tion issues such as extended forecasting, demand creation, and operationsplanning. Many of these were top-down initiatives driven by executives withequity positions in the companies whose technologies they were advocating.And many purveyors of systems and tools made promises they simplycouldn’t keep. At many companies their processes were too immature, theneeded data weren’t available, or they were unprepared for the new, collab-orative ways of working that the new technologies theoretically could enable.
Moreover, no single e-business standard for transactions and mes-saging emerged to rally a critical mass of users. Collaboration tools had to

162 Strategic Supply Chain Management
translate multiple data formats, adding to their complexity and furtherlimiting their appeal. In short, the world was not ready for the richness oftechnology available.
As a result, many of the early B2B “portals” were simply databasesfor pushing information. Company A would publish data to a site and thennotify Company B that the information was available—or assume thatCompany B would check the site on a regular basis. Company B wouldview the information, download it to its own system, and choose whetheror not to take action. In effect, the Internet became an expensive, sophis-ticated enabler of electronic data interchange (EDI). The most commonapplication became online auctions for buying and selling products andmaterials. Why? Because these applications didn’t demand the systemsand data integration needed for true collaboration.
After the dot-com collapse, many collaboration tools addressed a nar-rower focus—supply chain execution rather than long-term planning. Thisnarrowed focus mitigated the risk of information sharing, helped automatemany manual processes, and allowed companies to work in real time.
Today’s collaboration tools focus on supply chain event management and onrelationships between customers and sup-pliers. As technology advances and com-panies become better prepared for therigorous data maintenance needed for sup-ply chain collaboration, the promise ofthese new applications may soon become areality. It’s important to use these tools sen-sibly. While they can improve the flow ofinformation and aid decision making, theycan’t compensate for suboptimal processesor the expertise of a seasoned supply chainprofessional. A good collaborative system
can gather data and make recommendations based on a predefined set ofbusiness rules, but it can’t gauge the applicability of those rules to thecurrent situation or calculate the effect of an inappropriate demand on asupply chain partner.
Nonetheless, technology is a critical element of most coordinated andsynchronized collaborative relationships and many cooperative relation-ships. Remember that technology is an enabler, not the driver of success.To make your technology investment pay off, make sure that your organi-zation is set up to leverage it. This may mean changing your organization’sstructure, processes, incentive plans, and performance measurement.
Today’s collaborationtools focus on supplychain eventmanagement and onrelationshipsbetween customersand suppliers.
CHAPTER 4 Core Discipline 4: Build the Right Collaborative Model 163
Involve your suppliers and customers in the selection and develop-ment of processes and systems. Or at the very least, solicit feedback fromthem and allow them to influence or enhance the design. Make your tech-nology solution a foundation of service excellence—not an excuse forpoor service.
Don’t Forget to Compromise
Unless you’re Dell or Wal-Mart, don’t expect that your requests for cus-tomer or supplier collaboration will be met with an immediate flurry ofpositive activity. When you invite another company to be a collaborationpartner, you’re asking it to make fundamental changes in how it operates.The farther you go along the collaboration spectrum, the more you’re ask-ing of your partner. Only the largest and most powerful companies are ina position to force changes. Other companies must be prepared to sellprospective partners on the idea of collaboration.
We’ve already made the point that thegoal of a collaborative relationship is torealize strategic or financial benefit. Asobvious as it sounds, collaboration for thesake of collaboration is simply not worththe effort. Collaboration isn’t about shiftingcosts from one supply chain partner toanother. It’s about setting up the supplychain to lower overall costs and then shar-ing the savings. This means that you mustbe willing to compromise.
Avnet’s Frazier sees many electronic-component suppliers and contract manufac-turers forced into collaborative relationshipsat a level that they’re not prepared to sup-port. “It’s one thing to share forecasts elec-tronically,” he notes, “but when thesecompanies are asked to do sophisticated logistics, it can be hard to take onthese added tasks and still profit from the relationship.”
Frazier’s company works with component manufacturers that preferto sell their products through Avnet rather than directly to the end cus-tomer. “Many of these companies have a hard time making money sellingdirect,” he says. “It isn’t a matter of competency; it’s a matter of strategyand scale. These companies are in business to sell electronic components,not to manage other companies’ supply chains.”
Collaboration isn’tabout shifting costsfrom one supplychain partner toanother. It’s aboutsetting up the supplychain to lower overallcosts and thensharing the savings.
164 Strategic Supply Chain Management
Many of these component manufactures sell to OEMs that outsourceproduction to contract manufacturers—often multiple contractors in mul-tiple locations. A component manufacturer selling to five OEMs, eachwith five manufacturing partners with five manufacturing facilities, mustsupport 125 different manufacturing sites. “That means 125 forecastscoming in each week,” Frazier points out. “Without major investments inpeople, systems, and infrastructure, this is a very difficult model for mostcomponent manufacturers to support.”
Often, OEMs or EMS providers develop the “master plan” for a col-laborative relationship—a plan that optimizes their own benefits.Suppliers are expected to provide value-added services as the cost of con-tinuing to do business. Yet, if you expect your suppliers to provide addi-tional services and to take on additional risk at no additional cost to you,your chances of getting them on board are small. And even if you do suc-ceed in getting them to “sign up,” you may find that they’re unable to meetthe requirements you’ve set for them. Instead, work closely with yourpartners to develop a value proposition they can understand and buy into.Create an agreement that fairly values the added services you want themto provide—and pay them an appropriate premium.
Successful collaborators make a major effort to bring their partnersup to speed. Some of the best practices involved in offering a compromiseinclude providing a technology solution to them at little or no cost andworking closely to get them up to speed with any new technology.Purchasing a license and having it installed at your supplier, however, isnot collaboration.
Finally, be sure to set up a way to monitor the results of your col-laborative relationships. Work with your partners to establish a set of met-rics that is consistent with the value proposition and can be updated andreviewed on a regular basis.
NEXT-GENERATION COLLABORATION
A critical aspect of collaboration is the need to capture and react tochanges in a partner’s planning data. Most of today’s collaboration toolsare built on centralized databases. Since it can take hours to assimilate andprocess data collected from numerous sources, companies often makedecisions based on historical data. If you’re an international company withheadquarters in the United States, that might be where you keep your cen-tral database. The tools need the data to be centralized in order to doglobal analysis—otherwise, they are just optimizing local information. To

CHAPTER 4 Core Discipline 4: Build the Right Collaborative Model 165
get the data into the database, they have to be “piped in” from all over theworld, which can take several hours. Thus, even though you think that youcan run real-time analysis, you can’t. This is the reason companies runtheir analysis using information from yesterday (or earlier). Before cen-tralized databases, analysis took a lot less time but was suboptimalbecause it only used a portion of the available data.
The next generation of collaboration takes us “back to the future”—tothe late 1990s, before the bubble burst, when Internet technology promisedcomplete visibility of operational information across the entire supply chainnetwork. In many ways the future is already here. Most of the technologyneeded for end-to-end visibility alreadyexists and has for some time. However, youcan’t fully leverage this technology until the process maturity at your organizationcatches up. Most companies are not thereyet, but they’re getting there fast.
In the next generation of supply chaincollaboration, technology advances will beovershadowed by changes in individual atti-tudes. There’ll be an evolution toward col-laboration as a joint investment rather thanthe more one-sided, “if we build it, we canmake them use it” attitude that charac-terizes many of today’s collaborative efforts.Changes will include the following:
◆ Companies will focus on collaborating to achieve long-term cus-tomer satisfaction rather than internal cost reductions.
◆ Distributed data architecture will become the most common plat-form for collaboration tools, allowing companies to respond inreal time to planning and execution data.
◆ Companies will explore the security policies of their collaborationpartners more closely, and new technologies will enable in-depthelectronic audits of security provisions.
◆ True integration among disparate systems will become a reality,allowing companies to monitor all their production and logisticsassets from a central system.
◆ Instead of simply automating routine transactions, systems willbe able to look ahead, predict unplanned events, and trigger thecorrect response as needed.
In the nextgeneration of supplychain collaboration,technologyadvances will beovershadowed bychanges in individualattitudes.

166 Strategic Supply Chain Management
◆ Software applications will be extended to multiple tiers of suppli-ers and distributors. While collaborating with multiple customersand suppliers will be the norm, companies will still reservedeeper planning and forecasting efforts for a select set of partners.
◆ Collaboration with materials suppliers will continue to be trans-action-focused, whereas relationships with service suppliers willbe more strategic and focused on planning.
◆ Applications will be built on top of an Internet-based architecturehosted externally.
◆ Collaboration increasingly will focus on the front end of the supplychain, with heavy emphasis on collaborative forecasting andreplenishment models.
◆ Use of industry-standard tools, such as RosettaNet PIPs and CPFR,will become the dominant forms of collaborative communication inthe electronic and consumer products sectors.
As a management discipline, collaboration is still in its infancy. Webelieve that it will change the economics of all companies as businesspractices, rules, and conventions are adjusted to reflect the realities ofintegration and increasing visibility across supply chains. Collaborationwill allow smaller companies to compete with larger companies, makingscale less critical as a competitive differentiator. Collaboration willbecome an essential discipline—and an inevitable part of your supplychain strategy. See Figure 4-6 for a collaboration guideline.

CHAPTER 4 Core Discipline 4: Build the Right Collaborative Model 167
F I G U R E 4–6
A collaboration guideline.
❏ You may have a grandiose vision for the future, but your chances ofsuccess are small if you try to go for “collaboration nirvana” fromthe start. Start with tactical improvements.
❏ Focus on a single, unambiguous vision for your collaborationstrategy, including clear goals and a purpose.
❏ Clearly understand your company’s current and future desired corecompetencies, and ensure that the collaboration strategy is whollyconsistent.
❏ Start small, focusing on a limited set of capabilities, on selectedpartner candidates, and on selected tasks.
❏ Recognize that early efforts can be supported by a manualinfrastructure (phone/fax/email); more extensive efforts will certainlyrequire more advanced supporting systems. So pay close attentionto how the systems will need to evolve.
❏ Let your business drivers and economic realities shape the nature ofyour collaborative relationships and the way they will be managed.
❏ Advance your technological capabilities only to the level that youexpect your partners to be able to manage.
❏ Assess the organizational changes that will be needed to supportcollaboration on a larger scale in parallel with your initial efforts.
❏ Align your company’s compensation and reward structure to thegoals of the collaboration strategy.
❏ Effectively manage your collaboration partners; have acomprehensive metrics program in place that allows you to monitortheir performance—and your own—on a regular basis.
❏ Don’t take people out of the equation. Stories abound aboutcompanies who “flipped the switch” on new collaboration tools, onlyto find that the system was recommending actions that made nosense from a business perspective. As your effort gets underway,make sure your organization is populated with skilled professionalsthat can monitor progress and make necessary midcoursecorrections.

This page intentionally left blank.
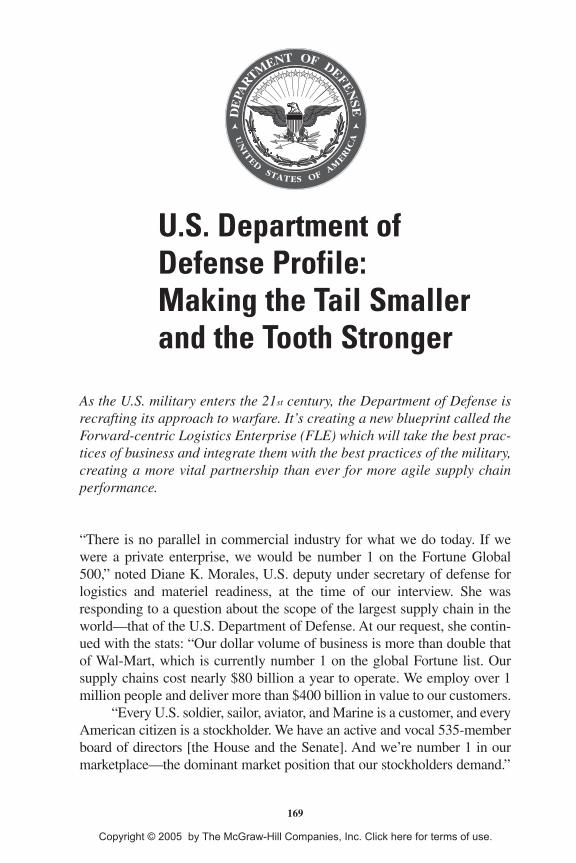
U.S. Department ofDefense Profile:Making the Tail Smallerand the Tooth Stronger
As the U.S. military enters the 21st century, the Department of Defense isrecrafting its approach to warfare. It’s creating a new blueprint called theForward-centric Logistics Enterprise (FLE) which will take the best prac-tices of business and integrate them with the best practices of the military,creating a more vital partnership than ever for more agile supply chainperformance.
“There is no parallel in commercial industry for what we do today. If wewere a private enterprise, we would be number 1 on the Fortune Global500,” noted Diane K. Morales, U.S. deputy under secretary of defense forlogistics and materiel readiness, at the time of our interview. She wasresponding to a question about the scope of the largest supply chain in theworld—that of the U.S. Department of Defense. At our request, she contin-ued with the stats: “Our dollar volume of business is more than double thatof Wal-Mart, which is currently number 1 on the global Fortune list. Oursupply chains cost nearly $80 billion a year to operate. We employ over 1million people and deliver more than $400 billion in value to our customers.
“Every U.S. soldier, sailor, aviator, and Marine is a customer, and everyAmerican citizen is a stockholder. We have an active and vocal 535-memberboard of directors [the House and the Senate]. And we’re number 1 in ourmarketplace—the dominant market position that our stockholders demand.”
169
Copyright © 2005 by The McGraw-Hill Companies, Inc. Click here for terms of use.

170 Strategic Supply Chain Management
We get the picture. Yet, although mighty indeed, the U.S. Departmentof Defense’s (DoD’s) supply chain apparatus is facing a transformation on a scale never before attempted. Morales’s invocation of Wal-Mart ($246.5 billion in annual sales) is appropriate. Besides shoelaces and tooth-brushes, frying pans and motor oil, though, the DoD has to supply missilesubassemblies, vehicle engines and transmissions, microcircuits, x-raymachines and magnetic resonance imaging (MRI) equipment, aircraftframes, heavy industrial machinery, and jet fuel, to name a few of the 4.6 million items stocked by the Defense Logistics Agency (DLA). EverySKU must be delivered on time—no stock-outs, no rainchecks—in what-ever quantities the customer requires, wherever the customer happens to bein the world at any particular moment.
That “customer,” as we all know, is what the military calls a“warfighter.” And he or she is liable to be anywhere, anytime these days. AsMorales notes, the pace and modus operandi of warfighting have changedconsiderably even over the past decade. “In 1991, in Desert Storm, GeneralNorman Schwarzkopf wanted 60 days of supplies on hand before he wouldlaunch an assault with a quarter million troops. In Operation Iraqi Freedom(OIF), General Tommy Franks wanted just two weeks’ worth of supplies for150,000 troops.”
WHEN PUSH COMES TO PULL
Morales has spearheaded one of the biggest transformation programs everlaunched at the DoD. It was called the Future Logistics Enterprise duringits policy-planning phase and was renamed the Force-centric LogisticsEnterprise (FLE) during the implementation phase. She describes the pro-gram as “an integrated plan to transform logistics to a more flexible forceto meet the requirements for agility and responsiveness.” The characteris-tics of this vision for a modernized logistics capability are fivefold:
◆ Speed. General Tommy Franks’s battle plan called for a lightningadvance on Baghdad, for instance. Never before has an armyadvanced so far so fast: The army covered more than 300 milesin 22 days.
◆ Flexibility. When Turkey balked at supporting a second front fromthe north in Iraq, the United States advanced successfully, solelyfrom the south, changing its strategy in a matter of hours.
◆ Precision weaponry. In the Gulf War, 8 percent of weapons usedwere precision-guided. In OIF, that figure was 66 percent.

U.S. DEPARTMENT OF DEFENSE PROFILE: Making the Tail Smaller and the Tooth Stronger 171
◆ Increased reliance on unmanned aerial vehicles. These are usefulfor both surveillance and combat.
◆ Joint operations. Coordination of the different service “compo-nents” is essential for effectiveness in today’s defense environ-ment. In OIF, 78 percent of the sorties flown were in directsupport of special operations forces.
Of course, the Army, Navy, Air Force,and Marines are not fighting any battle alone.They are dependent on what’s called the“tail”: the vast infrastructure that suppliesthem, from product development ofweaponry and machinery to transportationand other services sustaining them. AsMorales says, “Traditionally, defense logis-tics has been thought of as supply, transporta-tion, maintenance, and supporting informationsystems and infrastructure. But actually, it’ssupply chain management, integrated weaponsystem support, and integrated, shared data(the knowledge environment), plus materielreadiness.” Since the scope is so broad, theconcerns range from rightsizing the infra-structure to rightsizing the inventory andfrom transforming the overall logistics processes to demanding performancestandards and accountability from a very young military force.
Because of the scope and speed required to transform the military toa higher state of readiness, tomorrow’s defense supply chain will be verydifferent from yesterday’s. To use the parlance of supply chain manage-ment, it will move from a push to a pullmodel of customer order fulfillment. One ofthe most critical of its characteristics is ashift from vertical integration to a strategyof virtual value-chain management basedon deep collaboration with customers, part-ners, and suppliers.
The “tail” that supports the “teeth” ofthe military is drawing on best practicesfrom private industry. It is creating greaterpartnerships with the private sector than ever
Because of thescope and speedrequired to transformthe military to ahigher state ofreadiness,tomorrow’s defensesupply chain will bevery different fromyesterday’s.
Today, the “tail” thatsupports the “teeth”of the military isdrawing on bestpractices fromprivate industry.

172 Strategic Supply Chain Management
before. It’s being organized differently because more horizontal processesare being instituted incrementally. The end state will be the largest enterprisesystem in the world. It is designed to be more flexible, transparent, andsimultaneous—to be an agile infrastructure. It will, in itself, be a lean, meanfighting machine. It won’t get there overnight, but the FLE has been thelaunching pad for total transformation.
Unfortunately, the DoD cannot mimic the private sector in trans-forming its supply chain to effect these changes, for the scope and signif-icance of its activities and obligations vastly exceed those of any privateenterprise. It must answer to changing legislative mandates and, unlikeprivate enterprise, to the changing mandates of different presidentialadministrations. Its very motive—readiness or preparedness rather thanprofit—forces it to cope with logistical complexities and uncertaintiesunknown to private business.
THE BLUEPRINT FOR CHANGE
The FLE defines three drivers of change:
◆ Total life cycle systems management. This type of management is well established among manufacturers of complex products and among advanced industrial users of complex, mission-criticalcapital equipment but not so developed in the military.
◆ End-to-end distribution. This initiative is aimed at providingfaster and more reliable delivery by synchronizing the flow ofmateriel across the entire supply chain—from factory to foxhole.It calls for breaking down the barriers and seams between the“stovepipes” or “silos” among the organizations involved indemand planning, acquisition, sourcing, positioning, and trans-portation (e.g., DLA, and the U.S. Transportation Command, orTRANSCOM, etc.). This may well be the biggest challenge ofthe plan.
◆ Enterprise integration. All the aforementioned initiativesrequire the close integration of information systems andprocesses among all the entities in the national defense supplychain. DoD must have interoperable information systems thatdeliver comprehensive operational data, aggregated informa-tion, and logistical “situational awareness.”
These initiatives obviously have far-reaching consequences for logis-tics, personnel, weaponry, technology, and supplier relationships through-

U.S. DEPARTMENT OF DEFENSE PROFILE: Making the Tail Smaller and the Tooth Stronger 173
out the DoD—for the “components” (i.e., the Army, Navy, Air Force, andMarines), as well as for the policy-making offices. As Morales describes it,“We must build processes from the supplier base (both public and private)through the distribution agents to enable rapid movement of materiel. Wemust collaborate and build partnerships with industry to achieve thisresponsive, end-to-end delivery capability. This involves real-time infor-mation and tools such as radio frequency identification (RFID) tags totrack assets and more accountability and integration in the lifetime supportof weapons systems.”
Transformation at the DLA
Execution will not be for the faint of heart.A case in point is the Defense LogisticsAgency (DLA). The DLA has served forover four decades as the DoD’s “logisticscombat support agency.” With its nearly$25 billion in sales and services for fiscalyear 2003, it would occupy the no. 65 spoton the Fortune 500, just ahead of New YorkLife. The agency operates in 48 states and28 foreign countries and is staffed by21,000 civilian and 500 military personnel.
“We run the world’s largest warehousedistribution system,” says Vice Admiral Keith W. Lippert, the DLA’sdirector. “We also run a defense energy support center that supplies all thefuel for the Department of Defense. We run a national defense stockpilecomposed of strategic materials that we gradually sell into the market ifthey’re not needed. The stockpile is big enough that we have to watch theworld markets, because we can end up affecting world prices through ourvolume of sales.”
Admiral Lippert addresses the shift in thinking as it affects hisagency: “DLA was put together to manage consumable items that werecommon to all the services. What DLA did—and this dates back to 1962—was to buy material, put it in a warehouse, and then basically say to its cus-tomers, ‘OK, I bought it, so you had better come get it.’ The shift we’regoing through right now is toward understanding our customers’ require-ments and being responsive to them, even when there are problems in theindustrial base [that affect us].” In other words, the DoD is extending the sup-ply chain to include the customer’s customer and the supplier’s supplier.
With its nearly $25 billion in salesand services forfiscal year 2003, the DLA wouldoccupy spot no. 65 on the Fortune 500.
174 Strategic Supply Chain Management
Lippert is a member of the Joint Logistics Board (JLB), whichMorales established and which oversees the FLE. The JLB consists of themost senior-ranking logisticians from the four service branches, the U.S.Joint Forces Command, the DLA, and TRANSCOM. Three working groupshave been created to expedite the FLE’s initiatives: The Best BusinessPractices Group (“Reengineer for Success”), focused on logistics architec-ture and process reengineering; the Program Implementation Group (“Do ItRight”); and the Change Management Group (“Make It Stick”). Assistingall three groups is an advisory team drawn from industry.
THROUGH THE LOOKING GLASS: LIFE CYCLE MANAGEMENT
“I look at the FLE as a cross within a circle,” explains Morales. “The ver-tical bar is the requirement for integrated weapons system support over thelife cycle of a weapons system, which is something we don’t have today.”To reach this goal will require accountability, says Morales. “Today, wedon’t know what the lifetime cost of supporting a single weapons systemis, for example. No one person is accountable. You have the program man-ager who is responsible for the design, development, and fielding of aweapons system. The system then gets thrown over a fence to somebodyelse to sustain it over its lifetime. Reliability, maintainability, and mobilityhave not been key considerations, yet they have to be built into a system.
“We then need to have the people who are accountable for buildingthose features into a given weapons system also be the people accountable
for the sustainment of that system over itslifetime. Once we have these dual account-abilities, we’ll see better up-front decisionsbeing made.”
Morales refers to end-to-end distri-bution as the horizontal line of the crosswithin the circle. This line encompasses a spectrum of partners: industry partners,coalition partners, public-sector partners—partners who range from the supplier, themanufacturer of the part, all the waythrough to acquisition, contracting, and thefulfillment agents who actually deliver thatweapons system to the warfighter. “Thehorizontal line includes the operationalplanners who develop the system require-ments. It includes the financial community,
Right now, the DoDis building thepartnerships,protocols, andsystems that will getus to the goal of end-to-end capability,says Diane Morales,who launched theFLE initiative.

U.S. DEPARTMENT OF DEFENSE PROFILE: Making the Tail Smaller and the Tooth Stronger 175
and it includes the acquisition community. The point is that you have aworld of partners who are being called on to deliver this end-to-end capa-bility. It’s the extended supply chain,” Morales says.
“Nobody owns all the partners,” she continues. “There is no singlemanager of this supply system or owner of that system. Right now, theDoD is building the partnerships, the protocols, and the systems that willget us to the goal of end-to-end capability. And we’re starting to see someamazing successes in this area.”
THE INTEGRATED ENTERPRISE INITIATIVE: FROM EXCESS TO ACCESS WITH INFORMATION TECHNOLOGY (IT)
Enterprise integration is the circle around the cross and the enabler ofintegrated weapon system support and end-to-end distribution. The fast-track evolution of the DoD’s data enterprise from hundreds of cold-warlegacy systems and their hundreds of millions of lines of code to state-of-the art information systems and processes integrated across the nationaldefense supply chain has been one of the most ambitious programs in theFLE agenda.
Laura Faught, cochair of the Program Implementation Group, one of the FLE’s “triangle groups,” and assistant deputy under secretary ofdefense for logistics systems management, talked to us about the processand progress of logistics systems modernization: “First, and most obvi-ously, we developed the overall enterprise data strategy collaborativelywith parts of our logistics domain. A basic lesson in change managementis that you don’t stuff an architecture, especially a process-oriented archi-tecture, down the throat of an $80 billion supply chain. We pulled in from across the DoD logistics domain, business process owners and keystakeholders from the Defense Logistics Agency, the Army, Navy, AirForce, Marines, Joint Forces Command, and TRANSCOM. This gave usan anchoring in our customers’ perspec-tives, just as the SCOR model anchored usin a process orientation.”
Faught says her group leveraged the IT community’s technical views of the stan-dards and focused on architecture, datastrategy, portfolio management, and “a scal-able, repeatable process to ensure that we’revery smart acquirers of commercial tech-nologies to support our system and processintegration.” She thinks the key to success in
“You don’t stuff aprocess architecturedown the throat ofan $80 billion supplychain,” says LauraFaught.
176 Strategic Supply Chain Management
integrating systems is data strategy: “Our basis is motherhood and applepie: It’s to have accurate and operable data available to whoever has autho-rized access to it, whenever they need it.” This meant a single point of entryinto the logistics data enterprise, as opposed to all the point-to-point inter-faces provided by the legacy systems. The DoD accomplished this in a testcase with the Joint Strike Fighter. “It’s a matter of transparency: access toaccurate data as the weapon moves through its life cycle,” says Faught.
The work of Faught’s group evolved into an enterprise integrationtoolkit that has wide applicability beyond logistics: “It’s a framework forhow anyone can develop the business case, how you can select and docontracts with the integrators and the commercial off-the-shelf (COTS)software vendors, how you can do your blueprinting, how you can mapthe whole life cycle of this process or of that project,” says Faught. “In it,you have an entire set of compliance criteria tied back to all the architec-ture products at the component level.”
Application of IT Principles at the DLA
The DLA has built on the work of Faught’s group and its “integrate theenterprise” mandate. As Admiral Lippert explains, DLA runs on a systemcalled the Standard Automated Materiel Management System (SAMMS).It’s a system that was designed in the 1960s and implemented in the early1970s. SAMMS is written in COBOL, and it has about 6 million lines ofcode associated with it. It’s probably five generations behind the systemsat world-class private-sector companies. The DLA tried on five differentoccasions to replace the system and failed five different times, accordingto Lippert. “So we’re now on our sixth attempt to replace it, and this timewe’re going to succeed,” he asserts.
The new system went up in August 2003, with 170,000 of the 4.6 million items the DLA handles, on a SAP backbone solution, an enter-prise resource planning system that’s being customized for the DLA’s vol-ume and requirements. SAP is the core for financial management andrequisition fulfillment, but the DLA is using an application from Manu-gistics as a bolt-on for demand planning, and a separate system, called theProcurement Desktop 2 (PD2), for procurement.
“Collectively, this is the biggest development in our business in 34years,” says Lippert. “I think we’re on schedule for the new system to payfor itself by 2008 or 2009 through fewer IT people, reduced inventories,better forecasting, and better data accuracy than we’ve ever had before.”
Lippert speaks proudly of the executive information system that hasbeen instituted at DLA as well: “I get a daily update of key statistics on

U.S. DEPARTMENT OF DEFENSE PROFILE: Making the Tail Smaller and the Tooth Stronger 177
my PC, as does the entire management team. The results are color-coded:red, yellow, or green, depending on whether we’re on plan, or behind plan,or starting to fall behind plan. One of the first things I do in the morning,after I get through my e-mails, is click onto this thing and find out exactlyhow we did yesterday.”
The DLA handles 45,000 requisitions and issues 8,000 contracts aday, on average. To improve its performance, it has simultaneouslyembarked on programs of strategic distribution, competitive sourcing, andstrategic supplier alliances in addition to business systems modernization.Are the programs working? And if so, how well? The agency is is aggres-sively implementing performance metrics and benchmarking to answerthese questions. DoD always has struggled with what metrics the staffshould be looking at to measure performance within the logistics opera-tion. It realizes that it’s important to get the right metrics—the transfor-mational metrics—so the current effort is to develop what’s called a“balanced scorecard.” The Joint Logistics Board is working together tofinalize the metrics to implement this scorecard.
The bottom-line results are already impressive: By paying attentionto the metrics and taking corrective actions, the DLA has reduced its backorders by 22.2 percent since October 2001 and has achieved the lowestcost recovery rate (operating costs as a percentage of total sales) in its his-tory. The agency is also operating at close to an all-time low in terms ofpersonnel—just under 22,000 people—versus an all-time high of threetimes that from 1989 to 1992. “We’re working to improve the tooth-to-tailratio,” notes Lippert.
THE END-TO-END INITIATIVE: CREATING POLICIES FOR CHANGE
The champion for the end-to-end initiative is Alan Estevez, assistantdeputy under secretary of defense for supply chain integration and thechair of the FLE’s Best Business Practices Group. Estevez characterizesthe biggest challenge in supply chain integration as getting supplies to theend customer without his having to even order them: “Why should my sol-dier out on the battlefield—who is out in dust and dirt and getting shot atand fixing things so [that] he can keep fighting the enemy—have to worryabout ordering if he can pull the supply he needs and then have the back-fill for that supply just show up?”
To effect this kind of change, Estevez has been working on revisionsto the military’s 4,140 materiel management regulations. The revisions callfor accountability on all sides for delivering supply to customers whereverthey are in the world. Everyone is accountable. There are no handoffs of
178 Strategic Supply Chain Management
responsibility, as in the past. “It’s not aboutend-to-end distribution (which impliessequence) but about end-to-end supply,” saysEstevez. The mechanism for this account-ability is performance agreements—withoriginal equipment manufacturers (OEMs)and suppliers and internally with customers.The metrics that Estevez is looking at—time-definite delivery, customer wait time(a measure of the velocity in the pipeline),
etc.—have everything to do with the end customer, not with the distributionnetwork. Three pilot programs have shown that calibrating to the customercan pay off: with the Naval Air Systems Command and Naval Sea SystemsCommand and their depots, with the Army’s installation activities for theBlack Hawk helicopter and the Abrams Tank, and with the Air Force/DLAcollaboration on supply for the F15, F16, and KC135.
With the imprimatur of the Joint Logistics Board, Estevez’s groupis also using a balanced scorecard to track performance to key metrics.One of the quadrants of the scorecard—the anchor quadrant—representsthe warfighter perspective. There are two high-level metrics in that per-spective. One is getting the combat capability to where it needs to be, andthe other is force readiness and the operational availability of weaponssystems. However, there’s also a quadrant for “sustained capability” thatgoes beyond the warfighter’s perspective, says Estevez. That quadranttakes into account such matters as development cycle times for weaponsplatforms—concerns that would not have been considered supply chainissues in the military world before FLE. They’re indicative of the newend-to-end perspective.
Part of the policy set forth by the Best Business Practices Groupcalls for “mobility force structure.” More than any other single concept,this explains the critical role that logistics play in supporting warfighterstoday. Earl Boyanton, assistant deputy under secretary of defense fortransportation policy and previously a career transportation officer in theAir Force, describes it as “a three-legged stool: airlift, sealift, and prepo-sitioning.”
“Just as combat units have force structure—the Army has so manydivisions, the Navy has so many carriers, and the Air Force has so many airwings, fighter wings, and bomber wings—we think of mobility force struc-ture in the same way. How many air mobility (airlift and aerial refueling)wings do we need, how many transport ships? In Iraq, prepositioning—
“It’s not about end-to-end distributionbut about end-to-endsupply,” says AlanEstevez.

U.S. DEPARTMENT OF DEFENSE PROFILE: Making the Tail Smaller and the Tooth Stronger 179
where you have everything from combat equipment like tanks and heli-copters to consumables all stashed in places other than the United States, asizable portion of them on ships in different oceans of the world—allowedmore rapid reaction and less reliance on airlift and sealift to get materiel toa distant location. All of that paid off dramatically.”
Much of the afloat prepositioning Boyanton is talking about usesspecially commissioned 900-foot-long medium-speed ships with largeroll-on, roll-off ramps to more efficiently load and unload the military’swheeled and tracked equipment. These ships, crewed by civilian merchantmariners, were procured by DoD after Operation Desert Storm, when themilitary realized that greater flexibility and quicker reaction were imper-ative and could be realized through increased afloat prepositioning.
Boyanton thinks that another major factor for success during the Iraq engagement was in-transit visibility. And this, we learn, is related toadvanced technology. With a fast-moving force, the challenge on the logis-tics side is to keep up and keep it supplied without putting too much of a“logistics footprint” on the ground. One of the ways this was accomplishedin Iraq was with RFID tags, which can be read by a computerized inter-rogator. General Franks had requested that all materiel entering the centralcommand theater of operation in ocean containers or on aircraft palletshave a robust data tag so that military personnel at any point in the distrib-ution process could read it without having to access a remote database orphysically break into cargo to find out what was “in the box.”
The challenge for the future, says Boyanton, will be providing in-transit visibility “from source to foxhole.” In addition to enabling the cus-tomer and other materiel managers to determine status at any time, themilitary needs to collect consumption data to be recorded in such a waythat it automatically triggers resupply, similar to point-of-sale data collec-tion and inventory/reorder triggers in the consumer products industry. Theabiding question for the DoD FLE plan is: “Where is the end of the sup-ply chain for this purpose?” Each of the military services has somewhatdifferent practices, and situational variables can cause modificationswithin those practices.
Special Partnerships with Commercial TransportPart of Boyanton’s responsibility is the Civil Reserve Air Fleet (CRAF)and the Voluntary Intermodal Sealift Agreement (VISA). Each of theseprograms gives the DoD a contract-based authority to mobilize U.S. flagcivilian air and ocean transportation resources, respectively. The air andocean carriers that make up CRAF and VISA were employed extensively
180 Strategic Supply Chain Management
on a voluntary basis during the operations in Afghanistan and Iraq after9/11. In addition, a portion of CRAF was formally mobilized to supportthe force buildup prior to OIF.
Boyanton describes the contribution of DoD’s commercial transporta-tion partners, including highway, rail, and integrated carriers such as FedExand UPS, as well as ocean and air, as “nothing short of outstanding—we simply can’t do without them.”
However, long-held perspectives here are changing as well. SaysBoyanton, “Part of our job right now is convincing people [in the mili-tary] that they have the transportation options they think they don’thave.” These misunderstandings stem from what has been a kind ofschizophrenia in transportation policy. For example, there’s this pre-sumed “rule” that if you’re a DOD shipper and you’re shipping to a cus-tomer overseas, you need to move your air cargo, the priority stuff thatqualifies for air movement, through DoD’s organic air transport. “Butthat’s contradictory to what we’re doing right now with the supplychain,” says Boyanton. “We’re telling sources of supply to collaboratewith their customers and all prospective fulfillment agents to pick thesupply chain design that adequately fulfills the customer’s requirementsfor time-definite delivery. I’m having to disabuse the notion that cargothat moves by commercial air transport is leakage from the defensetransportation system. Commercial air transport is emphatically a part ofthe DoD’s air transportation capability.”
During peacetime, the DoD maintains its fleet of cargo aircraft—theC17s and the C5s—and aircrews, aerial ports, and a worldwide air mobil-ity infrastructure to respond immediately to the orders of the President andSecretary of Defense. This readiness requires constant international flyingfor training and to exercise the system. Thus international air transportcapacity is created in the process. “We need to carefully rationalize ourdecisions of when we bypass that capacity in favor of another option,”explains Boyanton. “On the other hand, the providers of that capacity,TRANSCOM and the Air Force’s Air Mobility Command, need to offerbest-in-class service and reliability to convince suppliers and customersthat they are a viable supply chain.”
THE CRITICAL ROLE OF PERFORMANCE-BASED AGREEMENTS
What supports the immense number of decisions that have to be made isperformance-based agreements (PBAs). Boyanton’s new policy docu-ments, like Estevez’s, will make one point crystal clear: “The customer and
U.S. DEPARTMENT OF DEFENSE PROFILE: Making the Tail Smaller and the Tooth Stronger 181
the source of supply will design the supply chain for whatever is best forthat customer’s requirement. The decisions will be made by the partici-pants to the agreement.”
Boyanton cites a sterling example of the success of this approach. It’sa weapons system known as JSTARS on a 30-year-old platform called theC135, a Boeing 707-type airplane equipped with this highly sophisticatedradar suite that provides ground-situation information such as movementsof vehicles and helicopters, much as the AWACS provides air-situationinformation. There’s a performance agreement between the integratingcontractor who put the electronics on the plane and the Air Force, as wellas with the OEM who manufactured the electronics.
“When JSTARS deployed for Afghanistan, they had a 100 percentsortie rate,” says Boyanton. “They generated 148 sorties during the com-bat phase of OIF, and all of them launched. A 100 percent launch relia-bility rate is unheard of for such a complex weapon system. Now, whatwas responsible for the success? I believe it was the PBA in addition tosome very dedicated and skilled Air Force people at the far end of thepipe that were saying, ‘We’re going to get this airplane off come hell orhigh water. We’re going to find a way to make sure this mission flies.’”
IN SUMMARY
Although Diane Morales stepped down as deputy under secretary ofdefense for logistics and materiel readiness in January 2004, the life of theFLE likely will be a long one. Its characteristic will be continuous change.How will anyone know whether it has been successful? Morales summedit up for us: “The greater logistics community will be measuring successthrough the balanced scorecard. It balances the risks among operationalrequirements, cost-effectiveness or affordability, and performance by theservice providers.”
Some of the measures of success will be
◆ Increased capability at no transformational cost◆ Increased weapon system operational availability◆ Consistent, reliable, time-definite delivery of support to the
customer◆ Efficient supply chain business operations
The defining change in perspective is the accent on effectivenessover efficiency. As Boyanton puts it, “Effectiveness says we’re going toget the job done because that’s our job. And sometimes it’s going to cost
182 Strategic Supply Chain Management
more than if we did it the most efficient way. To some degree that’s doneto mitigate risk to the supply chain—but we can’t completely eliminaterisk because you never have enough resources to be in a zero-risk game.Our job in logistics is to make as certain as we can that the operator, theshooter, has at his disposal everything he needs. But also, as we imple-ment standard processes—integrate the enterprise—we will achieve effi-ciencies because we’ll all be operating from a common set of businessrules and information at the enterprise level.”
THE MARINES TAKE ON THE FLE
The U.S. Marine Corps, which throughout its history has practicedthe art of doing more with less, is actively engaged in numerouslogistics modernization and transformation initiatives. Focused onproviding more effective support to the war fighter, these effortsrange from improving internal supply chain practices to participat-ing in joint and DoD enterprise logistics improvement initiatives—such as the Force-centric Logistics Enterprise (FLE).
We talked with Susan C. Kinney about the Marines’ logisticaldirection and initiatives. Kinney is deputy director of the logisticsplans, policies, and strategic mobility division, Headquarters, U.S.Marine Corps (HQMC).
“The increasing number of dynamic threats to national securityobjectives dictate a leaner, more focused logistics effort from theMarine Corps, one that replaces footprint with precision and volume(the ‘iron mountain’) with information and speed,” she says. Why?“Because we learned that setting that iron mountain and workingfrom that point were no longer good enough; it’s too difficult to sus-tain the forces from that vantage point today,” she says. “This hasnever been more apparent than in recent conflicts, where Marineshave been forced to maintain supply lines extending 500 or 600miles. If you are going to move that far inland, you have to be lighter.So we’re looking, in our acquisitions programs, to make less of afootprint so that we can become more agile.”
In fact, the Marine Corps is moving toward the concept of sea-basing, replacing those mountains of iron with information and

U.S. DEPARTMENT OF DEFENSE PROFILE: Making the Tail Smaller and the Tooth Stronger 183
speed. Major Ken Lasure explains how the concept worked inAfghanistan: “Due to political considerations, we couldn’t maintaina permanent presence on the beach in Pakistan or operate duringthe daytime. As a result, we had to establish a temporary beachsupport area three to four times a week and shuttle equipment andsupplies from the ships to an airfield in Pakistan at night, and thenwe’d fly it forward. But at the same time, we were muscling throughsome significant communication challenges. More often than not,the only way I could talk to our personnel in Pakistan was when thatLCAC [Landing Craft Air Cushioned—a hovercraft that transportspersonnel, equipment, and supplies ship to shore] went ashore and I was able to grab someone and say, ‘I need you to do this.’Nevertheless, the sea-basing operations enabled us to adjust to theaccess limitations and still move inland 400 to 500 miles—somethingthe Marine Corps really isn’t designed, sourced, or organized to do.”
To make the logistics chain organization operate more responsi-bly end to end, the Marine Corps has now blended the functions ofdistribution, transportation, materiel management, and supply man-agement under one umbrella. It is mapping its logistical and supplychain processes at the enterprise level for the first time in its his-tory. To do this, it has depended on the Supply-Chain OperationsReference-model (SCOR) described in Chapter 2.
Mapping the processes across the enterprise was no easy mat-ter. As Keith Rineaman of the Log[istics] Vision Center explains it, itall starts with the customer, the supported unit—the Marine battal-ion that needs products or services. They go through a processcalled request management, involving the identification of needs;they then pass those demands to a supporting unit, which is theirfirst line of logistics support, their “bellybutton,” as the Marines callthis single point of contact.
A role called order management accepts all those demands fromsupported units and turns them into orders and then manages thoseorders through to fulfillment. The order manager sources orders to aset of functional units or activities within the supporting unit. It couldbe inventory, maintenance, food—or any product or service. Andthey have their own functional management and execution roles and
184 Strategic Supply Chain Management
processes. The processes include activities at the wholesale level,where there are depot operations, and in commercial industrythrough the procurement role.
These processes create an “operational architecture” that isrole-based. After documenting the processes, often it’s necessary to restructure. Thus there’s the need to define new roles and makepolicy changes, doctrinal changes, organizational changes, andinformation technology changes.
Then there’s the special attribute of the Marine Corps: It moves in groups, in what’s called Marine Air Ground Taskforces(MAGTFs). As Kinney explains, “When you go into a situation, yougo with a MAGTF. You don’t go anywhere without the whole group.There is no splitting aviation or logistics off by itself, for instance.”Because of the special role of the logistics element, it has becomea fifth element in the MAGTF, historically comprised of four ele-ments: a command element, a ground combat element, an air combat element, and a combat service support element. The fifthelement is now considered the supporting establishment. A MAGTFcan range from 100 people to a Marine expeditionary force, whichcould be 18,000 strong.
What will be the metrics of success for the FLE program in theMarine Corps? Having just finished its process reengineering, the Corps is now readying to buy empowering applications andother IT, using the enterprise integration toolkit developed throughone of the three “triangle groups” of the FLE. The attributes itexpects all its programs to have are reliability, responsiveness, flexibility, expense containment, and asset utilization. All these areembedded in the SCOR model. However, the Marines have added a sixth attribute: readiness. “It wasn’t in the SCOR model [developedfor industry], but it’s obviously critical to the DoD,” says GavinMcCarthy of the Log Vision Center.
5 C H A P T E R
Core Discipline 5:Use Metrics to DriveBusiness Success
185
Most people agree with the adage, “If you can’t measure it, you can’t fixit.” Yet few metrics programs actually provide a clear picture of overallperformance, pinpoint the root of performance problems, or identifyimprovement opportunities. The reason is simple: Establishing a robust—and useful—performance measurement program is difficult! Just gettingagreement on what to measure, how to define the chosen metrics, and howoften they should be measured can be a major effort. And getting man-agement to agree on the fundamental purpose of a metrics program can bethe most contentious activity of all.
Think about the metrics your company uses to determine its opera-tional health. Like many companies, you may have functionally focusedscorecards for customer service, purchasing, and manufacturing already inplace. Few companies, however, track cross-functional supply chain met-rics, even though actively monitoring these metrics for management pur-poses is a key component of an integrated supply chain organization (seeChapter 3).
Most corporate metrics focus on financial impact and outcomes. Thisisn’t surprising because financial reporting must be done on a regular basis.Financial metrics are also relatively easy to obtain once the books are closedfor any given period. Moreover, regulations such as the Sarbanes-Oxley Act
Copyright © 2005 by The McGraw-Hill Companies, Inc. Click here for terms of use.

186 Strategic Supply Chain Management
of 2002 oblige companies to be thorough about ensuring the validity oftheir financial data and diligent about documenting the controls and proce-dures used to arrive at those numbers. (Sarbanes-Oxley requires that officers of U.S. public companies certify the accuracy of their financialstatements and the effectiveness of the associated disclosure controls andprocedures. As such, it requires that companies establish and actively man-age sound internal controls.)
Indeed, many executives laud the Sarbanes-Oxley Act for enforcinggood business practices and providing external validation for companyinitiatives.1 The strict reporting requirements give managers more and bet-ter information that can make business processes more efficient and cost-effective. Some executives even regard the Sarbanes-Oxley Act as aleverage point in making the case for process improvement.
Yet, while financial metrics can help to gauge the impact of processchanges on a company’s financial health, we think they’re inadequatewhen it comes to measuring supply chain performance. Why? Since mostfinancial measures are historical, they don’t provide a forward-lookingperspective and can be very difficult to tie to operational effectiveness.Nor do they provide insight into strategic nonfinancial performance indi-cators such as order-delivery performance and customer service levels.
What exactly is a metric? The Merriam-Webster Dictionary definesa metric as “a basis or standard of comparison.” Note that by this defini-tion, a stand-alone number or value is not a metric. A number or valueonly becomes a useful management tool when compared with anothernumber or value. This is the premise of an effective performance mea-surement program.
WHY MEASURE?
Is measuring supply chain performance really that important? Absolutely.For starters, the right set of metrics can tell you how well each plan,source, make, deliver, and return supply chain process is performing,highlight where there’s room for improvement, and help you to diagnoseproblems and decide where to focus your improvement efforts. Metricsalso can be a powerful management tool by letting people know what isexpected of them and allowing you to track progress—or lack thereof—over time.
Supply chain metrics can be difficult to define and even more diffi-cult to measure. At the highest level, supply chain operations are expectedto contribute to a company’s financial performance. Supply chain metrics,

CHAPTER 5 Core Discipline 5: Use Metrics to Drive Business Success 187
therefore, have three important objectives. First, they must translate financial objectives and targets into effective measures of operational per-formance. Second, they must do the opposite—translate operational perfor-mance into more accurate predictions of future earnings or sales. Finally,they must drive behavior within the supply chain organization that supportsthe overall business strategy.
Even if you don’t measure nonfinancial metrics on a regular basis,you can be sure that your customers do. For instance, they’ll take intoaccount how good your service was on their last order when decidingwhether to order again. This is just one way that nonfinancial performancemetrics can be leading indicators of future financial performance.
Measurement is the only way to understand whether process per-formance is improving or worsening andwhether action is required. All too oftencompanies learn about performance prob-lems or the failure to meet stated objectivesafter the fact—when revenues fall short oftargets, customers take their business else-where, or margins fall below expectations.
Our research and experience showclearly that companies with good supplychain management skills have higher levelsof process maturity that lead to better supplychain performance overall. They avoid thedifficulties associated with “steering by the rear-view mirror” and can take steps tocorrect problems early—before they becomeoverwhelming.
This chapter will examine the universe of supply chain metrics, theirdefinitions, and the ones that apply to supply chain performance manage-ment. We’ll also provide guidance on how to gain a comprehensive viewof overall supply chain performance and pinpoint opportunities forimprovement.
It’s important to draw the distinction between performance mea-surement and performance management. Performance measurement isabout putting in place the right metrics to assess the health of your sup-ply chain. Performance management uses those metrics to support yourcompany’s strategic objectives. Your metrics program is an effectivemanagement tool if it includes the following three activities on anongoing basis:
Measurement is the only way tounderstand whetherprocess performanceis improving orworsening andwhether action isrequired.

188 Strategic Supply Chain Management
◆ You integrate quantitative targets into plans and budgets. If cut-ting distribution costs is a priority, for instance, budget assump-tions are adjusted to integrate the specific cost-reduction targets.
◆ You establish meaningful targets at the individual and depart-mental levels that link to overall corporate objectives. For exam-ple, if you plan to drive lower delivery costs, a distributioncenter’s targets might aim for a lower percentage of express versus standard deliveries. To track process changes, you mightmeasure the adoption rate of new practices that drive lower pre-mium freight costs, such as adherence to order cutoff times.
◆ You have well-defined mechanisms and processes in place fortracking progress and managing performance. Performance excep-tions are identified easily and drive appropriate actions that involvethe right individuals and organizations in a timely manner.
MANAGING PERFORMANCE WITH METRICS
To make these activities a regular part of your company’s supply chainmanagement process, you’ll first need to define an approach to supplychain performance management. We’ve found that the most effectiveapproaches share these characteristics:
◆ Supply chain metrics are linked to the business strategy.◆ Supply chain metrics are both balanced and comprehensive.◆ Targets are set based on both internal and external benchmarks.◆ Targets are aggressive but achievable.◆ Metrics are highly visible and monitored at all levels of the
company.◆ Supply chain metrics are used as a continuous improvement tool.◆ Metrics are implemented via a formal implementation plan.
Let’s look at each of these characteristics more closely.
Link Your Metrics to Your Business Strategy
Traditional supply chain metrics focus on efficiency and productivity.Improvements in service levels, costs, and inventory levels are the desiredoutcome of an operations strategy and are measured accordingly. A morestrategic perspective looks at these measures as enablers of businessobjectives such as growth within a specific segment or market, accelerated

CHAPTER 5 Core Discipline 5: Use Metrics to Drive Business Success 189
product development, or immediate product availability. When alignedwith key business objectives, the supply chain becomes an added sourceof competitive advantage.
For example, a leading maker of personal computer (PC) peripheralsdeveloped a business strategy focused on low cost, constant innovation,and a make-to-stock approach for fast order fulfillment. Each business unitwas expected to manufacture at the lowest possible unit cost and haveproducts available for shipment within two to three days of receiving a cus-tomer order. Supply chain metrics tracked on a regular basis included prod-uct cost, delivery performance, and fill rate.
To compete based on cost, the company set up plants in locationswith low labor rates and developed long-term contracts with carriers toship the products by sea to local distribution centers. Although most of themanufacturing sites were in Asia, most of the company’s business was inNorth America and Europe, so products took up to five weeks to reach thedistribution centers. This made achieving the strategic objective of fastorder fulfillment a major challenge. Accurate forecasting was critical butextremely difficult in the highly volatile peripherals market. And constantproduct introductions and phase-outs made it even harder.
As a result, the company had to depend increasingly on flexibilitywithin the supply chain. One of the few levers available was shippingproducts by air rather than sea. This nearly tripled transportation costs butwas necessary to maintain customer service levels. The need to reworkproducts to better align them with current demand when they arrived at thelocal distribution centers also boosted costs.
The product managers didn’t see these added costs as an issue: Thetransportation and rework costs appeared as expenses charged to the oper-ations function. As such, they did not affect the product-cost metric.
Of course, the total cost of managing the supply chain increasedsignificantly because of these unplanned expenses. To address this prob-lem, the management team began measuring total supply chain manage-ment costs on a quarterly basis (see Figure 5-1). The team also examinedhow the supply chain strategy affected costs related to order manage-ment, materials acquisition, inventory carrying, and planning—not justthe cost of goods sold.
The management team worked closely with each product group tocommunicate the importance of total supply chain management cost.Product costs were still measured regularly, but the entire company wasasked to focus on the new total-cost metric. As a result, product managerssaw for the first time the huge expense associated with expediting shipments

190 Strategic Supply Chain Management
F I G U R E 5–1
Components of total supply chain management cost.
OrderManagement
MaterialsAcquisition
InventoryCarrying
Finance andPlanning
ManagementInformationSystems (MIS)
• New product release, phase-in, and maintenance• Customer order creation• Order entry and maintenance• Contract/program and channel management• Installation planning• Order fulfillment• Distribution Transportation, outbound freight, and duties• Installation• Customer invoicing/accounting
• Materials/commodity management and planning• Supplier quality engineering• Inbound freight and duties• Receiving and materials storage• Incoming inspection• Materials process and component engineering• Tooling
• Opportunity cost• Shrinkage• Insurance and taxes• Total inventory obsolescence–raw materials, WIP, and finished goods• Channel obsolescence• Field service parts obsolescence
• Supply chain finance costs• Demand/supply planning costs
• Plan – Product management – Finished goods demand/supply planning• Source – Sourcing/materials acquisition• Make – Manufacturing planning and execution• Deliver – Order management – Logistics and distribution – Channel management – Field service/support
Total Supply Chain Management Cost
Source: The Performance Measurement Group, LLC—definitions used in benchmarking studies

CHAPTER 5 Core Discipline 5: Use Metrics to Drive Business Success 191
because of forecast inaccuracies. This was the catalyst needed to move forward with a major initiative to improve the forecasting process, whichgreatly improved forecast accuracy—and reduced reliance on supply chainexecution to make up for planning errors.
This example is not unusual. Measuring operational metrics in isola-tion is a common—and often counterproductive—way to use performance-related data. A more effective approach is to start with your company’sstrategic goals and work backward to identify the supply chain perfor-mance metrics that support those goals.
Make Sure Your Metrics Are Balanced and Comprehensive
The goal of performance management is to drive desired behaviors—notacross-the-board excellence. This may sound obvious, but many compa-nies have a hard time agreeing on where performance excellence is criti-cal and where it’s merely “nice to have.”
Consider the classic triangular balance of customer service, cost, andquality. Which is most important? Least important? The natural tendencyis to say that all are equally important andthat inferior performance in any of the threeareas is not an option. Excellent customerservice costs money. So does superior qual-ity. And cost cutting usually means shavingdollars allocated to improving product qual-ity or service excellence. This is the classicdilemma of managing supply chain perfor-mance. If you want to pursue balancedobjectives, you need to cover multiple per-formance perspectives and then select yourmetrics accordingly. An effective metricsprogram must include a balance of
◆ Internally focused and customer-facing metrics◆ Financial and nonfinancial metrics◆ Functional and cross-functional metrics◆ Metrics designed to measure innovation and continuous
improvement
In the chapter on strategy (Discipline 1) we talked about the need toconstantly look for ways to improve and differentiate your supply chainperformance. Once you have decided on the appropriate path forward, the
If you want to pursuebalanced objectives,you need to covermultiple performanceperspectives andthen select yourmetrics accordingly.
192 Strategic Supply Chain Management
next step is to decide how you’ll know if you’re meeting your objectives.This assessment forms the basis of your performance-managementapproach. A necessary step in this process is determining where averageperformance is acceptable and where superior performance is a must.
For the computer peripherals company discussed earlier, theobjective of reducing total supply chain management cost may result ina supply chain configuration that forces a trade-off between low prod-uct costs and high fill rates. Achieving best-in-class performance forboth is unlikely because each requires a different focus and configura-tion. The company must choose among higher transportation costs for specific products, higher finished goods inventory levels, or slowerorder fulfillment.
We worked with a large telecommunications company whose firstattempt to develop a comprehensive set of metrics resulted in the selec-tion of 21 key performance indicators. The management team had spenta lot of time winning commitment to the program, making the metricshighly visible, and even modifying individual performance objectives tosupport the chosen targets. Then the team realized that not one metricfocused on the customer. Instead, the program focused on such metrics asmarket penetration, inventory levels, and cost data. In the end, the teamkept the 21 performance indicators they’d worked so hard to develop butadded a set of metrics focused on customer satisfaction, with an empha-sis on delivery performance.
As you begin to structure your performance-management program,consider including metrics that align with the four dimensions of the well-known balanced scorecard approach:2
◆ The financial dimension includes metrics such as cost of goodssold, labor rates, transportation cost per mile, value-added pro-ductivity, and asset turns. As we noted earlier, financial metricsare relatively easy to measure but don’t provide a complete picture of how well your supply chain is performing.
◆ The internal dimension includes metrics such as forecast accu-racy, production quality, production flexibility, and internal cycletimes. These metrics assess operational performance but are nottied to specific financial results.
◆ The customer dimension includes metrics such as on-time deliveryto commitment, order-fulfillment cycle time, fill rates, and perfectorder fulfillment. Customer-oriented metrics are designed to showhow your company performs from the customer’s perspective.

CHAPTER 5 Core Discipline 5: Use Metrics to Drive Business Success 193
◆ The innovation and learning dimension is the most difficult todefine because metrics in this area quantify your company’s effec-tiveness at learning new skills. Setting goals for employees whoare APICS-certified or have completed Six Sigma training is anexcellent way to establish meaningful metrics for this dimension.
How often should metrics be monitored? This depends on the lifecycle or clock speed of your business, but monthly reporting is fine formost top-level metrics. This usually allows you to spot trends before theybecome problems and avoids overreporting with little value. Detailedoperational metrics should be monitored and reported at least weekly, ifnot daily. Often these are key customer-facing metrics such as fill rate ordelivery-to-commit performance.
While invoiced costs, such as warehousing and transportation, shouldbe tracked on a monthly basis, costs related to internal headcount should bereexamined during the budgeting cycle, the frequency of which may varyfrom one company to another but typically is on an annual cycle. Despitemaking large investments in supply chain planning tools, most companiestrack inventory and delivery performance only on a monthly basis. Thesemetrics should be tracked at least weekly—if not daily—to ensure excellentcustomer service.
Creating the capability to use existing metrics more effectively alsocan be an important lever in gaining organizational support. Increasing thefrequency with which you monitor an existing metric is an excellent way toleverage already available infrastructure while improving its effectiveness.
Base Performance Targets on Both Internal and External Metrics
Benchmarking—both internal and external—can provide valuable datafor improving supply chain performance and has two main benefits. First,external comparisons place your performance in an industry context,which helps to identify supply chain improvement opportunities. And sec-ond, internal benchmarking helps you to identify which of your businessunits, regions, or locations are the best performers. Then you can pinpointthe underlying practices that make the difference and adopt those prac-tices across the company.
Companies typically use external benchmarking to study businesspractices of industry competitors as a basis for improving their own performance. Benchmarking is not just the study of another company’s per-formance levels—it’s about the practices that lead to those performance

194 Strategic Supply Chain Management
levels. An effective benchmarking effort will help you to understandwhat level of quantitative performance is possible and, more impor-tantly, what practices can deliver this level of performance.
Besides external competitors, we believe that companies shouldstudy noncompetitors in other industries—provided that they have similarsupply chain characteristics. Why look outside your own industry?Because often what works in one industry can be applied successfully toanother. But be careful which companies you compare yourself against.You should compare yourself to peers—companies with similar productionprocesses, distribution channels, or other dynamics that allow a valid com-parison. Otherwise, it’s less likely you’ll be able to set realistic targets.
External benchmarking requires collecting performance data—oftenhighly sensitive data—from other companies. Many companies are reluc-tant to provide such data directly to competitors or even to noncompeti-tors. To get around this roadblock, consider participating in benchmarkingsurveys managed by independent third parties. These benchmarking ser-vice providers specialize in defining relevant supply chain metrics andworking with participating companies to ensure that the data collected areunambiguous and accurate. When choosing a service provider, look forone that offers a thorough assessment of the supply chain practices asso-ciated with best-in-class performance. This link between practice and per-formance is the key to understanding how to change your supply chain toreach new performance levels.
Many companies make the mistake of thinking that participating in abenchmarking survey is the same as conducting a benchmarking assess-ment, or they want to have access to a supply chain database without anyplans to participate in a survey. As Michelle Roloff, general manager ofPRTM’s benchmarking subsidiary, The Performance Measurement Group,LLC, notes, “The benchmarks are only as good as the data the organiza-tions submit. We want survey responses from companies that are usingbenchmarking to change how they do business. This means they’re willingto invest the time needed to collect accurate information from a variety of sources.”
An external benchmark is only useful if a company knows how itsown organization is performing in the same area. An effective bench-marking program starts with a thorough understanding of your ownprocesses and level of performance. This means generating a comprehen-sive set of internal metrics.
Internal benchmarking doesn’t depend on sensitive data from othercompanies. Instead, it involves measuring the performance of comparable

CHAPTER 5 Core Discipline 5: Use Metrics to Drive Business Success 195
functional areas, processes, and facilities within your company using con-sistent definitions. For instance, you might compare the performance lev-els of a set of manufacturing facilities, warehouses, distribution centers,purchasing organizations, or order-management groups. In an internalbenchmarking program, best-in-class functions are identified, and theirbenchmark metrics become the basis of performance targets for similarfunctions within the company.
Although internal benchmarking can be easier than collecting exter-nal data from competitors, most large companies are extremely complex,with multiple regions and business units. If your company does not havecommon processes, information systems, and underlying data across busi-ness units, internal benchmarking can be a major undertaking. Even so,it’s the right place to start.
Once you’ve agreed on what to measure and how to define the met-rics, collecting internal benchmarking data is relatively simple. Since inter-nal organizations operate within the same corporate structure, there’susually minimal controversy about whether or not the basis of comparisonis relevant. You should monitor your internal benchmarking effort closely—on rare occasions, internal benchmarking can result in unproductive com-petition among business units or divisions. In extreme cases, business unitsmay try to “game the system” to deliver winning results. If you see this, youwill need to take immediate action to reset behavior.
Once you’ve generated your internal metrics and collected relevantbenchmarking data, the next step is external benchmarking—comparingyour company’s performance against that of other companies. You maychoose to limit your comparison to companies within your own industry orextend your comparison to companies in other industries. Some benchmark-ing services offer custom comparison populations, where you can select aspecific set of companies that share similar business characteristics, such asproduct complexity, geographic distribution, or manufacturing strategy.
Analyze the performance gaps between your company and yourcomparison group. Pay special attention to strategically critical areas thathave subpar performance. Follow this gap analysis by investigating thecauses of any performance issues and assessing the business practicechanges that will be necessary to close the gaps. To do this effectively,make sure to benchmark both qualitative and quantitative data. Qualitativedata include an assessment of the business practices that the comparisonpopulation uses to run its businesses.
External benchmarking can be a very powerful tool when makingthe business case for supply chain transformation because an external

196 Strategic Supply Chain Management
view often is needed to justify making major internal changes. To mini-mize potential skepticism about the relevance of the comparison popula-tion, you’ll need to do a thorough analysis to ensure that the externalbenchmarks are meaningful. Your benchmarking service provider can helpyou to choose a relevant population, especially if you’re looking beyondyour own industry.
BASF Corporation used a combination of internal and externalbenchmarking to drive process improvements throughout its operations.The BASF Group, headquartered in Ludwigshafen, Germany, is one of theworld leaders in the chemical industry, with more than 160 subsidiariesand affiliates. In 2003, its North American Free Trade Agreement(NAFTA) operations in the United States, Canada, and Mexico set up atask force to assess the core supply chain operations of its 13 businessunits, identify any performance gaps, and develop a plan to close thosegaps. The task force planned to use both internal and external benchmarksto compare the performance of each business unit against other BASFbusinesses and a customized external population.
At first, the business unit leaders were somewhat skeptical about theproposed approach and expressed concern that the benchmarks wouldn’tprovide a meaningful comparison. As Mary Scheibner, the NAFTA direc-tor of supply chain consulting, explains, “Each of the business units isunique. Each produces different products through different manufacturingprocesses and sells to different customers. So we needed each businessunit to feel confident that the population to which they were being com-pared was appropriate.”
To address this concern, BASF used a “bundling” approach to createmeaningful comparison populations. The 13 business units were groupedinto two high-level categories based on their primary manufacturingprocess—continuous or batch (see Figure 5-2). Then each unit completed aPMG supply chain scorecard (see generic scorecard shown in Figure 5-3).Similar external companies were chosen to create a comparable benchmarkpopulation for each of the two bundles. The performance of each businessunit was compared against two groups—the BASF units with the samemanufacturing process and the population of similar external companies.
Each business unit got a report comparing its performance with thatof the two different comparison groups. The results were used to set per-formance-improvement targets. Scheibner worked closely with seniormanagement to establish aggressive but reasonable targets for each unit.“This was a huge effort, so we needed to come up with a fairly simpleapproach,” she notes. “We looked at each business unit’s percentile-based

CHAPTER 5 Core Discipline 5: Use Metrics to Drive Business Success 197
performance compared with the benchmarking population and set a targetof 25 percent improvement.” For example, if a unit ranked in the 50th per-centile for inventory performance, the target was to achieve a performancelevel consistent with the 75th percentile. Business units that were alreadyat the 75th percentile level or higher for a given metric were off the hook.
This top-down approach provided a relatively straightforward way toset stretch targets. Notes Dave McGregor, BASF’s senior vice president oflogistics, “Historically, business units have taken a bottom-up approach toincrementally improving productivity. The benchmarking data are allow-ing us to link theoretical opportunities with proven supply chain practicesto achieve breakthrough performance.”3
Set Aggressive but Achievable Targets—and Tie Them to Actions
If you plan to use metrics to determine how your supply chain is performing,you must set a target for each metric. Only a target gives you a basis fortracking whether performance is improving, holding steady, or getting worse.
Don’t aim to be best at everything—no company can excel at everykey metric. Unattainable goals are more likely to result in behaviors that dis-rupt rather than enhance a company’s performance. Instead, start by agree-ing on your overall strategic objectives, and acknowledge that previoustargets may not align with those objectives.
F I G U R E 5–2
BASF benchmarking population.
BASFBusiness
Unit 1
BASFBusiness
Unit 2
BASFBusiness
Unit 3BASF
BusinessUnit 4
BASFBusiness
Unit 5
BASFBusiness
Unit 6
BASFBusiness
Unit 7
BASFBusiness
Unit 8BASF
BusinessUnit 9
BASFBusinessUnit 10
BASFBusinessUnit 11
BASFBusinessUnit 12
BASFBusinessUnit 13
ComparisonCompany A
ComparisonCompany B
ComparisonCompany C
ComparisonCompany D
ComparisonCompany E
ComparisonCompany F
ComparisonCompany G
ComparisonCompany H
ComparisonCompany I
ComparisonCompany J
Continuous ManufacturingPopulation
Batch ManufacturingPopulation
Bat
chM
anuf
actu
ring
Bun
dle
Con
tinuo
us
Man
ufac
turin
g B
undl
e

198 Strategic Supply Chain Management
We noted earlier that a balanced set of metrics is critical to an effec-tive performance-management program. The same is true for performancetargets. While optimizing supply chain performance isn’t a zero-sumgame—a performance improvement in one area doesn’t have to be at theexpense of another—it’s true that to reach a target in one big area, youmight have to accept a lower metric in another.
It’s also true that you can improve the performance of numerousparts without improving the performance of the whole—an idea that canbe hard for companies to grasp. Sometimes compromises at the functional
F I G U R E 5–3
Typical supply chain scorecard.
Performance Versus Comparison Population
KeyPerspectives
Customer-FacingMetrics
Internal-FacingMetrics
0–20%Major
Opportunity20–40%
Disadvantage40–60%Median
82.1%
91.1%
7.9
49.0
10.3%
0.9%
64.2
76.3
2.0
60–80%Advantage
60–100%Best-in-Class
97.3% x
99.2%
2.4
5.5
4.7%
0.2%
23.6
22.3
9.1
YourOrg.
96.3%
92.8%
11.0
25.0
6.9%
66.6%
39.0
43.6
5.9
Metric
On-Time Deliveryto Request %
On-Time Deliveryto Commit %
Order FulfillmentLead Time(OFLT): PrimaryManufacturingStrategy (days)
Upside ProductionFlexibility: PrincipalConstraint (days)
Total Supply ChainManagement Costs(% of revenue)
Total ReturnsProcessing Costs(% of revenue)
Inventory Daysof Supply
Cash-to-CashCycle Time (days)
Net AssetTurns
© Copyright 2004 The Performance Measurement Group, LLC
Your Organization
CHAPTER 5 Core Discipline 5: Use Metrics to Drive Business Success 199
level are needed to improve overall performance, but this can be a bitterpill to swallow for managers of those functions: It may appear that theirown performance is declining.
There are many ways to set performance targets. Perhaps the sim-plest is to develop specific percentage-improvement goals based on his-torical and baseline performance. With this method, you simply measureperformance in a specific area over a specified time period, determine thebaseline, and set a target for improvement. But be sure to link the target toa specific change in strategy or execution. Too often targets are based onthe assumption that because a certain level of performance is possible—as indicated by benchmarking data—it is a logical, attainable goal.
For example, a telecommunications equipment company was dissat-isfied with the service its key suppliers were providing and embarked ona program to improve supplier on-time delivery. The company measuredthe performance of 25 key suppliers over a three-month period and foundthat on-time delivery ranged from 70 to 80 percent. It then set an objec-tive of achieving average on-time delivery of 95 percent for these key sup-pliers within six months.
After six months, supplier performance hadn’t improved noticeably.The manager of the procurement group explained that the 95 percent targetwasn’t tied to any specific program. The company had just assumed thatimproving performance by about 5 percent per month was a reasonablegoal. Later, after benchmarking delivery performance within the telecomindustry, the company found that the top performers were achieving sup-plier delivery performance of only 87 percent. Using these data, the com-pany set a long-term goal of 95 percent but also set interim targets tied tospecific practices shown to be lacking by the benchmarking program. Theseincluded the use of joint service agreements, increased use of electronicdata interchange (EDI), and upgraded supplier certification programs.
We advocate setting “stretch” targets, but we also caution againstsetting unrealistic goals, which can hurt morale and breed cynicism. Thebest approach is to combine historical analysis and baselining with inter-nal and external benchmarking and—in some cases—an assessment ofwhat is realistic given specific business conditions and planned processimprovements.
Make Your Metrics Highly Visible and Monitor Them at All Levels
You’ve probably experienced a performance-management program thatgot off to a great start and then failed. In our experience, the most com-mon reason for failure is a lack of attention paid to the program once it’s
200 Strategic Supply Chain Management
off and running. Consistent measuring and reporting will help you toavoid this problem.
One of the most successful metrics programs we’ve seen was put inplace by the supplier of software tools and related hardware we first dis-cussed in Chapter 3. The company’s customers were very unhappy withhow long it took to get their orders. Order fulfillment averaged 25 days,whereas 2 to 3 days was a reasonable expectation; the sales force citedlong order-fulfillment cycles as the primary cause of the company’sinability to meet its growth objectives. A supply chain analysis revealedthe source of the company’s slowness—too many functional handoffsthroughout the order-fulfillment process. As a software provider, the com-pany didn’t have to deal with most traditional manufacturing issues, suchas supplier performance and manufacturing cycle times. Instead, process-ing customer orders, getting them through the contract negotiation cycle,and packing them for delivery were the major issues.
To improve supply chain performance, the company set targets foreach functional area involved in order fulfillment. Then, in an effort tobreak down functional barriers, it set up a highly visible system for track-ing order-fulfillment cycle time overall. Convinced that e-mail updates orWeb site postings would lack the necessary impact, the chief financialofficer (CFO) placed huge scoreboards in high-visibility areas—near theexecutive offices, in the local sales office, and in the shipping area—andmanually updated the cycle-time scores each week. Since the cycle-timemetric was made up of data from every function involved in order fulfill-ment, many people were involved in data collecting and were well awareof the progress toward the goal of four days or less.
In an unexpected twist, the strategy of high-visibility tracking nearlyderailed the project at the beginning. The metrics allowed the project teamto look at each activity in the order-fulfillment process, eliminate thosewhich didn’t add value, and create a new process designed to do awaywith many of the handoffs between functions. The heightened scrutiny ofpeople and the added burden of manually tracking each exception andcause of delay actually slowed the process down, and at first, cycle timeincreased from the historical average of 25 days.
After the first several weeks of posted results, many project teammembers feared that the initiative would fail. “It’s going the wrong way,”was a frequent comment. Despite concerns that the highly visible datawould discourage people and make them resistant to change, the CFOinsisted on continuing to update the scoreboards. Each board showed boththe order-fulfillment cycle time and a rolling average of the most recent
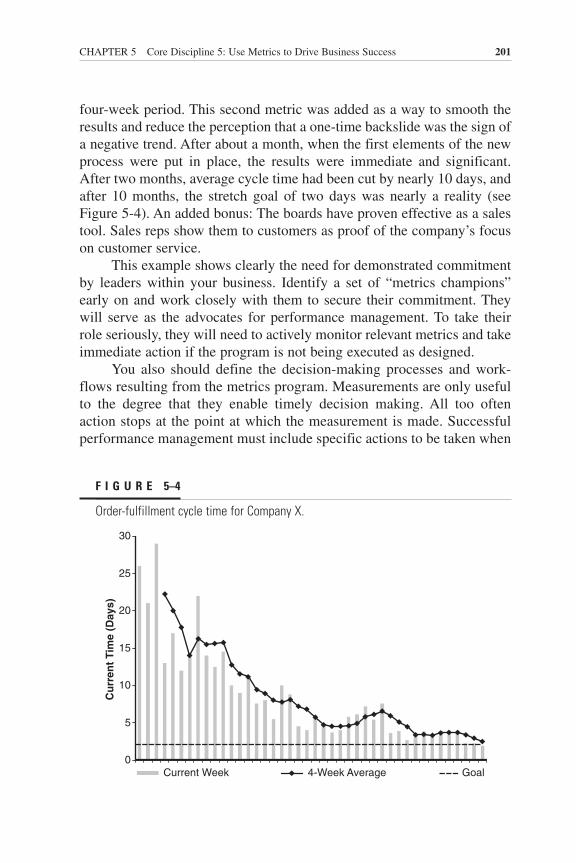
CHAPTER 5 Core Discipline 5: Use Metrics to Drive Business Success 201
four-week period. This second metric was added as a way to smooth theresults and reduce the perception that a one-time backslide was the sign ofa negative trend. After about a month, when the first elements of the newprocess were put in place, the results were immediate and significant.After two months, average cycle time had been cut by nearly 10 days, andafter 10 months, the stretch goal of two days was nearly a reality (seeFigure 5-4). An added bonus: The boards have proven effective as a salestool. Sales reps show them to customers as proof of the company’s focuson customer service.
This example shows clearly the need for demonstrated commitmentby leaders within your business. Identify a set of “metrics champions”early on and work closely with them to secure their commitment. Theywill serve as the advocates for performance management. To take theirrole seriously, they will need to actively monitor relevant metrics and takeimmediate action if the program is not being executed as designed.
You also should define the decision-making processes and work-flows resulting from the metrics program. Measurements are only usefulto the degree that they enable timely decision making. All too oftenaction stops at the point at which the measurement is made. Successfulperformance management must include specific actions to be taken when
F I G U R E 5–4
Order-fulfillment cycle time for Company X.
Cu
rren
t Ti
me
(Day
s)
0
5
10
15
20
25
30
Current Week 4-Week Average Goal

202 Strategic Supply Chain Management
a measurement falls outside a defined toler-ance level. Processes and workflows shouldshow which decisions are to be made, bywhom, and within which limits.
Use Your Metrics to Drive ContinuousImprovement
Gathering comprehensive benchmarkingdata takes time and effort. And since most
benchmarking services charge a fee for participation and database access,there’s usually an out-of-pocket cost as well. Logic would say that anycompany willing to make this sort of investment would highly value theresulting information and make every effort to leverage it. Yet, a recentsurvey of hundreds of companies found that few had used their supply-chain metrics to drive strategic management practices, and most had failedto realize a full return on investment from their benchmarking efforts.4
This is true of many companies. Too often they review the benchmarkinginformation but don’t use it to move the company forward. Over time, thedata-collection effort no longer may seem worth the benefits achieved.
Develop an Implementation Plan
There are four major steps to putting a performance-management programin place:
1. Set supply chain strategy objectives. Start with your company’sbusiness strategy, and then develop supply chain objectives thatsupport this strategy.
2. Choose supporting metrics and targets. Identify the specificmetrics and targets that you’ll use to track progress toward yoursupply chain objectives.
3. Identify supporting initiatives. Develop performance-improvementprograms to help meet the supply chain objectives.
4. Implement the programs. Collect data and develop tools forreviewing the data and to support decision making.
Set Supply Chain Strategy ObjectivesCreate supply chain objectives and priorities that support your company’sbusiness strategy. Although senior management may agree with the supply
Measurements areonly useful to thedegree that theyenable timelydecision making.

CHAPTER 5 Core Discipline 5: Use Metrics to Drive Business Success 203
chain strategy overall, opinions may vary as to which supply chain perfor-mance criteria are most important. This is where a standard framework forperformance management, such as the Supply-Chain Operations Reference-model (SCOR), can come in handy.
If necessary, interview senior managers or conduct workshops to validate the supply chain priorities. Articulate the key objectives expressedduring these sessions and then validate them with the entire managementteam and with other stakeholders inside and outside your own organization.
Choose Supporting Measures and TargetsOnce you’ve agreed on the key objectives of your supply chain strategy,choose the metrics you’ll use to gauge progress toward those objectives.The best place to start is with an assessment of current performance lev-els. Then use a tool such as PMG’s supply chain performance scorecardto define a list of metrics and ensure consistency. Group the metricsaccording to which aspect of the business strategy they support. Use thestandard definitions to determine the baseline performance level and inter-nal and/or external benchmarking to set near- and long-term targets. Asmentioned earlier, choose aggressive but achievable targets.
Start with a few metrics and insist on widespread use before addingadditional metrics. Metrics to consider as a starting point include SCORlevel 1 metrics, such as inventory days of supply, delivery performance,order-fulfillment lead time, and cash-to-cash cycle time.
Identify Supporting InitiativesStart by looking at all existing initiatives, their expected impact, and howwell they’re aligned with the objectives of your supply chain strategy.Eliminate any initiatives that are redundant or misaligned, identify gapsthat might prevent achieving the stated objectives, and develop programs toaddress those gaps. Then update your performance targets, tying targetedimprovements to specific activities to clearly show the cause and effect.Getting management support for these improvement programs is critical.
Implement the ProgramsAlmost every performance-improvement program will require systems sup-port. You may choose to design and build an in-house system or buy a datawarehouse, an enterprise resources planning (ERP) module, or a stand-alonesolution that offloads data from your ERP system. Knowing the specific datasources is critical when choosing the right system tool. So is understandinghow your performance-management approach will link to other efforts and
204 Strategic Supply Chain Management
metrics used in other core functions. Never develop a performance-manage-ment system in a vacuum.
Understand and respect your organization’s capabilities, and strike abalance on business criticality when introducing new measurement require-ments. Products and geographic regions can be brought online progres-sively. A metrics program does not have to be initiated simultaneously forall regions, channels, and products.
Establishing the measurement frequency up front can help to avoidcostly reimplementation of data structures. This does not preclude provid-ing reporting on a less frequent basis, a tactic that may be useful if the orga-nization is not ready to exploit more real-time information. Focus on fast“clock speed” metrics on a daily or weekly basis and report the remainderas part of your balanced scorecard. Also determine the appropriate level ofvisibility. The goal should be visibility all along the supply chain, includ-ing a sufficient amount of drill-down capability to understand performancedifferences by, for example, originating factory and warehouse.
Identify all required data sources, and make the data accessible. Forexample, if you choose to monitor the percentage of orders delivered ontime to the customer’s request, you will need the ability to capture the cus-tomer request date. Some transactional systems do not have a field for thisinformation, and many systems, while capable of tracking this date, arenot programmed to do so.
A gap analysis of data elements and data sources is a vital first stepto ensure that existing data are accessible to decision makers. If you arelike many companies, you may have large amounts of data buried withinmultiple, disparate systems. An information systems architecture for bothapplications and infrastructure is needed to pull data from differentsources and enable timely decision making. To simplify both data gather-ing and reporting, design the data-capture and reporting infrastructureusing standard data and metric definitions.
Take the time to understand the performance-management softwaremarket. It is made up of many discrete tools and components, enterprisesuites, and packaged applications, including such categories as reporting,business intelligence, advanced planning and scheduling (APS) analytics,supply chain event management, and supply chain performance manage-ment. As you evaluate the system tools available, resist the temptation tocreate an all-encompassing data warehouse to enable “slicing and dicing”for root-cause analysis and resolution. Integrating extensive sets of lower-tier metrics can lead to an overly complex implementation and should notbe seen as a prerequisite for an effective metrics program.

CHAPTER 5 Core Discipline 5: Use Metrics to Drive Business Success 205
The remainder of this chapter provides guidance on how to choose theright metrics and build an infrastructure that supports ongoing measurement.
WHICH METRICS?
When faced with a universe of metrics, companies tend to choose morethan they actually need. This is especially true when one or two key met-rics are first put in place—providing visibility into operational capabilitiesand results for the first time. For companies used to backward-lookingmetrics and rear-view-mirror steering, data that can offer insight intocause and effect of key supply chain processes are extremely powerful.The natural inclination is to want such data for all processes.
As an example, let’s look at order-fulfillment cycle time. The macro-level metric used by most companies measures the elapsed time betweenwhen a customer order is entered and when the associated product is shipped.Orders go through numerous “gates”—an order may be received, verified,entered, priced, credit-checked, released, picked, packed, and shipped—andit is possible to measure the elapsed time between each gate and the next.From the customer’s perspective, though, the clock starts when he or sheissues the order and stops when the product isreceived; customers are not particularly inter-ested in the interim stops the order may takealong the way. Because of this, it probablydoesn’t make sense to measure each gate-to-gate cycle. Instead, choose larger “processsets,” such as the time between order receiptand order release. And if the results indicate aperformance issue, consider adding additionalgranularity at that point.
You also should avoid using a prede-fined set of metrics designated as being“right” for your business. No predeterminedset of metrics is appropriate for all busi-nesses. Earlier in this chapter we discussedthe need to align metrics with strategic objec-tives. Since a supply chain strategy is basedon a company’s overall strategic directionand core competencies, you’ll need to care-fully choose the metrics that make sense assignals of performance to your objectives.
Since a supply chainstrategy is based ona company’s overallstrategic directionand corecompetencies, you’llneed to choosecarefully the metricsthat make sense assignals ofperformance to yourobjectives.
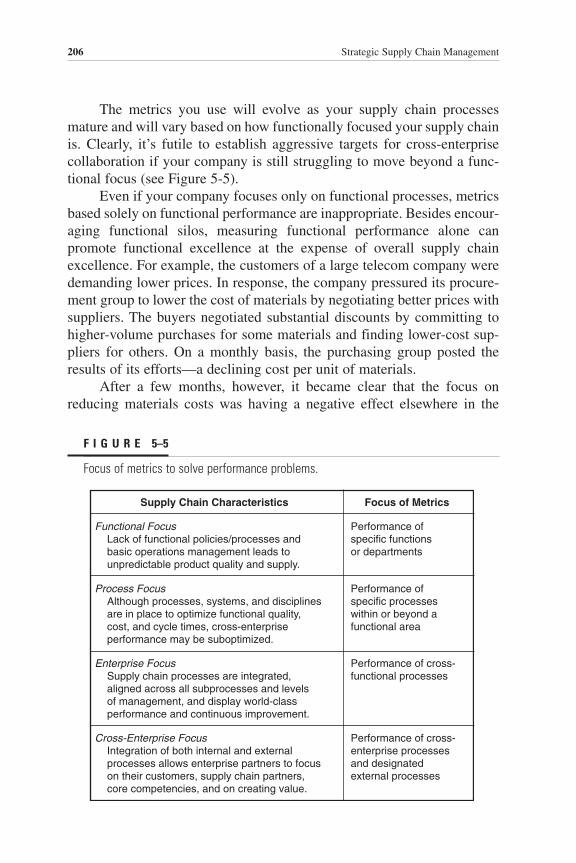
206 Strategic Supply Chain Management
The metrics you use will evolve as your supply chain processesmature and will vary based on how functionally focused your supply chainis. Clearly, it’s futile to establish aggressive targets for cross-enterprisecollaboration if your company is still struggling to move beyond a func-tional focus (see Figure 5-5).
Even if your company focuses only on functional processes, metricsbased solely on functional performance are inappropriate. Besides encour-aging functional silos, measuring functional performance alone can promote functional excellence at the expense of overall supply chainexcellence. For example, the customers of a large telecom company weredemanding lower prices. In response, the company pressured its procure-ment group to lower the cost of materials by negotiating better prices withsuppliers. The buyers negotiated substantial discounts by committing tohigher-volume purchases for some materials and finding lower-cost sup-pliers for others. On a monthly basis, the purchasing group posted theresults of its efforts—a declining cost per unit of materials.
After a few months, however, it became clear that the focus onreducing materials costs was having a negative effect elsewhere in the
F I G U R E 5–5
Focus of metrics to solve performance problems.
Supply Chain Characteristics
Functional Focus Lack of functional policies/processes and basic operations management leads to unpredictable product quality and supply.
Process Focus Although processes, systems, and disciplines are in place to optimize functional quality, cost, and cycle times, cross-enterprise performance may be suboptimized.
Enterprise Focus Supply chain processes are integrated, aligned across all subprocesses and levels of management, and display world-class performance and continuous improvement.
Cross-Enterprise Focus Integration of both internal and external processes allows enterprise partners to focus on their customers, supply chain partners, core competencies, and on creating value.
Focus of Metrics
Performance ofspecific functionsor departments
Performance ofspecific processeswithin or beyond afunctional area
Performance of cross-functional processes
Performance of cross-enterprise processesand designatedexternal processes

CHAPTER 5 Core Discipline 5: Use Metrics to Drive Business Success 207
business. Buying in volume caused inventory levels to increase. And man-ufacturing yields were dropping—a problem traced back to lower-qualitymaterials purchased from the low-cost suppliers.
The moral of this story is clear: Exclusive use of functional metricscan drive unwanted behaviors and interfere with overall strategy execu-tion. Functional metrics aren’t bad in and of themselves, but they can hurtoverall performance if not combined with cross-functional measurementsthat enhance the end-to-end supply chain.
Choose Metrics That Support Your Strategy
In Chapter 2, we discussed the importance of organizing around cross-functional processes and breaking down functional silos to support theend-to-end supply chain. Your metrics program must do the same—breakdown the barriers and handoffs between functions by using cross-func-tional and process-based performance measures to supplement functionalmetrics. Functional metrics then become useful tools for diagnosing thecauses of performance problems.
The first step in choosing the right metrics is to assess your com-pany’s supply chain maturity. The next step is to review your overallstrategic objectives and any plans you have to move to the next stage ofmaturity—cross-process excellence, for instance, or cross-companyexcellence. Then you can begin to structure a balanced set of supportingmetrics, including top-level metrics that evaluate whether or not your sup-ply chain is supporting your company’s overall strategy.
Our design of the SCOR model was influenced heavily by our workwith hundreds of companies in establishing appropriate approaches tosupply chain performance management as part of operations strategy andperformance-improvement programs. This work allowed us to establishone of the world’s most comprehensive databases of supply chain metricsand associated best practices, which, in turn, became the foundation forPMG’s supply chain management database. These metrics and practicesare embedded in the SCOR model and are leveraged widely by all indus-tries today.
PMG’s Supply Chain Management Benchmarking Study, an ongoingsurvey of supply chain practices and performance, is based on the samework that led to creation of the SCOR model and uses the same hierarchi-cal construct. At the highest level, the SCOR model provides quantitativemeasures of performance under 5 key attributes and 13 specific measures.5
SCOR level 1 metrics typically are associated with executive-level concern(see Figure 5-6).

208 Strategic Supply Chain Management
Note that the SCOR level 1 metrics include both internally focusedmeasures (total supply chain management cost, value-added productivity,warranty/returns processing cost, cash-to-cash cycle time, inventory daysof supply, and asset turns) and customer-facing metrics (delivery perfor-mance, fill rate, perfect order fulfillment, order-fulfillment lead time,supply chain response time, and production flexibility).
SCOR level 1 metrics are designed to provide a view of overallsupply chain effectiveness. Explains Michelle Roloff, “While it is virtu-ally impossible for one company to perform at a best-in-class level for
F I G U R E 5–6
Performance attributes and associated level 1 metrics, SCOR, version 6.0.
PerformanceAttribute
DeliveryReliability
Responsiveness
Flexibility
Cost
AssetManagement
Performance AttributeDefinition
Supply chain performancein delivering:• the correct product• to the correct place and the correct customer• at the correct time• in perfect condition and packaging• in the correct quantity• with the correct documentation
How quickly a supply chaindelivers products to thecustomer
How quickly a supply chainresponds to marketplacechanges; agility in gainingor maintaining acompetitive edge
The costs associated withoperating the supply chain
How effectively a companymanages assets to satisfydemand. Includes fixed assetsand working capital.
SCOR Level 1Metric
• Delivery performance• Fill rate• Perfect order fulfillment
• Order fulfillment lead time
• Supply chain response time• Production flexibility
• Cost of goods sold• Total supply chain management cost• Value-added productivity• Warranty/returns processing cost
• Cash-to-cash cycle time• Inventory days of supply• Asset turns

CHAPTER 5 Core Discipline 5: Use Metrics to Drive Business Success 209
each of the level 1 metrics, strong performance in targeted areas is areflection of overall supply chain health and therefore a very good indi-cator of return on supply chain spending.”
While level 1 metrics are appropriate for monitoring performance ata high level, they are less useful for diagnosing the causes of performanceproblems. More detailed performance measures that provide details ontactical execution provide a better understanding of these problems. Inkeeping with the SCOR model’s hierarchical structure, each level 1 met-ric is associated with a group of level 2 and level 3 metrics. These lower-level metrics can be used to diagnose the causes of any performanceproblems that appear at level 1. Before you start, make sure that you cre-ate an overall architecture for your performance-management program—determine which level 1, level 2, and level 3 metrics you will monitor.(See Appendix C for a comprehensive list of level 2 and level 3 metrics.)
Measure Yourself as Your Customers Measure You
The metrics embedded in the SCOR modelare consistent with the premise of the sup-ply chain as an end-to-end process. As such,each metric is considered from the perspec-tive of customers and suppliers—not justfrom an internal perspective. The supplychain scorecard is necessarily prescriptive.It provides detailed definitions for eachmetric and specific recommendations forhow to collect the needed data.
In many cases a company may strayfrom the standard definitions. This may bedone to ease the burden of data collection, to influence the behavior of aninternal or an external constituent, or—consciously or unconsciously—tomake performance seem better than it really is. While it may be appropri-ate to “tweak” the standard definitions, always make sure that your met-rics are consistent with what your customers and suppliers would use.
We worked with a global automotive parts company that spent morethan two years making sure that each of its business units adopted a con-sistent measurement for delivery performance to its primary customers—retail chains and stores. With daily deliveries and an official policy thatall products would be available to customers within one day of ordering,
The metricsembedded in theSCOR model areconsistent with thepremise of thesupply chain as anend-to-end process.

210 Strategic Supply Chain Management
“on-time delivery” was based on the percentage of products received bycustomers within one day of the order being placed. However, while thebusiness units reported good results, customers were complaining aboutdelivery performance, and a customer satisfaction survey showed that thecompany was performing worse than its competition.
A closer look revealed that the order desk used a default of next-daydelivery except when a product was not available. Products were consid-ered available if they were either in a local distribution center or sched-uled to arrive the next day. Customers who ordered a product that was notavailable were given an estimate of when it would be delivered.
Of course, customers expected delivery the next day or on the esti-mated date provided by the order desk. They measured on-time perfor-mance based on these dates, as did the industry association that reportedcustomer satisfaction data. The company, on the other hand, based its cal-culations on the assumption that only products that were not available atthe time the order was placed had missed their target. Missed “next day”deliveries were not tracked, nor were failures to meet the estimated datesprovided when the requested products were not available immediately. Inaddition, business units calculated their performance on a per-item basis,whereas customers based their measurement on whether or not the entireorder was received on time.
Following this analysis, management established two new metricsfor order-delivery performance. The first was on-time delivery to commit,defined as the percentage of complete orders received by customers on thedelivery date that the company committed to. When a later delivery datewas requested by the customer, the commit date was updated accordingly.The second metric, order-fulfillment cycle time, tracked the elapsed timebetween when an order was received by the company and when the prod-uct was delivered to the location specified by the customer.
Interestingly, by analyzing the discrepancy between performance asreported by the business units and performance as reported by customers, thecompany made a valuable discovery: Customers valued an accurate deliverydate for their entire order more than they valued 24-hour turnaround. Thisinsight led the company to reassess its entire service-level strategy.
CASE IN POINT: PERFORMANCE MANAGEMENT AT 3COM
In 2003, 3Com Corporation, a leading maker of networking products, setout to develop a way to use performance management to help execute itsbusiness strategy. The company’s sales, marketing, product management,

CHAPTER 5 Core Discipline 5: Use Metrics to Drive Business Success 211
research and development (R&D), and supply chain operations are cen-tralized and support all product lines. 3Com hoped to develop an infra-structure that would allow the leaders of each of these functions to
◆ Align the organization’s activities and priorities with overall corporate objectives
◆ Monitor key performance indicators◆ Provide timely information for better decision making and
responsiveness
3Com put together a project team, along with a cross-functionalsteering committee, to provide executive oversight. Before starting, thecompany went through a major strategic planning effort. Ari Bose,chief information officer (CIO) and chair of the steering committee,explains, “We wanted to make sure that we had a clearly defined busi-ness strategy that was bold and forward-looking. And the functionalheads had to clearly understand the strategy so [that] they could executeagainst it.”
Once the strategy was set, 3Com focused on aligning each func-tion. Using the balanced scorecard framework, each function set upactions and metrics along the four key dimensions of customer, finan-cial, internal (“operations”), and innovation and learning (“people”).Each function’s objectives and actions were designed to support theoverall company strategy, and key initiatives were derived from the cor-porate goals. For example, the service organization had an initiative toupgrade its capabilities to support 3Com’s reentry into a specific marketsegment, and the operations organization had an initiative to move man-ufacturing to a contract manufacturing partner. Each functional score-card rolled up into an overall worldwide operations scorecard (seeFigures 5-7 through 5-11).
The supply chain organization chose a set of metrics that measurescritical aspects of performance and also supports the business goals, as wellas more detailed metrics that provide broader visibility into the health ofthe function. Performance metrics include delivery predictability, stockoutpercentage, order cycle time, and supply chain costs. These costs can bebroken down into materials costs, overhead costs, and period costs, whichhave even further detail.
Figure 5-9 shows the graphic format that 3Com uses to emphasizethe key targets at various levels of the scorecard. To identify the rootcauses of any problem areas, the company analyzes lower-level metricsin the drill-down option of the supply chain scorecard (see Figure 5-10).

212 Strategic Supply Chain Management
F I G U R E 5–7
3Com’s approach to performance management.
3Com WorldwideOperations Scorecard
Corporate Strategy, Goals & Objectives
Sales
Business Model,
Strategy, Goals
& Objectives
Marketing
Business Model,
Strategy, Goals
& Objectives
R&D
Business Model,
Strategy, Goals
& Objectives
Supply Chain
Business Model,
Strategy, Goals
& Objectives
ProductManagement
Business Model,
Strategy, Goals
& Objectives
F I G U R E 5–8
Setting up a balanced scorecard at 3Com.
1. Business Model &StrategyStart with the businessstrategy—a bold future-oriented statement.
2. Business ObjectivesDevelop key businessobjectives that will attainthe strategy.
3. Measure & MetricsDevelop specificmeasures and metricsto track progress.
4. ImplementGather measures, createthe Balanced Scorecard, and use it to make decisions.Incorporate a continuousimprovement philosophyin the process.
Use strategy toidentify the objectives
Use objectives to identifythe measures that will be used
Use measuresto build theBalancedScorecard
Use scorecard to determineif targets are met and the right
measures are being used
Use measures/metricsto evaluate progress
against objectives
Useprogress
againstobjectivesto confirm
strategy

CHAPTER 5 Core Discipline 5: Use Metrics to Drive Business Success 213
Today, the worldwide operations scorecard resides on every 3Comexecutive’s desktop and is used daily to monitor performance at both acorporate and a functional level. At weekly executive staff meetings, eachfunctional area takes turns making a presentation that includes the sum-mary scorecard and an update on key initiatives that align with overall cor-porate objectives. “This process has really helped our supply chainorganization focus on what’s important,” says Jim Ticknor, 3Com’s vicepresident in charge of supply chain operations. “But even more, it hashelped all the groups see how their activities and decisions affect otherareas of the company.”6
NEXT-GENERATION PERFORMANCE MANAGEMENT
Like 3Com, many organizations are moving away from a piecemealapproach to performance management and toward a more holistic approach.This means that supply chain performance management will become anintegral part of an overall performance-management strategy—whatGartner calls “corporate performance management” (CPM).
F I G U R E 5–9
Supply-chain scorecard for 3Com.
Customer Financial Operations People
Delivery Predictability
Supply ChainCosts (% of Revenue)
Days of Supply VoluntaryAttrition (OverallAnnualized)
ChannelInventory
Supply ChainCosts ($)
Material Turns Voluntary Attrition (Top 30)
Stockout % OrderManagementCosts ($)
MaterialOperational Turns
% PerformanceReviews CompletedOn Time
Order CycleTime
Quarterly Material CostReductions ($)
Warranty/Service Inventory Turns
Communications
RMA DeliveryPredictability
Skills Assessment/Development
Quality (FailureRate)
Actual is better than or equal to plan
Actual is within 5% of plan
Actual is >5% off plan

214 Strategic Supply Chain Management
CPM describes the methodologies, metrics, processes, and systemsused to monitor and manage an organization’s overall business perfor-mance.7 It’s more than software. It includes the processes for managingcorporate performance, the methodology for choosing the right processmetrics, and the processes for managing those metrics. It also blends datafrom ERP, customer relationship management (CRM), product life-cyclemanagement, human resources management, and business intelligencesystems, providing necessary and valuable links between the disparatepoints of internal operations.
Supply chain performance management is a key element in overallcorporate management-performance strategy, which also must include theprocesses and tools that will enable links with supply chain partners.
While CPM solutions are evolving quickly, there’s no silver bullet orsystem that offers one-stop shopping. This means that your company
F I G U R E 5–10
Submetrics of supply chain scorecard for 3Com.
Supply Chain Cost ($)
Total Material Variances
Total Period Costs
Overhead Variances
Total Period Costs
Excess & Obsolete
Returns Scrap
Warranty Cost
Freight-In Cost
Freight-Out Cost
Duties
DistributionActual is better than or equal to plan
Actual is within 5% of plan
Actual is >5% off plan

CHAPTER 5 Core Discipline 5: Use Metrics to Drive Business Success 215
needs to think critically about its immediate performance-managementrequirements but plan for an integrated solution. Disconnected initiativesmanaged within specific functions should be avoided at all costs. Thisintegrated CPM approach is wholly consistent with the concept of tightlyintegrating your end-to-end supply chain with your overall business.
F I G U R E 5–11
Regional/product group scorecard for 3Com.
Customer Financial Operations People
Delivery Predictability
Supply ChainCosts (% of Revenue)
Days of Supply VoluntaryAttrition (OverallAnnualized)
ChannelInventory
Supply ChainCosts ($)
Material Turns Voluntary Attrition (Top 30)
Stockout % OrderManagementCosts ($)
MaterialOperational Turns
% PerformanceReviews CompletedOn Time
Order CycleTime
Quarterly Material CostReductions ($)
Warranty/Service Inventory Turns
Communications
RMA DeliveryPredictability
Skills Assessment/Development
Quality (FailureRate)
Order Cycle Timeby Region
Region A
Region B
Region C
Region D
Order Cycle Time byProduct Group
Product Group 1
Product Group 2
Product Group 3
Product Group 4
Actual is better than or equal to plan
Actual is within 5% of plan
Actual is >5% off plan
216 Strategic Supply Chain Management
As CPM evolves, we expect to see the following changes:
◆ Organizations will use consistent supply chain metrics and defin-itions based on industry standards such as PMG’s supply chainscorecard.
◆ As these standards are embraced, ERP vendors will make perfor-mance monitoring and reporting capabilities a basic part of theirsolutions.
◆ Companies will develop integrated, enterprisewide performance-management systems. Supply chain, CRM, product life-cycle management, and other functional performance management strategies will be designed within the context ofthis integrated whole.
◆ The architecture for business intelligence solutions will be basedon a comprehensive approach to corporate performance manage-ment, of which supply chain performance management will be akey element.
◆ Event management systems—which monitor business events inreal time and notify users of exceptions and alerts—will becomeincreasingly prevalent, allowing companies to react more quicklyto changes in the marketplace.
◆ Companies will see a growing consensus on how often key met-rics should be monitored. Real-time reporting will be reservedfor real-time processes.
◆ “Dashboards” will be replaced by tools with greater functional-ity. These tools will enable decisions based on current businessconditions.

General Motors Profile: Driving CustomerSatisfaction
Faced with declining market share and a changing industry, GeneralMotors (GM) launched an ambitious effort that transformed its supplychain and made customer satisfaction a priority.
In the late 1990s, the Internet seemed poised to transform the automobileindustry. Consumers armed with information could quickly compareprices, options, quality, and service—and make more informed choices.New business models threatened to squeeze industry margins and disruptthe long-standing original equipment manufacturer (OEM)-dealer rela-tionship. General Motors observed these changes warily.
The world’s largest vehicle manufacturer, GM has revenue of$185.5 billion, production facilities in 32 countries, and a workforce of about 325,000. In 2003, the company sold more than 8.6 million carsand trucks—about 15 percent of the global vehicle market. Despite its size and clout, though, GM had seen its global market share erode from17.7 percent in the early 1990s to 15 percent in 2002 mainly due to declin-ing levels of customer satisfaction and competition from foreign imports.The industry had changed.
In the 1970s and 1980s, GM alone decided what products to make—with little input from dealers or customers. Explains Harold Kutner, groupvice president of worldwide purchasing and production control and logisticsat the time, “We were an arrogant company. We had an attitude of ‘we’llmake it, and the customer will take it.’” This attitude typified the “BigThree” automakers at the time. Running plants at full capacity was the name
217
Copyright © 2005 by The McGraw-Hill Companies, Inc. Click here for terms of use.
218 Strategic Supply Chain Management
of the game—whether or not the vehicles being made were the onescustomers wanted.
THE IMPETUS FOR CHANGE
By the late 1990s the need for change was becoming clear. Consumerswere more savvy, powerful, and demanding. Yet GM’s responsivenesslagged the industry. Dealers grew increasingly frustrated by the mix ofinventory foisted on them. Even in key markets, dealer lots were cloggedwith over 100 days of supply. To clear out slow-moving products, GM hadto offer sales incentives, which squeezed profit margins.
Dealers couldn’t get the vehicles they wanted—the vehicles theircustomers wanted. Desirable options such as aluminum wheels, leatherinteriors, and V8 engines often were not available in adequate quantities.Unavailable options, or constraints, were high at GM dealerships relativeto the industry as a whole, averaging tens of thousands of orders affectedat any given time over the range of GM products. This meant that cus-tomers could rarely get their first-choice vehicle. As a result, they oftensettled for more basic, lower-margin models, which ultimately hurt GM’sbottom line.
Customers who chose to special-order a vehicle had to wait as longas 70 to 80 days for it to arrive. Furthermore, GM was uncertain of itsdelivery-date reliability because delivery-date promises were nottracked at the time, and neither dealers nor customers had any way ofchecking on the status of their orders—there was no visibility into GM’sorder-fulfillment process.
At the same time, the company’s supply chain costs were growing.High levels of raw materials and work-in-progress inventory, inefficientprocesses, outdated information-technology systems, and bloated over-head resulted in a costly, sluggish organization—at a time when stream-lined operations were becoming more and more critical. Now, withmarket share down and Internet-driven change on the horizon, GM knewthat it could no longer operate as it once had if it hoped to remain a mar-ket leader.
Change at the mammoth company wouldn’t be easy. After all, GMmakes over 30,000 vehicles every day, using over 160,000 parts from avast network of global suppliers—a staggeringly complex undertaking.Brad Ross, head of GM’s global order-to-delivery (OTD) organization,describes the process as a “tremendously orchestrated set of events thatintegrates orders across sales, manufacturing, and logistics, resulting inwhat we refer to as the daily miracle of production.”

GENERAL MOTORS PROFILE: Driving Customer Satisfaction 219
GM’s OTD process encompasses four of the Supply-ChainOperations Reference-model’s key supply chain processes—plan, source,make, and deliver. Given this complexity, transforming OTD would be like“turning the Titanic around on the Flint River,” notes Kutner. Yet that’swhat GM set out to do. The goal? To ship customer orders in less time,with less inventory, at a lower cost—and to satisfy customers better thananyone else in the industry.
THE NEW MANDATE: SENSE AND RESPOND
GM’s ambitious undertaking meant moving from a make-and-sell to asense-and-respond organization. First, the company had to start tuninginto what customers wanted by sensing the marketplace better. GM hadbeen making the wrong products. Its declining market share and the glutof inventory at the dealer lots were proof of that. Notes Ross, “In this busi-ness, product is everything. The supporting processes are important, butwithout the right product in the right place at the right time, you’re noteven in the game.”
Second, GM had to put in place an organization that could respondmore quickly and effectively to customer demand—and provide betterservice quality. This meant rethinking key processes and replacing thefunctional mind-set with a more cross-functional, collaborative approach.
The Internet became a critical tool for sensing consumer preferencesand market trends. In collaboration with dealers, GM developed BuyPower,an online portal that lets potential customers get detailed product and dealerinformation. By monitoring the “click streams” of online shoppers doingvehicle research, GM now gains a wealth of information that helps withproduct development, production planning, and sales forecasting. The com-pany also set up dealer councils, regular forums for getting dealer input onconsumer trends and better ways to sell.
To align real demand with production schedules—and provide visi-bility into the OTD process—GM upgraded its vehicle order management(VOM) system to allow dealers access through the Internet. Previously,customer-specified orders went to the end of the manufacturing queue,which is why lead times were so long. Dealers were unable to specify the mix of inventory they wanted. Instead, GM “pushed” inventory to thedealers. With the new VOM system, dealers place orders for the vehiclesthey want on a weekly and daily basis and can see the status of thoseorders as they move through the order-fulfillment process.
Using the new system, dealer orders are automatically comparedwith the current manufacturing schedule. In the past, GM often built the
220 Strategic Supply Chain Management
“right” vehicles but sent them to the “wrong” dealers because there wasno mechanism in place for matching production with demand. Now GMdoes its best to make sure that dealers get the vehicles they want. To speedorder delivery, the new process looks for the fastest way to fill orders. Isa desired vehicle already in production? Scheduled for assembly? Avail-able at another dealer’s lot? Close enough to a vehicle currently in pro-duction that a few adjustments will seal the deal? Orders are viewed daily,and assembly schedules are adjusted accordingly.
When desired options are constrained by parts availability, thoseconstraints are systematically flagged, analyzed, and minimized through a new constraint-elimination process. Strategic parts buffering has been auseful new approach to minimizing parts shortages (and order con-straints); a new tool has been implemented that enables GM to stock upon select parts and materials that are potential bottlenecks. Getting theright part to the right operator in the plant at the right time is critical. Withbetter supply chain visibility and a focus on strategic parts buffering, GMhas been able to improve parts availability overall, boosting quality andcutting costs.
Although demand forecasts still drive production—long lead timesfor certain materials make this the most practical approach—GM now bal-ances its traditional build-to-stock model with more build to order to lowerinventory levels throughout the distribution chain and better respond tocustomer needs. The company now accepts new orders on a daily basis andcan schedule them for the assembly plant the same day and have themcome off the line in the same week.
As a result of these changes, lead times for special orders and dealer-replenishment orders have improved by 60 percent, and customer surveysshow that GM customers receive their vehicles eight days faster than vehi-cles from competitors. Delivery reliability also has improved dramatically.Today, GM meets its delivery date commitments 90 percent of the time.Now recognized as one of the most reliable suppliers to the commercialfleet market, GM recently received Fleet Magazine’s Best Order toDelivery Fleet Company award for the second consecutive year.
And since production better matches demand, customers have agreater probability of receiving their first-choice vehicle. Orders affectedby constraints have been reduced by over 90 percent. GM received itsbest-ever National Automobile Dealers Association (NADA) surveyresults for OTD/distribution elements for allocation system, product avail-ability, and timeliness of delivery. And it’s realizing higher margins onvehicles that are built to customer order.

GENERAL MOTORS PROFILE: Driving Customer Satisfaction 221
A NEW ORGANIZATION
One of the greatest obstacles to transforming GM’s OTD organization intoone that would be customer driven was the company’s functional “silos.”Too often different groups worked at cross-purposes rather than together.This led to finger pointing and an added layer of complexity while boost-ing schedule changes and increasing parts shortages, causing unnecessar-ily high inventory levels and carrying costs.
GM created a global cross-functional OTD organization to ensurethat operating objectives were aligned and to eliminate competition forresources. It is organized around GM’s three core supply chain sub-processes: supply operations, order fulfillment, and logistics. Order ful-fillment deals with dealer-facing and planning activities; supplyoperations manages materials, internal plant activities, and supplier inter-action, and logistics coordinates the movement of parts inbound from thesuppliers to the assembly plant and outbound transportation of vehicles tothe dealer. Each of these subprocesses is run by a global leader. Together,the three leaders formed a global leadership team that drove the OTDtransformation.
The new organization colocates the people who support each otherand depend on each other for information. Supply operations was alignedwithin manufacturing, for instance. Likewise, order fulfillment wasembedded within sales and marketing. Outbound logistics was colocatedwith order fulfillment and inbound logistics with supply operations.
In the old organization, GM had two order-management groups.Vehicle order management reported to sales and marketing, productionorder management reported to production control and logistics. TheOTD team realized that only one order-management process wasneeded. Accordingly, both processes were combined under OTD withinsales and marketing. (See Chapter 3 for more detail on designingprocesses first and then realigning organizational structure to empowerthe processes.)
When the dust had settled, GM was able to cut back on the numberof people needed to run the global OTD organization by nearly 30 percent,achieving far greater efficiency and a major reduction in costs.
RETHINKING LOGISTICSIn seeking ways to further streamline the OTD organization and cutcosts, GM realized that logistics were a weak link. The company had longoutsourced inbound and outbound logistics activities to a network of

222 Strategic Supply Chain Management
third-party service providers at a high cost. However, a lack of commu-nication and coordination among the providers led to inconsistent per-formance and long lead times.
To reduce costs and improve efficiency, GM partnered with a globallogistics company to create the joint venture Vector SCM. Today, Vectorcentrally manages GM’s large, complex logistics network through a seriesof command centers equipped with the technology needed to track GM’sassets and carriers. To further improve performance and visibility, Vectorcreated one integrated information system for the third-party serviceproviders. By improving logistics, GM’s goal was to reduce costs by 20percent in five years. By year three, GM had already achieved cost savingsof 17 percent.
The logistics team also sought to further cut costs by minimizing in-transit damage. Vehicles are treated as “jewels” in the auto industry, andconsumers want their jewels delivered unscratched, undented, and “pol-ished.” By streamlining the route from assembly plant to dealer and min-imizing vehicle handling, GM has reduced vehicle damage incidents by35 percent.
A FOCUS ON BUSINESS RESULTS
Throughout the OTD transformation, GM maintained a rigorous focus onbusiness results. Because the initiative was so ambitious—with so manyimprovement opportunities—the company risked losing sight of the bigpicture while chasing down avenues with limited value-add. GM chosefour key metrics to guide the transformation: quality, net income, cashconservation, and market share. Every initiative and every decision had tosupport one or more of these metrics.
The primary drivers of quality are fewer vehicle damage incidentsand providing parts to the assembly line on time to support the build plan.Lower costs and fewer constraints boost net income. Lower inventory lev-els help to conserve cash. The OTD initiative systematically addressedeach of these areas.
The final metric—market share—was selected as the way in whichcustomer satisfaction improvements could be translated into improvedcompany performance. The drivers of customer satisfaction that OTD caninfluence are order lead time, delivery-date promise reliability, and vehicle-of-choice availability. By improving these drivers, GM would boost cus-tomer satisfaction. This would be good for business because satisfiedcustomers buy more products.

GENERAL MOTORS PROFILE: Driving Customer Satisfaction 223
These four business-focused metrics were a focal point for thetransformation, driving the change forward by forcing the organization tokeep its eyes on the road. Notes Ross, “We were always able to map theimprovement initiatives to these objectives.”
THE INFORMATION TECHNOLOGY CHALLENGE
Although the primary focus of GM’s transformation effort in the earlystages was on redesigning the key processes and organization, GM couldn’thave transformed its OTD capability without addressing the company’sunderlying information systems. Like most large, complex organizations,GM had a tangle of legacy systems—many redundant—and a lack of inte-gration across functions, business units, and geographies. Since most off-the-shelf software requires significant customization, many of the legacysystems and applications were developed by or for GM and were specifi-cally designed to manage the company’s high degree of product and processcomplexity. GM is in the process of moving many of its legacy systems tothe Internet, but a high-performance, wholly integrated IT environmentremains a vision that will take many years to achieve.
In the meantime, GM is working with what it has. Given the scopeof the effort, the OTD team had to prioritize the needed capabilities andthen find technology solutions that didn’t cost too much or take too longto implement. The team’s strategy has been to enhance key legacy sys-tems with Web-enabled tools and integration, incorporating new toolsselectively.
Bill Kala, director of North American manufacturing supply opera-tions and part of the original OTD leadership team, credits GM’s globalmaterials scheduling system—a legacy system dating back to the 1980s—with driving many of the savings in supply operations. Kala realized earlyon, however, that he had to rein in enhancement and maintenance costs. Ashe explains, “Everyone wanted to make frequent changes to the system,and those changes were contributing to a $70 million annual spend.” Togain control, Kala stipulated that any changes be clearly explained and jus-tified. Moreover, changes had to benefit at least two geographic regions.Any request for a new stand-alone system was scrutinized carefully. Theresult? Kala’s group cut the annual cost of the system by almost 30 percent.
In some areas, GM had to push IT changes faster than planned toimprove partner collaboration. GM’s Information Systems Group sup-ported a move to better integrate the company’s processes and systemswith those of GM’s dealers at the point of sale. Until then, integration had

224 Strategic Supply Chain Management
been limited to the basics—parts ordering or submission of warrantyclaims and financial reports. GM is also piloting a program that deploysone personal computer (PC) for every two service bays at dealer locationsto support integration between service and parts and GM. Early tests atSaturn have shown that GM can centrally manage parts inventory at thestore level with this system, increasing inventory turns and first-time fillrates and lowering retail inventory levels.
GM’s IT strategy is working. The company has taken an additional$1 billion out of IT expenses related to the supply chain since the OTDinitiative was launched. The focus on process first and technology secondhas had a bonus effect. Explains John Whitcomb, GM director of globalsales, service, and marketing, “Once people have a common understand-ing of business process, which is manifested by the workflow, the discus-sion about legacy components becomes much more fact-based. Youremove the emotional arguments about keeping those systems which peo-ple have grown comfortable with.”
THE NEXT FRONTIER
What’s next for GM’s OTD transformation? Reduced cycle times and leadtimes. More personalized vehicles with special accessories and features.Better integration with dealers, who have already embraced the VOM sys-tem and several other Web-based tools that are being built into an inte-grated “workbench.” GM is also looking at more build to order throughthe dealer channel, which is valuable for its high-touch, high-tech capa-bilities, and a more flexible supply base. It’s looking at more commonal-ity among global systems and processes. “There really is no end point toan initiative like this,” says Ross. “We expect to continue on this improve-ment trajectory for the next several years, providing more competitiveadvantage for GM—and setting new standards for customer satisfaction.”
GM SERVICE AND PARTS OPERATIONS—A TRANSFORMATION OF ITS OWN
The story of GM’s supply chain transformation would not be completewithout a discussion of another, parallel effort to transform the supplychain of GM Service and Parts Operations (SPO), another key factorin customer satisfaction.

GENERAL MOTORS PROFILE: Driving Customer Satisfaction 225
The SPO supply chain is complex: 400,000 order lines every day,generating requirements for 600,000 part numbers from 4,100 sup-pliers. In the mid-1990s, GM SPO lagged the service parts operationsof OEM competitors in several measures by a wide margin. Costs,inventory levels, and response times were all out of line with thecompetition. To make matters worse, GM’s dealers’ service partsbusiness was hurting. Faced with new competition from quick ser-vice chains, dealers with slow response times were having troubleholding onto customers beyond the warranty period. Today, however,the organization is focused on closing the gap with the competition,and GM SPO is setting its sights for top performance in the industry.
By focusing on five common objectives, SPO has been able toalign all of its people and energy behind a common strategy.According to Dennis Mishler, GM SPO’s director for logistics andsupply chain management, “We focus everyone on better servingthe customer through improvements in order response time, materialavailability, inventory management, value creation in logistics, andnew-launch support. We learned quickly that change cannot comefrom spreading ourselves too thin. We say, ‘The main thing is to keepthe main thing the main thing.’”
FOCUSING ON THE CUSTOMER
The “main thing” for SPO is the customer. The group recognized thatits supply chain was defined by the needs of its customers, andtherefore, the most important guiding principle for the transformationeffort should be to “make it easier for SPO’s customers to service theend customer.” In fact, SPO realized that it was serving multiple sup-ply chains, each with varying requirements. There are three separatebrands and multiple product-line businesses covering collision, pow-ertrain, maintenance, and repair, as well as accessories.
IMPROVING ORDER RESPONSE TIME
To provide dealers and retailers with better service, SPO had toimprove order response times and delivery reliability. So it imple-mented a one-day delivery policy for most customers, shippingovernight or in some cases the same day. Meeting the new delivery

226 Strategic Supply Chain Management
policy while continuing to lower costs required some key changesin inventory deployment. SPO revaluated which inventories wouldbe stored in the field and which would be held in central locations,leading to a more centralized deployment approach overall.
IMPROVING MATERIAL AVAILABILITY THROUGHFORECASTING
The service parts business is one characterized by seemingly randompatterns of demand spread across a wide range of products for a widerange of customers. According to Mishler, approximately 10,000 of the600,000 parts are considered fast movers, requiring little in the way ofadvanced planning and forecasting. The other 590,000 parts are slowmovers, requiring much more sophistication in forecasting and inven-tory planning. SPO restructured its overall approach to forecasting:Parts were grouped by business (collision, maintenance and repair,etc.) with similar life-cycle demand curves, and SPO forecasters weretrained to understand characteristics, trends, and events related todemand across the life cycle. SPO also implemented world-class fore-casting tools that allowed its experts to easily test different forecastingmodels and implications. For example, patterns related to seasonality,demand spikes, or supply chain events could be “clicked anddragged” into the models to test the overall impact on the forecast.While there is still room for improvement, the results to date havealready been striking: SPO has reduced inventory by over 25 percentdue to improved forecasting capabilities.
IMPROVING INVENTORY MANAGEMENT AND VISIBILITY
Improving inventory management required GM to greatly enhance itsability to see and manage demand, supply, and inventory informationat another level of detail. By developing forecasts and schedules atthe level of each PDC (product distribution center), SPO is now moving into a more deterministic, data-driven environment that isenabling significant new reductions in inventory. SPO also has estab-lished the capability to see inventory availability across its network,which will soon be extended to include dealer parts departments.

GENERAL MOTORS PROFILE: Driving Customer Satisfaction 227
CREATING VALUE IN LOGISTICS
SPO faced a significant gap in the competitiveness of its warehous-ing and logistics operations. The management team is addressingthe challenge in partnership with a third-party logistics provider,systematically implementing principles of lean manufacturing. Overtime, this consistent focus has enabled SPO’s people to “lean out”material flows one at a time, implementing standardized workprocesses along the way. Says Mishler, “We have improved ourproductivity [in the distribution centers] by over 50 percent.”
CREATING A BALANCED PARTNERSHIP WITH SUPPLIERS
SPO acknowledges that much of its improved supply chain perfor-mance has been due to its improved relationships with its suppliers,including its logistics providers. In conjunction with other GM orga-nizations, it has implemented a rigorous process of supplier collabo-ration, whereby performance is reviewed and ideas for reducingwaste in the supply chain are exchanged on a quarterly basis.
EMPOWERING THE “OAKS”
People also play a powerful role. As Mishler explains, they’re the“oaks” that hold up the organization. The SPO is now organizedaround business lines, reinforcing the focus on customers in eachbrand/product business. Each business line is supported by a cross-functional team that is held accountable for supply chain perfor-mance. The teams include “oaks” from key functions—people whoknow the processes and have been around the business for yearsand are continuously trained in skills that will help them eventuallyoptimize each of their supply chains.
Future plans include an aggressive “digital supply chain” initia-tive that will incorporate virtual warehousing, enhanced suppliercollaboration, event management, advanced planning/optimization,and other new capabilities. “It’s really a journey,” says Mishler.“Once you get the entire organization focused on what is reallyimportant, you can really make progress.”

This page intentionally left blank.
6 C H A P T E R
A Roadmap to Change
229
While the five core disciplines provide the foundation for supply chainexcellence, none is sufficient on its own. Supply chain performance is allabout integration—integration of strategy, processes, organization, andinformation systems. Moreover, making sure that this integration happens—given the complexity of the supply chain and the hundreds of potential prac-tices and competing priorities—requires a multidimensional plan. We callthis plan the roadmap to change.
An effective roadmap is developed and managed as an iterative andongoing activity. Unlike a plan that focuses on a single project, a roadmapdescribes each of the major initiatives to be executed over a given timeperiod—typically one to three budget cycles. It shows the links betweenthe different initiatives and the expected performance improvements atmeaningful intervals. Progress toward objectives is monitored as part ofregular business or operations reviews.
Creating and managing a roadmap to change (see Figure 6-1) is across-functional effort with ongoing collaboration among the supplychain organization, the information technology organization, and otherfunctions, such as marketing, sales, finance, and engineering. Workingtogether, thought leaders from these groups ensure that each initiative isclearly defined, launched, and executed in a manner consistent with theoverall business strategy.
Copyright © 2005 by The McGraw-Hill Companies, Inc. Click here for terms of use.

230 Strategic Supply Chain Management
Developing and executing the roadmap can be time-consuming andresource-intensive but is the key to supply chain maturity and is wellworth the effort. A highly mature supply chain is one that has achievedadvanced capability across each of the core disciplines (see Figure 6-2).Research by PRTM’s benchmarking subsidiary, The PerformanceMeasurement Group, LLC (PMG), finds that there is a strong correlationbetween supply chain maturity and superior performance. Companieswith mature supply chains experience
◆ A 40 percent profitability advantage, where profitability isexpressed as earnings before income and tax as a percentage ofrevenue
◆ Average total supply chain costs just above 8 percent of revenue,versus 10 percent for companies with less mature supply chainpractices
◆ Superior customer service, with 25 percent less inventory investment
ADVANCED SYSTEMS AREN’T ENOUGH
Advancing your company’s supply chainperformance means moving from whereyou are today to a future state that includesnext-generation processes and infrastruc-ture, including information systems. Tech-nology is only one part of the story—and it isn’t the first chapter. Throughout thisbook we have noted where the five core dis-ciplines can and should be enabled by effec-
F I G U R E 6–1
Creating the roadmap to change.
Define the Supply Chain Strategy
Operate the supply chain
Adapt the supply chain
Design the solution
Set the priorities for change
ProcessArchitecture
Organization PerformanceManagement
Collaboration
1 2 3
There is a strongcorrelation betweensupply chain maturityand superiorperformance.
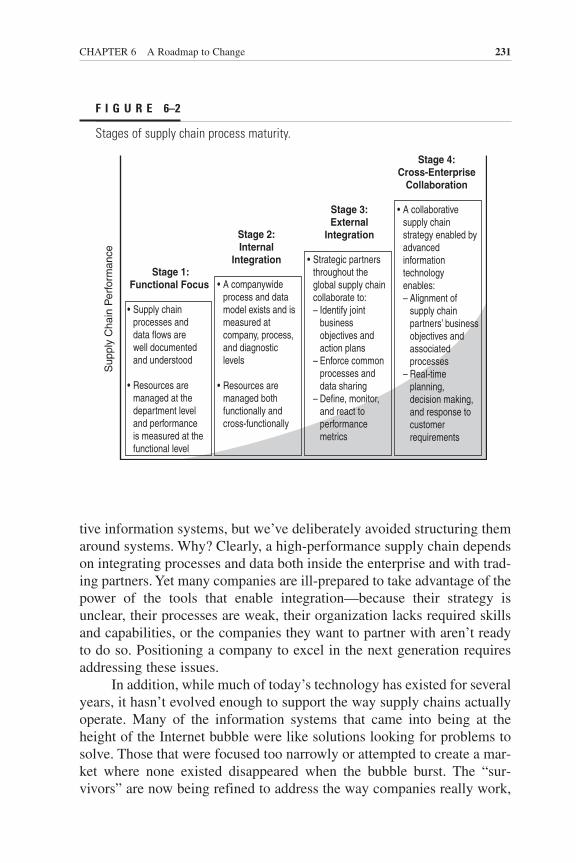
CHAPTER 6 A Roadmap to Change 231
tive information systems, but we’ve deliberately avoided structuring themaround systems. Why? Clearly, a high-performance supply chain dependson integrating processes and data both inside the enterprise and with trad-ing partners. Yet many companies are ill-prepared to take advantage of thepower of the tools that enable integration—because their strategy isunclear, their processes are weak, their organization lacks required skillsand capabilities, or the companies they want to partner with aren’t readyto do so. Positioning a company to excel in the next generation requiresaddressing these issues.
In addition, while much of today’s technology has existed for severalyears, it hasn’t evolved enough to support the way supply chains actuallyoperate. Many of the information systems that came into being at theheight of the Internet bubble were like solutions looking for problems tosolve. Those that were focused too narrowly or attempted to create a mar-ket where none existed disappeared when the bubble burst. The “sur-vivors” are now being refined to address the way companies really work,
F I G U R E 6–2
Stages of supply chain process maturity.
Stage 1:Functional Focus
• Supply chain processes and data flows are well documented and understood
• Resources are managed at the department level and performance is measured at the functional level
Stage 2:Internal
Integration
• A companywide process and data model exists and is measured at company, process, and diagnostic levels
• Resources are managed both functionally and cross-functionally
Stage 3:External
Integration
• Strategic partners throughout the global supply chain collaborate to: – Identify joint business objectives and action plans – Enforce common processes and data sharing – Define, monitor, and react to performance metrics
Stage 4:Cross-Enterprise
Collaboration
• A collaborative supply chain strategy enabled by advanced information technology enables: – Alignment of supply chain partners’ business objectives and associated processes – Real-time planning, decision making, and response to customer requirements
Sup
ply
Cha
in P
erfo
rman
ce

232 Strategic Supply Chain Management
as opposed to a technologist’s opinion as tohow they should operate.1 In the next gen-eration, we believe applications will be farbetter aligned with what companies wantand need.
To understand the appropriate role ofsystems in creating your roadmap, think of creating a ladder that will allow you toclimb from where you are today to the nextgeneration. If the core disciplines form thesides of the ladder, then the supporting sys-
tems are the rungs that allow you to climb. Although it is possible to ascenda ladder with no rungs, you would have to pull yourself along with greateffort to do so. Now imagine the rungs with no supporting sides—there isno way to climb at all! This is what happens when companies attempt toachieve the characteristics of the next-generation supply chain withoutfocusing on the core disciplines first.
Perhaps the most interesting finding of our research is the benefit ofthe synergy that results from integration of best practices and effectiveinformation systems. It’s not surprising that mature processes, combinedwith advanced technologies, lead to better performance. What is surprising,however, is that companies that implement sophisticated technology—suchas an advanced planning system—without the same level of attention paidto their processes and organization actually perform worse than those thatmake no use of advanced technology at all.2
CHARACTERISTICS OF THE NEXT GENERATION
An effective roadmap will take you to the next generation—but what willthe next generation look like, and how will it be different from today? Fewwould argue about the benefits of the extended supply chain and the ideathat in order to optimize value, you need to look beyond your own orga-nization and your immediate customers and suppliers.
In practice, this means achieving
◆ Enterprise connectivity—business and transactional systems thatare linked, allowing data to be seen and transported to differententities within the supply chain
◆ Distributed decision making—bidirectional information flow anddefined business rules used to manage ongoing changes indemand and supply
In the nextgeneration,applications will befar better alignedwith what companieswant and need.
CHAPTER 6 A Roadmap to Change 233
◆ Real-time performance management—real-time, accurate infor-mation available to enable rapid and informed decision making
While reacting immediately to events within the extended supply chainand establishing seamless collaborative processes are objectives for manycompanies, in actuality, very few can do them effectively. This is so becausetoday, process and data standards, as well as information-system architec-tures, can be major inhibitors to the various collaboration approaches dis-cussed in Chapter 4. Many systems in use today still rely on point-to-pointor hub-and-spoke architectures. Their primary utility is to move materialsmore quickly and efficiently. And today’s supply chain strategies and pro-cesses reflect the limitations of these tools.
Next-generation supply chain tools will emphasize collaboration andinformation availability more than speed and efficiency and support threefundamental characteristics: transparency, flexibility, and simultaneity. Asthese technologies continue to evolve and supply chain practitionersbecome more comfortable with their effectiveness, strategies, processes,and organizational capabilities will evolve in parallel. Figure 6-3 showssome specific applications that you may consider using to enable thesenext-generation characteristics as you develop and manage your roadmapto change.
Transparency
Transparency enables visibility into the end-to-end supply chain.Companies that can see the status of their supply chain resources andtransactions—both internal and external—can make more timely deci-sions. Transparency can create value in numerous ways. If you know thestatus of key resources, you can make better use of them and optimize the ongoing balance between demand and supply, boosting efficiency andproductivity and lowering costs. End-to-end visibility also can provideearly warning of potential problems and facilitate root-cause analysis whensomething goes wrong.
Flexibility
Flexibility is the modern-day hedge against uncertainty. As supply chainsbecome increasingly lean, cushions of inventory and backup resourcesused to meet unexpected demand surges or supply constraints are beingcalled into question and scrutinized carefully—they’re too costly to serveas buffers. Thus companies will find new ways to be flexible without the
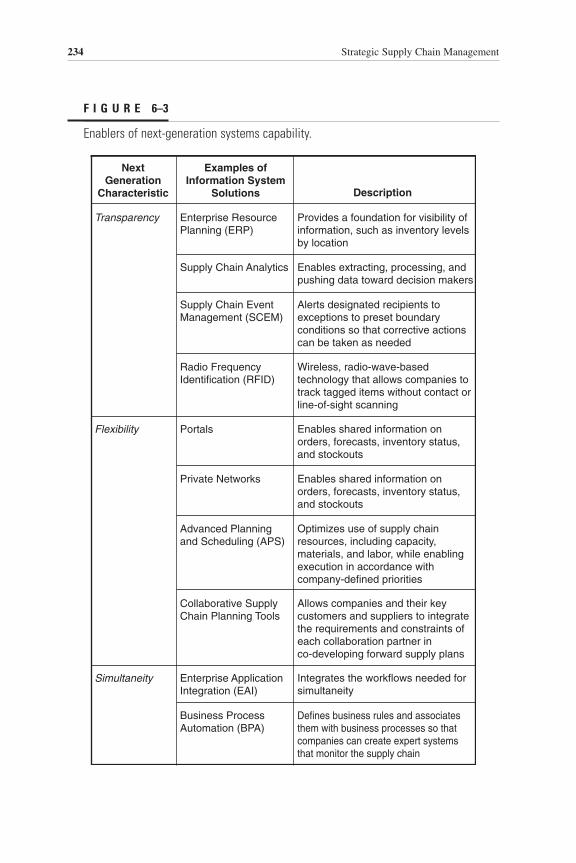
234 Strategic Supply Chain Management
F I G U R E 6–3
Enablers of next-generation systems capability.
NextGeneration
Characteristic
Transparency
Flexibility
Simultaneity
Examples ofInformation System
Solutions
Enterprise ResourcePlanning (ERP)
Supply Chain Analytics
Supply Chain EventManagement (SCEM)
Radio FrequencyIdentification (RFID)
Portals
Private Networks
Advanced Planningand Scheduling (APS)
Collaborative SupplyChain Planning Tools
Enterprise ApplicationIntegration (EAI)
Business ProcessAutomation (BPA)
Description
Provides a foundation for visibility ofinformation, such as inventory levelsby location
Enables extracting, processing, andpushing data toward decision makers
Alerts designated recipients toexceptions to preset boundaryconditions so that corrective actionscan be taken as needed
Wireless, radio-wave-basedtechnology that allows companies totrack tagged items without contact orline-of-sight scanning
Enables shared information onorders, forecasts, inventory status,and stockouts
Enables shared information onorders, forecasts, inventory status,and stockouts
Optimizes use of supply chainresources, including capacity,materials, and labor, while enablingexecution in accordance withcompany-defined priorities
Allows companies and their keycustomers and suppliers to integratethe requirements and constraints ofeach collaboration partner inco-developing forward supply plans
Integrates the workflows needed forsimultaneity
Defines business rules and associatesthem with business processes so thatcompanies can create expert systemsthat monitor the supply chain
CHAPTER 6 A Roadmap to Change 235
asset “cushions” of the past. They’ll use a combination of internal flexi-bility (e.g., highly configurable products and effective use of postpone-ment strategies), supplier flexibility, and the ability to substitute highlyaccurate information for physical inventory.
Simultaneity
Simultaneity refers to the execution of supply chain activities in parallelrather than sequentially. It results in start-to-finish transactions that can be completed quickly without further inputs, allowing greater customerresponsiveness and lower transaction costs. This means that each partici-pant has all the information needed to make decisions at the moment anevent—such as a new customer order or replenishment signal—occurs.Within the extended supply chain, this information is available both withinan enterprise and, for collaborative practices, between the organization andits trading partners.
A supply chain that is transparent, flexible, and simultaneous can substi-tute execution based on real-time requirements for the frequent planningand replanning that characterize most supply chains today, enablingincreased manufacturing responsiveness and automatic sequencing andfulfillment of customer requirements.
Why are these elements so important? For one thing, the supply chainis fast becoming a critical driver of both shareholder value and competitivedifferentiation. The pressures of global competition that exist today willincrease in the years to come, making a focus on efficiency and ongoingcost reduction essential for staying power. In addition, supply chain perfor-mance will grow in importance as a competitive differentiator as companiesbecome better at adapting their supply chain strategies and capabilities inaccordance with changing market requirements. Solid processes will be theprice of entry; superior processes will set companies apart.
We’ve noted that the next generation is all about integration—andthe innovation results in a highly integrated supply chain that can have animpact on both revenue and profitability. This means that you need tobuild your roadmap with a vision of the future in mind—and the innova-tive practices and tools that will enable this vision to become a reality.While every industry is different, we see several trends that should beincorporated in any company’s vision of the future.
As the supply chain becomes a larger contributor to both the top andthe bottom lines, activities that occur before and after a product ships will

236 Strategic Supply Chain Management
become increasingly important. In the next generation, the supply chainwill be used as a way to increase sales opportunities and enhance cus-tomer relationships before, during, and after the sale. This means thatyou’ll need to pay close attention to the front end of the supply chain—the activities associated with demand creation—and the increasingimpact of the Internet, online marketplaces, and collaborative relation-ships. And as customers focus increasingly on their total cost of owner-ship, they will look for suppliers who can extend superior supply chainexecution to their service offerings. Thus your roadmap also needs toinclude a focus on the service supply chain.
We expect that today’s trend toward outsourcing will continue to gather steam and that, in the future, companies will outsource even moreheavily in an attempt to transition as many fixed costs to variable costs aspossible. This means that effective collaboration will be even more criticalto success. Companies will need to be highly skilled at evaluating theirprospective partners and identifying those with whom a relationship willresult in the maximum economic value for each party. Logistics serviceproviders and manufacturing outsourcers will expand their skill sets, help-ing their customers increase efficiencies while reducing labor requirements.
As technologies such as Web-enabled planning and optimization toolscontinue to advance, more data will be available, and integration with sup-pliers and customers will become more straightforward. At the same time,the functionality enabled by these technologies will become more modular,“commoditized,” and widely available. This means that information systemsaren’t likely to provide the level of competitive advantage they imparted inthe past; as with robust processes, they simply will be the price of entry.
DEVELOPING A ROADMAP
To understand how to develop your roadmap for an integrated, extendedsupply chain, then, let’s revisit the steps shown in Figure 6-1 one by one.
Step 1: Set the Priorities for Change
The complexity of the supply chain—which touches numerous corporatefunctions, including product design, procurement, manufacturing, dis-tribution, and postsales support, as well as diverse, often global sales channels and external partners—makes pinpointing the right focus forimprovement efforts a challenge. Your supply chain strategy is the rightplace to start.
CHAPTER 6 A Roadmap to Change 237
Note that developing and executing toyour roadmap and addressing the core disci-plines may be somewhat iterative. As anexample, the approach you take to a certainroadmap initiative may require that you makechanges to the organization or redefine per-formance targets. However, your strategyalways should drive your roadmap, not theother way around.
Chapter 1 provides a detailed approach to developing your supplychain strategy; use the strategy to evaluate your current capabilities anddetermine any structural supply chain changes that are required to executeit. Clearly, if any basics are broken, you’ll need to fix them. Perhaps you areexperiencing specific performance problems. Or if you’ve bought or sold abusiness recently, you may have to adapt your supply chain accordingly.
To set the priorities for change, use the following principles as a guide:
◆ Use a business-driven approach.◆ Identify the type of change required.◆ Understand the interrelationships among initiatives.◆ Consider your culture and environment.
Use a Business-Driven ApproachYou need to ensure that each improvement initiative will deliver real busi-ness value. Almost invariably, a portfolio of prospective initiatives willhave total resource requirements far in excess of the resources actuallyavailable to support them—and varying opinions about what needs to bedone first.
To overcome these obstacles, define the performance objectives forkey supply chain metrics, such as on-time delivery, inventory days of sup-ply, or total supply chain management costs. As described in Chapter 5,you’ll need to look at these metrics as an interdependent set and make anynecessary trade-offs. Base these trade-offs on the primary basis of compe-tition that forms the foundation of your strategy—innovation, cost, service,or quality. Then decide on appropriate targets and performance priorities.
Next, quantify the value of reaching these targets—this may be acost saving or an improvement in customer service that will result inincreased revenue. Then, when you have determined the resource levelrequired to make the changes that will result in these benefits, you will beprepared to calculate the overall return for a specific set of initiatives. This
Your strategy alwaysshould drive yourroadmap, not theother way around.
238 Strategic Supply Chain Management
will give you an objective way to make the trade-offs necessary to maxi-mize the overall benefit to your business.
As an example, let’s look at Company X, a consumer-electronicscompany that has chosen superior customer service as its primary basis ofcompetition. For Company X, on-time delivery or fast-order fulfillmentwill be a high priority. This means that the management team shouldestablish quantitative, time-phased targets for ongoing performanceimprovement in areas such as “improve on-time delivery to commit per-formance by x percent every six months.” They’ll need to tie these objec-tives to specific initiatives designed to enhance performance. They’ll alsoneed to quantify the value of achieving these targets and balance this valueagainst the investment required to achieve it.
Identify the Type of Change RequiredBefore even considering specific initiatives for your roadmap, it’s impor-tant to have a view of the order of magnitude of change required to real-ize the value of the performance objectives. Although large investments innew processes, skill sets, or information systems may seem like prerequi-sites for significant performance improvement, they may not be the rightplace to start.
You need to fix what isn’t workingtoday before you can focus on taking majorsteps toward next-generation performance.For example, many companies own enter-prise resources planning (ERP) systems that provide them with standard materialrequirements planning (MRP) functionalitybut manage material requirements planningoffline. These same companies may look tosophisticated applications, such as advancedplanning and scheduling (APS) applica-tions, as the solution to the issues they exper-ience as a result of not having centralizedplanning data. While using MRP isn’t nec-
essarily a prerequisite to a successful APS implementation, the discipline,control, and data integrity inherent in a stable planning process are. Thismeans that these companies will need to focus first on resolving any data-quality and process-compliance issues. Layering a sophisticated infor-mation system on top of a weak process is likely to make things worse,not better.
You need to fix whatisn’t working todaybefore you can focuson taking majorsteps toward next-generationperformance.
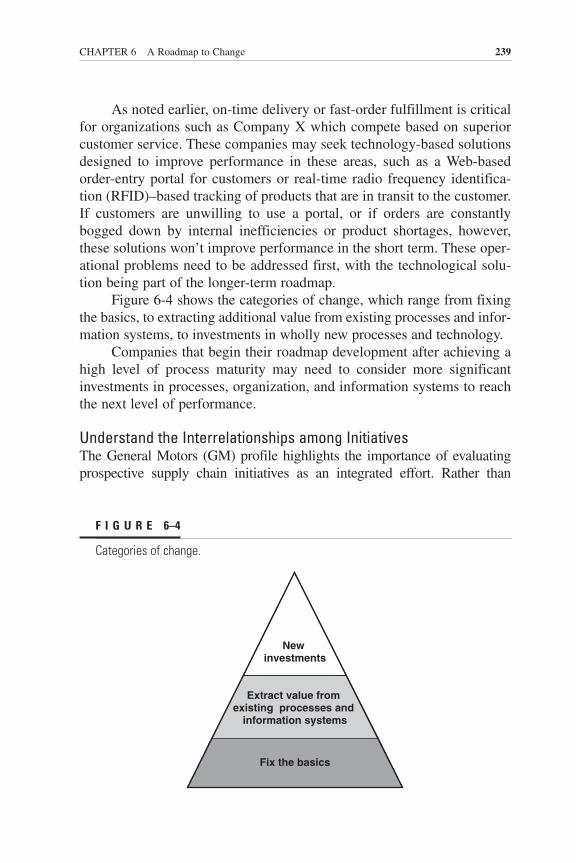
CHAPTER 6 A Roadmap to Change 239
As noted earlier, on-time delivery or fast-order fulfillment is criticalfor organizations such as Company X which compete based on superiorcustomer service. These companies may seek technology-based solutionsdesigned to improve performance in these areas, such as a Web-basedorder-entry portal for customers or real-time radio frequency identifica-tion (RFID)–based tracking of products that are in transit to the customer.If customers are unwilling to use a portal, or if orders are constantlybogged down by internal inefficiencies or product shortages, however,these solutions won’t improve performance in the short term. These oper-ational problems need to be addressed first, with the technological solu-tion being part of the longer-term roadmap.
Figure 6-4 shows the categories of change, which range from fixingthe basics, to extracting additional value from existing processes and infor-mation systems, to investments in wholly new processes and technology.
Companies that begin their roadmap development after achieving ahigh level of process maturity may need to consider more significantinvestments in processes, organization, and information systems to reachthe next level of performance.
Understand the Interrelationships among InitiativesThe General Motors (GM) profile highlights the importance of evaluatingprospective supply chain initiatives as an integrated effort. Rather than
F I G U R E 6–4
Categories of change.
New investments
Extract value from existing processes and
information systems
Fix the basics

240 Strategic Supply Chain Management
focusing on the return on investment of individual supply chain initiatives,GM looks closely at how different initiatives can work together to support itsoverall supply chain goals and analyzes which need to precede others. Thissort of approach is critical in creating a path to next-generation performance.
Consider, for instance, the interrelationship between structural-simplification and process-change initiatives. Should the physical distri-bution network be simplified before inventory management practices arechanged? Should SKU proliferation be addressed before embarking ona new approach to supply chain planning? Identifying dependencies mayreveal that initiatives previously thought to be unrelated are, in fact, onthe critical path to the success of the overall effort. You also may findthat a proposed initiative is likely to have an impact on the return of oneor more existing projects, which may lead to reprioritizing or even can-celing an in-process effort.
Continuing our example of Company X, the management team willneed to consider a number of factors that affect delivery performance.These may include
◆ Issues with the core planning processes that result in ongoingimbalances between demand and supply
◆ Internal policies that cause orders to get caught in an extensivecredit-verification process
◆ Aggressive inventory targets that cause business units to operatewith overly conservative inventory levels
◆ Skill gaps inside the organization that limit overall effectiveness◆ Conflicting performance targets that drive suboptimal behavior◆ Inconsistent performance by key partners, such as material sup-
pliers or logistics service providers
Addressing these issues requires a clear understanding of the inter-dependencies of the major activities being considered. Will a redesign of the planning process have the necessary impact if supplier delivery perfor-mance remains below acceptable levels? Do the responsible individualshave the experience and skills to define and execute the required processchanges? Are the new processes dependent on new systems capabilities?These are just a few of the questions that need to be answered as part ofdeveloping the roadmap.
Consider Your Culture and EnvironmentIncluding an initiative in your roadmap requires that you look beyond anytechnical solutions and consider the “softer” factors of your culture and

CHAPTER 6 A Roadmap to Change 241
environment. How does your organizationdeal with change? At some companies,transformation efforts are embraced. At oth-ers, past experience has created a strongmistrust of large-scale initiatives, and onlysmall steps are acceptable.
Also consider your business environ-ment. How important is improving supplychain performance relative to other businesspriorities? Can the right resources be madeavailable? Although current performancemay be well below what is dictated by your supply chain strategy, the real-ity of how your company operates may override what you view as a criti-cal initiative, and other business imperatives may claim the resourcesnecessary to execute the roadmap. If this happens, you’ll need to adjustyour ambitions accordingly.
Finally, take the stability of your organization’s management teaminto account, particularly at the most senior level. Next-generation supplychain practices have a major impact on decision making; as such, any newinitiative will be shaped by the management team’s vision of how deci-sions should be made. A lack of continuity at the executive level, espe-cially during the more difficult, early phases of implementation, maydestroy an initiative’s momentum. If this is a concern, consider delayingthe start of the roadmap execution until you are confident that you willhave the ongoing support you need.
Test your readiness to establish and manage the priorities for changeby making sure that you can answer the following questions:
◆ What are your value objectives and priorities?◆ What type of change is needed to create the value?◆ Are ongoing supply chain initiatives still appropriate, or do you
need to stop or redirect initiatives?◆ Given your environment (resources, other business priorities, poten-
tial management team turnover), what type of change is feasible?◆ Given your culture, what approach (big bang, small steps, etc.) is
most appropriate?
Step 2: Design the SolutionOnce you have consensus on your priorities, the next step is to identify thechanges needed to support your value objectives. To do this effectively,
Look beyond anytechnical solutionsand consider the“softer” factors ofyour culture andenvironment.
242 Strategic Supply Chain Management
you’ll need to be familiar with each of the remaining core disciplines—andknow how you plan to approach creation of your supply chain processarchitecture, organizational structure, a plan for collaborating with selectedsupply chain partners, and appropriate metrics.
Your solution design should focus on streamlining business processesand increasing the velocity of product and information flow. The overallobjective: delivering the business value you used to set the priorities.
Understand What’s Already ThereIn essence, the solution design describes how work will be performed inthe future. In order to get this right, you’ll need a clear understanding ofhow things work today. Start by analyzing the major supply chainprocesses that drive the critical metrics and understand the sequences of processes and events. As necessary, decompose these processes intosmaller activities. You are looking for causes of errors, non-value-addedactivity, redundancy, queuing, and any other factors that have an impacton process efficiency and effectiveness.
Let’s return to Company X, where the management team is planningan initiative focused on implementing improvements to the overall order-fulfillment process. As we saw in Chapter 5, from the customer’s perspec-tive, this process starts when a sales order is generated and stops when theproduct is received. Analysis of the current process needs to be consistentwith the customer’s viewpoint.
Company X should start by analyzing current performance and whatmetrics are being used, how they are defined, and the data sources. What isthe average order-fulfillment cycle time? What does the distribution of thedata look like? Do some orders take much longer than others? How good isthe company at making and meeting commitments? Is there a good under-standing of the causes of delays or missed commitments? Are clear targetsand accountabilities in place?
Next, the company needs to document the path orders take once theyare generated by the customer and understand exactly what happens tothem. Some of the questions to consider are: In what order are activitiesdone? Where and why does an order get “stuck”? How many people han-dle each order? Who can modify orders? Who is responsible for schedul-ing delivery and communicating with the customer? Are there any areasof rework or backtracking? Is the same activity performed more thanonce? How long does each activity take? Where is value added? Of criti-cal importance: For each of these questions, Company X must know whythe activity is performed the way it is.

CHAPTER 6 A Roadmap to Change 243
This effort is likely to uncover some issues initially thought of as onlytangentially related to delivery performance. If product-availability issuesare causing a large percentage of problems, attention needs to shift to theplanning process. What is causing the stockouts? Is there a problem withthe forecasting or demand-management process? Are suppliers failing todeliver? Is the factory having yield issues? Are the system tools being usedto balance demand and supply working properly? Is their output beinginterpreted correctly, and are the right actions being taken?
As it reviews the process, Company X also will look at the associatedorganization and the specific roles and responsibilities within it. Where arethe handoffs between functional areas? Do people understand what theyneed to do? Are they well trained? Can they think analytically about howthe process can be improved?
Company X also will need to look critically at the systems that sup-port the process and determine if there are any issues with current func-tionality. A word of caution here: In our experience, there is a commontendency to look at systems as the cause of many process problems. Quiteoften the real problem is how the systems are being used—or misused—rather than an issue with existing functionality. Or the functionality is wellsuited to the business requirements, but data-integrity issues are causingpeople to mistrust the system’s recommendations.
Develop a Vision of Where You Want to GoYour supply chain design should incorpo-rate the next-generation characteristics oftransparency, flexibility, and simultaneity.Depending on your starting point, this mayrequire major change or only minor updatesto what you are already doing. Your road-map to change doesn’t have to be a massiveundertaking.
As you design your future supply chain,ensure that it satisfies the four tests of supplychain architecture discussed in Chapter 2:strategic fit, end-to-end focus, simplicity, andintegrity. Once your process design is com-plete, you can define the organizational struc-ture required to ensure that it can be executedeffectively and efficiently. You also can identify the information systems thatwill be needed to support the process and make the necessary data available.
Your supply chaindesign shouldincorporate the next-generationcharacteristics oftransparency,flexibility, andsimultaneity.
244 Strategic Supply Chain Management
Test the strength of your solution by answering the followingquestions:
◆ Is the future process clearly defined?◆ How does the new process affect the existing process architecture,
organization, physical infrastructure, and IT?◆ Do business and IT managers agree on the nature and scope of
required changes?◆ Does the initiative meet all evaluation criteria—return on
investment, strategic alignment, business risk, and supplychain architecture rules?
◆ Are the proposed changes ambitious but achievable?◆ How will you measure success?
Step 3: Adapt the Supply Chain
The final step in managing the roadmap to change is all about imple-mentation—and ensuring that the solution is implemented in a way thatachieves your value objectives. How you adapt your supply chain willdepend on the types of initiatives you include in your roadmap, but the core disciplines provide an excellent framework for guiding yourefforts.
The most successful roadmap implementations use a phasedapproach, which minimizes risk and maximizes the likelihood of success.The phases generally include detailed design, prototyping or proof-of-concept, a controlled pilot, refinement based on the results from the pilot,and rollout. A number of work streams are needed to support these phases,including program management, change management, and value manage-ment. While it is not our intent to provide a primer on effective program-management methodologies in this book, we note that successfulimplementation requires understanding and mastering these challenges.We will touch on each briefly, focusing on specific challenges associatedwith increasing focus on collaboration and information availability.
Value ManagementThe next-generation supply chain emphasizes the value of informationand the ability to make real-time decisions far more than in the past. Thismeans that many of the changes you put in place will focus less on tangi-ble physical assets making it more difficult to measure and manage thevalue of your efforts. As an example, the value of reducing inventory days

CHAPTER 6 A Roadmap to Change 245
of supply from 150 to 100 days is relatively easy to measure. However, thevalue of increasing on-time delivery to commit from 70 to 90 percent ismuch more difficult.
Since you’ll need to monitor performance improvements at criticalmilestones, make sure that you have agreement up front on the specificmetrics definitions and on the value created by hitting certain targets.Perhaps for every percentage point in improved delivery performance youcan expect a 5 percent increase in the customer revenue stream for the lifeof the product. Or for every day you reduce your average order-fulfillmentcycle time you will realize a one-time release of cash equal to one day’srevenue, which can then be invested at your current cost of capital. Sincethe value of performance improvements will be different for every orga-nization, there is no set formula to follow—so make sure that you haveagreement up front.
Use the operational metrics you chose while designing the solutionto measure progress toward your overall business objectives, and system-atically audit value achievement after significant milestones are reached toassess whether the solution needs fine-tuning.
Program ManagementAlthough all core elements of program management—issue management,resource management, scope management, risk management, action-itemmanagement, status reporting, budgeting, and planning—are important inimplementing the roadmap to change, our experience is that managing theoverall scope of effort can be the most challenging.
Changes affecting physical assets or human resources are relativelyeasy to “see,” but the inherent complexity of the next-generation supplychain and its focus on information and decision making mean that thescope of effort will go far beyond changes to tangible resources. Andbecause the technologies that enable next-generation characteristics arestill not widely adopted, many companies don’t fully understand the chal-lenge of collecting, manipulating, and maintaining information across thesupply chain. This can lead to initiatives with unrealistic expectations andhigh rates of failure.
You can minimize “scope creep” by actively involving your supplychain architects—your business-process and IT experts who are in thebest position to understand the details of your process and applicationsarchitecture—during implementation.3 Moreover, regular programreviews help to maintain a focus on scope management and ensure that theexecutive management team approves any major scope changes.

246 Strategic Supply Chain Management
Change ManagementSince your supply chain should be evolving constantly, you need to ensurethat the culture within your organization is one that embraces frequentchange. This means that you need to understand and use basic change-management principles: managing expectations, communicating fre-quently, involving key stakeholders, identifying and managing resistanceto change, and monitoring and reporting on progress. You’ll also need toensure that this culture extends to your supply chain partners. Involvethem early and often—in team-building exercises, training programs, andprogress reporting.
Poor communication is often the culpritwhen roadmap initiatives don’t progressaccording to plan, but the next-generationsupply chain also requires new skills. As dis-cussed in Chapter 3, next-generation practiceshave a major impact on the organization, cre-ating new roles and required capabilities.These include the ability to manage collabo-rative relationships and supply chain perfor-mance and to ensure tighter integrationbetween the supply chain and other core processes, such as technology and productand service development.
Achieving these new capabilities is a key success factor, andprogress should be assessed on a regular basis. We recommend placingmanagers in their new roles even before a new supply chain solution hasbeen rolled out. And whenever possible, managers who will be taking onnew roles also should be involved even earlier in defining the parts of thesolution that relate to those roles. (See the Owens-Corning profile for anexample of role reengineering.)
IN CONCLUSION
As you develop and manage your roadmap, make performance a prior-ity. As we noted at the beginning of this chapter, companies with moremature supply chain practices already have a significant performanceadvantage. As these more advanced companies adopt next-generationpractices, the performance gap between leaders and laggards willgrow—and those with less mature supply chains likely will experiencedeclining profitability.
Poor communicationis often the culpritwhen roadmapinitiatives don’tprogress accordingto plan.

CHAPTER 6 A Roadmap to Change 247
The five disciplines provide the foundation for supply chain excel-lence and are the levers that allow your supply chain to increasingly con-tribute directly to the growth of both revenue and profit. Many companieshave already made significant progress in putting these disciplines inplace—and are reaping major benefits as a result.
Our consulting experience and our in-depth discussions with thecompanies profiled in this book show clearly that process work has to pre-cede technology enablement. The two can then work, hand in glove, tomake both quantum and incremental improvements in performance. Byfocusing on improving the five core disciplines of strategic supply chainmanagement, you’ll be prepared for the increased competitiveness, speed,and agility of next-generation supply chain management.

This page intentionally left blank.

Seagate Technology Profile: Real-Time Response to Demand
Driven by a vision of multitiered visibility and real-time demand fulfill-ment, Seagate Technology is investing heavily in technology and processimprovements and an electronically linked end-to-end supply chain.
Founded in 1979, Seagate helped fuel the information age by building thepersonal computer (PC) disc drives needed to store vast sums of data.Today, data-storage technology has evolved far beyond the PC. And as ourappetite for storage keeps on growing—driven by the Internet, consumerelectronics, and our desire for anytime, anywhere access to information—so does the need for increasingly sophisticated disc drives.
What few people realize is just how complex these products are.Seagate notes on its Web site that building disc drives is considered the“extreme sport” of the high-tech industry, involving expertise in physics,aerodynamics, fluid mechanics, information theory, magnetics, processtechnology, and many other disciplines. The company constantly strives toboost storage capacity and set new records for disc-drive performance.Besides staying ahead of the technology curve, Seagate faces a number ofunique business challenges that drive its supply chain strategy.
KEY BUSINESS CHALLENGES
Seagate’s products use components that are so complex to manufacturethat lead times can range from one month to an entire quarter. Then there’sthe geographic challenge. The component manufacturing plants are oftenfar removed from the subassembly and drive manufacturing plants.Explains Karl Chicca, senior vice president of global materials, “Everydisc drive has several hundred of these very complex parts, each of which
249
Copyright © 2005 by The McGraw-Hill Companies, Inc. Click here for terms of use.

250 Strategic Supply Chain Management
has process technologies that are literallybleeding edge, coming together from allcorners of the world, in massive quantities—we produce 15 to 20 million disc drives aquarter.” This translates into about 65 mil-lion components a day—many purchasedfrom outside suppliers—that go into discdrives that are increasingly customized tospecific customer needs. Customers rangefrom Sony and Microsoft which use Sea-
gate’s drives for consumer applications, to companies with high-end storage systems, such as EMC.
For every customer, Seagate maintains one or more just-in-time(JIT) hubs—inventory warehouses operated by a third-party logisticsprovider. These vendor-managed inventory (VMI) arrangements are theindustry norm. Each hub is stocked with anywhere from one or two todozens of different types of disc drives, depending on how broad a rangeof products the customer sells. Some of Seagate’s customers have 15 to 20 locations—and just as many JIT hubs—but they don’t pay for theinventory stocked in their hubs until they use it.
Now add the complexity of unpre-dictable demand. In this business, customerdemand is infinitely dynamic, and Seagate’sambitious goal is to ship to real-timechanges in demand—not to plans or fore-casts. This means that the company has tomonitor the economy, the high-tech indus-try, and the information-technology subsetof the industry to get a sense of which waydemand is flowing.
In the early days, a plan would hold forsix months. No more. Notes Richard Becks, vice president of e-businessand supply chain, “Looking back on almost 25 years in this business, thebiggest change has been the demand dynamic. It can’t be predicted any-more. We’ve had to migrate from a mind-set of plan-based stability to amodel of infinite flexibility and building to pure customer demand.”
Extreme product complexity, lengthy component lead times, globaloperations, high volume, dynamic demand, customized products—Seagatehas to meet these challenges as well or better than its competitors to sus-tain and build on its leadership position. The company’s supply chain playsa critical, strategic role.
Seagate produces 15to 20 million discdrives a quarterusing 65 millioncomponents a day.
Seagate’s ambitiousgoal is to ship toreal-time changes indemand—not toplans or forecasts.

SEAGATE TECHNOLOGY PROFILE: Real-Time Response to Demand 251
REAL-TIME DEMAND FULFILLMENT
Earlier in its history, Seagate focused on low-cost manufacturing andoperating to plan. But the company has evolved. Today, the focus is onbeing a technology leader, getting more innovative products to marketmore quickly, and building speed and flexibility into the organization forgreater agility—all while maintaining a sharp focus on customer satisfac-tion. Notes Chicca, “Everything we do has the fundamental premise thatit has to benefit the customer.”
Seagate’s supply chain has evolved accordingly. A cornerstone of thecompany’s supply chain strategy is meeting customer demand in real time—literally responding to customer orders as they arise. To do this successfullyand cost-effectively, Seagate has to maintain a greater degree of flexibility inits factories and lower levels of inventory overall. The key is informationflow, and that’s been a critical focus of the company’s supply chain efforts.
Seagate acquired a jumble of dissimilar processes and informationsystems in its early years as it grew through acquisition. For the last fiveyears, making processes, systems, applications, and databases consistentthroughout the company has been a top priority. For example, the com-pany had several engineering-change control tools to manage productconfigurations. Now Seagate has just one worldwide system—Metaphasefrom EDS. The company also consolidated nine enterprise resources plan-ning (ERP) systems from Oracle into two worldwide systems and eventu-ally will move to a single system. This effort to consolidate and standardizeis paying dividends now. Information is flowing more freely throughoutthe supply chain because it no longer has to be reworked or reenteredmanually. And integrated systems give the company a clear view intoevery aspect of operations—a must for real-time demand fulfillment.
“Electronic connectivity gives us visibility up and down the supplychain, so we don’t have to generate new capacity every time there’s a requestfor more product,” says Chicca. “We understand what our capability to flexreally is, and we can commit to the customer very quickly.” Responding tocustomer requests used to take a week orlonger. Now it takes about a day to informcustomers if and when they’ll get product.Seagate’s goal is to commit on the spot.
END-TO-END CONNECTIVITY
Seagate’s customers and suppliers arelinked electronically to its internal network.
Responding tocustomer requestsused to take about aweek. Now it takesabout a day.
252 Strategic Supply Chain Management
When a customer pulls a drive from the JIT hub, that pull sends a signalback to the factory and triggers two things: an automatic shipment requestto replenish the drive or drives that have been pulled and an automaticorder to the manufacturing line to start additional drives to backfill theones used. Seagate’s automatic response to real demand allows the com-pany to maintain lower levels of inventory, while industry competitors stillshoulder the cost of loading up the JIT hubs. Seagate’s annual inventoryturns have nearly doubled, going from 8 per year to 15.
But it doesn’t stop there. Those pull signals are also conveyedupstream to Seagate’s internal subassembly and component manufactur-ing plants and to external suppliers. Seagate’s internal subassembly plantsuse the same JIT hub processes that are required of external suppliers andstock inventory ahead of the downstream factories that use the inventory.These internal hubs are continually resized to accommodate actual cus-tomer demand.
By integrating electronically with its factories and suppliers, Seagateeliminates the touch points that slow things down and lead to errors. Over160 suppliers are connected, with a direct view to Seagate’s daily con-sumption rates. The suppliers can track changes in demand over time, ana-lyze consumption rates, and start to make better use of their own capacity.To make this work, Seagate partnered with e2open to set up a business-to-business (B2B) supply chain hub to communicate real-time demand andimmediate supplier acknowledgment. e2open worked with suppliers thatalready used electronic data interchange (EDI) to translate their feedbackinto the RosettaNet signals that Seagate uses. During this transition, Seagatebecame one of the world’s largest RosettaNet implementations, sendingsupply and demand information to all its direct materials suppliers.
Unlike a few years ago when EDI put this level of connectivity outof reach for many suppliers, the Internet has leveled the playing field—everyone can access the World Wide Web. e2open provided an Internet-based application that any supplier with a Web browser can use. Thisallowed even small suppliers with limited information technology capa-bilities to have the same visibility as larger, more sophisticated suppliers.
The suppliers that adopted the Web-based system are very pleasedwith the results. Now they’re looking for the next level of integration,where the unfiltered demand goes directly into their planning systems sothat they can respond even more quickly to Seagate’s needs. To this end,e2open is developing a low-cost B2B server appliance with integrationsoftware premapped and loaded for most of the popular ERP systems in use today. This server appliance will sit behind a supplier’s firewall.

SEAGATE TECHNOLOGY PROFILE: Real-Time Response to Demand 253
Seagate sees this as a major opportunity to cut costs both internally andexternally while increasing the speed and accuracy of information flowingup and down the supply chain.
Linking with suppliers also gives Seagate a better idea of where itsorders are in the queue. This information is especially critical when suppli-ers have long lead times, such as semiconductor manufacturers. Seagate canget a better view into their processes and immediate updates on order status.
VISIBILITY—THE HOLY GRAIL
This multitiered visibility—the ability to see up and down the supplychain—is a critical component of Seagate’s supply chain strategy. It’s alsothe “Holy Grail” for many of Seagate’s customers that have outsourcedproduction to contract manufacturers. These customers have less controlover their supply chain as a result and fear that scarce components may goto their competitors.
Seagate is extending the concept of multitiered visibility beyond itsimmediate suppliers, as reflected in its dealings with providers of appli-cation-specific integrated circuit (ASIC) semiconductors, for instance.Once vertically integrated, ASIC suppliers could no longer afford to main-tain their manufacturing facilities, so the companies sold their plants andoutsourced production to major subcontractors. Seagate is now in theposition of placing orders and forecast demands with suppliers that aren’tactually manufacturing the parts—and through multiple levels of subcon-tractors. The wafers may be built in Taiwan, for instance, sent to Korea fortesting, and then shipped to Singapore for packaging and final testingbefore going back to the original semiconductor company for shipment to Seagate.
To deal with this added layer of complexity, Seagate is working on aprocess for gaining visibility into these subcontractors. The company ispiloting a project that dives deep into a supplier’s supply chain. And then itis tying that process all the way through to one of Seagate’s end customersfor true end-to-end multitiered visibility. The bottom line of multitiered visibility, both upstream and downstream, is better capacity utilizationthroughout the supply chain.
VERTICAL INTEGRATION
Gaining visibility into subcontractors is one way that Seagate manages therisks inherent in an extended supply chain. But the company also maintains
254 Strategic Supply Chain Management
control through vertical integration—a maverick approach among indus-try players.
The industry trend has been to disaggregate, outsource, and get lean.Bucking that trend, Seagate adopted a vertically integrated model, whichmany observers thought was unwise. The benefits of breadth, control, andflexibility seem to work to Seagate’s advantage. The company’s competi-tors can’t always be sure they’ll get the critical components they needwhen they need them, and any change order triggers a negotiation processand a series of requests that has to trickle down through many layers. Bycontrast, Seagate can move more quickly on behalf of the customer andbelieves that developing component technology in-house gives the com-pany an edge, given the technical complexity of its products. Seagate cancodevelop and codesign each component and the respective process tech-nologies instead of buying components from a variety of vendors and cob-bling them together. Today, Seagate manufactures many of its high-cost/high-complexity components in-house.
Vertical integration doesn’t come cheap, though. The barriers toentry are huge, given the capital needed for technology development andto produce components and drives. Seagate spends $700 million a yearon research and development and $600 million in capital—far more thanits non-vertically-integrated competitors. This investment pays hand-some dividends. Customers are willing to pay a premium for Seagate’shigh-performance disc drives while the company’s competitors race tocatch up.
CHANGE-MANAGEMENT CHALLENGES
Although Seagate’s supply chain efforts have delivered substantial bene-fits, managing change has been a challenge, both internally and externally.Altering decades-old attitudes takes time and effort. Not surprisingly, cus-tomers and suppliers didn’t embrace the changes Seagate introducedimmediately. Customers were used to the security of a fully stocked JIThub, even if it was a false sense of security. The drives in stock weren’tnecessarily the drives they’d need. And those safety cushions of inventorywere driving up costs throughout the supply chain.
Seagate’s value proposition was a strong one: Let us cut the inven-tory levels of your JIT hubs, and we’ll actually be more responsive tochanges in your demand—we’ll have the capacity in reserve to meet yourneeds as they arise. To further support this effort, Seagate has investedheavily in a “factory of the future” alliance—fully automated drive assem-
SEAGATE TECHNOLOGY PROFILE: Real-Time Response to Demand 255
bly lines that also are so flexible that any drive can be built on any line at any time.
The education process is ongoing. Some customers get it. Others justwon’t hear of it, especially those with conflicting incentive systems. If acustomer’s procurement people aren’t measured against excess inventoryor total cost of ownership—even in a VMI/JIT system—they’ll want asmuch inventory as they can get. Today, even Seagate’s most hardened crit-ics acknowledge a night-and-day difference between current service andthat of five years ago. “They’d much rather have today’s supply chain ser-vicing them than yesterday’s,” notes Becks.
Suppliers also were reluctant to change their old ways of operating.Before coming on board, they suspected that Seagate was just passing costson to them. In the late 1990s, VMI had begun to spread throughout theindustry, and the suppliers were getting pressure from all sides. Their firstreaction was that it would not be good for their business. But Seagate’svalue proposition was that if suppliers would agree to link up electronicallyand share information on order status, Seagate would be completely openwith them on consumption. This is critical information for suppliers, espe-cially in times of constraint, when many buyers start to double-book.Explains Becks, “I can look those suppliers in the eye and say, ‘Look, Idon’t have the ability to waste your capacity by double-booking you—you’ve got online visibility in real time to what we’re actually consuming.’The suppliers love this.”
Industry observers have commented on the “new” discipline in theelectronics industry today, notes Becks, but it’s not really more discipline—it’s more visibility. He explains, “When everyone switched to VMI, sup-pliers got a better sense of consumption, of what the customer was reallyusing, as opposed to just delivering pallets of parts—only to be surprised byunexpected demand once those pallets ran out.”
NEW REWARD SYSTEM
Changing internal attitudes and behaviors has been equally challenging.Seagate is in the process of putting in place new reward systems that bet-ter align with its new ways of working. The company’s old “build to fore-cast” incentives rewarded plant managers for using capacity to its fullestextent. Now Seagate realizes that running capital equipment or a plant “fullout” actually wastes capacity if the product it’s building isn’t what the customer really needs. The result is high levels of inventory waiting for cus-tomer demand. This hurts Seagate in two ways. First, an oversupply of

256 Strategic Supply Chain Management
finished goods inventory can quickly cause price erosion. And second, if acustomer comes along with a real order and capacity is unavailable, thenthere’s the opportunity cost of wasted capacity.
At Seagate today, success is more often defined as changing the manufacturing line many times and getting lower scores on capacity utilization—but better scores on meeting customer demand and reducinginventory levels. The key is to balance immediate customer demand withforecasted demand that’s expected, validated, and underpinned with a salescommitment but hasn’t yet arrived. It’s a trade-off. Sometimes it makessense to prepare for expected spikes in demand; other times it makes senseto wait to see the demand first.
Seagate knows that it can’t truly anticipate changes in demand orbuild to plan. Instead, by electronically linking to its customers and suppli-ers, the company can sense and respond to real demand based on actual pullrates and tee up suppliers to restock inventory based on actual consumption.This makes Seagate’s supply chain very opportunistic and nimble.
AN EVOLVING SUPPLY CHAIN
To make sure that Seagate’s supply chain strategy stays aligned with thecompany’s business strategy, Becks’s team chairs a monthly meeting ofsenior-level supply chain sponsors and project team members. Meetingparticipants review the status of all supply chain projects that are under-way and recalibrate those efforts as needed to align them with changes inbusiness direction or new customer requests. Seagate has already investedabout $5 million in supply chain improvements—a reflection of the com-pany’s commitment to supply chain excellence.
The company typically tracks about 30 supply chain projects at anygiven time. One major new initiative is enterprise planning, which willimprove data accuracy and integration among functions and processes,eliminating data silos and separate functional plans. The goal is that whena customer calls and wants to double its order on one disc model and cutanother order in half, the order-management group will be able to committo the order immediately but also calculate the impact on revenue, margin,and capacity utilization throughout the company.
Seagate often puts in place one building block of its supply chainarchitecture and then monitors how well it works out. If a better solutioncomes along that delivers more flexibility, responsiveness, or value, thecompany doesn’t hesitate to rethink its first approach and deploy the newsolution.

SEAGATE TECHNOLOGY PROFILE: Real-Time Response to Demand 257
Like its business, Seagate’s supply chain is flexible, agile, and evolv-ing constantly. What doesn’t change, though, is the company’s view of its supply chain as a key source of competitive advantage—one well worththe ongoing investment.

This page intentionally left blank.
A A P P E N D I X
Source and Methodologyfor Benchmarking Data
259
The benchmarking data presented in this book are sourced from ThePerformance Measurement Group, LLC (PMG), a subsidiary of PRTM.
PMG maintains a repository of company-confidential supply-chaininformation dating back to 1995. Companies that access this database arerequired to complete extensive surveys of their supply chain perfor-mance, practices, and information-technology (IT) usage. They can thencompare their performance against benchmarks derived from the perfor-mance of a selected population of companies in the database. This pro-vides them with a basis in fact for assessment, highlights differences inpractices, and helps them to understand which practices will help themimprove performance.
PMG conducts analysis on an ongoing basis to determine trends indominant and emerging practices, supply chain strategy, and performancelevels for key supply chain metrics.
The metrics used in this book were chosen because they show the levelof performance gains that can be obtained from better practices and systemsand what supply chain performance is considered significantly better thanaverage, as well as what is considered best overall. To accomplish theseobjectives, PMG explored the link between supply chain practices andfinancial performance, developed an aggregate measure of supply chain
Copyright © 2005 by The McGraw-Hill Companies, Inc. Click here for terms of use.
260 Strategic Supply Chain Management
performance, and evaluated various segments of the population according tothis measure. PMG calculated customer-facing and internal benchmarks ofsupply chain performance across populations of companies in similar indus-tries; these are referenced throughout this book.
THE DATABASE POPULATION
A small subset of PMG’s overall database was selected for analysis basedon surveys submitted during 2001 and 2002, except where historical dataare used to show a trend or where single-calendar-year data are used toshow even more current performance levels. In most cases, broad cuts ofthe database—for example, groups of industries—are used. The bench-marks provided throughout the book are based on a robust set of compa-nies that have similar demographics and business characteristics (e.g.,industry segment, company size, etc.), allowing for a highly reliable data source.
PMG focused on the high-level findings (e.g., SCOR level 1 metricsor practice elements) and aggregated analysis rather than on more detailedanalysis, which is valuable but better suited for supply chain topics morenarrow than those addressed in this book.
WHAT’S BEST IN CLASS?
Best in class (BIC) denotes a superior level of performance in a particulararea. PMG defines BIC as the average of the top quintile of a population.For example, in a population of 20 survey responses on inventory levels,the BIC level is defined as the average of the four lowest numbers; forinventory turns, on the other hand, it would be the four highest numbers.For a normal distribution, where about two-thirds of the population fallswithin one standard deviation, this means that more than 90 percent of theresponses fall below the BIC performance level.
This definition can be applied to the majority of quantitative andmany qualitative practice-assessment questions, where a certain practice isrecognized as superior to others. In addition to the simple example justgiven, best-in-class analysis can be used to provide insight into the rangeof operational performance levels associated with a particular strategy,practice, or financial result. For example, in an industry population of com-panies that have BIC delivery performance, we can see which manufactur-ing strategy and IT-enabled delivery practices are dominant. For companiesthat have BIC performance across a set of metrics, we can see what profitmargin is achieved relative to other companies in their industry.
APPENDIX A Source and Methodology for Benchmarking Data 261
There are many survey questions where the BIC definition cannot beapplied. Some examples include those related to demographics (e.g., num-ber of locations) or business characteristics (e.g., percentage of sales byregion) that do not represent relative performance and for which BIC isnot applicable.
While the BIC performance level provides a useful measure of the toplevel of performance represented by the best 20 percent of respondents fora given metric, the BIC levels across a set of metrics do not represent theperformance of any one set of companies. For example, for a population of20 companies in the chemical industry that primarily use a make-to-stockmanufacturing strategy, the four companies that have the best delivery per-formance may not be the same four companies that have the best inventoryperformance. Because virtually no company is best in all metrics, PMGcreated an index consisting of several different supply chain metrics. Thisbest-in-class company (BICC) index provides a method for sorting the“high performer” companies from the “typical performer” or “low per-former” companies and enables comparisons among subpopulations.
ENSURING “QUALITY” BENCHMARKS
To be effective, a benchmark must have a precise definition that can beapplied consistently across companies. For quantitative metrics, this meansa clear description of the formula and the data sources. For qualitative prac-tice measures, this means a detailed characterization of practices, includingIT-enabled functions, and a rule to clarify how consistently the practice isused in the organization.
Quality benchmarks are rooted in the age-old saying, “An apples toapples comparison.” PMG provides support and logical estimation tech-niques to participants during data collection and validates all survey sub-missions prior to creating benchmarks. Quality benchmarks are maintainedby screening out data that are extreme outliers relative to the population,requiring a certain minimum number of data points, and updating thebenchmarks on a regular basis based on the latest survey submissions.
Confidentiality of company-specific data is ensured by disclosingonly benchmarks, rather than individual company data, for use in com-parisons with the database. The vast majority of companies consider mea-sures of their internal operations and business-unit financial performanceto be confidential. Contractual obligations between participating compa-nies and PMG prohibit the disclosure of company-specific survey infor-mation, and PMG limits the disclosure of the names of companies in thedatabase to companies that are interested in using the database.

262 Strategic Supply Chain Management
POPULATION DEMOGRAPHICS AND SCOPE OF SURVEY
PMG’s supply chain database contains several surveys that address anorganization’s supply chain activities at various levels, for example, sur-veys that focus on reverse logistics and repair operations or supply chainplanning practices and performance. For both the analysis of BICC andthe analysis of supply chain maturity (see Appendix B for a definition ofstages of process maturity), we selected companies that had fully com-pleted PMG’s supply chain performance scorecard survey during 2002.
This survey assesses quantitative performance based on the calen-dar year 2001 and dominant (2001) and emerging (projected for 2003)supply chain practices. The population consists of 89 organizations from65 companies. The industry distribution reflects PMG’s participant base,which is largely high tech (44 percent), followed by consumer goods (30percent), with the remaining from process industries such as chemicalsand pharmaceuticals (see Figure A-1). These organizations employ a var-iety of manufacturing strategies. More than half the companies use maketo stock as their primary manufacturing strategy, and more than a quarteruse make to order (see Figure A-2).
F I G U R E A–1
Industry distribution.
Computers 9%
Electronic Equipment 15%
Telecom Equipment 11%
A&D, Ind., Auto 6%
Med. Dev. & Equip. 3%Consumer Goods 30%
Semiconductors 6%
Chemicals & Applied Materials 18%
Pharmaceuticals 2%
High Tech = 44%
Process = 26%
Consumer Goods = 30%
Number of Businesses / Data Sets = 89
© Copyright 2004 The Performance Measurement Group, LLC

APPENDIX A Source and Methodology for Benchmarking Data 263
Quantitative performance is assessed using a detailed questionnairethat covers a set of SCOR-compliant metrics, as well as other questionsdesigned to assess supply chain performance. High-level metrics such asdelivery performance or cash-to-cash cycle time (SCOR level 1) are calcu-lated based on responses to more detailed questions. For example, deliveryperformance to commit is calculated based on the number of orders deliv-ered on time to the customer request date divided by the total number oforders delivered. More detailed metrics such as materials acquisition costare collected using detailed definitions that break out all the various components (e.g., inbound freight and duty cost, a SCOR level 3 measure).
The quantitative part of the survey also includes questions that pro-vide further insight into supply chain operations, for example, number ofweeks of firm forecast needed in advance of ship date window, as well asquestions that assess processing of product returns and repairs.
Qualitative performance is assessed using more than 270 questions thatcharacterize supply chain practices in four areas: plan, source, make, anddeliver, as well as a number of questions that address overall supply chain
F I G U R E A–2
Primary manufacturing strategy.
Make toStock 56%
Configure to Order 15%
Make to Order 27%
Engineer to Order 2%
Number of Businesses / Data Sets = 89
© Copyright 2004 The Performance Measurement Group, LLC

264 Strategic Supply Chain Management
practices. Participating companies characterize both their dominant andemerging practices. This question set is used to characterize companies bystage of maturity.
CRITERIA FOR SELECTION OF BICCs
The BICC index was developed by selecting a small set of four ofSCOR level 1 metrics (see Appendix C and Chapter 2). Based on anevaluation of the rationale for each metric, these metrics were selectedto provide a representation of both customer-facing and internal-facingmetrics.
◆ Upside production flexibility was selected based on the assump-tion that companies with more flexible manufacturing capacityare better able to respond rapidly to and take advantage ofchanges in market conditions.
◆ Delivery performance to commit date was selected because com-panies have more influence over their performance that theycommit to than they do over delivery performance to request,which varies considerably based on market demand, stability ofsupply, manufacturing strategy, and demand patterns.
◆ Cash-to-cash cycle time was selected for its comprehensive viewof payables, receivables, and inventory levels.
◆ Despite being a component of cash-to-cash, inventory days ofsupply also was selected because it is such a widely used supplychain metric.
These choices are not meant to imply that these are the only metricsappropriate for measuring overall supply chain performance. The traditionaland still widely used net asset turns metric was not selected because it isinfluenced by the company’s choice of capital structure (i.e., short- and long-term debt-to-asset ratio). Similarly, order-fulfillment lead time was avoidedbecause a large part of its variation can be attributed to primary manufactur-ing strategy. Total supply-chain management cost was considered, but thisalso was dropped because the companies with the lowest total supply chainmanagement cost may not reflect the best supply chain performance (e.g.,low materials acquisition, order management, and inventory managementcosts often are the result of spending on supply chain systems or a company’soutsourcing strategy). Other level 1 metrics, such as assert turns, were notincluded because they are considered to be dependent on other metrics.
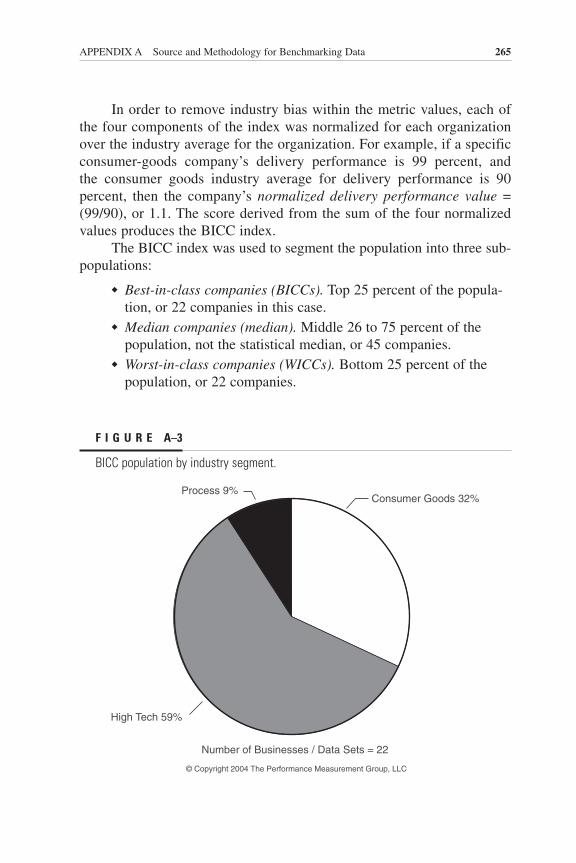
APPENDIX A Source and Methodology for Benchmarking Data 265
In order to remove industry bias within the metric values, each ofthe four components of the index was normalized for each organizationover the industry average for the organization. For example, if a specificconsumer-goods company’s delivery performance is 99 percent, and the consumer goods industry average for delivery performance is 90 percent, then the company’s normalized delivery performance value =(99/90), or 1.1. The score derived from the sum of the four normalizedvalues produces the BICC index.
The BICC index was used to segment the population into three sub-populations:
◆ Best-in-class companies (BICCs). Top 25 percent of the popula-tion, or 22 companies in this case.
◆ Median companies (median). Middle 26 to 75 percent of thepopulation, not the statistical median, or 45 companies.
◆ Worst-in-class companies (WICCs). Bottom 25 percent of thepopulation, or 22 companies.
F I G U R E A–3
BICC population by industry segment.
Consumer Goods 32%
High Tech 59%
Process 9%
Number of Businesses / Data Sets = 22
© Copyright 2004 The Performance Measurement Group, LLC

266 Strategic Supply Chain Management
Within these three groups we evaluated financial measures of over-all business success, such as profitability, supply chain practice maturity,and a variety of measures of supply chain performance. Our hypothesiswas that companies with better supply chain performance would havemore mature practices and better financial results. While we were not sur-prised to find this correlation—it has been apparent in analyzing variousaspects of the database over the years—the magnitude of the discrepancyamong these three populations is compelling.
The bottom line is that the BICCs have better financial results thantheir industry peers. (See Figure A-3 for the breakdown of BICC popula-tion by industry segment.) Operating with more advanced supply chainpractices and lower supply chain management costs, these companieshave higher profit margins. BICCs have 40 percent higher profits than themedian companies in their industry. The lowest-quartile or WICCs had 60percent lower profits than the median companies. In a high-margin indus-try segment, this could be a 14 percent profit for BICCs versus a 4 percentprofit for WICCs. In a low-margin industry segment, it could mean thedifference between making good margin and losing money.
RESULTS FOR SUPPLY CHAIN PRACTICE MATURITY
Evaluation of supply chain practices and IT shows that the BICCs are moreclosely integrated with suppliers and customers. The overwhelming major-ity (19 of 22) of BICCs were mature stage 2 or higher, whereas 40 percentof the rest of the population was still trying to figure out how to transitionaway from the more traditional, functionally focused processes. While theBICCs used a variety of more advanced practices, the differences in prac-tices were most pronounced in the plan and source areas and in their strat-egy practices, including overall supply chain strategy, planning strategy,sourcing strategy, and manufacturing strategy (see Figure A-4).
RESULTS FOR SUPPLY CHAIN PERFORMANCE
BICCs were about 10 to 20 percent better than the population medianon the majority of all metrics, and WICCs were 15 to 50 percent lowerthan the median (see Figure A-5).
BICCs schedule a higher percentage of orders to customer requestdate and are more likely to deliver the goods on the committed date. Theyhave slightly higher forecast accuracy, in terms of the number of unitsrequired and of the sales price for the units sold (see Figure A-6). Because our selection criteria for BICCs included inventory days of supply, it is not surprising that BICCs have lower inventory levels, but it
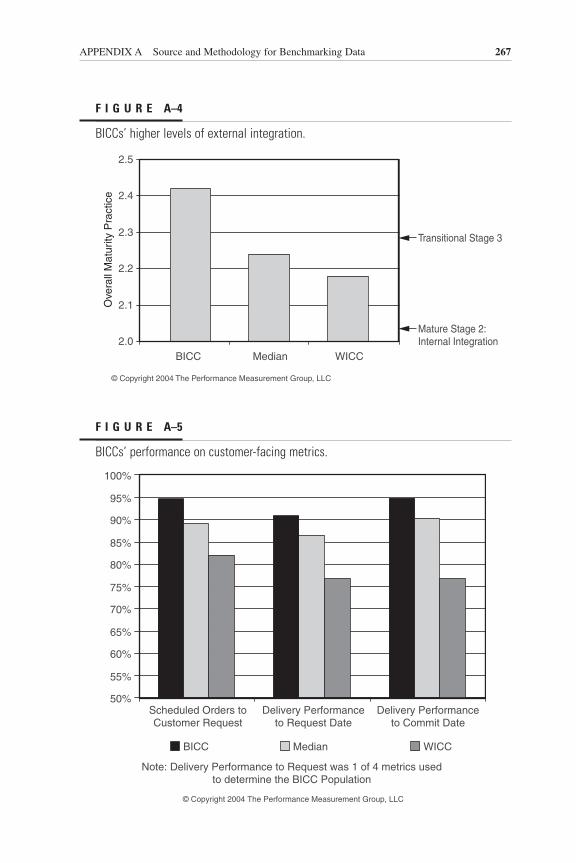
APPENDIX A Source and Methodology for Benchmarking Data 267
F I G U R E A–4
BICCs’ higher levels of external integration.
2.0
2.1
2.2
2.3
2.4
2.5
BICC Median WICC
Mature Stage 2:Internal Integration
Transitional Stage 3
© Copyright 2004 The Performance Measurement Group, LLC
Ove
rall
Mat
urity
Pra
ctic
e
F I G U R E A–5
BICCs’ performance on customer-facing metrics.
50%
55%
60%
65%
70%
75%
80%
85%
90%
95%
100%
Scheduled Orders toCustomer Request
Delivery Performanceto Request Date
Delivery Performanceto Commit Date
BICC Median WICC
Note: Delivery Performance to Request was 1 of 4 metrics used to determine the BICC Population
© Copyright 2004 The Performance Measurement Group, LLC

268 Strategic Supply Chain Management
is notable that a greater portion of their inventory is in finished goods,whereas a smaller portion is tied up in raw materials and work in progress(WIP). The BICCs are operating with only about one month of inventoryversus two to three months for other companies (see Figure A-7).
BICCs also are able to respond to increases in demand by obtaininglabor, materials, or manufacturing capacity needed to react to a 20 percentunforeseen increase in demand within about 3 weeks, compared withabout 8 to 10 weeks for the other companies (see Figure A-8).
By definition, significantly lower inventory days of supply arehighly correlated with lower cash-to-cash cycle time, which represents thedays of inventory plus days of receivables net days of payables. Somewhatshorter cash-collection and accounts-payable cycles translate to about 3weeks for cash-to-cash cycle time for BICCs versus 9 weeks for mediancompanies and more than 16 weeks for WICCs (see Figure A-9).
In addition to lower inventory financing costs, BICCs showed lowersupply chain management costs. While the percentage of revenue spent on supply chain IT assessments and supply chain-related finance and
F I G U R E A–6
BICCs’ higher forecast accuracy.
70%
72%
74%
76%
78%
80%
82%
Unit Dollar
BICC Median WICC
© Copyright 2004 The Performance Measurement Group, LLC

APPENDIX A Source and Methodology for Benchmarking Data 269
F I G U R E A–7
BICCs’ performance on days of supply.
0
20
40
60
80
100
120
BICC Median WICC
Day
s of
Sup
ply
© Copyright 2004 The Performance Measurement Group, LLC
F I G U R E A–8
BICCs’ performance on upside production flexibility.
0
10
20
30
40
50
60
70
80
BICC Median WICC
Days
Note: Upside production flexibility was 1 of 4 metrics used to determine the BICC population
© Copyright 2004 The Performance Measurement Group, LLC

270 Strategic Supply Chain Management
planning costs is only slightly lower for BICCs than for other companies,spending on order management, materials acquisition, and inventory man-agement is significantly lower.
Overall supply chain management costs are 9 to 11 percent for mostcompanies, whereas for the BICCs the range is 8 to 10 percent (see FigureA-10). These companies demonstrate better asset turnover, with BICCs atbetter than 4 net asset turns compared with 3 for the median companiesand less than 2.5 for the WICCs. While there could be some industry-specific drivers or more systematic reasons for this result (e.g., inventorylevels are a component of assets), it is notable that BICCs with good deliv-ery performance and upside production flexibility also generated a higherlevel of sales on net assets (see Figure A-11).
F I G U R E A–9
BICCs’ cash-to-cash cycle time.
0
20
40
60
80
100
120
140
BICC Median WICC
Days
Note: Cash-to-Cash cycle time was 1 of 4 metrics used to determine the BICC population
© Copyright 2004 The Performance Measurement Group, LLC

APPENDIX A Source and Methodology for Benchmarking Data 271
F I G U R E A–10
BICCs’ supply chain management cost.
F I G U R E A–11
BICCs’ net asset turns.
0%
20%
40%
60%
80%
100%
120%
140%
BICC Median WICC
Per
cent
age
of In
dust
ry A
vera
ge
© Copyright 2004 The Performance Measurement Group, LLC
0.0
0.5
1.0
1.5
2.0
2.5
3.0
3.5
4.0
4.5
BICC Median WICC
Turns
© Copyright 2004 The Performance Measurement Group, LLC

This page intentionally left blank.

BA P P E N D I X
The Supply Chain Maturity Model
273
Using knowledge gained from more than a decade of supply chain bench-marking experience and field knowledge of current and emerging prac-tices across both process and discrete industries, The PerformanceMeasurement Group (PMG) and PRTM jointly conducted the supplychain practice and information technology (IT) assessment that formedthe basis for development of the Supply Chain Maturity Model in 2000.The model is used to assess the stage of capability for each of fourprocesses defined by the Supply-Chain Operations Reference-model(SCOR)—plan, source, make, and deliver—and for what we classify as“overall” supply chain management practices that govern the strategy andlink the processes together. The model also evaluates the extent to whichIT enables richer practices and cross-enterprise collaboration in supplychain management.
PMG conducts analyses of practices by industry segment, correla-tions between practice and performance, and distribution of changes inpractices over time each year. The findings from the first analysis, con-ducted in late 2001, showed that process maturity was positively corre-lated with supply chain performance, profitability, and sales growth. In2002, the questions in the assessment were refined and expanded.
Copyright © 2005 by The McGraw-Hill Companies, Inc. Click here for terms of use.
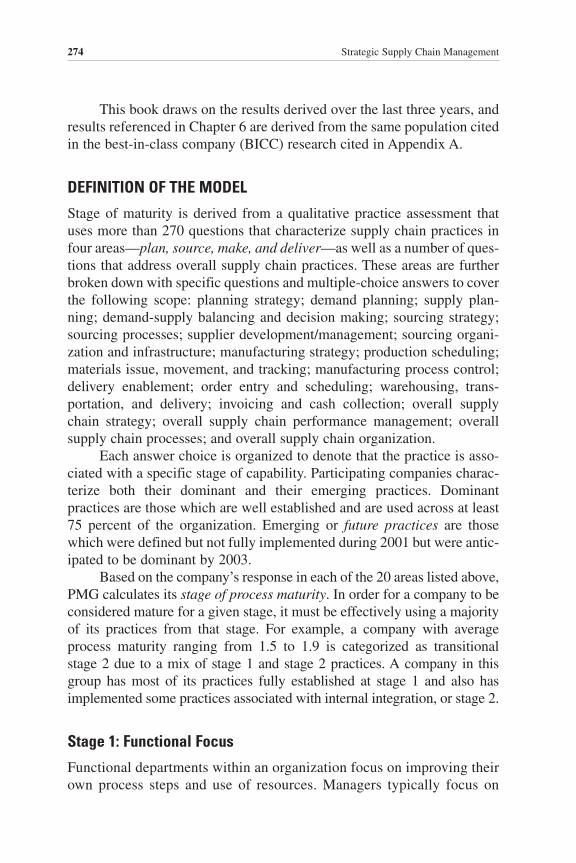
274 Strategic Supply Chain Management
This book draws on the results derived over the last three years, andresults referenced in Chapter 6 are derived from the same population citedin the best-in-class company (BICC) research cited in Appendix A.
DEFINITION OF THE MODEL
Stage of maturity is derived from a qualitative practice assessment thatuses more than 270 questions that characterize supply chain practices infour areas—plan, source, make, and deliver—as well as a number of ques-tions that address overall supply chain practices. These areas are furtherbroken down with specific questions and multiple-choice answers to coverthe following scope: planning strategy; demand planning; supply plan-ning; demand-supply balancing and decision making; sourcing strategy;sourcing processes; supplier development/management; sourcing organi-zation and infrastructure; manufacturing strategy; production scheduling;materials issue, movement, and tracking; manufacturing process control;delivery enablement; order entry and scheduling; warehousing, trans-portation, and delivery; invoicing and cash collection; overall supplychain strategy; overall supply chain performance management; overallsupply chain processes; and overall supply chain organization.
Each answer choice is organized to denote that the practice is asso-ciated with a specific stage of capability. Participating companies charac-terize both their dominant and their emerging practices. Dominantpractices are those which are well established and are used across at least75 percent of the organization. Emerging or future practices are thosewhich were defined but not fully implemented during 2001 but were antic-ipated to be dominant by 2003.
Based on the company’s response in each of the 20 areas listed above,PMG calculates its stage of process maturity. In order for a company to beconsidered mature for a given stage, it must be effectively using a majorityof its practices from that stage. For example, a company with averageprocess maturity ranging from 1.5 to 1.9 is categorized as transitional stage 2 due to a mix of stage 1 and stage 2 practices. A company in thisgroup has most of its practices fully established at stage 1 and also hasimplemented some practices associated with internal integration, or stage 2.
Stage 1: Functional Focus
Functional departments within an organization focus on improving theirown process steps and use of resources. Managers typically focus on
APPENDIX B The Supply Chain Maturity Model 275
their individual department’s costs and functional performance. Processesthat cut across multiple functions or divisions are not well understood,resulting in limited effectiveness of complex supply chain processes.
Stage 2: Internal Integration
Division- or companywide processes are now defined, allowing individualfunctions to understand their roles in complex supply chain processes.Cross-functional performance measures are clearly defined, and individ-ual functions are held accountable for their contributions to overall oper-ational performance. Resource requirements typically are balanced acrossthe organization. A well-defined demand-supply balancing process thatcombines forecasting and planning with sourcing and manufacturing isevident at this stage.
Stage 3: External Integration
Stage 2 practices are now extended to the points of interface with cus-tomers and suppliers. The company has identified strategic customers andsuppliers, as well as the key information it needs from them in order tosupport its business processes. Joint service agreements (JSAs) and score-card practices are used, and corrective actions are taken when perfor-mance falls below expectations.
Stage 4: Cross-Enterprise Collaboration
Customers and suppliers work to define a mutually beneficial strategy andset real-time performance targets. IT now automates the integration of thebusiness processes across these enterprises in support of an explicit supplychain strategy.
See Figure B-1 for a list of the practices for plan, source, make, anddeliver under the four stages.
SELECTED RESULTS OF SUPPLY CHAIN MATURITY ANALYSIS
PMG’s analysis found that the study population defined in Appendix 1was distributed largely between transitional stage 2 and stage 3. More thana third (36.6 percent) had dominant practices associated with mature stage 2, internal integration, showing an average stage of 2.3. Another third(34.1 percent) was in the process of transitioning to stage 3 and beyond.
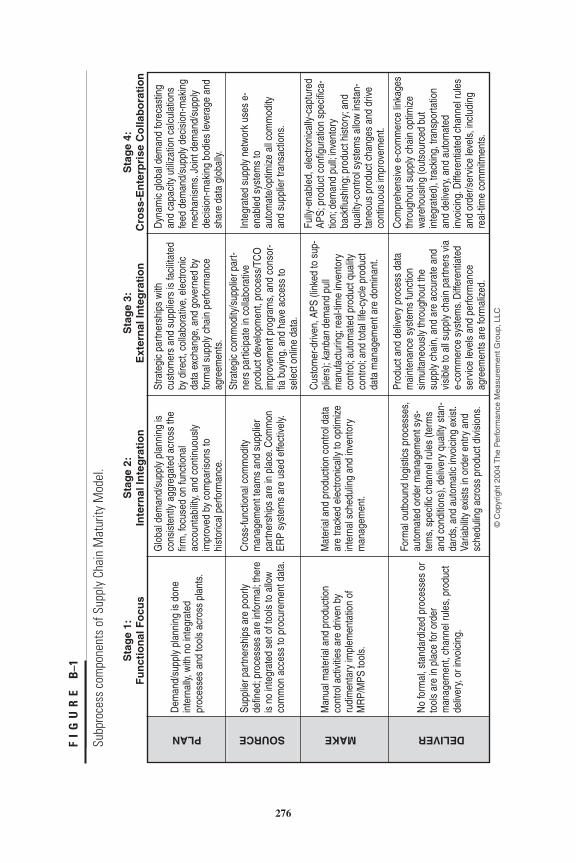
FI
GU
RE
B–1
Subp
roce
ss c
ompo
nent
s of
Sup
ply
Chai
n M
atur
ity M
odel
.
Supp
lier p
artn
ersh
ips
are
poor
lyde
fined
; pro
cess
es a
re in
form
al; t
here
is n
o in
tegr
ated
set
of t
ools
to a
llow
com
mon
acc
ess
to p
rocu
rem
ent d
ata.
Cro
ss-fu
nctio
nal c
omm
odity
man
agem
ent t
eam
s an
d su
pplie
rpa
rtner
ship
s ar
e in
pla
ce. C
omm
onER
P sy
stem
s ar
e us
ed e
ffect
ivel
y.
Stra
tegi
c co
mm
odity
/sup
plie
r par
t-ne
rs p
artic
ipat
e in
col
labo
rativ
epr
oduc
t dev
elop
men
t, pr
oces
s/TC
Oim
prov
emen
t pro
gram
s, a
nd c
onso
r-tia
buy
ing,
and
hav
e ac
cess
tose
lect
onl
ine
data
.
Inte
grat
ed s
uppl
y ne
twor
k us
es e
-en
able
d sy
stem
s to
auto
mat
e/op
timiz
e al
l com
mod
ityan
d su
pplie
r tra
nsac
tions
.
Man
ual m
ater
ial a
nd p
rodu
ctio
nco
ntro
l act
iviti
es a
re d
riven
by
rudi
men
tary
impl
emen
tatio
n of
MR
P/M
PS to
ols.
Mat
eria
l and
pro
duct
ion
cont
rol d
ata
are
track
ed e
lect
roni
cally
to o
ptim
ize
inte
rnal
sch
edul
ing
and
inve
ntor
ym
anag
emen
t.
Cus
tom
er-d
riven
, APS
(lin
ked
to s
up-
plie
rs);
kanb
an d
eman
d pu
llm
anuf
actu
ring;
real
-tim
e in
vent
ory
cont
rol;
auto
mat
ed p
rodu
ct q
ualit
yco
ntro
l; an
d to
tal l
ife-c
ycle
pro
duct
data
man
agem
ent a
re d
omin
ant.
Fully
-ena
bled
, ele
ctro
nica
lly-c
aptu
red
APS;
pro
duct
con
figur
atio
n sp
ecifi
ca-
tion;
dem
and
pull;
inve
ntor
yba
ckflu
shin
g; p
rodu
ct h
isto
ry; a
ndqu
ality
-con
trol s
yste
ms
allo
w in
stan
-ta
neou
s pr
oduc
t cha
nges
and
driv
eco
ntin
uous
impr
ovem
ent.
No
form
al, s
tand
ardi
zed
proc
esse
s or
tool
s ar
e in
pla
ce fo
r ord
erm
anag
emen
t, ch
anne
l rul
es, p
rodu
ctde
liver
y, or
invo
icin
g.
Form
al o
utbo
und
logi
stic
s pr
oces
ses,
auto
mat
ed o
rder
man
agem
ent s
ys-
tem
s, s
peci
fic c
hann
el ru
les
(term
san
d co
nditi
ons)
, del
iver
y qu
ality
sta
n-da
rds,
and
aut
omat
ic in
voic
ing
exis
t.Va
riabi
lity
exis
ts in
ord
er e
ntry
and
sche
dulin
g ac
ross
pro
duct
div
isio
ns.
Prod
uct a
nd d
eliv
ery
proc
ess
data
mai
nten
ance
sys
tem
s fu
nctio
nsi
mul
tane
ousl
y th
roug
hout
the
supp
ly c
hain
, and
are
acc
urat
e an
dvi
sibl
e to
all
supp
ly c
hain
par
tner
s vi
ae-
com
mer
ce s
yste
ms.
Diff
eren
tiate
dse
rvic
e le
vels
and
per
form
ance
agre
emen
ts a
re fo
rmal
ized
.
Com
preh
ensi
ve e
-com
mer
ce li
nkag
esth
roug
hout
sup
ply
chai
n op
timiz
ew
areh
ousi
ng (o
utso
urce
d bu
tin
tegr
ated
), tra
ckin
g, tr
ansp
orta
tion
and
deliv
ery,
and
auto
mat
edin
voic
ing.
Diff
eren
tiate
d ch
anne
l rul
esan
d or
der/s
ervi
ce le
vels
, inc
ludi
ngre
al-ti
me
com
mitm
ents
.
SOURCE MAKE DELIVER
Dem
and/
supp
ly p
lann
ing
is d
one
inte
rnal
ly, w
ith n
o in
tegr
ated
proc
esse
s an
d to
ols
acro
ss p
lant
s.
Glo
bal d
eman
d/su
pply
pla
nnin
g is
cons
iste
ntly
agg
rega
ted
acro
ss th
efir
m, f
ocus
ed o
n fu
nctio
nal
acco
unta
bilit
y, an
d co
ntin
uous
lyim
prov
ed b
y co
mpa
rison
s to
hist
oric
al p
erfo
rman
ce.
Stra
tegi
c pa
rtner
ship
s w
ithcu
stom
ers
and
supp
liers
is fa
cilit
ated
by d
irect
, col
labo
rativ
e, e
lect
roni
cda
ta e
xcha
nge,
and
gov
erne
d by
form
al s
uppl
y ch
ain
perfo
rman
ceag
reem
ents
.
Dyn
amic
glo
bal d
eman
d fo
reca
stin
gan
d ca
paci
ty u
tiliz
atio
n ca
lcul
atio
nsfe
ed d
eman
d/su
pply
dec
isio
n-m
akin
gm
echa
nism
s. J
oint
dem
and/
supp
lyde
cisi
on-m
akin
g bo
dies
leve
rage
and
shar
e da
ta g
loba
lly.
Sta
ge
1:F
un
ctio
nal
Fo
cus
Sta
ge
2:In
tern
al In
teg
rati
on
Sta
ge
3:E
xter
nal
Inte
gra
tio
nS
tag
e 4:
Cro
ss-E
nte
rpri
se C
olla
bo
rati
on
© C
opyr
ight
200
4 T
he P
erfo
rman
ce M
easu
rem
ent G
roup
, LLC
PLAN
276

APPENDIX B The Supply Chain Maturity Model 277
As shown in Figure B-2, most companies in the population expect to moveforward with their practices and achieve a half-stage advancement to tran-sitional stage 3 with an average stage of 2.9.
The most mature companies expect to achieve fully mature stage 3(32.1 percent) and begin to transition to stage 4, cross-enterprise collab-oration. Stage of maturity varies by industry, with the consumer goods,semiconductor, and high-tech industries demonstrating more advancedpractices than other industries.
The relation between practice and performance was evaluated bydividing the population into two groups based on the overall average scoreof the population’s dominant maturity: stage 2.3. Those with more maturepractices (>stage 2.3) represented 44 percent of the population, and thosewith less mature (<stage 2.3) represented the remaining 56 percent. Weanalyzed the relative performance of the two groups across the completeset of SCOR level 1 metrics, as well as a variety of supporting level 2 andlevel 3 component metrics. Our premise was that more advanced practicesresult in better quantitative performance, and this correlation was trueacross the majority of metrics. The results are shown in Figure B-3, alongwith selected results cited in Chapters 2 and 5.
F I G U R E B–2
Average stage for dominant and emerging practices.
Practice Maturity
% o
f Par
ticip
ants
Stage
Dominant Emerging
0%
5%
10%
15%
20%
25%
30%
35%
40%
1-1.4 1.5-1.9 2-2.4 2.5-2.9 3-3.4 3-3.5 4
© Copyright 2004 The Performance Measurement Group, LLC

FI
GU
RE
B–3
Sum
mar
y re
sults
of p
opul
atio
n co
mpa
rison
s.
: I
ndic
ates
that
the
subp
opul
atio
n of
com
pani
es w
ith h
ighe
r S
C m
atur
ity, m
ore
adva
nced
pla
nnin
g pr
actic
es, o
r
BIC
per
form
ance
, sho
wed
bet
ter
perf
orm
ance
in th
e m
etric
cite
d—
: In
dica
tes
data
not
ava
ilabl
e be
caus
e qu
estio
n w
as n
ot a
sked
in th
is s
urve
y X
: In
dica
tes
that
the
subp
opul
atio
n of
com
pani
es w
ith h
ighe
r S
C m
atur
ity, m
ore
adva
nced
pla
nnin
g pr
actic
es, o
r
BIC
per
form
ance
, sho
wed
no
bette
r pe
rfor
man
ce in
the
met
ric c
ited
KeyP
rofit
abili
ty
inco
nclu
sive
—in
conc
lusi
veR
even
ue G
row
th
XX
Net
Ass
et T
urns
Cas
h-to
-Cas
h C
ycle
Tim
e
Inve
ntor
y D
ays
of S
uppl
y
Inve
ntor
y C
arry
ing
Cos
t
—To
tal S
uppl
y C
hain
Man
agem
ent C
osts
—X
Ups
ide
Pro
duct
ion
Fle
xibi
lity
—F
orec
ast A
ccur
acy
– D
olla
r
—F
orec
ast A
ccur
acy
– U
nit
XO
rder
Ful
fillm
ent L
ead
Tim
e
——
Fill
Rat
e %
by
Ord
er (
MT
S O
nly)
—S
ched
uled
to C
usto
m R
eque
st D
ate
On-
Tim
e D
eliv
ery
Per
form
ance
to C
omm
itted
Dat
e
On-
Tim
e D
eliv
ery
Per
form
ance
to R
eque
st
Bes
t-in
-Cla
ssC
om
pan
ies
Mo
re A
dva
nce
dP
lan
nin
g P
ract
ices
H
igh
er S
C M
atu
rity
P
op
ula
tio
nC
har
acte
rist
icM
etri
c
© C
opyr
ight
200
4 T
he P
erfo
rman
ce M
easu
rem
ent G
roup
, LLC
278

C A P P E N D I X
Comparison ofCharacteristics for Levels2 and 3 SCOR Metrics
279
The metrics contained within the Supply-Chain Operations Reference-model (SCOR) are hierarchical, just as the process elements are hierar-chical. Level 1 metrics are high-level measures that may cross multipleSCOR processes; they do not necessarily relate to a specific SCOR level1 process (plan, source, make, deliver, and return). Each of the 13 level 1metrics is associated with one of five specific performance attributes—supply chain reliability, supply chain responsiveness, supply chain flexi-bility, supply chain costs, and supply chain asset management. Theperformance attributes are the characteristics of the supply chain thatenable evaluation against other supply chains with competing strategies.For example, without these characteristics, it would be extremely difficultto compare an organization that chooses to be the low-cost provideragainst an organization that chooses to compete on reliability and perfor-mance. Figure C-1 shows this alignment.
Level 1 metrics are typically “assigned” to the plan supply chainprocess category and then decomposed into lower-level metrics. Level 2metrics are associated with a narrower subset of processes. Level 3 met-rics (also called diagnostic metrics) are used to identify variations in per-formance against plan. Each level 2 and level 3 metric is also associatedwith one of the five performance attributes.
Copyright © 2005 by The McGraw-Hill Companies, Inc. Click here for terms of use.
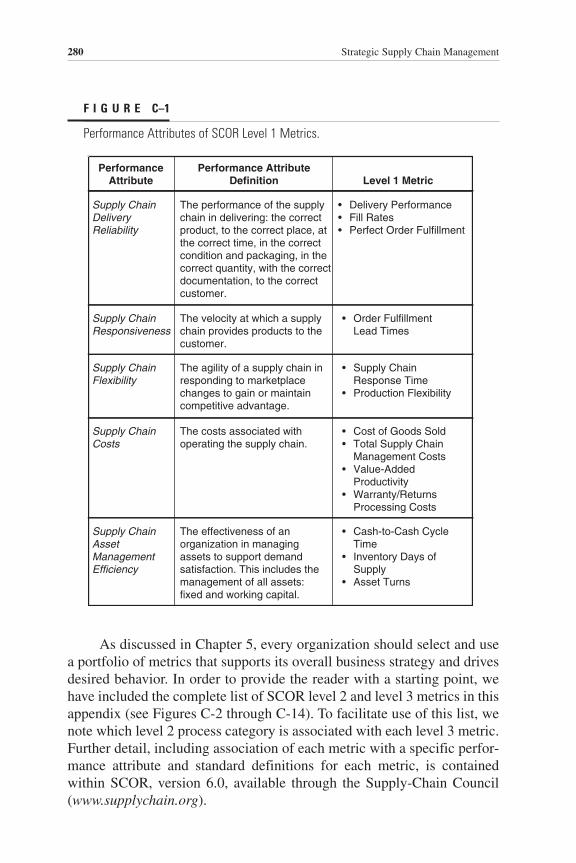
280 Strategic Supply Chain Management
As discussed in Chapter 5, every organization should select and usea portfolio of metrics that supports its overall business strategy and drivesdesired behavior. In order to provide the reader with a starting point, wehave included the complete list of SCOR level 2 and level 3 metrics in thisappendix (see Figures C-2 through C-14). To facilitate use of this list, wenote which level 2 process category is associated with each level 3 metric.Further detail, including association of each metric with a specific perfor-mance attribute and standard definitions for each metric, is containedwithin SCOR, version 6.0, available through the Supply-Chain Council(www.supplychain.org).
F I G U R E C–1
Performance Attributes of SCOR Level 1 Metrics.
PerformanceAttribute
Supply ChainDelivery Reliability
Performance AttributeDefinition
The performance of the supplychain in delivering: the correctproduct, to the correct place, at the correct time, in the correctcondition and packaging, in thecorrect quantity, with the correctdocumentation, to the correctcustomer.
Level 1 Metric
• Delivery Performance• Fill Rates• Perfect Order Fulfillment
Supply ChainResponsiveness
The velocity at which a supplychain provides products to thecustomer.
• Order Fulfillment Lead Times
Supply ChainFlexibility
The agility of a supply chain inresponding to marketplacechanges to gain or maintaincompetitive advantage.
• Supply Chain Response Time• Production Flexibility
Supply ChainCosts
The costs associated withoperating the supply chain.
• Cost of Goods Sold• Total Supply Chain Management Costs• Value-Added Productivity• Warranty/Returns Processing Costs
Supply ChainAssetManagementEfficiency
The effectiveness of anorganization in managingassets to support demandsatisfaction. This includes themanagement of all assets:fixed and working capital.
• Cash-to-Cash Cycle Time• Inventory Days of Supply• Asset Turns

APPENDIX C Comparison of Characteristics for Levels 2 and 3 SCOR Metrics 281
F I G U R E C–2
SCOR metrics—Plan level 2.
Plan Level 2 Supply Chain Source Make Deliver ReturnAbility to Augment Return Capacity Rapidly xCapacity Utilization xCash-to-Cash Cycle Time xMake Cycle Time xSource Cycle Time xCumulative Source/Make Cycle Time xDelivery Performance to Customer Request Date x xDemand/Supply Planning Costs x Fill Rate x xFinished Goods Inventory Days of Supply xForecast Accuracy x xInventory Days of Supply xOrder Management Cycle Time xProduction Plan Adherence xRe-Plan Cycle Time xReturn Assets Utilization xReturn on Assets xReturn Product Velocity xSales per Employee xSource Flexibility xSupplier On-Time Delivery Performance xSupplier Fill Rate xTotal Deliver Costs Total Supply Chain Cost xWIP Inventory Days of Supply x
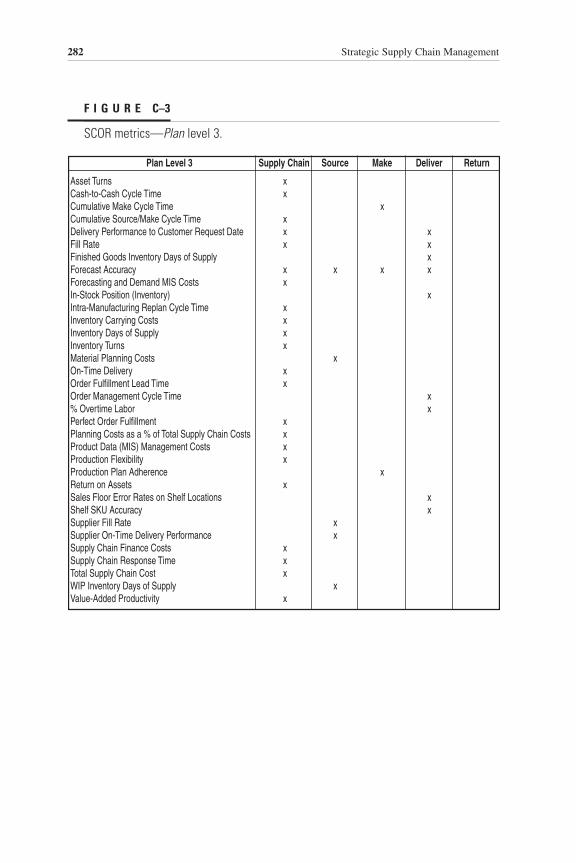
282 Strategic Supply Chain Management
F I G U R E C–3
SCOR metrics—Plan level 3.
Plan Level 3 Supply Chain Source Make Deliver Return
Asset Turns xCash-to-Cash Cycle Time xCumulative Make Cycle Time xCumulative Source/Make Cycle Time xDelivery Performance to Customer Request Date x xFill Rate x xFinished Goods Inventory Days of Supply xForecast Accuracy x x x xForecasting and Demand MIS Costs xIn-Stock Position (Inventory) xIntra-Manufacturing Replan Cycle Time xInventory Carrying Costs xInventory Days of Supply xInventory Turns xMaterial Planning Costs xOn-Time Delivery xOrder Fulfillment Lead Time xOrder Management Cycle Time x% Overtime Labor xPerfect Order Fulfillment xPlanning Costs as a % of Total Supply Chain Costs xProduct Data (MIS) Management Costs xProduction Flexibility xProduction Plan Adherence xReturn on Assets xSales Floor Error Rates on Shelf Locations xShelf SKU Accuracy xSupplier Fill Rate xSupplier On-Time Delivery Performance x Supply Chain Finance Costs xSupply Chain Response Time xTotal Supply Chain Cost xWIP Inventory Days of Supply xValue-Added Productivity x
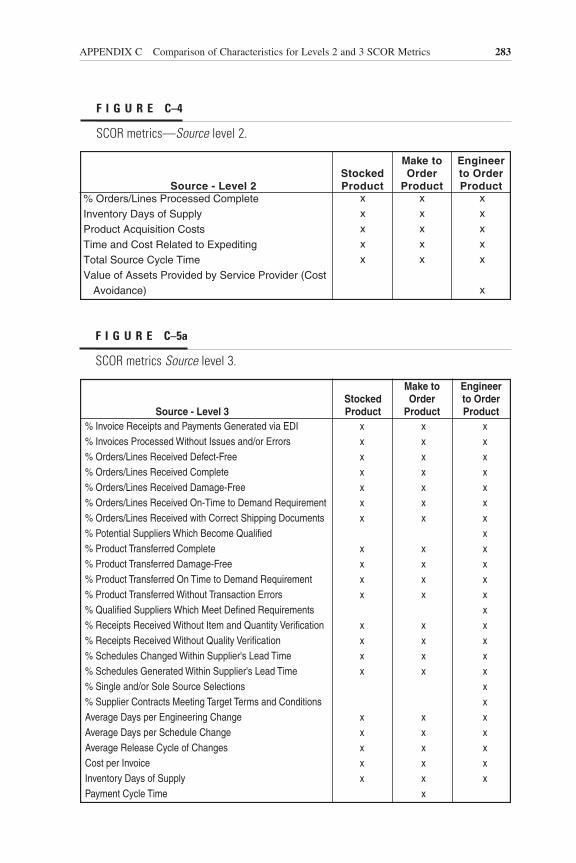
APPENDIX C Comparison of Characteristics for Levels 2 and 3 SCOR Metrics 283
F I G U R E C–5a
SCOR metrics Source level 3.
Source - Level 3StockedProduct
Make toOrder
Product
Engineerto OrderProduct
% Invoice Receipts and Payments Generated via EDI x x x% Invoices Processed Without Issues and/or Errors x x x% Orders/Lines Received Defect-Free x x x% Orders/Lines Received Complete x x x% Orders/Lines Received Damage-Free x x x% Orders/Lines Received On-Time to Demand Requirement x x x% Orders/Lines Received with Correct Shipping Documents x x x% Potential Suppliers Which Become Qualified x% Product Transferred Complete x x x% Product Transferred Damage-Free x x x% Product Transferred On Time to Demand Requirement x x x% Product Transferred Without Transaction Errors x x x% Qualified Suppliers Which Meet Defined Requirements x% Receipts Received Without Item and Quantity Verification x x x% Receipts Received Without Quality Verification x x x% Schedules Changed Within Supplier's Lead Time x x x% Schedules Generated Within Supplier's Lead Time x x x% Single and/or Sole Source Selections x% Supplier Contracts Meeting Target Terms and Conditions xAverage Days per Engineering Change x x xAverage Days per Schedule Change x x xAverage Release Cycle of Changes x x xCost per Invoice x x xInventory Days of Supply x x xPayment Cycle Time x
F I G U R E C–4
SCOR metrics—Source level 2.
Source - Level 2StockedProduct
Make toOrder
Product
Engineerto OrderProduct
% Orders/Lines Processed CompleteInventory Days of SupplyProduct Acquisition CostsTime and Cost Related to ExpeditingTotal Source Cycle TimeValue of Assets Provided by Service Provider (Cost Avoidance)
xxxxx
xxxxx
xxxxx
x

284 Strategic Supply Chain Management
F I G U R E C–5b
SCOR metrics—Source level 3 (continued).
Source - Level 3StockedProduct
Make toOrder
Product
Engineerto OrderProduct
Product Management and Planning Costs as a % of Product Acquisition Costs x x xProduct Process Engineering as a % of Product Acquisition Costs xReceiving Costs as a % of Product Acquisition Costs x x xReceiving Cycle Time x x xSource Identification Cycle Time xSource Qualification Cycle Time xSource Selection Cycle Time xSourcing Costs as a % of Product Acquisition Costs xTime and/or Cost Reduction Related to Expediting the Transfer Process x x xTime and/or Cost Reduction Related to Source Identification xTransfer & Product Storage Costs as a % of Product Acquisition Costs x x xTransfer Cycle Time x x xValue of Assets Provided by Service Provider (Cost Avoidance) xVerification Costs as a % of Product Acquisition Costs x x xVerification Cycle Time x x x

APPENDIX C Comparison of Characteristics for Levels 2 and 3 SCOR Metrics 285
F I G U R E C–6a
SCOR metrics—Source enable.
Source Enable% Agreements Negotiated Without Error/Change Requirement% Obsolete or Inactive Capital Assets% Orders Placed Without ErrorActual Asset Life Maintenance Cost as % of Replacement ValueApproval Cycle TimeAssets as a % of Cost to Administer Business RulesAssets as a % of Cost to Maintain Data RepositoryAssets as a % of Nonconformance CostsAvailability & Accuracy of Supplier/Source DataAverage Length of ContractsBusiness Performance Trends or PatternsCapital Asset Carrying CostCompliance with Multi-Country Government RegulationsContinuous Improvement Trends or PatternsCost of ComplianceCost of Damaged Capital AssetCost of Maintaining Data as a % of Spend/RevenueCost of Managing All Contracts as a % of Spend/RevenueCost of Managing Long-Term Agreements as a % of Spend/RevenueCost of Noncompliance to Business RulesCost of Obsolete Capital AssetCost of Process Documentation, Monitoring and Auditing Business RulesCosts Related to Specific Types of Non-ConformanceCustoms Clearance Cycle Time
Cycle Time Required to Move Product to Point of UseData Maintenance CostsDefective Product Parts per MillionDegree and Frequency that Purchase Orders/Contract Can Be AlteredDegree & Frequency of Conformance to Business RulesDegree of Demonstrated FlexibilityDegree of Flexibility to Access and Analyze Source DataDock-to-Dock Times (Lane Specific)Duty Tax ControlEmpty-to-Loaded Back-Haul Mile IndexEnd-to-End Cycle Time for Business ProcessesEquipment Utilization Rates (Hours)Equipment Utilization Rates (Product Contribution Margin)Export Shipment Processing TimeFill RateFrequency of Parameter UpdatesFrequency of Personnel Changes and Related ImpactsFrequency of Supplier/Source Data Update FeedsInventory Carrying CostInventory Days of SupplyInventory ValueMean Time to Repair Asset (Tooling & Equipment)Minimized Delays In-Transit Caused by Customs InterventionNumber of Data Sources for Data CollectionOn-Time Delivery Performance (Required Quantities, to Dates Required)
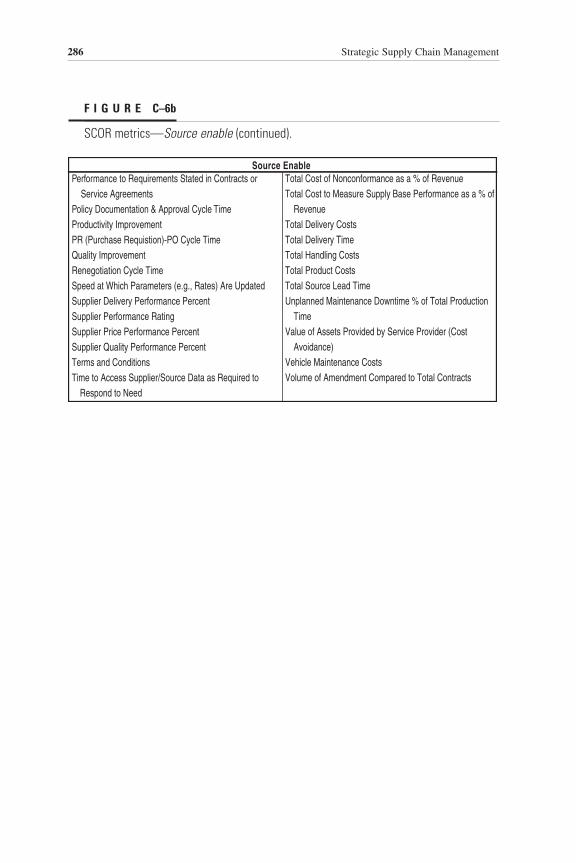
286 Strategic Supply Chain Management
F I G U R E C–6b
SCOR metrics—Source enable (continued).
Source EnablePerformance to Requirements Stated in Contracts or Service AgreementsPolicy Documentation & Approval Cycle TimeProductivity ImprovementPR (Purchase Requistion)-PO Cycle TimeQuality ImprovementRenegotiation Cycle TimeSpeed at Which Parameters (e.g., Rates) Are UpdatedSupplier Delivery Performance PercentSupplier Performance RatingSupplier Price Performance PercentSupplier Quality Performance PercentTerms and ConditionsTime to Access Supplier/Source Data as Required to Respond to Need
Total Cost of Nonconformance as a % of RevenueTotal Cost to Measure Supply Base Performance as a % of RevenueTotal Delivery CostsTotal Delivery TimeTotal Handling CostsTotal Product CostsTotal Source Lead TimeUnplanned Maintenance Downtime % of Total Production TimeValue of Assets Provided by Service Provider (Cost Avoidance)Vehicle Maintenance CostsVolume of Amendment Compared to Total Contracts
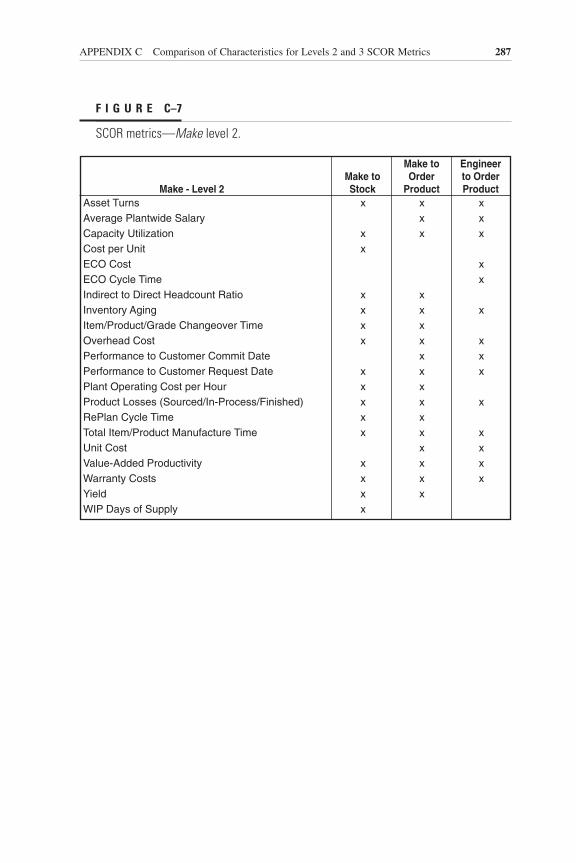
APPENDIX C Comparison of Characteristics for Levels 2 and 3 SCOR Metrics 287
F I G U R E C–7
SCOR metrics—Make level 2.
Asset Turns x x xAverage Plantwide Salary x xCapacity Utilization x x xCost per Unit xECO Cost xECO Cycle Time xIndirect to Direct Headcount Ratio x xInventory Aging x x xItem/Product/Grade Changeover Time x xOverhead Cost x x xPerformance to Customer Commit Date x xPerformance to Customer Request Date x x xPlant Operating Cost per Hour x x Product Losses (Sourced/In-Process/Finished) x x xRePlan Cycle Time x x Total Item/Product Manufacture Time x x xUnit Cost x xValue-Added Productivity x x xWarranty Costs x x xYield x xWIP Days of Supply x
Make - Level 2Make toStock
Make toOrder
Product
Engineerto OrderProduct

288 Strategic Supply Chain Management
F I G U R E C–8a
SCOR metrics—Make level 3.
% Orders Scheduled to Customer Request Date x x% Parts Received at Point of Use x% Release Errors x xAsset Turns x x xCapacity Utilization x x xCash-to-Cash Cycle Time x x xDeliver to Commit Date Variance xDownside Production Flexibility x x xECO Cost xFill Rates xIn-Process Failure Rates x x xIntra-Manufacturing Replan Cycle x xInventory Accuracy x x xInventory Carrying Cost x xInventory Days of Supply x x xPlant Finished Good Inventory Days of Supply x xInventory Obsolescence x x xNumber of ECOs xOut-of-Stock Occurrences xPackage Cycle Time x xPackaging Cost x xPlant Level Order Management Costs xProduct/Grade Changeover Time xProduction Engineering Cycle Time xQuarantine or Hold Time x xRatio of Actual to Theoretical Cycle Time x x xRelease Cost per Unit x x
Make - Level 3Make toStock
Make toOrder
Product
Engineerto OrderProduct
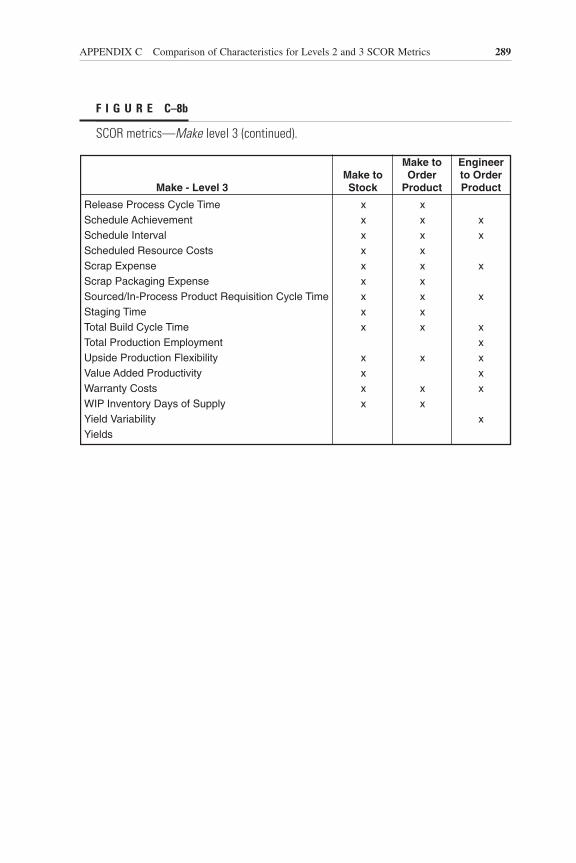
APPENDIX C Comparison of Characteristics for Levels 2 and 3 SCOR Metrics 289
F I G U R E C–8b
SCOR metrics—Make level 3 (continued).
Make - Level 3Make toStock
Make toOrder
Product
Engineerto OrderProduct
Release Process Cycle Time x xSchedule Achievement x x xSchedule Interval x x xScheduled Resource Costs x xScrap Expense x x xScrap Packaging Expense x xSourced/In-Process Product Requisition Cycle Time x x xStaging Time x xTotal Build Cycle Time x x xTotal Production Employment xUpside Production Flexibility x x xValue Added Productivity x xWarranty Costs x x xWIP Inventory Days of Supply x xYield Variability xYields
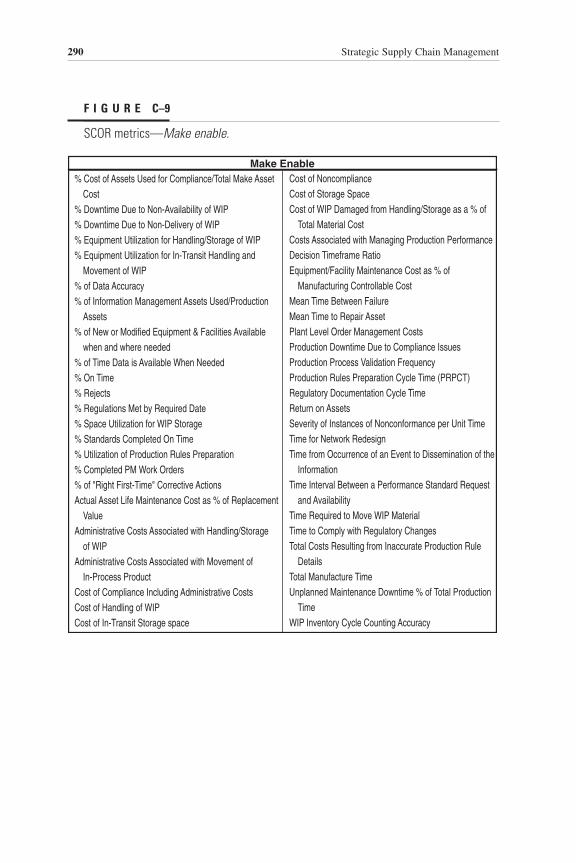
290 Strategic Supply Chain Management
F I G U R E C–9
SCOR metrics—Make enable.
Make Enable% Cost of Assets Used for Compliance/Total Make Asset Cost% Downtime Due to Non-Availability of WIP% Downtime Due to Non-Delivery of WIP% Equipment Utilization for Handling/Storage of WIP% Equipment Utilization for In-Transit Handling and Movement of WIP% of Data Accuracy% of Information Management Assets Used/Production Assets% of New or Modified Equipment & Facilities Available when and where needed% of Time Data is Available When Needed% On Time% Rejects% Regulations Met by Required Date% Space Utilization for WIP Storage% Standards Completed On Time% Utilization of Production Rules Preparation% Completed PM Work Orders% of "Right First-Time" Corrective ActionsActual Asset Life Maintenance Cost as % of Replacement ValueAdministrative Costs Associated with Handling/Storage of WIPAdministrative Costs Associated with Movement of In-Process ProductCost of Compliance Including Administrative CostsCost of Handling of WIPCost of In-Transit Storage space
Cost of NoncomplianceCost of Storage SpaceCost of WIP Damaged from Handling/Storage as a % of Total Material CostCosts Associated with Managing Production PerformanceDecision Timeframe RatioEquipment/Facility Maintenance Cost as % of Manufacturing Controllable CostMean Time Between FailureMean Time to Repair AssetPlant Level Order Management CostsProduction Downtime Due to Compliance IssuesProduction Process Validation FrequencyProduction Rules Preparation Cycle Time (PRPCT)Regulatory Documentation Cycle TimeReturn on AssetsSeverity of Instances of Nonconformance per Unit TimeTime for Network RedesignTime from Occurrence of an Event to Dissemination of the InformationTime Interval Between a Performance Standard Request and AvailabilityTime Required to Move WIP MaterialTime to Comply with Regulatory ChangesTotal Costs Resulting from Inaccurate Production Rule DetailsTotal Manufacture TimeUnplanned Maintenance Downtime % of Total Production TimeWIP Inventory Cycle Counting Accuracy
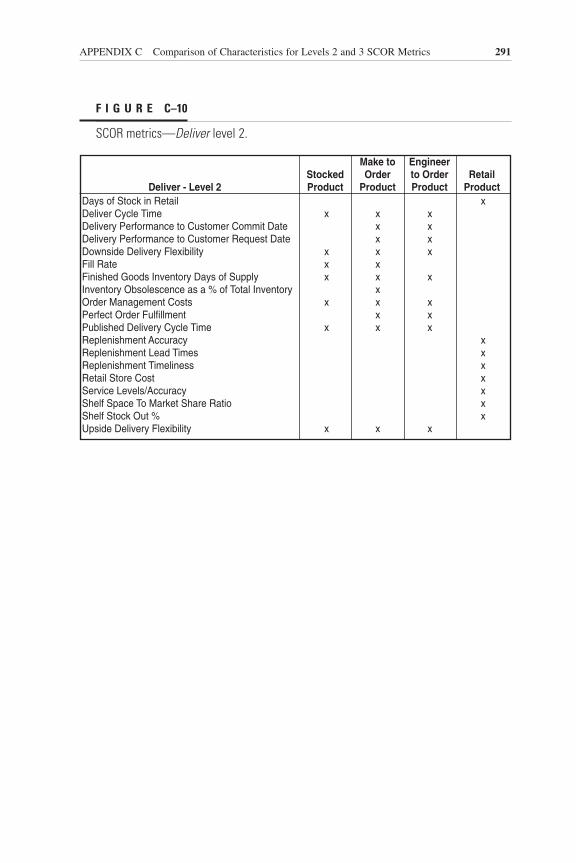
APPENDIX C Comparison of Characteristics for Levels 2 and 3 SCOR Metrics 291
F I G U R E C–10
SCOR metrics—Deliver level 2.
Deliver - Level 2StockedProduct
Make toOrder
Product
Engineerto OrderProduct
RetailProduct
Days of Stock in Retail xDeliver Cycle Time x x xDelivery Performance to Customer Commit Date x xDelivery Performance to Customer Request Date x xDownside Delivery Flexibility x x xFill Rate x xFinished Goods Inventory Days of Supply x x xInventory Obsolescence as a % of Total Inventory xOrder Management Costs x x xPerfect Order Fulfillment x xPublished Delivery Cycle Time x x xReplenishment Accuracy xReplenishment Lead Times xReplenishment Timeliness xRetail Store Cost xService Levels/Accuracy xShelf Space To Market Share Ratio xShelf Stock Out % xUpside Delivery Flexibility x x x

292 Strategic Supply Chain Management
F I G U R E C–11a
SCOR metrics—Deliver level 3.
Deliver - Level 3StockedProduct
Make toOrder
Product
Engineerto OrderProduct
RetailProduct
# Callbacks as % of Total Inquiries x x% Accuracy or Failure Rates x% Faultless Installations x x x% Faultless Invoices x x x% Item Location Accuracy x% Shrinkage xAccuracy of Stocking xAdoption Rates xCapacity Utilization xCarrier Quote Response Time xCheckout Labor as a % of Revenue xComplete Manufacture to Order Ready for Shipment Time xCost Efficiency/Elasticity of Shipping Schedules xCreate Customer Order Costs x x xCustomer Invoicing/Accounting Costs x x xCustomer Receipt of Order to Installation Complete x xCustomer Signature/Authorization to Order Receipt Time x x xDays Sales Outstanding x x xDeliver Cycle Time xDelivery Performance to Customer Commit Date x x xDelivery Performance to Customer Request Date x x xDistribution Costs x x xDock to Stock Cycle Time x xDocumentation xDownside Delivery Flexibility x x xDownside Installation Flexibility x x x

APPENDIX C Comparison of Characteristics for Levels 2 and 3 SCOR Metrics 293
F I G U R E C–11b
SCOR metrics—Deliver level 3 (continued).
Deliver - Level 3StockedProduct
Make toOrder
Product
Engineerto OrderProduct
RetailProduct
Downside Order Flexibility x x xDownside Shipment Flexibility x x xEnd-of-Life Inventor Field Finished Goods Inventory Days of Supply x x xFill Rates xFinished Goods Inventory Carry Cost xFinished Goods Inventory Days of Supply x xIn Store Inventory Accuracy xIncoming Material Costs xIncoming Material Quality xInstallation Costs x xInstallation Cycle Time (Measured in Days) xIn-Stock % xInventory Inaccuracies During Pick-Process xInventory Obsolescence as a % of Total Inventory xItems Stocked per FTE xLabor $ per Direct Product Cost (DPC) xMinimum Stock Levels xNumber of Restocking Events per Day xOn-Time In Full xOrder Consolidation Profile xOrder Entry and Maintenance Costs x xOrder Entry Complete Time to Order Ready for Shipment xOrder Entry Complete to Order Ready for Shipment Time xOrder Entry Complete to Start Manufacture Time x xOrder Fulfillment Costs x x x

294 Strategic Supply Chain Management
F I G U R E C–11c
SCOR metrics—Deliver level 3 (continued).
Deliver - Level 3StockedProduct
Make toOrder
Product
Engineerto OrderProduct
RetailProduct
Order Management Costs x xOrder Ready for Shipment to Customer Receipt of Order x x xOrder Receipt to Order Entry Complete Time x x xPerfect Order Fulfillment x x xPrice Checks per Cashier Shift xProduct Acquisition Costs xPutaway Labor Cost xRain Check % xRequirements Fill % xService Levels xStocking Cycle Time xTime to Pick xTransportation Costs x x xUpside Delivery Flexibility x x xUpside Installation Flexibility x x xUpside Order Flexibility x x xUpside Shipment Flexibility x x x

APPENDIX C Comparison of Characteristics for Levels 2 and 3 SCOR Metrics 295
F I G U R E C–12
SCOR metrics—Deliver enable.
Deliver Enable# Orders Requiring Intervention Due to Rule Violation Inventory Value% Capacity Utilization% Damaged Products Receipts and % Damaged Customer Shipments% Obsolete or Inactive Inventory% Perfect Customer Order DeliveryAcquisition Cost for Operational SystemsAdministration CostAge of DataCompliance with Multi-Country Government RegulationsCost of Acquisition % of Distribution CostCost of Capital Systems or 3d Party ServicesCost of ComplianceCost of Damaged InventoryCost of NonconformanceCost of Obsolete InventoryCost to Maintain the Fixed Assets for the Distribution NetworkCustoms Clearance Cycle TimeData Maintenance CostsDistribution Capital CostDock-to-Dock Times (lane specific)Duty Tax ControlEmpty-to-Loaded Backhaul Mile IndexEquipment Utilization Rates (hours)Equipment Utilization Rates (product contribution margin)Export Shipment Processing Time
Fill RateFrequency of AnalysisFrequency of Parameter UpdatesInventory Accuracy by LocationInventory Carrying CostInventory Days of SupplyInventory Turns per YearMinimized Delays In-Transit Caused by Customs InterventionNumber of Data Sources for Data CollectionPerfect Order Fulfillment for the ProviderRatio of Active Customer Data/Inactive Customer DataRule Implementation TimeRule Management CostSpeed at Which Parameters (e.g., Rates) are UpdatedTime to Update Customer Records and StatusTotal Distribution Cost as a % of RevenueTransportation AssetsVehicle Maintenance CostsWarehouse Distribution Cost

296 Strategic Supply Chain Management
F I G U R E C–13
SCOR metrics—Return level 2.
Return - Level 2DefectiveProduct
SourceReturnMRO
Product
DeliverReturnMRO
ProductExcessProduct
% of MRO Deliver Returns Processed Correctly x xCycle Time and Cost to Implement Return Authorization Criteria x xDays of Obsolete Supply xMRO Inventory Value x xReturn Inventory Days of Supply xReturn Costs xTotal Cost Associated with Deliver Return Activities xTotal Deliver Return Cycle Time xTotal Source Return Costs xTotal Source Return Cycle Time xValue of Unserviceable MRO Inventory as a % of TotalWarranty Cost x
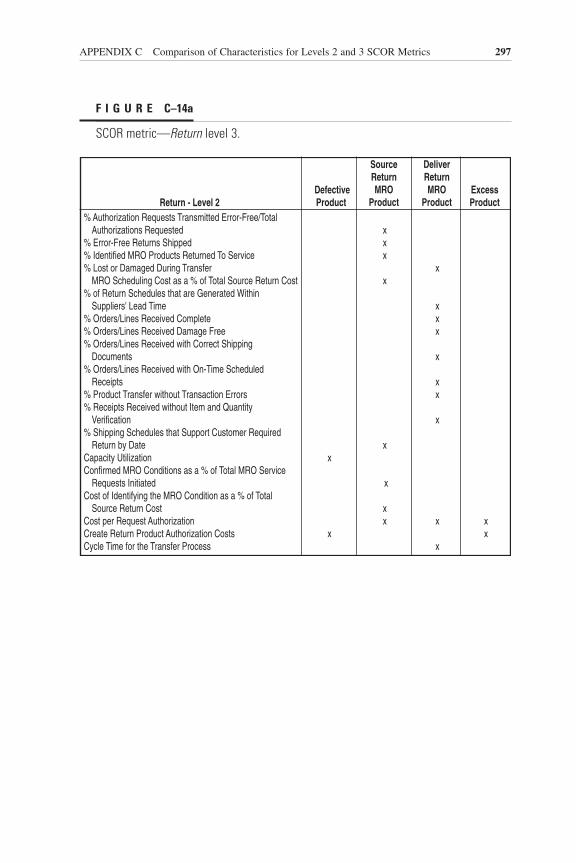
APPENDIX C Comparison of Characteristics for Levels 2 and 3 SCOR Metrics 297
F I G U R E C–14a
SCOR metric—Return level 3.
Return - Level 2DefectiveProduct
SourceReturnMRO
Product
DeliverReturnMRO
ProductExcessProduct
% Authorization Requests Transmitted Error-Free/Total Authorizations Requested x% Error-Free Returns Shipped x% Identified MRO Products Returned To Service x% Lost or Damaged During Transfer x MRO Scheduling Cost as a % of Total Source Return Cost x% of Return Schedules that are Generated Within Suppliers' Lead Time x% Orders/Lines Received Complete x% Orders/Lines Received Damage Free x% Orders/Lines Received with Correct Shipping Documents x% Orders/Lines Received with On-Time Scheduled Receipts x% Product Transfer without Transaction Errors x% Receipts Received without Item and Quantity Verification x% Shipping Schedules that Support Customer Required Return by Date xCapacity Utilization xConfirmed MRO Conditions as a % of Total MRO Service Requests Initiated xCost of Identifying the MRO Condition as a % of Total Source Return Cost xCost per Request Authorization x x xCreate Return Product Authorization Costs x xCycle Time for the Transfer Process x

298 Strategic Supply Chain Management
F I G U R E C–14b
SCOR metric—Return level 3 (continued).
Return - Level 2DefectiveProduct
SourceReturnMRO
Product
DeliverReturnMRO
ProductExcessProduct
Cycle Time from Packaging to Receipt at the Service Provider xCycle Time from Problem Identification to Condition Confirmation xCycle Time from Return Authorization to Actual Shipment Pickup xCycle Time from Return Authorization to Scheduled Shipment Pickup xCycle Time from Customer Identifying Return Authorization Need to Receipt of Authorization xCycle Time to Change Condition Criteria xCycle Time to Incorporate Changes in Return Authorization Processing xCycle Time to Update Changes to Shipment Schedule x xCycle Time to Reach Return Authorization, Return to Service or Discard Decision xDisposal Costs xExcess Inventory Days of Supply xMRO Deliver Return Costs xMRO Disposition Costs as % Total Source Return Cost xObsolete DOS xOrder Management Costs to Return Product into the Supply Chain x xRatio of Authorization Cost to Total Deliver Return Costs x

APPENDIX C Comparison of Characteristics for Levels 2 and 3 SCOR Metrics 299
F I G U R E C–14c
SCOR metric—Return level 3 (continued).
Return - Level 2DefectiveProduct
SourceReturnMRO
Product
DeliverReturnMRO
ProductExcessProduct
Ratio of Authorization Cost to Total Source Return Cost xReceiving & Product Storage Cost as a % of Product Return Costs xReceiving Costs as a % of MRO Costs xReceiving Costs as a % of Product Return Costs xReceiving Cycle Time xResponse Cycle Time xReturn Authorization Schedule Creation Cycle Time xReturn Inventory Days of Supply xReturn Order Entry and Maintenance Costs x Return Product Days of Supply x xReturn Product Management and Planning Costs as a % of Product Return Costs x xReturn Shipments Shipped On-Time xReturn Transportation Costs xReturned Materials Authorization (RMA) Costs xTime and Cost Related to Expediting the Disposition xTime and Cost Related to Responding to an Increase in Disposition Demand xTime and Cost to Exercise the Transfer xTotal Production Employment xTransfer and Product Storage Costs xValue Added Productivity xValue of Return Product x x

300 Strategic Supply Chain Management
F I G U R E C–14d
SCOR metric—Return level 3 (continued).
Return - Level 2DefectiveProduct
SourceReturnMRO
Product
DeliverReturnMRO
ProductExcessProduct
Value of Unserviceable MRO Inventory Awaiting Disposition as a % of Total MRO Inventory xValue of Unserviceable MRO Inventory in Physical Return Stage as a % of Total MRO Inventory xValue of Unserviceable MRO Inventory in Receiving Stage as a % of Total MRO Inventory xValue of Unserviceable MRO Inventory in Request Return Authorization Stage as a % of Total MRO Inventory xValue of Unserviceable MRO Inventory in Scheduling Stage as a % of Total MRO Inventory x xValue of Unserviceable MRO Inventory in Transfer to Storage Stage as a % of Total MRO Inventory xVerification Costs as a % of Product Return Costs x xWarranty Costs x

N O T E S
301
CHAPTER 11. Bob Pethick and Torsten Becker, “Dell on Wheels,” Supply Chain Manage-
ment Review (December 2000).
2. “Green Granite and Smoked Glass at Les Champs-de-Boujean,” Swiss WatchNews (October 22, 2003).
3. David Rogers, “Value-Based Customer Care,” PRTM’s Insight (Spring 1998).
4. Noshua Watson, “What’s Wrong with Hewlett-Packard’s Deskjet Printers?”Fortune (February 5, 2003).
5. Miguel Helft, “Fashion Fast Forward,” Business 2.0 (May 2002).
6. The Performance Measurement Group, LLC, “Better Project ManagementPractices Drop Time-to-Market 20–30 percent,” Signals of Performance:Product Development 2 (11).
7. Stephen Todd, “How to Support New Product Introductions,” Supply ChainManagement Review (July-August 2001).
8. Inditex, FY2002 Results Presentation, March 20, 2003.
9. June Avignone, “Pressing for Change,” Fortune Small Business (July 31, 2002).
10. The Performance Measurement Group, LLC, “Achieving Delivery Perfor-mance: Linking Strategy, Capabilities, and Results,” Signals of Performance:Supply Chain Deliver 3 (4).
Copyright © 2005 by The McGraw-Hill Companies, Inc. Click here for terms of use.

302 Strategic Supply Chain Management
11. Kay Burns, “Supplier Managed Inventory Sweeps through Shell Chemical,”APICS (December 1997); John H. Sheridan, “Managing the Value Chain,”Industryweek.com (September 6, 1999); “Supply on Demand,” ShellChemicals Magazine (third–fourth quarter, 2000); “Adding Value in a NewEconomy,” Shell Chemicals Magazine (Summer 2003); “Supplier InventoryManagement,” Shell Chemicals, http://www.shellchemicals.com/products.
12. Christina Hepner Brodie and Gary Burchill, Voices into Choices: Acting onthe Voice of the Customer (Joiner Editions, 1997).
13. “Going, Boeing . . . ,” The Economist (April 17, 2003).
14. Martii Haikio, Nokia: The Inside Story (Helsinki: Edita, 2001).
15. Paul Kailha, “Inside Cisco’s $2 Billion Blunder,” Business 2.0 (March 2002).
16. Jennifer Baljko Shah, “Cisco Faces Pitfalls as It Builds Hub,” EBN (June 7,2002).
17. Michael Porter, “What Is Strategy?” Harvard Business Review (November–December 1996).
CHAPTER 21. Fred Vogelstein, “Mighty Amazon,” Fortune (May 26, 2003), pp. 22–28.
2. Based on an interview conducted by Shoshanah Cohen, PRTM director, withMark Mastandrea, director of fulfillment at Amazon.
3. “Amazon Trims Fulfillment and Marketing Expenses and Loss in FirstQuarter,” Direct Newsline (PRIMEDIA, April 27, 2003).
4. Laurent Schwartz, “Alcatel Enterprise délègue le pilotage de sa supplychain,” Logistiques Magazine (January–February 2002), pp. 52–56.
5. “UPS Logistics Group Provides Fourth-Party Logistics Support for AlcatelEnterprise’s Supply Chain,” United Postal Service of America, Inc., CaseStudy, 2002.
6. See note 4.
7. Roberta J. Duffy, editor of Inside Supply Management, review of a speechby Theresa Metty, senior vice president and general manager of the world-wide supply chain, Motorola’s personal communications, at the Institute forSupply Management’s 88th Annual International Supply ManagementConference and Educational Exhibit, Nashville, TN, May 18, 2003.
8. “Get Started with a Data Quality Initiative,” Supply Chain Advisor (April 17,2002).
9. “Supply Chain Technology Briefing,” Supply Chain Technology Review 1(9):September 18, 2003.
10. Malcolm McDonald, “A Tool for Supply Chain Optimization,” PRTM’sInsight (August 1, 1995).

NOTES 303
11. Michael E. McGrath (ed.), Setting the PACE in Product Development: AGuide to Product and Cycle-Time Excellence, rev. ed. (Boston: ButterworthHeinemann, 1996).
12. PRTM and AMR press release, “69 Manufacturers Launch First Cross-Industry Framework for Improved Supply Chain Management,” November 21,1996.
13. CPFR.org (http://www.cpfr.org), Introduction page, Voluntary InterindustryCommerce Standards (VICS) Association, 1998.
14. RosettaNet press release, “RosettaNet Global e-Business Standard ReachesCritical Mass in High-Technology Sector,” May 12, 2003.
CHAPTER 31. Based on an interview conducted by Shoshanah Cohen, PRTM director,
with Robert Schlaefli, Stratex vice president of global operations.
2. APICS—The Educational Society for Resource Management (www.apics.org)—is a not-for-profit international educational organization recognized globallyas a source of knowledge and expertise for manufacturing and service indus-tries in such areas as materials management, information services, purchasing,and quality.
3. Based on an interview conducted by Kate Fickle, PRTM director, with MikePearce, Smith Bits vice president, and other Smith Bits executives.
4. Based on an interview conducted by Brad Householder, PRTM principal,with Peter Kelly, Agere executive vice president, global operations group.
5. Jennifer S. Kuhel, “Big Blue Supply Chain: Robert Moffat Discusses IBM’sPlan to Link Procurement, Distribution, Manufacturing and Logistics,”Supplychaintech.com, September 13, 2002.
6. David Drickhamer, “Looking for Value: Reducing Internal Costs andEnhancing Customer Value Draw Attention,” Industryweek.com, December 1,2002.
7. Flextronics Web site, Corporate Background Information, http://www.flex-tronics.com/corporate/backgrounder/asp.
8. Based on an interview conducted by Bob Moncrieff, PRTM director, withMike McNamara, Flextronics COO.
9. Christopher Reilly, “Central Sourcing Strategy Saves Dial $100 Million,”Purchasing.com, January 17, 2002.
10. Based on PMG benchmarks derived from consumer products companies’supply chain performance (submitted 2003).
11. Based on an interview conducted by Shoshanah Cohen, PRTM director,with Angel Mendez, palmOne senior vice president of global operations.
304 Strategic Supply Chain Management
12. W. L. (Skip) Grenoble, “How Will We Staff Our Supply Chains?” GlobalSupply Chain (February–March 2000).
13. Procter & Gamble Web site, http://www.pg.com.
14. Based on an interview conducted by Shoshanah Cohen, PRTM director, withJeff Rosen, AFC vice president of operations and information technology.
CHAPTER 41. “A Global Study of Supply Chain Leadership and Its Impact on Business
Performance,” Accenture/Stanford/INSEAD study, 2003.
2. Mike Uhl and Kevin Keegan, “Choosing the Right Model(s) for ManagingSupply Networks,” PRTM white paper used as the foundation for a PRTMarticle in EBN (November 2, 2000).
3. David A. Menachof and Byung-Gak Son, “The Truth about Collaboration,”http://www.totalsupplychain.com, February 2002.
4. Based on interviews conducted by Shoshanah Cohen, PRTM director, withNolan Perry, Logitech’s director of project management services, and GrayWilliams, vice president, worldwide supply chain.
5. Allison Bacon, Larry Lapide, and Janet Suleski, “Supply Chain CollaborationToday: It’s a Tactic, Not a Strategy,” AMR Research Report, September 2002.
6. http://www.alcatel.com.
7. Based on an interview conducted by Steve Palagyi, PRTM director, withBurt Rabinowitz, Alcatel vice president of sourcing and procurement.
8. http://www.dowcorning.com/main.asp.
9. http://w1.cabot-corp.com/index.jsp.
10. http://www.jambajuice.com/what/jambadifference.html.
11. http://www.calstrawberry.com/facts/industry.asp.
12. Based on an interview conducted by Shoshanah Cohen, PRTM director, withAnne Kimball, Jamba Juice director of supply chain management.
13. George V. Hulme, “In Lockstep on Security,” Information Week (March 18,2002).
CHAPTER 51. Dennis Callaghan, with additional reporting by John S. McCright and Lisa
Vaas, “Sarbanes-Oxley Balancing Act,” eWeek, June 2, 2003.
2. Robert S. Kaplan and David P. Norton, The Balanced Scorecard: TranslatingStrategy into Action (Cambridge, MA: Harvard Business School Press, 1996).
3. Based on interviews conducted by Robert Chwalik, PRTM manager, withDave McGregor, BASF’s senior vice president of logistics, and MarySchneibner, BASF’s NAFTA director of supply chain consulting.
NOTES 305
4. Bob Moncrieff, Hannah McClellan, and Julie Cesati, “Performance Measure-ment: Less Pain, More Gain,” in PMG Scorecard Users’ Guide (The Perfor-mance Measurement Group, 2003).
5. The Supply-Chain Operations Reference-model (SCOR), version 6.0. Copy-righted © 2003, by the Supply-Chain Council, Inc., Pittsburgh, PA.
6. Based on interviews conducted by Gary Galensky, PRTM principal, withAri Bose, 3Com’s CIO, and Jim Ticknor, 3Com’s vice president in chargeof supply chain operations.
7. Lee Geishecker and Brian Zrimsek, “Use CPM to Integrate the EnterpriseView,” Gartner.com, letter from the editor, July 18, 2002 (LE-17-4266).
CHAPTER 61. For an overview of the maturity of supply chain information systems, see
Gartner’s annual “Hype Cycle for Supply Chain Management” analysis.
2. Jakub Wawszczak, Mark Hermans, and Julie Cesati, “Supply Chain Planning:How to Achieve a Competitive Advantage,” Webcast conducted by PRTM,PMG, and SAP, June 19, 2003.
3. For a more detailed discussion of the need for architects, see Marco Iansiti,“Integration the RIGHT way, the WRONG way,” CIO (May 15, 2003).

This page intentionally left blank.

I N D E X
307
AAccountability, 79, 114–119, 177–178Accuracy, 78, 80, 85A&D industry, 12 Adaptability, 32–35Adaptation, 244–246Advanced planning and scheduling (APS),
238Advanced Fibre Communications, Inc. (AFC),
126–127Advanced planning system (APS), 58Advanced systems, 230–232Aerospace industry, 33AFC (See Advanced Fibre Communications, Inc.)Afghanistan, 180, 181, 183After-market customers, 28–30Agere Systems, 111–113Airbag market, 39–48Airbus, 9, 33Ala-Pietala, Pekka, 34Alcatel, 60–61, 154–155Alignment:
of business/supply chain strategies, 20–27of customers’ needs with supply chain strategy,
27–30of power position with supply chain strategy,
30–32in SCOR model, 70–72
Amazon, 9, 51–54Ambrey, Tim, 43American Electronics Association, xiAMR Research, xiii, 68Application islands, 64Application-specific integrated circuits (ASICs),
154APS (See Autoliv Production System)APS (advanced planning and scheduling),
238APS (advanced planning system), 58“As is” analysis, 74ASCS (Avnet Supply Chain Services), 160ASICs (application-specific integrated circuits),
154Assembly lines, 42–44Asset network, 18–20
Autoliv, 39–48assembly lines at, 42–44change at, 47–48collaboration with suppliers at, 46–47science involved in, 41upstream impact on supply at, 44–46
Autoliv Partner Portal, 47Autoliv Production System (APS), 40, 44Automation, 53, 90, 234Automobile industry, 12, 13, 28, 31–32, 217–227Avnet, 163Avnet Electronics Marketing, 160Avnet Supply Chain Services (ASCS), 160Avon, 91–100
business case for, 93–94collaborative design at, 97–98direct sales, 91–100end-to-end visibility at, 95–96growth of, 92–93reorganization at, 98–100supplier collaboration with, 96–97supply chain redesign at, 94–95
Awareness, 123
BBalanced scorecard approach, 192–193, 212Bancel, Stephan, 3, 4Barlean’s Organic Oils, 25BASF Corporation, 196–197Basis of competition, 22B2B (See Business-to-business)Benchmarking, xii, 193–197Best Business Practices Group, 174, 177, 178“Big Bang” program, 23Boeing, 33Bose, Ari, 211Bottled water industry, 14Boyanton, Earl, 178–182Brand leaders, 32Brand power, 31Brown, Dave, 133Budgets, 188Build-to-order strategy, 61Bundling approach, 196Business decisions, 6
Copyright © 2005 by The McGraw-Hill Companies, Inc. Click here for terms of use.

308 Index
Business strategy:metrics linked to, 188–191supply chain alignment with, 20–27, 37
Business-driven approach, 237–238Business-priority focus:
in make process, 83in plan process, 79
Business-to-business (B2B), 157, 162BuyPower, 219
CCabot Corporation, 156–157Capacity, 5–6Cash-to-cash cycle time, xii, 56Celestica, 16Cell system of assembly, 42–44Central Europe, 20Central supply chain management, 6–7Chain of chains, 120Change:
categories of, 239identifying required type of, 238–239organization design and ongoing, 102–108organizational, 6–7roadmap to (See Roadmap to change)
Change drivers, 172–174Change management, 246Channel strategy, 13–14Chemicals industry, 12China, 19Chrysler, 39Cialis, 5Cisco, 16, 35Civil Reserve Air Fleet (CRAF), 179–180Cleugh’s Frozen Foods, Inc., 159Collaboration, 32, 139–167
areas to avoid, 147–148benefits of, 142checklist for, 167and compromise, 163–164cooperative, 143, 145coordinated, 143, 145–146defining, 139–140degrees of, 152–155evolution of, 148, 149internal, 149–152next-generation, 164–167at Owens Corning, 137–138reasons for, 140–141risks/rewards shared in, 156–159spectrum of, 143–147successful, 148–164with suppliers, 96–97
Collaboration (Cont.):synchronized, 143, 146–147technology support for, 161–163transactional, 143–145and trust, 159–161
Collaborative design, 97–98Collaborative Planning, Forecasting, and
Replenishment (CPFR), 68–70Collaborative Commerce Standards Institute,
69Commercial off-the-shelf (COTS) software
vendors, 176Commercial transport, 179–180Communication, 100, 103–104Compaq, 16Competition:
basis of, 22changes in basis of, 33–34cost-based, 22, 23innovation-based, 23–25quality-based, 25–26service-based, 26–27and supply chain architecture, 51, 52
Competitive Advantage (Michael Porter), 35Compromise, 163–164Computer industry, 10, 12Confidentiality, 159–160Configuration level, 72–74Configure to order, 11–13, 61, 72Connectivity, 232Constraints, 218Consultation, 117Consumer packaged goods, 12Content:
process architecture, 90 supply chain strategy, 37
Contract manufacturing, 4Cooperative collaboration, 143, 145Coordinated collaboration, 143, 145–146Core competencies:
and outsourcing strategy, 15principle of, 119–122tests of, 121
Core strategic vision, 20, 21Corporate performance management (CPM),
213–215Cost:
competing on, 22, 23as metric, 189–191and supply chain architecture, 52total supply chain management, 56
Cost, volume, and profit (C/V/P), 140, 141 Cost to serve, 84, 85

Index 309
COTS (commercial off-the-shelf) software vendors, 176
Counterfeiting, 25Country network model, 19Country-based strategies, xiiiCountry-level inventory data, 57CPFR (See Collaborative Planning, Forecasting,
and Replenishment)CPM (See Corporate performance management)CRAF (See Civil Reserve Air Fleet)Cranfield University, 99CRM (See Customer relationship management)Cross-enterprise extension, 37Cross-enterprise focus of metrics, 206Cross-enterprise scope, 90Cross-functional teams, 6, 44Culture, 153, 240–241Customer:
GM SPO’s focus on, 225and metrics, 209–210supply chain alignment with needs of, 27–30
Customer relationship management (CRM),214, 216
Customer relationship manager, 129Customer service, 17–18, 80Customer wait time, 178C/V/P (See Cost, volume, and profit)
DData strategy, 175, 176Data transmission, 146, 160Dealer channels, 14DEC (Digital Equipment Corporation), xiiDecision making, 232Decision support, 90Defense Logistics Agency (DLA), 170,
172–174, 176–177Deliver process, 60, 75, 82–86, 88Delivery mode, 54Dell Computer, 9, 14Dell, Michael, 9–10, 19“Dell on wheels,” 13Demand management, 3, 4Design:
change, 241–244collaborative, 97–98organization (See Organization design)
Design-chain—supply chain integration, 24Design-for-manufacturability (DFM) services, 121Dial (soap), 121, 122Differentiation source, 16Digital Equipment Corporation (DEC), xiiDirect sales, 91–100
Distributed decision making, 232Distributor channels, 14“Division of labor”, xDLA (See Defense Logistics Agency)Documenting paths, 242–243DoD (See U.S. Department of Defense)Dow Corning, 156–157
Ee-commerce, 53, 161EDI transactions (See Electronic data interchange
transactions)Education, 99, 123, 136eHub network, 35Electronic data interchange (EDI) transactions,
135–136, 145, 162Electronic manufacturing service (EMS)
providers, 160, 164Electronics industry, 12Eli Lilly, 1–7
new product launches at, 4–5optimizing capacity at, 5–6organizational change at, 6–7standardized global processes at, 3–4and uninterrupted supply of medicines, 2–3
“The Emergence of the Globally IntegratedCorporation” study, xi
EMS providers (See Electronic manufacturingservice providers)
End-to-end distribution, 172–175End-to-end focus test, 50, 55–59End-to-end initiative, 177–180End-to-end supply, 178End-to-end tracking, 85Engineer to order, 11, 12, 72Enterprise connectivity, 232Enterprise focus of metrics, 206Enterprise integration, 172, 175–177Enterprise resource planning (ERP) system, 43,
55, 57–58, 132, 238Enterprise scope, 90Enterprise-wide focus, 81Entertainment industry, 25Environment, 240–241Epson, 29ERP (See Enterprise resource planning system)Estevez, Alan, 177–178“Ethical” products, 25Europe, xii–xiii, 13, 91–100European Economic Community, xiiExpired products, 3Explicit actions, 79External benchmarking, 193–196

310 Index
FFaught, Laura, 175–176FDA (Food and Drug Administration), 5Feedback, 87Finance, 190Flax seeds, 25–26FLE (See Force-centric Logistics Enterprise)Fleet Magazine, 220Flexibility, 19, 32, 83, 170, 233–235Flextronics, 16, 119–120Food and Drug Administration (FDA), 5Food safety, 25Force-centric Logistics Enterprise (FLE), 170,
172, 174, 175, 177–179, 182Ford, Henry, xFord Motor Company, x, xiiiForecasting, 3, 4, 80, 226Form follows function principle, 111–114Forward supply chain, 87Fourth-party logistics providers (4PL), 60Franks, Tommy, 170, 179Frazier, Greg, 160, 163, 164Functional focus of metrics, 206Functional supply chain organization, 108Future Logistics Enterprise, 170
GGain sharing, 156–159Gartner, 213Gartsherrie Ironworks, ix–xGeneral Motors (GM), 217–227, 239, 240
business-results focus at, 222–223change impetus at, 218–219future of, 224information technology at, 223–224logistics at, 221–222organizational change at, 221sense and respond mandate at, 219–220service and parts operations at, 224–227
Germany, xiii, 94, 97Global commodity manager, 129Global network model, 18–19Global sales and operations planning (GS&OP), 7Global supply chain management, 3–4GM Service and Parts Operations (SPO), 224–227Greening Donald, 46–47Growth trajectory, 34GS&OP (global sales and operations planning), 7
HHarada, Takashi, 41–42Hatfield, Sue, 131, 132, 133, 135, 136Health supplements market, 25–26
Hewitt, Fred, xiHewlett-Packard (HP), 23 Hoole, Rick, xiHub, 95–96Human assets, 125–128, 227Hungary, 20
IIBM, xii, 16, 113ICL Computers, xiiiIDEA (Industry Data Exchange Association),
66IFO (See Income from operations)Improvements, metrics-driven, 202Income from operations (IFO), 133, 138Inconsistency, 62Inditex, 23Industries of Scotland (Bremner), ix–xIndustry Data Exchange Association (IDEA),
66Information, timely/accurate, 78, 85Information technology (IT) systems:
at Defense Logistics Agency, 176–177at GM, 223–224integrated, 7integration with customers’, 26–27
Innovation:competing on, 23–25
Integrated enterprise initiative, 175–177Integrated information systems, 7Integrated model, 101–102Integrated supply chain (ISC) organization, 110,
113Integrated supply chain (ISC) performance,
xiiIntegration:
of deliver process, 86and end-to-end focus, 55of information systems, 63–66of make process, 83–84of plan process, 79–80of return process, 88of source process, 82of supply chain requirements, 79
Integrity test, 51, 63–66Intellectual property (IP), 146Internal benchmarking, 193–197Internal collaboration, 148–152International Organization for Standardization
(ISO), 160–161Internet Protocol (IP) servers, 60Internet service providers (ISPs), 18Inventory carrying, 189
Index 311
Inventory management, 226Inventory-hub strategy, 95–96IP (intellectual property), 146IP (Internet Protocol) servers, 60Iraq, 170, 178–180“Iron mountain,” 182ISC organization (See Integrated supply chain
organization)ISO (See International Organization for
Standardization)ISO/IEC 17799, 160–161ISPs (Internet service providers), 18
JJamba Juice, 157–159JIT (just-in-time) deliveries, 55JLB (See Joint Logistics Board)Johns, David, 132–134, 138Johnson, David B., 44Joint Logistics Board (JLB), 174, 177–178Joint operations, 171JSTARS, 181Just-in-time (JIT) deliveries, 55
KKala, Bill, 223Kanban system, 42Kelly, Peter, 112Key performance indicators (KPIs), 99Kimball, Anne, 158, 159Kinney, Susan C., 182, 184Kitchener, John, 94, 95, 98, 100Korhonen, Pertti, 34Kosanka, Don, 137KPIs (key performance indicators), 99Kraft Foods, 113–114Kutner, Harold, 217, 219
LLasure, Ken, 183Launch leader, 5Lead time, order fulfillment, 56Lean manufacturing, 227Legacy drugs, 6Lexmark, 23Lexus automobiles, 25Life-cycle management, 172, 174–175Lippert, Keith W., 173–174, 176–177Logistics providers, 227Logistics Vision Center, 183, 184Logitech, 151–152L’Oréal, 24Lotus Development Corporation, xii
Louis Vuitton, 31“Low Return,” 147Luxury goods market, 25Lyall, Allan, 53
MThe Machine That Changed the World
(Womack, Jones, and Ross), xMAGTFs (Marine Air Ground Taskforces), 184Maintenance, repair, and overhaul (MRO), 87,
88, 144Make process, 82–84Make to order, 10–13, 72Make to stock, 10–13, 72Management information systems (MIS), 190Manufacturing locations, 2Manufacturing networks, 3–4Manugistics, 4, 94, 176Marine Air Ground Taskforces (MAGTFs), 184Markert, Norm, 40, 43–48Mass customization, 61Mastandrea, Mark, 53, 54Material availability, 226Materials acquisition, 190Materials requirements planning (MRP), 6, 238Maytag, 25McCarthy, Gavin, 184McGregor, Dave, 197McNamara, Mike, 120Medical devices industry, 12Mendez, Angel, 123–125Mergers and acquisitions, 33–34Metrics, 185–216
at Avon, 99balanced and comprehensive, 191–193benchmarking, 193–197and benefits of integrated supply chain,
123business strategy linked to, 188–191definition of, 186deliver, 86implementation of, 202–205improvements driven by, 202make, 84performance management using, 188–205plan, 80reasons for using, 186–188return, 88selection of, 205–210source, 81–82targets linked to, 197–199visibility/monitoring of, 199–202(See also Performance management)

312 Index
Mexico, 96, 196Michelin, 28–30Microsoft, 14MIS (management information systems),
190Mishler, Dennis, 225–227MIT, xiiMobility force structure, 178Model T Ford, xMonitoring, 199–202Monklands Canal, xMontres Rolex SA, 16Morales, Diane K., 169–171, 173–175, 181Morton ASP, 39, 41Morton Thiokol, 41Motorola, 61–62MRO (See Maintenance, repair, and overhaul)MRP (See Materials requirements planning)“Must have” products, 23
NNADA (National Automobile Dealers
Association), 220NAFTA (North American Free Trade
Agreement), 196National Automobile Dealers Association
(NADA), 220National Electrical Manufacturers Association
(NEMA), 66Networks:
asset, 18–20eHub, 35global, 18–19, 57manufacturing, 3–4, 6–7
Never-miss-a-sale approach, 3, 4New product introduction (NPI), 4–5, 24Next generation:
characteristics of, 232–236of collaboration, 164–167flexibility in, 233–235of organization design, 128–129simultaneity in, 235–236of supply chain architecture, 88–90of supply chain strategies, 36–37transparency in, 233
Nike, 24Nokia, 34North American Free Trade Agreement
(NAFTA), 196“Not Viable,” 143, 147Novell, 14NPI (See New product introduction)NCR, xii
OObjectives, 202–203OC (See Owens Corning)ODMs (original device manufacturers), 151OEMs (See Original equipment manufacturers)OIF (See Operation Iraqi Freedom)Ollé, Ramon, 29O’Neill, Joe, 157–158On-time delivery, 56Operating scale, 16Operation Desert Storm, 170, 179Operation Iraqi Freedom (OIF), 170, 171, 180Operational Standards Supply Chain Excellence
(OSSCE) program, 3Operations:
as strategy, 10-13uniqueness of, 17
Optimizing capacity, 5-6Order fulfillment, 53-54, 115-118Order fulfillment lead time, 56Order management, 183-184, 190Order response time, 225-226Order-to-delivery (OTD) organization, 218–224Organic foods market, 25–26Organization design, 101–129
accountability principle of, 114–119challenges to, 101core-competencies principle of, 119–122evolution of, 108–110form-follows-function principle of, 111–114functional, 108integrated, 110management support for, 122–128next-generation of, 128–129and ongoing change, 102–108partially integrated, 109principles of, 111transitional, 108, 109
Organizational change, 6–7Organizational fit, 153Original device manufacturers (ODMs), 151Original equipment manufacturers (OEMs),
151, 160, 164, 178, 217OSSCE (Operational Standards Supply Chain
Excellence) program, 3OTD organization (See Order-to-delivery
organization)Outsourcing partner relationship manager, 129Outsourcing strategy, 14–17, 104–105Overautomation, 62–63Owens Corning (OC), 131–138
changing focus at, 135–136horizontal integration at, 138

Index 313
Owens Corning (OC) (Cont.):mechanics of transformation at, 136–137organizational changes at, 133–134supplier collaboration with, 137–138technology changes at, 132–133vision at, 134–135
PPACE (Product And Cycle-time Excellence), 67Pakistan, 183palmOne, Inc., 123–125Partner-interface processes (PIPs), 70Partnerships, 227Patents, 1PBAs (See Performance-based agreements)PCs (See Personal computers)PD2 (Procurement Desktop 2), 176PDAs (See Personal digital assistants)Pearce, Mike, 107Pennsylvania State University, xiiPerformance-based agreements (PBAs), 180–181Performance management, 81–82
metrics used in, 188–205next-generation, 213–216performance measurement vs., 187real-time, 2333Com’s use of, 210–213(See also Metrics)
Performance measurement, 187The Performance Measurement Group, LLC
(PMG), 123, 194, 203, 207, 215, 230Perry, Nolan, 151, 152Personal computers (PCs), 9–10Personal digital assistants (PDAs), 123–125P&G (See Procter & Gamble)Pharmaceuticals industry, 1–7, 12, 25Pick-to-order strategy, 61PIPs (partner-interface processes), 70Pitney Bowes, xiiiPlan deliver, 69, 78Plan make, 69, 78Plan process, 75–77Plan return, 69, 78Plan source process, 76, 78, 80Planning process, 78–80, 190PMG (See The Performance Measurement
Group, LLC)Point-of-sale information, 24Poland, 94, 96, 97Porter, Michael, 35Power:
alignment with position of, 30–32balance of, 17
Precision weaponry, 170Prepositioning, 178–179Prioritization, 236–241
business-driven approach to, 237–238cultural/environmental factors in, 240–241identifying change in, 238–239and interrelationships among initiatives, 239,
240Problem-resolution time, 18Process architecture content, 90Process automation, 90Process categories, 72Process focus of metrics, 206Process inconsistency, 62Process reference model, 67, 68Process-element level, 74–77Procter & Gamble (P&G), 10, 125–126Procurement Desktop 2 (PD2), 176Procurement strategies, 81Product And Cycle-time Excellence (PACE), 67Product development, 25Product life cycle, 13, 20Product packaging, 32Product proliferation, 61–62Product teams, 6Product variants, 13Production shifts between plants, 5–6Program Implementation Group, 174, 175Proliferation, product/service, 61–62Prozac, 1PRTM, ix, xi–xiii, xvi, 67, 68, 123, 134, 194, 230Pull communication, 145Purchase-to-order strategy, 61Push communication, 145Push-pull models, 170–172
QQuality:
competing on, 25–26standards of, 83and supply chain architecture, 52
Quigley, Mike, 155
RRabinowitz, Burt, 154RACI analysis, 115–118Radio frequency identification (RFID), 25, 179,
239R&D (See Research and development)Real-time performance management, 233Redundant facilities, 4Regional network model, 19

314 Index
Regional planning group, 94Regional/product group scorecard, 215Registration strategy, 2Regulations, 185–186Reorganization, 98–100Research and development (R&D), 2Resources, 79Responsibility, 116Ressner, Meg, 133–137Return on net assets (RONA), 138Return policies, 87Return process, 82, 83, 86–88Revenue opportunities, 88Reverse supply chain, 87–88Rewards sharing, 156–159RFID (See Radio frequency identification)Rineaman, Keith, 183Risk sharing, 156–157Roadmap to change, 229–247
adaptation step of, 244–246and advanced systems, 230–232design step of, 241–244developing, 236–246next-generation characteristics on, 232–236prioritization step of, 236–241
Rolex, 16, 31Roloff, Michelle, 194, 208–209Romania, 20RONA (return on net assets), 138Rosbottom, John, 47Rosen, Jeff, 126, 127RosettaNet, 68, 70, 166Ross, Brad, 218, 219, 223, 224Rucker, Jon, 6
SSales and operations planning (S&OP), 7, 135SAP, 132, 176Sarbanes-Oxley Act, 185–186Scale, 15
operating, 16–17and power, 31
SCC (See Supply-Chain Council)Scheibner, Mary, 196–197Schlaefli, Robert, 103, 104, 106Schofield, John, 127Schwarzkopf, Norman, 170Scope, 15
changes in, 33definition of, 67–68enterprise, 90supply chain strategy, 37
Scope management, 245
SCOR model (See Supply-Chain OperationsReference-model)
Scorecards, 81–82, 192–193, 198, 203,211–215
Scotland, ix–xSCPA ownership, 90SCTS (Supply Chain and Technology
Solutions), 134Security, 160–161Segmentation, 153
customer, 26supply chain, 37
Seiko Epson Corporation, 29Semiconductor industry, 12Senior management, 122–128Service:
competing on, 26–27cost to serve balanced with, 84, 85and supply chain architecture, 52
Service agents, 14Service proliferation, 61–62Shell Chemical, 9, 26–27Shifting work, 5–6Shingo Prize for Excellence in Manufacturing, 44Siemens Nixdorf, Ltd., xiiiSIMON (See Supplier inventory management
order network)Simplicity, 51, 59–63, 79Simultaneity, 234–236Six Sigma, 83Skinner, Brett, 46, 47Smith Bits, 106–107Solectron, 16Sony, 24S&OP (See Sales and operations planning)Source process, 71, 75–76, 80–84, 88Speed, 83, 170Speed-to-market capabilities, 6SPO (See GM Service and Parts Operations)SSADM (Structured Systems Analysis Design
Method), xiiiStalk, George, Jr., xiStandardization, 94, 96
of global processes, 3–4of manufacturing processes, 5
Stanford University, xiiStraight-through processing, 85Strategic alliances, 129, 146Strategic Facilities Planning Team, 5Strategic fit test, 50–55Strategic importance, 153Stratex Networks, 103–106Structured methodology, 54
Index 315
Structured Systems Analysis Design Method(SSADM), xiii
Subcontractor management, 73, 74Supplier inventory management order network
(SIMON), 26–27Supplier scorecards, 81–82, 129Supply Chain and Technology Solutions
(SCTS), 134Supply chain architecture, 49–90
components of, 50deliver-process, 84–86end-to-end focus test of, 55–59integrity test of, 63–66make-process, 82–84next-generation, 88–90planning-process, 78–80return-process, 86–88SCOR model of, 70–77simplicity test of, 59–63source-process, 80–82strategic fit test of, 51–55tests of, 50–66toolkits for, 66–70
Supply chain configuration, 60–61Supply-Chain Council (SCC), xii–xiv, 68Supply chain design, 4Supply chain for return, 87Supply chain management, xi, xivSupply Chain Management Benchmarking
Study, 207Supply-Chain Operations Reference-model
(SCOR), 68–77Avon’s use of, 94benefits of each level of, 77development of, xii–xivDoD’s use of, 175, 183, 184level 1 of, 70–72, 207–209level 2 of, 72–74level 3 of, 74–77objectives set with, 203Owens Corning’s use of, 135palmOne’s use of, 124
Supply chain optimization, 4Supply chain performance analyst, 129Supply chain process improvement manager, 129Supply chain process maturity, 231Supply chain scorecard, 198, 213, 214Supply chain stewards, 6Supply chain strategy, 9–37
adaptability of, 32–35and asset network, 18–20business strategy alignment with, 20–27channel, 13–14
Supply chain strategy (Cont.):criteria of good, 20customers’ needs alignment with, 27–30customer service, 17–18next-generation, 36–37operations, 10–13outsourcing, 14–17power position alignment with, 30–32
Supply chain(s):definition of, 67–68separate, 28–29
Supply-Chain Consortium, xiiSynchronization of manufacturing activities, 83Synchronized collaboration, 143, 146–147Systems inconsistency, 62
T“The tail,” 171–172Target (store), 53Targets, performance, 188, 197–199TCO (See Total cost of ownership)Technology:
changes in, 33collaboration supported by, 161–163at Owens Corning, 136–137
Technology expertise, 16Technology fit, 153Telecommunications industry, 12Tellabs, 16–17Tests, supply chain architecture, 50–66Third-party manufacturing, 2Third-party providers, 15Thomas, Ken, 23Com Corporation, 210–213Ticknor, Jim, 213Time to market, 24Time to volume, 24Time-definite delivery, 178Timeliness of information, 78, 85“Time—The Next Source of Competitive
Advantage” (George Stalk, Jr.), xi Tire industry, 25, 28–30Titles, 110“To be” design, 75“Toolkit” environment, 3Toolkits, supply chain architecture, 66–70Total cost of ownership (TCO), 80–82, 125Total cost of returns, 87Total inventory days of supply, 80Total life-cycle systems management, 172Total supply chain management cost, xii , 56Toth, Bob, 92, 99Toyota, 41–42, 45–47

316 Index
Toys “R” Us, 53Traceability, 25, 85Tracking, 85, 188Training, 99Transactional collaboration, 143–145TRANSCOM (See U.S. Transportation
Command)Transparency, 233, 234Transport, commercial, 179–180Tropicana, 25Trust, 159–161
UUCC (See Uniform Code Council)Uniform Code Council (UCC), 66, 70Uniqueness, 16, 17United Kingdom, xiiiU.S. Department of Defense (DoD), 169–184
change drivers at, 172–174end-to-end initiative at, 177–180integrated enterprise initiative at, 175–177life-cycle management at, 174–175and Marine Corps, 182–184performance-based agreements at, 180–181push-pull models for, 170–172
U.S. Marine Corps, 182–184U.S. Transportation Command (TRANSCOM),
172, 174, 175, 180Unmanned aerial vehicles, 171UPS Logistics, 60–61
VValue management, 244–245Value-added reseller channels, 14“Vanilla” products, 13Vector SCM, 222
Vehicle order management (VOM) system, 219Vending machines, 14Vendor-managed inventory (VMI), 58, 146VISA (Voluntary Intermodal Sealift
Agreement), 179Visibility, 179, 199–202, 226Vision, 134–135, 243–244VMI (See Vendor-managed inventory)VoC (See Voice of the customer)Voice of the customer (VoC), 28Voluntary Intermodal Sealift Agreement
(VISA), 179Volvo, 39VOM (vehicle order management) system,
219
WWade, Danny, 155Wal-Mart, 9, 10
channel strategy used by, 14DoD compared to, 169, 170power position of, 31uniqueness of operations at, 17
Walton, Sam, 10Warehousing, 53–54Watch industry, 16Watson, Michael, 93–95, 97, 98, 100Web-enabled global planning system, 4Whitcomb, John, 224Williams, Gray, 151–152
XXerox Corporation, xi, xii
ZZara, 23–25, 27
About the Authors
Shoshanah Cohen and Joseph Roussel are lead partners in the Worldwide SupplyChain Practice of global management consultancy Pittiglio Rabin Todd & McGrath(PRTM). Both were instrumental in PRTM’s development of the industry-standardSupply-Chain Operations Reference-model (SCOR) and have worked with num-erous management teams to define and implement dramatic improvements insupply chain effectiveness. Cohen, based in Mountain View, California, sits on the advisory board of several industry journals, and speaks frequently at internationalforums on supply chain issues, as does Roussel, who is based in Paris, France.
Copyright © 2005 by The McGraw-Hill Companies, Inc. Click here for terms of use.