Strategic Planning Project Work Session #2 PresentationStrategic Planning Project Work Session #2...
65
Strategic Planning Project Work Session #2 Presentation December 12, 2006 * * Partial underwriter of project costs.
Transcript of Strategic Planning Project Work Session #2 PresentationStrategic Planning Project Work Session #2...

Strategic Planning ProjectWork Session #2 Presentation
December 12, 2006
Strategic Planning ProjectWork Session #2 Presentation
December 12, 2006
*
* Partial underwriter of project costs.

Page
I. Introduction............................................................................................................…….…….………1– Project Objectives– Agenda for Today
II. Dental Analysis…………………...………….............……………………………………………………..4– Approach & Data Sources– Utilization Rate by Organization– Demand Analysis
III. Emergency Services Analysis………………………………………………………………………... 31– Approach & Data Sources– Demand Analysis
IV. Discussion………………………………………………………………………………………………….. 45– Summary From Work Session #1– Topics For Discussion
Table of Contents

I. Introduction
Project Objectives
I. To determine the optimal location and configuration of all MHM owned and funded clinics to best fulfill the mission of Methodist Healthcare Ministries within the context of: – Current and projected demographic and socioeconomic trends; and
– Strategic direction of all MHM owned and funded Community Health Clinics.
II. To develop a data-driven framework for rationalizing resource allocation of all Partner Organizations. This includes analysis of socioeconomic/demographic trends in the San Antonio MSA and development of a Demand Analysis model for projecting the healthcare needs of the targeted population.
III. To work with MHM and the leadership of organizations funded by MHM to develop consensus on the coordination and prioritization of facility projects.
Page 1

I. Introduction Agenda
• Dental Analysis– Approach & Use Rates
– 2005 Estimated Low-Income / Uninsured Volumes
– 2005 Estimated Utilization Rate by Partner Organization
– Projected Growth in Volumes 2005 Through 2016• By Age Cohort
• By Location
• By Specialty
• By Scenario
• Emergency Services Analysis– Approach & Use Rates
– Projected Growth in Volumes 2005 Through 2016• By Age Cohort
• By Location
• Discussion– Summary of Work Session #1– Topics for Discussion– Prioritization of Facility Projects– Coordination of Future Planning Efforts
Page 2

Final Report• Executive Summary
– 10 – 12 Pages of Text & Selected Graphs– Objectives– Process– Key Findings– Recommendations
• Consolidated Slides From Work Sessions #1 & #2
• Will Address – Feedback from both Worksessions– Additional analysis as required
I. IntroductionNext Steps
Page 3

II. Dental Analysis Demand Analysis Approach
Target Population
Total Target Population
Visits Population Dental Visits
Required Space DriversService Area
Definition
• Bexar County• San Antonio MSA• Partner Organizations
– Primary SA– Secondary SA
• 2005 Through 2016• By Age Cohort
• By Age Cohort• By Specialty
• Exam Rooms• Other Drivers
PercentageTarget
Population
DentalUse Rates
• By Age Cohort• Total Population• 100% FPL• 200% FPL
Utilization Rates
Visits Per Space Driver
• Adequate for Peaks
• 2005 Through 2016• By 7 Age Cohorts:
– 0 – 14– 15 – 17– 18 – 24– 25 – 44– 45 – 64– 65 – 74– 75+
• By Age Cohort
• Visits / 100 Population• By Age Cohort
• 2005 Through 2016• By Scenario:
– Baseline– Medium– High
Page 4

II. Dental Analysis Data Sources
Demographics• Claritas 2000, 2006, & 2011 • U.S. Census Bureau
Use Rates• Centers for Disease Control and Prevention / National Center for Health Statistics
– National Health Interview Survey (NHIS) - 2001– http://drc.hhs.gov/report/dqs_tables/4.htm
• National Dental Visits Per 100 Population by Age Cohort
Dental Visits• CommuniCare • CentroMed• Methodist Healthcare Ministries• Daughters of Charity
Age Cohort NHIS 2001
2 - 4 Years 42.20
5 - 14 Years 80.70
15 - 24 Years 66.20
25 - 34 Years 61.80
35 - 44 Years 66.30
45 - 54 Years 67.90
55 - 64 Years 65.10
65 - 74 Years 58.70
75 - 84 Years 55.00
85+ Years 47.70
Total Population 65.70
Page 5

Notes on Utilization Rate:
• No database of actual dental visits is available• Denominator is based on estimates developed by applying nationally recognized use rates to the
200% population• In lieu of actual data, approach estimates the closest proxy for utilization
II. Dental AnalysisUtilization Rates
Utilization Rates Methodology
Partner Organization Dental Visits- Bexar County- MSA Excluding Bexar County
Estimated Total Visits – 200% FPL- Bexar County- MSA Excluding Bexar County
=
Page 6
Utilization Rates (Percentage of Expected Visits
by Organization)
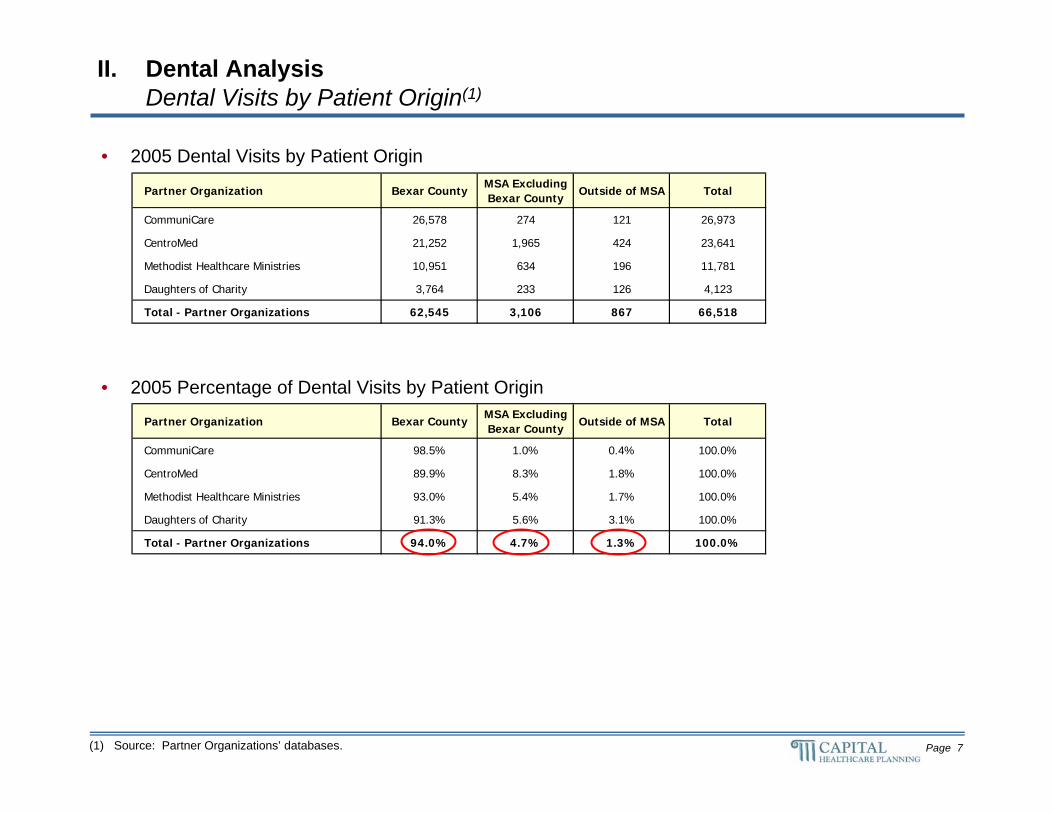
• 2005 Dental Visits by Patient Origin
• 2005 Percentage of Dental Visits by Patient Origin
Partner Organization Bexar CountyMSA Excluding Bexar County
Outside of MSA Total
CommuniCare 98.5% 1.0% 0.4% 100.0%
CentroMed 89.9% 8.3% 1.8% 100.0%
Methodist Healthcare Ministries 93.0% 5.4% 1.7% 100.0%
Daughters of Charity 91.3% 5.6% 3.1% 100.0%
Total - Partner Organizations 94.0% 4.7% 1.3% 100.0%
II. Dental Analysis Dental Visits by Patient Origin(1)
(1) Source: Partner Organizations’ databases.
Partner Organization Bexar CountyMSA Excluding Bexar County
Outside of MSA Total
CommuniCare 26,578 274 121 26,973
CentroMed 21,252 1,965 424 23,641
Methodist Healthcare Ministries 10,951 634 196 11,781
Daughters of Charity 3,764 233 126 4,123
Total - Partner Organizations 62,545 3,106 867 66,518
Page 7

16,1007,404
235,141
27,81839,041
145,970
0
50,000
100,000
150,000
200,000
250,000
0-17 Years 18 - 64 Years 65+ Years
Partner Organizations' Clinic Visits Expected Visits - 200% FPL
II. Dental Analysis Dental Visits & Utilization by Age Cohort – Bexar County(1)
(1) Source: Partner Organizations’ databases.
2005 Dental Visits by Age Cohort - Bexar
• Partner Organizations account for 15.3% of the expected visits for the 200% FPL population of Bexar County• Utilization varies significantly by age cohort:
– 11.0% of expected volumes from 0 – 17 age cohort– 16.6% of expected volumes from 18 – 64 cohort– 26.6% of expected volumes from 65+ age cohort
Page 8

Partner Organization 0-17 Years 18 - 64 Years 65+ Years Total
CommuniCare 2.9% 7.7% 15.1% 6.5%
CentroMed 6.0% 4.7% 5.2% 5.2%
Methodist Healthcare Ministries 1.9% 2.9% 4.7% 2.7%
Daughters of Charity 0.3% 1.3% 1.6% 0.9%
Total - Partner Organizations 11.0% 16.6% 26.6% 15.3%
Total - Other 89.0% 83.4% 73.4% 84.7%
II. Dental Analysis Dental Visits & Utilization by Age Cohort – Bexar County(1)
• 2005 Market Dental Visits - Bexar County
• 2005 Utilization – Bexar County
(1) Source: Partner Organizations’ databases.
Partner Organization 0-17 Years 18 - 64 Years 65+ Years Total
CommuniCare 4,212 18,176 4,190 26,578
CentroMed 8,709 11,086 1,457 21,252
Methodist Healthcare Ministries 2,807 6,826 1,318 10,951
Daughters of Charity 372 2,952 440 3,764
Total - Partner Organizations 16,100 39,041 7,404 62,545
Total Expected Market - 200% FPL 145,970 235,141 27,818 408,929
Variance 129,871 196,100 20,414 346,385
Page 9
II. Dental Analysis
Key Issues• From which areas of Bexar County do the Partner Organizations’ dental visits originate?
• What do these volumes represent in terms of expected volumes?
Following Slides Map:• Dental Visits of Individual Partner Organizations
• Utilization Rates of Individual Partner Organizations
Page 10

3,143
1,572
2,920
1,524
1,526
2,173 1,621
1,331
2,117
823
3,971
1,725
251
1,291
565
1,104
565
1,463
1,846
388
696
2,824
2,093
1,128
986
96
353
813
1,254
823
828180
1,735
1,463
1,426
725
613
1,036
1,439
785
211
663
473
1,674
286
1,901
574
2,828285
2,144
1,257
838 966
8731,017
1,385
4,272
2,033
3,959
2,721
1,381
1,640 630
2,114
2,585
2,347
3,110
509
334
1,583
1,565
1,1621,947
1,298
1,347
1,267
2,192
1,446
2,013
4,159
842
3,021
1,560
2,117
2,421
2,217
2,221
2
1,458
1,055
1,012
1,099
1,7691,102
730
1,458
8881,113
1,533
1,973
1,412
1,656
3,339
629
989
1,127
2,538
960
834
21,227
2,616
1,877
1,972
1,6111,097
636
856
1,7691,167
1,155
621
2,054
646
1,212
1,115
658
212
3,377
3,518
804
1,601
1,778
837
1,109
2,869
792
1,980
1,135
1,5092,394
3,225927 610
541947
340
1,049
3,009 773
1,758
1,872
1,025
1,4701,881
2,392
874
3,290
751
1,650
950
966
3,3352,722
1,962
399
2,917
2,702
2,813
152
2,338
966
1,6851,940
2,678
1,468
2,245
926794
629
987
1,7392,403
1,493
1,623
1,396
498
2,496
1,132
2,036
1,385
1,943
1,837
1,459361
2,672
1,888
1,662
1,153
1,374
2,169 961
877
1,426
244
1,734
958
802
592
878
87
181
81
10
281
35
281
37
90
35
410
90
78
16
97
1604
16
1604
122
173
422
10
35
35
10
37
10
Camp Bullis
Medina Lake
BEXAR
Lackland AirForce Base
Fort SamHouston
Randolph AirForce Base
Kelly AirForce Base
BrooksAir Force Base
CalaverasLake
BraunigLake
MitchellLake
LakeMc Queeney
ATASCOSA
MEDINA
BANDERA
KENDALL
COMAL
GUADALUPE
WILSON
HELOTES
CASTROVILLE
LYTLE
DEVINE
SOMERSET
ELMENDORF
FLORESVILLE
LA VERNIA
NEW BERLIN
MCQUEENEY
NEWBRAUNFELS
NORTHCLIFFLAKEHILLS
II. Dental Analysis 2005 Estimated Dental Visits at 200% FPL(1)
Miles
0 5 10 15
CentroMedCommuniCareDaughters of CharityMethodist Healthcare MinistriesUniversity Health System
(1) Source: Capital Healthcare Planning estimated volumes. Page 11

157
26
267
6
69
148 325
3
104
51
1,181
465
6
4
40
97
8
59
817
143
40
935
107
242
27
4
75
19
190
278
227106
46
5
404
55
20
25
43
4
13
3
59
84
1
350
16
97
200
86
12 60
2247
171
362
7
229
391
78
36 45
231
471
88
1,390
33
87
79
179
7071
214
73 104
6
58
224
63
199
845 518
79
1,049
44
5
797
252 147
387
282
178
41
16
52
11179
72
96
7017
134
135
71
251294
1,515
53
242
47
367
93
110
40
613
162
394
17271
62
45
86104
71
98123
15
115
112
16
35
413294
64
36
37
457
470
48
26
72
113
3
121
629
36
194
38
105
322
143
95
374
55 35
3542
12
4
831 221
409
111
57
637591
396
55
710
94
78
62
54
13
339
74178
526
65
389
48
842
459
333
14
579
128
96268
106
76
423 517
10
43
2
43
387 486
24
83
43
15
113
251298
402258
225
5355
140
867
167
273
49
334
272
118
261
157
3040
276
570
200
291
544
270803
172
220
70
108
60142
91
400
199
634484 173
152
239
76
188
80
414
775754
187
74
197
88
96
66
87
181
81
10
281
35
10
281
37
90
35
410
90
90A
78
16
97
1604
16
1604
13
122
173
422 536
10
35
35
10
37
10
Camp Bullis
Medina Lake
BEXAR
Lackland AirForce Base
Fort SamHouston
Randolph AirForce Base
Kelly AirForce Base
BrooksAir Force Base
CalaverasLake
BraunigLake
MitchellLake
LakeMc Queeney
ATASCOSA
MEDINA
BANDERA
KENDALL
COMAL
GUADALUPE
WILSON
HELOTES
CASTROVILLE
LYTLE
DEVINE
SOMERSET
ELMENDORF
FLORESVILLE
LA VERNIA
NEW BERLIN
MCQUEENEY
NEWBRAUNFELS
NORTHCLIFFLAKEHILLS
II. Dental Analysis 2005 Partner Organizations’ Dental Visits(1)
(1) Source: Partner Organizations’ databases.
Miles
0 5 10 15
CentroMedCommuniCareDaughters of CharityMethodist Healthcare MinistriesUniversity Health System
Page 12

5.0%
1.6%
9.1%
0.4%
4.5%
6.8% 20.0%
0.2%
4.9%
6.2%
29.8%
26.9%
2.4%
0.3%
7.0%
8.8%
1.4%
4.0%
44.3%
36.8%
5.7%
33.1%
5.1%
21.4%
2.8%
0.4
21.3%
2.4%
15.1%
33.8%
27.4%59.1%
2.7%
0.3%
28.3%
7.6%
3.3%
2.4%
3.0%
0.4%
6.4%
0.5%
12.4%
5.0%
0.3%
18.4%
2.8%
0.3%2.4%
9.3%
6.8%
1.5% 6.3%
2.5%4.6%
12.3%
8.5%
0.3%
5.8%
14.4%
5.7%
2.2% 7.2%
10.9%
18.2%
3.7%
44.7%
6.6%
26.0%
5.0%
11.4%
6.0%3.6%
5.6%
0.4%
4.6%
10.2%
4.4%
9.9%
20.3%
9.4%
34.7%
2.8%
0.2%
32.9%
11.4%
17.2%
12.7%
0
12.2%
3.9%
1.5%
4.7%
6.3%7.2%
9.9%
6.6%
7.9%1.6%
8.7%
6.8%
5.0%
17.7%
45.4%
8.5%
4.7%
13.2%
14.5%
9.7%
13.2%
03.3%
23.4%
8.6%
20.0%
10.7%6.5%
9.8%
5.2%
5.9%
5.8%
8.4%10.7%
2.4%
5.6%
5.5%
2.5%
2.9%
26.3%
17.0%
13.5%
13.4%
6.0%
4.5%
6.4%
0.3%
10.9%
21.9%
9.8%
3.3%
7.0%6.0%
3.0%
14.8%
5.9% 5.7%
6.5%4.4%
3.4%
0.3%
28.6%
23.2%
5.9%
5.5%
6.3%5.1%4.9%
43.4%
16.6%
6.3%
21.6%
12.5%
4.7%
6.5%
1.3%
10.2%
3.0%6.6%
26.8%
16.3%
4.7%
17.0%
11.9%
9.2%
24.8%
5.7%15.6%
15.8%
2.4%2.9%
21.7%
2.6%
4.8%2.4%
11.4%
14.4%12.4%14.3%
16.1%
10.6%5.9%
34.7%
14.8%
3.6%
17.2%
15.6%
14.8%
8.1%
21.3%
15.1%
28.7%
28.8%
16.2%
12.3%
22.3% 18.0%
17.4%
19.6%
44.7%
4.7%
10.4%
87
181
81
10
281
35
281
37
90
35
410
90
78
16
97
1604
16
1604
122
173
10
35
35
10
37
35
10
Camp Bullis
Medina Lake
BEXAR
Lackland AirForce Base
Fort SamHouston
Randolph AirForce Base
Kelly AirForce Base
BrooksAir Force Base
CalaverasLake
BraunigLake
MitchellLake
LakeMc Queeney
ATASCOSA
MEDINA
BANDERA
KENDALL
COMAL
GUADALUPE
WILSON
HELOTES
CASTROVILLE
LYTLE
DEVINE
SOMERSET
ELMENDORF
FLORESVILLE
LA VERNIA
NEW BERLIN
MCQUEENEY
NEWBRAUNFELS
NORTHCLIFFLAKEHILLS
II. Dental Analysis 2005 Partner Organizations’ Dental Utilization Rates(1)
(1) Source: Partner Organizations’ databases.
Miles
0 5 10 15
CentroMedCommuniCareDaughters of CharityMethodist Healthcare MinistriesUniversity Health System
Page 13

II. Dental Analysis Demand Analysis
Key Issues• What is the expected future growth in demand in Bexar County and the MSA?
– From 2005 through 2016
– By Age Cohort
• Where is the growth expected to occur?
Following Slides:• Map projected demand growth from 2005 through 2016
– Total Visits Increase
– Percentage Increase
• Quantify Bexar County and MSA total demand from 2005 through 2016
Page 14

3,143
1,572
2,920
1,524
1,526
2,173 1,621
1,331
2,117
823
3,971
1,725
251
1,291
565
1,104
565
1,463
1,846
388
696
2,824
2,093
1,128
986
96
353
813
1,254
823
828180
1,735
1,463
1,426
725
613
1,036
1,439
785
211
663
473
1,674
286
1,901
574
2,828285
2,144
1,257
838 966
8731,017
1,385
4,272
2,033
3,959
2,721
1,381
1,640 630
2,114
2,585
2,347
3,110
509
334
1,583
1,565
1,1621,947
1,298
1,347
1,267
2,192
1,446
2,013
4,159
842
3,021
1,560
2,117
2,421
2,217
2,221
2
1,458
1,055
1,012
1,099
1,7691,102
730
1,458
8881,113
1,533
1,973
1,412
1,656
3,339
629
989
1,127
2,538
960
834
21,227
2,616
1,877
1,972
1,6111,097
636
856
1,7691,167
1,155
621
2,054
646
1,212
1,115
658
212
3,377
3,518
804
1,601
1,778
837
1,109
2,869
792
1,980
1,135
1,5092,394
3,225927 610
541947
340
1,049
3,009 773
1,758
1,872
1,025
1,4701,881
2,392
874
3,290
751
1,650
950
966
3,3352,722
1,962
399
2,917
2,702
2,813
152
2,338
966
1,6851,940
2,678
1,468
2,245
926794
629
987
1,7392,403
1,493
1,623
1,396
498
2,496
1,132
2,036
1,385
1,943
1,837
1,459361
2,672
1,888
1,662
1,153
1,374
2,169 961
877
1,426
244
1,734
958
802
592
878
87
181
81
10
281
35
281
37
90
35
410
90
78
16
97
1604
16
1604
122
173
422
10
35
35
10
37
10
Camp Bullis
Medina Lake
BEXAR
Lackland AirForce Base
Fort SamHouston
Randolph AirForce Base
Kelly AirForce Base
BrooksAir Force Base
CalaverasLake
BraunigLake
MitchellLake
LakeMc Queeney
ATASCOSA
MEDINA
BANDERA
KENDALL
COMAL
GUADALUPE
WILSON
HELOTES
CASTROVILLE
LYTLE
DEVINE
SOMERSET
ELMENDORF
FLORESVILLE
LA VERNIA
NEW BERLIN
MCQUEENEY
NEWBRAUNFELS
NORTHCLIFFLAKEHILLS
II. Dental Analysis 2005 Estimated Dental Visits at 200% FPL(1)
(1) Source: Capital Healthcare Planning estimated volumes.
Miles
0 5 10 15
CentroMedCommuniCareDaughters of CharityMethodist Healthcare MinistriesUniversity Health System
Page 15

9.3%
-2.9%
6.1%
28.0%
-7.6%
9.1% 6.9%
15.7%
22.9%
2.5%
10.6%
-9.7%
4.8%
9.7%
15.6%
-13.0%
39.0%
14.4%
-1.5%
12.7%
9.0%
7.3%
25.1%
-1.7%
6.7%
-2.
1.0%
27.3%
11.4%
5.1%
11.0%-12.5%
43.5%
14.5%
17.8%
48.7%
23.0%
19.5%
35.4%
7.9%
2.2%
13.5%
46.2%
14.4%
4.5%
14.2%
-3.2%
23.1%-9.8%
14.8%
6.5%
52.4% 14.7%
4.5%9.3%
14.0%
21.0%
20.8%
26.0%
9.4%
35.8%
40.5% 9.9%
0.2%
5.7%
16.0%
5.4%
10.9%
4.4%
13.1%
17.9%
4.5%9.7%
19.9%
16.3%
26.8%
13.9%
11.2%
13.2%
1.8%8.5%
11.5%
10.5%
22.6%
14.0%
-4.4%
1.5%
-4.1%
28.9%
1
14.9%
14.8%
11.8%
11.4%
0.7%0.7%
32.2%
1.6%
-12.3%24.0%
3.0%
8.4%
11.1%
4.7%
1.1%
7.8%
3.2%
12.8%
10.0%
5.8%
6.0%
725.4%
1.6%
7.4%
3.5%
15.6%13.4%
20.8%
-1.6%
18.1%
17.3%
14.9%11.2%
-3.6%
-4.3%
15.6%
8.1%
3.7%17.3%
-0.3%
11.8%
25.4%
14.7%
1.4%
-2.2%
5.9%
14.4%
0.3%
-0.6%
-3.7%21.7%
40.0%
1.9%
19.2% -8.2%
22.3%-6.8%
30.2%
5.6%
6.2% 20.1%
-0.2%
2.7%
2.8%
6.6%6.1%
6.6%
24.5%
-11.6%
11.0%
22.2%
6.5%
-9.3%
9.1%
4.4%
11.3%5.3%
6.1%
11.7%
5.4%
13.8%
8.2%
3.4%
9.2%
9.6%
10.2%16.5%
12.0%
5.2%
5.5%
4.0%5.1%
2.4%
-2.4%3.7%9.7%
0.7%
3.3%-2.4%
8.8%
0.0%
7.1%
11.0%
7.0%
14.8%
3.7%
3.2%
7.1%
5.9%
8.6%
9.2%4.8%
9.6%
6.1% 7.0%
0.2%
6.6%
-4.1%
3.2%7.1%
3.8%
3.4%
-4.5%
87
181
81
10
281
35
281
37
90
35
410
90
78
16
97
1604
16
1604
122
173
422
10
35
35
10
37
35
10
Camp Bullis
Medina Lake
BEXAR
Lackland AirForce Base
Fort SamHouston
Randolph AirForce Base
Kelly AirForce Base
BrooksAir Force Base
CalaverasLake
BraunigLake
MitchellLake
LakeMc Queeney
ATASCOSA
MEDINA
BANDERA
KENDALL
COMAL
GUADALUPE
WILSON
HELOTES
CASTROVILLE
LYTLE
DEVINE
SOMERSET
ELMENDORF
FLORESVILLE
LA VERNIA
NEW BERLIN
MCQUEENEY
NEWBRAUNFELS
NORTHCLIFFLAKEHILLS
II. Dental Analysis Percentage Growth in Estimated Visits at 200% FPL 2005 - 2011(1)
(1) Source: Capital Healthcare Planning estimated volumes.
Miles
0 5 10 15
CentroMedCommuniCareDaughters of CharityMethodist Healthcare MinistriesUniversity Health System
Page 16

20.7%
-0.1%
14.3%
57.3%
-7.9%
16.4% 15.8%
37.3%
50.4%
7.6%
20.0%
-17.1%
8.4%
24.2%
38.5%
-20.5%
92.2%
30.9%
-2.2%
32.7%
23.5%
13.5%
56.6%
-1.9%
19.3%
3.7
1.9%
57.7%
19.4%
8.5%
28.1%-19.1%
95.3%
39.7%
32.0%
107.0%
61.4%
36.9%
88.4%
17.9%
11.2%
24.3%
117.3%
24.8%
17.6%
30.1%
-1.7%
49.3%-15.7%
26.6%
10.4%
109.4% 39.2%
9.2%35.0%
29.6%
38.5%
45.0%
55.7%
14.7%
81.2%
79.2% 22.1%
3.5%
8.3%
41.0%
9.5%
24.7%
5.5%
27.8%
30.0%
10.1%25.3%
49.6%
30.5%
51.9%
26.8%
21.8%
22.3%
1.6%
21.0%
18.7%
46.5%
26.2%
-8.0%
0.8%
-6.3%
55.2%
2
29.3%
22.3%
28.4%
22.0%
1.1%7.5%
71.2%
6.3%
-10.5%49.2%
7.8%
15.5%
21.9%
5.1%
0.4%
9.5%
20.8%
14.8%
9.2%
9.2%
163.4%
1.8%
13.0%
6.4%
28.6%23.7%
37.0%
2.4%
30.1%
37.8%
28.7%20.2%
-4.9%
2.3%
36.6%
18.3%
5.6%27.0%
3.5%
20.9%
45.7%
39.1%
4.3%
-2.2%
13.4%
23.6%
0.7%
-3.1%
-2.8%42.0%
83.2%
2.8%
46.3% -13.5%
36.6%-9.5%
54.1%
12.6%
8.2% 38.4%
0.5%
3.7%
14.3%
10.3%21.3%
11.4%
47.3%
-16.4%
17.5%
50.5%
11.6%
16.0%
7.2%
22.2%9.9%
7.8%
20.1%
7.8%
23.2%
14.4%
6.8%
9.7%
13.6%
16.2%27.4%
19.9%
9.9%
8.3%
9.4%20.1%
2.1%
-6.4%3.0%15.1%
-1.0%
1.7%-2.4%
13.5%
-2.2%
17.5%
9.5%
25.4%
6.6%
3.2%
9.7%
8.5%
14.4%
13.3%7.4%
12.3%
9.8% 8.7%
-1.0%
12.2%
-3.7%
4.3%11.5%
1.5%
2.2%
-8.1%
87
181
81
10
281
35
281
37
90
35
410
90
78
16
97
1604
16
1604
122
173
422
10
35
35
10
37
35
10
Camp Bullis
Medina Lake
BEXAR
Lackland AirForce Base
Fort SamHouston
Randolph AirForce Base
Kelly AirForce Base
BrooksAir Force Base
CalaverasLake
BraunigLake
MitchellLake
LakeMc Queeney
ATASCOSA
MEDINA
BANDERA
KENDALL
COMAL
GUADALUPE
WILSON
HELOTES
CASTROVILLE
LYTLE
DEVINE
SOMERSET
ELMENDORF
FLORESVILLE
LA VERNIA
NEW BERLIN
MCQUEENEY
NEWBRAUNFELS
NORTHCLIFFLAKEHILLS
II. Dental Analysis Percentage Growth in Estimated Visits at 200% FPL 2005 - 2016(1)
(1) Source: Capital Healthcare Planning estimated volumes.
Miles
0 5 10 15
CentroMedCommuniCareDaughters of CharityMethodist Healthcare MinistriesUniversity Health System
Page 17

291
-45
177
426
-115
197 112
209
485
20
422
-167
12
125
88
-143
220
211
-28
49
62
205
526
-19
66
-2
4
222
142
42
91-23
755
213
253
353
141
202
509
62
5
90
219
240
13
269
-18
655-28
318
82
439 142
3995
193
897
423
1,028
254
495
664 62
4
147
375
168
55
15
208
280
52188
-60
258 555
220
339
304
162
265
76 102
97
318135
353
297
-106
33 158
-93
641
217
156
119
125
128
235
24
-109267
45
166
157
29478
37
49
-5
32
144
255
56
50
312
43
139
69
252147
132
-14
100320
213
174130
-22
-88
280
101
98
92193
56
-1
400
892
118
5
22
-39
24
65
412
5
-7
-56
74
520
1,291
47
178 -50
121-64
103
59
186 155
-4
50
28
12997115
179
586
-102
362
167
108
-88
88
148
279144
120
47
287
55
404
221
95
14
224
-178
41
1722320
79
321 -56
93
236
-1
76
19 123
37
285
40
3
24
-4188
146-18
158
10
16-23
0
220
0
145
433
213
272
-160
-117
2
-52
13
130
84
94
125
162 64
15297
262
206
185
564
-16111
49
22
7
116133 67
2
7 89
213
-5342 37
55119
36 -3-473
37
75
83
-487
2
67
87
181
81
10
281
35
281
37
90
35
410
10
90
90A
78
16
97
1604
16
1604
13
122
173
422 536
10
35
35
37
10
Camp Bullis
Medina Lake
BEXAR
Lackland AirForce Base
Fort SamHouston
Randolph AirForce Base
Kelly AirForce Base
BrooksAir Force Base
CalaverasLake
BraunigLake
MitchellLake
LakeMc Queeney
ATASCOSA
MEDINA
BANDERA
KENDALL
COMAL
GUADALUPE
WILSON
HELOTES
CASTROVILLE
LYTLE
DEVINE
SOMERSET
ELMENDORF
FLORESVILLE
LA VERNIA
NEW BERLIN
MCQUEENEY
NEWBRAUNFELS
NORTHCLIFFLAKEHILLS
II. Dental Analysis Absolute Growth in Estimated Visits at 200% FPL 2005 - 2011(1)
(1) Source: Capital Healthcare Planning estimated volumes.
Miles
0 5 10 15
CentroMedCommuniCareDaughters of CharityMethodist Healthcare MinistriesUniversity Health System
Page 18

651
-1
418
873
-120
357 255
497
1,067
63
796
-295
21
312
218
-227
521
453
-40
127
164
381
1,184
-22
190
3
7
469
244
70
233-34
1,653
580
456
776
376
382
1,271
141
24
161
554
416
50
572
-10
1,393-45
570
131
917 378
81356
410
1,646
914
2,204
400
1,121
1,298 139
74
215
963
296
126
19
440
470
117493
-113
644
411
658
587
315
448
68 162
177
565171
725
554
-195
18 201
1,225
427
236
287
242
1983
520
91
-93547
120
305
309
61384
13
106
-37
94
234
376
88
77
778
47
244
125
461260
235
20
217533
464
335233
-30
47
489
236
222
140301
89
7
49
706
1,607
315
37
69
-40
69
149
678
14
-35
-42
242
1,006
2,683
72
429 -83
198-90
184
132
247 297
8
69
147
275152401
308
1,131
-143
577
379
192
-154
155
241
547269
153
80
497
80
678
388
192
15
317
-287
59
273-26531
125
533
192
426
-1
145
32 186
87
520
160
26
20
-11273
217-81
-13
9-22
20
338
-25
231
825
340
467
-296
-178
-38
24
194
86
129
178
271 91
221151
416
368
356
141
103
14
-20
90
143212 84
-8
163
330
-9
-5 59
74191
14
87
31-7
-20
143
87
181
81
10
281
35
281
37
90
35
410
10
90
90A
78
16
97
1604
16
1604
13
122
173
422 536
537
10
35
35
37
10
Camp Bullis
Medina Lake
BEXAR
Lackland AirForce Base
Fort SamHouston
Randolph AirForce Base
Kelly AirForce Base
BrooksAir Force Base
CalaverasLake
BraunigLake
MitchellLake
LakeMc Queeney
ATASCOSA
MEDINA
BANDERA
KENDALL
COMAL
GUADALUPE
WILSON
HELOTES
CASTROVILLE
LYTLE
DEVINE
SOMERSET
ELMENDORF
FLORESVILLE
LA VERNIA
NEW BERLIN
MCQUEENEY
NEWBRAUNFELS
NORTHCLIFFLAKEHILLS
II. Dental Analysis Absolute Growth in Estimated Visits at 200% FPL 2005 - 2016(1)
(1) Source: Capital Healthcare Planning estimated volumes.
Miles
0 5 10 15
CentroMedCommuniCareDaughters of CharityMethodist Healthcare MinistriesUniversity Health System
Page 19
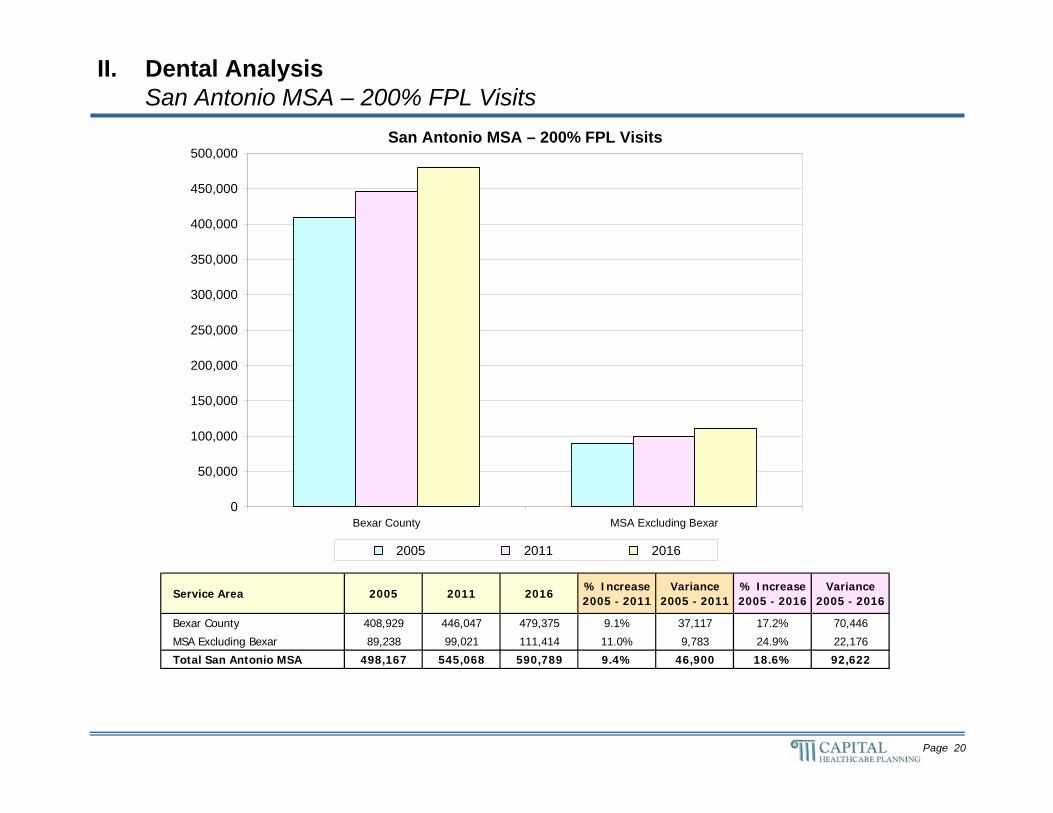
II. Dental Analysis San Antonio MSA – 200% FPL Visits
San Antonio MSA – 200% FPL Visits
Service Area 2005 2011 2016% Increase 2005 - 2011
Variance 2005 - 2011
% Increase 2005 - 2016
Variance 2005 - 2016
Bexar County 408,929 446,047 479,375 9.1% 37,117 17.2% 70,446
MSA Excluding Bexar 89,238 99,021 111,414 11.0% 9,783 24.9% 22,176
Total San Antonio MSA 498,167 545,068 590,789 9.4% 46,900 18.6% 92,622
0
50,000
100,000
150,000
200,000
250,000
300,000
350,000
400,000
450,000
500,000
Bexar County MSA Excluding Bexar
2005 2011 2016
Page 20

II. Dental Analysis Bexar County – 200% FPL Visits by Age
Bexar County – 200% FPL Visits by Age Cohort
0
50,000
100,000
150,000
200,000
250,000
300,000
0 - 17 Years 18 - 64 Years 65+ Years
2005 2011 2016
Age Cohort 2005 2011 2016% Increase 2005 - 2011
Variance 2005 - 2011
% Increase 2005 - 2016
Variance 2005 - 2016
0 - 17 Years 145,970 155,652 164,043 6.6% 9,682 12.4% 18,073
18 - 64 Years 235,141 258,304 277,877 9.9% 23,163 18.2% 42,736
65+ Years 27,818 32,090 37,455 15.4% 4,272 34.6% 9,637
Total San Antonio MSA 408,929 446,047 479,375 9.1% 37,117 17.2% 70,446
Page 21

II. Dental Analysis Dentist Requirements
• Dentist requirements dependent upon the staffing models of individual Partner Organizations– Dentists
– Dental Hygienists
• American Dental Association (ADA) Survey:
• Using the ADA benchmarks as a guideline, significant Dentist recruiting will be required to meet incremental 2005 to 2016 demand in Bexar County:
– Average Generalist Dentist Without Hygienists +26.9
– Average Generalist Dentist +18.1
– Average Generalist Dentist With At Least 1 Hygienist + 15.5
Dentist Visits Per Year
Average Generalist Dentist Without Hygienists 2,614
Average Generalist Dentist 3,888
Average Generalist Dentist With At Least 1 Hygienist 4,559
Page 22

II. Dental Analysis Demand Analysis Approach
Target Population
Total Target Population
Visits Population Dental Visits
Required Space DriversService Area
Definition
• Bexar County• San Antonio MSA• Partner Organizations
– Primary SA– Secondary SA
• 2005 Through 2016• By Age Cohort
• By Age Cohort• By Specialty
• Exam Rooms• Other Drivers
PercentageTarget
Population
DentalUse Rates
• By Age Cohort• Total Population• 100% FPL• 200% FPL
Utilization Rates
Visits Per Space Driver
• Adequate for Peaks
• 2005 Through 2016• By 7 Age Cohorts:
– 0 – 14– 15 – 17– 18 – 24– 25 – 44– 45 – 64– 65 – 74– 75+
• By Age Cohort
• Visits / 100 Population• By Age Cohort
• 2005 Through 2016• By Scenario:
– Baseline– Medium– High
Page 23

Utilization Rate• Baseline Scenario
– No changes to the 2005 utilization rates of Partner Organizations– Applies to Bexar County and MSA excluding Bexar County– Outside of MSA visits remain constant at 2005 volumes
• Medium Scenario– Bexar County utilization increases 1.0%... from 15.3% to 16.3%
• Utilization increases among Partner Organizations proportionate to 2005• Utilization increases occur between 2005 and 2011
– MSA utilization outside of Bexar remains unchanged from 2005 – Outside of MSA visits remain constant at 2005 volumes
• High Scenario– Bexar County utilization increases 2.0%... from 15.3% to 17.3%
• Utilization increases among Partner Organizations proportionate to 2005• Utilization increases occur between 2005 and 2011
– MSA utilization outside of Bexar remains unchanged from 2005 – Outside of MSA visits remain constant at 2005 volumes
Use Rates
– CDC / NCIS 2001 use rates by Age Cohort applied to all Scenarios
Population: – 2005 through 2016 population by age cohort applied to all Scenarios
Poverty Rates– 200% FPL is proxy for uninsured population– No changes to 2003 Poverty Rates in Bexar / MSA Counties
II. Dental AnalysisScenario Definitions
Constant Factors
Variable Factors
Page 24

0
5,000
10,000
15,000
20,000
25,000
30,000
35,000
40,000
CommuniCare CentroMed Methodist HealthcareMinistries
Daughters of Charity
2005 2011 2016
II. Dental Analysis Baseline Scenario
Baseline Scenario – Dental Visits by Organization
Partner Organization 2005 2011 2016% Increase 2005 - 2011
Variance 2005 - 2011
% Increase 2005 - 2016
Variance 2005 - 2016
CommuniCare 26,973 28,876 30,290 7.1% 1,903 12.3% 3,317
CentroMed 23,641 25,234 26,539 6.7% 1,593 12.3% 2,898
Methodist Healthcare Ministries 11,781 12,559 13,134 6.6% 778 11.5% 1,353
Daughters of Charity 4,123 4,406 4,639 6.9% 283 12.5% 516
Total 66,518 71,075 74,603 6.9% 4,557 12.2% 8,085
Page 25

II. Dental Analysis Medium Scenario
Medium Scenario – Dental Visits by Organization
0
5,000
10,000
15,000
20,000
25,000
30,000
35,000
40,000
CommuniCare CentroMed Methodist HealthcareMinistries
Daughters of Charity
2005 2011 2016
Partner Organization 2005 2011 2016% Increase 2005 - 2011
Variance 2005 - 2011
% Increase 2005 - 2016
Variance 2005 - 2016
CommuniCare 26,973 31,397 33,793 16.4% 4,424 25.3% 6,820
CentroMed 23,641 27,250 29,340 15.3% 3,609 24.1% 5,699
Methodist Healthcare Ministries 11,781 13,598 14,577 15.4% 1,817 23.7% 2,796
Daughters of Charity 4,123 4,763 5,135 15.5% 640 24.6% 1,012
Total 66,518 77,008 82,846 15.8% 10,490 24.5% 16,328
Page 26

II. Dental Analysis High Scenario
High Scenario – Dental Visits by Organization
0
5,000
10,000
15,000
20,000
25,000
30,000
35,000
40,000
CommuniCare CentroMed Methodist HealthcareMinistries
Daughters of Charity
2005 2011 2016
Partner Organization 2005 2011 2016% Increase 2005 - 2011
Variance 2005 - 2011
% Increase 2005 - 2016
Variance 2005 - 2016
CommuniCare 26,973 33,293 35,830 23.4% 6,320 32.8% 8,857
CentroMed 23,641 28,765 30,969 21.7% 5,124 31.0% 7,328
Methodist Healthcare Ministries 11,781 14,379 15,417 22.1% 2,598 30.9% 3,636
Daughters of Charity 4,123 5,031 5,424 22.0% 908 31.5% 1,301
Total 66,518 81,469 87,639 22.5% 14,951 31.8% 21,121
Page 27

0
50,000
100,000
150,000
200,000
250,000
300,000
350,000
400,000
450,000
500,000
Baseline Scenario Medium Scenario High Scenario Bexar County - 200%FPL
2005 2011 2016
II. Dental Analysis Scenario Summary
2005 Through 2016 Dental Visits by Scenario
Scenario 2005 2011 2016% Increase 2005 - 2011
Variance 2005 - 2011
% Increase 2005 - 2016
Variance 2005 - 2016
Baseline Scenario 66,518 71,075 74,603 6.9% 4,557 12.2% 8,085
Medium Scenario 66,518 77,008 82,846 15.8% 10,490 24.5% 16,328
High Scenario 66,518 81,469 87,639 22.5% 14,951 31.8% 21,121
Bexar County - 200% FPL 408,929 446,047 479,375 9.1% 37,117 17.2% 70,446
Page 28

0
5,000
10,000
15,000
20,000
25,000
30,000
35,000
40,000
2005 2011 2016 2005 2011 2016 2005 2011 2016 2005 2011 2016
II. Dental Analysis Scenario Summary
2005 Through 2016 Visits by Scenario
CentroMedCommuniCare Methodist HealthcareMinistries
DaughtersOf Charity
Baseline Scenario Medium Scenario High Scenario
Page 29

II. Dental Analysis Summary
Utilization Rate• Partner Organizations’ 2005 volumes were 15.3% of expected 200% FPL visits in Bexar County
– Expected 200% FPL Visits 408,929– Partner Organizations’ Visits 62,545– Utilization Rate 15.3%
Projected Volumes• Bexar County projected to experience large increases in Dental demand for the 200% FPL population
Incremental Visits % Increase– CY 2005 - 2011 37,117 9.1%– CY 2005 - 2016 70,446 17.2%
• Most incremental demand will occur in the 18 – 64 age cohort and will be concentrated in the northern half of Bexar County outside of Loop 410
Demand Analysis• Under the defined Scenarios, the Partner Organizations would need to significantly expand capacity
– Baseline Scenario + 8,085 visits… +12.2%
– Medium Scenario: +16,328 visits… +24.5%
– High Scenario: +21,121 visits… +31.8%
Page 30

III. Emergency Analysis Demand Analysis Approach
Target Population
Total Target Population
Visits Population Emergency
Visits
Required Space DriversService Area
Definition
• Bexar County• San Antonio MSA
• 2005 Through 2016• By Age Cohort
• By Age Cohort • Exam Rooms• Other Drivers
PercentageTarget
Population
EmergencyUse Rates
• By Age Cohort• Total Population• 100% FPL• 200% FPL
Utilization Rates
Visits Per Space Driver
• Adequate for Peaks
• 2005 Through 2016• By 7 Age Cohorts:
– 0 – 14– 15 – 17– 18 – 24– 25 – 44– 45 – 64– 65 – 74– 75+
• By Age Cohort
• Visits / 100 Population• By Age Cohort
• 2005 Through 2016
Page 31

Demographics• Claritas 2000, 2006, & 2011 • U.S. Census Bureau
Use Rates• Medstat Bexar County Estimates - 2003• Emergency Visits Per 100 Population by Age Cohort
Other Sources• Access to Care for the Uninsured (ACU)• Reporting Organizations:
– Methodist Healthcare System– Baptist Health System– CHRISTUS Santa Rosa– University Health System
III. Emergency Analysis Data Sources
• Non-Reporting Organizations:– Southwest General Hospital– Nix Health Care System
Age CohortMedstat Bexar County
Estimate
0 - 14 Years 39.50
15 - 17 Years 42.80
18 - 24 Years 42.80
25 - 44 Years 38.73
45 - 64 Years 29.82
65 - 74 Years 38.24
75+ Years 62.16
Page 32

1,888
937
1,764
904
908
1,321 972
785
1,242
490
2,386
1,046
147
774
340
661
327
876
1,113
226
415
1,713
1,239
675
601
57
246
489
752
499
495109
1,023
880
865
426
360
615
849
471
122
396
284
1,034
166
1,209
344
1,712164
1,271
757
502 568
527603
820
2,567
1,256
2,339
1,651
815
999 366
1,242
1,558
1,393
1,877
303
201
944
957
6871,160
738
783
880
749
1,319
876
1,232
2,518730
506
1,828
926
1,304
1,463
1,355
1,345
1
862
617
591
646
1,077648
442
868
516649
915
1,180
846
1,023
2,036
376
929
577
1,540
588
536
1734
1,580
1,169
1,212
983687
389
502
7041,102
728
700699
375
1,215
375
713
685
401
132
2,077
2,153
475
769
950
1,069
515
677
1,740
1,195
684
897
1,536
1,423
2,028551 373
341576
206
646
1,842 467
1,070
1,170
613
5829291,116
1,449
514
2,043
450
1,001
558
573
2,0351,657
1,200
229
611
1,784
1,670
1,712
93
1,442
582
1,0721,189
1,628
366
1,053885
870 1,379
571
1,027
470
366
598
1,0751,465
930
988
871
331
1,528
704
1,244
836
1,182
1,120
878
822
228
1,643
816
1,154
1,038
916
970
626
694
845
1,338 585
542
810
672
146
1,070
590
959
496
362
531
87
181
81
10
281
35
281
37
90
35
410
10
90
78
16
97
1604
16
1604
122
173
422
10
35
35
37
10
Camp Bullis
Medina Lake
BEXAR
Lackland AirForce Base
Fort SamHouston
Randolph AirForce Base
Kelly AirForce Base
BrooksAir Force Base
CalaverasLake
BraunigLake
MitchellLake
LakeMc Queeney
ATASCOSA
MEDINA
BANDERA
KENDALL
COMAL
GUADALUPE
WILSON
HELOTES
CASTROVILLE
LYTLE
DEVINE
SOMERSET
ELMENDORF
FLORESVILLE
LA VERNIA
NEW BERLIN
MCQUEENEY
NEWBRAUNFELS
NORTHCLIFFLAKEHILLS
III. Emergency Analysis 2005 Estimated Emergency Visits at 200% FPL(1)
(1) Source: Capital Healthcare Planning estimated volumes.
Miles
0 5 10 15
Page 33

8.7%
-2.9%
6.0%
27.8%
-7.7%
9.1% 6.6%
16.6%
22.6%
2.5%
10.3%
-9.5%
4.8%
9.5%
15.5%
-13.0%
39.0%
13.6%
-1.7%
12.9%
9.0%
7.0%
24.4%
-1.5%
6.2%
-1.
1.5%
27.6%
11.3%
5.5%
11.8%-12.4%
42.7%
14.0%
17.9%
49.0%
23.5%
19.5%
34.5%
8.4%
2.1%
13.7%
44.9%
14.0%
5.2%
13.3%
-3.1%
22.4%-9.3%
15.2%
6.1%
51.7% 14.1%
4.7%8.3%
13.9%
19.7%
20.1%
25.4%
9.2%
35.7%
38.7% 10.4%
-0.3%
6.6%
14.8%
5.8%
10.8%
3.3%
13.4%
18.3%
4.9%8.8%
18.4%
16.3%
26.1%
13.4%
10.9%
12.9%
1.5%8.1%
10.2%
10.9%
21.6%
13.3%
-3.8%
1.3%
-3.8%
29.0%
1
15.3%
15.9%
11.3%
11.2%
0.4%0.7%
30.9%
2.2%
-12.3%23.7%
2.9%
7.8%
10.2%
4.9%
0.8%
7.2%
3.5%
12.9%
9.3%
5.4%
6.6%
723.9%
2.0%
7.2%
3.3%
15.0%12.6%
19.6%
-1.3%
17.4%
16.6%
15.2%11.6%
-3.4%
-5.1%
15.8%
8.1%
3.9%17.9%
0.5%
11.4%
24.9%
13.9%
1.0%
-1.6%
6.3%
15.0%
0.7%
-0.5%
-4.0%20.3%
36.0%
1.4%
18.2% -8.1%
20.8%-6.5%
30.0%
4.6%
5.9% 20.3%
-0.8%
1.9%
2.0%
5.9%5.1%
6.8%
23.8%
-11.9%
10.7%
21.5%
5.2%
-9.1%
9.3%
3.8%
9.9%4.8%
6.1%
12.3%
5.6%
13.7%
7.9%
2.7%
9.5%
9.1%
8.2%15.8%
12.2%
4.7%
4.9%
3.7%4.6%
2.5%
-2.8%2.9%9.1%
0.3%
4.0%-2.2%
8.4%
-0.7%
6.4%
11.4%
6.4%
14.1%
3.8%
2.6%
6.4%
5.6%
8.6%
8.4%4.3%
8.6%
5.2% 6.6%
-0.2%
6.2%
-4.6%
2.7%7.0%
2.9%
2.5%
-5.4%
87
181
81
10
281
35
281
37
90
35
410
90
78
16
97
1604
16
1604
122
173
422
10
35
35
10
37
35
10
Camp Bullis
Medina Lake
BEXAR
Lackland AirForce Base
Fort SamHouston
Randolph AirForce Base
Kelly AirForce Base
BrooksAir Force Base
CalaverasLake
BraunigLake
MitchellLake
LakeMc Queeney
ATASCOSA
MEDINA
BANDERA
KENDALL
COMAL
GUADALUPE
WILSON
HELOTES
CASTROVILLE
LYTLE
DEVINE
SOMERSET
ELMENDORF
FLORESVILLE
LA VERNIA
NEW BERLIN
MCQUEENEY
NEWBRAUNFELS
NORTHCLIFFLAKEHILLS
III. Emergency Analysis Percentage Growth in Estimated Visits at 200% FPL 2005 - 2011(1)
(1) Source: Capital Healthcare Planning estimated volumes. Page 34
Miles
0 5 10 15

20.4%
0.4%
14.5%
57.9%
-7.5%
16.6% 15.8%
39.8%
51.3%
8.3%
19.8%
-17.0%
9.4%
24.2%
39.1%
-20.0%
95.2%
30.3%
-2.2%
34.7%
24.1%
13.4%
56.3%
-1.2%
18.8%
4.9
3.0%
58.1%
19.8%
8.9%
30.0%-19.1%
95.2%
39.0%
32.5%
110.1%
64.2%
37.2%
88.2%
18.9%
12.7%
25.5%
114.5%
24.1%
20.5%
28.0%
-1.3%
47.8%-13.7%
27.8%
10.1%
110.5% 39.7%
10.3%34.2%
30.1%
36.6%
43.3%
55.4%
14.6%
81.6%
76.5% 24.2%
3.5%
9.7%
39.6%
10.1%
25.1%
4.0%
28.9%
30.3%
11.2%24.1%
46.8%
31.0%
51.1%
25.9%
21.1%
21.9%
1.2%
19.3%
19.6%
45.2%
24.7%
-7.3%
0.4%
-5.5%
55.2%
2
30.8%
24.7%
28.3%
22.4%
0.4%8.5%
69.0%
7.7%
-9.5%49.9%
8.3%
14.9%
20.8%
5.5%
-0.3%
11.0%
20.8%
13.7%
9.3%
11.0%
160.4%
2.5%
12.6%
5.7%
27.4%22.4%
35.3%
3.5%
28.9%
37.1%
29.5%20.3%
-4.5%
1.5%
38.5%
18.9%
5.6%28.1%
5.6%
20.1%
44.4%
38.2%
4.3%
-0.9%
14.2%
24.4%
1.4%
-3.1%
-2.9%40.2%
75.0%
1.9%
44.9% -12.6%
34.4%-8.7%
54.3%
10.7%
7.6% 39.4%
-0.2%
2.3%
13.7%
9.0%20.2%
11.3%
46.1%
-16.1%
16.5%
49.2%
9.8%
16.8%
6.1%
19.8%8.9%
7.5%
21.7%
8.1%
22.7%
13.7%
5.7%
10.5%
12.3%
13.3%26.4%
19.9%
9.1%
7.1%
8.7%19.8%
5.6%
2.3%
-7.1%1.8%14.1%
-1.6%
3.1%-1.7%
12.7%
-3.0%
17.7%
8.2%
24.4%
7.2%
2.2%
8.4%
7.6%
14.3%
12.1%6.6%
10.9%
8.1% 8.4%
-1.4%
11.6%
-3.9%
3.2%10.7%
0.2%
1.3%
-9.6%
87
181
81
10
281
35
281
37
90
35
410
90
78
16
97
1604
16
1604
122
173
10
35
35
10
37
35
10
Camp Bullis
Medina Lake
BEXAR
Lackland AirForce Base
Fort SamHouston
Randolph AirForce Base
Kelly AirForce Base
BrooksAir Force Base
CalaverasLake
BraunigLake
MitchellLake
LakeMc Queeney
ATASCOSA
MEDINA
BANDERA
KENDALL
COMAL
GUADALUPE
WILSON
HELOTES
CASTROVILLE
LYTLE
DEVINE
SOMERSET
ELMENDORF
FLORESVILLE
LA VERNIA
NEW BERLIN
MCQUEENEY
NEWBRAUNFELS
NORTHCLIFFLAKEHILLS
III. Emergency Analysis Percentage Growth in Estimated Visits at 200% FPL 2005 - 2016(1)
(1) Source: Capital Healthcare Planning estimated volumes. Page 35
Miles
0 5 10 15

164
-27
107
252
-69
120 65
130
281
12
246
-100
7
74
53
-86
128
119
-19
29
38
121
303
-10
37
-1
4
135
85
27
59-14
437
123
155
209
84
120
293
39
3
54
127
145
9
161
-11
384-15
193
46
260 80
2550
114
506
253
595
152
290
387 38
-4
103
206
109
33
7
127
175
34102
-41
144 315
143
195
176
95
159
39 59
52
199 86
200
173
-56
18 93
-51
391
132
98
66
72
44
137
19
-64154
27
92
86
15950
16
27
0
20
89
144
32
36
175
32
84
40
14887
76
-7
61192
121
10781
-13
-62
161
59
58
60123
34
1
-6
237
535
66
5
10
-17
12
43
260
8
-4
-36
45
290
730
21
100 -30
71-37
62
30
76
109 95
-8
23
12
745557
113
345
-61
218
97
52
-51
31
53
78
14779
73
28
187
34
244
131
47
9
131
-104
20
88-4
78
43
199 -39
54
131
-0
42
11 67
21
163
22
3
15
-3042
89-14
90
3
13-12
-0
129
-5
79
248
135
77
158
-94
-65
-0
-32
9
75
4399
53
72
100 37
8754
150
136
102
327
-7
-1359
27
10
2
6869 39
-1
0 50
120
-3517 21
2971
17 -1-10
63
42
18
43
45
-6
82
48
1
34
87
181
81
10
281
35
281
37
90
35
410
10
90
90A
78
16
97
1604
16
1604
13
122
173
422 536
10
35
35
37
10
Camp Bullis
Medina Lake
BEXAR
Lackland AirForce Base
Fort SamHouston
Randolph AirForce Base
Kelly AirForce Base
BrooksAir Force Base
CalaverasLake
BraunigLake
MitchellLake
LakeMc Queeney
ATASCOSA
MEDINA
BANDERA
KENDALL
COMAL
GUADALUPE
WILSON
HELOTES
CASTROVILLE
LYTLE
DEVINE
SOMERSET
ELMENDORF
FLORESVILLE
LA VERNIA
NEW BERLIN
MCQUEENEY
NEWBRAUNFELS
NORTHCLIFFLAKEHILLS
III. Emergency Analysis Absolute Growth in Estimated Visits at 200% FPL 2005 - 2011(1)
(1) Source: Capital Healthcare Planning estimated volumes. Page 36
Miles
0 5 10 15

384
3
256
523
-68
220 153
312
638
41
471
-178
14
187
133
-132
312
266
-25
78
100
229
698
-8
113
2
7
284
149
45
149-21
974
343
281
469
231
229
748
89
16
101
325
250
34
339
-5
818-23
353
76
555 226
54206
247
940
544
1,295
241
665
764 89
43
151
551
190
76
8
272
290
77280
-77
367 660
273
383
341
185
270
30 91
98
358109
419
321
-107
5 117
-74
742
265
152
167
145
455
305
67
-49324
76
175
176
33956
-6
61
-16
63
144
210
55
59
443
40
148
69
270154
137
17
142318
270
207142
-17
18
281
144
135
86193
58
7
26
417
955
181
25
41
-9
36
96
425
17
-22
-26
152
572
1,522
30
247 -47
117-50
112
69
90
139 184
-2
27
84
16584225
188
669
-83
336
222
98
-86
96
125
294148
89
50
321
50
405
229
98
10
177
-169
26
143-24314
65
324
114
240
0
81
18 98
49
301
93
20
14
-7726
131-57
-14
10-9
13
194
-21
126
478
210
98
273
-174
-96
-25
-74
16
109
36
69
4
99
166 55
12682
239
246
202
638
-2876
59
1
-17
54
81108 49
-8
-12
184
-71-18 33
34110
1 -7
5011
7
78
69
-1189
-13
78
87
181
81
10
281
35
281
37
90
35
410
10
90
90A
78
16
97
1604
16
1604
13
122
173
422 536
10
35
35
37
10
Camp Bullis
Medina Lake
BEXAR
Lackland AirForce Base
Fort SamHouston
Randolph AirForce Base
Kelly AirForce Base
BrooksAir Force Base
CalaverasLake
BraunigLake
MitchellLake
LakeMc Queeney
ATASCOSA
MEDINA
BANDERA
KENDALL
COMAL
GUADALUPE
WILSON
HELOTES
CASTROVILLE
LYTLE
DEVINE
SOMERSET
ELMENDORF
FLORESVILLE
LA VERNIA
NEW BERLIN
MCQUEENEY
NEWBRAUNFELS
NORTHCLIFFLAKEHILLS
III. Emergency Analysis Absolute Growth in Estimated Visits at 200% FPL 2005 - 2016(1)
(1) Source: Capital Healthcare Planning estimated volumes. Page 37
Miles
0 5 10 15

0
50,000
100,000
150,000
200,000
250,000
300,000
Bexar County - 200% FPL MSA Excluding Bexar - 200% FPL
2005 2011 2016
III. Emergency Analysis San Antonio MSA – 200% FPL Visits
San Antonio MSA – 200% FPL Visits
Page 38
Service Area 2005 2011 2016% Increase 2005 - 2011
Variance 2005 - 2011
% Increase 2005 - 2016
Variance 2005 - 2016
Bexar County - 200% FPL 248,438 269,938 289,615 8.7% 21,500 16.6% 41,177
MSA Excluding Bexar - 200% FPL 53,964 59,757 67,346 10.7% 5,792 24.8% 13,381
Total San Antonio MSA 302,402 329,695 356,961 9.0% 27,292 18.0% 54,558

III. Emergency Analysis Bexar County – 200% FPL Visits by Age
Bexar County – 200% FPL Visits by Age Cohort
Age Cohort 2005 2011 2016% Increase 2005 - 2011
Variance 2005 - 2011
% Increase 2005 - 2016
Variance 2005 - 2016
0 - 17 92,935 99,097 104,434 6.6% 6,162 12.4% 11,499
18 - 64 130,954 142,638 152,823 8.9% 11,684 16.7% 21,869
65+ 24,548 28,202 32,358 14.9% 3,654 31.8% 7,810
Total Bexar County 248,438 269,938 289,615 8.7% 21,500 16.6% 41,177
0
25,000
50,000
75,000
100,000
125,000
150,000
175,000
0 - 17 18 - 64 65+
2005 2011 2016
Page 39

81,803
2,059
19,394
2,030
104,200
1,607
20,780
94,582
16,666
0
20,000
40,000
60,000
80,000
100,000
120,000
0 - 17 18 - 64 65+
2002 2003 2004
III. Emergency Analysis Summary – ACU Data(1)
(1) Source: Summary information from Access to Care for the Uninsured; excludes ED visits admitted to hospital.
Self-Pay ED Visits by Age Cohort
• Extremely high growth in Self-Pay Visits for 18 – 64 Age Cohort– 27.4% increase from 2002 – 2004… +22,397 visits
• Much lower volumes and negative or flat growth in 0 – 17 and 65+ Age Cohorts
Page 40

35.6%
12.5%
40.9%
4.1%
14.3%
4.0%
38.4%
3.1%
11.4%
0.0%
5.0%
10.0%
15.0%
20.0%
25.0%
30.0%
35.0%
40.0%
45.0%
0 - 17 18 - 64 65+
2002 2003 2004
III. Emergency Analysis Summary – ACU Data(1)
Percentage Self-Pay of Total ED Visits by Age Cohort
• Self-Pay accounts for nearly 41% of all Emergency visits in 18 – 64 Age Cohort– +5.3% Growth 2002 - 2004
• 0 – 17 and 65+ Self-Pay visits as a percentage of total have declined from 2002 - 2004
Page 41(1) Source: Summary information from Access to Care for the Uninsured; excludes ED visits admitted to hospital.

III. Emergency Analysis Summary – ACU Data(1)
(1) Source: Summary information from Access to Care for the Uninsured; excludes ED visits admitted to hospital.
Avoidable Self-Pay ED Visits by Age Cohort
• Extremely high growth in Avoidable Self-Pay Visits for 18 – 64 Age Cohort– 30.2% increase from 2002 – 2004… +11,121 visits
• Avoidable Visits Categories:– Non-Emergent– Primary Care Treatable– ED Care Needed; Preventable/Avoidable
Page 42
36,811
840
11,326
601 601
12,551
42,940
47,932
9,083
0
10,000
20,000
30,000
40,000
50,000
60,000
0 - 17 18 - 64 65+
2002 2003 2004

11.8%
35.6%
3.7%
14.1%
2.7%
38.5%
41.3%
2.6%
10.5%
0.0%
5.0%
10.0%
15.0%
20.0%
25.0%
30.0%
35.0%
40.0%
45.0%
0 - 17 18 - 64 65+
2002 2003 2004
III. Emergency Analysis Summary – ACU Data(1)
Percentage Avoidable Self-Pay of Total Avoidable Visits by Age Cohort
• 41.3% of all Self-Pay Emergency visits were avoidable in 18 – 64 Age Cohort… +5.7% Growth 2002 – 2004• Much lower volumes and negative or flat growth in 0 – 17 and 65+ Age Cohorts
Page 43(1) Source: Summary information from Access to Care for the Uninsured; excludes ED visits admitted to hospital.

III. Emergency Analysis Summary
Projected Volumes• Bexar County projected to experience large increases in Emergency demand for 200% FPL population
Incremental Visits % Increase– CY 2005 - 2011 21,500 8.7%– CY 2005 - 2016 41,177 16.6%
• Most incremental demand will occur in the 18 – 64 age cohort and will be concentrated in the northern half of Bexar County outside of Loop 410
Self-Pay Volumes(1)
• Self-Pay accounts for a significant percentage of Emergency visits in Bexar CountyAge Cohort Self-Pay Visits % of Total Visits
– 0 – 17 16,666 11.4%
– 18 – 64 104,200 40.9%
– 65+ 1,607 3.1%
– Total 122,473 27.1%
• Avoidable Self-Pay visits in Bexar County are a significant percentage of total avoidable volumesAge Cohort Avoidable Self-Pay Visits % of Total Avoidable Visits
– 0 – 17 9,083 10.5%
– 18 – 64 47,932 41.3%
– 65+ 601 2.6%
– Total 57,616 25.5%
Page 44(1) Source: 2004 Summary information from Access to Care for the Uninsured; excludes ED visits admitted to hospital.

IV. Discussion Summary – From Work Session #1
• There is currently a large unmet need for Primary Care for the 200% FPL population– Most areas of Bexar County have some degree of unmet needs
– Varies significantly by location
• Underutilization of Primary Care by target population results in:– Higher healthcare costs to community, both short-term and long-term
• Over-utilization of Emergency Services
• Less Preventive Care
• Less Early Detection and Treatment of Disease
– Lower quality of life
• Very strong incremental demand for Bexar County projected over the next 10 years across all age cohorts, especially in the 18 – 64 age group
– To maintain current utilization of 40.6%, Partner Organizations will need to expand capacity significantly
– To improve utilization in Bexar County to 45% or 50%, even larger commitments of resources will be required
• Existing clinic locations:
– Positioned to serve current target population within Loop 410
– Considerable overlap of Service Areas and close proximity of Clinic sites
– Not as well positioned to accommodate much of future growth
Page 45

IV. Discussion Planned / Potential Projects
• CentroMed Community Health Center - South– Relocate staffing and services from Southside Clinic– Alleviate overcrowding at South Park Clinic
• Daughters of Charity Facility Expansion - De Paul Clinic– Expand dental capacity and child care services
• CommuniCare - Potential New Clinic– Renovation/improved space utilization at Barrio Family Health Center– Potential new facility in northwestern region of FQHC service area
• University Health System– UHS Downtown Clinic (Brady Green)
• In planning stages for expansion and renovation• Imaging, Other Diagnostics, and Specialty Outpatient Services
– Metropolitan Health District
• Methodist Healthcare Ministries - Evaluation of Existing Clinics– Potential relocation of dental services from Villa Coronado to Wesley Columbia Heights– Expansion at Wesley Columbia Heights to increase dental and medical services
Page 46

IV. DiscussionTopics
1) What are the best strategies for ensuring greatest coverage in the most cost effective manner of the low-income uninsured? Potential options include:
A. Increased Capacity For:
• Preventive / Primary Care
• Dental Care
B. Improved Accessibility
• New Clinics in High Growth Areas
• Expanding / Renovating Existing Clinics
C. Developing Public Awareness / Education Programs
• Educating Public About Current Clinics & Programs– Services / Locations– Available Regardless of Citizenship or Insurance Status– Sliding Scale Fees for the Low-Income
• Emphasizing Importance of Preventive Care
• Distinguishing Between Emergent, Urgent, and Primary Care
D. Expansion of Funding
Page 47

IV. DiscussionTopics
2) How can the Partner Organizations work together to better serve the community?A. Potential framework for joint planning?
B. Potential opportunities for partnership?
• Between the Partnership Organizations
• With Hospitals in the San Antonio MSA
• Other organizations (Metro Clinics, The Community Clinic, Christian Dental)
C. Other programs such as ACU to coordinate clinical operations among Partner Organizations
3) How should we relay our message to the community?A. What is the message we need to communicate?
B. How should it be released? • Press Release• Presentations• Website
C. To whom should we convey the message?• Bexar County / San Antonio• Hospitals / Systems• State
D. What should we ask for?• Funding
• Capital Projects• Operating Expenses
• Cooperation / Operating Relationships• Other?
Page 48

• Beginning of hyperlinked slides

I. Introduction 2005 Visits Not Seen at Partner Organizations’ Clinics
(1) Source: Partner Organizations’ Databases.
1,464
2,030
-824
4,701
613
2,
1,755
1,048
2,094
1,401
510
3,383
3,907
2,436
2,1642,602
2,776
9,745
9,074
5,200
3,206
3,7321,150
4,189
4,298
5,454
2,088
1,143
392
3,907
3,474
2,400
4,800
1,992
2,996 5,497
2,993
4,617
3,609
3,653
6,170908
1,632
2,355 3,955
3,744
2,811
4,447 3,829
3,819
4,537
2,840
2,507
2,526
2,390
4,022
2,376
1,418
3,263
1,7433,033
3,231
4,319
3,113
5,051
2,768
2,174
1,211
2,377
2,338
2,106
3,733
2,035
1,818
3,054
3,379
3,593
2,792
3,119
2,398
1,286
2,024
2,7473,982
2,501
2,516
2,334
1,776
4,745
4,747
1,711
2,936
3,3811,695
1,426
216
1,976
5,577
6,953
1,818
3,621
3,947
4,052
2,355
4,056
1,780
4,069
2,946
3,153
4,945
4,582
7,539
3,804
2,109 1,359
1,137
2,266
858
4,584
3,020426
1,787
4,287
2,329
2,231
3,7934,503
1,987
4,179
1,968
5,116
1,222
4,213
2,058
1,112
2,575
6,568
6,3455,851
2,500
210
4,035
2,428
4,123
4,295
5,131
274
2,621
1,827
1,611
2,819
4,1172,439
2,0533,522
2,181
4,884 3,308
1,590
4,424
24
3,531
1,475 3,040
2,442
4,031
1,865
1,505
1,891
3,463
2,873
4,386
2,0891,961
3,064
1,957
997
2,118
-398
2,909
1,903
3,315
2,041
3,269
3,418
5,817
2,861
3,121
3,326
2,071
-1,168
1,473
776
2,951
3,430
4,0481,438
1,867
1,849
4,112
2,665 849
2,3432,145
2,701
3,149
1,950
3,961
3,928
206
3,729
1,677
2,032
2,327
4,839
1,953
1,907
1,804
3,1871,489
1,092
1,923
3,812
1,796
-5
3,398 594
1,874
1,3381,184
1,576
1,013
32
1,128
2,838
2,067
1,605
1,180
2,862
1,117
1,130
681
1,541
10
410
90
410
35
410
35
35
10
10
281
281 37
87
1604
1604
151
1604
421
122
536
13
368
16
422
345
371
353
16
537
47178
25963009
1957
2252
218
1346
35
10
37
10
35
10
BEXAR
Lackland AirForce Base
Fort SamHouston
Randolph AirForce Base
Kelly AirForce Base
BrooksAir Force Base
CalaverasLakeMitchell
Lake
HELOTES
Miles
0 2.5 5.0 7.5
CentroMedCommuniCareDaughters of CharityMethodist Healthcare MinistriesUniversity Health System

II. Dental Analysis 2005 Estimated Dental Visits at 200% FPL(1)
(1) Source: Capital Healthcare Planning estimated volumes.
1,725
1,104
388
2,093
353
8
1,254
828
1,426
613
473
1,901
2,144
1,257
8731,017
1,385
4,272
3,959
2,721
1,381
1,640630
2,114
2,585
2,347
3,110
509
334
1,583
1,565
1,162
1,947
1,180
1,298 2,247
1,267
2,192
1,446
2,013
4,1591,195
842
3,021 3,614
1,560
2,421
2,217 1,750
2,249
2,221
1,458
1,055
1,012
1,099
1,769
1,102
730
1,458
8881,113
1,533
1,973
1,412
2,457
1,656
3,339
629
1,476
989
1,127
2,538
960
834
1,227
2,616
1,877
1,972
1,611
1,097
636
856
1,1281,769
1,229
1,167
1,155
621
2,054
2,052
646
1,212
2,4991,115
658
212
837
3,377
3,518
804
1,274
1,601
1,778
1,109
2,869
792
1,980
1,135
1,509
2,583
2,394
3,225
2,534
927 610
541
947
340
2,073
3,009773
1,758
1,872
1,025
997
1,4701,881
2,702
2,392
874
3,290
751
1,650
950
496
966
3,335
2,4672,722
1,962
399
2,314
1,018
2,917
2,702
2,813
152
2,338
966
1,764
2,455
1,6851,475
9911,940
1,021
2,678 2,299
621
1,753
12
1,468
1,420 2,245
926
1,725
794
629
987
1,556
1,739
2,403
1,6681,493
1,623
1,396
498
942
357
2,496
1,132
2,036
1,938
1,385
1,943
2,263
1,910
1,837
1,459
1,375
1,230
928
361
1,263
1,827
2,6721,637
1,755
1,325
2,096
1,888 869
1,6622,023
1,510
1,620
1,040
2,581
1,925
344
1,675
879
1,153
1,286
2,143
1,374
1,346
735
2,169961
877
1,426
1,656
1,096
244
2,118 292
777
1,7341,668
958
708
195
842
1,857
1,375
802
717
1,612
949
841
834
592
609
878
10
410
281
90
410
35
410
35
35
10
10
281 37
87
1604
1604
151
1604
368
421
122
536
13
16
422
345
371
353
16
537
47178
25963009
1957
2252
218
1346
35
10
37
10
35
10
BEXAR
Lackland AirForce Base
Fort SamHouston
Randolph AirForce Base
Kelly AirForce Base
BrooksAir Force Base
CalaverasLakeMitchell
Lake
HELOTES

II. Dental Analysis2005 Partner Organizations’ Dental Visits(1)
(1) Source: Partner Organizations’ databases.
465
97
143
107
75
1
190
227
404
20
59
350
200
86
2247
171
362
229
391
78
3645
231
471
88
1,390
33
87
79
179
70
71
214
73 104
58
224
63
199
845518
79
1,049 1,161
44
797
252 147
387
282
178
41
16
52
111
79
72
96
7017
134
135
71
251
294
1,515
53
242
47
148
367
93
110
40
613
162
394
172
71
62
45
86104
71
98
123
15
115
112
16
35
413294
64
36
37
457
470
48
26
72
113
121
629
36
194
38
105
322
143
95
374
5535
35
42
12
177
831221
409
111
57
63
7591
1,172
396
55
710
94
78
62
54
13
339
74178
526
65
389
48
842
459
333
14
579
128
594
855
96268
111
106302
76
423 517
10
43
2
43
152
387 486
24
83
43
15
113
145
251
298
402258
232
225
53
55
140
867
167
273
527
49
334
68
298
272
118
261
641
157
30
40
276
570478
258
656
200
431
291
544 324
270803
172
220
70
552
108
83
60
105
142
171
91
400
199
36
634
484173
152
225 239
76
188
80
643
414 27
24
775754
187
175
75
74
132
409
158
381
197
88
96
199
232
179
122
103
71
64
66
10
410
281
90
410
35
410
35
35
10
10
281 37
87
1604
1604
151
1604
368
421
536
122
13
16
422
345
371
353
16
537
47178
25963009
1957
2252
1346
218
1976
35
10
10
35
37
10
BEXAR
Lackland AirForce Base
Fort SamHouston
Randolph AirForce Base
Kelly AirForce Base
BrooksAir Force Base
CalaverasLakeMitchell
Lake
HELOTES
Miles
0 2.5 5.0 7.5
CentroMedCommuniCareDaughters of CharityMethodist Healthcare MinistriesUniversity Health System

26.9%
8.8%
36.8%
5.1%
21.3%
2
15.1%
27.4%
28.3%
3.3%
12.4%
18.4%
9.3%
6.8%
2.5%4.6%
12.3%
8.5%
5.8%
14.4%
5.7%
2.2%7.2%
10.9%
18.2%
3.7%
44.7%
6.6%
26.0%
5.0%
11.4%
6.0%
3.6%
18.1%
5.6% 4.6%
4.6%
10.2%
4.4%
9.9%
20.3%43.4%
9.4%
34.7% 32.1%
2.8%
32.9%
11.4% 8.4%
17.2%
12.7%
12.2%
3.9%
1.5%
4.7%
6.3%
7.2%
9.9%
6.6%
7.9%1.6%
8.7%
6.8%
5.0%
10.2%
17.7%
45.4%
8.5%
16.4%
4.7%
13.2%
14.5%
9.7%
13.2%
3.3%
23.4%
8.6%
20.0%
10.7%
6.5%
9.8%
5.2%
7.6%5.9%
5.8%
8.4%
10.7%
2.4%
5.6%
5.5%
2.5%
2.9%
16.5%26.3%
9.7%
17.0%
4.4%
13.5%
13.4%
6.0%
2.0%
4.5%
6.4%
10.9%
21.9%
4.6%
9.8%
3.3%
7.0%
12.4%
6.0%
3.0%
14.8%
5.9% 5.7%
6.5%
4.4%
3.4%
8.6%
27.6%28.6%
23.2%
5.9%
5.5%
6.3%
5.1%4.9%
43.4%
16.6%
6.3%
21.6%
12.5%
4.7%
6.5%
10.9%
1.3%
10.2%
3.0%6.6%
26.8%
16.3%
16.8%
4.7%
28.9%
17.0%
11.9%
9.2%
24.8%
13.2%
33.7%
34.8%
5.7%18.1%
10.7%15.6%
7.4%
15.8% 22.5%
1.6%
2.4%
18.1%
2.9%
27.2% 21.7%
2.6%
4.8%
5.5%
2.4%
11.4%
9.3%
14.4%
12.4%
24.1%17.3%
14.3%
16.1%
10.6%
5.9%
39.3%
34.7%
14.8%
13.4%
27.2%
3.6%
17.2%
3.0%
15.6%
14.8%
8.1%
19.0%
52.1%
16.9%
8.3%
3.1%
15.1%
21.3%29.2%
37.4%
15.1%
13.9%
28.8% 37.2%
16.2%39.7%
11.4%
13.6%
6.8%
5.6%
3.6%
11.9%
12.3%
13.3%
4.3%
29.1%
14.8%
4.9%
22.3%18.0%
17.4%
15.8%
4.6%
17.2%
39.9%
19.6%
3.0%
44.7%45.2%
19.6%
24.8%
4.7%
15.7%
14.3%
11.0%
13.4%
24.4%
14.6%
10.4%
7.5%
10
281
410
10
90
410
35
410
35
35
281 37
87
1604
1604
151
1604
421
122
536
13
368
16
422
345
371
353
16
537
47178
25963009
1957
2252
1346
218
35
10
10
37
35
10
BEXAR
Lackland AirForce Base
Fort SamHouston
Randolph AirForce Base
Kelly AirForce Base
BrooksAir Force Base
CalaverasLakeMitchell
Lake
HELOTES
II. Dental Analysis 2005 Partner Organizations’ Dental Utilization Rates(1)
(1) Source: Partner Organizations’ databases.
Miles
0 2.5 5.0 7.5
CentroMedCommuniCareDaughters of CharityMethodist Healthcare MinistriesUniversity Health System

1,725
1,104
388
2,093
353
8
1,254
828
1,426
613
473
1,901
2,144
1,257
8731,017
1,385
4,272
3,959
2,721
1,381
1,640630
2,114
2,585
2,347
3,110
509
334
1,583
1,565
1,162
1,947
1,180
1,298 2,247
1,267
2,192
1,446
2,013
4,1591,195
842
3,021 3,614
1,560
2,421
2,217 1,750
2,249
2,221
1,458
1,055
1,012
1,099
1,769
1,102
730
1,458
8881,113
1,533
1,973
1,412
2,457
1,656
3,339
629
1,476
989
1,127
2,538
960
834
1,227
2,616
1,877
1,972
1,611
1,097
636
856
1,1281,769
1,229
1,167
1,155
621
2,054
2,052
646
1,212
2,4991,115
658
212
837
3,377
3,518
804
1,274
1,601
1,778
1,109
2,869
792
1,980
1,135
1,509
2,583
2,394
3,225
2,534
927 610
541
947
340
2,073
3,009773
1,758
1,872
1,025
997
1,4701,881
2,702
2,392
874
3,290
751
1,650
950
496
966
3,335
2,4672,722
1,962
399
2,314
1,018
2,917
2,702
2,813
152
2,338
966
1,764
2,455
1,6851,475
9911,940
1,021
2,678 2,299
621
1,753
12
1,468
1,420 2,245
926
1,725
794
629
987
1,556
1,739
2,403
1,6681,493
1,623
1,396
498
942
357
2,496
1,132
2,036
1,938
1,385
1,943
2,263
1,910
1,837
1,459
1,375
1,230
928
361
1,263
1,827
2,6721,637
1,755
1,325
2,096
1,888 869
1,6622,023
1,510
1,620
1,040
2,581
1,925
344
1,675
879
1,153
1,286
2,143
1,374
1,346
735
2,169961
877
1,426
1,656
1,096
244
2,118 292
777
1,7341,668
958
708
195
842
1,857
1,375
802
717
1,612
949
841
834
592
609
878
10
410
281
90
410
35
410
35
35
10
10
281 37
87
1604
1604
151
1604
368
421
122
536
13
16
422
345
371
353
16
537
47178
25963009
1957
2252
218
1346
35
10
37
10
35
10
BEXAR
Lackland AirForce Base
Fort SamHouston
Randolph AirForce Base
Kelly AirForce Base
BrooksAir Force Base
CalaverasLakeMitchell
Lake
HELOTES
(1) Source: Capital Healthcare Planning estimated volumes.
Miles
0 2.5 5.0 7.5
CentroMedCommuniCareDaughters of CharityMethodist Healthcare MinistriesUniversity Health System
II. Dental Analysis 2005 Estimated Dental Visits at 200% FPL(1)

-9.7%
-13.0%
12.7%
25.1%
1.0%
27
11.4%
11.0%
17.8%
23.0%
46.2%
14.2%
14.8%
6.5%
4.5%9.3%
14.0%
21.0%
26.0%
9.4%
35.8%
40.5%9.9%
0.2%
5.7%
16.0%
5.4%
10.9%
4.4%
13.1%
17.9%
4.5%
9.7%
-5.1%
19.9% 24.7%
26.8%
13.9%
11.2%
13.2%
1.8%8.5%
11.5%
10.5% 3.7%
22.6%
-4.4%
1.5% 9.0%
-4.1%
28.9%
14.9%
14.8%
11.8%
11.4%
0.7%
0.7%
32.2%
1.6%
-12.3%24.0%
3.0%
8.4%
11.1%
12.0%
4.7%
1.1%
7.8%
-0.3%
3.2%
12.8%
10.0%
5.8%
6.0%
25.4%
1.6%
7.4%
3.5%
15.6%
13.4%
20.8%
-1.6%
8.8%18.1%
17.3%
14.9%
11.2%
-3.6%
-4.3%
13.7%
15.6%
8.1%
3.7%17.3%
8.6%
-0.3%
-0.6%
11.8%
25.4%
14.7%
0.4%
1.4%
-2.2%
5.9%
14.4%
28.3%
0.3%
-0.6%
-3.7%
2.9%
21.7%
40.0%
1.9%
19.2% -8.2%
22.3%
-6.8%
30.2%
6.6%
6.2%20.1%
-0.2%
2.7%
2.8%
12.9%
6.6%6.1%
6.6%
24.5%
-11.6%
11.0%
22.2%
6.5%
-9.3%
10.%
9.1%
4.4%
11.3%5.3%
6.1%
11.7%
12.4%
5.4%
13.8%
8.2%
3.4%
9.2%
9.6%
-18.4%
2.3%
9.3%
10.2%0.1%
12.8%16.5%
7.8%
12.0% -2.4%
14.9%
13.5%
-6.9%
5.2%
1.3% 5.5%
4.0%
16.5%
5.1%
0.5%
2.4%
-11.2%
-2.4%
3.7%
8.8%-1.2%
9.7%
0.7%
3.3%
-2.4%
0.1%
8.8%
0.0%
7.1%
-3.2%
31.3%
11.0%
9.2%
7.0%
14.8%
-11.0%
-8.5%
0.1%
-5.5%
3.7%
6.8%
7.1%
3.2%10.2%
-1.2%
7.1%
1.8%
5.9%
8.6% 7.3%
9.2%4.8%
17.3%
12.7%
17.8%
9.0%
29.3%
-2.9%
18.8%
-1.8%
9.6%
3.8%
17.5%
1.6%
0.6%
5.5%
6.1%7.0%
0.2%
0.5%6.6%
12.9%
-4.9%
6.7%
2.0%
6.4%
3.2%7.1%
3.8%
13.8%
-1.5%
19.0%
5.4%
-0.2%
9.9%
3.9%
2.7%
3.4%
10.5%
5.1%
-0.4%
16.8%
10.5%
-4.5%
0.3%
7.6%
10
281
410
90
410
35
410
35
35
10
10
281 37
87
1604
1604
151
1604
421
536
122
13
368
16
422
345
371
353
16
537
47178
25963009
1957
2252
1346
218
35
10
35
37
10
10
BEXAR
Lackland AirForce Base
Fort SamHouston
Randolph AirForce Base
Kelly AirForce Base
BrooksAir Force Base
CalaverasLakeMitchell
Lake
HELOTES
II. Dental Analysis Percentage Growth in Estimated Visits at 200% FPL 2005 - 2011(1)
(1) Source: Capital Healthcare Planning estimated volumes.
Miles
0 2.5 5.0 7.5
CentroMedCommuniCareDaughters of CharityMethodist Healthcare MinistriesUniversity Health System

-17.1%
-20.5%
32.7%
56.6%
1.9%
57
19.4%
28.1%
32.0%
61.4%
117.3%
30.1%
26.6%
10.4%
9.2%35.0%
29.6%
38.5%
55.7%
14.7%
81.2%
79.2%22.1%
3.5%
8.3%
41.0%
9.5%
24.7%
5.5%
27.8%
30.0%
10.1%
25.3%
-9.6%
49.6% 51.0%
51.9%
26.8%
21.8%
22.3%
1.6%13.6%
21.0%
18.7% 4.7%
46.5%
-8.0%
0.8% 11.5%
-6.3%
55.2%
29.3%
22.3%
28.4%
22.0%
1.1%
7.5%
71.2%
6.3%
-10.5%49.2%
7.8%
15.5%
21.9%
25.0%
5.1%
0.4%
16.9%
-2.5%
9.5%
20.8%
14.8%
9.2%
9.2%
63.4%
1.8%
13.0%
6.4%
28.6%
23.7%
37.0%
2.4%
19.2%30.1%
37.8%
28.7%
20.2%
-4.9%
2.3%
23.9%
36.6%
18.3%
5.6%27.0%
13.5%
3.5%
5.9%
20.9%
45.7%
39.1%
2.9%
4.3%
-2.2%
13.4%
23.6%
55.6%
0.7%
-3.1%
-2.8%
9.4%
42.0%
83.2%
2.8%
46.3% -13.5%
36.6%
-9.5%
54.1%
8.2%
8.2%38.4%
0.5%
3.7%
14.3%
27.6%
10.3%21.3%
11.4%
47.3%
-16.4%
17.5%
50.5%
11.6%
-16.2%
20.8%
16.0%
7.2%
22.2%9.9%
7.8%
20.1%
21.5%
7.8%
23.2%
14.4%
6.8%
9.7%
13.6%
-29.7%
3.3%
15.0%
16.2%-1.8%
20.9%27.4%
12.3%
19.9% -7.1%
31.0%
24.3%
-8.7%
9.9%
2.3% 8.3%
9.4%
30.1%
20.1%
4.1%
2.1%
-20.1%
-6.4%
3.0%
13.0%-5.4%
15.1%
-1.0%
1.7%
-2.4%
5.5%
13.5%
-2.2%
11.3%
-6.8%
59.6%
17.5%
19.7%
9.5%
25.4%
-20.3%
-12.9%
-3.1%
-12.8%
6.6%
11.2%
10.6%
3.2%17.7%
-2.4%
9.7%
1.3%
8.5%
14.4% 10.5%
13.3%7.4%
27.6%
22.7%
34.2%
14.4%
56.7%
-4.3%
33.4%
-4.5%
12.3%
8.0%
28.1%
1.0%
-1.5%
12.2%
9.8%8.7%
-1.0%
-1.0%
20.0%
-9.8%
10.2%
-0.2%
9.7%
4.3%11.5%
1.5%
22.8%
-6.9%
10.%
17.8%
4.7%
2.3%
2.2%
19.0%
7.9%
-0.8%
29.5%
19.0%
-8.1%
-3.3%
16.3%
10
281
410
90
410
35
410
35
35
10
10
281 37
87
1604
1604
151
1604
421
122
536
13
368
16
422
345
371
353
16
537
47178
25963009
1957
2252
1346
218
35
10
10
35
37
10
BEXAR
Lackland AirForce Base
Fort SamHouston
Randolph AirForce Base
Kelly AirForce Base
BrooksAir Force Base
CalaverasLakeMitchell
Lake
HELOTES
(1) Source: Capital Healthcare Planning estimated volumes.
Miles
0 2.5 5.0 7.5
CentroMedCommuniCareDaughters of CharityMethodist Healthcare MinistriesUniversity Health System
II. Dental Analysis Percentage Growth in Estimated Visits at 200% FPL 2005 - 2016(1)
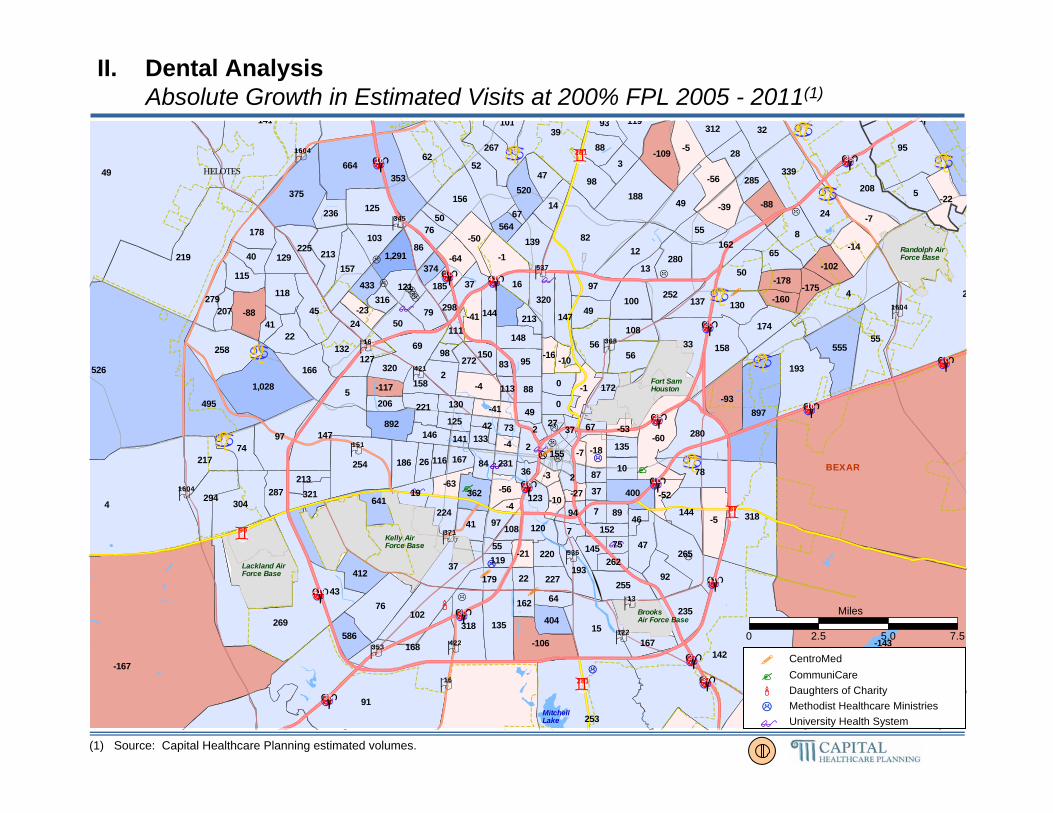
-167
-143
49
526
4
2
142
91
253
141
219
269
318
82
3995
193
897
1,028
254
495
66462
4
147
375
168
55
15
208
280
52
188
-60
258 555
339
304
162
265
76102
97
318 135
353
-106
33 158
-93
641
217
156
119
125
12
8
235
24
-109267
45
166
157
294
78
37
49
-5
32
144
255
56
50
312
43
139
69
252
147
132
-14
100320
213
174
130
-22
-88
280
101
98
92193
56
-1
-5
400
892
118
5
22
-39
65
412
225
5
-7
-56
74
520
1,291
47
178 -50
121
-64
103
137
186155
-4
50
28
129
97115
179
586
-102
362
167
108
-88
49
88
148
279144
120
47
287
55
404
221
95
14
224
-178
41
227
1722
-41
127320
79
321 -56
93
236
-1
76
19 123
37
285
40
3
24
-175
-41
88
146-18
158
10
16
-23
0
220
0
145
-63
433
213
207
135
272
-160
-117
2
-52
13
86
130
84167
150
-21
94
26
125
162 64
15297
262
206
185
231
564
-10
316
-16
111
49
374
22
7
41
116
13367
2
7 89
213
-53
-10
108
42 37
50
55119
36
98
-3
298
46
-4
113
73
37
27
75
83
-4
141
87
-27
-7
2
67
10
410
410
281
90
35
410
35
35
10
10
281 37
87
1604
1604
151
1604
368
421
536
122
13
16
422
345
371
353
16
537
47178
25963009
1957
2252
1346
218
1976
35
10
10
35
37
10
BEXAR
Lackland AirForce Base
Fort SamHouston
Randolph AirForce Base
Kelly AirForce Base
BrooksAir Force Base
CalaverasLakeMitchell
Lake
HELOTES
II. Dental Analysis Absolute Growth in Estimated Visits at 200% FPL 2005 - 2011(1)
(1) Source: Capital Healthcare Planning estimated volumes.
Miles
0 2.5 5.0 7.5
CentroMedCommuniCareDaughters of CharityMethodist Healthcare MinistriesUniversity Health System

-295
-227
127
1,184
7
4
244
233
456
376
554
572
570
131
81356
410
1,646
2,204
400
1,121
1,298139
74
215
963
296
126
19
440
470
117
493
-113
644 1,146
658
587
315
448
68162
177
565 171
725
-195
18 201
-141
1,225
427
236
287
242
19
83
520
91
-93547
120
305
309
613
84
13
106
-37
94
234
376
88
77
778
47
244
125
461
260
235
20
217533
464
335
233
-30
47
489
236
222
140301
89
7
49
706
1,607
315
37
69
-40
149
678
441
14
-35
-42
242
1,006
2,683
72
429 -83
198
-90
184
170
247297
8
69
147
275
152401
308
1,131
-143
577
379
192
-154
103
155
241
547269
153
80
497
80
678
388
192
15
317
-287
59
368
273-26
-33
207531
125
533 -163
192
426
-1
145
32 186
87
520
160
26
20
-312
-112
73
217-81
245
-13
9
-22
20
338
-25
231
-132
825
340
447
182
467
-296
-178
-38
-119
24
142
194
86290
216
-42
129
19
178
271 91
221151
416
368
356
371
1,092
-15
560
-39
141
103
602
14
-20
90
143
21284
-8
-14 163
330
-107
-9
165
-5 59
75
74191
14
162
-13
577
84
-47
203
87
31
18
137
128
-7
248
159
-48
-19
-20
143
10
410
410
281
90
35
410
35
35
10
10
281 37
87
1604
1604
151
1604
368
421
536
122
13
16
422
345
371
353
16
537
47178
25963009
1957
2252
1346
218
1976
35
10
10
35
37
10
BEXAR
Lackland AirForce Base
Fort SamHouston
Randolph AirForce Base
Kelly AirForce Base
BrooksAir Force Base
CalaverasLakeMitchell
Lake
HELOTES
II. Dental Analysis Absolute Growth in Estimated Visits at 200% FPL 2005 - 2016(1)
(1) Source: Capital Healthcare Planning estimated volumes.
Miles
0 2.5 5.0 7.5
CentroMedCommuniCareDaughters of CharityMethodist Healthcare MinistriesUniversity Health System

1,046
661
226
1,239
246
4
752
495
865
360
284
1,209
1,271
757
527603
820
2,567
2,339
1,651
815
999366
1,242
1,558
1,393
1,877
303
201
944
957
687
1,160
738
783 1,343
749
1,319
876
1,232
2,518730
506
1,828 2,198
926
1,463
1,355 1,062
1,345
1,345
862
617
591
646
1,077
648
442
868
516649
915
1,180
846
1,474
1,023
2,036
376
929
577
693
1,540
588
536
734
1,580
1,169
1,212
983
687
389
502
7041,102
728
700
699
375
1,215
1,259
375
713
1,525685
401
132
496
2,077
2,153
475
769
950
1,069
677
1,740
467
1,195
684
897
1,536
1,423
2,028
1,557
551 373
341
576
206
1,269
1,842467
1,070
1,170
613
582
9291,116
1,660
1,449
514
2,043
450
1,001
558
330
573
2,035
1,4841,657
1,200
229
1,396
611
1,784
1,670
1,712
93
1,442
582
1,085
1,503
1,072903
5991,189
657
1,628 1,418
366
1,053
8
885
870 1,379
571
1,027
470
366
598
966
1,075
1,465
1,021
930
988
871
331
570
220
1,528
704
1,244
1,190
836
1,182
1,352
1,190
1,120
878
822
747
569
228
769
1,123
1,6431,033
1,080
816
928
1,291
1,154 528
1,0381,242
916
970
626
1,602
1,167
207
1,008
537
694
804
1,305
845
818
438
1,338585
542
865 810
1,006
672
146
995
1,306 177
467
1,0701,027
590
502
120
959
513
1,156
696
1,136
843
496
440
981
587
520
513
362
221
384
531
10
410
281
90
410
35
410
35
35
10
10
281 37
87
1604
1604
151
1604
368
421
122
536
13
16
422
345
371
353
16
537
47178
25963009
1957
2252
218
1976
1346
35
10
35
37
10
10
BEXAR
Lackland AirForce Base
Fort SamHouston
Randolph AirForce Base
Kelly AirForce Base
BrooksAir Force Base
CalaverasLakeMitchell
Lake
HELOTES
(1) Source: Capital Healthcare Planning estimated volumes.
III. Emergency Analysis 2005 Estimated Emergency Visits at 200% FPL(1)
Miles
0 5 10 15
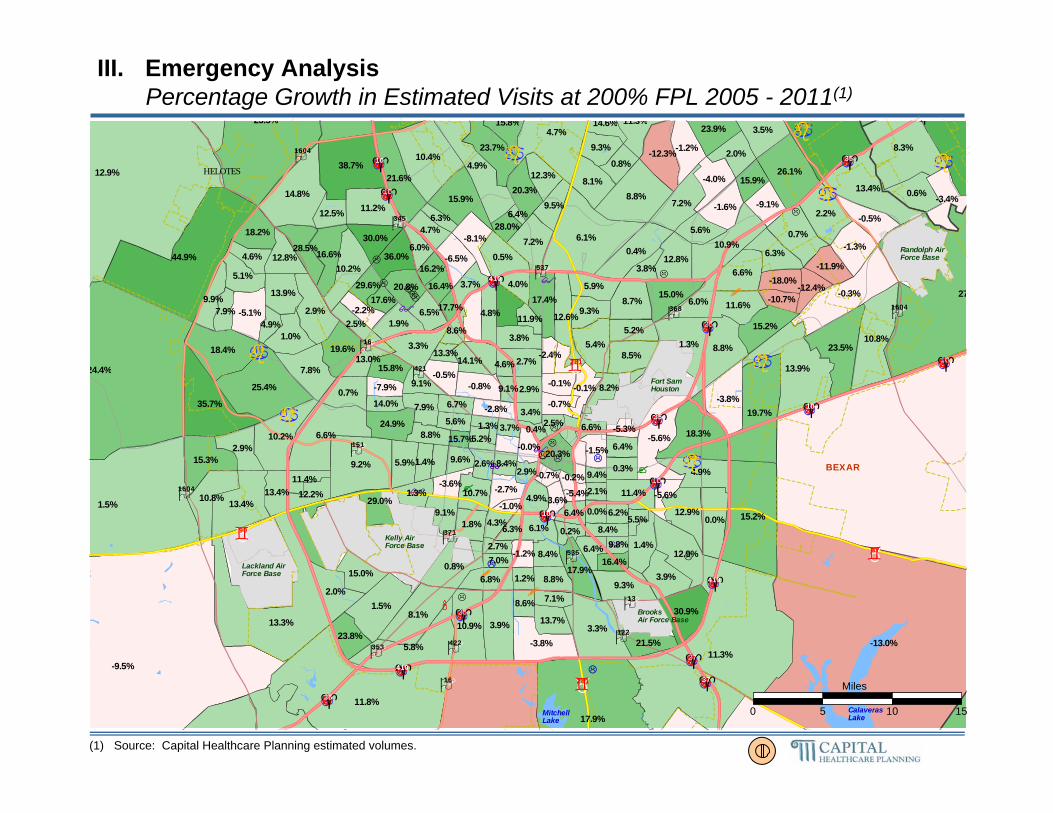
-9.5%
-13.0%
12.9%
24.4%
1.5%
27
11.3%
11.8%
17.9%
23.5%
44.9%
13.3%
15.2%
6.1%
4.7%8.3%
13.9%
19.7%
25.4%
9.2%
35.7%
38.7%10.4%
-0.3%
6.6%
14.8%
5.8%
10.8%
3.3%
13.4%
18.3%
4.9%
8.8%
-5.6%
18.4% 23.5%
26.1%
13.4%
10.9%
12.9%
1.5%8.1%
10.2%
10.9% 3.9%
21.6%
-3.8%
1.3% 8.8%
-3.8%
29.0%
15.3%
15.9%
11.3%
11.2%
0.4%
0.7%
30.9%
2.2%
-12.3%23.7%
2.9%
7.8%
10.2%
10.8%
4.9%
0.8%
7.2%
0.0%
3.5%
12.9%
9.3%
5.4%
6.6%
23.9%
2.0%
7.2%
3.3%
15.0%
12.6%
19.6%
-1.3%
8.7%17.4%
16.6%
15.2%
11.6%
-3.4%
-5.1%
12.8%
15.8%
8.1%
3.9%17.9%
8.5%
0.5%
-1.2%
11.4%
24.9%
13.9%
0.6%
1.0%
-1.6%
6.3%
15.0%
28.5%
0.7%
-0.5%
-4.0%
2.9%
20.3%
36.0%
1.4%
18.2% -8.1%
20.8%
-6.5%
30.0%
6.0%
5.9%20.3%
-0.8%
1.9%
2.0%
12.8%
5.9%5.1%
6.8%
23.8%
-11.9%
10.7%
21.5%
5.2%
-9.1%
9.3%
9.3%
3.8%
9.9%4.8%
6.1%
12.3%
13.4%
5.6%
13.7%
7.9%
2.7%
9.5%
9.1%
-18.0%
1.8%
8.8%
8.2%-0.5%
13.0%15.8%
6.5%
12.2% -2.7%
14.6%
12.5%
-0.1%
4.7%
1.3% 4.9%
3.7%
15.9%
4.6%
0.8%
2.5%
-12.4%
-2.8%
2.9%
8.8%-1.5%
9.1%
0.3%
4.0%
-2.2%
-0.1%
8.4%
-0.7%
6.4%
-3.6%
29.6%
11.4%
7.9%
6.4%
14.1%
-10.7%
-7.9%
-0.0%
-5.6%
3.8%
6.0%
6.7%
2.6%9.6%
-1.2%
6.4%
1.4%
5.6%
8.6% 7.1%
8.4%4.3%
16.4%
14.0%
16.4%
8.4%
28.0%
-3.6%
17.6%
-2.4%
8.6%
3.4%
16.2%
1.2%
0.2%
4.9%
5.2%6.6%
-0.2%
0.0%6.2%
11.9%
-5.3%
6.3%
1.3%
6.3%
2.7%7.0%
2.9%
13.3%
-0.7%
17.7%
5.5%
9.1%
3.7%
2.1%
2.5%
9.8%
4.6%
-1.0%
15.7%
9.4%
-5.4%
0.4%
6.4%
10
281
410
90
410
35
410
35
35
10
10
281 37
87
1604
1604
151
1604
421
536
122
13
368
16
422
345
371
353
16
537
47178
25963009
1957
2252
1346
218
35
10
35
37
10
10
BEXAR
Lackland AirForce Base
Fort SamHouston
Randolph AirForce Base
Kelly AirForce Base
BrooksAir Force Base
CalaverasLakeMitchell
Lake
HELOTES
III. Emergency Analysis Percentage Growth in Estimated Visits at 200% FPL 2005 - 2011(1)
(1) Source: Capital Healthcare Planning estimated volumes.
Miles
0 5 10 15

-17.0%
-20.0%
34.7%
56.3%
3.0%
58
19.8%
30.0%
32.5%
64.2%
114.5%
28.0%
27.8%
10.1%
10.3%34.2%
30.1%
36.6%
55.4%
14.6%
81.6%
76.5%24.2%
3.5%
9.7%
39.6%
10.1%
25.1%
4.0%
28.9%
30.3%
11.2%
24.1%
-10.4%
46.8% 49.1%
51.1%
25.9%
21.1%
21.9%
1.2%12.5%
19.3%
19.6% 5.0%
45.2%
-7.3%
0.4% 11.0%
-5.5%
55.2%
30.8%
24.7%
28.3%
22.4%
0.4%
8.5%
69.0%
7.7%
-9.5%49.9%
8.3%
14.9%
20.8%
23.0%
5.5%
-0.3%
16.1%
-1.8%
11.0%
20.8%
13.7%
9.3%
11.0%
60.4%
2.5%
12.6%
5.7%
27.4%
22.4%
35.3%
3.5%
20.2%28.9%
37.1%
29.5%
20.3%
-4.5%
1.5%
22.3%
38.5%
18.9%
5.6%28.1%
14.5%
5.6%
5.3%
20.1%
44.4%
38.2%
3.3%
4.3%
-0.9%
14.2%
24.4%
57.8%
1.4%
-3.1%
-2.9%
9.9%
40.2%
75.0%
1.9%
44.9% -12.6%
34.4%
-8.7%
54.3%
7.1%
7.6%39.4%
-0.2%
2.3%
13.7%
28.4%
9.0%20.2%
11.3%
46.1%
-16.1%
16.5%
49.2%
9.8%
-15.4%
20.5%
16.8%
6.1%
19.8%8.9%
7.5%
21.7%
23.0%
8.1%
22.7%
13.7%
5.7%
10.5%
12.3%
-29.0%
2.4%
14.3%
13.3%-2.6%
20.8%26.4%
9.9%
19.9% -7.9%
31.1%
22.8%
2.3%
9.1%
2.0% 7.1%
8.7%
29.3%
19.8%
5.6%
2.3%
-21.6%
-7.1%
1.8%
12.8%-6.1%
14.1%
-1.6%
3.1%
-1.7%
6.1%
12.7%
-3.0%
10.1%
-7.4%
57.2%
17.7%
17.9%
8.2%
24.4%
-19.8%
-11.7%
-3.4%
-13.1%
7.2%
9.8%
9.7%
2.2%16.3%
-2.9%
8.4%
0.5%
7.6%
14.3% 10.3%
12.1%6.6%
26.1%
25.3%
32.2%
13.0%
54.7%
-5.0%
31.8%
-5.3%
10.9%
7.3%
26.1%
0.1%
-2.1%
12.4%
8.1%8.4%
-1.4%
-1.4%
18.3%
-10.5%
9.3%
-1.4%
9.5%
3.2%10.7%
0.2%
22.1%
-5.5%
34.5%
9.7%
16.6%
4.2%
1.3%
1.3%
17.8%
7.0%
-1.9%
27.2%
17.3%
-9.6%
-3.5%
14.6%
10
281
410
90
410
35
410
35
35
10
10
281 37
87
1604
1604
151
1604
421
122
536
13
368
16
422
345
371
353
16
537
47178
25963009
1957
2252
1346
218
35
10
35
37
10
10
BEXAR
Lackland AirForce Base
Fort SamHouston
Randolph AirForce Base
Kelly AirForce Base
BrooksAir Force Base
CalaverasLakeMitchell
Lake
HELOTES
(1) Source: Capital Healthcare Planning estimated volumes.
III. Emergency Analysis Percentage Growth in Estimated Visits at 200% FPL 2005 - 2016(1)
Miles
0 5 10 15

-100
-86
29
303
4
1
85
59
155
84
127
161
193
46
2550
114
506
595
152
290
38738
-4
103
206
109
33
7
127
175
34
102
-41
144 315
195
176
95
159
3959
52
199 86
200
-56
18 93
-51
391
132
98
66
72
4
4
137
19
-64154
27
92
86
159
50
16
27
0
20
89
144
32
36
175
32
84
40
148
87
76
-7
61192
121
107
81
-13
-62
161
59
58
60123
34
1
-6
237
535
66
5
10
-17
43
260
133
8
-4
-36
45
290
730
21
100 -30
71
-37
62
76
10995
-8
23
12
74
5557
113
345
-61
218
97
52
-51
31
53
78
14779
73
28
187
34
244
131
47
9
131
-104
20
133
88-4
-30
78188
43
199 -39
54
131
-0
42
604
11 67
21
163
22
3
15
-120
-30
42
89-14
90
3
13
-12
-0
129
-5
79
-43
248
135
107
77
158
-94
-65
-0
-32
9
46
75
4399
89
-13
53
13
72
100 37
8754
150
136
102
134
327
-7
178
-13
59
27
211
10
2
21
68
6939
-1
0 50
120
-35
-7
62
17 21
30
2971
17
67
-1
170
28
-10
63
42
18
13
43
45
-6
82
48
-19
-6
1
34
10
410
410
281
90
35
87
410
35
35
10
10
281 37
1604
1604
151
1604
368
421
536
122
13
537
16
422
345
371
353
16471
78
25963009
1957
2252
1346
218
1976
35
10
10
35
37
10
BEXAR
Lackland AirForce Base
Fort SamHouston
Randolph AirForce Base
Kelly AirForce Base
BrooksAir Force Base
CalaverasLakeMitchell
Lake
HELOTES
III. Emergency Analysis Absolute Growth in Estimated Visits at 200% FPL 2005 - 2011(1)
(1) Source: Capital Healthcare Planning estimated volumes.
Miles
0 5 10 15

-178
-132
78
698
7
2
149
149
281
231
325
339
353
76
54206
247
940
1,295
241
665
76489
43
151
551
190
76
8
272
290
77
280
-77
367 660
383
341
185
270
3091
98
358 109
419
-107
5 117
-74
742
265
152
167
145
4
55
305
67
-49324
76
175
176
339
56
-6
61
-16
63
144
210
55
59
443
40
148
69
270
154
137
17
142318
270
207
142
-17
18
281
144
135
86193
58
7
26
417
955
181
25
41
-9
96
425
270
17
-22
-26
152
572
1,522
30
247 -47
117
-50
112
90
139184
-2
27
84
165
84225
188
669
-83
336
222
98
-86
68
96
125
294148
89
50
321
50
405
229
98
10
177
-169
26
215
143-24
-30
124314
65
324 -112
114
240
0
81
18 98
49
301
93
20
14
-209
-77
26
131-57
140
-14
10
-9
13
194
-21
126
-89
478
210
242
98
273
-174
-96
-25
-74
16
76
109
36169
129
-31
69
4
99
166 55
12682
239
246
202
208
638
-10
320
-28
76
59
340
1
-17
54
81
10849
-8
-12 94
184
-71
-6
93
-18 33
44
34110
1
111
-7
331
50
-41
116
48
11
7
78
69
-11
141
89
-35
-13
-13
78
10
410
410
281
90
35
410
35
35
10
10
281 37
87
1604
1604
151
1604
368
421
536
122
13
16
422
345
371
353
16
537
47178
25963009
1957
2252
1346
218
1976
35
10
10
35
37
10
BEXAR
Lackland AirForce Base
Fort SamHouston
Randolph AirForce Base
Kelly AirForce Base
BrooksAir Force Base
CalaverasLakeMitchell
Lake
HELOTES
III. Emergency Analysis Absolute Growth in Estimated Visits at 200% FPL 2005 - 2016(1)
(1) Source: Capital Healthcare Planning estimated volumes.
Miles
0 5 10 15