Strategic Planning of the Faculty Workforce Model Planning of the Faculty Workforce Model Jocelyn...
23
Strategic Planning of the Faculty Workforce Model Jocelyn Caldwell, TIAA Valerie Martin Conley, University of Colorado, Colorado Springs Paul Yakoboski, TIAA Institute AAC&U 2018 Annual Meeting January 26, 2018
Transcript of Strategic Planning of the Faculty Workforce Model Planning of the Faculty Workforce Model Jocelyn...

Strategic Planning of the Faculty Workforce Model
Jocelyn Caldwell, TIAA Valerie Martin Conley, University of Colorado, Colorado Springs Paul Yakoboski, TIAA Institute
AAC&U 2018 Annual Meeting January 26, 2018
Agenda
Introduction
Use of nontenure-track faculty
Cost and outcome implications
Workforce analytics and planning
Better understanding the current state
Envisioning the future state
Application within higher education
2

Changing faculty composition
57% 50%
55%
20%
50% 44%
38%
17%
Research Masters Bachelors CommunityCollege
Public higher ed 2003 2013
Decreasing share of faculty are tenured/tenure track.
3 Source: Hurlburt and McGarrah, “The Shifting Academic Workforce,” TIAA Institute and Delta Cost Project (2016).
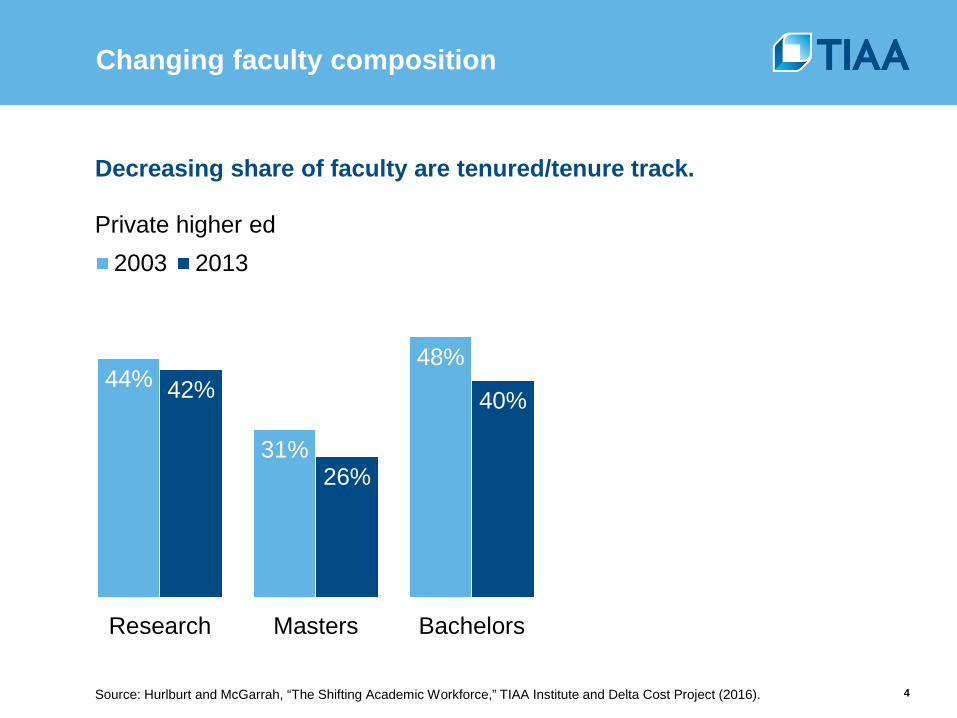
Changing faculty composition
44%
31%
48% 42%
26%
40%
Research Masters Bachelors
Private higher ed 2003 2013
Decreasing share of faculty are tenured/tenure track.
4 Source: Hurlburt and McGarrah, “The Shifting Academic Workforce,” TIAA Institute and Delta Cost Project (2016).

Adjunct growth and salary growth
Change in salary per FTE faculty, 2003-2013
Zero or small growth in adjunct share
High growth in adjunct share
9% 7%
13% 26% 27%
Public 4-years Public 2-years Private 4-years
0%
5 Source: Hurlburt and McGarrah, “Cost Savings or Cost Shifting?,” TIAA Institute and Delta Cost Project (2016).
Outcomes in adjunct-taught courses
Research generally finds negative effects on student outcomes.
Learning outcomes
Retention rates
Transfers from 2-year to 4-year institutions
Graduation rates
6
Outcomes in adjunct-taught courses
Factors underlying negative effects
Lack of faculty-student interactions outside of class
Last-minute hiring
Lack of professional development and mentoring
Limited access to campus resources
7

Career satisfaction
Adjunct faculty tend to be less satisfied with their academic career.
41%
69%
45%
28% 86%
97%
Adjunct faculty Tenure-track faculty
Somewhat satisfied
Very satisfied
8 Source: Faculty Career and Retirement Survey, TIAA Institute (2014).

Workforce intelligence
W O R K F O R C E A N A LY T I C S
W O R K F O R C E P L A N N I N G
What is going on with our workforce?
What should we do in the future?
W O R K F O R C E P L A N N I N G
9
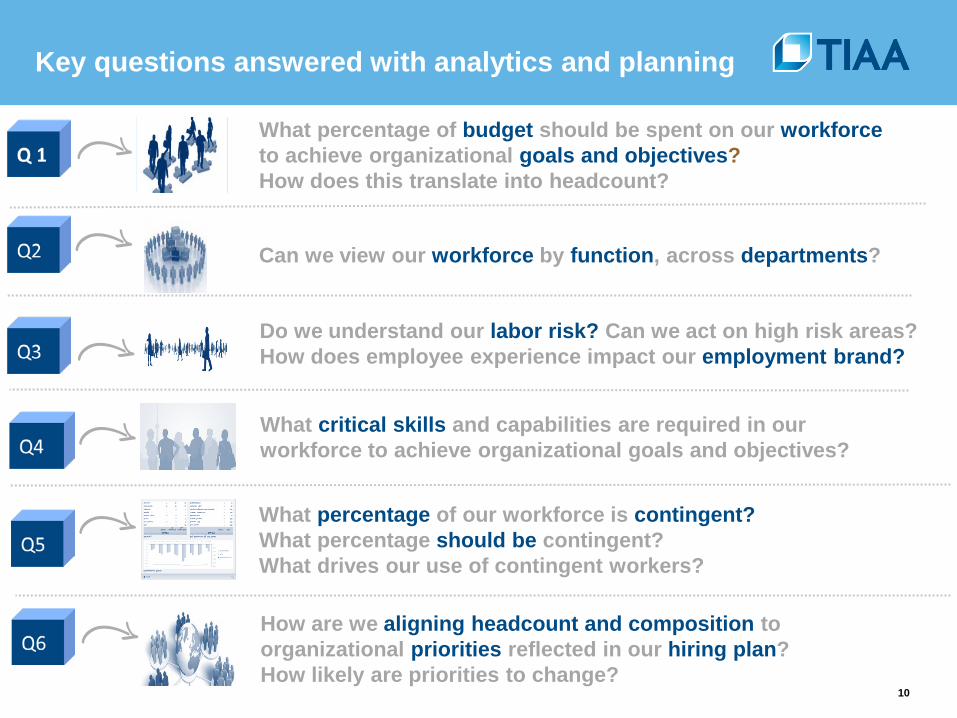
Key questions answered with analytics and planning
What percentage of budget should be spent on our workforce to achieve organizational goals and objectives? How does this translate into headcount?
How are we aligning headcount and composition to organizational priorities reflected in our hiring plan? How likely are priorities to change?
What critical skills and capabilities are required in our workforce to achieve organizational goals and objectives?
What percentage of our workforce is contingent? What percentage should be contingent? What drives our use of contingent workers?
Can we view our workforce by function, across departments?
Do we understand our labor risk? Can we act on high risk areas? How does employee experience impact our employment brand?
10

Workforce analytics and planning maturity model
1. Ad-hoc Reporting Extension Workforce analytics is a reporting extension of HR and mostly provides descriptive information about the efficiency of HR operations to HR and business partners.
2. Stand Alone Analytics Workforce analytics is distinguished from reporting and measurement allowing HR to prioritize specific areas for descriptive analysis.
3. Cause and Effect Analytics HR investigates the causes of talent phenomena to inform HR activities.
4. Business-Led Analytics
Workforce analytics integrates with workforce planning to identify prioritized talent areas most important to the business by engaging with key stakeholders to identify workforce needs of the future.
5. Actionable Analytics Workforce analytics and planning utilizes a variety of techniques to inform business decisions and provides actionable guidance.
Bus
ines
s O
utco
mes
HR
Sop
hist
icat
ion
Bus
ines
s A
lignm
ent
Wor
kfor
ce A
naly
tics
Wor
kfor
ce P
lann
ing
Adapted from CEB’s Talent Analytics Maturity Model. 11
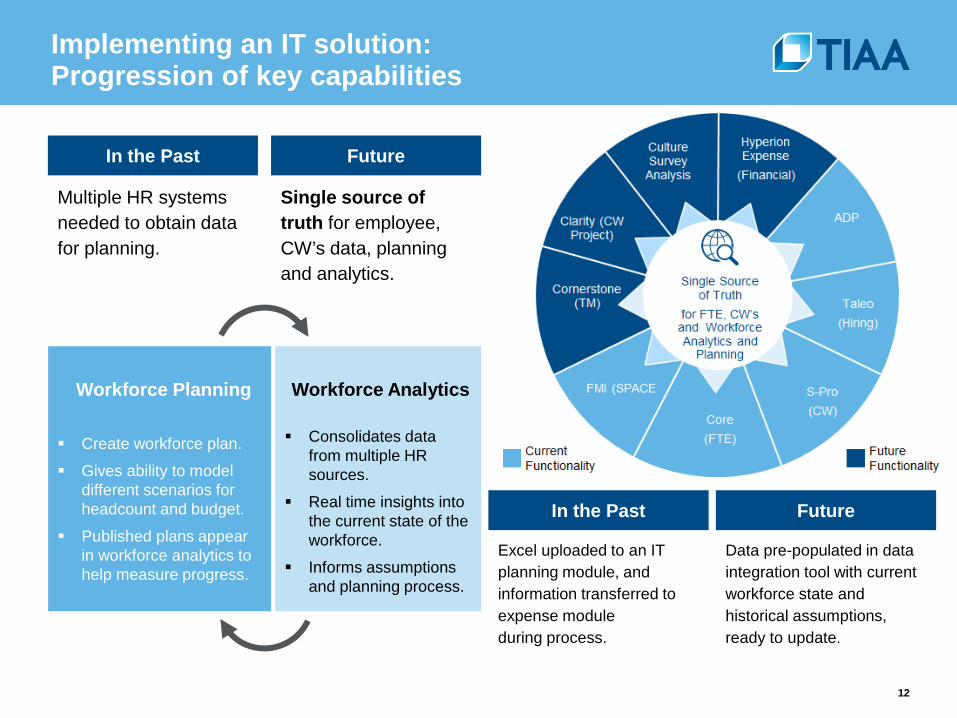
Implementing an IT solution: Progression of key capabilities
In the Past Future
Multiple HR systems needed to obtain data for planning.
Single source of truth for employee, CW’s data, planning and analytics.
In the Past Future
Excel uploaded to an IT planning module, and information transferred to expense module during process.
Data pre-populated in data integration tool with current workforce state and historical assumptions, ready to update.
Workforce Planning Workforce Analytics
Create workforce plan.
Gives ability to model different scenarios for headcount and budget.
Published plans appear in workforce analytics to help measure progress.
Consolidates data from multiple HR sources.
Real time insights into the current state of the workforce.
Informs assumptions and planning process.
12
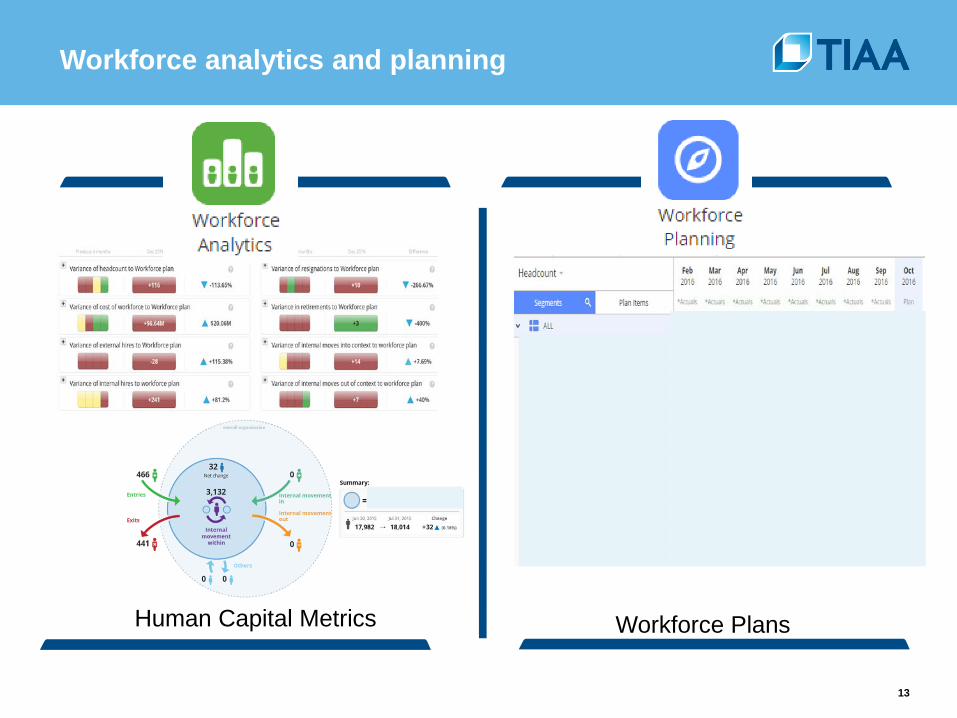
Workforce analytics and planning
Human Capital Metrics Workforce Plans
13

Recruiting
Analyze the roles needed to meet business goals.
Align with managers on hiring requirements.
Act on adapting hiring plans to changing business needs.
Performance
Analyze how to develop more top performers, critical roles and leaders.
Align on the organizational strategy, considering different scenarios.
Act on initiatives that drive performance with measurable results.
14
Workforce analytics

15
Retention Analyze who is at risk of resigning and how to retain them. Align on risk areas, driving mitigation strategies. Act on evolving plans in response to changing environmental conditions and business needs.
Workforce costs
Analyze how much the workforce costs, all in.
Align on the pros and cons of different cost options.
Act on deviations from the workforce plan.
Workforce analytics

Improving workforce
productivity and experience.
Improving CW supply and demand management. Headcount & Hiring Plans
Improving employee supply and demand management. Headcount & Hiring Plans
An end-to-end process that produces a highly accurate annual headcount, hiring plan and quarterly forecasts for employees and CW’s.
Develop human capital strategy and talent plan.
Develop financial plan (budget.)
Translate strategies and budget into headcount and hiring plan.
Determine implications of headcount for organizational performance.
16
Workforce planning

Start/Finish
Check Point Governance
Check Point Governance
17
Workforce planning: end to end
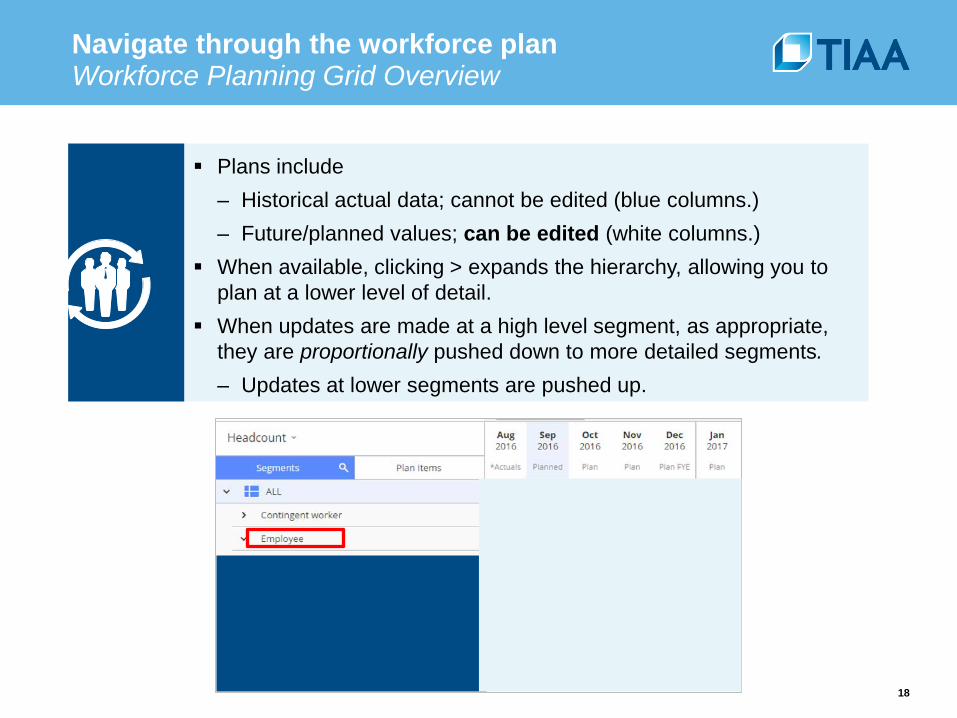
Navigate through the workforce plan Workforce Planning Grid Overview
Plans include – Historical actual data; cannot be edited (blue columns.) – Future/planned values; can be edited (white columns.)
When available, clicking > expands the hierarchy, allowing you to plan at a lower level of detail.
When updates are made at a high level segment, as appropriate, they are proportionally pushed down to more detailed segments. – Updates at lower segments are pushed up.
18

Cost of workforce overview
Workforce costs are projected, based on actual values for each segment.
Workforce costs are made up of base salary cost and benefits (including contingent costs.)
Workforce costs cannot be adjusted directly. They are updated based on changes in headcount.
19

Workforce plan monitoring
Once the workforce plan has been published you can monitor how the plan is performing in comparison to what is actually happening in the business to see if course corrections are required.
Planned Headcount Actual Headcount
20
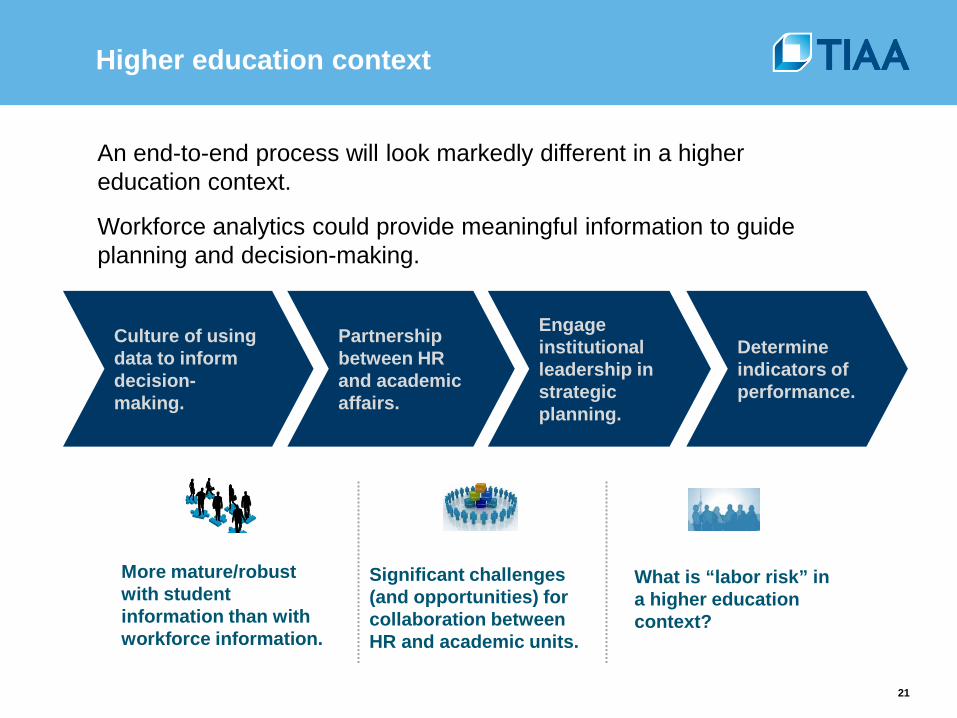
Higher education context
What is “labor risk” in a higher education context?
Significant challenges (and opportunities) for collaboration between HR and academic units.
More mature/robust with student information than with workforce information.
An end-to-end process will look markedly different in a higher education context.
Workforce analytics could provide meaningful information to guide planning and decision-making.
Culture of using data to inform decision-making.
Partnership between HR and academic affairs.
Engage institutional leadership in strategic planning.
Determine indicators of performance.
21

Q&A

Thank you