Strategic planning for a private school: A Case study
214
Rochester Institute of Technology Rochester Institute of Technology RIT Scholar Works RIT Scholar Works Theses 1994 Strategic planning for a private school: A Case study Strategic planning for a private school: A Case study Kathleen Vollmers Follow this and additional works at: https://scholarworks.rit.edu/theses Recommended Citation Recommended Citation Vollmers, Kathleen, "Strategic planning for a private school: A Case study" (1994). Thesis. Rochester Institute of Technology. Accessed from This Thesis is brought to you for free and open access by RIT Scholar Works. It has been accepted for inclusion in Theses by an authorized administrator of RIT Scholar Works. For more information, please contact [email protected].
Transcript of Strategic planning for a private school: A Case study

Rochester Institute of Technology Rochester Institute of Technology
RIT Scholar Works RIT Scholar Works
Theses
1994
Strategic planning for a private school: A Case study Strategic planning for a private school: A Case study
Kathleen Vollmers
Follow this and additional works at: https://scholarworks.rit.edu/theses
Recommended Citation Recommended Citation Vollmers, Kathleen, "Strategic planning for a private school: A Case study" (1994). Thesis. Rochester Institute of Technology. Accessed from
This Thesis is brought to you for free and open access by RIT Scholar Works. It has been accepted for inclusion in Theses by an authorized administrator of RIT Scholar Works. For more information, please contact [email protected].

STRATEGIC PLANNING FOR
A PRIVATE SCHOOL:
A CASE STUDY
by
Kathleen Eyster Vollmers
A project submitted to the
Faculty of the School of Food, Hotel and Travel Management
at
Rochester Institute of Technologyin partial fulfillment of the requirements
for the degree
ofMaster of Science
August 1994

FORMKROCHESTER INSTITUTE OF TECHNOWGY
School of Food, Hotel and Travel ManagementDepartment of Graduate Studies
M.S. Hospitality-Tourism ManagementStatement Grantine or Denyine Pennission to Reproduce ThesislProject
The author of a thesis or project should complete one of the following statementsand include this statement as the page following the title page.
Title of thesis/project: Strategic Planning For A Private SchOOl: A Case Study
I, Kathleen E. vollmerphereby (grant, d't¥ff¥) permission to the
Wallace Memorial Library of R.I.T., to reproduce the document titled above in
whole or part. Any reproduction will not be for commercial use or profit.
OR
I, :, prefer to be contacted each time a
request for reproduction is made. I can be reached at the following address:
~/</71Date Signature
FORM IROCHESTER INSTITUTE OF TECHNOLOGY
School of Food, Hotel and Travel ManagementDepartment of Graduate Studies
M.S. Hospitality-Tourism ManagementPresentation of ThesislProject Findin~s
Narne: _..:.K:=a;.::;t:.:.hl=.:e:::.::e:.:.n~E...:..._V:...,:o:.=l;.=l..::.;m:=.;er::..;s=--- Date: 8/1/94 SS#: --:..:. _
Title of Research: Strategic Planning For A Private School: A Case Study
Specific Recommendations: (Use other side if necessary.)
Thesis Committee: (1) _...::;D.=..r..:...--=Rc:..:i=-=c:.:..:h.;::.a=-rd=-:F--=.---=..:.Ma=:r:...:e:...:c:.:..:k:=.i ( Chairperson)
(2) Dr. Edward Kelly
OR (3) _
Faculty Advisor: Dr. Richard l1a,recki
Number of Credits Approved: __~O..:::.3_c:::.:r::..::e:.:::d~i...::;ts=-- _
g!k(4 yDate Corn..rn:ittee .Ghaifp.erson's Signature
~Date Department Chairperson's Signature
Note: This form will not be signed by the Department Chairperson until all corrections,as suggested in the specific recommendations (above) are completed.
cc: Departmental Student Record File - OriginalStudent

Table of Contents
List of Tables v
Abstract viii
Introduction 1
Methodology . . . .3
Purpose of Planning . . 6
Education Development in the United States 8
Pre-Revolutionary War schools . 8
Pre-Civil War schools 8
Pre-1960 schools 9
Present day schools 10
Professional organizations 12
Background of Park Christian School 14
History of Park Christian School ....... 14
Park's Mission Statement 15
Park's Philosophy 16
Park's Vision Statement 16
External Environment 17
Economic environment . . 17
Economic base ... 17
MSA income ... .20
Economic outlook 24
Government and regulation environment ... 24
Technological environment 27
Social, cultural, and demographic trends ... 30
Social cultural factors 30
Demographic trends 32
Children at risk 34
Market Characteristics 36
National market size and trends 36
Local market size and trends . 38

Competitive Product Offerings 42
Market shares 42
Competitive prices 42
Grade offerings of competitors ; 44
Customer Profile 47
Target market 47
Usage by customers 47
Characteristics of Park families 48
Distribution of demand among churches 51
Geographic demand 54
Attributes and benefits demanded 59
Perceptions of Park . . . .61
Internal Analysis . .63
Overall organization 63
Organization structure 63
Mission and Vision Statement ... . 64
Interviews with pastors . . . .... . 66
School Board . 66
Parent-Teacher Fellowship (PTF) .... 69
Human resources 70
Teacher qualifications . . 70
Evaluation of pay and benefits 71
Staff development and training . . . 73
Job descriptions 73
Employee turnover 73
Administrative processes 74
Administrative structure 74
Office procedures . . 74
Administrator 75
Management style 75
Myers-Briggs analysis . 79
Marketing of Park Christian School .... 84
SWOT analysis developed by School Board . 88
SWOT analysis identified in interview process 91
Product offering of Park Christian School 94
Elementary educational program 94
Junior High educational program . . . . 94
Special programs 95
Program issues 95

Facilities 95
Building exterior: 95
Grounds 96
Capacity 97
Future building expansion 98
Equipment status 99
Office 99
Computer lab 100
Library 100
Outside Playground ... 100
Classroom 100
Hot lunch 101
AV equipment . . 101
Facilities and equipment 102
Finances of Park Christian School 103
Financial procedures . 103
Administrator 103
Bookkeeper . 103
Service bureau accounting service 103
Finance Committee . 103
Accounting year 104
Annual review/audit . . 104
Revenue accounting 104
Cash management .... 104
Payroll 105
Development accounting 105
General ledger . 106
Budgeting .... . . 106
Overall comments 106
Financial statement analysis for Park Christian School 108
Background information ... ... . . 108
The 1982-83 through 1987-88 time period 109
The 1988-89 through 1992-93 time period 116
The 1993-94 budget .... 127
Role of the Finance Committee 128
Overall operation of the Finance Committee 128
Composition of Finance Committee 129
Relationship to Park School Board 130
Involvement in budgeting process 130
Overall comments . . 131
in

Key Factor For Success 133
Strategic Recommendations . . 135
Strategy 1: Organizational structure 135
Strategy 2: Strategic planning . . 141
Strategy 3: Enhance School Board performance 144
Strategy 4: Use leadership and benchmarking to implement TQM .... 148
Strategy 5: Human resource strategies 154
Strategy 6: Evaluate Park's program offerings . . . 157
Strategy 7: Marketing program. . 164
Strategy 8: Facilities 166
Strategy 9: Finances 168
Appendix 1: Caleb Report 172
Appendix 2: Suggestions to Enhance Park Handbook .... 180
Appendix 3: Ideas to Create Junior High . ..... 181
Appendix 4: Aspen Brochure 183
Appendix 5: Job Description From Moorhead High 186
Appendix 6: Employee Evaluation Form 190
Bibliography 193
tv

List of Tables
Table 1 : Employment by economic sector in Fargo-Moorhead
(June 1993) 18
Table 2: Major employers in Fargo-Moorhead 19
Table 3: Income and cost of living in Fargo-Moorhead and comparable cities . .21
Table 4: Household income in 1989 for Fargo-Moorhead Metropolitan
Statistical Area 23
Table 5: Income and poverty status in 1989 by state 23
Table 6: Population of Fargo-Moorhead 1960 through 1990 33
Table 7: Total, public, and private enrollment in grades K-8 in the US,
1975 to 2000 37
Table 8: Actual past and projected future enrollment in Moorhead public schools for
1988-89 through 1997-98 40
Table 9: Actual past and projected future enrollment in Fargo public schools for 1988-
89 through 1997-98 40
Table 10: Actual past and projected future enrollment in Southside Fargo public
schools for 1988-89 through 1997-98 41
Table 11: Actual past and projected future enrollment in Northside Fargo public
schools for 1988-89 through 1997-98 41
Table 12: Market share of Fargo-Moorhead schools based upon 1993-94
enrollments 43
Table 13: Tuition costs for 1994-95 at private schools in Fargo-Moorhead 43
Table 14: Grade levels used in Fargo Public School systems 46
Table 15: Grade levels used in Moorhead and West Fargo Public School
systems 46
Table 16: Enrollment for Park Christian School for 1981-82 through 1993-94 ... 49
Table 17: Retention percentage of Park Christian School 50

Table 18: Profile of families sending children to Park Christian School 50
Table 19: Applications of 80-20 rule to customer base 52
Table 20: Number of churches represented by Park Christian School students . . . 52
Table 21: The church home of students attending Park Christian School 55
Table 22: Enrollment at Park Christian School in 1990-91 and 1993-94 and factors
explaining increase ... .56
Table 23: Enrollment at Park Christian School by geographic location of students
home 58
Table 24: Park Christian School's market penetration in Moorhead, North Fargo, and
South Fargo 58
Table 25: Ranking of educational components by Park parents 60
Table 26: Ranking of educational components by non-Park parents 60
Table 27: Ranking of Park's attributes by Park parents 62
Table 28: Bi-polar comparison of attitudes of public school parents towards the quality
of education 62
Table 29: Current organizational structure of Park Christian School 65
Table 30: Salaries at Park Christian School compared to other regional schools . . 72
Table 31: Training provided for Park Christian School teachers 1991-1994 72
Table 32: Nordstrom's employee rules 78
Table 33: Distribution of four pairs of preferences among all Park Christian School
employees analyzed 82
Table 34: Distribution of four temperaments of Park Christian School employees
analyzed 82
Table 35: Myers Briggs Type Indicator preference groupings for employees of Park
Christian School 83
Table 36: Capacity of Park Christian School assuming two sections per grade level 98
vi

Table 37: Critical income statement components: 1982-1983 1987-1988.. . 110
Table 38: Critical balance sheet components: 1982-1983 1987-1988 114
Table 39: Critical income statement components: 1988-1989 1992-1993 ... 117
Table 40: Revenue and support segmentation: 1988-1989 1992-1993 117
Table 41: Tuition increases in nominal and real dollars ... 118
Table 42: Changes in teacher salaries in nominal and real dollars 120
Table 43: Critical components of the balance sheet: 1988-1989 1992-1993 . 124
Table 44: Critical component of the statement of cash flows: 1988-89 1992-93 126
Table 45: Alternative organizational chart for Park Christian School . . . 140
Table 46: Suggested time lines and responsibilities to complete strategies and tasks 171
vn

Abstract
Park Christian School is a private interdenominational Evangelical Christian
School located in Moorhead, Minnesota. During the 1993-94 school year, 321
students were enrolled in grades K through 8 with the majority from Moorhead or
Fargo, North Dakota. These children represent about 206 families and 39 area
churches.
In the fall of 1993, the School Board authorized a strategic planning process
using professional planning facilitators to lead the planning team which would include
teachers, members of the School Board, members of the Finance Committee, and
parents.
A. External environment
The economy of the region is agricultural-based, while the Fargo-Moorhead
economy consists of services, retail and wholesale trade, and government, including
four hospital/clinic facilities and four higher education institutions. In comparative
terms, in 1990, the service sector generated 31.2 percent of the jobs, compared to 27.7
percent nationally. However, 5.9 percent of jobs were in manufacturing, compared to
14.2 nationwide. This suggests the community has many middle and upper-middle
class people who want a quality education for their children.
Incomes in Fargo-Moorhead tend to be relatively low, while the cost of living
is relatively high for the region. The economic base suggests that the community
contains two groups of families: a relatively sizeable number of higher income
individuals in the medical and educational occupations, along with a sizeable number
viii

of lower income people in other occupations. Combining these factors suggests that
Park must watch tuition rates to avoid pricing itself out of the reach of some families.
Further insight about the community is revealed by Moorhead High School's
graduation rate of 97.3 percent, and 70 percent continuing on to college. And the
Moorhead ACT average test score is 21 which is greater than the Minnesota average
of 19.7. And Minnesota ranks fourth in the nation for test scores. This suggests that
parents in this area are very concerned with the quality education of their children.
Demographic trends show the local population is growing, and is projected to
continue growing during the next several decades. During the 1980's, the Cass-Clay
MSA's population grew 16.9 percent. Projections are for an additional growth of 6.7
percent during the 1990's. For a variety of reasons, Fargo is growing much faster than
Moorhead, and South Fargo is growing faster than North Fargo. The overall growth
suggests that the customer base available to Park is growing, and provides significant
opportunities for Park to grow. However, the direction of the growth in South Fargo
has significant implications because of Parks location in North Moorhead, which is a
distance from the population growth.
B. Market characteristics
In 1985, total national elementary enrollments started increasing, and are
projected to continue to increase into the next century. Local trends follow the
national pattern, and Fargo schools are projecting continued enrollment increase
through the year 2000. However, Moorhead enrollment in the early elementary
grades is declining. Within this environment, Park's enrollment should remain strong.
ix

In addition to Park, the local elementary school environment consists of the
public schools, Catholic School System, Grace Lutheran (K-8), and Oak Grove High
School (grades 7 and 8). As the largest private school in the community with 2.3
percent of the total K-8 student enrollment, Park's real competition is from the public
schools.
Among the private elementary schools in Fargo-Moorhead, Park's tuition and
fees are the highest. Further, most other schools have a two-tier fee structure, with a
substantially lower fee for church members. This structure is not available to Park.
Most Park students continue into public High Schools. Therefore, their grade
configuration has a substantial impact on Park's grade configuration. Historically, all
schools but Fargo North used a middle school, in which grade nine was the first year
of High School. For Park, this meant graduates could enter High School with the
graduates of the public middle schools, which had social implications because Park
students were on "equalfooting"
in establishing social groups. However, the new
Junior High structure in South Fargo has serious implications. Half of the students at
Park will now be forced to move from grade 8 at Park into grade 9 in a Junior High.
This means they will transfer into pre-existing social structures, which can make their
adjustments more difficult.
C. Customer profile
In general, Park serves a very specific target market: The Evangelical Christian
community living in Moorhead, Minnesota, and Fargo, and West Fargo, North Dakota,
and with children in grades K through 8. During the past four years, enrollment has

grown from 204 in 1989-90 to 318 in 1993-94. Annual growth rates have been
twenty, four, twenty, and three percent. This rate of growth has resulted from an (1)
excellent product, (2) effective marketing, (3) excellent retention, and (4) a very
favorable market.
Presently, Park serves families attending 39 different churches and most
denominations in the area. During the part six years, enrollment from the largest
church, First Assembly of God, has increased, but because other enrollment has
increased even faster, the percent from First Assembly has declined about nine percent
from 32 to 23 percent. Further, students from the five churches with the largest
enrollment at Park have averaged around 60 percent during the past five years. These
churches include First Assembly, Bethel Evangelical Free, Salem Evangelical Free,
Triumph Lutheran Brethren, and Evangel Temple during 1988 to 1991-92, and
Believer's Fellowship during 1992-93 through 1993-94.
Historically, the majority of Park students were from Moorhead, but in the
1993-94 school year, this was reversed as Fargo, and West Fargo students
outnumbered Moorhead students for the first time. While enrollment from Moorhead
has continued to climb, enrollment from Fargo has climbed faster.
One need seen by some associated with Park is the expansion of Park into
higher grades starting with grade 9. Eventually, their goal is an entire a High School.
The interviews did not disclose a percentage of people wanting a ninth grade, but it is
important to point out that not everyone wants it. Further, the level of intensity varied
significantly.
xi

D. Internal analysis
Park is directed by Board members appointed by the eight sponsoring churches.
Overall, Park uses a"strong"
School Administrator model of management in which
the Administrator is instrumental in both guiding daily operations, and in establishing
long-term strategies and goals. The School Board currently consists of twelve
members serving three-year staggered terms. The Board tends to be a"working"
Board and focuses on operational issues rather than on strategy or planning. During
the interview process, the Board members identified several areas which they believed
need to be addressed including training, role of the Board, Board recruitment, and
specialized expertise (to illustrate, legal) on the Board.
The Parent-Teacher Fellowship is currently performing some of its functions
very effectively, while others tend to have extremely low parental involvement. It
appears that parents face excessive time demands which restrict their participation. At
this time, the focus of the PTF needs to be evaluated to allow it to function more
effectively.
Each classroom teacher at Park Christian School is certified by the State of
Minnesota and/or the State of North Dakota. Their effectiveness is displayed through
parents reporting satisfaction with their children's progress academically, spiritually,
and socially. Further, standardized academic test results rank Park students extremely
high nationally and regionally. However, since the last Strategic Plan, pay increases
have not reached stated goals and Park salaries are lower than local public, regional
private schools, and ACSI averages.
xn

Park Christian School has one key employee who assumes the duel role of
School Administrator and Principal. This individual is regarded by teachers, Board
members, pastors, and others as an outstanding Administrator who has contributed
significantly to the School's financial and enrollment growth. However, there is also
agreement that the current position includes too many responsibilities for one person.
Park has excellent systems which are maintained by the traditional managerial
approach to organizational performance, and within this structure, teachers assume a
very traditional role. Yet, to become the best Christian school in America, it is
essential to empower employees to create excellence.
Overall, the Park facility is relatively new and therefore, it is in relatively good
condition. Some normal maintenance, such as carpeting and parking lot improvement,
will be ongoing, but there should not be major maintenance projects during the next
several years. On-the-other-hand, the facilities are used very intensively, and there is
a shortage of space for various needs. Perhaps the most urgent needs are for
additional restrooms, expanded gymnasium facilities, and lunch room facilities. In
addition, there is a very pressing need for expanded office space. Park is in the
middle of Phase II of the capital campaign which will address these needs, and also
fund salary increases.
E. Finances of Park Christian School
Overall, in terms of net income, Park was a"breakeven"
to slightly profitable
operation between 1988-89 and 1993-94. For a non-profit, this is excellent
performance.
xiii

Tuition increases at Park has exceeded inflation during 1988-89 to 1992-93 by
1.64 percent for first through eight grades while Kindergarten tuition has decreased by
1.69 percent in real dollars.
Teacher salaries have also increased in real dollars. Beginning salaries
increased 1 .4 percent while salaries of experienced teachers increased 1 . 1 percent in
real dollars. However, salaries in the middle decreased 1.4 in real dollars.
With the advent of the capital campaign in the fall of 1993, the budgeting
process has became more uncertain. Predicting the timing of receipt of capital
campaign pledges is difficult. It is probable that 1993-94 and 1994-95 will be
"strong"
financial years with the concurrence and conclusion of Phase I and Phase II
of the capital campaign in June 30, 1995.
After June 30, 1995, it is anticipated that many of the stated capital campaign
goals will be met. However, dedicated and deferred giving will probably prevent
elimination of the entire School debt. Further, another capital campaign will need to
be launched to fund the annual operating needs not met by tuition and fees for 1995-
96 and future years. Given the transitional state of the development effort, appropriate
personnel need to be hired, and effective planning initiated in the near future.
Park's organizational structure includes a Finance Committee, which is a
subcommittee of the School Board. The Finance Committee makes input in
determining tuition costs, budgets, teacher and staff salaries, and overall financial
development goals. Several areas to enhance performance have been identified: (1)
overall operations of the Committee, (2) composition of the Finance Committee, (3)
xiv

relationship of the Finance Committee to the School Board, and (4) involvement in the
budgeting process.
F. Strategies
Based upon the analysis, several strategies were identified. It is essential to
recognize that these are simply starting points, and each will be modified to respond to
changes and additional information.
1. Finances: The success of Phase I, and the apparent success of Phase II of the
capital campaign has created an excellent position for Park. However, starting
July 1, 1995, Park will have a gap to fill, a debt which has not been retired,
and an inexperienced Development Coordinator. With the potential that many
donors are financially exhausted, immediate action is required to get a
Development Coordinator hired as soon as possible.
2. Ninth grade: There appears to be substantial support for a ninth grade and
some believe that a feasibility study should be conducted during the 1994-95
school year. The consultants do not believe that a feasibility study is warranted
at this time, and the ninth grade should be reconsidered during the 2000-01
school year. This issue should be resolved and the decision communicated to
everyone to avoid revisiting yearly.
3. Administrative structure: Park has outgrown its organizational structure and the
Administrator needs additional supporting personnel to retain the School's
overall effectiveness. Rather than making marginal or small adjustments to the
current structure, it is recommended that the entire administrative structure be
xv
evaluated. This might include a Principal, but a variety of alternatives should
be explored.
4. Board design: Currently, Park utilizes two essential boards, the Finance
Committee and the School Board. Both are effective, but members of both
also believe that performances of each could be enhanced substantially. It is
essential for each to carefully update their mission, develop training, evaluate
operating procedures, and develop job descriptions. Improved performance
includes review of membership. The Finance Committee should add members
who can provide assistance in development because of their existing networks.
And the School Board should consider adding specialized expertise such as
legal, personnel, planning, etc.
5. Administrative style: Park is a very good school, but to move to even higher
levels of performance, Park should use leadership and benchmarking to
implement a total quality system which will enhance communications and
overall performance. It will be almost impossible to achieve excellence at Park
with traditional management.
6. Because of its success, Park faces the dangers of strategic drift which occurs
when organizations loses their focus by adding activities which are onlysemi-
related to their mission. When things are going well, everyone has ideas
regarding new programs. The key is to evaluate each new idea against the
Mission Statement and the cost in dollars and labor, rather than against need.
xvi

7. Teacher and staff pay need to be addressed. To achieve progress, we must first
establish a realistic benchmark. It is suggested that the ACSI median be used.
The second decision is to establish a specific goal. The initial goal should be
the ACSI median. Then, the Board should set a long-term goal above ACSI.
8. During the next several years, the geographic shift of the population base in
Fargo and Moorhead will have significant impacts on Park. While changes in
bussing should solve the problem in the short run, in the long run, Park needs
to address this issue.
9. Because Phase II of the capital campaign is currently in progress, specific
strategies and timing for facilities cannot be fully developed, but they should be
reviewed as the results of the campaign become known. The success of the
campaign will determine the strategies which can be implemented. The current
facilities are increasing the pressure on teachers because of the crowded
conditions, and this should be addressed as soon as possible. In addition, it is
essential to upgrade computer facilities for the office staff to maintain their
productivity.
xvn

I. Introduction
Park Christian School is a private interdenominational Evangelical
Christian School located in Moorhead, Minnesota. During the 1993-94 school
year, 321 students were enrolled in grades K through 8. The majority of the
students are from homes in either Moorhead, Minnesota, or Fargo, North Dakota,
although a variety of nearby communities are also served. These children
represent about 206 families and 49 area churches.
Since its inception in 1981, Park Christian School has constantly sought
God's will and direction. And towards this end, Park has obeyed the scriptural
instructions:
"Any enterprise is built by wise planning, becomes strong through
common sense, and profits wonderfully by keeping abreast of thefacts."
Proverbs 24:3-4 Living Bible
"We should make plans-Counting on God to directus."
Proverbs
16:9 Living Bible
"Hear counsel and receive instruction, that thou mayest be wise in
thy latterend."
Proverbs 19:20 King James
"A prudent man foresees the difficulties ahead and prepares for
them; the simpleton goes blindly on and suffers theconsequences."
Proverbs 22:3 Living Bible
As part of its scriptural planning process, Park Christian School has
extensively used both strategic planning and marketing research. In late 1988, an
undergraduate team of students from Moorhead State University completed a
survey of parents; in May 1989, an MBA student team completed a marketing
plan; and in 1991, an undergraduate team updated the marketing plan. In
1

addition, Park has continually conducted surveys of employees and parents to
determine needs and potential.
However, the most comprehensive planning effort took place between
October, 1989 and July, 1990. During this period, a Strategic Planning Committee
developed a five-year business plan. Part of the effort included substantial
primary and secondary research. But by the summer of 1993, many of the goals
of the Strategic Plan had already been achieved. The needs of Park Christian
School had changed substantially, and it became obvious a new strategic plan was
essential. To illustrate, enrollment had increased nearly forty percent during the
three year period and the building was fully utilized, containing no room for
expansion. A capital campaign had been launched and was well on the way to
reaching its goal of $1,000,000. To prepare the new plan, a Strategic Planning
Committee was appointed in the fall of 1993, and a planning process was initiated.
Its task was to develop a new strategic plan for Park Christian School.

II. Methodology
In the fall of 1993, the School Board recommended and authorized that
the 1990 Strategic Plan be updated by going through a complete planning process.
To complete the task, professional strategic planning facilitators were utilized to
lead the planning team which would include teachers, members of the School
Board, members of the Finance Committee, and parents. Specifically, the
Strategic Planning Committee included the following individuals:
Clyde Vollmers, Facilitator, Professor of Marketing, Moorhead State
Kathy Vollmers, Facilitator, Vice President, Malchiel Marketing
Dave Bender, Teacher, Park Christian School
Marilyn Ellingson, Teacher, Park Christian School
Ruth Korsmo, Management, Korsmo Funeral Home
Karen Nesius, Teacher, Park Christian School
Terry Norton, Administrator, Park Christian School
Bill Schwandt, Manager, Moorhead Public Service
Polly Sivertson, Teacher, Park Christian School
Len Sliwoski, Professor of Accounting, Moorhead State University
Carl Wendelbo, Manager, Precision Machine of North Dakota
During the initial Planning Committee meeting, subcommittees were
established and specific tasks were assigned. Each subcommittee included at least
one member of the Strategic Planning Committee and other individuals with
specific expertise. The committees and members included:

Facilities: External environmental:
Carl Wendelbo, Chair
Karen Nesius
Steve Gehrtz
Kelsey Olson
Brent Lee
Bill Schwandt, Chair
Karen DeMarais
Marlene Nielsen
Kathy Randall
Jennifer Bender
Personnel: Finance:
Polly Sivertson, Chair
Ruth Korsmo
Dave Bender
Jim Larson, Chair
Sterling Volla
Len Sliwoski
Educational & TQM Marketing:
Marilyn Ellingson, Chair Kathy Vollmers, Chair
Lorraine Kahler Kathy Randall
The overall methodology of this strategic planning process utilized both
primary and secondary data collection methods to assess the external and internal
environments at Park Christian School. These activities were completed by the
subcommittees and other individuals associated with Park. A partial list of
specific tasks included in the methodology includes the following:
The external environments were identified, examined and reviewed by the
subcommittees using primarily secondary information.
The internal environment, Park Christian School itself, was also examined
and reviewed by the subcommittees using both primary and secondary data.

The facilitators interviewed School Administrators from Park to determine
operational characteristics.
The pastors of each of the eight sponsoring churches were interviewed by
the facilitators.
Each Park teacher and School employee was interviewed individually by
the facilitators.
Each of the twelve School Board members were interviewed by the
facilitators. In addition, past Board Chairs were also interviewed.
Some of the ten Finance Committee members were interviewed by the
facilitators.
The Myers-Briggs Type Indicator was administered to every employee of
Park Christian School.
The facilitators interviewed school administrators from similar schools to
determine operational characteristics.
Several surveys were administered to teachers or parents.
A computer data base search was conducted to explore the trends within
private education.
The strategies recommended in this plan have emerged from the
interactions of the individual members of the Strategic Planning Committee. The
committee submitted the strategic plan to the teachers and Board for additional
feedback, review, and modification.

III. Purpose of Planning
A manager's primary task is planning. However, for planning to impact an
organization, it must be part of a formal, systematic, and ongoing process. The
key to the successful implementation of this plan is an ongoing planning process
which meets regularly to evaluate changes at Park Christian School, or in the
environment, and modify the plan accordingly. This is a working document which
must be modified in response to new information or the evolution of
environment.
This document is not an attempt to make future decisions now, because
decisions can only be made in the present. Therefore, future decisions are made
at the appropriate future time. And strategies should not be viewed as cast in
concrete! Rather, they are fluid and may change in response to changes in either
external or internal factors. Planning must be flexible in order to take advantage
of new and changing knowledge about our environment.
And lastly, strategic planning does not follow a scientific formula which fits
every organization under every circumstance. Each plan and each planning
process uniquely utilizes the appropriate portion of the wealth of tools available
for planning.
The benefits of strategic planning to Park Christian School are many and a
partial listing includes the following:
Planning provides vision and direction to an organization.

Planning helps define the organization by identifying uniqueness and
comparative advantages.
Planning also reveals and clarifies future opportunities and threats which
provide direction to an organization.
Focuses attention on major issues and prevents getting sidetracked.
Defines customer.
Defines what the organization must do to more effectively service both
external and internal customers.
Forces us to set objectives and allows us to manage by facts.
Coordinates everyone's effort towards the same objectives.
And lastly, it is essential to understand the approval process of this plan.
Once the present Strategic Planning Committee has completed its work, the
document proceeds to the School Board. The Board has the authority to reject,
accept, or modify any strategy and thus, changes are anticipated through Board
action.
To summarize, this Strategic Plan is a working document which must be
modified regularly if it is to effectively serve Park Christian School.

IV. Education Development in the United States
The development of elementary education in the United States can be
divided into four somewhat distinct periods (Beadle, 1985).
A. Pre-Revolutionary War schools
Puritans brought a high regard for education to American. Luther
advocated compulsory education for all children. Calvinism required all believers
to have an elementary education so they could read the Bible. As a result,
grammar or"petty"
schools were started by Puritans when the number of families
made schools feasible. Schools in the New Netherlands were run by the Dutch
Reformed Church. Churches in Pennsylvania, New Jersey, and Delaware also
controlled local schools. Many times in rural areas, children were either sent
away to church schools or a private tutor was used.
B. Pre-Civil War schools
After the Revolutionary War, academies absorbed the grammar schools.
The academies offered a broader curriculum and were controlled by independent
trustees, not governmental officials. Usually, the trustees had similar religious
beliefs. The academies were open to all faiths, but generally were religious rivals
seeking to indoctrinate their students with their beliefs. The academies were
partially funded by the "foundingfathers"
of the locality and often received
monies from state assemblies. These academies were the dominant forms of
elementary education until the mid-1800's.

C. Pre-1960 schools
The Civil War is usually cited as the dividing line between the end of the
academies and the beginning of free public schools. Four factors caused this
change:
industrialization and the related urbanization,
the assumption by the state of direct responsibility for aspects of social
welfare,
the redefinition of the family, and,
the societal perception of education being a major solution to social
problems.
The move to free public education did not mean the demise of private
schools. Roman Catholics saw public schools as an extension of Protestantism
that had dominated the American society. Thus, by 1860, 200 Catholic schools
were founded. By 1870, there were 1,300 and by 1,900 there were 3800 Catholic
elementary and 1000 secondary schools. In addition, Protestant groups such as
Calvinists, Lutherans, Episcopalians, Quakers, and Dutch Reformed objected to
public schools and established their own church schools. However, other
Protestant groups, including Baptists, Congregationalists, Presbyterians, and
Methodists, accepted the secularized education opportunities and encouraged
religious instruction of children at home.
Between the Civil War and the 1960's, public schools became the major
form of education and private schools played a significant, but minor, role. At the

peak of the Depression, 8.0 percent of the elementary population was in private
schools. In 1960, 13.6 percent of the elementary and secondary school population
was enrolled in private schools, with Catholic schools comprising 87 percent of the
13.6 percent.
D. Present day schools
Total private elementary school enrollment, as a percent from the 1950's to
present, has varied little when compared to public school enrollment. Private
school enrollment peaked in 1960, at 13.6 percent of total elementary school
enrollment, and has stabilized around 11 percent since that point in time. In
1989, the exact figure was 11.7 percent.
However, the constitution of private elementary school enrollment has
changed significantly during this period. In 1960, Catholic school enrollment
constituted 87 percent of total private school enrollment, with the remaining 13
percent being divided between other religious schools and private non-religious
schools. By 1980, Catholic school enrollment dropped to 63 percent of total
private school enrollment, with the remaining 37 percent being distributed 21
percent to other religious schools and 16 percent to private non-religious schools.
By 1989, Catholic school enrollment dropped to 52 percent of total private school
enrollment, with the remaining 48 percent being distributed 34 percent to other
religious schools and 14 percent to non-religious schools.
The decline in students attending Catholic elementary schools over the last
30 year period has been attributed to a number of factors including:
10

views expressed by some Catholic educators that public schools were
sufficient,
decreasing number of Catholics entering the ministry and therefore
unavailable to teach at these schools,
financial difficulties of supporting churches, and
general demographic trends of decreasing students during this time period.
The non-Catholic private schools which have a religious orientation can be
classified in a number of different manners. One of the most common
classifications is denominational schools versus independent Christian schools,
sometimes referred to as Fundamentalist, Pentecostal or Evangelical Christian
schools. There are several religious denominations that have established
elementary schools including: Judaism, Lutherans, Episcopalians, Seventh Day
Adventists, etc. Enrollment in these institutions has been basically stable over the
last 30 year period (Dill, 1987).
Independent Christian schools, historically, have been quite numerous in
the East, and in recent years have spread throughout the country. Independent
Christian schools generally have higher tuition than denominational church
schools, many times are smaller, and share the view that the Bible is the inspired
revelation of God, and believe to attain eternal salvation a "bornagain"
experience is necessary. Independent Christian schools have grown rapidly over
the past 30 year period. Ceyor and Hunt make this observation (1984):
11

Not only do these schools currently constitute the most rapidly
expanding segment of formal education in the United States, but
they also represent the first widespread secession from the public
school pattern since the establishment of Catholic Schools in the
nineteenth century.
Many writers have suggested that nineteenth century public schools, with
Bible reading, prayer, and McGuffy readers, supported a non-denominational
Evangelical Protestant faith, which was also a civic faith. Since the later part of
the twentieth century, society has moved from many traditional values and public
elementary education has moved accordingly. In many cases, Evangelical
Christians believe the exclusion of Christian values and perspectives from public
education is untenable and has, in essence, created a de facto new religion called
secular humanism. Perceived societal and related elementary school trends have
spawned the bulk of many independent Christian schools.
E. Professional organizations
There are many differences among independent Christian schools in terms
of particular beliefs, organizational structure, church affiliations, size, funding
patterns, etc. Many are very independent-minded and do not belong to any
central Christian scholastic association. However, most of these schools belong to
one of the three major Christian scholastic associations:
The largest association is the Association of Christian Schools
International, based in Boulder, Colorado. In 1994, this organization had
2,801 member schools with total enrollment of approximately 463,868
students.
12

The American Association of Christian Schools, located in Jacksonville,
Florida, has 1,000 member schools and approximately 160,000 students.
Christian Schools International, Grand Rapids, Michigan represents
Calvinist schools and in 1994, had 340 member schools and 71,000 students
in the US.
13

V. Background of Park Christian School
A. History of Park Christian School
Park Christian School was founded in May, 1981, through the cooperative
efforts of Bethel Evangelical Free Church, Daystar School and Central Christian
School. It was their vision to offer a quality, Christian interdenominational
education to students of the Fargo-Moorhead area.
Park Christian School started with 103 students in 1981. It was housed in
the former Park School building, a public facility which was closed. Significant
growth occurred during the first three years, and the number of students doubled
to 203 by 1985. This growth demanded a larger facility, and the current property
was purchased in 1985.
Renovation was necessary in the newly purchased property, and several
financial problems arose. Parents and dedicated friends stood strong together,
worked hard and with God's help, Phase One of the renovation was partially
completed in December of 1985, and financial disaster was averted. As Park
Christian School moved forward, new policies were put in place to help assure
stronger financial management.
Students, faculty, and staff joyfully moved into their new facility. By fall of
1986, Phase One of the renovation was complete, but the School's debt exceeded
$1.2 million. In the years since, God has helped us, through generous friends and
careful stewardship, to reduce that debt to just $275,000 in 1994.
14

But during this period, enrollment grew slowly. In the fall of 1984, there
were 203 students and by the fall of 1990 there were 231, which is just under a
fourteen percent growth during a six year period, or about two percent per year.
Therefore, in the fall of 1990, strategic planning was initiated to develop
strategies for increasing enrollment, as well as general vision for the School.
As strategies were implemented, Park began to enjoy blessings in increased
enrollment. During this period, the number of students increased from 231 in
1990, to 318 in the fall of 1993, an increase of 38 percent, or about thirteen
percent per year.
In the fall of 1992, Park Christian School started a three-year capital
campaign designed to raise $1,000,000 for debt reduction and School
improvements. Within 18 months, the goal had been reached, and a Phase II
capital campaign was started to provide for expansion of the School building. The
goal of the second phase is $600,000.
B. Park's Mission Statement
As an interdenominational Evangelical Christian School, we provide high
quality, affordable education which impacts the whole child-body, mind and spirit.
Our mission is to reinforce the values and morals taught in the Christian home
and church while providing a high-quality Christian education. Our certified
teachers are Christians who represent Godly living and principles in everything
they do.
15
C. Park's Philosophy
Our philosophy concurs with scriptural teaching that education is the
ministry given to parents for the purpose of instructing and developing character
in their children (Deuteronomy 6:4-9). We are here to help Christian parents
bring up their children in "the discipline and instruction of theLord"
(Ephesians
4:6). Our emphasis is on instruction and character development.
We are concerned, then, not only with a child's intellectual training, but
also with character development. We train our students in traditional Judeo-
Christian values and attitudes through a Christ-centered curriculum of the highest
academic quality.
D. Park's Vision Statement
We aim to become the best Christian school in America, providing
academic training of exceptional quality within an environment that nurtures
Christian values, morals, ethics, character, and a strong Christian world view.
Such an education equips children with essential academic skills plus a
Christian value system. Both of these are foundations for a life of service to God,
family, and community.
The Fargo-Moorhead area is uniquely endowed with all the resources
needed for accomplishing this goal.
16

VI. External Environment
The external environment includes those factors influencing an
organization from outside, beyond the control of the organization. In some cases,
external environmental factors threaten an organization, forcing it to respond by
changing its strategy. The external environment also creates opportunities which
can be pursued.
A. Economic environment
Park Christian School serves the twin communities of Fargo, North Dakota,
and Moorhead, Minnesota, as well as the surrounding areas. Cass County, North
Dakota, and Clay County, Minnesota, comprise a Metropolitan Statistical Area
(MSA) containing 153,296 people (U.S. Census, 1990). These communities are a
regional economic center serving Northwestern Minnesota and most of North
Dakota. They are situated in the rich, fertile, Red River Valley of the North.
1. Economic base: Overall, North Dakota and Northwest Minnesota are
an agricultural-based economy which has a significant impact on employment and
economic activity in the Fargo-Moorhead community. However, a review of Table
1 reveals that services, retail and wholesale trade, and government comprise the
largest economic sectors. Specifically, the services which drive the two county
MSA are education and medical services (see Table 2). These types of employers
comprise the six largest and nine of the largest eleven employers. The area has
17

Table 1: Employment by economic sector in Fargo-Moorhead
(June 1993)
Economic sector Fargo
employment
Moorhead
employment
Services 18,159 3,255
Retail and wholesale trade 16,764 3,701
Government 6,993 2,764
Manufacturing 5,190 1,528
Finance, insurance, and real estate 4,281 361
Transportation, utilities, and
communications
3,484 216
Unemployment rate 2.7% 4.8%
Source: Job Service of North Dakota, Labor Market Advisor (June 1993).
Let's Get to the Point, Moorhead Economic Development Authority.
18

Table 2: Major employers in Fargo-Moorhead
Name of organization Employees
North Dakota State University 3,500
MeritCare Hospital 1,580
MeritCare Medical Group 1,300
Fargo Public Schools 1,018
Blue Cross Blue Shield of North Dakota 1,015
Dakota Hospital 811
Shooting Star Casino 810
Moorhead School District 740
Northern Improvement Company 700
VA Medical and Regional Office Center 670
Dakota Clinic, Ltd 630
Moorhead State University 615
Great Plains Software, Inc. 600
Heartland Medical Center 598
City of Fargo 494
American Crystal Sugar Company 450
Concordia College 450
Air National Guard 434
U S West Communications 415
U.S. Post Office 400
Metropolitan Federal Bank, FSB 381
Norwest Bank ND, N.A. Fargo 376
U. S. Postal Service 373
Border States Electric Supply 340
The Forum 300
Eventide Lutheran home 300
Federal Beef 250
Commerce, and Let's Get to the Point, Moorhead Economic Development
Authority, 1993.
19

four hospital/clinic facilities and four higher education institutions. Other major
types of businesses providing service throughout the region include financial
services, banking, and legal. And wholesale distribution of a wide variety of goods
occurs from warehouses located in Fargo.
In comparative terms, in 1990, the service sector generated 31.2 percent of
the jobs, compared to 27.7 percent nationally. However, 5.9 percent of jobs were
in manufacturing, compared to 14.2 nationwide. This suggests the community has
many middle and upper-middle class people who want a quality education for
their children.
The labor force of the MSA is 91,430. Its unemployment rate of 3.4% is
about half of the national average (see Table 1). The relatively low
unemployment rate is an advantage for Park Christian School because of the
family income implications.
2. MSA income: Incomes in Fargo-Moorhead tend to be relatively low,
while the cost of living is relatively high for the region. Table 3 compares this
community to"cousin"
communities in the region. Table 3 reveals that average
incomes in Fargo-Moorhead are about average compared to the other six
communities. However, hourly wages in manufacturing are the second lowest,
suggesting that the community contains two groups of families: a relatively
sizeable number of higher income individuals in the medical and educational
occupations, along with a sizeable number of lower income people in other
20

Table 3: Income and cost of living in Fargc
cities
)-Moorhead and comparable
Community Per capita
income
Cost of livingas percentage
of US
Manufacturingearnings
(hourly)
Fargo-Moorhead $15,935 102.8 9.44
St. Cloud $14,153 95.3 10.94
Duluth-Superior $15,819 12.09
Sioux Falls $18,037 95.1 9.15
Lincoln $17,918 89.6 12.10
Dubuque $15,730 99.6 12.62
Ceder Rapids $18,202 99.2 15.67
U.S. average $18,714 100
Seven-city average 11.72
Source: Patrick Springer, The Forum, March 6, 1994
21

occupations. Combining these factors suggests that Park must watch tuition rates
to avoid pricing itself out of the reach of some families.
Further, 47 percent of the households have incomes of less than $25,000
(see Table 4). While the amount of sacrifice a family is able or willing to make to
send their children to private school varies substantially, incomes lower than
$25,000 will require substantial sacrifice. This has implications for both
scholarships and tuition levels.
While regional figures can be misleading when applied locally, they can
provide insight. Rural Minnesota, including Moorhead, has a poorer economy
relative to the seven county Minneapolis-St. Paul MSA. Fargo has a better
economy than the rest of North Dakota. Given these limitations, the data in
Table 5 reveals that North Dakota compares unfavorably with national statistics,
as it has low income levels and high poverty rates. Minnesota compares favorably
with national means, as Minnesota's average income exceeds national averages
and it is below average for poverty rate. However, has fewer families with
incomes exceeding $75,000.
Between 1980, and 1990, Cass County lost ground in comparative family
income with the rest of the nation. Local incomes grew, but slower than other
regions. In the Cass-Clay MSA, real growth in income was 9.3 percent during the
1980's, while the population grew 11.5 percent. The number of people living in
poverty in the MSA increased 50 percent. The number of AFDC families grew 56
22

Table 4: Household income in 1989 for Fargo-Moorhead
Metropolitan Statistical Area
Income level Percent of households Number of people
Less than $10,000 16.9 24,964
$10,000 14,999 10.7 15,797
$15,000 24,999 19.5 28,728
$25,000 34,999 17.7 26,020
$35,000 49,999 18.3 26,896
$50,000 or more 16.9 24,933
Source: U.S. Census 1990
Table 5: Income and poverty status in 1989 by state
Region Median familyincome
Percent at $75,000
or more
Percent below
poverty
North Dakota $28,707 3.5 14.4
Minnesota $36,916 8.1 10.2
United States $35,225 9.5 13.1
Source: U.S. Census 1990
23

percent in Cass and 37 percent in Clay County. And the number receiving food
stamps increased 76 percent in Cass and 42 percent in Clay County. In 1980, 27.1
percent of the families had incomes of $15,860 or less (in 1990 dollars). This
number had swelled to 29.3 percent in 1990. The greatest decrease occurred in
the middle income, where 44.5 percent of the families had incomes between
$15,861 and $39,653 in 1980, compared to 41.1 percent in 1990. (U.S. Census)
3. Economic outlook: In general, the local economy is expected to
continue to grow at a steady two to four percent rate. Because of the relatively
high service and retail/wholesale combined with the relatively low manufacturing
base, the local economyis impacted more by the agricultural economy than the
national economy, but as the economy diversifies, faster growth is possible.
Agricultural processors such as Crystal Sugar, Federal Beef, and Anheuser-Bush,
and farm equipment manufacturing such as Case-IH and Concord continue to
provide jobs. And the growth of firms such as Great Plains Software has created
diversification into the high technologies industries.
B. Government and regulation environment
Government vouchers are presently receiving significant discussion. While
there is significant opposition to having vouchers available for both private and
public schools, it appears that this could occur. The existing performance of
public schools suggest that the public may become accepting of using public
money for private schools.
24

In California, voters defeated Proposition 174 in the 1992 election. This
amendment would have given $2,600.00 vouchers to all students, allowing them
choice between public and private schools. Similar laws were also defeated in
Oregon and Washington. It is thought that the bill will be reintroduced by Gary
S. Becher.
New guidelines are impacting implementation of Title VII of Civil Rights
Act of 1964. These guidelines being proposed cover harassment based on race,
color, religion, gender, national origin, age, or disabilities. These guidelines could
affect hiring in parochial schools.
Federal Bill HR6 limits subjects taught, and proposes that teacher be
licensed with a major in subject areas taught. While initially, Christian schools
and home schools are not affected, administrative decisions could significantly
alter this policy in the future.
A modification to the G.I. Bill proposes that private schools be included as
alternatives for participants.
On February 8, 1994, the Minnesota State Board of Education approved
and sent to the legislature a plan designed to look at desegregation. It states that
all schools with 30 or more students of color will be required to develop plans to
increase the performance level of said students. Moorhead has an increasing
number of students of color. Under the rules, increases in state aid will go to
develop plans and education diversity rule will be part of the plans. Every district
in State of Minnesota will be required to develop plans to incorporate into the
25

curriculum material that stresses contributions of men/women of all races,
cultures, and abilities.
Further, the State Board of Education is proposing that magnet schools,
which will specialize in one area, be created. Children/families would be able to
choose which to attend.
Goals 2000, sponsored by the Clinton administration, will promote
management-
taking decisions, giving power to federal office and away from state
and local agencies.
Parental Rights legislation has been sponsored by Senator Charles Grassley
(Iowa).
The US Senate approved an amendment denying federal funds to any state
agencies or public schools that ban voluntary student prayer.
Public Finance Quarterly, July, 1992, states that policies that reduce choice
among public school districts within metro areas result in greater secular private
school enrollment. It also reported that limitations on revenue increases in local
taxing districts are likely to increase private school enrollments.
In Kansas City, federal judges ordered schools to be equal and accessible in
1986. The result was an experiment using $1.2 billion to up-grade inner city
schools. The specific mandates were class sizes of no more than 25, new facilities
and theme schools, desegregation including buses and taxis, and increased teacher
salaries. The end results, based upon testing in 1993, showed student
26

achievements still below national average. The consensus was that the emphasis
was put on environment rather than teaching.
School consolidation has been mandated by law in Minnesota. Thus, in the
future, schools will be bigger, and many students will travel further.
A June 18, 1993, court decision in Zorbrest vs. Catalina Foothills School
District found that public schools must treat disabled children wishing to attend
Christian schools exactly the same as they treat children wishing to attend other
private secular schools. There can be no discrimination allowed based on the
religious character of the school.
C. Technological environment
Technology is already reshaping education. Before children enter the
formal school system, new technology is offering them more opportunities than
ever to learn at home. With interactive software designed to stimulate their
natural curiosity, preschoolers quickly learn the alphabet, and to identify words
with pictures. As children progress at their own rate, programs that teach
reading, writing, art, math, and reasoning skills are available. Other programs
offer the opportunity to develop choice-making skills that deal with the social,
economic and political issues found in real life. Dealing with the consequences of
those choices, plus added random negative events, add up to a touch of reality.
Replacing the old home bookcase full of encyclopedias, dictionary,
thesaurus, and an atlas will be CD Rom disks, alive with animation and sound.
27

During the next ten years, technology will transform the American
classroom. They will more closely resemble large office areas where desks sport
computer equipment for each student, replacing the lab down the hall. Schools
will become more custodial. "Parents will want to choose schools whose values
match theirown,"
says The Economist magazine. Their concern will be for the
total well-being of their child.
Quiet rooms, where teachers once controlled the drill and practice
exercises, will be replaced with exciting interactive learning. Teachers will become
directors of learning who will incorporate interactive video teaching, networking,
CD Rom and multimedia PC's. Knowledge on any subject will be available at our
fingertips from authorities on the subject. Virtual reality technology will allow
students seeking to learn a foreign language to be placed in the midst of the
culture where the language would be spoken with the correct accent.
Many education experts see the interactive multimedia software with
graphics, sound and video as a key technology to revamp American education
because it attracts and holds the interest of kids while teaching them. Interactive
software has been found to be able to speed learning 30-50 percent over
conventional methods. Even critics agree that the interactivity stimulates learning
and will play an important role in the classroom.
Individualized instruction is a major bonus of this technology. It can teach
anyone, anything, at any time they desire to pursue it, allowing those with a short
attention span better opportunities to learn when they are able. It can more
28

economically provide individual instruction to the gifted, remedial, and average
student that will allow them to work to their potential.
By identifying thestudents'
level of competence at the beginning of
programs, the appropriate level of material can be introduced to best stimulate
the learning for that individual. One computer company has found that remedial
education is the most available market for interactive learning systems at this
point. Government programs fund these projects, allowing for the cost of the
equipment needed. It will be slower coming to the whole classroom because of
the cost.
Because students learn differently, it makes sense to offer ways to make
the process less frustrating. In addition to verbal learning styles, many children
learn more visually or auditorially, or both. For those children, multimedia
education will provide a richer learning environment. Computers can help
children be empowered to be more responsible for their own learning.
But to be successful, the computers and software must be incorporated into
the classroom curriculum. Some of the problems associated with incorporation
include the cost of the equipment, resistance from established education, and
redesigning the basic educational system.
A former chairman of Josten's Learning predicts that the ability to have a
direct home-school connection, with interactive programming that is attractive to
kids, will make a profound difference in American education.
29

The information superhighway will pave the way for making interactive
instructional programming available to all schools. Local colleges have already
assigned task forces to look into it.
Now under consideration in Washington, D.C. is a regulation requiring
cable TV and local phone companies to wire public schools with high speed
communication lines and provide universal interactive TV service to families that
can't afford cable hook-up. This would finally equalize opportunities for poor
children to receive a quality education. Small schools can offer subjects through
interactive TV that are presently prohibited because of costs or lack of qualified
instructors. Private schools, like Park Christian School, may have to pay for
access to the multimedia system. The information superhighway could create a
huge demand for interactive education!
SENDIT, a telecommunication network available in North Dakota is
presently utilized by 89% of the North Dakota schools. This is a cost-effective
method to bring a wide variety of resources into all schools, connecting them to
educators worldwide. As more rural schools are forced to consolidate, it will be
more valuable.
D. Social, cultural, and demographic trends
1. Social cultural factors: Further insight about the local community
can be gained from the high school graduation rate and test scores in Moorhead.
Moorhead High School graduation rate is 97.3 percent, and 70 percent continue
on to college. And the Moorhead ACT average test score is 21. This is greater
30

than the Minnesota average of 19.7. And Minnesota ranks fourth in the nation
for test scores (Moorhead Public Schools Administrative Office). This again
suggests that parents in this area are very concerned with the quality education of
their children.
On-the-other-hand, research from the National Association of Independent
Schools reveals that 36 percent of all families sending their children to private
schools earn less than $50,000 per year. Since the average family income is well
below $50,000, this suggests that private schools are much more accessible to
wealthier families. A national survey completed in February, 1993, indicated that
more than a third of the parents polled would send their children to private
schools if they could afford it. And as families leave Park Christian School, the
number one reason they give is financial considerations. Therefore, the increase
in poverty has significant implications for Park. With relatively high tuition, the
overall reduction in standard of living may potentially price Park out of the reach
of more and more families over time.
While the number of students attending Minnesota non-public schools in
1992-93 increased by 978 students to 81,631 from the previous year, the long-term
trend is a downward trend in non-public school enrollment. In 1991-92, non
public enrollment approached its all time low, with 9.4 percent of the Minnesota
student population (Minnesota Department of Education, 1994). The bulk of the
decline is in Catholic-affiliated schools, while other or non-affiliated enrollment
has grown. In 1964-65, Catholic-affiliated schools accounted for 88.1 of non-
31

public enrollment, while in 1992-93, it comprised 62.2 percent. The other and
non-affiliated schools enrolled 30,862 students during the 1992-93 school year.
Home schooling has also increased within Minnesota (Minnesota
Department of Education, 1994). In 1987-88, 2,322 students were home schooled
compared to 6,149 in 1992-93. The threat to Park is that home schooling
represented 19.9 percent of the enrollment of other and non-affiliated schools. In
1987-88, home schooling represented only 7.7 percent. This rapid increase could
have long-term implications.
At the national level, an increase in students attending private schools was
also observed, and the trend is projected to continue. As of 1993, 11 percent of
the total school population is enrolled in private elementary and high schools.
Minnesota is lower, with 9.4 percent, reflecting both an opportunity to achieve
national market shares and much stronger competition from public schools in
Minnesota.
2. Demographic trends: The populations of Fargo-Moorhead, and the
surrounding areas are growing, and are projected to continue growing during the
next several decades (see Table 6). During the 1980's, the Cass-Clay MSA's
population grew 16.9 percent. Projections are for an additional growth of 6.7
percent during the 1990's. For a variety of reasons, Fargo is growing much faster
than Moorhead, and South Fargo is growing faster than North Fargo. The overall
growth suggests that the customer base available to Park is growing, and provides
significant opportunities for Park to grow. However, the direction of the growth
32

in South Fargo has significant implications because of Park's location in North
Moorhead, which is a distance from the population growth.
Table 6: Population of Fargo-Moorhead 1960 through 1990
Year Fargo population Moorhead population SMA population
1970 53,365 29,687 120,261
1980 61,383 29,998 137,594
1990 74,111 32,295 153,295
Source: U^. Census
Housing growth is also substantial in both communities. Moorhead added
142 homes in 1993, while Fargo added 600. These are supplemented by the 940
apartment units which were also added. 1994 promises to be another good year
for housing growth.
Further, the communities have a relatively young population with the
average age in Moorhead of 25.7, while the Minnesota average age was 32.5. In
Fargo, the average age was about 30. Further, 38 percent of the area's population
is between 18 and 35 years old. A major contributing influence is that the
community is home to over 23,000 students at local universities and colleges.
These provide contradictory impacts for Park. The young population suggests that
there are many young families. On-the-other-hand, the college students are not
really residents and are unlikely to utilize the services of Park Christian School.
While the population of the MSA is growing, the growth hides significant
outmigration. Between 1980 and 1990, Cass County had net outmigration in most
age categories. Clearly, the exception is the net inmigration of the late teens and
early 20's.
33

However, the community is also 95.5 percent white, which presents
challenges to Park. While a homogeneous population may reduce interpersonal
conflicts, it is extremely difficult to provide students an exposure to the culturally
diverse society into which they are likely to move someday.
3. Children at risk: As the consultants interviewed Park teachers, and
visited with other educators, an emerging trend in American education was
revealed. There is a significant increase in the number of "children atrisk."
There is neither agreement on the definition of the term, nor who to include as
"atrisk,"
but some generalities can be suggested. This group of students has been
called "specialneeds"
as well as "atrisk."
Further, they exhibit many different
problems including, but not limited to:
Attention deficit disorder
Attention deficit hyperactivity disorder
Behavior disorder
Slower development
Educational behavior disorder
Physically handicapped
Severely handicapped
*
Intellectually disadvantaged
*
Emotionally disadvantaged
*Birth defects
34

There appears to be general agreement that the number of students with
some type of difficulty is increasing at Park and in public schools. However, there
is substantial disagreement and uncertainty on the causes of the increase.
Clearly, part of the increase in the number of students with the problems is
the improvement in the capability to diagnose problems. However, this does not
explain the increase in classroom problems experienced by teachers over the past
decade.
Many believe that there also appears to be some culturally influenced
factors such as the increase in single parent homes, and more latch key kids.
35

VII. Market Characteristics
A. National market size and trends
Total enrollment in elementary schools peaked in 1970. Between 1970, and
1984, enrollment declined fifteen percent. Starting in 1985, enrollments started
increasing, and are projected to continue to increase into the next century.
Private elementary school enrollment also peaked in 1970, but it does not
follow the total enrollment pattern. Private enrollments fell until 1979, they
reversed in 1980. During the 1980's, and through 1992, enrollments fluctuated.
Future projections are for increased enrollment in private schools by the year
2000.
Since 1960, enrollments in Catholic elementary schools declined significantly,
non-Catholic church sponsored schools remained relatively constant, and
independent Christian schools increased significantly. Specific projections for
independent Christian schools are not compiled. However, in the 1965-66 school
year, 83,700 students enrolled in a category of schools called other church-related
schools. These include religious schools sponsored by other than Roman Catholic,
Lutheran, Seventh Day Adventist, Baptist, Jewish, Episcopalian, Methodist,
Presbyterian and Friends. By the 1978-79 school year, enrollment had grown to
281,200 students (National Center for Educational Statistics, 1981). By the
1985-86 school year, it reached 660,000 students (Dill, 1987).
36

Table 7: Total, public, and
in the US, 1975 to 2000
private enrollment in grades K-8
Year Total
enrollment
Public
enrollment
Private
enrollment
1975 34,187 30,487 3,700
1976 33,831 30,006 3,825
1977 33,133 29,336 3,797
1978 32,060 28,328 3,732
1979 31,631 27,931 3,700
1980 31,669 27,677 3,992
1981 31,370 27,270 4,100
1982 31,358 27,158 4,200
1983 31,294 26,979 4,315
1984 31,201 26,901 4,300
1985 31,225 27,030 4,195
1986 31,535 27,419 4,116
1987 32,162 27,930 4,232
1988 32,537 28,501 4,036
1989 33,309 29,147 4,162
1990 33,973 29,878 4,095
1991 34,544 30,470 4,074
1992 35,031 30,819 4,212
19931
35,727 31,447 4,280
19951
36,668 32,275 4,393
20001
39,129 34,441 4,688
1. Estimate
Source: Di
s
eest of Educatioilal Statistics, 199 3.
37

B. Local market size and trends
In addition to Park, the local elementary school environment consists of
the public schools, Catholic School System, Grace Lutheran (K-8), and Oak Grove
High School (grades 7 and 8). As the largest private school in the community,
Park's real competition comes from the public schools. Therefore, the market
potential for Park is derived from the market potential for the public schools.
As displayed in Table 8, actual enrollment in Moorhead public schools
increased 43 percent between 1985-86 and 1993-94. This has contributed to the
significant enrollment increase enjoyed by Park. However, during the next five
years, enrollment in Moorhead public schools is projected to increase only three
percent. Kindergarten (K), the leading indicator of school enrollment, exhibits
even more negative forecasts. Enrollment in grade K is projected to reach a
maximum in the 1994-95 school year, with a 2.6 percent increase over 1993-94.
After 1994-95, K enrollment is projected to drop by nearly 10 percent through the
1998-99 school year.
Fargo projections are displayed in Tables 9, 10, and 11. Fargo public
school enrollments have climbed steadily for the past decade and projections are
for continued growth through the 2000-01 school year. Between the 1985-86 and
1993-94 school years, Fargo schools grew 33 percent, and are expected to grow an
additional 14 percent through 2000-01. However, Fargo's school growth is not
balanced within the City. In 1985-86, the Southside schools enrolled 53 percent of
all Fargo students. During each year since, the Southside has enjoyed a one
38

percent larger market share, and by the 1993-94 school year, it had 62 percent.
Projections are for this trend to stabilize, but housing developments suggests that
the projections may not be correct. South Fargo growth affects North Fargo
busing at Park because the North Fargo route has to cover more of the South
Fargo route, lengthening the time children are on the bus. Within Fargo,
Kindergarten enrollment has fluctuated, although the overall trend is upward.
The projections to the year 2000 suggest growth of 23 percent in North Fargo,
and 28 percent in South Fargo.
Based upon national and local elementary school enrollment projections, and
based upon the fact that there are approximately 6,000 individuals who attended
Evangelical churches in the Fargo-Moorhead area (Vollmers, 1989), maintaining,
and possibly increasing, enrollment at Park Christian School appears probable.
39

ON
on o T-H roM"
on NT) ^o ON r~-* i
i i
NOon
r~- NO O ro rn (N in NOocj
ON
t)-
* Tf in on on in in in
COOn
T ( NO t-H m ro on T On COr-
i NO m ON C) CN CM CO in CO1
I
ON* tt "tf in on in on m on
TT
ON NO cm n-H rr co m CO in on<N
i TT OO rN CXI T 1 m co CM roNO
ONTT TT in m on m in m on
coNOOn CN CN ON ro n i r^) oo CM
* I
oON r-1 1 C 5 1 1 CN rn o CN
r-
ON
ON
^H
On
=*
in 0T) in m on m in on*
x;DO
mOn. ,_, ,_, ON 1 1 ,_, o CO ^t On
On
3 o o CN CN fN c~. O r~> rsl
oOh
CN"O m
<*
m on on m m inTf
X
ON
coOn o T 1 r-- On m * i ON IN
co On On o CN CO o CO CM in^C
coON
C 1
ON^r tT m m
T|-
ind-
m^t-
1 1
COOn ON NO r- ON CO in co o o
co
ro
^C
^ m ON ON o ON CO CO ON r- on
o
o
cj
>->
(J
ON
Tl"
Tf in * tt<*
* xr *
X, ,
on o
CJo
X On (N NO CN on in r- (N "+ Onra
pj
Ti
X3
o i ON cjn o On r~ On ^f ^t fN
00 i 1
ONTf ^r in
tJ-
tt rr ^r rhxt-
aa3
CO
X
n 1
On ro NO mH in oo ^H co ON r- ro
roON i 1 On Of) Of) ^r CN C 3 ori
o
o
l_l
CN* m ^r -Ti tt xr
^J-
^f roTf
sc o
On tt r- oo ro ,_, NO T 1 NO OCM
CO
CO
41 t-- no ^f NO co i 1 CV1 P- r-
c ON
COTi
-*
Tf xf TT rr CO co CO
s 0oOh On
on ro o r- CO o r_( 14 N * onNO
co
NO
CO
>
no NO m ci r t CO r NO-Tt- *-
GO
CO* *
-*
Ti Tf m CO CO ro1-
Oh r\
3c
34-i CO
in cn >n ro ON on co ON ONmONTt"
CO
E
<TD NO r~ cxi i i NO in ^f CO o<U
r-
no,
Tf ^r * Tr co CO CO CO ro
O
CJ
'SToh
D,
O
Conn m ro NO io *f (N CO NO CN
NO
l l
CO
CO
C
-C
CO
a
c
ON rN ON r- on, CO CO O On<jCO
TTt}-
co ro m CI C) CI ro u
cd J2
300
cdDm
a.NO
on Tf ^H co NO ^H r^ o CO ^HNO a
ro vn NT) ro m pi r^ (-1 Nf!i 1
CO
cd
C3 on vr ro m rO m CO CX| ro ro u
3 on r
<n
c
co CO
~a2
IS5 >
a-
^ T_H CN CO -* in NO r- ooO
iioOh
H c00
o
oo
Tfr-
oN-H
NO
oT 1
CNON
ON
CO
NOON
NO
ooON
ON
CN
O
in
NOON
l I
CO
ON
ocoON
CMON
On
o
cpON
ON
oNO
o1 1
mo> 1
oCO
ON
on
inON
r-
o^H
NO
On
m
ON
ON
NO
ON
CO
ONX
ON
ON
o7~*
oTJ-
o
r- m o CN CO CO CO31 NO GO in N^ 1 in NT) co
ONON On ON ON ON ON ON
GO
ooON
& r~-t~- O ^ O r- CO CN
On
nO
X
CO
On
o oON
ON<N
ONoON
on
OnTf
ON
r-
ONTT
CN
OnCN
O
ON ro On ct r~ cxi roXi C) r~-
CO Tf in CO ro
r-~On
ON oo On ON ON ON ONX
ON
ON
J2NOJOn
CN
on
o
ON ^r ON co ro r--^r c->
60 aj OC) f> co in T-H CN| t-H
3
O
o-)
OnON CO ON ON ON ON On ON
X
Oh
J2
ONon
On ro ON o CO CN CO nn ^ 3
CO CO Cl CN o^1-
t-H O o GOXI
XCO
J
OnON ON ON ON ON ON ON ON 00
COON
T-H
OhOh
C3
TfOn t-H ^r I-- ON CO CN \n NO
XOn
ooO i in CM Cl On NO NO in NOOh
>N ONoo ON On ON 00 co oo co r~-
"oo
J3
o
o
XICJ
00
COON r- CN NO t-H On NO - i on
3o
CO NC) Tt On r~ r- NT) r-> TT
3
INJ
OnON
co
ON ON CO CO co GO co "> r~-
3
a, ON TTT-H
co
in m o O r-on
rN
' <N NO Tf on NO CN roo00 On
ON00 OO CO oo r~ r~- r-
~~
Oh
On in o r~- in ^r r- (Nm-
ror-
r~^r
r- M-
^f r~- ro CM cxi
a
o_J
ONOn ON co oo co r- t~- r~- r-
r-~
u
eOOn CO
Tt"
oo ro o co ro NO onro
Co)
C)o ' o Tf in NH r- ro c-> NO
:t
co
1)
COON ON oo CO r~- r~- r~- r~- NO r^
0-H
c
-JOh On >
3 on 1 I NO m ro on r~- MO CTN ro rj-t * o CN ^H r- CO ON O on tT
X
-o
prt
34-( co
ON ON oo r~- r- NO r- NO NO Oh
-aCo) (-1
oCo)
COon ON CM oo ^f in NO On ON tT
o E1 1 NO m i i On <~> Tf CO O u
oOh oo
ON CO r- r- NO c~- NO NO NOo <
CX i
T3
c on CO O r~-on NO NO cxi NO CN
>
o
XI
ON CN CM on o Tf ro ro oo00
CJoo
cd
NO
cooo co r- NO t~- NO NO on on
nO
Ch-O
"ca3
NO
on ,_, o ON r- m r- ON NT) r-i Tf
3
OhTT ^f OO r- T-H CN p^ on o
<
on
cooo r-- VC NO NO NO on on NO
n
CJ000h
ON
Co)
2 >
6-
lIh
CO
w - CN CO Tf m NO r- OO
"ca
C
CJCJOh
3
o00
oTTj"

T 1
On r~ CN Tf ror- CO in in
CM
on
m
m
Tfm-
O On o CO ox ON CO0_)
ONO NO NO m NO NO on in NO
OC~l ro ON Tf NO \-H on t-- o o
m
go
TT
in
ro CO CJN co CN cjn NO CN COON
ONNO NO in on NO m m NO NO
ON
ON in t-H r-Tf on 1 1 NO NO
NO
CN
Tf
in
i CN CI CO C~) on NO ON t-H cnLXJ NO NO on NO in m on NO NO
COON
r- OOOn r- ro >n Tf T< ON r- T 1 CN
Onp-
CO
on
T 1 CN o NO on OO oo t-H CO
i iOn
NO NO NO in in m in NO NO
X00
3O On o CN in NO T 1 Tf ro CO m
Tf
CX4Oh T-H Tf NT) ro P- on on T H 1 1
X NO NO NO on in on in in NO NO+' CJN
ON
ooi
ooNOOn OO O NO on o o ON o o
m
CN
in
oo CN C M CO in r- on on O ON
ON
^H
inOn
NO NO in m on in in NO in
oOh on
onr- ON ON Tf NO r- CO p- in
T 1
T 1
on
c^ oo NO on m NO oo r- r-Tf
oo
Tt
ONin in in on in in m on in
Xooo
CJ Oh
TfOn o ro ro ro NO CN NO CN CO
co
NO
oo
TT
o O oo NO NO CN ro T 1 oo
X3
CO
>NON
in NO on on in >n m in TT
a,-_
oCO
u
o
C)On CO r- o NO NO on ^_, o ON
r-
r-
Tf
XCJ
00
CO T 1 NO in CNtt-
i i ON CO
cd
Cm
CJ
CMON
on NO on on on m in Ti Tf
."2
CNOn NO CN ro NO Tf o o ro Tf
GO
Tf
m
TT
X
3
in O in CO CN o NO ro OO
ONin NO in in in in Tt Tf CI
CO
C On CN T-H N-H ON CO m NO in roonON
ro
TT
*-" r- On Tf T 1 ON NO CN p- T 1
cCO
e_> m m in m Tf Tt Tf roTl-
"oOOn NO in r- ON Tf NO CN m o
Ti
roi i
Tf
C0cj
i CO o T-H P- Tf CN m o r-
eOX
coon NO in Tf Tf Tf CO Tf ro
HM
CO
IVOh
3
o
ON
CO Tf on 1 1 m o >n T-H CNNO
on
GO
ro
CJ
>
3in NO in ro T 1 in Of) m on
cdOh
CO on in Tf Tf Tf CO CO ro ro
-a
co
CO
3
CJ
co
coro m CN NO NO o ON o Tf CN
T i
CO
O
CO
Ea
<
in CO Tf o m r- ro Tt CO
OOh on
>n Tf Tf Tf CO CO ro ro ro
U,
a o
aC3
p-
on CN in CO r- Tf onr Tf
r-
aTT
co
or
CN m CN Ti r- CI CO t-H ON c)
CO
NO
onin Tf Tf ro ro ro CO CI CM 00
as CJ
Dh X
, , Xcd
3NO
CO CO CM r-~ ON T-H NO CN Ooop-
_)
0 i
NO ro Tf in t-H ro o C 1 CN
<on
coTf Tf ro ro CO ro CO CO CO
coo00
o CmCD_
CO T3 u C3 rj
Xcd >Oh (V)
fed T-H CN ro Tf in NO r- co nCJ
cd
Hi- 3
O00
' 1
o CO On CN r-~ NO NO ^H NO oouo
1 CO rH On (x- on ON r~~ Tf
oTf Tf ro ro CO CO CO CO CO
CO
ro
or-
Tf r~- CN CO o CN <) NONO
1 <N T 1 co r- On r- >n NO
OXTf Tf ro CO ro co ro CO CO
CO
On
On CN ON CN Tf CM , i r-- f- ONC )
i CN o oo CO r-. in no NO
coCN
Tf Tf ro CO co co ro ro COro
On
ro-GO
ON CN r- Tf Tf ON co NT) Tf f-i mCM
1 T-H o ON m in NO NO r~- CM
ONTf Tf CO CO CO CO ro ro CO
rO
XO0
3
Op--
ON ,_ NO co o oo ro r- Px T_l
CoX
i 1 1 t-H NO Tf NO NT) r~- CN roTf Tf CO CN CO rO ro ro ro
ON
oo
co
oo
NO
On Tf ON ON on on NO ro CO ONCO
ONi CN CO Tf in NO r-- ro ro CX|
PI
COt-H
OnTT CO C) CO CO ro ro ro ro
Oh
O
00l/NOn NO ON Tf CN on OJ On T-H rxl
CO
oCN
CO
t ON NO NO m i-~
ro ro ro Tf
o
XCJCO
Onro C) CI CO CO ro ro CO ro
CJ Oh
cdOn T 1 CN
N^ 1 Tf CO NO on Tf rocTf
oCO
X3
i on C) Tf r~-CO Tf CM Tf ON
>N Onro CN ro co ro ro CO CO CN
a.
o n
DO O
XCJ
00
On o o CM O on Tf m ^M NOCO
CO
cCO
cdi NO m CO Tf Tf ro m ,
C~
)
Cm Onro C) C) CO ro ro ro CO CO
CO
-o
CO
X
CNOn co ON CN o ^_, O o Tf T_(
in
NO ON ro CO CN on o c-i inoCO
0h
o ONCO CO ro CO CO CO CO CO CO
On ro ON NO NO CN NO ON c-iCXJ
Tf
oro
J_J O Tf C) CN m t-H o Tf
cCO
N_J
ONTf CO CO CO CO CO CO ro CO
E
oOOn CN ON ,_H Tf NO r~- T 1 l-H co
Onp-
CJo
cCO
r~ CO Tf CO CN o on , { CN Oh
ON
ooro CO CO CO CO CO CO CO CM
CMc
COOh )
3 On >
3Mm
a
on CO CN o CN O r~- T-H CO T 1NOOn
CN
_
Tf NO NON^ 1 CN Tf CN C~) On C3
GO
GOro CO CO CO CO ro CO CO CN
CVD
CO'-
O
COcoon Tf CO CM oo m r- ON in CN
on Eo i NO r~- ^H o Tf CN T 1 On r
'ON
CN
o
Oh
Oh
n
coCO Cl CN CO CO ro co CN CN <
cC3
r^
on co oo CN r~- On CN r- On ooOP-
c
XCJ
00-1, NO NO C 1 CO CN ON nj-1 coCO
cd
NO
ooCO ro ro ro CO ro CM CN CN
CXJ
Uh
Xcd
3NO
on CO r- r~- o NO NO CO Tf c-)NO'
3
0-p- o Tf CM CN ON r~~ on 00
< GOro CN ro CO CN CN CN CN CN
CX)u
DO
t-H
Co
Xcd
f-
T3 aj
2 >
o-
fed -1 CX) ro Tf in NO r- co
cd
OE-
CJCJOh
3
000

VIII. Competitive Product Offerings
Within Fargo-Moorhead, the public schools have the largest market share.
However, other private schools also serve the communities, including the Fargo
Catholic School System, St. Joseph Catholic School in Moorhead, and Grace
Lutheran in Fargo. In addition, Oak Grove Lutheran in Fargo is a High School
which also offers grades 7 and 8.
A. Market shares
Table 12 displays the market share for each school in Fargo-Moorhead for
the 1993-94 school year. Overall, Park's enrollment of 318 in one building is
larger than the enrollment in any other private school building, and it also
comprises 2.3 percent of the total Fargo-Moorhead enrollment. However, as a
system, the Fargo Catholic School System is the largest private school, and has 5.0
percent of the market. Clearly, the public schools dominate the market with
about 90.2 percent of the K-8 student population. An interesting aside is that
Grace has an enrollment of 139, but has 44 enrolled in their pre-Kindergarten.
B. Competitive prices
Among the private elementary schools in Fargo-Moorhead, Park's tuition
and fees are the highest. The data in Table 13 reveals the costs for sending one
child, a first grader, to the specified private school. In comparing the fees, most
other schools have a two-tier fee structure, with a substantially lower fee for
42

Table 12: Market share of Fargo-Moorhead schools based 1
enrollments
jpon 1993-94
School system Competitive grades
offered
Enrollment
in K-8
Market share of
Fargo-Moorhead
market
Grace Lutheran Pre-K-8 139 1.0
Fargo Catholic
School System
Holy Spirit K-5
Nativity K-5
St. Anthony 6-8
Total
170
281
247
698
5.0
St Joseph Catholic K-6 160 1.2
Park Christian K-8 318 2.3
Oak Grove 7-8 44 0.3
Fargo Public K-8 7,898 57.1
Moorhead Public K-8 4579 33.1
Total 13,836 100.0
Source: Administrative Offices of school specified
Table 13: Tuition costs for 1994-95 at private schools in Fargo-Moorhead
School system Registration, books,
and student fees.
Tuition for one child in grade 1
Grace Lutheran $100 $1,600 for non-members
$640 for members
Fargo Catholic
School System
$50 $1,696 for non-members
$1,025 for members
5 1/4% of gross familyincome is maximum
St Joseph
Catholic
$20
$16 student fee
$2,000 for non-member
$800 for member
Park Christian $60
$80 books
$2,082
Oak Grove $40 plus books
$25 student fee
$1,900 (grades 7 and 8)
Source: Administra tive Offices of specified school
43

church members. To illustrate, Grace gives members of Grace Lutheran Church a
60 percent reduction. The schools with tuition closest to Park are St. Joseph,
which charges $2,000 for non-members and Oak Grove which charges $1,900.
Compared to Fargo Catholic School System and Grace, Park is about $400 to
$500 above the price charged to non-members.
However, compared to tuition charged to church members, Park's fees are
about double the fees charged by the Catholic School System in Fargo and are
more than triple fees charged by Grace Lutheran. These schools have two
substantial price advantages:
They have much lower building costs because they have depreciated
buildings which were built directly by the churches, and some costs, such as
heat and lights, are probably provided in many cases.
They receive substantial subsidies from their congregation.
And lastly, Park also has the highest registration and book fee at $140.
C. Grade offerings of competitors
While the public schools are competitors of Park, they also are the
destination for the vast majority of Park graduates. Therefore, their grade
configuration has a substantial impact on Park's grade configuration. Historically,
Moorhead, West Fargo, and South Fargo used a middle school concept in which
grade nine was the first year of High School (see Tables 14 and 15). North Fargo
was the exception with its grade 7 through 9 Junior High school. For Park, this
meant that a grades K through 8 format worked extremely effectively because the
44

Park grade 8 graduate could enter high school with the graduates of the public
middle schools. This had significant social implications for the Park students
because they were on "equalfooting"
in establishing new social groups.
However, the new Junior High school structure in South Fargo has serious
implications for Park. Half of the students at Park will now be forced to move
from grade 8 at Park into grade 9 in a Junior High. This means they will transfer
into pre-existing social structures which will make their adjustments more difficult.
45

Table 14: Grade levels used in Fargo Public School systems
North Fargo South Fargo (1994 and beyond)
Elementary grades K-6 Elementary grades K-5
Junior High grades 7-9 Upper elementary grades 6-7
Junior High grades 8-9
Senior High grades 10-12 Senior High grades 10-12
Source: Fargo Public School Administrative Offices
Table 15: Grade levels used in Moorhead and West Fargo Public School
systems
Moorhead Public Schools West Fargo Public Schools
Elementary grades K-4 Elementary K-5
Upper elementary grades 5-6
Junior High grades 7-8 Middle school grades 6-8
High School grades 9-12 High School grades 9-12
Source: Moorhead and West Fargo Public Schools Administrative Offices
46

IX. Customer Profile
A. Target market
Currently, Park serves a diverse market as families from a wide variety of
churches drive as far as 60 miles one way for their children to attend the School.
But in spite of this diverse customer base, Park serves a very specific target
market: The Evangelical Christian community living in Moorhead, Minnesota, and
Fargo, and West Fargo, North Dakota, and with children in grades K through 8.
B. Usage by customers
As displayed in Table 16, during the past four years, enrollment at Park
has grown substantially from 204 students in the 1989-90 enrollment to 318 in
1993-94. Annual growth rates have been twenty, four, twenty, and three percent.
This rate of growth has resulted from an excellent product, effective marketing,
excellent retention, and a very favorable market.
When planning was last conducted, enrollment was 204, which was an
increase of one student during a six year period. The concerns were lack of
enrollment growth and excess capacity in the building. Now, the concern has
changed, and Park must manage enrollment and focus on balancing the School's
capacity in each grade level with the demand. Variations in demand create excess
capacity, or empty seats, in some grades, and waiting lists in others. Looking
back, Park has enjoyed two periods of substantial growth during 1982-83 through
1984-85, and 1990-91 through 1992-93. During the present school year,
47

enrollment increased about three percent. Early projections for the 1994-95
school year are for in excess of a ten percent increase.
There are a number of important factors contributing to the overall growth.
A review of Table 16 reveals that the 1986-87 Kindergarten class had 41 students,
which was the largest to that date. Since, there have been some years with
smaller classes, but there have been no"bad"
recruitment years.
In addition, retention has also improved significantly. At this time, five
classes have started grade K, and graduated from Park. As displayed in Table 17,
the retention rate has steadily climbed from about 40 percent to near 70 percent.
The impact on a class of forty is significant. Thirty percent higher retention
results in 12 more eighth graders. As the school matures, retention should remain
relatively high and potentially could increase.
In conclusion, the growth at Park has resulted from a wide variety of
factors. In looking to the future, it is essential to continue focusing on the needs
of the Park parent and student to insure that they get what they want for their
tuition dollars.
C. Characteristics of Park families
Based upon Park's enrollment in the 1993-94 Directory and Handbook, the
profile of families is identified in Table 18. Because of pricing discounts, the size
of the family has implications on the total revenue. The number of single parent
and blended families may not be completely accurate since the data was derived
from the directory.
48

Tf
ON en (N CJ r> o (N On o cnoo en
enTf Tf Tf en Tf en CN en CN
T-H
en +on
mOn oo en cn t> in oo r- oo CN
o o
CN
+CN
On
Tf Tf Tf en en <N C~l <N T-HT-H
en
CN
ON00 <N NO Tf Tf m o en T 1
On Tf
T-H
On
en en en en CN en rN T-H (NCN +
T 1
ON r- r- NO in in o ON o TfOn
Tf
<N
oCN
+oOn
cn en en <N en (N T 1 CN T-H
OON
(N CN in o en T 1 co inTf en
Tf
ON
OO
On
en en CN en CN (N Tl T-H00 o
tN +
ON CO oo O Tf in en co T-Hr~x oo
O
o
<N
^o1
CO) oo <N (N en CN CN i i <N N-H 1
On Vm CO
On cd
<D
;>x
_C oo
O O
ooCN o i i co o fx
ONON o
en CN
rx- en en en fN CN CN T 1 T-H
(N+
Vm_C
co
H
o
CN C--
ooi
oot-H On T-H Tf On in CN Tf
Tf
ON
o
(N
CN
ooNO
CO
Tf <N en CN <N T-H Cxi T-H i
On
i i
Oh
c2
NO
ooTf en en oo in r/x
oT-H
(Nen
+"o oo
en en en en " ' CN 11 T-H
CN
o
o
CO m
i i
+
c
.2
ooi
Tj"
en
en
m
en
m
en
oo1 1
ON
<N
Tf en
T 1
inT 1
T-H
T-H
en
o
(NH coCO
C
uTf
co r-- m in NO Tf CN CO T 1m
en
T-H
inT-H
Vmen
CO
en en 1 ' CN T 1 T 1 T 1 '""'
+
Vh
o2
4
C
en
oo
CN
co
Tf
en
CO m
CN
r- <Nt-H T 1
en oT 1
in
T-H
mT 1
Tf
+
zrj CN
OVm
C
OO1
T1
o
CN
ON enT-H
ONen
T 1r- CN
in m
en
oT-H
P-1
NO
oo
T-H
0h>
<d
~<D "3e nD
303
Vm><D
i4 rt CN en Tf m o r- ooH-H
o 5Vm Cd
ca O H <D -C
H OH U
<3X
Tf

Table 17: Retention percentage of Park Christian School
Year started
Kindergarten
Year graduated from
8th grade
Retention
percentage
81-82 89-90 40
82-83 90-89 41
83-84 91-92 57
84-85 92-93 36
85-86 93-94 68
Table 18: Profile of families sending children to Park Christian School
Demographic variable Number
Students at Park 319
Families at Park 205
Number of families with
one child
two children
three children
four children
107
84
12
2
Single parent or blended families 16
Children from single parent or blended families 20
50

D. Distribution of demand among churches
The 80-20 rule has guided marketers for many years. It is a rule of thumb
suggesting that a few key customers (20 percent) will purchase the bulk of any
organization's products (80 percent). Generally, these accounts provide the sales
(or for Park, the children) to sustain thebusiness'
overall operations of the
organization and to create a critical mass to generate overall economies of scale.
For Park Christian School, it is essential to have a base of churches which
support the School with strong and regular enrollment. To illustrate, word-of-
mouth is a critical factor in promoting the School, and parents will visit with
others in their church to gather information regarding perceptions of Park.On-
the-other-hand, Park does not want to be dependent on only a few churches.
Table 19 displays the 80-20 rule for Park Christian School. In general,
dependency on the largest customer, First Assembly of God, has declined about
ten percent during the past six years. But the decline has resulted from positive
reasons. Student numbers from First Assembly have increased during this period,
but the overall increase in students has grown even faster.
Further, students from the five churches with the largest enrollment at
Park have averaged around 60 percent during the past five years. These churches
include First Assembly, Bethel Evangelical Free, Salem Evangelical Free, Triumph
Lutheran Brethren, and Evangel Temple during 1988 to 1991-92, and believers
Fellowship during 1992-93 through 1993-94. Considering the community, five key
51

Table 19: Applications of 80-20 rule to customer base
School year Share of church
with most students
Share of five
churches with most
students
Percent of churches to
create 80 percent of
students
1988-89 32 68 36
1989-90 28 59 42
1990-91 29 57 41
1991-92 27 61 34
1992-93 22 60 33
1993-94 23 62 31
Table 20: Number of churches represented by Park Christian School students
Year Churches
represented
New churches Churches lost
1988-89 25
1989-90 31 8 2
1990-91 34 4 1
1991-92 38 10 6
1992-93 42 8 4
1993-94 39 2 5
52

accounts are a reasonable number. Perhaps, one concern is that the churches
comprisingthe five key accounts six years ago are not the same five churches
representing key accounts today. While not a major concern, the market share
from each church should be reviewed to establish the cause of the change. It may
be a lack of children of a certain age. But if there is a perceived problem, it
needs to be resolved. As the number of churches represented at Park increase,
the percent required to generate 80 percent of sales appears to be gradually
dropping. Overall, this distribution of sales is strong.
To provide for continued growth and avoid dependency on a few churches,
Park should be striving to expand the number of churches represented among the
student body. During the past six years, Park has expanded the number
represented from 25 to 39 (see Table 20). Based upon the community and
differences in theology, it will be difficult to expand much beyond this number of
church representation.
A concern is the churches no longer represented by students at Park.
During the six year period, 32 new churches are represented, while 18 have been
lost. Considering that a K-8 education takes nine years, this is substantial
turnover of churches. While Park keeps careful records of why families leave, it
will be insightful to examine the families which have chosen to attend Park and
then drop out after one year. Is it also possible that the large number of students
from some of the churches also conceals turnover which is too high?
53

Table 21 identifies the number of students from each church for a six year
period. One expects some changes in student numbers because of changing
demographic profiles of individual churches. However, the patterns of individual
churches create concern that there may be some minor problems within specific
congregations. To illustrate, Bethel has fewer students represented today than six
years ago, and enrollment declined by nearly a third in the past year. Is this the
result of the demographic profile of Bethel? On-the-other-hand, some churches
have shown substantial growth. Triumph Lutheran Brethren, Salem Evangelical,
Believers Fellowship, Brookdale Baptist, and Community Baptist are some of the
congregations which have shown substantial growth.
E. Geographic demand
Historically, the majority of Park students were from Moorhead, but in the
1993-94 school year, this was reversed as Fargo and West Fargo students
outnumbered Moorhead students for the first time (see Table 23). While
enrollment from Moorhead has continued to climb, enrollment from Fargo has
climbed faster. During the past eight years, Moorhead enrollment has increased
from 103 to 151. Fargo and West Fargo enrollment has grown from about 87 to
158. Within Fargo, North Fargo has increased nearly 180 percent.
A second critical issue is enrollment Park is capturing from supplemental
markets: Those communities outside of Fargo-Moorhead (see Table 24). In 1993-
94, 19 students were from rural Minnesota, rural North Dakota or West Fargo.
While they comprise six percent of the student population at Park, they are
54

Table 21: The church home of students attending Park Christian School
Church 1988-89 1989-90 1990-91 1991-92 1992-93 1993-94
# 1 % # j % # | % # | % # 1 % # %
First Assembly 64 32 52 28.4 57 29 69 27 67 22 71 23
Bethel Evangelical Free 29 15 22 12 17 8.6 22 8.7 34 11 24 7.9
Triumph Lutheran Brethren 16 8.1 7 3.83 9 4.6 20 7.9 28 9.1 40 13
Salem Evangelical Free 15 7.6 16 8.74 17 8.6 30 12 40 13 40 13
Evangel Temple 10 5.1 10 5.46 13 6.6 15 5.9 14 4.5 12 3.9
Word & Faith Fellowship 0 0 0 0 0 0 6 2.4 3 1 3 1
Moorhead Evangelical Free 7 3.5 8 4.37 10 5.1 11 4.3 10 3.2 11 3.6
Meadow Ridge Bible 5 2.5 5 2.73 5 2.5 3 1.2 5 1.6 5 1.6
Believers Fellowship->
1 7 3.83 9 4.6 12 4.7 16 5.2 15 4.9
Christian Fellowship Church -> 1 o 1.09 1 0.5 1 0.4 0 0 0 0
Knollbrook Covenant T1 -> 1.09 2 1 2 0.8 3 1 0 0
Red River Alliance 0 0 0 0 0 0 4 1.6 5 1.6 1 0.3
St Paul's Free Lutheran 2 1 4 2.19 4 2 3 1.2 0 0 2 0.7
Mission Bautista Buen 1 0.5 1 0.55 1 0.5 1 0.4 1 0.3 1 0.3
Brookdale Baptist 5 2.5 5 2.73 6 3 4 1.6 8 2.6 10 3.3
Grace Baptist 4 0 2 1.09 -> 1 3 1.2 3 1 1 0.3
Temple Baptist 4 1 3 1.64 3 1.5 4 1.6 4 1.3 1 0.3
Community Baptist 3 1.5 3 1.64 i 1 5 ->7 2.3 7 2.3
Olivet Lutheran 6 3 3 1.64 3 1.5 2 0.8 2 0.6 4 1.3
Trinity Lutheran 3 1.5 i 1.09 2 1 2 0.8 4 1.3 3 1
Bethlehem Lutheran 2 1 i 1.09 2 1 -> 0.8 1 0.3 0 0
Calvary United Methodist 2 1 1 0.55 1 0.5 1 0.4 1 0.3 1 0.3
First Lutheran Church 1 0.5 0 0 0 0 0 0 i 0.6 0 0
First United Methodist 1 0.5 3 1.64 4 2 0 0 4 1.3 4 1.3
Liberty Lutheran Brethren 0 0 1 0.55 2 1 3 1.2 4 1.3 3 1
Red River Reformed 0 0 0 0 0 0 3 1.2 4 1.3 5 1.6
Marion Methodist 0 0 0 0 0 0 1 0.4 1 0.3 1 0.3
Valley Christian 0 0 1 0.55 1 0.5 2 0.8 4 1.3 4 1.3
Calvary Baptist 0 0 4 2.19 3 1.5 2 0.8 3 1 n0.7
Bethesda Lutheran 0 0 0 0 1 0.5 0 0 1 0.3 2 0.7
Christ the King Lutheran 0 0 2 1.09 3 1.5 1 0.4 1 0.3 0 0
Seventh Day Adventist 0 0 0 0 0 0 3 1.2 4 1.3 5 1.6
Edgewood United Methodist 0 0 0 0 0 0 1 0.4 4 1.3 2 0.7
Church of Christ 0 0 3 1.64 4 2n
0.8 2 0.6 2 0.7
Fargo Free Methodist 0 0 0 0 0 0 i 0.4 2 0.6 0 0
Good Shepherd Lutheran 0 0 0 0 0 0 3 1.2 4 1.3 1 0.3
Shiloh Evangelical Free 0 0 0 0 3 1.5 2 0.8 -> 0.6 4 1.3
Koinonia Fellowship 0 0 0 0 0 0 3 1.2 3 1 3 1
Pontoppidan Lutheran 0 0 1 0.55 1 0.5 1 0.4 1 0.3 1 0.3
Metropolitan Baptist 0 0 0 0 0 0 0 0 1 0.3 3 1
Maranatha Free Lutheran 0 0 0 0 0 0 1 0.4 0 0 0 0
Barnesville Lutheran Brethren 0 0 0 0 0 0 2 0.8 0 0 0 0
Hope Lutheran: Rustad 0 0 0 0 0 0 0 0 1 0.3 ->0.7
First Presbyterian 1 0.5 1 0.55 0 0 0 0 3 1 ->0.7
Hope Lutheran 0 0 0 0 0 0 0 0 1 0.3 4 1
55

Plymouth Congregational 0 0 0 0 0 0 0 0 0 0 1 0
St. Peter's Lutheran: Audubon 0 0 0 0 0 0 0 0 1 0.3 1 0
Faith, Hope, & Love Church 9 4.5 3 1.64 3 1.5 0 0 0 0 0 0
Wolverton Evangelical Free 2 1 0 0 0 0 0 0 0 0 0 0
Cornerstone Baptist 0 0 4 2.19 1 0.5 0 0 0 0 0 0
Forward Foundation Ministries 0 0 3 1.64 3 1.5 0 0 0 0 0 0
Hosanna Assembly of God 0 0 0 0 1 0.5 0 0 0 0 0 0
Sure Foundation 0 0 0 0 1 0.5 0 0 0 0 0 0
Totals 198 183 197 253 309 304
Table 22: Enrollment at Park Christian School in 1990-91 and 1993-94 and factors
explaining increase
Enrollment factor Moorhead
students
North Fargo
students
South Fargo
students
Total
1990-91 Park enrollment 119 25 74
Enrollment increase from
population increase
9 0 8 17
Enrollment increase from market
share increase
23 31 11 65
1993-94 Park enrollment 151 56 93
56

from too many locations to analyze market share. Further, in most cases, very
dedicated parents drive their children daily up to 60 miles one way to and from
school. Therefore, only the market share in Fargo-Moorhead will be reviewed.
In the 1986-87, and 1987-88 school years, Park Christian School captured
about 3.11 percent of the students enrolled in Moorhead Public Schools. During
the next three years, while the actual number of students increased at Park, its
market share in Moorhead declined by 0.24 percent (to an average of 2.87
percent) which was equal to about ten students per year. Fortunately, during the
1991-92 to 1993-93 period, Park's market share trend has reversed, and in 1993-
94, it achieved a 3.38 percent market share. The difference between a 2.88 and
3.38 percent market share is 23 more students enrolled at Park!
Although North Fargo is relatively close to Park, market share has always
been substantially lower than either South Fargo or Moorhead. During the five
year period ending with the 1990-91 school year, market share averaged eight-
tenths of one percent. However, during the past three years, market penetration
has more than doubled and reached 1.84 percent for the 1993-94 school year.
Market share in South Fargo also has grown, but not as fast as in the other areas.
The impact on Park is displayed in Table 22. About 80 percent of the
enrollment increase at Park has resulted from increases in market share, and the
increase in student populations explain about 20 percent of the increase. As a
result, enrollment declines in Moorhead will not have a significant impact, if
market share can be maintained.
57

ro
Oas Tf m r- r- CO
sn CN rrs oo
en CI cn CN _ CN
0m Tf _ O __, oc Tf i>
L_ lO m> SO t* Tf Tf r-- r-
ro n.
U
_C
o
zu
a Er> r- MD
as CC Osm un
Oh 3
2
CJ n o OO SO Tf o r- so
OS o r- r~i COs
0Dm.
en oi m cn CN CN rN
ro
Uh
3
Con CJ
-O
E
z
m -f en Tf CO in Tfr^ r- in Tf >n in
so SO r- o CN CO as cn
r- SO cn 1-H CN en o
oCl-
ro
s Z oU
Ein Tf so
in IT, m rN<V3
c Z<u
-o3
w
O,
c c
ro
8oen
CD
O
a,
SO
CD
SO .
c
?
&0O u
CJ
O F CN IV~, in
>!
jO
Z
oo
o
on
c
cCJ m m o -f rn Tf o SO
. r^ SO <n fN Tf r- Tf CN
un-
Tf i/ , in m m W1 in
U arou
a.
j*
ro-C
o
_,o
ro > i_
XI ,-H J-i m as -- 30 as rn
sh l/"i Tf m zs> -J o o
0 Z
c 1
en n o On n r-
i- Os as as as as =0 =o 30
CJm N -a 7s X) -- o>
> On Ts T\ "TS X> 30 30
as T\ Ts as as on as
H 1 _r
cu_
o
= C M JJCO 0 r- r?\ 0
\r. SO
5-sOh n M
M"
OJ
Dh
Seo
E o ?
O ^JtL,
m Tf f~T) Tf on m,
= Shas c~~ r~~ u-i Tf n m
U Oh 3
00,2
HH
""
i3 [2-2
8 x: c^
<n Tf VIr-
Tf OS en in
C D OU O
in rn 00
Tf Tf Tf Tf T m en en
OO OO -=
-i .ao-
CHM
<u o
""era".o
gn. E Tf Qs as
CN 00 CN 0
C o_c
-TT
A-a
O Ct. W
T7-
CJ
co ro *h
a.
^ P>oS-^
so CN SO in, Tf sn
f SfIT, m CN CN CN CN CN
U Ol, 0
P -z
-j
o00
o-s 0 M0. 0/1 -
cro C ,n O
-5 U. -c
g j= c5:
in, Os rr\
m, Tf r- sn^
Coou 0 _^
00 z -
C 3 O C7\ as
m en C4 CN CN CN
t_ ni .ECL,
o
Z
ro ra
-C
oo E S2c
= c x: E
c H 0 E
m > =0 13 m CN _
en en en ri
OO
CN
as
en en
c
o
u US c
Dh
OJ
CJ
4JU ^
TH
E2
0-*
00 _.>
-^1 a, --
h
"o
en O 0 0 c:
oJZ
->
M
CJ
ro
u 2^ii
7i 0 u
2 0 00
N n sO n
un N 50
5 J -J.
^ a,
SO -O
u,
ro
0-
Tf m en rn m
Tf
CJ i_ Tf rn rN ~i
JD as as CO CC CO
(- > rn r^ rs Os on
as X) 00 CO 00
co
10

F. Attributes and benefits demanded
During the 1990 planning process, two surveys determined benefits parents
sought in their child's education. One surveyed Park parents and the other
surveyed non-Park parents. Non-Park parents were (1) families attending the five
main churches serving Park, (2) that had K through 8 children, (3) in public
schools. The results revealed a significant difference of perception between
parents who sent their children to Park, and those who used public schools.
The most important benefit to parents sending their child to Park Christian
School was the Bible emphasis. The next most important benefit was cooperation
between home, school, and church. The next most frequently mentioned benefits
were Christian environment, Christian teachers, and a well-rounded education.
Other benefits included size, and quality and results (test scores) of education. In
ranking of educational components by Park parents, the Christian components
emerged as the most important, while quality ranked seventh (see Table 25).
On-the-other-hand, non-Park parents surveyed said they sent their child to
public schools because of the high cost of Park tuition. Other issues included
quality of education, convenience, and existing peer groups. Those who were not
attending Park were much more concerned with quality education for their child
and did not perceive Park to be offering quality. It is likely that since this data
was generated, attitudes of non-Park parents towards quality at Park have
changed. In ranking of educational components by non-Park parents, quality
again ranked as the most important by far (see Table 26).
59

Table 25: Ranking of educational components by Park parents.
Educational component Mean
Christian teachers 4.96
Teaching of Christian values 4.96
Prayers of teachers 4.89
Opportunity to pray 4.86
Christian environment 4.83
Loving, caring environment 4.83
Quality education 4.79
Small classes 4.41
Chapel 3.93
Avoid public school problems 3.61
Music programs 3.52
After school sports 3.31
Art programs 3.30
Scale: 5 very important and 1 very unimportant
Table 26: Ranking of educational components by non-Park parents.
Educational component Mean
Quality education 4.98
Teaching of values 4.85
Caring environment 4.08
Athletics program 3.90
Small classes 3.85
Music program 3.77
Art program 3.59
After school sports 3.51
Avoid discipline problems 3.40
60

G. Perceptions of Park
Park parents were asked their perceptions in both 1989, and 1993. Overall,
interviews with Park parents reveals that Park Christian School is perceived to
offer a high quality education within a Christian environment. The continuing
high test scores convey a message of quality and the ongoing marketing efforts
have reinforced the quality image.
A comparison of the 1989 and 1993 data reveals that every category except
one received improved evaluation. The exception was the special school programs
which declined two-tenths of one point. Significant improvements were reported
in Parent-Teacher Fellowship, student appearance, chapel services, and School
atmosphere. And the key issues, such as academic programs and love of teachers,
continued to rank high.
Parents also believe the physical facility is attractive and projects a positive
image of Park. Additional details regarding opinions regarding specific attributes
of both parents whose children attend Park and parents whose children attend
public schools are displayed in Tables 27 and 28.
One need seen by some associated with Park is the expansion of Park into
higher grades starting with grade 9. Eventually, their goal is an entire a high
school. The interviews did not disclose a percentage of people wanting a ninth
grade but it is important to point out that not everyone wants it. Further, the
level of intensity varied significantly.
61

Table 27: Ranking of Park's attributes by Park parents.
Attribute of Park Mean ranking 1993 Mean ranking 1989
Special school programs 4.4 4.61
Academic programs 4.6 4.51
General school staff personality 4.6 4.45
Love expressed by teachers 4.7 4.44
General school appearance 4.4 4.36
Spiritual influence 4.3 4.32
Curriculum materials 4.3 4.29
Opportunity for parental involvement 4.6 4.29
School atmosphere 4.6 4.25
Student discipline in general 4.3 4.21
Chapel services 4.5 4.17
Communications between school/home 4.3 4.10
Field trips 4.1 3.90
Student appearance (dress) 4.2 3.71
Peer influence 3.8 3.61
Parent-Teacher Fellowship 4.2 3.59
Scale: 5 excellent to 1 unsatisfactory
Table 28: Bi-polar comparison of attitudes of public school parents towards the quality
of education.
Question asked
Public schools have better than Park Christian
Attribute Mean
Better after school sports 2.29
Art programs 2.37
Better quality education 2.38
Better music program 2.43
Less discipline problems 3.31
Smaller classes 3.37
Teaching of values 3.42
More caring environment 3.43
Christian teachers 3.73
Scale: 1 means public schools are superior, 3 means public and private are equal,
and five means Park is superior
62

X. Internal Analysis
An internal analysis examines the characteristics of the organization
conducting the strategic planning. The purpose is to identify existing strategies as
well as identify strengths and weaknesses of the organization. This section of the
Strategic Plan evaluates the performance of Park Christian School.
A. Overall organization
1. Organization structure: The present organizational structure of
Park Christian School is displayed in Table 29. As illustrated, Park is directed by
the eight sponsoring churches and each appoints Board members to direct the
School. The twelve-member School Board meets monthly, and generally has
rather long meetings.
Generally, both public and private schools have elected or appointed
boards consisting of average citizens and the boards do not contain legal,
accounting, or other specialized expertise. This structure creates the necessity for
"strong"
administrators to provide assistance and direction in deliberations of the
board. Park also utilizes this model with a"strong"
School Administrator who is
instrumental in both guiding daily operations and in establishing long-term
strategies and goals. Overall, the Park Christian School Board tends to review the
strategies suggested by the School Administrator, rather than providing the lead in
developing and designing strategies.
63

The School Board has established a committee structure with four standing
committees of which two, Finance and Curriculum, appear to be working
effectively. The other two, Public Relations and Strategic Planning, are inactive
most of the time. According to the organizational chart, all committees report to
the Board, but in reality, the School Administrator appears to be responsible for
the effectiveness of each committee.
It appears the existing committees require extensive amounts of time. For
example, the Curriculum Committee requires large amounts of time from both
teachers and others who serve on it. Yet, the importance of curriculum, and the
sensitivity required to insure that there is a proper prospective in the curriculum
may suggest that efforts to reduce the time investment will prove futile. If this is
true, other solutions such as compensation time may be required.
Overall, the organization chart displayed in Table 29 provides a sensitive
interpretation of the School's organization, but it does not provide clear
responsibilities or lines of authority. To illustrate, both parents and teachers have
the same relationship with the School Administrator, while in reality, parents are
external customers and teachers are internal customers. Therefore, it is important
to revise the organizational chart to reveal specific operational lines of
responsibility and authority.
2. Mission and Vision Statement: Park's current Mission Statement,
Philosophy, and Vision Statement are displayed on page 15 of this plan. Each has
been reviewed recently and each appears to be succinct, directly to the point, and
64

Table 29: Current organizational structure of Park Christian School
SPONSORING CHURCHES
Bethel Evangelical Free Church
Evangel Temple Fargo First Assembly of God
Moorhead Evangelical-Free Church Salem Evangelical Free Church
PARK CHRISTIAN SCHOOL BOARD OF DIRECTORS
Committees
cFinance
Curriculum 3-
Public
Relations
Strategic
Planning
Ad hoc
Administrator
Development Office
IDevelopment Asst.
Admissions ~H
P T F
Administrative Assistant
[Teachers and Staff
Students
Parents
ZJ
Community
65

captures the spirit intended. The By-Laws of Park have another Mission
Statement which is much longer. The Board needs to consider bringing the two
Mission Statements into agreement. Further, the consultants believe that Park
needs to communicate these messages more effectively by posting them in a
visible spot and including them in publications.
3. Interviews with pastors: As the leaders of the sponsoring churches,
the senior pastors were each interviewed. An analysis of these interviews indicate
they perceive both Park Christian School's administration and education very
positively. However, they also believe Park cannot replace the family and church
role in creating Christian values, but rather should be a positive supplement.
Support from the pastors is apparent in numerous ways. All sponsoring
churches allow Park to market in their services, through presentations and
literature tables. It is also apparent in the financial support given directly or
indirectly to Park by the churches. And many of the pastors send their children
to Park.
The most active role of the sponsoring churches is participation in the
chapel services. Aside from chapel, pastors of the sponsoring churches maintain a
very low profile at Park. Because of the theological diversity among the
sponsoring churches, their low profile has served to prevent conflicts within the
interdenominational setting.
4. School Board: The School Board currently consists of twelve
members serving three-yearstaggered terms, with four terms expiring each year.
66

Board members are appointed by the eight sponsoring churches and Board
positions are allocated as follows:
Two members: One member:
First Assembly Evangel Temple
Triumph Lutheran Brethren Moorhead Evangelical Free
Bethel Evangelical Free Metropolitan Baptist
Salem Evangelical Free Believer Fellowship
The members are generally appointed because of their interest in Park, and
in most cases, they are parents of current students. Because Board members are
appointed by the sponsoring churches, Park has little influence in their selection.
In spite of this selection process, Park has generally been blessed with a strong
Board. As an operating body, the Board tends to be a"working"
Board and
approaches a"committee"
structure. This means that the Board focuses on
operational issues rather than on strategy or planning. As a result, the Board
meets monthly, with a relatively long agenda, covering day-to-day decisions which
result in long meetings.
This type of board is in contrast to an advisory board, which tends to focus
on the broader and longer-term aspects. Generally, advisory boards have fewer,
and shorter meetings. And they tend to ignore daily operating issues unless a
crisis has arisen. Rather, they focus on strategic planning and providing direction
to the organization, and to the administrator. They set policies and directions
which shape the budget, the mission, staffing, and the vision of an organization.
67
During the interview process, the Board members identified several critical
weaknesses from the existing Board's operations.
There is no training for new Board members and each spends the first year
of their term trying to figure out their role and tasks.
Some Board members, but not all, feel the Board is too soft and needs
someone to stir discussion of issues. Members have a tendency to come ill-
prepared and do not participate. This problem is compounded when the
agenda is not distributed soon enough to provide time to contemplate the
issues.
About half of the Board members feel the Board accepts the expertise of
the Finance Committee without adequate consideration. Several suggested
the Board acquiesces with inadequate reflection to the Finance Committee
or Administrator.
Current Board members see recruitment as very informal, and they do not
see adequate effort to identify and recruit needed expertise. However,
Board members have substantial expertise to provide in recruitment.
The consultants believe that specialized needs such as legal, financial,
human resource management, or marketing may or may not be represented
on the Board at a specific time, and are never collectively present.
In addition, the operations of the current Board exhibits several other
characteristics which are far less significant to overall performance, but may still
require attention. These include the following:
68

While not a critical weakness, the size of the Board could be reviewed to
determine if a smaller or larger Board would be more effective. Other
school administrators from schools of a similar size suggested that a smaller
Board could be more effective.
Currently, the Board contains three teachers from public schools. The
interviews revealed this is working very effectively. However, school
administrators from other private schools expressed surprise. They
suggested that the expertise of teacher- board members would duplicate
the expertise of Park's teachers and Administrator.
5. Parent-Teacher Fellowship (PTF): To create interaction with
parents, Park has established the Parent-Teacher Fellowship. The Handbook
suggests that:
The Parent-Teacher Fellowship provides a framework in which both
parent and teacher, through a mutual understanding of the problems
involved in Christian education and of the needs of the child, may
work together for his best interest in developing intellectually,
spiritually, physically, and socially.
The Handbook continues by stating the purpose of the Parent-Teacher
Fellowship as follows:
The PTF will strive to involve parents in the ministry of Christian
education at Park Christian School, provide enriching programs,
facilitate a spirit of unity, and support fund-raising activities.
In analyzing the overall performance of the PTF, it serves a number of
functions for Park with varying degrees of success:
69

Twice a year, the PTF has a meeting with teachers and parents, butthe
turnout (and apparent interest) from parents is very low. Participation is
usually about 25 to 35 people, with teachers comprising the majority.
The PTF also organizes and sponsors two major events each year: a picnic
at the beginning of the year and a fun night during the winter. Both are
very well-attended and seem to be very popular.
In addition, the PTF sponsors a number of social events each year which
are relatively well-attended. To illustrate, during the current school year,
the PTF held five roller-skating nights.
Activities generated financial support for the School totaling between
$1,500 and $1,800 per year during the last two years.
The PTF is operated by four elected parents and a teacher representative.
However, as society has changed and more mothers are working outside the
home, there appears to be less willingness to serve on PTF committees.
In addition to their role in PTF, parents also have the opportunity to
volunteer service to Park. Generally, volunteers provide a lot of service to the
Kindergarten class but after that, participation drops off significantly. But again,
the social cultural changes are reducing the number of parents available to
volunteer.
B. Human resources
1. Teacher qualifications: Each classroom teacher at Park Christian
School is certified by the State of Minnesota and/or the State of North Dakota.
70

However, two Junior High subjects, Spanish and Bible, are taught by part-time,
adjunct faculty who have expertise, but are not certified. Both are pursuing
additional qualification. Overall, the quality of Park teachers appears to be
outstanding. Parents report that they are very pleased with their children's
progress academically, spiritually, and socially. Further, standardized academic
test results rank Park students extremely high nationally and regionally.
2. Evaluation of pay and benefits: Private educators have historically
received lower wages than public educators. At Park, this is also true. A
comparison of wages with local public and regional private schools reveals that
salaries are higher at every other school except Grand Forks Christian. The
greatest disparity is with Moorhead Schools, which pay starting salaries 75 percent
greater than Park. The North Dakota public schools paid starting salaries about
30 percent higher, while Minnesota schools paid 57 to 75 percent more. ACSI
average and median, and Shiloh all paid about nine percent more than Park.
Further, salaries at PCS tend to deteriorate slightly over time, based upon ten-
year salaries.
Increasing teacher salaries was a strategy identified in the last Strategic
Plan, with the goal of reaching 75% of the Cass and Clay County average. In
hindsight, this goal was vague because there were too many schools involved.
However, compared to Fargo Schools, Park gained one percent. But compared to
Moorhead Schools, Park lost eighteen percent. Overall, this goal has not been
achieved. Further, Park has no retirement plan.
71

Table 30: Salaries at Park Christian School compared to other regional schools
School
Starting salary base Ten year salary base
Salary Percent of Park Salary Percent of Park
Park $13,375 $18,457
Moorhead, MN $23,4743 175%
Fargo, ND $17,600 131% $24,816 134%
West Fargo, ND $17,000 127% $23,750 129%
Hawley, MN $21,047 157%
Kindred, ND $17,400 130% $24,186 131%
Grand Forks
Christian, ND
$11,500 86%
Bismarck
Shiloh, ND
$14,565 109% $19,954 108%
ACSI median $14,645 109%
ACSI average $14,453 108%
Table 31: Training provided for Park Christian School teachers 1991-1994
Year Training programs Program intensity Faculty involved
1993-94 1. Dr. Uecker 24 hours Everyone
2. August teacher workshop 12 hours Everyone
3. ACSI convention 12 hours 1/3 of teachers
4. Child abuse/neglect 1 hour Everyone
5. July Science workshop 10 hours Everyone
1992-93 1. Science workshop 80 hours 5th and 6th
2. Math workshop 80 hours 5th and 6th
3. August 12 hours Everyone
4. ACSI convention 12 hours 1/3 of teachers
3. January 22 teacher workshop 6 hours Everyone
4. February 12 teacher workshop 6 hours Everyone
5. MECC & muffins (computer) 4 hours 4th 8th
6. Social study curriculum training 6 hours 4th 8th
1991-92 1. Computer using MECC software Everyone
2. January 24 teacher workshop 6 hours Everyone
3. Dr. Uecker 7 hours Everyone
4. August 26 teacher workshop 12 hours Everyone
5. MECC & Muffins (computer) 10 hours Everyone
6. ACSI convention 12 hours 1/3 of teachers
72

3. Staff development and training: Teacher training and
development programs implemented during the past three years are displayed in
Table 31. Overall, the majority appear to focus on curriculum implementation or
computers.
4. Job descriptions: Job descriptions delegate authority, assign
responsibility, and create accountability. Their wording generally reveals the
philosophy of an organization and the use of job descriptions. To illustrate, job
descriptions reveal both empowerment and if the job description is used to blame
people or to encourage people.
At Park, job descriptions are too complex and detailed. While personnel
experts suggest that 10 or fewer tasks are generally appropriate for job
descriptions, the teacher's description details 37 specific tasks within five broad
categories, and the Administrator's description details 76 specific tasks. Overall,
there is excessive detail.
5. Employee turnover: Sixteen teachers left Park during the six year
1987-88 to 1992-93 period. This is an average of 2.67 per year. Of these, three
left because their husbands were transferred, five for maternity leave, two for
teaching jobs in public schools, one became a pastor, and one left teaching. The
other four left for a variety of reasons. Turnover is normal and expected within
any organization. Half of those leaving Park did so for family reasons. Overall, it
does not appear that turnover is excessive. Nor does turnover appear to be driven
primarily by environmental factors at Park.
73

C. Administrative processes
1. Administrative structure: As a private school, Park has an
administrative staff consisting of four individuals: (1) Both school and academic
administration are the direct responsibility of the School Administrator. (2)
Development and fundraising is a full-time position. (3) Admissions Counselor is
a part-time position currently filled by an individual who also teaches choir. And
(4) a full-time Administrative Assistant supports the School Administrator. The
development staffing for the current capital campaign has made this structure
more complex because short-term appointments have been used to bring large gift
fundraising expertise on board. Thus, development currently has additional
positions.
2. Office procedures: The Park administrative office has a support staff
consisting of four individuals including: (1) A part-time Secretary, 30 hours per
week, who works entirely in development. (2) A full-time Receptionist/Secretary.
And (3) a part-time, 220 days a year, Bookkeeper. Currently, the office area is
inadequate, and it is a credit to the support staff that they are able to function.
There is inadequate room and equipment, such as computers, and staff must wait
for shared computers to be free. These problems are compounded because three
of the four support staff work in an open reception area, and therefore, are
frequently interrupted by needs of parents or students. And since the sick room is
within the office area, sick children also tend to interrupt the normal office
74

efficiency, although it makes the office staff available to tend to the needs of the
child.
3. Administrator: Park Christian School has one key employee who
assumes the duel role of School Administrator and Principal. This individual is
regarded by teachers, Board members, pastors, and others as an outstanding
Administrator who has contributed significantly to the School's financial and
enrollment growth. However, there is also agreement that the current position
includes too many responsibilities for one person.
4. Management Style: Historically, education has used hierarchical
managerial styles. This evolved in part, from the authoritarian hierarchial
structure of the industrial revolution. But it also possibly emerged from the role
of both the church and Christian schools within the community. Because they
were often the highest educated people in the community, and they represented
the church, both clergy and headmasters were respected opinion leaders. The
hierarchical style was also used by business where it has driven a national business
economy which felt few competitive pressures. Further, economic demand
outstripped supply, enabling businesses to sell regardless of the quality or service.
However, in the late 1970's, a revolution hit American business. Economic
sector after economic sector was devastated by international competition,
especially the Japanese. Terms such as strategic planning, total quality control,
Demming, Juran Institutes, Philip Cosby, Cam Bam, Just in Time, worker team,
empowerment, ISO 9000, Malcomb Baldridge, benchmarking, etc., became part of
75

everyone's vocabulary as America's managers responded. And in the 1980's, a
book entitled Service America carried the revolution beyond manufacturing into
the service sector. Albrecht and Zemke (1985) suggested:
management practices will have to evolve from a manufacturing
orientation to a moment-of-truth orientation to meet the demand of
competition. We are at the beginning of an era that will see the
demise of the General Motors model of management, with its tool-
and-task orientation, and the evolution of a new motif that will
revolve around outcomes instead of activities.
Your employees are your first market; you have to sell them on the
service idea or they will never sell it to your customers. The way
people feel about themselves and their jobs will always affect their
interactions with customers.
Systems are often the enemies of service. Many of the problems of
poor or mediocre service originate in systems, procedures, policies,
rules and regulations, and organizational craziness. Too often, we
blame the frontline people...when the real problem is systems that
don't work or make sense.
Currently, the overall managerial style of the Park organization which starts
with the School Board suggests the following:
Parents and students are our customers and Park exists to serve them.
True. But, no company can continue delivering quality without
recognizing that employees are the frontline customer. Unless employees
are the primary customer, many management decisions designed to
improve quality and service will prove to be counter-productive. Therefore,
at Park, both parents and teachers are our customer.
Managers achieve much, but their accomplishments are limited by their
energy and ability. Generally, rather than increase the results of those they
76

supervise, they impede and limit. Leaders, on-the-other-hand, achieve
much greater results by capturing the energy of their followers. The 1990's
will see the continued demise, but not elimination, of the traditional
manager as leaders take over. Lao Tzu stated (Albrecht, 1992):
A leader is best when people barely know he exists.
Not so good when people obey and acclaim him,Worst when they despise him.
Fail to honor people,
They fail to honor you.
But of a good leader, who talks little,When his work is done, his aim fulfilled,
They will all say "We did thisourselves."
The American retailer best known for excellent customer service is
Nordstrom's. While they have problems, they have achieved an enviable status for
service. Their policy from the employee handbook is displayed in Table 32.
At this time, Park has excellent systems which are maintained by the
traditional managerial approach to organizational performance. However, within
this structure, teachers do not believe that they are adequately empowered. Yet,
empowered employees create excellence. As Park prepares for the year 2000 and
beyond, the Board should consider what it wants Park Christian School to
become. Further, it should consider altering the existing management style to
focus on leadership that will empower employees and enhance overall
performance. Leadership, benchmarking, and total quality management are tools
used to empower and achieve the greatness desired by Park.
77

Table 32: Nordstrom's employee rules
Welcome to Nordstrom.
We're glad to have you with
our Company.
Our number one goal is to provide
outstanding customer service.
Set both your personal and
professional goals high.
We have great confidence in your
ability to achieve them.
Nordstrom Rules:
Rule # 1: Use your good
judgement in all situations.
There will be no additional rules.
Please feel free to ask
your department manager,
store manager or division general
manager any question
at any time.
NORDSTROM
78

5. Myers-Briggs analysis: Psalms 139:13-14 of the Living Bible
explains: "You made all the delicate, inner parts of my body, and knit them
together in my mother's womb. Thank you for making me so wonderfully
complex! It is amazing to think about. Your workmanship is marvelous-and how
well I knowit."
Little is less understood than the truly complex personality that
makes us each unique.
Because many unique personalities make up each organization, part of this
strategic planning process included administrating the Myers-Briggs Type
Indicator.
The Myers-Briggs Type Indicator has been employed as a tool for many
years to help people in organizations: (1) Understand themselves and their
behaviors, (2) Appreciate others and make constructive use of individual
differences, and (3) See that approaching problems in different ways can be
healthy and productive.
It's often used to help organizations: (1) Communicate more effectively, (2)
Solve organizational and personal problems, (3) Make the most of human
resources, (4) Assist in career choices and professional development, (5) Improve
teamwork, and (6) Resolve conflict.
Myers-Briggs provides a useful measure of personality by looking at eight
personality preferences that are organized into four bi-polar scales, that identify
your"Type."
ALL Types are equally important. And Types are just one method
of describing who you are. God made us each unique to get the whole job done!
79

One scale is Extrovert or Introvert: Extroverts: Part of the genuine caring
shown among staff and to the children at Park certainly springs from this
preference. Introverts: While it might seem inconsistent that those who prefer
being alone would seek to be in the midst of so many children, we must
remember these people are most at home in the world of ideas and
understanding.
Sensing or INtuitive make up the second scale: Sensing: It would seem a
natural that a population that enjoys living in the present and gathering facts
would enjoy the atmosphere of children and education. INtuitive: Their ability to
see new possibilities and solutions in everything, to be inventive, to exercise their
very vivid imagination is just part of the reason it is not surprising this population
at Park, an elementary school, is higher than the general percentage.
Third is the Thinking-Feeling dimension: Theory reveals that the only pair
of preferences which shows a gender trend is the Thinking-Feeling dimension.
More women than men (six out of ten) choose a personal values approach
(Feeling) to decision-making. More males (six out of ten) prefer to make
decisions on the basis of principles in a logical and objective manner (Thinking).
Thinking: Teaching would seem like a natural place to find those who analyze,
who value logic, and who are good at organizing facts and ideas into sequence.
Seventy-five percent of the eight men at Park are thinkers. Of the twelve
thinkers, or 41 percent of the employee population at Park, it was equally divided
with six men and six women choosing the thinking preference. Feeling: While
80

statistics suggest sixty percent, prefer the feeling preference, 15 out of 21, or 71
percent, of the women at Park chose the feeling preference, as did two of the
men. The personal involvement required of teachers nicely matches the
characteristics of the person with Feeling preference.
Lastly, Judging versus the Perceiving scale: Judging: All eight men, and
fifteen of the women chose the Judging preference. The structure and
organization that has surrounded education makes teaching ideal for this
preference that likes to regulate and control life. Perceiving: While the Judging-
focused see Perceivers as aimless drifters, they are well-suited to the early grades.
Four of the six women with this preference were teachers of the first three grades
where youngsters are seeking to understand life and experience all of it. Their
curiosity is still very active and the perceiver is ready and willing to explore new
possibilities with them. Attention spans for the early grade are not lengthy, and
the Judging might be more apt to grow impatient with this lack of control that is
part of the young child.
When the four factor preferences are chosen and interact, they comprise
sixteen basic personality types. Table 35 diagrams the types indicated by the
employees analyzed at Park.
81

Table 33: Distribution of four pairs of preferences among all Park Christian School employees
analyzed
Percent
general
population
Percent
Park
Number Preference Number Percent
Park
Percent
general
population
75 62 18 Extrovert vs Introvert 11 38 25
75 48 14 Sensing vs INtuitive 15 52 25
50 41 12 Thinking vs Feeling 17 59 50
50 80 23 Judging vs Perceiving 6 20 50
Table 34: Distribution of four temperaments of Park Christian School employees
analyzed
% Gen. pop. % Park Number Temperament
38% 10% 3 SP (Realist)
38% 38% 11 SJ (Legalist)
12% 24% 7 NT (Analyst)
12% 28% 8 NF (Empathist)
82

Table 35: Myers Briggs Type Indicator preference groupings for employees of Park
Christian School
s s N N
ISTJ ISFJ INFJ INTJ
Todd S. DebL. JoAnn H. Terry N.
Randy S. Barb E. (3%) Duane E.
(6%) Karen P.
Paul R.
(13%)
(6%)
ISTP ISFP INFP INTP
N=0 Jennifer B. N=0 N=0
(0%) Naomi W.
(6%)
(0%) (0%)
ESTP ESFP ENFP ENTP
N=0 Shirley S. Deb H. N=0
(0%) (3%) Wendy B.
Debra G.
(10%)
(0%)
ESTJ ESFJ ENFJ ENTJ
John G. Kathy J. Kathy R. Terrinne B.
Polly S. Serene Y. Marlene N. Enedeo G.
Lorraine K. (6%) Sherri F. Karen N.
(10%) Dave B. Marilyn E.
(13%) Tracy S.
(17%)T T
S3

D. Marketing of Park Christian School
As Park markets, it must communicate with two completely different
customer segments and within each segment, a variety of customers exist. To
illustrate:
Financial supporters
Parents
*
existing customers (parents of children at Park),
*potential customers from major Evangelical churches,
*potential customers from other churches, and
*others
The donor marketing was not reviewed as part of this strategic planning
process. Marketing to parents includes both advertising and personal selling.
The current advertising materials used by Park include two brochures. A
critical analysis reveals that these materials are excellent and effectively
incorporate marketing theory and principles. They incorporate excellent
verbiage with the proper focus, high quality paper and printing to
communicate an image of quality for the School, and quality photographs
to bring the message to life. At the present, there is literature available for
Park in general, and the lower elementary grades, but there is no literature
for the Junior High program.
84

Park also has a 4.25 X 8.25 inch pocket folder with seven sheets of
information in each pocket. The seven sheets are progressively shorter so
the title of each is clearly visible.
Presentations are made to sponsoring churches. Reports reveal that these
efforts are well-received and professionally done. Park recently purchased
a professionally- designed booth for use with the presentations. However,
it does not appear that presentations are made to every church every year.
The advertising materials are displayed in each of the sponsoring churches.
Because of the physical layout of each church, the effectiveness of each
display varies. Board members are supposed to insure that the material
displays are maintained and replenished.
Weekly newsletters are sent to each parent at Park. These are intended to
be informative and contain information regarding events and happenings at
Park. They also include information on the teachers at Park, which
communicates to parents about the teachers their children will have in the
future. Overall, these serve a very useful purpose. Since these are the
most frequent communications with parents, they send a very strong signal
regarding Park. Some parents commented that the newsletter's tone, on
occasion, can sound authoritarian (for an example of an authoritarian
message, see the "businginformation"
sheet which contains words such as
"must"
and "will be"). In addition, the quality of paper and printing is
similar to most school newsletters: that is, adequate, but not outstanding.
85

Other materials are mailed to parents and others interested in Park on a
regular basis. Some include:
*
Quarterly issues of Park Today, a visually appealing 8.5 X 11 inch
magazine. This publication provides information regarding the
overall performance of the School.
*Prayer letters on monthly basis.
A packet of materials is given to prospective parents. In general, the
material answers most of the questions a parent might have, include the
following:
*One page cover letter
*Stanford Achievement Test scores
*Park fact sheet
*Park brochure
*Kindergarten brochure
*
Map of Park's location
* Application for enrollment
*Tuition and fee schedule
*
Busing information
Prospective parents are interviewed by the Administrator and Admissions
Counselor. Parents report that these interviews are very effective and
generate good impressions of Park.
86

Historically, Park conducted substantial marketing research to identify
customer needs and attitudes. And more importantly, this information was
used in developing School policies. However, there has been little research
in the past few years.
87

E. SWOT analysis developed by School Board
In business analysis, and specifically in strategic planning, the SWOT
analysis is an essential tool. SWOT is an acronym for:
S the strengths of the organization
W the weaknesses of the organization
O the opportunities existing within the organization's environment
T the threats presented by the organization's environment
Strengths of Park Christian
School
Outstanding teachers
Excellent administration
High level of commitment
by employees
Outstanding academic programs
Excellence and variety in electives
Scripturally-based curriculum
Desire to excel in academics
Strong athletic program with
winning tradition
Scholarship program
Financially strong
Weaknesses of Park Christian
School
Close to capacity
Inadequate planning for growth
Low salaries
7th and 8th grade lack identity
Lack of outcome-based goals for
individual students
Poor communications
Interrelationship problems
Communications with sponsoring
churches
School Board not visible to parents
Successful capital campaign
88

with expanding donor base
Building which is safe, clean,
and appealing
Handicap-accessible building
Day Camp
Apathy of parents/ no threats
perceived
Not equipped to serve severely
handicapped students
Need support for sustained giving
Gym needs repair and upgrading
No orchestra
89

Opportunities for Park Threats facing Park Christian
Christian School
Growing population in target
market of young families
Prosperity in community
Excellent supply of teachers from
local universities
Additional land available to expand
property
Growing awareness of benefits
of private education
Increased need for quality
preschool and day care
Growing awareness of Park
Accreditation by ACSI
Disseminate expertise of Park to
other Christian schools
School
High quality public schools in
community
Significant competition from private
and public schools
Growing very rapidly
Tuition increases pricing Park
beyond ability of the average family
Intensive competition for donor
dollar
Families seeing Park as the solution
to problems with high risk students
Families want specific teachers
More acceptance of outcome-based
education
Voucher system for public
education
Evolving laws for handicapped-
accessibility
Federal health care legislation
90

F. SWOT analysis identified in interview process
During the interviews the consultants held with teachers, staff, Board
members, pastors, parents, and others, the following strengths, weaknesses,
opportunities, and threats were identified.
Strengths of Park Christian Weaknesses of Park Christian
School
Christ-centered
Quality education
Ecumenical spirit
Growth and growth potential
Biblically-based instruction
Classmates with similar family
values
-
Fellowship among parents
Good parental involvement
Visionary planning
Successful capital campaign
Well-managed resources
Spirit of excellence
Excellence of children at Park
Children taught Biblical-problem
solving for life's problems
School
High tuition
Danger that quality school becomes
more important than Christian
school
Need more trust, communication,
unity
Park has become ingrown
Outgrown the building
Office area too small
Too few classics in reading program
Define purpose of chapel
Junior High program is less
developed
Computer program weak and
not enough time in computer lab
Science and math test scores lower
91

Mr. Norton's Administration:
handles parents and Board well
Great office staff
Pray together as a staff
Work together on common goals
Teachers
Teachers who pray with kids
Size allows more opportunities for
kids in sports etc.
Nice Facility
We fail to re-evaluate curriculum
Need more money for classroom
use
Parent apathy
Low pay
No retirement plan
Teachers serve on too many
committees
Breach of prayer time
confidentiality
Teachers fatigued: too much work
Teachers feel excluded/ not
affirmed
Gossip among teachers
Lounge has become a complaint
center
Need better evaluation process
for teachers and staff
We ignore sexuality
92

Opportunities for Park
Christian School
Start High School
Start Pre-school rather than
Senior High to feed system
Separate Junior High
Expand building and equipment,
establish regular replacement
program
Add to sponsoring church base
Involve teachers in strategic
planning
Teacher continuing education
Consultant to other Christian
schools
Threats facing Park Christian
School
Special needs children require
resources that already stretched
Need for seminars
for parents in community
Dedicated funds in capital campaign
Lack of involvement of most
sponsoring churches
Help Christian home schoolers
93

G. Product offering of Park Christian School
1. Elementary educational program: Students in grades
Kindergarten 6 take the following courses:
Reading Phonics
Spelling Language
Math Social studies
Bible Science
Penmanship Art
General music Physical education
2. Junior High educational program: Students in grades 7 and 8
take the following subjects:
7th grade 8th grade
Bible Bible
English/literature
Math
Life science
English/literature
General math/algebra
Earth science
Spanish (1 semester) Spanish (1 semester)
Computers (1 semester) Computers (1 semester)
Social studies Social studies
Physical education
Art
Physical education
Art
94

3. Special programs: In addition to the traditional subjects identified
above, electives include:
Choir for grades 4-8
Band for grades 5-8
Athletic programs for grades 4-8
Volleyball
Basketball
*Track
4. Program issues: There appears to be some disagreement regarding
the role of the Junior High program. There is general agreement that the Junior
High is an extension of the elementary school and does not provide training to
students in handling greater responsibilities. This issue expands into the transition
between grade 8 and High School, where some feel Park students could be better
equipped to make this difficult and emotional transition. Yet, the traditional
Junior High may not be a desirable alternative, based upon the problems and
other factors generally present in Junior High schools.
H. Facilities
1. Building exterior: Currently, the Park building is relatively new and
the overall condition is good. Specific details include:
Exterior walls have exterior insulation finish system with no maintenance.
Windows have maintenance free PVC clad exterior, but sealant needs
reviewed in 1994.
95

Roof is a fully-adhered membrane and was installed in 1985. It had a 5-
year warranty and 40-year expected life. A visible inspection in 1994.
Bus storage building appears in good condition.
Handicap-access is adequate. Possibly add handicap-assist operators at
main entrance. This could be added anytime for approximately $5,000.00.
Paint is peeling off south side of the building.
2. Grounds: The grounds of Park include parking and a playground. In
the near future, additional land will be acquired from the Burlington Northern
Railroad which will substantially expand the grounds. Following is an analysis of
the grounds:
Sidewalk has some cracking and heaving. Should be reviewed in 1994.
Main parking lot will be reviewed in 1994. Estimated cost to add2"
overlay would be $3.10/Square yard. Cost to add 11/2"
level course and 1
1/2"
wear course would be $4.35/Square yard. Side parking lot will also be
reviewed.
Trees and shrubs will be reviewed in 1994.
Could add 10 staff parking stalls at east side of building with gravel surface
for approximately $l,500-$2,000.
Separate office access for visitors. This should be evaluated at the time of
facility expansion. Due to the current office constraints, this is a future
consideration.
96

The parking lot could be used for bus drive-up and loading zone. The
buses could act as a windbreak. This could cause increased parking lot
congestion with parent pick-up activity. It also is very limiting on bus
mobility.
A windbreak screen could be added to current bus drop-off area. This
would decrease visibility, add snow accumulation hazards. Positives and
negatives should be discussed with staff prior to any action on this item.
3. Capacity: The 29,000 square-foot facility of Park Christian School is a
converted food store. Because of the substantial, excess space, only part of the
building was finished when the building was acquired in 1985. There were eight
class rooms and a gym in 1986. As student numbers have increased, addition class
rooms have been added by finishing additional areas. In 1994, there are 18
classrooms, a gym, and office areas. However, since all areas of the building have
now been completely finished, there is no additional room for expansion. The
gym doubles as the cafeteria, one classroom is devoted to music.
Historically, Park offered one section of each grade. But as enrollment
grew, second sections were added. In general, the strategy has been to add the
second section for the first grade when enrollment justified and the following year,
add a second section of second grade. This pattern has been repeated each year
and for the fall of 1994, the second section of the sixth grade will be added.
If Park continues to create double sections, by the fall of 1996, 17 class
rooms will be necessary (one for the two sections of K and two for grades 1
97

Table 36: Capacity of Park Christian School assuming two
sections per grade level
Grade level Maximum capacity Realistic capacity
K 48 48
1 44 44
2 46 44
3 50 44
4 54 44
5 54 44
6 54 44
7 54 44
8 54 44
Total 458 400
through 8). Given this assumption, the current school building could provide
room for 458 students (see Table 36). However, the assumption that every seat is
full is not realistic. Since the early grades require smaller sections, they become a
restriction which limits the flow of students into higher grades. Given this
restriction, 400 becomes a more realistic capacity figure within the present facility
but even this figure will be extremely difficult to achieve because restrooms and
the gym/lunch area are beyond capacity.
4. Future building expansion: Park is in the middle of Phase II of the
capital campaign to fund a gymnasium and teacher salaries. In addition, the
following needs exist:
Additional restrooms can be combined with gym construction
Additional classroom space:
*Needed when enrollment justifies and funds are available.
*Where should addition be constructed? Several alternatives.
98

Additional office space: how much is needed and where should it be
located?
New gym facility: What is included? Restrooms? Eating area? Showers?
Office for director? Storage etc., Lockers?
Storage: Add storage in the gym, revise some existing rooms, bus storage
area, create priority on items stored (When to discard?).
Bus storage building could be relocated at east end of large field area
which gets it away from the school. It could also have access to 2nd
Avenue North from present location. This facility needs roof and door
repair.
Nurse: Need office area for visiting nurse and a larger room for a sick
room.
I. Equipment status
As a teaching institution, Park has relatively high requirements for
equipment to support both teachers and office staff. A review of equipment
indicated:
1. Office:
One terminal per person networked and modem access where needed
Software training and updates including central grading, attendance
records, admissions, scheduling, hot lunch, bookkeeping, inventory control
(texts, equipment, classroom purchases)
99

Technology person knowledgeable in software used to train staff and
manage computer/AV etc. usage, service, etc.
Increase storage area of office and microfiche old records
2. Computer lab:
Larger classroom area which allows better arrangement
Master switch for all computers, network, LCD for presentations
Additional software, whiteboard, and overhead screen
Bank of four computers and printer (in small group)
3. Library:
Computer access to area libraries and catalog on computer
CD Rom and video disks
More seating space
4. Outside Playground:
Larger area available, spread classes further apart
Easy view of students by teachers
Add playground equipment and prioritize types
Check all playground items with insurance company to ascertain that all
purchases are covered by liability insurance
Running track, softball diamond, soccer and football field
Playground separated from parking lot
5. Classroom:
More vertical storage shelves
100

World map for each room
Replace worn teachers desks
Coat rack for teachers and visitors
Student storage improved
Master clock
Files and shelving
Present there is 20-student maximum capacity in some rooms
Cork strips for mounting and displaying work
Boot rack under coat rack
Improvements in desks, tables, and chairs
New chairs for Kindergarten, and Junior High needs library-type chair
Art room: teacher uses "art oncart"
but needs closed-door storage. May
need small room with large countertop space, tile floor, sink and drain.
6. Hot lunch: Eating area needs may not be possible in existing facility
Increase refrigerator/freezer space and monitoring, discarding old food and
unneeded items, and keeping area in a clean condition
Serving area cleaned: Would paid staff facilitate keeping serving area
clean?
7. AV equipment:
Increase number of TV/VCR units with central storage and library of tapes
Stereo equipment for music room use
Overhead projector and screen for each room
101

8. Facilities and equipment: Maintenance manager to develop daily,
weekly, monthly, yearly maintenance items to be checked. Sample items
could be (1) building condition: roof, windows, doors, classrooms, lights,
heating system, paint; (2) individual classrooms including: desks,
chalkboards, carpet, storage area, daily vacuum schedule; (3) condition of
playground equipment; (4) training for use of equipment; (5) frequency of
cleaning all areas; (6) and pager for custodian.
102

XI. Finances of Park Christian School
A. Financial procedures
Park Christian School's financial management and accounting systems
consists of the following functions and details:
1. Administrator: Oversees all financial matters, prepares annual budget
with Finance Committee review and School Board approval. He gives staff
authority for encumbering school funds, approves invoices to be paid, and contacts
parents who have accounts showing to be excessively overdue on accounts
receivable.
2. Bookkeeper: Receipts all cash received, prepares and mails all checks,
oversees cash accounts and reconciles accounts, manages payables, prepares
payroll information for service bureau. This position reports to the School
Administrator.
3. Service bureau accounting service: The School retains Larson's
Accounting to provide monthly compilation of financial statements. They process
all accounts receivables and payroll using an accounting receivable system which
has been custom-designed for Park Christian School. They have been contracted
by the School Administrator.
4. Finance Committee: Reviews financial decisions with the School
Administrator and assists in setting financial direction for the School. The
Finance Committee is a subcommittee of the School Board.
103

5. Accounting year: July 1 to June 30.
6. Annual review/audit: Historically, Park Christian has received an
annual limited review from Keith Ollie, CPA. Beginning with the 1993-94 fiscal
year, the School will have an audit.
7. Revenue accounting: The primary source of revenue for Park
Christian is tuition. All tuition is billed to accounts from contracts signed by
parents. Parents have a multiple payment plan of 10, 11, or 12 months. The
revenue is not recognized until billed. The spreading of the billing plans is
prepared by the service bureau with review from the School.
Payment to accounts is applied from receipts written by the Bookkeeper.
Special billing for sports fees, book fees, etc. are billed from billing sheets
completed by various staff at Park Christian. Statements are delivered to parents
monthly. Statements include all year-to-date information, allowing parents to
review for any errors in applying billing or payments.
8. Cash management: Cash is received directly into the business office
of the School. The mail is opened by the Receptionist, and then given to the
Bookkeeper for receipting. The Bookkeeper receipts the funds and deposits them
directly to the bank. The original copy of the receipt is given to the development
office for all donations. The yellow copy of all receipts is sent to the service
bureau accounting. If the Bookkeeper does not have time to do the receipting, it
is put off to a later day. There is not a back-up for this function.
104

Accounts receivable bad debt expense and write-off is minimal. Accounts
that are overdue are charged with a $10.00 finance charge. Accounts must be
paid in full at the end of the school year for grades to be released. If records are
not released, it could have some negative impact on the parents ability to enroll
the child into another school.
Bank accounts are reconciled monthly by the Bookkeeper.
Park Christian does not have an official policy for investing excess funds.
The School has been primarily using savings accounts for investments. Because of
using savings accounts, cash would not be pooled to maximize investment
earnings.
Park Christian does not record monthly accounts payables. Invoices are
held by the Bookkeeper until ready to be paid. Expenses are not recognized until
the invoice is paid. Invoices are not formally aged for payment. Approval for
payment is based on available funds. The Administrator selects invoices for
payment as there are not available funds to pay all invoices due.
Park has a purchase order system controlling proper authorization of
expenses.
9. Payroll: The Bookkeeper prepares a payroll worksheet, which is sent
to the service bureau accounting service to calculate the proper payroll check.
Checks are printed by the service bureau and returned back to the School
unsigned. All pay rates are based from signed contracts with each employee. Pay
105

types vary from hourly to salary. The service bureau prepares all State and
Federal reports.
10. Development accounting: Park Christian receives up to 25% of
their general budget from development income. The income is receipted by the
Bookkeeper, and the original receipt is sent to the development office. The
development office sends a thank you and the receipt to the donor. If a pledge is
involved, the gift is applied to the pledge. The donor gift tracking is
computerized. At this time, there is not reconcile or association of the
development system with the financial accounting system.
11. General ledger: The general ledger is a monthly compilation
prepared by the service bureau. Statements are due to the School within 10 days
after the final day of the month. The format of the statements is basically
controlled by the service bureau. Special reports are available upon request. The
financials are prepared in a fund accounting format.
12. Budgeting: The budget is prepared by the Administrator with
minimal input from other areas. The budget generally is not completed and
approved by the Board until September of each year. Thus, Park operates for two
to three months without a budget.
13. Overall comments: The overall financial system is functional for
the current enrollment, but it is also inefficient. The cash receipting is basic and
gives opportunity for error. If the Bookkeeper doesn't have time to receipt the
funds, they are kept in the School and not deposited to the bank. Further, if the
106

funds are not receipted, they can't be applied to development accounts or
receivable accounts. The bank accounts could be consolidated to allow fewer
reconciles and better investment potential.
The monthly financials do not report the entire financial position because
accounts payable are not being reported. This could prevent a cash flow problem
from being detected early. Payables are recorded in the financials at year end.
The automated development system should be reconciled monthly with the
financial accounting. This would help assure that funds received are accounted to
the correct account.
The financial processes in the business office and development need to be
integrated better. Further, admissions needs to be informed when payments are
received for new enrollments and the business office needs to be advised to bill
new students.
The School Board receives monthly statements and a cash report each
monthly Board meeting. The cash statement is incomplete and has timing errors.
This statement should be replaced by the balance sheet of the School, allowing
the Board to understand the financial position of the School.
When the Board makes financial decisions, generally the overall financial
impact of the decision is not discussed. The burden of funding a decision is
passed back to the Administrator and Finance Committee. The method of
funding should be presented along with the request for a decision.
107

B. Financial statement analysis for Park Christian School
1. Background information: Park Christian School was formed in
May, 1981, and on July 1, 1982, began to lease the former Park Elementary
School building at 121 Sixth Avenue South in Moorhead. The lessor was Daystar-
Gardner Ministries, Inc. and the lease payment was $500 per year with Park
Christian School paying repairs, utilities, and maintenance. Additional space was
rented at the Townsite Center and the North Junior High School building in
Moorhead on various occasions. On May 31, 1985, Park Christian School
purchased a building at 300 North Seventeenth Street in Moorhead at a cost of
$250,353. The building was later sold to Park Christian School Partners, a real
estate holding partnership. The intent of the partnership was to purchase,
remodel, and lease the building to Park Christian School. The original lease term
was from July 1, 1985 to December 31, 1991, with an annual rent of $165,000 plus
payment of real estate taxes on the building.
School started in the new facility in December, 1985. There were financial
difficulties and uncertainties associated with Park Christian School Partners which
resulted in Park Christian School Partners deeding the building to Park Christian
School on June 6, 1986. The consideration associated with the quit claim deed
was that the School assume liabilities of $960,113 associated with purchase and
remodeling of the building plus accrued interest related to these liabilities of
$42,546.
108

2. The 1982-83 through 1987-88 time period: Following is a brief
analysis of the financial statements for the period indicated.
a. Income statement analysis
Table 37 depicts critical components of the income statements for the
1982-83 through 1987-88 time period. The following significant points can be
gleaned:
1. The 1982-83 year is not comparable to subsequent years as the revenues
totaled only $83,480 and expenses totaled only $76,799. During this period,
the operating budget, number of students, and level of educational
programming was minimal.
2. Between the 1982-83 year and the 1983-84 year, student enrollment
increased by 22 students, or 15 percent. Subsequently, the cost of
education per student rose to $1,296. Net income for the year was positive
at $18,068. Also during this year, classroom space became a serious
problem, and the School leased one classroom in the Townsite Center from
the Moorhead Public School district.
3. Between the 1983-84 year and the 1984-85 year, student enrollment
increased by 30 students, or 17 percent. During this year, the operating
budget increased from $242,280 to $304,301, or by 26 percent. Even
through the operating budget increased significantly due to the increased
enrollment, the cost of education per student remained relatively stable as
109

^ c^ $ ^ S c^ ^ ^ ^ e^
JZ oo sO
2 c~-
so n rn Os d3
mg
mSO
o
|O CA
1 5 4o oo
>
g- 2
< 5 ^
W Os
E^ ^ E ^ CsC^ ^ ^
o m in Cs CN o
CC8
Os r^
3; CNCN d o
CC
as
CCcn
so
Os rn CN
O cTrn >n o rn
SO0\ in SO OS m
OS
o
r-rn CN
W
CNSO m Wh
f*"-'
^=>
S$ SS E C^ E * E^ ^
6?o O oo o Os o Cs
i>do
d d^ d CN rn oo
00
ON
SO
"
CO
as
o CNm SO^o ro o CN 00 OS
e-
m
CN
oin
OO m
-r
<-9
VI
T3
^ 8S c> c^
5^t E^ ^
m
^o r^
r-; CN SO m CN Os
sC d so o CN
CCo "T CN OS
CN r'l
asOv
1/1 "J
CC
as<n CN
CN
SOooo c^T 3
SO r- CN
3~
^O sO_ CS_ in r-
be-
rn
CS m ~
3 T4 tfl a
v> W
o
OO ^ g$ ^ C^ ^ c^ S^ 5?-
OO
^o SO 00 Os r o
Os d -J m od as _^ d~
CO
o ^ "" ~"'
5
00as
CC
OOoo
OS_^ OO m r- 00 m m m Oso oo rn m <n o o
as ro r o m in CN m oo r-J
m-so-
oo
=0 o mOS
Os rN v* &o
"Sicn
oo
3
O
Os
o gS$
OO
o
S?=
o
^-5
00 -r
j
do
drj
oo
m d r- ooc*
c
c
cC
as
drncoOS
oQ.
en
COo CN _ 00
^.oo -n SO
""
m O rn O r^ c
EOs. CN u-i T SO ^, <n o (N
oo
V^ CN
m m >
f^e 0&** ^
c,-a
1) "CI
4)
ca
^o
d
i? 5L
(Z) m o
aj CO c
Eo
Os o
T5
o CN o
c CO CO oo r-l0
as*^t
rn
"" "
M
"5 Ci^l
CJ W=t s4J
OCJ a a c
a.
C
a.5
c
5 E "o UJ
,_ cd
c 5o =
p c :Hc
" S{ "
= VI
S 5*o ^ =
o
z5ca QJ
> Q II ul a.- X 3 I
a. 5 o "S
5 S 5
0 5a.
a s5 ac x
2
-a
3 D
2 3
S 3-a
c3 "3 g j

enrollment also was increased significantly. Net income for the year was
positive at $54,873.
Classroom space became a constraining resource, and the School
leased five classrooms in the North Junior High building from the
Moorhead Public School district. In April, 1985, the decision was made to
purchase the new building. The financing vehicle used to finance the
building was the Park Christian School Partners real estate partnership.
4. Between the 1984-85 year and the 1985-86 year, student enrollment
increased by 9 students, or by 4 percent. During this year, the operating
budget increased from $304,301 to $499,651, or by 64 percent. Due to the
limited increase in enrollment and the large increase in the operating
budget, the cost of education per student rose to $1,762. In December,
1985, operations were moved to the new building. Also during this year,
financial problems associated with remodeling the building began to occur.
These problems were accentuated by limited enrollment growth.
5. Between the 1985-86 year and the 1986-87 year, student enrollment
decreased by 2 students, or .1 percent. During this year, the operating
budget decreased form $499,651 to $356,654, or by 28 percent. This was
mostly due to a decrease in contributions of $175,817 from 1984-85
amount.
During this year, extreme financial pressure existed. Projected
enrollment increases did not materialize, building renovations were
111

materially in excess of budget, and numerous vendors/lenders could not be
paid on time. The amount of $500,428 reflected as other income, was
received as a result of debt cancellations and pleas for increased giving.
On June 6, 1986, Park Christian School Partners deeded the building to
Park Christian School with the stipulation the School would assume all
outstanding debts ($1,002,659.) of the partnership. Due to the $500,428 of
other income, the $459,857 net income reported in 1986-87 was distorted
from an economic perspective as was the ($491) cost of education per
student. As a result of the building purchase and renovation during1985-
86 and 1986-87, Park suffered financially and its reputation in certain facets
of the Christian and secular communities was tarnished.
6. Between the 1986-87 and the 1987-88 years, student enrollment increased
by 3 students, or .1 percent. During this year, the operating budget
increased from $356,654 to $445,562, or by 25 percent. As was the case in
1986-87, a significant sum, $107,910, was received through debt
cancellations and pleas for increased giving. This factor allowed the School
to attain a positive net income of $134,390 for the year, and keep the cost
per student low at $1,461. This was despite the fact that enrollment only
increased by .1 percent, and the fact that the operating budget increased by
25 percent.
112

7. The last column on the table depicts average annual compound growth
rates for various revenue and expense categories between 1983-84 and
1987-88. The following items should be noted in relation to this column:
Support and revenues, which includes tuition, church support, and
contributions, increased by 16.4 percent per year.
With the exception of facility expense, which increased at 33.5
percent per year due to the move to the new location, and other
income, which increased significantly due to dedicated monies
received for building purchase and renovation, all other expense
categories increased at annual rates less than the 16.4 annual
percentage increase in support and revenues.
The annual net income throughout the entire 1982-83 through 1987-
88 time period was positive. However, after the move to the new
building, the annual positive net incomes were achieved under an
element of duress.
b. Balance sheet analysis
The following table depicts critical components of the balance sheets for
the 1982-83 through 1987-88 time period and reveals:
1. Prior to moving to the new building in 1984-85, the School was a relatively
low budget operation with a conservative financial structure. In 1982-83
and 1983-84 note the following:
113

Table 38: Critical balance sheet components: 1982-1983 - 1987-1988
Year 1982-1983 1983-1984 1984-1985 1985-1986 1986-1987 1987-1988
Current assets $21,025 $38,000 $53,829 $184,183 $104,955 $43,247
Endowment 50,000
Net fixed assets 37,678 32,655 381,309 1,296,715 1,205,598 1,201,215
Total assets $58,703 $70,655 $432,138 $1,480,898 $1,310,553 $1,344,462
Total debt $15,720 $12,911 $322,521 $1,242,134 $611,932 $511,451
Total equity $42,983 $51,744 $112,617 $238,764 $698,621 $833,011
Debt/equity ratio 0.37 0.22 2.86 5.20 0.88 0.61
Debt per student $104 $75 $1,589 $5,895 $2,914 $2,401
114

Current assets, the vast majority of the category was cash,
constituted 36 percent and 54 percent of total assets in 1982-83 and
1983-84 respectively. The remaining balance of total assets, 64
percent in 1982-83 and 46 percent in 1983-84, where fixed assets
which were primarily leasehold improvements and instructional
equipment.
Total debt was a small portion of total equity as evidenced by the
.37 debt to equity ratio in 1982-83 and the .22 debt to equity ratio in
1983-84.
2. Once the School moved to the new building, the investment in net fixed
assets increased significantly with the balance being $381,309 in 1984-85
and $1,201,215 in 1987-88. The School became increasingly leveraged
during this time period as it struggled to finance the building purchase and
renovation. The increased leverage is reflected by the following debt to
equity ratios during this time period:
1984-85 2.86
1985-86 5.20
1986-87 0.88
1987-88 0.61
As of June 30, 1988, total debt was reduced to $511,451 from the
$1,242,134 amount in 1985-86. However, as indicated earlier in this section
of the Strategic Plan, the School's reputation was somewhat tarnished in
the process of accomplishing the debt reduction.
115

3. Also beginning in 1987-88, a scholarship endowment began with a
dedicated gift from a major donor. The balance was $50,000 at June 30,
1988.
3. The 1988-89 through 1992-93 time period: This section
provides a more detailed analysis of the specified time period.
a. Income statement analysis
The following tables, 39 and 40, depict critical components of the 1988-89
through 1992-93 income statements. The following factors can be gleaned.
1. Revenues and support increased at an average annual compound growth
rate of 19.8 percent during this period. Within this category, the following
are significant:
In absolute dollars, tuition revenues increased from $281,970 in
1988-89 to $538,751 in 1992-93. As a percentage of total revenues
and support, tuition decreased from 67.0 percent in 1988-89 to 62.2
percent in 1992-93. The decrease primarily resulted from the
increasing percentage of total revenues and support supplied by
contributions during this period.
In terms of nominal and real dollars, dollars adjusted for the effects
of inflation, tuition increased as shown in Table 41.
If the average annual compound growth rates from 1989-90 through
1993-94 for the above two categories are calculated in real dollars,
the rates are:
116

^ ^ ^ ^ ro
CN c^CO Cs rN r^ so ^J-
Cs WO o r^Tto wo O
ro. 1
TJ- ro oo
CNOjjH
10 Cu^l A.M Pr > cs
cd 6 g co
5 GO CO
< 2
^ c^ ^o
o
SO
CO
so
so
ro
ro
po
CN
f-;ro o
^3- oOS T-H
OS
CM r~ '-O Cs SO * SO ^^ o CN OOs SO CO ro r- r^ TJ- Tf 1 1 T-H CNOs WO CO so CN co SO i 1 ro SO,-H o
v=* SO 1 ( ro wo SO as CNSO CN * T-H o ro
^r-
&eCO * &^fee
^ ^ ^ ^ ^ ^p WO r-- SO o O ^ N CN
c o ^r T-H SO o >oOS
ro
CN o LO CN t-H
^)-
OS T-Hs '
OS
T-H r- wo Cs CS ro r- , , O r~ OsCs r^ CN
-d-
>o CO^l- so ^r wo TT
OS oo SO ro , 1 CN oqwo SO CN
>d-
r-
&e CS CN <N
o co ro o wo ro vjSO ro , i T ( CN &e
fee
cj? ^ ^ t ^ ^o CN , i OS wo r~
COwo
^ o r~ o wo t-H ^r C-i
o xt OJ
OSs '
OSt-H
oOS
OS
Cs ^r O) r- Cs o s-^ <N 00 SO^d- r~- OS SO CS r) ^
-d-
^rr-
CN->*
T 1 CO WO ro^t-
co csi roo
fee ^f V) T 1 WO CS CO ^r CNo CO CN CS SO CM
i-H&e
SO CN fee i-H feefee
^^
ro
csOS
t-H ^ tcs ^ ^ J^CN
^o wo o t-H o r~ ^O
cTON o CN o Cs o co ^dON o o WO ro^H OS
OS
OS 1
co Cs r- ro CN SO CN ro ^v ' V ro r-
OS CO , i wo SO CN ro OJr~- CN O ro
T 1 CS CN ro q t> SO CO CN WO CN *T-H oo wo
oo fee CN WO CN
00 OO wo o OS ro *r(
^f-
fee
OSfee
CN t-H rn 1
c/3
s '
c ^ $ ^ $ ^ ^CJ
c
o^
o WO CN o CO r^ wo
-2*
o wo ro o wo OS wo
a,
Soo
OS
CO
o wo CN Os
Os
co
coOS
CN CN CN wo ' 1 r^ ^-^ ^^O ^t
c- CS O CN SO r- sO Cs o OSr-~ rr WO CO_
-d- r^ T-H SO
OCN CN
et-H fee CN
CN ro Os CO CN Tf CO CO &ecj -d"
CN O) ro
fee fee *>ecd
co
CJ
6C/Cj
CJ
3
C
CJ
ocj CJ
CJCO E
CJ
Cjco
a aC
CJ
ChXCJ
oCJ
CO Q.
13o
CJ
>CJ
CJ
exX
S-a CJ CJ
r^ cCJ
a
a
51-1
CJ cda a CJ 3
rtSh
u-a "c3
c
CJ
a
a
CJ
a.cCJ
CJ
Q.XCJ
C/Cj
CCJ
CJ
c/}
+H
o
P
OS
co
cd
1-t
cd
2"
XCJ
o
Ea.
o
a,XCJ
EoCJ
O
Wh
CJ
aCJ
^4-H *->
3cd
H |
cd
oa.
pCO
s
aJI
Wh J
CJ cj
'ocd
Ph
"cj>
CJ
Q
CJl-H
u
C
CJ
X!
6
G
CJ
z
Xl
Sp
o c
H-<U
co Td
O P
u ts
^ ^ cS c^ f? 5SCN oo ro ro CO CN O
CN CS ro ol i l , i o
ro SO CN or> H
CS
CN ,_, _ wo cs T-H CO r-
m Wl CJ\ Os r- CO snr-~ CN CN 1 1 o CO wo
CO co a) CO t-H C ) SOCO Wl CN CN t-H so
wo <N &e- oo
fee
^ ^ ^ $ ^ ON
CN CS O >o ro CO o
t-H CO-d-
CN rN CO CO
ojr- 1 1 n
CS T-H
CS
T^H
o roM- r- ro CO r~
CN ro ro wo ro CO r-
wo W1 wo o CN CO oo
^r ws'd-
SOM"
wo OSro T-H IN T-H T-H C 1-d-
T-H fee SO
&e
^ Cj! S ^ t $ {8T-H o r>- wo 00 CO CO
SO OJ SO CN T-H CO CO
, 1 SO rj CO
Cs t-H
OS
oOS
CS
r- T-H ^ CS ^_ CO Cs
ro 1 1 CS r- ro CO^d-
SO Cs Wl C 5 CO ro CN
Cs CN o W', , I wo -crOS ro
M-H , 1 ro
ro T 1 fee so
fee
^ ^ fN $ t00 ro 00 ro CO o o>d-
SO ro o) . i , 1 oo so OJ COcs
Cs
Cs Cs r~ Cs sn SO ro r^
wo . i CO CO sn ro - i
CS r) CN , id-
o ol
o SO a) . i CO wo COt-H O) , i , i fee CO
ro t 1 "d-
fee
ro
Cs
Os
CNt^ $ ?s fS f o5
O-d-
SO CO 00 CS o
OS
OS
CO
CS
so
04
C4
-d-
ro o oo
co .
OS o CO co oi ro CN OJT-H I-- , 1 Cs N S.O r^
CO . 1CS
-d-
OJ o ^c SO r~
CO T 1^d-
OS ^r r-~ -o co
OS oo CS 1 1 . i fee CNCN or
fee
co
cd
c
CJ
Eoo
CJCO
o
Q,Ch - s
+*
31) cCO rs
T3 a a.C CJ
cdX
CO
CJ 0) T)3
CCO
Ccd
CJ CJ rJ.
>CJ
CO ^_> CO CJ
00
CCJ
f
a,a,3
3
CCJ
o 3 COOCJ
C
00
E5
>
^r CO
X cd XICJ
CJ1
I J tH < )
X .'_! c c CO 3 T)cd
,3o 3 3 X C o
H H U Uh cn u W H
r-

Table 41: luition increases in nominal and real dollars
Year 1989-90 1990-91 1991-92 1992-93 1993-94
Nominal
dollars
Real "
dollars
Nominal
dollars
Real
dollars
Nominal
dollars
Real
dollars
Nominal
dollars
Real
dollars
Nominal
dollars
Real
dollars
Kinder
garten$911 S9U $950 $901 $950 $865 $950 $840 $992 $851
First-
eighth
grade $1,595 $1,595$1,722 $1,634 $1,774 $1,615 $1,871 $1,654 $1,983 $1,702
(1) Note
the base
.: Real dollars were determined usin
year.
I change in the Consumer Price Index with 1989-90 as
2.
Kindergarten (1.69%)
First Eighth Grade 1.64%
This suggests that Kindergarten tuition remained reasonable,
actually declining somewhat in terms of real dollars, during the
period. However, tuition for first through eighth grade rose
significantly, 1.64 percent in real dollars, throughout the period. In
the Fargo-Moorhead economy,
many non-professionally employed individuals have had, at best,
nominal wage adjustments. The tuition increases in real dollars
have the effect of pressuring these individuals financially.
Contributions increased form $94,418 in 1988-89 to $258,251 in 1992-93.
In terms of the percentage of total revenues and support, contributions
increased form 22.4 percent in 1988-89 to 29.8 percent in 1992-93. This
reflects the increased importance and effectiveness of the development
effort. During this time period, the development position moved form a
118

part-time position, to a full-time position, to a full-time position with a
paid full-time capital campaign consultant.
3. The emphasis in fundraising projects stabilized between 1988-89 and1992-
93 such that by 1992-93 two fundraising projects were held annually. The
two projects are the coupon book sale in the fall and the food-a-thon in
the spring. These projects typically yielded between $25,000 and $30,000 in
annual revenues.
4. Bus income as a percentage of total revenues and support declined from
3.3 percent in 1988-89 to 2.3 percent in 1992-93. This reflects the busing
policy which subsidizes children riding on Fargo bus routes. The intent was
to increase enrollment from Fargo, and the policy seems to have worked
effectively.
5. Church support as a percentage of total revenues and support was
immaterial, hovering between 1 percent and 2 percent, throughout the
entire period. Even though sponsoring churches exercise significant
authority in School matters, they appoint Board of Director members, they
provide minimal monetary support.
6. Endowment revenues reflect designated contributions received from donors
for scholarships. The endowment contributions throughout the time period
were steady and were primarily from one donor.
7. Instructional expense includes non-administrative salaries, textbooks,
teaching supplies, expenses associated with busing students, and expenses
119

associated with auxiliary activities, i.e. day camp, music and bank, physical
education, library, and educational testing. Instructional expense increased
at an average annual rate of 15.9 percent which is less than the 19.8
percent average annual rate increase in revenues and support. Teachers
salaries during this period varied as follows:
Table 42: Changes in teacher salar es in nominal and real dollars
1989-90 1990-91 1991-92 1992-93 1993-94
Nominal
dollars
Real "
dollars
Nominal
dollars
Real
dollars
Nominal
dollars
Real
dollars
Nominal
dollars
Real
dollars
Nominal
dollars
Real
dollars
High $16,720 $16,720 $17,100 $16,203 $18,810 $17,117 $19,570 $17,300 $20,330 $17,443
Median $14,300 $14,300 $13,557 $12,866 $15,593 $14,190 $15,579 $13,772 $15,783 S13.541
Low $11,000 $11,000 $11,250 $10,676 $12,746 $11,599 $13,068 $11,552 $13,576 $11,648
m Note:
base yee
Real dollars were
r.
determined using change in the Consumer Price Index with 1989-9C as the
If average annual compound growth rates from 1989-90 through
1993-94 for the above three categories are calculated in real dollars, the
rates are as follows:
High 1.1%
Median (1.4%)
Low 1.4%
This suggests that the increases inteachers'
salaries which occurred
over the time period allowed teachers to do well in terms of purchasing
power. There was a slight purchasing power advantage received by high
120

and low paid teachers and a slight purchasing power disadvantage given to
teachers in median salary ranges.
8. General and administrative expense reflects administrative and clerical
salary expenses, office expenses, and miscellaneous administrative expenses.
The amount increased at a 10.2 percent average annual growth rate during
the period.
9. Facility expense reflects all expense categories associated with upkeep of
the building and grounds. The amount increased at 7.7 percent moderate
average annual growth rate during the period.
10. Development expense reflects the development director's salary, expenses
associated with the development effort, the annual banquet expense, the
capital campaign consultants expense, and expenses associated with the
capital campaign. The 44.6 percent average annual compound growth rate
reflects movement from a part-time to full-time development director, and
movement to a full-time development and capital campaign consultant.
11. Interest expense decreased from $40,777 or 9.7 percent of revenues and
support in 1988-89 to $36,146 or 4.2 percent of revenues and support in
1992-93. This decrease reflects the reduction in outstanding School debt
and the increase in the operations budget that took place during the
period.
121

12. Other income relates primarily to contributions received which were
designated for building expenditures. The amount fluctuated from a low of
$6,064 in 1992-93 to a high of $31,827 in 1989-90.
13. Net income fluctuated significantly throughout the 1988-89 through 1992-93
time period from a loss position of $38,069 in 1988-89 to an income
position of $49,110 in 1992-93. During the 1988-89 and 1989-90 years,
enrollment was"flat,"
the development director position was a part-time
position, and the school debt was higher than it was in later years. The
collective interaction of these factors was largely responsible for the losses
incurred.
During the 1990-91 through 1992-93 time period: enrollments
increased substantially; the development directory position became full-
time, and contribution income increased substantially. All years were
profitable with the exception of 1991-92. The loss in 1991-92 was primarily
caused by the large increase inteachers'
salaries. This increase resulted in
instructional expense equalling 54 percent of revenues and support in this
year.
14. The cost of education per student during this time period increased at an
average annual rate of 3.4 percent. This was caused by the absolute level
of expenses increasing at a faster rate than the increased enrollment during
this time period. Increases inteachers'
salaries, staff salaries, program
offerings, development activities, and depreciation associated with facility
122

additions were all part of the increase in total expense which took place
during this time period.
b. Balance sheet analysis
Table 43 depicts critical components of the 1988-89 through 1992-93
balance sheets. The following factors can be gleaned form the table:
1. Current assets, which consists primarily of cash, with the exception of 1992-
93 in which current assets reflect a house gifted to Park as part of the
capital campaign with an estimated fair market value of $41,000, grew
steadily throughout the period. Most of the cash balance reflected in the
June 30th balance sheets related to monies owed to teachers, electing to
receive their annual salary over a twelve month period and to deferred
revenues for the start of the next school year. Minimal amounts of
discretionary cash existed at the end of any of these years.
123

Table 43: Critical components of the balance sheet: 1988-1989 1992-1993
1988-1989 1989-1990 1990-1991 1991-1992 1992-1993
Current assets $47,254 $64,922 $83,359 $97,353 $149,178
Endowment $50,000 $55,000 $60,000 $65,000 $75,000
Net fixed assets $1,197,295 $1,160,566 $1,127,426 $1,090,760 $1,077,601
Total assets $1,294,549 $1,280,488 $1,270,785 $1,253,113 $1,301,779
Total debt $497,113 $495,522 $474,924 $469,788 $468,991
Total equity $797,436 $784,966 $795,861 $783,325 $832,788
Debt/equity ratio 0.62 0.63L
0.60 0.60 0.56
124

2. The scholarship endowment increased steadily from $50,000 in 1988-89 to
$75,000 in 1992-93.
3. Net fixed assets declined from $1,197,295 in 1988-89 to $1,077,601 in 1992-
93. This reflects the fact that net fixed asset additions which took place
during the time period were less than the depreciation expense recognized
during the period.
4. Total outstanding debt decreased moderately during the time period from
$497,113 in 1988-89 to $468,991 in 1992-93. This, combined with a
moderate increase in equity, from $797,436 in 1988-89 to $832,788 in 1992-
93 caused the leverage position of the School to improve by the decreasing
debt to equity ratio from 0.62 in 1988-89 to 0.56 in 1992-93.
c. Statement of cash flow analysis
The following table depicts critical components of the 1988-89 through
1992-93 statement of cash flow and reveals the information detailed below:
1. In terms of net income, the School was basically a"breakeven"
operation
between 1988-89 and 1992-93 with cumulative net income totaling ($8,279).
For a non-profit institution, a breakeven result is acceptable. However, a
small positive net income, i.e. 1 percent to 2 percent of total revenues and
support, is a more preferable position which would allow a small cash
reserve to accumulate.
2. Adjusting the ($8,279) for total depreciation expense of $285,082 incurred
during that time period, yields $276,803 gross cash flow. The $276,803 of
125

gross cash flow was increased by $13,907 due to liabilities incurred but not
paid, to yield cash flow
Table 44: Critical component of the statement of cash flows: 1988-89 - 1992-93
1988-89 1989-90 1990-91 1991-92 1992-93 Total
Net income ($38,069) ($14,522) $14,842 ($19,640) $49,110 ($8,279)
+ Depreciation expense 54,618 55,619 57,633 57,989 59,223 285,082
= Gross cash flow 16,549 41,097 72,475 38,349 108,333 276,803
Change in operating 6,770 25,617 (2,622) 25,222 (41,080) 13,907
assets
= Cash flow from
operations 23,319 66,714 69,853 63,571 67,253 290,710
- Cash flow from investing
activities (7,573) (23,157) (29,493) (26,320) (56,065) (142,608)
- Cash flow from financing (12,436) (18,279) (20,007) (31,895) 1,814 (80,803)
activities
= Change in cash 3,310 25,278 20,353 5,356 13,002 67,299
+ Beginning cash balance 27,742 31,052 56,330 76.683 82,039
= Ending cash balance $31,052 $56,330 $76,683 $82,039 $95,041
126

from operations of $290,710. This is the amount of cash which is available
to fund capital asset acquisitions and service outstanding debt.
3. Of the $290,710 in gross cash flow, $142,608 was used for equipment
purchases and building improvements and $80,803 was used for debt
service. This resulted in a remaining balance of $67,299. This balance,
added to the beginning cash balance in 1988-89, yields the ending cash
balance at June 30, 1993 of $95,041.
4. The 1993-94 budget: The 1993-94 budget reflects revenues and
support of $925,072 and total expenses of $888,762 which yields a projected net
income of $36,310. As of April 30, 1994, $983,875 of revenues and support had
been received of which $294,798 related to the receipt of capital campaign
pledges. Total expenses incurred as of April 30, 1994 where $797,871. Year to
date income through April 30, 1994 was $185,984.
With the advent of the capital campaign in the fall of 1993, the budgeting
process has became more uncertain. Predicting the timing of receipt of capital
campaign pledges is difficult. The receipt of significant capital campaign pledges
largely accounts for the positive net income variance which existed at April 30,
1994. It is probable that 1993-94 and 1994-95 will be"strong"
financial years with
the concurrence and conclusion of Phase I and Phase II of the capital campaign in
June 30, 1995.
After June 30, 1995, it is anticipated that many of the stated capital
campaign goals will be met. However, dedicated and deferred giving will probably
127

prevent elimination of the entire School debt. Notwithstanding these gifts, the
Burlington Northern property should be purchased, building and gymnasium
construction should be started, the scholarship endowment should be increased,
the parking lot should be resurfaced, and the leverage position of the School
should continue to improve.
However, another capital campaign will need to be launched for no other
reason than to fund the annual operating needs not met by tuition and fees for
1995-96 and future years. Given the transitional state of the development effort,
appropriate personnel need to be hired and effective planning initiated in the near
term future.
C. Role of the Finance Committee
Park Christian School's organizational structure includes a Finance
Committee which is a subcommittee of the School Board. The Finance
Committee makes input in determining tuition costs, budgets, teacher and staff
salaries, and overall financial development goals.
1. Overall operation of the Finance Committee: The general
function of the Finance Committee seems to be providing wisdom and balance in
financial matters, in addition to providing expertise in financial management and
direction for the School Board. Finance Committee responsibilities also include
assisting the Administrator in financial decisions, avoiding potential financial
pitfalls, being a source of information, and ultimately, communicating this
information to the School Board.
128

A Finance Committee Chairperson is appointed annually according to the'
constitution. Committee members are appointed for a term of up to three years
and may be re-appointed for one additional three year term. After serving a
second term, members are ineligible for re-appointment for a three year period.
In addition, a complete listing of all Committee members, including Chair, shall
be submitted to the School Board by October 1 of each year, or when changes are
made (Park Constitution: Article 8-Section 2).
Meetings are called on an as needed basis throughout the year. Minutes,
agenda and notice of future meetings are communicated in an irregular fashion.
In the past, regularly scheduled meetings have been communicated to Committee
members as little as 16 hours before the meeting time.
2. Composition of Finance Committee: The current composition of
the Finance Committee consists of individuals with a variety of expertise and
backgrounds: budgeting, accounting, finance, retailing, salaried workers, self-
employed individuals, and business owners. The current Committee brings a
depth and wide-range of expertise in budgeting, financial planning, and overall
management issues.
It should be noted, however, that a primary function of the Finance
Committee is reviewing and coordinating activities of the Development
Coordinator in regard to financial development and fundraising. It would appear
the current Committee could benefit from some individual with expertise in this
area.
129
At this time, the Finance Committee does not include any members with
direct access to the wealthy individuals in the community. This will have
significant impact when the capital campaign ends in July, 1995, and the Finance
Committee will have to revert to meeting the"gap."
3. Relationship to Park School Board: Finance Committee's present
relationship to the Board is maintained through a Board Representative on
Committee, in addition to the School Administrator presenting all decisions,
recommendations, etc. to the School Board. There is a perception from the
Finance Committee that communication and interaction between the School
Board and Finance Committee is somewhat limited. There could be more
communication between the two entities regarding upcoming issues or decisions
significantly impacting the School. It is essential both the School Board and
Finance Committee have clear visions and goals for Park Christian. Decisions
and/or recommendations made by both groups can significantly impact the other.
Free-flowing information between Board and Committee is critical.
4. Involvement in budgeting process: Park's fiscal year-end currently
is June 30 of each year. This roughly coincides with the school year, allows for
collection of final tuition from the previous year, and is a reasonable cut-off for
the School's financial year. Historically, salary determinations for the next school
year are made without a preliminary budget and are determined from January
through March of each year. A preliminary budget is typically presented,
discussed and approved at a committee meeting near the end of the current
130

school year. A final budget is not presented or approved until September or
October of the new school year. At the present time, the Finance Committee
provides limited input into the budgeting process. It is unclear the level of
involvement of administration, teachers, School Board, Facilities Committee or
Finance Committee has in this overall process.
Current financial reporting for the School tends to be unclear, and at
times, lacking in value or usefulness. The current cash report presently in use
does not present an accurate overall cash picture for the School. Year-to-date
revenues and expenditures are not compared to budgeted year-to-date numbers.
As a result, Finance Committee makes decisions that significantly impact the
financial affairs of the School with limited or inaccurate information.
5. Overall comments: The Finance Committee provided valuable,
reasoned, and prayerful recommendations to the School Board. Though this
Committee has been useful, the expertise and depth of individuals on this
Committee would allow it to be much more. The following are strategies to
enhance the value of Finance Committee:
Lines of communication should be improved between Finance Committee,
School Board, Development, Administrator, Strategic Planning, Facilities,
Curriculum and Administration. This is most critical within the budgeting
process which should include input from the above and teachers.
Committee members should be appointed to a specific term and clearly
informed of the responsibilities of Finance Committee membership.
131

Notice of meeting, publishing of past minutes, and proposed agendas
should be given to Finance Committee members well in advance of the
next meeting date.
Training should be provided to Committee members regarding the
information presented to Finance Committee and how the information can
be interpreted.
Preliminary budgets should be made available to Finance Committee
members in advance of significant financial decisions (tuition rates and
teachers salaries).
There is a perception that issues presented to Finance Committee have
been decided before the meeting is held; discussion and resolution of this
issue is strongly encouraged. Therefore, the role of the Finance
Committee needs to be clearly defined to utilize the depth and expertise of
Committee members.
132

XI. Key Factor For Success
Throughout the strategic planning process, a number of problems or
situation requiring attention have been identified. However, continued and
enhanced success at Park Christian School requires that energies and resources be
directed at the critical situations. Therefore, this section presents those factors
called the Key Factors For Success, which the consultants believe require focused
attention during the next twenty-four months.
1. Finances: The success of Phase I, and the apparent success of Phase II of
the capital campaign have created an excellent position for Park. However,
starting July 1, 1995, Park will have a gap to fill, a debt which has not been
retired, and an inexperienced Development Coordinator. With the
potential that many donors are financially exhausted, immediate action is
required.
2. Ninth grade: There appears to be substantial support for a ninth grade and
some believe that a feasibility study should be conducted during the 1994-
95 school year. The consultants do not believe that a feasibility study is
warranted and the ninth grade should be reconsidered during the 2000-01
school year. This issue should be resolved and the decision communicated
to everyone to avoid revisiting it each year.
3. Administrative structure: Park has outgrown it organizational structure and
the Administrator needs additional supporting personnel to retain the
School's overall effectiveness. Rather than making marginal or small
133

adjustments to the current structure, it is recommended that the entire
administrative structure be evaluated.
4. Board design: Currently, Park utilizes two essential boards, the Finance
Committee and the School Board. Both are effective, but members of
both also believe that performances of each could be enhanced
substantially.
5. Administrative style: Park is a very good school, but to move to even
higher levels of performance, Park should use leadership and benchmarking
to implement a total quality system which will enhance communications
and overall performance. It will be almost impossible to achieve excellence
at Park with traditional management practices.
134
X. Strategic Recommendations
Experts have suggested that strategic plans should be discarded, but the
planners retained. Other have suggested that the major benefit derived from
planning is not the strategic plan, but rather that it forces people to focus on the
future. Therefore, the following strategies are not designed to be engraved in
concrete, but rather are intended to help Park focus on the future, and develop a
management structure which allows the School to proact to changes in the
environment. Each strategy implementation contains numbered, specified tasks
and lines of responsibility.
135

Strategy 1: Organizational structure
Rationale: To fine tune the overall performance of Park Christian School, the
following organizational issues are presented for consideration.
Implementation:
1. Pastors of sponsoring churches: From Park's perspective, the pastors of the
sponsoring churches have a minor involvement in Park's operations. While
some might prefer a higher level of involvement, it is not going to occur
because Park is operating effectively, churches have Board members, and
pastors have too many time demands. Therefore, accept the level of
participation and consider:
The key role of sponsoring churches and pastors is their part in
marketing. Therefore, focus on access for literature tables and
presentations.
The fall luncheon for Evangelical pastors is effective and well-
received.
Continue sending the Board minutes to pastors because they are
read.
Consider a luncheon for sponsoring churches pastors each spring
that includes discussion of relevant information and strategic plans.
Also, include time for a frank discussion of perceptions of Park.
136

This meeting should include the Administrator, Board President,
Admissions Counselor, and the pastors.
2. Parent-Teacher Fellowship: At this time, the PTF is at a crossroads, as
changing lifestyles have left some of its functions impossible, while other
are effective. A committee consisting of a Board member, the PTF
President, a parent active in PTF, a parent inactive in PTF, and a teacher
should be appointed to determine if PTF is worth salvaging. If the
decision is yes, evaluate its success and failures for each event held in 1993-
94. In addition, evaluate the percent of families participating in each
event, and the families which do not participate in any event. Are skate
nights used by a small or large percentage of families during a year? If
PTF is retained, develop a Mission Statement and objectives which will
allow effective functioning in the late 1990's. If a survey of parents is
completed during the 1994-95 school year, several questions should be
allocated to the PTF.
3. Administrative staffing: Park has grown substantially, while adding little
administrative staffing. While some changes are occurring presently, it is
essential for the School Board and Administrator to evaluate the total
administrative needs of Park to the year 2000 and develop an
administrative structure leading to that design. Factors to consider are
adding a Principal, the role of the Administrator in fundraising, the role of
the Development Coordinator, and the role of the Admissions Counselor.
137

It is not humanly possible for the small staff to continue to complete all of
the necessary activities as Park continues to grow. However, it is essential
to consider these needs in light of the current financial situation which
does not appear to provide excess funding. Overall, a reorganization is
necessary. It is recommended that zero-base staffing be used, which
involves starting over in designing an administrative structure, rather than
fine tuning the existing structure.
4. Organizational chart: The existing organization is confusing and does not
display lines of authority or responsibility. Create a pictorial representation
of the lines of communication, responsibility, and participation of each staff
position, committee, and department. Several approaches to the
organizational structure can be made. Following is a starting point for the
organizational chart.
5. Mission and Vision Statements: While the Mission and Vision Statements,
and Park's Philosophy are current, they are not widely disseminated. Yet,
they can be used to communicate the personality of Park to a variety of
publics. Include them in more publications of Park, insert them in the
weekly newsletter and advertising materials, and post them in the School so
they are visible to students.
6. Use of volunteers: Park should explore alternative strategies to utilize
parent volunteers to perform various functions within the school. At this
time, this is a resource which is under-utilized.
138

Time line: Tasks 2, 3, 4, and 6 should be completed during the 1994-95 school
'
year. Tasks 1 and 5 are ongoing.
Responsibility: Tasks 1 and 6 are the responsibility of the Administrator. Task
2 should be completed by the committee appointed by the Administrator. Tasks 3
and 4 should be the responsibility of the School Board, Administrator, and a
personnel expert. Task 5 should be handled by the office staff.
139

oc
.e
U
I
CS
0-,
i
O
a
a
X)
CB
H
'j-}
a. uu OJ
OJ
OJ
CI
iEo
U
3
3CJ
i--------1
OJu
Eoj
W(In
o
Bi>
a73
OJ
OJ
c ST.
-C
5
Eo
U
00o
o
2^ c
ccCS
cd
Oh
<
"e3 c/0
a
G v, o -O
&K C
M C [LGO 03
>E
W r-l
c -ai-
c/5
.2 w c
O o
c m c/o
-C _
O oC
o^ j C
b o -a <r
<* <
EOJ
E
2 w^
U5
c
.2 u
cd
on
OJ ca
u u >OJ "3
E
o)
^ 53 u3
Oh
OJ
5.
OJ
>OJ
a
u iJu
-O
oo q,
OJ
> ru
c
OJ
OJ
C
f=
O
OJOJ
s "O OJ c
- -2 o J3 ca
2 s O COJ
E
04
c
E^O
o
c
Ch

Strategy 2: Strategic planning
Rationale: Park has continually performed extremely effectively in recruiting
students, fundraising, debt reduction, and delivering quality instruction. To
maintain this, it is essential to activate the Strategic Planning Committee of the
School Board.
Implementation:
1. Strategic planning process: Assign one Board member familiar with
planning to head the committee. Appoint two teachers and two parents to
the Committee which could meet two to four times a year to update the
plan and analyze environmental changes. The primary focus next year
could be continued development of the ongoing data base. This includes
identifying specific data needed for planning, establishing systems to collect
and analyze the data, and develop a reporting system to make the
information available to the Board.
A second task should be establishing a scan, clip, and review system
in which teachers and Board members scan five periodicals they normally
do not read. They can range from highly technical to popular. Each
person clips all articles they think are interesting regarding future trends
and shares them.
2. Mission and Vision Statements: The current Vision Statement of Park
Christian School reads "We aim to become the best Christian school in
141

America."
Some felt that this could not be measured, and was too
aggressive. However, excellence is seldom achieved without aggressive
goals! Currently, two Mission Statements exist; a full and an abbreviated
version. This will tend to create confusion, thus, it is recommended that
they be reviewed and consolidated into one. Usually, a briefer Mission
Statement is more useful and enlightening for general use.
3. Avoid strategic drift: Strategic drift occurs when organizations loses their
focus by adding activities which are only semi-related to their mission.
Generally each new activity was an excellent opportunity, but collectively,
they create the loss of focus. Interviews revealed that everyone feels
pressured by the many time demands. Are there areas that can be cut
without decreasing Park's excellence? Also, identify potential issues which
might create strategic drift. Some issues involve defining the appropriate
balance of social and spiritual needs beyond the normal classroom for both
teachers and students. Churches have excellent programs for adults and
children that Park does not have the financial or human resources to
duplicate. Strategic drift can also involve adding grade levels, such as a
pre-school, if it does not fit within the overall mission. There is no"right"
mission for Park, and it will certainly evolve over time. It is critical to
evaluate each new idea against the Mission Statement and the cost in
finances and labor, rather than against need.
142

4. Planning resources: Park is in the process of acquiring 16 acres of land,
expanding the building, and purchasing equipment. Each of these require
planning to insure that Park is a good steward of the money and resources
available. An overall plan with major teacher input should be developed
which includes and prioritizes classroom equipment, playground equipment,
facilities, carpet replacement, and other resources. At this time, there is no
investment to cover depreciation of capital assets. While Park is several
years away from major repairs, we must start planning now to maintain the
facilities.
5. Target marketing: To avoid strategic drift, in the overall strategic planning
of Park, it is essential to identify specifically which groups of people we will
serve. It is foundational in massing resources to meet the needs of
customers. At this time, the target market includes: Evangelical Christian
families with children in grades K through 8 living in Moorhead,
Minnesota, and Fargo, and West Fargo, North Dakota. Because of the
relatively high tuition, we could also add that the target market is often
restricted to families with average incomes or above. At this time,
resources do not allow broadening the target market. Park will continue to
accept those from beyond the geographic boundaries, if they provide their
own transportation. Because we do not have comprehensive "special
services"
available within the School, children requiring such specialized
support are not considered part of our target market. And while not
143

addressed within this plan, the changing cultural diversity within the
community must be considered.
6. Positioning statement: Positioning refers to creating a clear and distinct
image in the mind of the customer. To illustrate, the name Haagen Dazs,
Cadillac, and Hersheys all create an instant picture in our minds. During
the interview process, parents stressed strongly that they wanted a Christian
environment. Some also stressed a high quality education. When those
who did not identify quality were asked about it, they stated they assumed
quality academics. When asked to rank quality and Christian education,
quality came out a very close second, generally a 9 or 9.5 on a scale of 10.
A Christian education always came out 10. The current positioning
strategy focusing on the Christian education slightly more than quality
seems appropriate. However, it is essential to include quality for Park
because of the demographic profile of Fargo and Moorhead. Can a slogan
be developed? The key to positioning is to very accurately understand
what your customer wants and clearly create the image in their mind that
only Park Christian School can fill that need.
Time line: Tasks 1, 3, 5, and 6 are ongoing. Tasks 2 and 4 should be addressed
during the 1994-95 school year.
Responsibility: The Board should assume responsibility for all planning tasks.
However, it should delegate some responsibilities to appropriate committees and
individuals. Task 4 should include the Administrator and teachers.
144
Strategy 3: Enhance School Board performance
Rationale: As Park grows, the demands on the Board become more complex
and require more specialized expertise.
Implementation:
1. Evaluate the purpose of the Board, and define what its role should be in
the year 2000. Will Park need a committee-type Board, which is actively
involved in operating decisions, or will it need a strategic-guidance type
Board which meets less frequently to provide overall directions? The
consultants recommend that a strategic Board be seriously considered.
2. Evaluate if a twelve-member Board is the ideal size. Because of Board
size, do some members fail to contribute? Would a seven or eight person
Board work better? Confer with pastors of the sponsoring churches in the
evaluation.
3. Implement a training program for Board members. This should start with
a half day program for new members, focusing on mission, vision, duties of
a Board member, specific responsibilities of Board members, etc.
However, the training cannot stop here, therefore, an annual training
program should be implemented. The Board must identify the specific
needs that it faces in successfully completing its tasks. Some suggestions
might include financial planning, marketing, and human resource
management. There are also experts available in school board operations
145

and their skills should be utilized. Richard Ott, Chair of the North Dakota
School Board Association provides board training. The Education
Administration program at Tri-College University could also be a resource.
Develop a packet of information for new Board members. Current
members suggestions for materials to include:
What does a Board member do?
What is expected of Board members at meetings?
What are the current issues before the Board?
Committees of the Board/function & membership
What is the vision for Park Christian?
How does a Board member fit into that vision?
What are the five-year goals and what part will Board members play
in achieving those goals?
Creative ways to stay in touch with teachers
Resolving conflicts that come up at meeting
Insights for Christian School Board Members by Roy Lowrie Jr.
Identify specific types of skills which the Board needs to function
effectively, and develop a recruitment program to get this expertise on the
Board. Consider:
Finance (perhaps two individuals)
Human resource management
Legal
146

Marketing
Engineer or architecture
Before vacancies occur, efforts should be made to identify and
recruit potential candidates who meet these qualifications. In addition, the
Board should include several parents who are selected because of their
concern for Park, and not their expertise.
One concept which has gained some acceptance is having
teacher/employees on the Board. In other industries, employee
representation on boards has not worked effectively because the Board
needs to represent broader constituents. At this time, the consultants
recommends that we do not have teacher/employees on the Board.
Should the number of public school teachers on the Board be
reduced?
6. Teachers disagree with the recommendation in task 5 and feel they need
greater access to the information of the School Board. The Board should
consider alternatives to enhance communications such as providing minutes
(with personnel, specific admissions, and other legal issues deleted) to all
employees. Public schools have open meetings. Companies have found
that performance generally increases as information is provided to
employees, and Park should not fear sharing Board information.
7. Consider subscribing to the Aspen's Board & Administrator which provides
leadership techniques for non-profit board members. The cost is $111 per
147

year for one subscription which includes one publication and an insert for
each board member. Addition publications can be purchased for $5 per
year. See Appendix 4 for a sample flyer and ordering information.
Time line: Tasks 1, 2, and 5 should be decided during the 1994-95 school year.
Tasks 3, 4, and 7 should start during the summer of 1994.
Task 6 should be handled fall of 1994.
Responsibility: Tasks 1, 2, 5, and 6 should receive full Board deliberation and a
consultant could provide assistance..
Tasks 3, 4, and 7 should be assigned to one Board member with help from the
Administrator.
148
Strategy 4: Use leadership and benchmarking to
implement TQM
Rationale: While Park currently provides very good education to students, the
current vision is to be the best Christian school in America! To move from very
good to the best in America can only occur with a paradigm shift in the School's
operations. Quality is delivered by organizations which benchmark other
organizations, have leaders not managers, and implement a total quality
management system. Park should start preparing for the year 2000 by adapting
these concepts now.
Implementation: This will require three highly interrelated, but distinct,
activities benchmarking, leadership, and total quality management:
1. Establish benchmarking: "Benchmarking is a continuous search for and
applications of significantly better practices that leads to superior
competitiveperformance"
(Adams: 1992). It involves identifying
organizations which perform a task exceptionally and learning their tactic.
Firms using benchmarking generally have a number of organizations they
benchmark against from both inside and outside of their industry.
"Although benchmarking is a measurement process and results in
comparative performance measures, it also describes how exceptional
performance is attained. The practices which lead to exceptional
performance are called enablers. Thus, the process of benchmarking
149

results in two types of outputs: benchmarks, or measurements of
comparative performance and enablers, representing the theory behind the
processperformance."
(Watson: 1993)
2. Implement a leadership style of management: Leadership is based upon
two primary factors:
Motivation: Strategies are generally based on an organizational skill that
is, in turn, based on people. The level and nature of their motivation
affect strategy implementation. There are, of course, a variety of ways to
motivate people, including fear of losing their job, financial incentives,self-
fulfillment goals, and the development of goals for the organization or
groups within the organization such as teams or quality circles. A study by
McKinsey concluded that the successful firms studied treated employees as
important in many tangible and intangible ways that affected motivation.
In particular, people were trusted and given the control and opportunity to
make things happen. Further, individual status was enhanced by titles.
There was wide use of celebration, sometimes corny, but usually oriented
to recognizing individuals.
Culture: An organizational culture involves three elements:
A set of "sharedvalues"
or "dominantbeliefs"
that defines an
organization's priorities. These values and belief underlie a culture
by specifying what is important.
150

A set of norms of behavior. These are the informal rules that
influence decisions and behavior throughout the organization.
Symbols and symbolic activities used to develop and nurture those
shared values and norms. The history of struggle at Park's
beginning, a monthly birthday party for employees, etc. would all
serve this function.
In The 100 Best Companies to Work For in America, the authors describes
characteristics of the firms. Most of these relate to leadership styles
(Levering and Moskowitz, 1994):
If a company is a good place to work, its employees make no secret
about it. The better employers usually acquire a good reputation
within their industries and with their communities. People are
proud to work for companies that treat them well. They become
linked to these companies in more than just an employer/employee
relationship. It's the presence of this feeling more than any other
that sets these 100 best companies apart. They exhibit a people
orientation, sense of community, trust, pride, freedom, and
allowance to make mistakes.
Implement total quality management: During the 1990's, the term
paradigm shift has become a grossly over-used term and it seems that even
a change in the wind direction is called a paradigm shift by some. On-the-
other-hand, some experts have suggested that there have been two
paradigm shifts in history: the invention of the railroad and the invention
of total quality management. While TQM has become a fad in many firms,
it has paid huge dividends for those organizations which have truly adopted
and implemented it seriously and professionally. TQM is defined as "an
151

effective system for integrating the quality development, quality
maintenance, and quality improvement efforts of the various groups in an
organization so as to enable production and service at the most economic
levels which allow for full customersatisfaction"
(Ishikawa, 1985) "Another
roadblock is management's supposition that the... workers are responsible
for all trouble. ..The workers are handicapped by thesystem."
(Deming,
1975). Collier (1993) suggests that "service/quality performance is the best
competitiveweapon"
and that "service/quality performance is more difficult
to manage than product/qualityperformance."
And he stresses that "to
truly understand service/quality as a competitive weapon, one must truly
understand service management. Service management is the bedrock of
ideals, principles, and philosophy of management upon which to base an
effective service/quality improvementeffort."
To implement a paradigm shift within Park Christian School will require
more than a weekend seminar and implementing it Monday morning. Park must
seriously contemplate if it wants to achieve the benefits of organizational
reengineering which will result from adopting this specific strategy. If the answer
is yes, a long-term program should be established. A quality expert such as Tim
Peschong could serve as a valuable resource for both design and implementation.
Recent books that can provide insight include Using Quality to Redesign
School Systems by Peggy Siegel and Sandra Byrne; Total Quality for Schools: A
Guide for Implementation by Joseph C. Fields; Quality & Education: Critical
152

Linkages by Betty McCormick; Flight of the Buffalo by James Belasco and Ralph
Stayer; and The Fifth Discipline by Peter Senge.
Time line: By September 1, 1994, determine if the paradigm shift will be
adopted. If so, during the next twelve months, start developing expertise.
Responsibility: Board and Administrator.
153
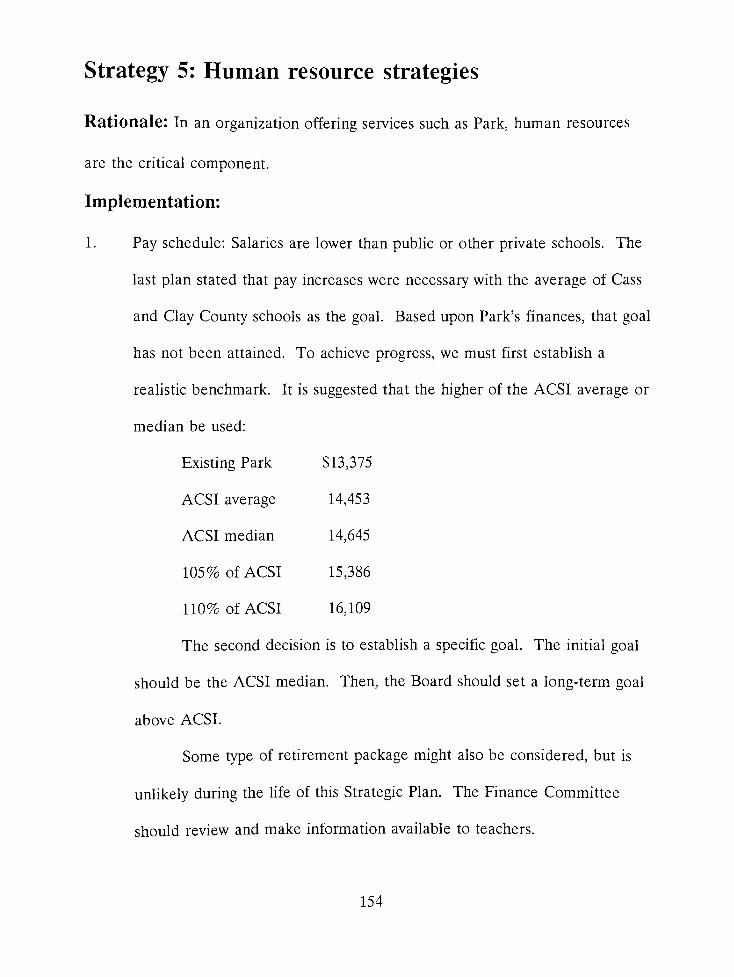
Strategy 5: Human resource strategies
Rationale: In an organization offering services such as Park, human resources
are the critical component.
Implementation:
1. Pay schedule: Salaries are lower than public or other private schools. The
last plan stated that pay increases were necessary with the average of Cass
and Clay County schools as the goal. Based upon Park's finances, that goal
has not been attained. To achieve progress, we must first establish a
realistic benchmark. It is suggested that the higher of the ACSI average or
median be used:
Existing Park $13,375
ACSI average 14,453
ACSI median 14,645
105% of ACSI 15,386
110% of ACSI 16,109
The second decision is to establish a specific goal. The initial goal
should be the ACSI median. Then, the Board should set a long-term goal
above ACSI.
Some type of retirement package might also be considered, but is
unlikely during the life of this Strategic Plan. The Finance Committee
should review and make information available to teachers.
154

Classroom budgets for supplies and other items impact teachers
significantly and individual expenditures, in effect, reduce salaries. These
budgets should be evaluated in light of teacher needs during the next year.
Some schools have started paying for service on time-intensive and key
committees. Of course, perks such as the ability to take ones child to a
doctor and similar type of rewards send very strong messages that
employees are valued.
2. Staff salaries: Staff salaries have not been evaluated as part of the planning
process and thus, it is essential that this be completed during the coming
year.
3. Using the expertise of someone knowledgeable in writing job descriptions,
prepare new job descriptions. Appendix 5 provides a sample from the
Moorhead Public School. Strive for a maximum of ten or preferably fewer
tasks with fifteen as the absolute maximum. Tasks should be more general
in nature giving the employee more discretion. Further, tasks should be
prioritized and have a percentage of time allocated to each. Design job
descriptions to guide and encourage people, and involve the individuals
performing the job in writing the description. In addition, a performance
review instrument should be developed for each type of job position. This
instrument should also reflect a reasonable number of evaluation criteria
and should be developed by the Administrator and teachers. See Appendix
6 for a sample from Moorhead State University.
155

4. While the current grievance procedure appears to be effective, it should be
reviewed to insure that each step is clear, the requirements of each step
are clearly defined, notification for each step is clear, and that the
procedures work effectively. The grievance procedures should cover both
employees and parents.
5. It appears most Park teachers do not have a formal professional
development plan. For Park to remain a quality educational institution, it
is essential for teachers to plan for additional training. Training can
develop competence, deepen commitment, improve ability to handle
responsibility, build self-esteem, strengthen communication skills,
encourage personal and professional growth, create stronger team building,
and contribute to spiritual growth. All of these benefit both teachers and
Park and therefore, it is recommended that Park establish a more
aggressive training and development program. This will involve:
Determine a level of funding that fits within the budget, and method
to allocate limited funds between teachers.
Identify training that Park teachers believe they need.
Determine what types of programs Park will fund and establish
specific policies. The policy should also identify types of funding
available such as funding for substitutes, payment of tuition for
Saturday programs, etc.
156

Financial, managerial, and psychological support systems should be
established to encourage individual teachers to design and
implement development programs which are not part of their
evaluation process.
6. During the interview process, teachers revealed feeling time pressures.
Activities and time required of teachers during evenings should be
reviewed, with the goal of reducing the commitments. Perhaps, the best
strategy is to review and prioritize each activity using a zero base budgeting
approach.
Time line: Tasks 1 and 2 are ongoing, but goals should be established during
1994-95. Tasks 3 and 6 should be completed during the 1994-96 school years.
Task 4 is fall of 1994, while task should be addressed during the 1994-95 school
year.
Responsibility: Tasks 1 and 2 should be completed by the School Board and
Finance Committee. Task 3 should include the person performing the job and
their supervisor with the help of an expert. Tasks 4 and 5 is the responsibility of
the School Board and Administrator. Task 6 should be developed by the
Administrator and teachers.
157

Strategy 6: Evaluate Park's program offerings
Rationale: The interview and research process revealed several program
offerings which should be examined to determine the specific purpose and
evaluate if the purpose is met by the current programs.
Implementation:
1. Chapel: The 1993 survey revealed that satisfaction with chapel has
increased significantly. Yet, the interviews seemed to reveal a concern that
chapel may not be as effective as Park would like. To address this issue,
review the purpose of chapel. Is it designed to provide teaching? Or
worship? What is the specific goal Park wants to achieve during chapel.
What age levels should be combined? Are there better ways to use
chapel? Should chapel be eliminated and the time spent on Bible in the
class room? Is the current focus on Bible in the class room adequate to
meet the needs of students? Are the students getting the same information
too many times? How does chapel fit with the scripture training in the
classroom, church, Sunday School, and midweek church programs? Chapel
should be reviewed to establish guidelines which enhances it and share
those guidelines with chapel presenters.
2. A comparison of the Park Handbook with other handbooks indicated that
it was excellent. However, areas which can be enhanced are displayed in
Appendix 2.
158

3. Role of grades 7 and 8: The interview process revealed that there is not a
common vision for the purpose or goals of grades 7 and 8. Therefore, it is
essential that a common vision be created by identifying the specific
purposes and goals for these grades. At this time, these grades appear to
be an extension of the elementary school. Is this what we want, or do we
want a Junior High? The initial step is to identify alternatives for grades 7
and 8. Next, a model should be chosen from among the alternatives. This
is followed by developing strategies designed to achieve the goals specified.
And the last step is to communicate to everyone the specific goals and
objectives identified. Appendix 3 contains some suggestions regarding
alternatives for grades 7 and 8.
4. Evaluation of course offerings: As part of the review of grades 7 and 8,
and the evaluation of grade 9, Park should conduct an evaluation of course
offerings. This would include examining what students need to be
prepared for the future. Verbal and written communication, math, science,
and other potential needs should be explored.
5. Grade 9 and High School: A number of people want Park to expand into
grade 9 and eventually a complete High School. The concept of a Pre-
Kindergarten has been suggested. Others have suggested a split school in
which the Junior High is in a different facility. And a variety of other
strategies have been advanced to enable Park to add additional grades.
159

Further, some see Park expanding geographically and establishing schools
in other communities.
Each of these ideas have merit. But the critical issue is to identify the
proper strategy within God's timing. The Board should review the current
situation and make a determination of the specific strategy. Following are
some thoughts:
The last Strategic Plan revealed that High Schools have much higher
costs. Even a grade 9 forces Park to add at least a biology lab.
There is a belief that the cost of serving more students is only the
teacher's salary. However, the financial data in Tables 38 and 40
reveals that the cost per student has generally increased when
student enrollment increased.
By adding a grade 9, Park is likely to retain more Fargo students
where grade 9 is Junior High. However, a grade 9 makes the
transition harder in Moorhead and West Fargo where grade 9 is
presently High School.
Grade 9 will have both fundraising and student recruitment
implications with Oak Grove.
Before adding grade 9, Park should determine the specific strategies
for grades 7 and 8. (See task 3 of this strategy).
160

While the consultants believes that funding for buildings and other
costs should be in hand before any projects are started, others
believe that Park needs to step forth in faith and establish a grade 9.
Students interested in extracurricular activities are not likely to use
grade 9 at Park because it delays entry into the High School
programs.
In the past, the teachers at Park have been asked to bear the cost of
the projects and today, their pay remains relatively low. In all
probability, adding a Junior High will come at the cost of giving
teachers pay increases.
Overall, the consultants believe that this decision has huge implications and
should be carefully evaluated before proceeding. Based upon current costs
of educating each student and the current financial situation, it appears
that grade 9 is still out beyond the year 2000. However, because of the
high level of interest, the School Board should take a formal action to
consider a grade 9 now, or at some time in the future. The consultants
recommend that the Board consider a feasibility study for the school year
2000-01 and communicate this clearly.
6. South Fargo: The population shift towards South Fargo needs to be
addressed by Park. During the previous planning process, a remote
Kindergarten or Pre-Kindergarten in South Fargo was discussed, but not
implemented, to serve as a feeder for the Moorhead campus. At this time,
161

a feeder will create a problem for Park because the current enrollment in
Kindergarten through grade 5 is almost full, and there would be no room
for the students from the feeder system. In addition, remote sites tend to
create complex management problems. And a Pre- Kindergarten will
directly compete with some sponsoring churches.
Considering the current finances, Park should address the South Fargo
situation by modifying the bussing system and should not consider remote
sites. However, this should be reviewed at least every two years, because it
will eventually need to be addressed. If a second site is considered, the
political implications of locating in a church building should be seriously
considered. Potential customers might see the School as related to that
church, rather than to Park.
7. Enrollment management: Park has grown because of excellent recruitment
and retention. As Park plans for the future, the growth of the past several
years potentially could create a false euphoria. Market share has
increased, and the number of total students is projected to continue to
increase in the total community. However, Park's growth has resulted from
filling the upper grade levels through much more effective retention.
Kindergarten enrollments, while up, have increased less than the other
grades. As the large Kindergarten sections of the past have moved through
the system, enrollment growth occurred naturally. This growth is ending
because the last small eighth grade class is graduating.
162

To plan for the future, analysis of enrollment by church, geographic
area and other factors should be constantly monitored to insure that we
can proact to any emerging trends. If retention is more difficult in the
upper grades, determine what can be modified to retain these students.
Kindergarten enrollment should be studied each year to determine if Park
should go to three sections. The long-term trend in Kindergarten becomes
critical in the overall management of enrollment. Further, make
enrollment projections for each grade for the next five years, using the
public school information. Utilizing "what if scenarios, forecast realistic
projections and determine the impacts on capacity and budgets.
Time line: Tasks 1, 3, and 4 should be completed during the 1994-95 school
year. Task 2 should be completed for the 1995-96 Handbook. Task 5 should be
completed during the fall of 1994. Tasks 6 & 7 are ongoing.
Responsibility: Tasks 1, 3 and 4 are the responsibility of the Administrator and
teachers. Task 2 should be completed by the Administrator and administrative
staff. Task 5 is the responsibility of the School Board. Tasks 6 and 7 are the
Administrator's.
163

Strategy 7: Marketing program
Rationale: Existing marketing is strong, but it is also the link to our customers,
and therefore, should always receive a major focus. Many of the people doing the
marketing, such as office staff, have outstanding abilities, but have no formal
training in marketing.
Implementation:
1. Conduct marketing research to identify customer and non-customer
perceptions of Park. There could be substantial savings if Park worked
with other private schools such as Grace, Oak Grove, or the Catholic
School System.
2. Conduct marketing research of graduates to determine their reaction to
Park after several years in High School.
3. Continue developing the literature for upper grade levels. Because of the
unique marketing situation at this level, special marketing programs are
likely required.
4. As is currently being done, use an advertising agency when possible to
develop brochure copy and concepts.
5. Provide marketing training to Admissions Counselor and Development
Coordinator.
164
6. Provide training for office staff in desk top publishing, writing, andlayout
to create an even more effective newsletter and other communications to
parents.
7. For admissions activities, develop a strategic marketing plan which
identifies tasks to complete each year, and assigns responsibility for
completing each.
8. Review literature display areas in each church to determine condition and
possible improvements. Would wall hung units improve display and be
approved by churches? Apparently, this is in process by Board members at
the present.
Time line: Tasks 1 and 2: Start with one project during the 1994-95 school year
and develop an ongoing research program when free research is available. Tasks
3, 4, and 7 should be addressed during the 1994-95 school year. Tasks 5 and 6
can be handled during the 1994-95 school year and task 8 is ongoing.
Responsibility: Tasks 1, 2, 3, and 4 should be handled by the Administrator
and the Admissions Counselor. A consultant could help with 1 and 2. Tasks 5
and 6 should be handled by the Administrator and the individual involved. Task 7
should be handled by the Admissions Counselor and task 8 by the Admission
Counselor and Board.
165
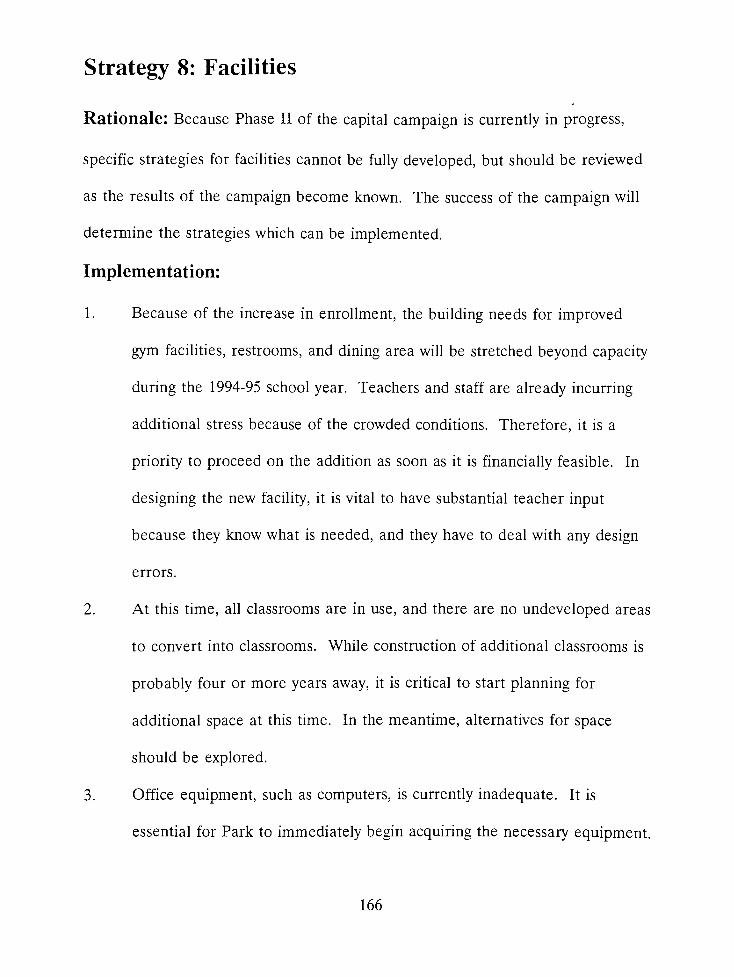
Strategy 8: Facilities
Rationale: Because Phase II of the capital campaign is currently in progress,
specific strategies for facilities cannot be fully developed, but should be reviewed
as the results of the campaign become known. The success of the campaign will
determine the strategies which can be implemented.
Implementation:
1. Because of the increase in enrollment, the building needs for improved
gym facilities, restrooms, and dining area will be stretched beyond capacity
during the 1994-95 school year. Teachers and staff are already incurring
additional stress because of the crowded conditions. Therefore, it is a
priority to proceed on the addition as soon as it is financially feasible. In
designing the new facility, it is vital to have substantial teacher input
because they know what is needed, and they have to deal with any design
errors.
2. At this time, all classrooms are in use, and there are no undeveloped areas
to convert into classrooms. While construction of additional classrooms is
probably four or more years away, it is critical to start planning for
additional space at this time. In the meantime, alternatives for space
should be explored.
3. Office equipment, such as computers, is currently inadequate. It is
essential for Park to immediately begin acquiring the necessary equipment.
166

Since the biggest need is probably computer, Park should identify a system
which will last for many years and then start purchasing the individual
components. It is likely that a networked system is necessary.
4. Interior and exterior maintenance and improvements such as carpeting,
parking lot improvements, landscaping, and playground equipment will
become a regular expense as the building and grounds age. To prevent
surprises and negative budget impacts, all anticipated maintenance needs
for the next five years should be identified, and priorities established.
Time line: Tasks. 1 and 2 do not have a time line. Tasks 3 and 4 should be
completed as soon as possible, and before the end of 1994.
Responsibility: Tasks 1 and 2 are the responsibility of the School Board,
Finance Committee, and Administrator. Task 3 includes the Administrator and
Finance Committee. Task 4 involve the Finance Committee.
167

Strategy 9: Finances
Rationale: Park's financial stewardship has been outstanding during the past
several years. Therefore, the situation appears very rosy, especially as a result of
the success of Phase I of the capital campaign. But while the situation is very
positive, normal operations will force Park to conduct an ongoing development
program.
Implementation:
The following strategies have been developed by members of the Finance
Committee:
1. Launch a gap or Phase III capital campaign to fund the annual operating
needs which are not met by tuition and fees for 1995-96 and future years.
Given the transitional state of the development effort, appropriate
personnel need to be hired and effective planning initiated in the near
future.
2. While existing accounting practices are adequate, the following can
improve overall performance:
Bank accounts could be consolidated to allow fewer reconciles and
better investment potential.
Monthly financials could include payables to provide better
information regarding cash flow.
168

To assure that funds are credited to the correct account, the
automated development system should be reconciled monthly to the
financial system.
The financial processes in the business office and development
should be integrated better. Further, admissions needs to be
informed when payments are received for new enrollments, and the
business office needs to be advised to bill new students.
Financial information provided to the School Board: The Board currently
receives monthly statements and a cash report monthly, but these should be
replaced by the balance sheet of the School. All Board financial decisions,
should include both a request for funds and the overall financial impact of
the decision.
Lines of communication should be improved between Finance Committee,
School Board, Development, Administrator, Strategic Planning, Facilities,
Curriculum and Administration. This is most critical within the budgeting
process, which should include input from the above and teachers.
Finance Committee operations: Strategy 3 discusses School Board
operations and some concepts are transferable to the Finance Committee.
Further,
Training should be provided regarding the information presented to
the Finance Committee and how the information can be
interpreted.
169

Preliminary budgets should be available to Committee members in
advance of significant financial decisions (tuition rates and teachers
salaries).
The role of the Finance Committee needs to be clearly defined to
utilize the depth and expertise of Committee members. The level of
involvement in developing budgets should be reviewed, and specific
roles identified.
6. Finance Committee composition: Generally, committees are designed to
provide wealth, wisdom, and work. At this time, the composition of the
Finance Committee does not appear to include enough individuals that
have access to the wealth within the community.
Time line: Task 1 must be completed by October 31, 1994. Task 2, 3, 4, 5, and
6 should be considered during the fall of 1994.
Responsibility: Task 1 is the responsibility of the School Board, Finance
Committee and Administrator. Tasks 2 and 3 are the responsibility of the
Finance Committee, Administrator, School Board, and Larson Accounting. Tasks
4, 5, and 6 are the responsibility of the Finance Committee and the School Board.
170

Table 46: Suggested time lines and responsibilities to complete strategies and tasks
Strategies and
tasks
Time line for
completion
Responsibility to complete task
School Board 1 Administrator 1 Teachers | Others
Strategy 1
Task 1 Ongoing X
Task 2 1994-95 school year Committee
Task 3 1994-95 school year X X Consultant
Task 4 1994-95 school year X X Consultant
Task 5 Ongoing Office staff
Task 6 1994-95 school year X
Strategy 2
Task 1 & 3 Ongoing 1 Board member
Task 2 1994-95 school year X
Task 4 1994-95 school year X X
Task 5 & 6 Ongoing X
Strategy 3
Task 1, 2, & 5 1994-95 school year X Consultant
Task 3, 4, & 7 Start August 1, 1994 1 Board member X
Task 6 Fall of 1994 X
Strategy 4 September 1, 1994 X X
Strategy 5
Task 1 & 2 Ongoing X Finance committee
Task 3 1994-96 school years X Person in position &.
consultant
Task 4 Fall 1994 X X
Task5 1994-95 school year X X
Task 6 1994-96 school years X X
Strategy 6
Task 1 1994-95 school year X X
Task 2 Before 1995-96
handbook
X Office staff
Task 3 & 4 1994-95 school year X X
Task 5 October 1994 X
Task 6 & 7 Ongoing X
Strategy 7
Task 1 & 2 When available for free X Consultant &
Admissions Counselor
Task 3 & 4 1994-95 school year X Admissions Counselor
Tasks 5 & 6 1994-96 school years X Individual involved
Task 7 1994-95 school year Admissions Counselor
& consultant
Task 8 Ongoing X Admissions Counselor
Strategy 8
Task 1 & 2 No time line X Finance Committee
Task 3 As soon as possible X Finance Committee
Task 4 1994-95 school year Finance Committee
Strategy 9
Task 1 Immediately X X Finance Committee
Tasks 2 & 3 Fall of 1994 X X Larson Accounting
Tasks 4, 5, & 6 Fall of 1994 X Finance Committee 1
171

Appendix 1: Caleb Report
Park teachers completed Caleb, or vision, statements revealing what they
believed Park could become. Following is a summary of their responses.
A. Description of Park Christian School atmosphere
"God is in control. He has the plans. He will go before us wait on Him.
Be of good cheer. Be an overcomer. This is His school. His Name will be
lifted high. Come before Him with praise and worship. Obstacles will be
overcome. He will bringvictory."
I see God's people, carrying out God's plan
Needs being met
God's love and care has formed a loving, caring, praying, family
Faculty and staff strong role models for students, encouraging
Respect for quality education
Continue a strong standard of teaching from God's Word
To always remember and humbly appreciate the awesomeness of God's
provision to Park
2 Park atmosphere will be warm, serious, but joyful, openhearted,
inclusive of differences
Where Jesus is always kept in first place
School with strong trust in, and dependence on, God
2 Where people support one another in prayer
Families continue to know one another, even with growth
172

Communication between administration, faculty and parents withJesus'
love and compassion
Many children going on to the mission field
2 Children grown to be true disciples of Christ and lights in the world
Students would all accept Jesus as Lord and Savior before leaving
Students with effective Biblically-based decision-making skills
Students who become tomorrow's leaders
2 Additional sponsoring churches with stronger church support base
-stronger network of people within sponsoring churches
-developed CAP program
3 High parent involvement
-School -PTF -Activities -Prayer support
-Volunteer efforts -Volunteer coordinator
3 Increased enrollment
Active and enthusiastic Alumni Club
A developed network of professional services: counselors, pastors,
consultants, architects, lawyers, doctors, etc.
A strong Board with varied professional background and specific portfolios
B. Staff
1. New positions:
2 Principal for teacher support and evaluation
7 Working with special needs children (gifted, Id, etc)
6 Full-time Counselor or Family Therapist
173

4 Full-time paid school librarian
4 Two janitors (staff of janitors with pagers)
Janitorial service everyday
Evening custodian to supervise evening use of building
Computer instructor
Chaplin to coordinate chapel & oversee Bible curriculum and
spiritually challenge students and staff
PE teachers (at least 2)
Recess supervisor
Mechanic for buses
Volunteer or paid Teacher's Aide staff
Health technician on staff
Full-time art teacher for expanded art program
An aid for each department
Staffing for a 9th grade
2. Staff development:
Ongoing staff development
PCS staff utilized to full potential working in unity
Teacher specialization
Spiritual and intellectual growth & physical blessings for
teachers and staff of PCS
More planning time for teachers during the day
174

C. Outreach to the community
PCS Consulting Services well-known for quality of program and resources
available for other Christian Schools
A resource for all community families
Community education programs offered to adults in evening at school
Tutoring classes held at PCS in evening
3 Higher community awareness
A"safe"
place for children
5 Testimony to community of interdenominational unity
2 Bring educational leadership to area -educational speakers to encourage
the entire FM area in walk with God
D. Computerization
2 Computer generated report cards (including attendance)
Computerized library card catalog with access to local libraries
CD ROM equipment
Computerized class scheduling
Computerized milk, juice and lunch count system
Newsletter and events on phone access recording
Larger, better-arranged computer lab
Networked office computer equipment with modem access
Multimedia computer system for library and computer classes
2 Office computers for each with network
Hook up with Denise's computer with her eventually in office
175

Functioning computer in every classroom
E. Equipment
Newer buses with automatic shifts
LCD screen for use with computer and overhead projector
2 Overhead projectors and screen in every room
Intercom in every room
F. Finances
Our own finance department with fully trained staff
7 More equitable (big raise) pay scale for teachers/staff
2 Adequate scholarship funds for needy families
2 Reach capital campaign goal and beyond
Unlimited classroom funds
Our financial needs met so we can give to those in need
Endowment- enough to give $60,000 in scholarships without touching
budget
Finances for staff development courses
Continued financial blessing
Raising money to ease burden of tuition
G. Facilities
1. Building:
7 New classrooms or buildings
Large music room
176

Bus barn large enough for all buses equipped with mechanics
Air conditioning in all areas to use school in summer
10 New gym
-Staging with curtains
-Locker rooms
-2 Bleachers
-2 Attached kitchen/cafeteria, with serving windows
-Big
2 School cafeteria area
-Magnetic cards instead of hot lunch tickets
4 Kitchen
-2 Fully equipped and licensed with staff
-Completely new, range and sink included
Library improvements
-Computerized
-CD Rom Equipment
-More reference and research materials
-Adult/parent section for checkouts by PCS parents
-Staff development video library
-Video library for curriculum areas
Office space
-2 Expanded office space for administrative staff with
cabinets and storage
177

Room for a PE teacher with phone
2. Outdoor facility:
School grounds have been improved aesthetically with shrubs
Increased surfaced parking area
5 Expanded playground area with athletic fields developed
2 Playground equipment
Burlington Northern field donated to PCS
Track
Football field with bleachers
Baseball diamond
H. Expansion
2 Add 9th grade
3 A more defined Junior High setting- separate
6 Add 9 through 12
4 Preschool with equipment
2 Two Kindergarten sections
Three sections for each grade level
Cap class size at 20 or little more
Longer class periods: 45-50 minutes
Latchkey programs
After school programs (Odyssey of the Mind/Language)
Vacation/ day camp programs
Junior High Music Program
178

Expanded extracurricular activities: drama, speech, computer, math,
science, video, art, foreign language
Expanded music program, including student performance
Broadened areas of bussing in community
Junior High and Senior High fall retreat to challenge students and develop
relationships for the coming year
Mr. Norton serving as Superintendent to:
A main administration building
Four satellite schools, each with an Administrator and
Principal in:
Grand Forks
Bismarck
Sioux Falls
Fergus Falls
The present staff of PCS is now distributed between the four
campuses mentoring and discipling the younger teachers. Teachers
for these schools are chosen on their growing spiritual lifestyle,
rather than the fact they are Christians.
179

Appendix 2: Suggestions to Enhance Park Handbook
1. Grading system including a clear definition of each percentage and letter
grade; outline of grading scale; well-defined grading system for each
subject, and for each grade level.
2. Definition of child abuse, and Park's behavior policies clearly defining rules
for all students at each grade level.
3. Immunization policies according to law. List of communicable diseases,
including normal contagion periods common to school children from the
Communicable Disease Regulations, Fargo Community Health Center.
Disaster emergency procedure to make parents aware of our plans.
Special services, procedures for admission or transfer out, and
definition of acronyms.
Purpose of standardized testing, dates to be administered, specific
tests administered at each level, and use of test results.
Active role of parents in child's education, including ways they can
help their child be successful.
Review Handbook for inappropriate gender-specific pronouns (for
example: see Mission Statement of PTF).
180

Appendix 3: Ideas to Create Junior High
Several teachers brainstormed ideas to enhance the Junior High program.
Following are the results. Please note that these are brainstorm results and have
not been refined or evaluated for overall integration into the Park program.
1. Create an area primarily for the Junior High. This separation would
eliminate the disruption the students cause as they pass between classes.
This location would also be an excellent spot to add a set of bathrooms, to
be used only by these students.
2. Schedule a different chapel time which would be targeted specifically for
this age. Possible speakers may include Christians from various careers or
athletes who would give a testimony of faith and encouragement. The final
outcome should be consistent with the decision for chapel at Park.
3. Morning and afternoon announcements would be a benefit to the staff and
students. The Junior High students could collect announcements from
teachers at the beginning of the day and broadcast them over the intercom
system either a few minutes before school begins or a few minutes before
dismissal. This would encourage unity and promote a sense of School
spirit and pride in fellow students. Important items which could be
included:
Begin or end with prayer for entire School or Junior High
Short scripture verse for the day
Announce any special events for the day and after school events
Congratulate people who have accomplished something for Park
181

Today's birthdays
4. Student Council representation to allow the students to voice ideas on
various issues.
5. More options for elective classes within the constraints of facilities and
funding. These may include such things as home economics and
shop/woodworking/crafts, which are life skills. Debate, speech, Math
Challenge, Inventor Fair and other academic programs could also be
considered. These could be offered on a weekly, or one week a month
basis, whichever would be the easiest.
6. Extra responsibilities or privileges offered only at this level.
7. More/different sports such as football (with another school), tennis, soccer,
baseball. Some of these activities would need to be parent directed, but
would allow the students a broader option.
8. Separate bathroom facilities from younger students.
9. A Principal designated especially to deal with the Junior High needs.
10. Social functions for Junior High only. Possibilities may include: skiing,
bowling, lock-in, or a back-to-school retreat with a strong spiritual and
relational emphasis.
11. Organized clubs, such as speech, drama, or science. These could be
teacher and/or parent directed activities.
12. Optional work-study program for those who need a small tuition break.
Services could include vacuuming of classrooms, general cleaning of the
building or grounds surrounding, taking down or setting up chairs, etc.
182

Appendix 4: Aspen Brochure
183

Nonorotit Edition
0Aspen
une 1994
Dear Nonprofit Board Member.
Here s a pop quiz on board
teamwork. Pick the description below
that best fits your board:
A) Consensus is easily reached.
B ) Each item is discussed at length, some
times resulting in loud disagreement.
C) Several factions fight over everv issue.
If vou chose B or C. vour board
Get your board team to work better
To prevent problems that can undermine the effectiveness of
your board team, the Board Doctor offers these suggestions:
1) Identify each board member's personality traits.
Individuals with overbearing personalities may get in the wav
of effective teamwork. Consider the balance of personalities
when electing new members and forming committees.
2) Make everv effort to respectyour board peers. Dis
plays of disrespect and rudeness in the board room can easily
and permanently scar the board team.
3) Realize thatyour view won't always prevail No matter
how stronglv you feel about an issue, it the majority opts tor a
different view, accept it and support it.
isn t a team. In my experience, these two
statements accurately describe how many
hoards act. For the best possible board
team, you should strive for option A.
Here s one good way to get there...
Board Member Peggy Schantz tells
me mat the board team is only as strong
as its committees. The path to an
effective board team is for board members
to study issues in committee and then
make recommendations to the full board.
she says. Schantz is right on the money.
Committees let members work in small.
less-structured groups that quickly bond
and allow for speedy consensus on issues.
The committee structurefosters
sound decision-making on thefull
board. When members work well to
gether at the committee level, thev re more
likely to do the same at board meetings.
'Teamwork is essential. The best
wav to develop it is to appoint members to
serve on committees then let them de
velop trust, confidence and respect in one
another at that level. Once thev re working
well together in committees, teamwork in
the board room follows
Advice for new board chairpersons: Manage those meetings!i
Nonprofit Board Chairperson John
Donohue says that many responsibilities go
with the top board leadership position.
But none is more important than knowing
the mechanics of the board meeting.
Here are six board meeting tips he
savs chairpersons ought to keep in front of
them at all times...
1) Prepareyourselffor han
dling complex issues. The board
chairperson must understand every difficult
issue the board faces, savs Donohue. "Bv
working closely with the executive director
and doing a lot of advance preparation. I'm
able to keep a firm hand on topics that bynature are pretrv sticky.
2) Create a comfortable board
room setting. "The right environment sets
the tone for effective meetings, adds
Donohue. so place a pad and sham
Advising administrators and boards in the
US and Canaaa for more than 1 0 years

pencii ateven-
cnair. along witn tresli
copies ot the agenda and minutes or the
previous meeting. When memners arrive
and take their seats, they'll be ready to go.
You might even want to arrange with vour
administrator to provide refreshments.
3) Don't drop any surprises on
board members. "Handing a report to
members at a meeting and asking them to
read it and make an on-the-spot decision.
is a no-no. he savs. Board members
need time to digest information before thev
can form opinions. Hasty, ill-informed
decisions never help any nonprotit.
-i) Involve as many members as
possible. "Board members want to feel
needed. That's why I invite as many as
possible to give brief reports at meetings.
This keeps them from iust sitting there
watching the clock.
5) Focus board members on the
agenda. "One big problem at board
meetings is when the socializing aspect of
discussion gets out of hand. While impor-
\;nr. i tne
".eeung is unuer-
\\ av. comments
lot related to the
agenda should be
minimized. Were
busy people, and
we want to accom
plish the meeting
without wasting
time.
6) Talk
privately with
Board Chairman
John Donohue
board members ivho have a meeting
problem. "If I think board members are
unusually quiet < >r garrulous 1 take note
of this, sjys Donohue (Onnda. CA).
'These individuals may feel alienated from
the rest of the board or think their opinions
.ire being ignored. After the meeting. I
visit with them to draw rneir problems or
concerns out on the table Talking about
them usually gets the members back on
track for the next meeting.
The boardmember job description should include these duties
Have you ever wondered what
board members are charged to do
other than govern and make policy? Here
are three responsibilities Board Member
Nancv McFarland says should be included
in everv member's |ob description...
1) Planfor the groivth and
future of the nonprofit. "While the
executive director is hired to take care ot
dav-to-dav decisions, board members
should play a major role in making sure
that finances, staff and equipment are
sufficient to run a smooth operation, says
McFarland (Jonesboro. AR). "Sure, the
executive director leads the board in this
role, but he or she won't always be
around so planning for growth and future
needs must be a board priority.
2) Speak on behalfof the non
profit. Who does the organization touch?
Who doesn't it reach? These are the
KEPRODI l.TION OE THIS NEWSLETTER IN WHOLE OR FART Is sTRILTLY FORBIDDEN
i.mutations must lu\e tilt; consent ot tile publishersubscription inquiries in.iv he directed to Aspen I
I'jhlisners Int. . "JO I McKinnev circle. Erederit k Ml):i"
>l t I -sun-m.s-.s-1-r Editorial offices
ire located ac 150 Third Street. Box 22b. Akron. IA 51001. Please send editorial comments
:o this address or phone "12/568-2-418.
questions you need to ask yourself, says
McFarland. "Board members are the
nonprofit's biggest advocates and should
use their connections to spread the good
word about what the organization does.
For example. I'm on mv church's
social justice committee. Through that
group I provide information about mv
nonprofits services. In addition. I make
sure my church keeps a supply of our
brochures available for parishioners who
mav need our help.
3) Be an activefund raiserfor
the nonprofit. As a board member. I'm
aware of the financial needs of this organi
zation, she adds. "It's easy to see how
additional monies can help our programs
and services. I play an active roie in fund
raising events and in brainstorming other
wavs to increase our budget. Board mem
bers who participate at this level are an
invaluable asset to the nonprotit.
sincerely. Chuck Elliot
The Board Doctors;
< and board member! >
Asoen s Board & Administrator

Appendix 5: Job Description From
Moorhead High School
186

MOORHEAD SCHOOLSJOBDESCRIPTION
BAND GRADE SUBGRADE
JOB TITLE
TEACHER
DEPARTMENT DATE
IMMEDIATE SUPERVISOR:
PRINCIPAL
JOB SUMMARY:
The certified teacher develops lesson plans, conducts classroom instruction, evaluates and
assesses both instructional material and student performance. The incumbent meets with
parents, interprets student progress, and informs parents about student strengths,
weaknesses and/or programs.
TASK
NO. ESSENTIALDUTDSS
FRE
QUENCY
BAND/
GRADE
1. Develops and plans instructional activities,
lesson plans and/or individual educational
plans.
2. Conducts classroom instruction based on
established lesson plans or instructional units.
* Develops and decides on methods, approaches
and instructional aids to present material;
* Evaluates and assesses student performance
against lesson plans, need for re-instruction,
or need for new approaches;
* Reinforces material previously presented in the
classroom;
* Researches topics, materials and information
to improve instructional material
and information.
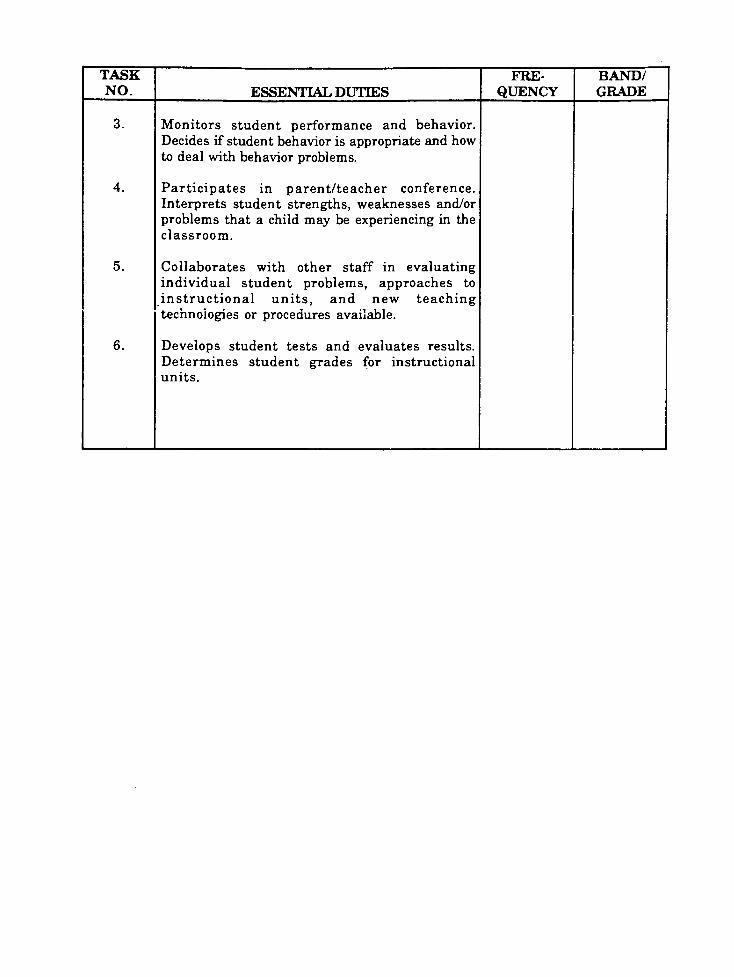
TASK
NO. ESSENTIALDUTTES
FRE
QUENCY
BAND/
GRADE
3.
4.
5.
6.
Monitors student performance and behavior.
Decides if student behavior is appropriate and how
to deal with behavior problems.
Participates in parent/teacher conference.
Interprets student strengths, weaknesses and/or
problems that a child may be experiencing in the
classroom.
Collaborates with other staff in evaluating
individual student problems, approaches to
instructional units, and new teachingtechnologies or procedures available.
Develops student tests and evaluates results.
Determines student grades for instructional
units.

MINIMUM QUALIFICATIONS:
BA7BA. in education. Teacher's Certificate in related areas of instruction.
PHYSICAL ACTrVTTY/REQUTREMENTS:
To perform the essential functions of the job, the incumbents must be able to perform the
following:
Talking, hearing/listening, and seeing/observing.
Sedentary work: Exerting up to 10 pounds of force occasionally and/or an eligible amount
of force frequently or constantly to lift, carry, push, pull or otherwise move objects includingthe human body. Sedentary work involves sitting most of the time. Jobs are sedentary if
walking and standing are required only occasionally and all other sedentary criteria are
met.

Appendix 6: Employee Evaluation Form
From Moorhead State University
190

State ot
Minnesota PERFORMANCE REVIEWIn compliance with Minnesota Statutes, Chapter 1 3.04, Subd. 2, we are informing you that the information collected through the use of this form will be
jsed to document your performance on an annual basis. The information may be used in decisions concerning advancement, reassignment, future trainingneeds, performance-related salary adjustments, and as evidence in contested disciplinary actions. It is legally required. Without it, there is no ob|ective data
on which to evaluate performance; therefore, no performance-based salary increases will be granted. This information is available to you, your supervisor,
personnel director, and other employees in your agency whose job assignment requires access.
EMPLOYEE'S NAME AGENCY/DIVISION
CLASSIFICATION TITLE WORKING TITLE (if different) POSITION CONTROL NUMBER
APPRAISAL
PERIOD to
DATE PERFORMANCE
INDICATORS ESTABLISHED
DATE REVIEWED
WITH EMPLOYEE
A. EVALUATION OF RESPONSIBILITIES identified in the employee's position description. Rate each principal responsibility using the ap
propriate evaluation factors of quantity, quality and time. If a factor is not included in the employee's performance indicators or is
inappropriate for measuring the employee's performance of a given responsibility, cross out that factor. Use the COMMENTS section
to support and/or qualify your evaluation. Comment (justification) must be given when either "BelowStandards"
or "Greatly ExceedsStandards"
is used.
RESP.
or
OBJ.
No.
>
H
CC
qrr0-
LU
H
O
EVALUATION
FACTORS
lUse onlv
ihose that hh'
inprupridte I
LEVELS OF PERFORMANCE
COMMENTS
Below
Standards
MinimallyMeets
Standards
FullyMeets
Standards
Exceeds
Standards
GreatlyExceeds
Standards
QUANTITY
QUALITY
TIME
( )
( )
( )
QUANTITY
QUALITY
TIME
QUANTITY
QUALITY
TIME
QUANTITY
QUALITY
TIME
QUANTITY
QUALITY
TIME
QUANTITY
QUALITY
TIME
QUANTITY
QUALITY
TIME
QUANTITY
QUALITY
TIME
QUANTITY
QUALITY
TIME
QUANTITY
QUALITY
TIME
QUANTITY
QUALITY
TIME
QUANTITY
QUALITY
TIME
page..of.

B. ADDITIONAL COMMENTS AND CONCERNS to be considered in the performance review. Add anything that is relevant to the
employee's performance not included in Section A.
C. OVERALL PERFORMANCE LEVEL OF EMPLOYEE. Check appropriate statement below. Consider all data in Sections A and B.
Performance is outstanding. The employee's achievements and contributions consistently exceed standards, expectations and
requirements.
Performance is above expectations. The employee typically performs at a higher level than the job requires.
Performance is satisfactory. The employee meets job requirements and expectations.
Performance is marginal. The employee meets some, but not all job requirements and expectations. Improvement is necessary.
Performance is unsatisfactory. The employee does not meet job requirements and expectations. Substantial improvement is
needed to justify retention in the position.
D. POSITION DESCRIPTION REVIEW is to be completed each year. Description should be revised if the position changes (need not
be rewritten each year). The position description must be entirely rewritten every three years. A copy of the employee's revised or
rewritten position description should be submitted to the agency's personnel office with a copy of the review form.
The current position description is:
I I an accurate reflection of the current responsibilities and performance standards.
I I revised to reflect changes in the position.
I I rewritten because it is three years old.
SIGNATURE OF RATER (I have completed
the above evaluation)
SIGNATURE OF EMPLOYEE (I have read
the above evaluation)
SIGNATURE OF RATER'S SUPERVISOR (I have reviewea
and concur with the above evaluation)
Date !
Date
Date

Bibliography
Adam, Paul R. (1992). Proceedings of Benchmarking Week 1992.
Houston, TX: American Productivity and Quality Center, Presentation
notes.
Albrecht, Karl (1992). At America's service. New York, New York: Warner
Books, p. 102.
Beadle, Mark R. (1985). Sources of revenue and Process of
development in Christian Fundamentalist schools. Unpublished doctoral
dissertation, University of Cincinnati, Cincinnati, Ohio.
Ceyer, James C, & Hunt, Thomas C. (1984). Religious schooling
in America. Birmingham, Alabama: Religious Education Press.
Collier, David A. (1994). The service/quality solution. Burr Ridge, Illinois: Irwin.
Deming, W. Edward (1975). On some statistical aids toward
economic production. Interfaces, 3, (4), August.
Dill, Steven P. (1987). An analysis of funding patterns of
Evangelical Christian schools in the Midatlantic Region according to size
and governed pattern. Unpublished doctoral dissertation, Temple
University, Philadelphia, Pennsylvania.
Ishikawa, Kaoru (1985). What is total quality management:
The Japanese way. Englewood Cliffs, New Jersey: Prentice Hall.
Levering, Robert, Moskowitz, Milton & Katz, Michael (1984). The 100 best
companies to work for in America. Reading, Massachusetts: Addison-
Wesley Publishing Company.
193