Strategic Planning Considerations for Expansion of Low ... · Strategic Planning Considerations for...
65
Strategic Planning Considerations for Expansion of Low-Income Tax Preparation Services in the Metropolitan Chicago Area Prepared for the Center for Economic Progress By Don Eggert Ben Emmel Bennett Javenkoski Princess Ojiaku Mallory Palmer Workshop in Public Affairs Spring 2015
Transcript of Strategic Planning Considerations for Expansion of Low ... · Strategic Planning Considerations for...

Strategic Planning Considerations for Expansion of Low-Income
Tax Preparation Services in the Metropolitan Chicago Area
Prepared for the Center for Economic Progress
By Don Eggert Ben Emmel
Bennett Javenkoski Princess Ojiaku Mallory Palmer
Workshop in Public Affairs Spring 2015

©2015 Board of Regents of the University of Wisconsin System All rights reserved.
La Follette School of Public Affairs
1225 Observatory Drive, Madison, WI 53706 [email protected]
For an online copy, see http://www.lafollette.wisc.edu/research-public-service/workshops-in-public-affairs
The Robert M. La Follette School of Public Affairs is a teaching and research department
of the University of Wisconsin–Madison. The school takes no stand on policy issues; opinions expressed in these pages reflect the views of the authors.
The University of Wisconsin–Madison is an equal opportunity and affirmative action
educator and employer. We promote excellence through diversity in all programs.
Table of Contents
List of Tables ................................................................................................................................ iv
List of Figures ............................................................................................................................... iv
Foreword ........................................................................................................................................ v
Acknowledgements ...................................................................................................................... vi
Executive Summary .................................................................................................................... vii
Introduction ................................................................................................................................... 1
Income and Wealth Inequality .................................................................................................... 1
Redistribution in the Tax Code ................................................................................................... 1
Tax Return Preparation ............................................................................................................... 2
Paid Preparation ...................................................................................................................... 2
Volunteer Income Tax Assistance: A Free Preparation Alternative ....................................... 2
CEP: Community-Based Implementation .................................................................................. 3
Research Approach: Market Analysis ........................................................................................ 3
Research Questions ..................................................................................................................... 4
Study Area .................................................................................................................................. 4
Operational Baseline: Current Conditions ................................................................................. 5
Site Operations ............................................................................................................................ 5
Clients ..................................................................................................................................... 6
Site Performance ..................................................................................................................... 8
Volunteer Participation ............................................................................................................... 9
Neighborhood Evaluation ......................................................................................................... 10
Operational Analysis: Strategic Planning Factors .................................................................. 13
Site Efficiency ........................................................................................................................... 13
Quality Review: Practical Barriers to Efficiency .................................................................. 15
Volunteer Life Cycle ................................................................................................................ 16
Motivation ............................................................................................................................. 16
Satisfaction ............................................................................................................................ 17
Retention ............................................................................................................................... 18
Neighborhood and Site Selection ............................................................................................. 19
Client Travel ......................................................................................................................... 19

Recommendations ....................................................................................................................... 21
Improve Site Efficiency ............................................................................................................ 21
Recommendation 1: Fully embrace data-driven analysis ..................................................... 21
Recommendation 2: Collect client service data throughout intake, preparation, and QR .... 22
Recommendation 3: Collect volunteer data throughout intake, preparation, and QR .......... 23
Recommendation 4: Conduct a detailed evaluation of the quality review process .............. 24
Increase Volunteer Satisfaction and Retention ......................................................................... 24
Recommendation 5: Improve the volunteer survey, rewards, and learning opportunities ... 24
Recommendation 6: Acquire data regarding employer-based volunteer participation ......... 25
Systematically Evaluate Expansion .......................................................................................... 26
Recommendation 7: Apply a quantitative framework to evaluate neighborhoods ............... 26
Recommendation 8: Adopt a comprehensive set of criteria to evaluate sites ....................... 27
Limitations and Additional Research ....................................................................................... 27
Limitations ................................................................................................................................ 27
Race and Ethnicity ................................................................................................................ 27
Surveys .................................................................................................................................. 28
Neighborhood and Site Evaluation ....................................................................................... 28
Areas for Further Research ....................................................................................................... 29
Decline in Average Refund ................................................................................................... 29
Promotion and Outreach ....................................................................................................... 29
Conclusion ................................................................................................................................... 30
Appendix A: Research and Data Analysis ................................................................................ 32
Literature Review ..................................................................................................................... 32
CEP Interaction ......................................................................................................................... 32
Public Data and CEP Internal Data ........................................................................................... 32
Interviews .................................................................................................................................. 32
Explanatory Notes ..................................................................................................................... 33
Terminology: Neighborhood, Community Area, and Townships ............................................ 33
Supplemental Data .................................................................................................................... 35
Appendix B: Return Preparation Costs to Filers .................................................................... 38
Appendix C: Volunteer Survey ................................................................................................. 39
Survey Design ........................................................................................................................... 39
Timing and Frequency .............................................................................................................. 39
Questions and Suggestions ....................................................................................................... 39
Appendix D: Evaluation of Client Travel ................................................................................. 41
Schaumburg–Roselle–Glendale ................................................................................................ 41
Northwest Chicago and Suburbs ............................................................................................... 42
West Cook Area ........................................................................................................................ 43
South Cook Area ....................................................................................................................... 43
Appendix E: Neighborhood Selection Framework .................................................................. 45
Client Travel ............................................................................................................................. 45
Community Partnerships ........................................................................................................... 45
Accessibility and Convenience to Volunteers .......................................................................... 46
Demographic Factors ................................................................................................................ 46
Median Household Income ................................................................................................... 46
Marital Status, Single Parent, and Family Size ..................................................................... 46
Benefit Recipients ................................................................................................................. 47
English Language Proficiency .............................................................................................. 47
Other Considerations ................................................................................................................ 47
Location of “Optimal” Clients .............................................................................................. 47
Security of Neighborhood ..................................................................................................... 48
Appendix F: Site Selection Criteria ........................................................................................... 49
Host Partner Relationship ......................................................................................................... 49
Availability of Public Transit and/or Parking ........................................................................... 49
Operating Service Hours ........................................................................................................... 49
Real Estate Valuation ................................................................................................................ 50
Works Cited ................................................................................................................................. 51
iv
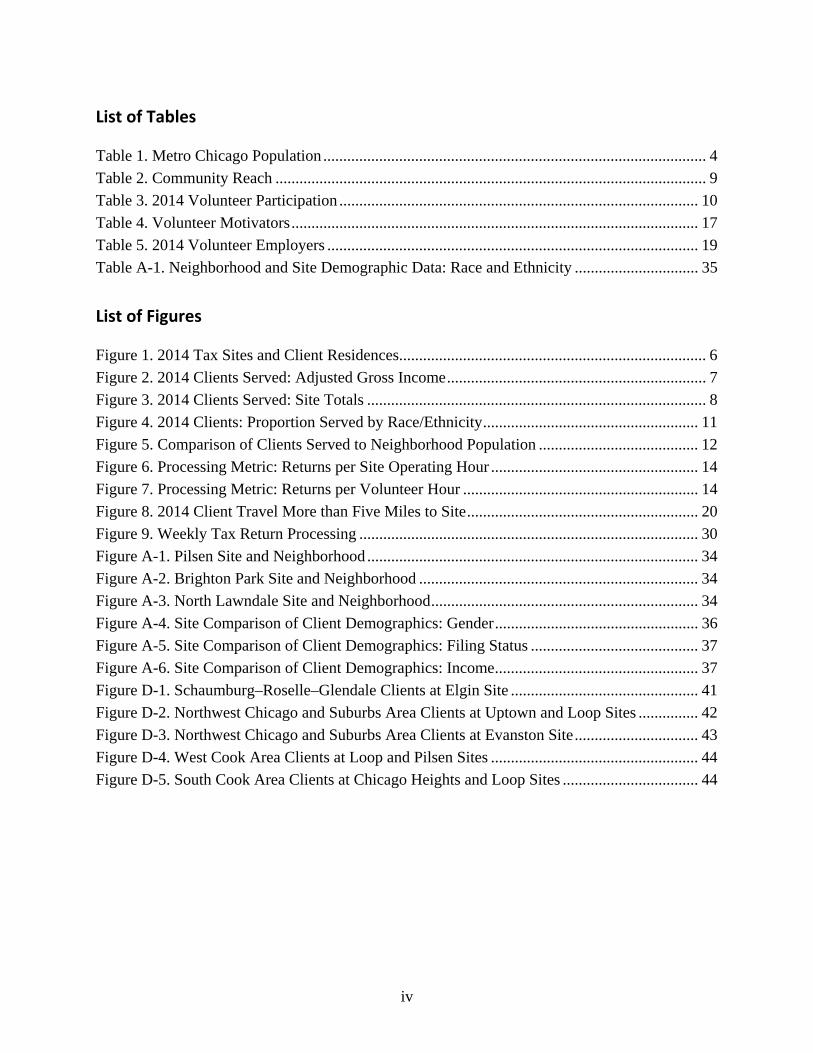
List of Tables
Table 1. Metro Chicago Population ................................................................................................ 4
Table 2. Community Reach ............................................................................................................ 9
Table 3. 2014 Volunteer Participation .......................................................................................... 10
Table 4. Volunteer Motivators ...................................................................................................... 17
Table 5. 2014 Volunteer Employers ............................................................................................. 19
Table A-1. Neighborhood and Site Demographic Data: Race and Ethnicity ............................... 35
List of Figures
Figure 1. 2014 Tax Sites and Client Residences............................................................................. 6
Figure 2. 2014 Clients Served: Adjusted Gross Income ................................................................. 7
Figure 3. 2014 Clients Served: Site Totals ..................................................................................... 8
Figure 4. 2014 Clients: Proportion Served by Race/Ethnicity ...................................................... 11
Figure 5. Comparison of Clients Served to Neighborhood Population ........................................ 12
Figure 6. Processing Metric: Returns per Site Operating Hour .................................................... 14
Figure 7. Processing Metric: Returns per Volunteer Hour ........................................................... 14
Figure 8. 2014 Client Travel More than Five Miles to Site .......................................................... 20
Figure 9. Weekly Tax Return Processing ..................................................................................... 30
Figure A-1. Pilsen Site and Neighborhood ................................................................................... 34
Figure A-2. Brighton Park Site and Neighborhood ...................................................................... 34
Figure A-3. North Lawndale Site and Neighborhood ................................................................... 34
Figure A-4. Site Comparison of Client Demographics: Gender ................................................... 36
Figure A-5. Site Comparison of Client Demographics: Filing Status .......................................... 37
Figure A-6. Site Comparison of Client Demographics: Income ................................................... 37
Figure D-1. Schaumburg–Roselle–Glendale Clients at Elgin Site ............................................... 41
Figure D-2. Northwest Chicago and Suburbs Area Clients at Uptown and Loop Sites ............... 42
Figure D-3. Northwest Chicago and Suburbs Area Clients at Evanston Site ............................... 43
Figure D-4. West Cook Area Clients at Loop and Pilsen Sites .................................................... 44
Figure D-5. South Cook Area Clients at Chicago Heights and Loop Sites .................................. 44

v
Foreword
This report is the result of collaboration between the Robert M. La Follette School of Public Affairs at the University of Wisconsin–Madison and the Center for Economic Progress, a nonprofit community-based organization in Chicago, IL. The objective of this project is to provide graduate students at La Follette the opportunity to improve their policy analysis skills while contributing to the capacity of partner organizations.
The La Follette School provides students with a rigorous two-year graduate program leading to a master’s degree in public affairs. Students study policy analysis and public management, as well as concentrate study in at least one policy area. The authors of this report are all in the final semester of their degree program and are enrolled in Public Affairs 869, Workshop in Public Affairs, at the University of Wisconsin–Madison. Although studying policy analysis is important, there is no substitute for engaging actively in applied policy analysis as a means of developing policy analysis skills. The Public Affairs 869 Workshop gives graduate students that opportunity.
Income tax policies are a significant mechanism for distributing income supports to working families. Yet, the process of accessing these supports requires people to accurately complete federal and state tax forms, a process that can be confusing and time confusing even for a trained professional. This report provides a framework to enhance the efficiency and effectiveness of income tax filing services targeted to economically vulnerable taxpayers. The potential market for tax preparation services varies by neighborhood and is changing over time. This report analyzes demographic and economic data, as well as administrative records, to develop a systematic approach to locating new tax preparation services.
I am grateful to the Center for Economic Progress for partnering with the La Follette School on this project. The staff of the center have been exceptionally generous with their time to support this project and have given the students engaged in this project high levels of professional respect. The students have collectively contributed hundreds of hours to this project, and in the process developed a genuine respect for the commitment and leadership of the center. The La Follette School is grateful for their efforts and hopes that this report proves valuable for the center’s strategic growth.
J. Michael Collins Professor of Public Affairs
May 2015 Madison, Wisconsin

vi
Acknowledgements
This project would not have been possible without the support of numerous individuals and organizations. Our final report is only the visible product of their assistance; the knowledge and insights they have shared with us go well beyond the printed page.
First and foremost, we express our sincere appreciation to our client: the Center for Economic Progress. Most notably, we benefited from ongoing interaction with President and CEO David Marzahl. Both he and his staff were collegial and responsive throughout the project. We were fortunate to have the Center for Economic Progress as a client. We also appreciate the advice and technical support provided by Chicago demographer Rob Paral (“Chicago Data Guy”) of Rob Paral and Associates.
We thank the numerous leaders and professionals from Chicago and elsewhere who willingly shared their time and expertise to enhance our understanding of relevant issues:
Lynne Bosley, Executive Director and President, United Way of Elgin Amy Brown, Program Officer, Ford Foundation Jeanette Castellanos-Butt, Vice President of Community Investments, United Way of
Metropolitan Chicago Christine Cheng, Executive Director, Ladder Up Christian Denes, Senior Policy Advisor, Chicago Department of Families and Social Services Sarah Halpern-Meekin, Assistant Professor, School of Human Ecology, UW–Madison Marjory Lewe-Brady, Director of Partnerships for Wellness, Safety, and Achievement, West
Chicago Elementary School District 33 Rudy Medina, President, Second Federal Community Credit Union Maggie Morales, Manager of Community Engagement, Lake County Community
Foundation Yvonne Orr-El, Chief Professional Officer, South South-West Suburban United Way Jennifer Ptak, Program Manager, Department of Planning and Economic Development, Cook
County Bureau of Economic Development Louisa Quittman, Director, Office of Consumer Policy, Office of Financial Education, U.S.
Department of the Treasury Jay Readey, Chair, Southland Human Services Leadership Council Carrie Thomas, Executive Director, Chicago Jobs Council Andrew VanSingel, Supervising Attorney and Director, Low Income Tax Clinic, Prairie
State Legal Services Susana Vasquez, CEO, Local Initiatives Support Corporation Ernest Vasseur, Executive Director, Healthcare Foundation of Northern Lake County
We also thank our La Follette School colleagues for their valuable feedback and encouragement; Karen Faster, publications editor; and the other La Follette School staff and faculty who facilitated the capstone experience. Finally, we extend our gratitude to Dr. J. Michael Collins, Professor of Public Affairs and Director of the Center for Financial Security at the University of Wisconsin–Madison, for his guidance and mentorship throughout the semester.
vii
Executive Summary
In the United States, as well as elsewhere throughout the world, income inequality is a growing concern. Federal tax policy, as codified in the tax code, serves as a redistributive mechanism that attempts to combat inequality. In general, low-income filers have three choices for tax preparation services: preparation by paid providers, self-preparation, and free preparation by organizations such as the Center for Economic Progress (CEP) in Chicago. Based on our review of available data, interviews with key stakeholders, and ongoing discussions with CEP leadership and staff, we offer three strategic objectives and eight specific recommendations to guide CEP as it implements its strategic plan.
CEP’s strategic plan calls for 10 percent annual growth through 2017, based on Chicago’s population and the overall need for tax preparation services in the metropolitan area (CEP 2015c). CEP expects to achieve this growth by opening new sites throughout the Chicago area. To validate that course of action, we started with a market analysis approach, analyzing client demographics, site trends, and volunteer data to evaluate CEP’s operational baseline. Next, we identified the strategic planning factors that have the greatest impact on site efficiency and location, and interviewed stakeholders with expertise regarding the Volunteer Income Tax Assistance (VITA) program or specialized knowledge of low-income neighborhood demographics.
Our research questions and market analysis focused on factors critical to CEP’s continued success: site operations, the volunteer life cycle, and evaluation of expansion options. CEP has a strong commitment to data-driven decisions and considers some aspects of each factor in its day-to-day decision making. The operational factors directly align with three objectives that motivate our final recommendations and support CEP’s desire to expand its services throughout metropolitan Chicago: improving site efficiency, increasing volunteer satisfaction and retention, and adopting a more systematic approach to neighborhood evaluation and site selection.
The transformation of CEP’s strategic plan into tactical decision making calls for a more rigorous and methodical focus—not just outward expansion, but also inward to make improvements to operations and procedures. To that end, CEP’s priority should be improving efficiency at existing sites. Doing so will enable the organization to serve more clients with the same resources; additionally, any reduction in service time will reduce the opportunity cost clients experience when utilizing CEP’s service. Next, improved volunteer satisfaction and retention is an important goal because CEP’s VITA tax preparation services are volunteer-driven by definition. Finally, decisions regarding location are perhaps the most critical choices CEP makes in its tax preparation program, as they represent a major commitment of limited resources. We provide a framework for evaluating expansion to new neighborhoods and propose a list of criteria for analyzing specific site locations.

viii

1
Introduction
Amid growing concerns about income and wealth inequality in the United States, redistributive aspects of the federal tax code are increasingly relevant as policy solutions. The efficacy of these elements, however, depends on the ability of low-income tax filers to submit accurate, timely returns that maximize their refunds. Taxpayers have a variety of options for preparing their tax returns: paid preparers, self-preparation, and free preparation by organizations participating in the Internal Revenue Service’s volunteer tax preparation programs. One such organization, the Center for Economic Progress (CEP), is the subject of this report.
Income and Wealth Inequality
Since the start of the Great Recession in 2008, national media and public efforts such as the Occupy movement have directed increased public scrutiny toward issues of income and wealth inequality. For example, a 2012 finding by Emmanuel Saez and Thomas Piketty that the top 10 percent of U.S. earners received more than half the country’s total income generated coverage in the New York Times (Lowrey 2013). The article also observed that while wage-earners continued to experience a depressed labor market and the labor force participation rate remained at a 35-year low, richer households benefited from the stock market’s recovery boom disproportionately because the top 10 percent own approximately 90 percent of stock. Similarly, a Pew Research Center analysis of economic inequality highlighted that wealth inequality is even greater than income inequality, with the richest 20 percent of households holding about 89 percent of all U.S. wealth (DeSilver 2014).
Recent public discourse about inequality comes from across the political spectrum. A fellow at the American Enterprise Institute addressed one proposal in part by noting, “the top tax rate has bounced up and down for more than 30 years, and growth has actually been faster when it’s been on the higher side.” (Edsall 2015) His participation in an ongoing political debate about taxation reflects the evolution of the federal income tax code, originally authorized in 1913 with the passage of the Sixteenth Amendment to the Constitution, from a simple revenue collection program into a long-standing tool for combating income inequality, and poverty in general, that incorporates economic and policy goals such as income redistribution.
Redistribution in the Tax Code
The federal tax code features an array of redistributive mechanisms, such as deductions, credits, indexing, and progressive rates. Among these, one is especially instructive regarding the potential and limitations of taxation to achieve this goal: the Earned Income Tax Credit (EITC). Instituted in 1975, the EITC provides a refundable tax credit to low- and moderate-income tax filers, primarily those with children. Policymakers designed the credit to reward work by supplementing income, in contrast to previous welfare programs that many believed discouraged work by replacing income.
Over time, the EITC has become the largest social welfare program directed at the poor, and it is widely credited as the most successful poverty intervention other than Social Security (Hoynes 2014). However, critics point to several aspects that limit its effectiveness: Some low-income workers are not eligible (especially those single and childless), the program generates marriage
2
penalties or bonuses (where marriage decision changes the net EITC benefit for two individuals), and it is generally regarded as quite complex (Maag 2015). Furthermore, research shows knowledge of the EITC and similar tax credits, such as the Child Tax Credit, varies among low-income adults and families (Maag 2005). Even presupposing that knowledge, preparing and filing tax returns to access these credits still requires a relatively high cost of compliance: one estimate suggests two-thirds of families with incomes below poverty level, particularly those with very low education levels, use paid preparers to avoid that cost (Maag 2015).
The EITC is just one example that illustrates how the effectiveness of using tax policies to redistribute income depends on accurate, timely filing of tax returns, particularly by the low-income earners who would benefit from such policies. It also shows the importance of providing filing alternatives other than paid preparation to those tax filers.
Tax Return Preparation
The Internal Revenue Service (IRS) calculates that a filer who prepares a complete 1040 form bears a burden of 16 hours of time and $260 to prepare, submit, and file the return (IRS 2015). Given this burden, tax filers often seek out assistance in preparing their returns; for low-income filers, that assistance primarily comes in the form of paid tax preparation services. More than 98 percent who seek assistance do so from paid preparers, according to IRS statistics (Maag 2005).
Paid Preparation
Actors within the paid preparation industry range from self-employed preparers, to accountants in sole proprietorships, to franchises and large national corporations. H&R Block is by far the largest corporate tax preparer, holding a 31 percent market share. Jackson Hewitt and Liberty Tax Service, in contrast, are second and third, with less than 2 percent market share each (Edwards 2014).
Both government agencies and independent researchers have called the accuracy of these and other paid preparers into question. The Treasury Department’s most recent estimate indicates about one-quarter of fiscal year 2013 EITC payments were erroneous (TIGTA 2014). Maag (2015) states, “Unscrupulous tax preparers have an incentive to manipulate income reporting to claim fraudulent EITCs, increasing the fees they charge and the refunds their clients receive.” Holtzblatt and McCubbin (2004) found that almost 60 percent of erroneous EITC payments occurred on paid preparer returns.
Issues with paid tax preparation are not limited to large tax credit programs. In a limited study of paid preparers, the U.S. Government Accountability Office found significant errors, especially among preparers not certified by the IRS (GAO 2014). Despite these issues, courts have struck down on appeal recent IRS attempts to license and register tax preparers (IRS 2014b).
Volunteer Income Tax Assistance: A Free Preparation Alternative
In 1969, Congress authorized an alternative to paid preparation, the Volunteer Income Tax Assistance (VITA) program, as part of the Tax Reform Act. VITA uses trained volunteers to provide free federal tax return preparation assistance to low- and moderate-income tax filers whose income falls below a designated threshold. The program focuses on disabled persons, the
3
elderly, and citizens with limited English proficiency (IRS 2014a). In 2012, approximately 3.2 million taxpayers utilized the IRS Volunteer Program, which includes VITA and Tax Counseling for the Elderly, a similar program. More than 88,000 volunteers prepared 3 million electronically filed returns at 12,500 sites across the country (TIGTA 2012).
In 2007, the federal government established a grant component of VITA, enabling non-profit VITA providers to apply for federal matching funds on a 1:1 basis. It created the grant program to achieve several objectives: extend VITA to underserved urban and rural populations; increase electronic return filing rates; improve quality control and accuracy; and improve volunteer training. Since the grant program’s inception, Congress has continued it on an annual basis (IRS 2014a). In 2011, IRS awarded $12 million to 179 organizations; in 2012 it provided the same amount of grants to 213 recipients (TIGTA 2012).
CEP: Community‐Based Implementation
CEP is a non-profit organization based in Chicago, Illinois, founded in 1990 as the Center for Law and Human Services. In conjunction with the former National Community Tax Coalition, CEP led the effort that established the VITA matching grant; it uses that program and other funding sources to pursue its mission of serving low-income individuals and families through tax preparation assistance, financial services, and a tax clinic.
CEP’s financial services activities involve workshops and one-on-one coaching aimed at increasing basic financial literacy, access to mainstream banking products, and credit standing. Its tax clinic provides representation to low-income subjects of IRS cases and to provide training for small businesses (CEP 2015a). The organization is closely engaged with local government agencies, elected officials, and non-governmental stakeholders throughout metro Chicago. For example, it is working in partnership with Chicago Mayor Rahm Emanuel to implement a pilot program that will provide a periodic advance EITC payment for a group of city residents as part of a research and policy project.
CEP’s tax assistance work, the subject of this report, involves coordination and operation of VITA sites throughout the Chicago metropolitan area, ranging from downtown to the far west suburbs. In 2014, CEP utilized 713 volunteers who worked 26,523 hours to prepare 18,190 tax returns that generated more than $31 million in tax refunds for 17,011 families (CEP 2015b).
Research Approach: Market Analysis
CEP’s strategic plan calls for 10 percent annual growth through 2017, based on Chicago’s population and the overall need for tax preparation services in the metropolitan area (CEP 2015c). To achieve its desired growth, CEP anticipates opening sites throughout the Chicago area (Marzahl et al. 2015). In addition to considering expansion of CEP operations to new locations, we reviewed data on existing site operations, including clients, volunteers, and site performance. This analysis, along with interviews of stakeholders in Chicago’s tax preparation, financial services, and non-profit communities, allowed us to develop recommendations that address improving tax preparation work at current sites; increasing volunteer satisfaction,

4
recruitment, and retention; and establishing more comprehensive data collection to inform decision making.
Research Questions
To address CEP’s strategic planning needs and anticipated growth, we developed a set of research questions:
Who does CEP serve? On a site-specific basis, how do those client demographics compare to surrounding communities?
What effect does volunteer experience have on the VITA model, and how can CEP maximize volunteer productivity?
As CEP considers expansion options, what criteria should it apply to evaluate neighborhoods and sites?
These questions established the three overarching areas that directed our analysis: site operations, volunteer participation, and development of an expansion framework. We provide details about the techniques used to acquire and analyze information relevant to these questions, as well as the supporting data for figures that appear throughout the report, in appendix A.
Study Area
Our analysis defines the Chicago metro area as Cook, Lake, DuPage, Will, McHenry, and Kane counties. These six counties had a total population of more than 8.3 million people in 2010. Table 1 shows population changes for Chicago, suburban Cook County, and the other counties in the study area.
From 2000 to 2010, Will and Kane counties were the region’s two fastest expanding counties. The general trend in population growth during the period was a shift outward from the city moving westward into the suburbs (Hall 2010). Population growth in communities in and around the Loop is the only exception to the westward trend (Paral 2011).
Table 1. Metro Chicago Population
Region Population
Change 2010
Households 2000 2010
Counties Will 502,266 677,560 34.9% 225,256 Kane 404,119 515,269 27.5% 170,479 McHenry 260,077 308,760 18.7% 109,199 Lake County 644,356 703,462 9.2% 241,712 DuPage 904,161 916,924 1.4% 337,132 Cook (– Chicago) 2,480,725 2,499,077 0.7% 920,976 City of Chicago 2,896,016 2,695,598 ‐ 6.9% 1,045,560
Total 8,081,720 8,316,650 2.9% 3,050,314
Source: U.S. Census Bureau, Decennial Census 2000 and 2010 (Census 2013b; Census 2011).

5
Between 1990 and 2000, metro Chicago experienced population growth of almost 12 percent, largely driven by dramatic changes in Hispanic populations (Johnson 2002). Chicago’s metro growth trend continued during the next decade, with 29 percent growth in the Hispanic population and 36 percent growth in the Asian-American population (Paral 2011).
Operational Baseline: Current Conditions
CEP’s activities involve extensive coordination with local governments, schools, libraries, other non-profit organizations, and community stakeholders. This collaborative approach is a central feature of CEP’s establishment and maintenance of tax preparation sites. Because CEP does not operate its own year-round physical locations, it relies on nurturing and maintaining relationships with other organizations to secure its service locations. As the basis for our examination of CEP’s operational baseline, we chose three operational factors related to our research questions that are critical to CEP’s success: site operations, volunteer activities, and neighborhood evaluation.
Site Operations
CEP provides tax services at 14 metro Chicago sites during the filing season, which runs from January 1 to April 15 each year. It also maintains a seasonal site in Springfield and holds several other one-day events in the off-season at their office in downtown Chicago. Each site primarily serves clients who reside in the nearby neighborhood or community. The Loop site is an exception: Due to its central Chicago location near major local transportation centers, the Loops site attracts clients from diverse geographic locations.
In 2014 and 2015, CEP added three new tax sites in Evanston, Brighton Park, and West Chicago. CEP selected these additional sites based on two criteria: Brighton Park and West Chicago due to its partnership with the United Way of Metropolitan Chicago, and Evanston due to the number of clients who traveled to Uptown. It strategically aimed both Brighton Park and West Chicago sites at the Hispanic population, the fastest growing segment of its client base.
Each tax site location serves a unique distribution of clients in terms of race, gender, household and family status, and income. The volume of tax returns varies from site to site, ranging in 2014 from 381 returns processed in Evanston to 3,733 returns processed at the Loop location; the average across all sites (including drop-off service and returns completed at CEP headquarters) for the entire tax season was 1,215 returns. Figure 1 shows the zip code distribution of CEP clients (shaded areas) and the location of client residences (individual data points), referenced against CEP tax sites and a two-mile radius surrounding those sites (white circles). Most CEP clients are from Chicago, but it has placed additional tax sites in high-need suburban locations.

6
Figure 1. 2014 Tax Sites and Client Residences
Source: Rob Paral, Rob Paral and Associates.
Clients
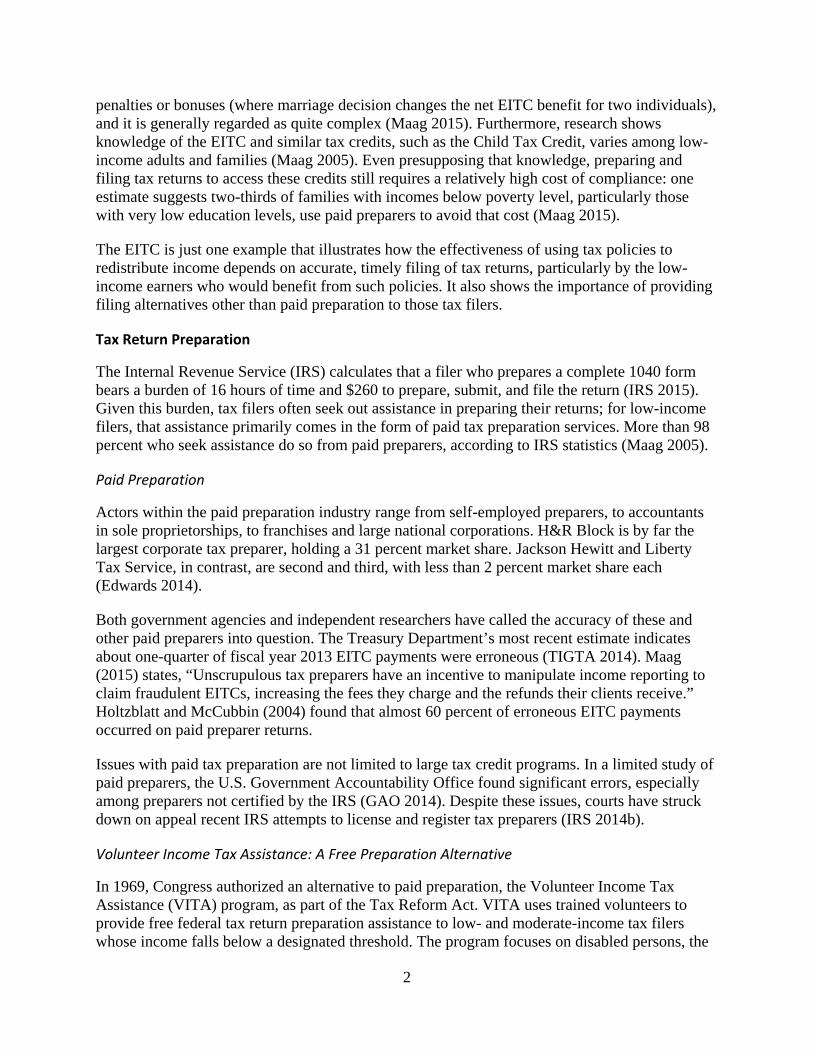
A client must typically have a household income of less than $50,000 to receive services from CEP, although site supervisors may waive the limit on a case-by-case basis. Average client adjusted gross income has remained relatively constant since 2010, averaging $16,439 during that period. Figure 2 shows the overall breakdown of 2014 clients by adjusted gross income. The higher volume of clients with adjusted gross income below $25,000 occurs in part because that is the VITA threshold for single filers.
7
Figure 2. 2014 Clients Served: Adjusted Gross Income
Source: Authors, from CEP data (CEP 2015d).
On average, CEP’s female clients have a slightly higher income than male clients, $15,144 vs. $14,576 respectively. Hispanic clients have the highest average income, $17,919, compared to others. CEP’s Hispanic clients also have, on average, twice as many dependents as their counterparts—1.03 vs. 0.51 (CEP 2015d). Dependent counts can have a significant effect on tax payments and refunds, because filers who participate in tax credit programs such as the EITC, the Child Tax Credit, and the Child Care Tax Credit receive additional funds from the government through the tax system.
In addition to the number of dependents, tax and refund calculations made at time of return processing depend on other personal characteristics, including income, withholding, eligibility for a Social Security number, and other unique circumstances. Since 2010, refunds to CEP clients totaled $165,362,508. Clients have received an average refund of $1,639; however, this amount has decreased from $1,685 in 2009 (CEP 2015d). Possible causes for the decrease include changes in service population or specific tax policies, but the detailed analysis necessary to pinpoint likely causes with a reasonable confidence level is beyond the scope of this report.
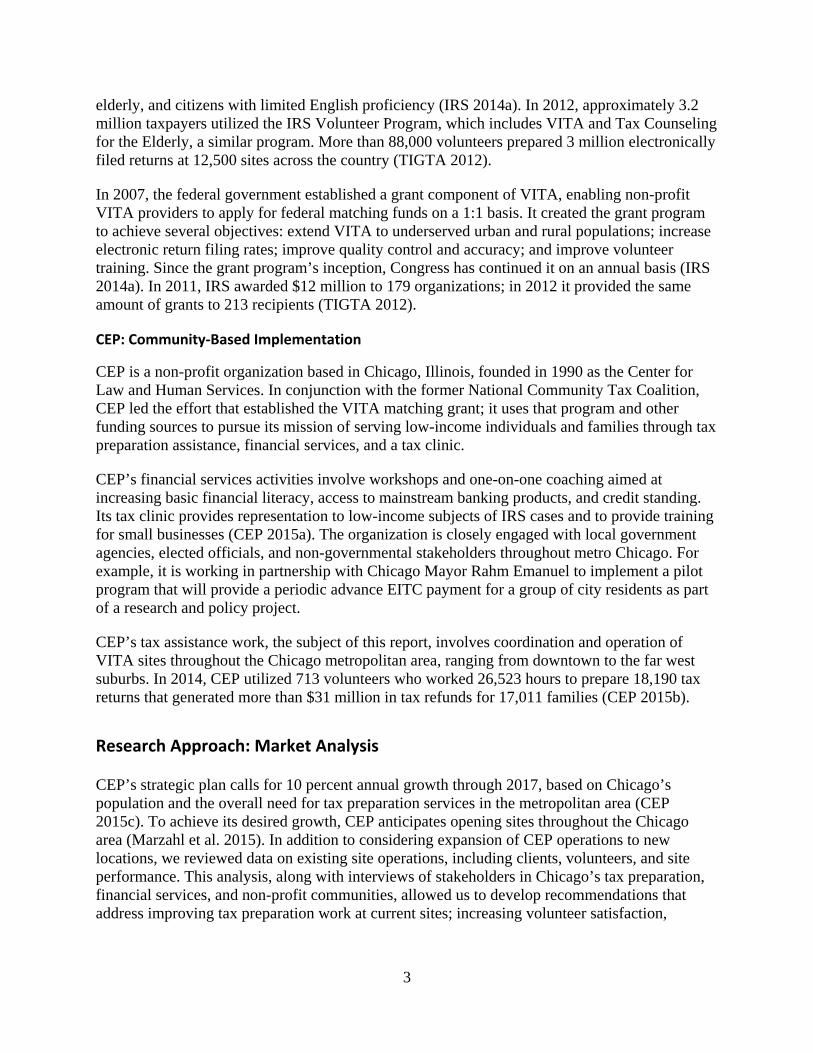
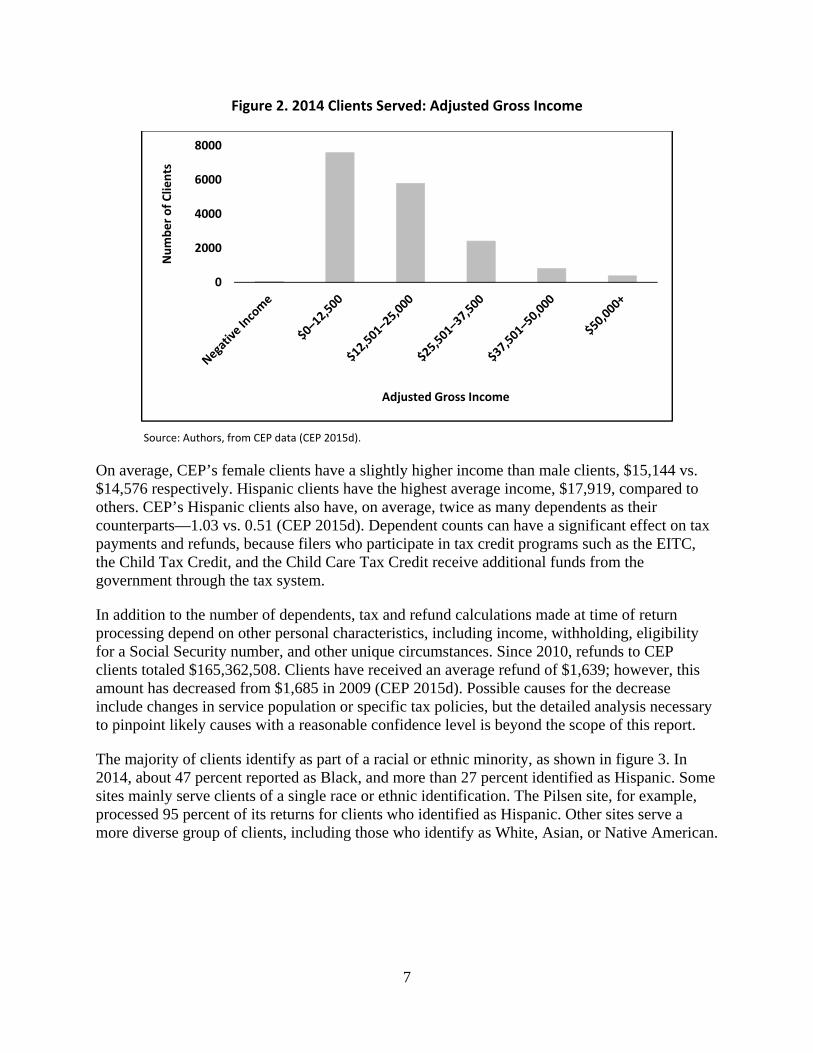
The majority of clients identify as part of a racial or ethnic minority, as shown in figure 3. In 2014, about 47 percent reported as Black, and more than 27 percent identified as Hispanic. Some sites mainly serve clients of a single race or ethnic identification. The Pilsen site, for example, processed 95 percent of its returns for clients who identified as Hispanic. Other sites serve a more diverse group of clients, including those who identify as White, Asian, or Native American.
0
2000
4000
6000
8000
Number of Clients
Adjusted Gross Income
8
Figure 3. 2014 Clients Served: Site Totals
Source: Authors, from CEP data (CEP 2015d).
Site Performance
To determine the percentage of local households that CEP served, we compared the total number of clients that CEP served at each site to the number of households meeting the VITA eligibility threshold, as measured by the Census Bureau’s American Community Survey (ACS). This comparison represents the “reach” of CEP within the neighborhoods it serves (table 2). Throughout this report, we use the term “neighborhood” generically to refer to a community area or township where a CEP site is located (see “Terminology,” appendix A, for more information).
This metric, which seeks to measure the extent to which CEP serves a particular area, varies across locations. Because clients often travel to a tax location from outside their neighborhoods, this metric is somewhat overstated for individual sites. Loop and Uptown, in particular, have a very large number of such clients. However, overall totals and percentages confirm CEP serves only a relatively small proportion of eligible households within the neighborhoods surrounding most service locations.
0
750
1,500
2,250
3,000
3,750
Number of
Clients Served
Site Location
Black Hispanic White Asian
Native Am. Other Unknown

9
Table 2. Community Reach
Site Eligible
Households Clients Served
Percentage Served
Loop 4,429 3,733 84.3%
Uptown 15,932 3,338 21.0%
Bronzeville 6,296 1,152 18.3%
Pilsen 8,241 1,035 12.6%
Elgin 13,387 1,469 11.0%
West Chicago 5,169 538 10.4%
Auburn Gresham 11,816 1,115 9.4%
Lawndale 8,154 603 7.4%
Waukegan 17,037 713 4.2%
Brighton Park 7,531 304 4.0%
Aurora 22,899 866 3.8%
Joliet 16,642 614 3.7%
Chicago Heights 15,704 538 3.4%
Evanston 11,586 381 3.3%
Total Served 164,823 16,399 9.9%
Study Area Total 1,465,685 1.1%
Source: Authors, from CEP and ACS data (CEP 2015d; Census 2014).
Factors that influence each filer’s decision to utilize CEP services include preferences for and location of paid preparers, the presence of other community organizations and VITA preparers, or the ability and willingness to self-prepare. Notwithstanding these factors, the large discrepancy between clients served and eligible households suggests CEP may be able to increase capacity and growth at existing locations. Attracting clients who have not utilized CEP services despite their eligibility and decreasing client “costs,” including travel and wait time, are two avenues to accomplish this goal. Appendix B addresses the subject of client costs related to free tax preparation.
Volunteer Participation
Volunteers are the lifeblood of CEP. Without an adequate, properly trained volunteer force, the VITA model fails. Furthermore, utilizing this limited resource in the most efficient means possible maximizes VITA’s impact. CEP staff believe veteran volunteers facilitate mission accomplishment, and improve the effectiveness of its VITA program (Haskins 2015). This makes sense at an intuitive level, because returning volunteers require less training and oversight, and are more efficient (Dobson 2015).
Missed retention opportunities represent a potentially serious cost to CEP, as it must seek, find, and train volunteers replace those who do not return. The vast majority of volunteers express satisfaction in their experience and a keen interest to return. In CEP’s 2013 volunteer survey, 92 percent rated their volunteer experience at least 7 on a 10-point scale, and 95 percent of

10
respondents said they would probably or definitely volunteer again in 2014 (CEP 2015e). That said, CEP’s 2014 volunteer demographic data reveal 37 percent of volunteers actually returned.
Continuous volunteer recruiting and training is therefore essential for CEP to grow the number of tax returns filed. Table 3 shows volunteer retention rates at a sampling of CEP locations. The Loop site, which leads CEP in return volume, also has one of the lowest returning volunteer rates. Although smaller sites tend to have a higher retention rate, our limited data review did not provide sufficient information to form a hypothesis as to why this might be the case. Evanston’s position at the bottom of this list is likely due to its status as a new site.
Table 3. 2014 Volunteer Participation
Site Volunteers Percentage
of Volunteers Who Returned Total First‐Time Returning
Auburn Gresham 75 38 37 49%
Bronzeville 106 55 51 48%
Springfield 49 26 23 47%
Aurora 129 82 47 36%
Loop 535 364 171 32%
Evanston 87 62 25 29%
Source: Authors, from CEP data.
CEP does engage in some activities related to volunteer satisfaction and retention, including the general tracking of volunteer hours (tracked as preparation or non-preparation activity) and the administration of a 37-question volunteer survey at the conclusion of the tax season. More than one-half of volunteers complete the survey, which provides the organization important feedback from volunteers on their experiences (CEP 2015e). See appendix C for further discussion of volunteer surveys. Additionally, CEP collects some data related to volunteer activities at sites.
Neighborhood Evaluation
To measure how CEP serves its neighborhoods, we compared client demographics across tax sites. We found that characteristics such as gender, filing or household status, number of dependents, and income were relatively stable across all of CEP’s 14 locations. For example, the proportion of female clients at each tax site ranged from 40 to 67 percent, while the proportion of male clients ranged from 26 to 43 percent. Charts describing these characteristics appear in appendix A (“Supplemental Data”). In contrast to these factors, our analysis of race and ethnicity (figure 4) found much greater differences among locations.
11
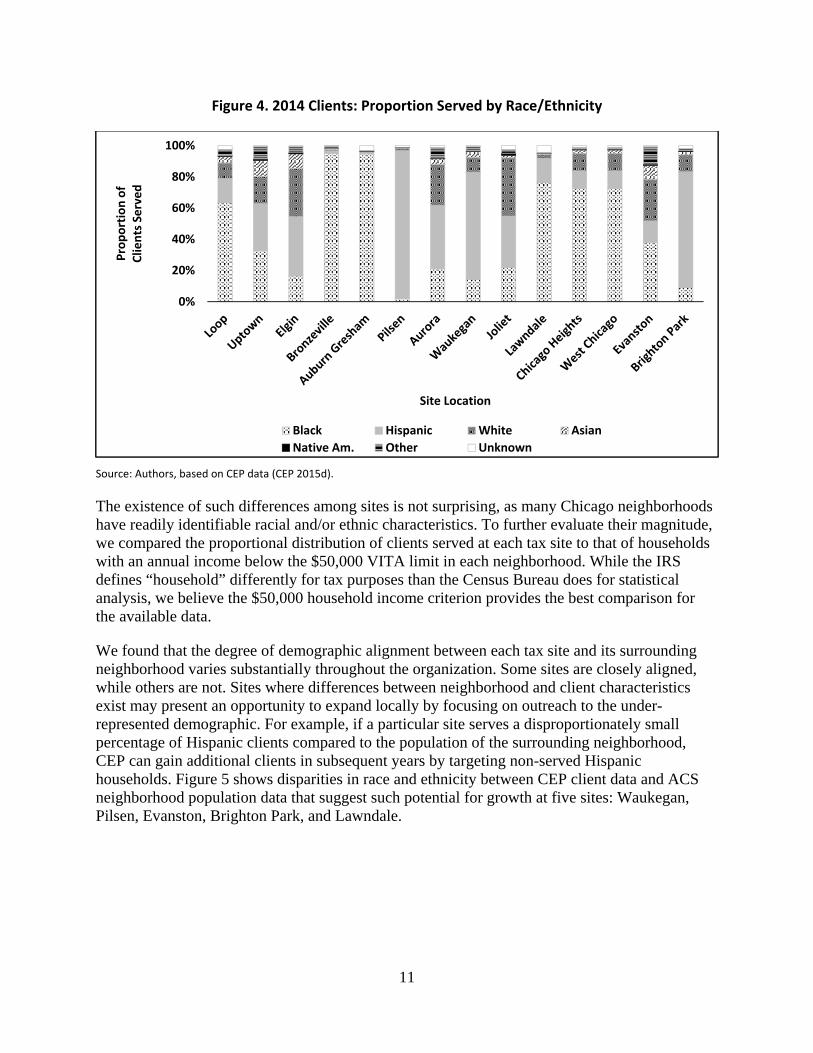
Figure 4. 2014 Clients: Proportion Served by Race/Ethnicity
Source: Authors, based on CEP data (CEP 2015d).
The existence of such differences among sites is not surprising, as many Chicago neighborhoods have readily identifiable racial and/or ethnic characteristics. To further evaluate their magnitude, we compared the proportional distribution of clients served at each tax site to that of households with an annual income below the $50,000 VITA limit in each neighborhood. While the IRS defines “household” differently for tax purposes than the Census Bureau does for statistical analysis, we believe the $50,000 household income criterion provides the best comparison for the available data.
We found that the degree of demographic alignment between each tax site and its surrounding neighborhood varies substantially throughout the organization. Some sites are closely aligned, while others are not. Sites where differences between neighborhood and client characteristics exist may present an opportunity to expand locally by focusing on outreach to the under-represented demographic. For example, if a particular site serves a disproportionately small percentage of Hispanic clients compared to the population of the surrounding neighborhood, CEP can gain additional clients in subsequent years by targeting non-served Hispanic households. Figure 5 shows disparities in race and ethnicity between CEP client data and ACS neighborhood population data that suggest such potential for growth at five sites: Waukegan, Pilsen, Evanston, Brighton Park, and Lawndale.
0%
20%
40%
60%
80%
100%
Proportion of
Clients Served
Site Location
Black Hispanic White Asian
Native Am. Other Unknown

12
Figure 5. Comparison of Clients Served to Neighborhood Population
Source: Authors, from CEP and ACS data (CEP 2015d; Census 2014).
Waukegan
In 2014, the tax preparation site at Waukegan processed 714 tax returns; 69 percent of these clients identified as Hispanic. The race and ethnicity of the neighborhood vary significantly from the client base. Those who identified as White made up 35 percent of the township population, but only 10 percent of clients. Similarly, 21 percent of the population identified as Black, but only 14 percent of the client base.
In addition, the Waukegan site serves only 4 percent of the population, which indicates substantial additional need for tax preparation services within the neighborhood.
Pilsen
The tax preparation site at Pilsen processed 1,035 tax returns in 2014. This total is significant as it represents a continued downward trend for this site, which processed 1,499 returns in 2011. Overall, the site serves about 13 percent of eligible households in the Lower West Side.
0%
20%
40%
60%
80%
100%
CEP
Clients
Population
CEP
Clients
Population
CEP
Clients
Population
CEP
Clients
Population
CEP
Clients
Population
Waukegan Pilsen Evanston Brighton Park Lawndale 5 SiteTotal
Proportion of
Group M
easured
Site Location andGroup Measured
Black Hispanic White AsianNative Am. Other Unknown

13
At Pilsen, an overwhelming 94 percent of clients identify as Hispanic, but only 53 percent of community residents identify as such. While the differential is partially explained because the community partner is a Hispanic-serving organization, outreach to additional community groups who serve individuals of different races could provide a client makeup more representative of the larger community area.
Evanston
The tax site in Evanston served the fewest number of clients of any CEP site in 2014, its first year of operation. As it served only 381 clients in the latest year of available data (representing 2 percent of the eligible population), opportunity for growth exists by targeting local residents.
Brighton Park
The Brighton Park site, located in the community area of the same name, also shows the potential for additional demand. CEP serves 4 percent of eligible households in the neighborhood, and although the area includes almost 6,000 eligible Hispanic households, CEP only served 225 in 2014.
Lawndale
The Lawndale site is within the North Lawndale community area. It primarily serves a Black clientele, which reflects the area’s racial and ethnic makeup. The neighborhood includes a substantial low-income Asian population (about 18 percent); from that group, however, CEP only served four clients in 2014.
Operational Analysis: Strategic Planning Factors
Applying the operational factors that drove our examination of baseline conditions, we shifted our analysis to look at the same areas from a strategic planning perspective. We developed recommendations in three areas directly aligned with those factors and our research questions: site efficiency, volunteer satisfaction, and evaluation of neighborhoods and sites for expansion.
Site Efficiency
As CEP strives to meet its growth targets, the performance of existing sites is equally important, if not more so, than the potential performance of new or proposed sites. It should, therefore, devote attention to making its existing sites as efficient as possible. The organization’s data acquisition and analysis make clear that CEP’s leaders and staff already understand this. Missing from its efforts thus far, however, are well-defined metrics for efficiency and productivity.
If the process of finding and opening a new location is viewed as the major inhibitor to growth, then maximizing returns generated at each site might be a top priority, and returns prepared per operating hour would be one appropriate metric. However, suppose sites are relatively easy to locate, and the real problem is finding volunteers to staff them; in that case, the number of returns per volunteer hour could be a more appropriate management tool for measuring

14
efficiency. Figures 6 and 7 demonstrate how different metrics yield a different analysis of efficiency.
Figure 6. Processing Metric: Returns per Site Operating Hour
Source: Authors, from CEP data (CEP 2015d).
Figure 7. Processing Metric: Returns per Volunteer Hour
Source: Authors, from CEP data (CEP 2015d).
Figure 6 asserts that Uptown, Aurora, and Elgin are the top three sites. Uptown almost doubles third-place Elgin’s production rate at 16 returns per operating hour. If that metric is the leading indicator, one should look to these top sites for best practices and benchmarking.
Conversely, figure 7 shows that in terms of returns per volunteer hour, Aurora has the second lowest ranking, and Elgin is in the bottom half of all sites; Auburn Gresham and Bronzeville
0.0
4.0
8.0
12.0
16.0
Returns per
Site Operating Hour
Site Location
0.0
0.2
0.4
0.6
0.8
1.0
1.2
Returns per
Volunteer Hour
Site Location

15
move to the top using this measure. Defining the right metrics and determining their relative merit is an essential prerequisite for accurate site comparisons and prudent expansion.
Figure 7 also shows that only three sites—Auburn Gresham, Bronzeville, and Springfield—achieved more than one return per volunteer hour in 2014. Most other sites hover around 0.70 returns per volunteer hour, about two-thirds the efficiency of the three best. At the lower end, Aurora, Evanston, and the Loop all fail to achieve 0.50 returns per volunteer hour. Comparing this potential measure of site efficiency to the percentage of returning volunteers at each site (shown in Table 3), it appears that a higher ratio of returning volunteers is associated with a higher number of returns processed per volunteer hour. The presence of such an association after a more rigorous analysis would corroborate CEP’s belief that experienced volunteers enhance effectiveness, and reinforce the importance of prioritizing their retention.
CEP leadership must ask, exactly what does it mean for a site to be efficient, or for a volunteer to be productive? CEP must make a deliberate decision on how to measure site efficiency and consider the impact of resources on service levels when it does so.
Quality Review: Practical Barriers to Efficiency
CEP has already identified the VITA quality review step as a major bottleneck in service delivery (Dobson 2015). Several years ago, the IRS updated its volunteer program guidelines to require a quality review: “All returns prepared by an IRS-tax law certified volunteer preparer are required to be quality reviewed and discussed with the taxpayer… before the taxpayer signs the return.” (IRS 2014c, 17) Providing sufficient quality reviewers has posed a problem for CEP at some sites, with the end result being multiple preparers waiting for the single quality reviewer to double check their work (Dobson 2015). If CEP could field more quality reviewers or convert some preparers to quality reviewers, it may increase capacity for the number of returns prepared. To build a larger network of volunteer quality review, we surmise that CEP must overcome two main hurdles: the requirement for advanced coursework, and the nature of the work itself.
In addition to the initial training all screeners and return preparers complete, quality reviewers are often required to complete advanced coursework. According to IRS rules, they must earn tax law certification “at a minimum, at the Basic level or higher (including specialty levels) based on the complexity of the tax return.” (IRS 2014c, 17). Due to the range of returns that may arise at a site, the need for higher certification is not atypical. Additional classes necessary to certify beyond the basic level cover more complicated tax situations and challenge the participant to prove attention to detail and preparation prowess. These requirements may dissuade many volunteers from acquiring quality review certification.
Other potential barriers may limit the number of volunteers who are willing to do quality review. The work is more tedious, high pressure, and less social than simple tax preparation or client screening (Dobson 2015). In addition, CEP has a mandatory minimum volunteer participation requirement of 30 hours per tax season that may inhibit participation. Nearly 30 percent of 2013 volunteer survey respondents answered that they would not return in 2014 if the mandatory minimum volunteer hours were increased from 20 to 30 (CEP 2015e).

16
Efforts to make the work more appealing may pay dividends for CEP. CEP should investigate training alternatives reduce the burden of the certification process, and better communicate the importance and value of quality review to volunteers. To encourage more volunteers to become quality reviewers the organization could incentivize or reward those volunteers who choose to do quality review. Finally, decreasing the mandatory minimum number of volunteer hours for quality review volunteers may encourage some to take on that responsibility.
To ascertain what makes for a serial volunteer and, more specifically, what motivates a volunteer to pursue quality review, we recommend that CEP’s volunteer survey explicitly seek to acquire more information about the general unwillingness to do quality review. It is important to know if a lag in tax return processing from the quality review bottleneck is reducing volunteer engagement. Finally, as an alternative staffing strategy, CEP might consider employing tax professionals or CEP staff.
Volunteer Life Cycle
According to the U.S. Department of Labor’s Bureau of Labor Statistics, 62.8 million people volunteered with an organization at least once in 2015 (BLS 2015), about 25 percent of the adult population. The bureau also reported that organizational outreach is one of the main reasons a volunteer became involved. When asked how they became connected to the organization, about 41 percent of respondents said they were asked; almost 25 percent of all respondents were approached by that organization (BLS 2015).
Volunteer satisfaction should be a central concern to CEP not only because volunteers are the core of VITA, but also because their satisfaction affects and is affected by all of the major stages of the volunteer life cycle: recruiting, onboarding, training, participation, and retention.
Motivation
What motivates a quarter of the population to volunteer? What motivates volunteers to first engage with an organization and, just as importantly, to continue their volunteer commitment year after year?
Clary et al. (1998) identify six motivators that can improve volunteer interactions: values, understanding, career, social, protective, and enhancement. Volunteer motivation can have important implications for recruitment, because volunteers are more likely to respond to messaging that aligns with their individual motivation (Clary et al. 1998). Furthermore, an Urban Institute study found organizations that struggle with recruiting volunteers also have problems retaining them (Hager and Brudney 2004). This emphasizes the importance of understanding volunteers and their motivation. Table 4 explains these motivators.

17
Table 4. Volunteer Motivators
Motivation Explanation Example
Values The individual volunteers to express or act on important values like humanitarianism.
I feel it is important to help others.
Understanding The volunteer is seeking to learn more about the world or exercise skills that are often unused.
Volunteering lets me learn through direct, hands‐on experience.
Career The volunteer seeks career‐related experience.
Volunteering can help me to get my foot in the door in a place where I would like to work.
Social Volunteering allows an individual to strengthen social relationships.
People I know share an interest in community service.
Protective The individual uses volunteering to reduce negative feelings, such as guilt, or to address personal problems.
Volunteering is a good escape from my own troubles.
Enhancement One can grow and develop psychologically through volunteering.
Volunteering makes me feel better about myself.
Source: Clary et al. (1998).
Similarly, mandatory requirements can influence motivation and intent to remain. Some studies caution the use of mandatory requirements for volunteers. If volunteers do not feel they are autonomous or have personal control, they may be less likely to continue. This relationship may not always hold true; some research suggests a combination of mandatory requirements and focus on motivation may be the most effective strategy (Stukas, Snyder, and Clary 1999).
Satisfaction
Understanding volunteer motivations is only one piece of the puzzle. Volunteer satisfaction is another key element that organizations can evaluate to improve the retention of quality volunteers. Specific strategies focused on volunteer satisfaction have been linked with a significant effect on short term retention of volunteers and have some correlation with longer term commitments (Chacón, Vecina, and Dávila 2007).
One tool that CEP might apply to improve its volunteer experience is the Volunteer Satisfaction Index, a critical framework for evaluating the experiences of volunteers that includes five dimensions of volunteer satisfaction: communication quality, work assignment, participation efficacy, support, and group integration (Galindo-Kuhn and Guzley 2001). Each dimension has its own opportunities that organizations can use to improve volunteer satisfaction.
First, organizations can have a large effect on volunteers through the frequency and quality of their communications. Poor or infrequent communication sends a message to the volunteer that they are not important and that their work is not valued. Providing useful, specific feedback to volunteers is one good example of improving communication quality. Volunteers who are interested in developing their skill set will benefit most from direct feedback.

18
Matching work assignments to motivation is important. Volunteers, especially those motivated by the understanding and career motivators, see volunteering as an opportunity to grow and develop. Organizations should strive to match the knowledge, skills, and abilities of volunteers with assignments where they can maximize their creativity, which leads to greater satisfaction.
Third, volunteers feel satisfied in their work when they find value in it. Participation efficacy leads to increased volunteer fulfillment because individuals are able to find meaning through volunteering. Support is also a key indicator of satisfaction. Actions that an organization can take to make volunteers feel supported include training, feedback, and encouragement.
Last, social relationships are important to human beings. In the context of the Volunteer Satisfaction Index, group integration focuses on the social relationships volunteers have with individuals associated with the organization. These relationships include interaction with other volunteers as well as interaction with staff and other members of the organization. Valuable interactions can lead to higher levels of satisfaction.
Volunteers are a critical component of nonprofit management and organizational efficiency. Organizations that view volunteer management as unworthy of attention and costly tend to have lower volunteer retention rates. Conversely, organizations that recognize the net benefit of investing in volunteers have higher retention rates (Hager and Brudney 2004).
Retention
CEP does not have information on how employers may have conducted advertising and recruitment. It should investigate the process to identify employers and policies that generate volunteers who have a high chance of returning in subsequent years. Good working relationships with management or specific employer benefits may result in particular companies providing high-quality volunteers. CEP should identify the factors driving this phenomenon so it can recommend best practices in volunteer recruiting or seek volunteers from similar organizations. Some businesses reward employees for volunteering a specific number of hours each year (e.g., paid time off or matching donations for volunteer activities) as part of a commitment to social responsibility (Dansko 2015). CEP could also consider recruiting from large employers near tax sites, to minimize travel time for after-work shifts.
Table 5 on the next page summarizes the employers that provided 10 or more volunteers in 2014. The data demonstrate very high variability among these employers—of these 10, only AT&T and the City of Chicago provide returning volunteers at a rate greater than 50 percent.

19
Table 5. 2014 Volunteer Employers
Employer
Total Volunteers
Returned From 2013
Percentage Returned
AT&T 18 16 89% City of Chicago 17 9 53% JPMorgan Chase 37 16 43% Brighton Park Neigh. Council 13 4 31% Northern Trust 48 15 31% Discover Financial Services 15 2 13% Allstate Insurance 13 1 8% MB Financial Bank 18 1 6% Bank of America 19 1 5%
Source: Authors, from CEP data (CEP 2015e).
Because site effectiveness, volunteer satisfaction, and volunteer return rate interact with each other, getting all three parts right provides synergy for CEP’s VITA program. Skilled volunteers are necessary for VITA, and literature shows that volunteer retention and experience correlate with positive outcomes and effectiveness (Galindo-Kuhn and Guzley 2001). This correlation occurs partially because talented, motivated volunteers choose to return, but also because returning volunteers have more experience. CEP should harness that experience to increase service efficiency. As sites grow in effectiveness, we anticipate volunteer satisfaction will increase with it, which should improve the return rate of volunteers.
Neighborhood and Site Selection
Continued growth of volunteer tax preparation services may require physical expansion to new locations in the Chicago metropolitan area. Location matters for a number of reasons, including ease of client, volunteer, and staff accessibility. Travel to the tax preparation site is a major cost in terms of time, money, and energy for all parties involved in the work. The following section addresses travel as one of several dimensions of site accessibility.
Client Travel
Both clients and volunteers may incur the cost of travel to reach CEP locations. For clients, this cost is a major consideration when deciding to utilize CEP services (see appendix B). To portray how clients actually incur this cost, we mapped those who traveled five or more miles to a CEP site as shown in figure 8.

20
Figure 8. 2014 Client Travel More than Five Miles to Site
Source: Authors, from CEP data (CEP 2015d).
Several areas where traveling clients and existing volunteers lived near each other stand out. The four red circles identify these clusters of overlapping client and volunteer residences, roughly named as Schaumburg–Roselle–Glendale (top left), Northwest Chicago and Suburbs (top right), West Cook (middle), and South Cook (bottom). The darker points on the map represent client residences, while the lighter dots represent volunteer residences. These areas suggest optimal locations for new sites that would serve the dual purpose of limiting the traveling burden on clients while providing volunteers more convenience.
Most clients in these four areas travel to the Loop site, despite the fact that other sites may be located closer to their residences. The Loop is easily accessible via public transportation and is a business district; thus, many clients may find the Loop site to be a more convenient location to obtain services. We evaluate each of these areas in further detail in appendix D.
21
Recommendations
In CEP’s formal strategic plan, the first goal enumerated is expansion of tax preparation services and provision of high-quality customer service (CEP 2015c). Our recommendations are oriented toward accomplishing that goal through achieving three relevant objectives, which align with the three operational areas that served as the foundation for our research questions and analysis—sites, volunteers, and expansion:
Improve site efficiency. CEP should focus on evaluating and improving the efficiency and capacity of its existing sites. As noted, sites vary in terms of site and volunteer performance; this variation suggests CEP can improve efficiency at specific sites. Gains in site efficiency lower the opportunity cost to clients and ultimately increase the number of returns generated by an equivalent investment in resources.
Increase volunteer satisfaction and retention. CEP should improve its ability to retain volunteers. Returning volunteers are the linchpin of the VITA service program; in interviews, CEP staff highlighted their importance (Dobson 2015). Only 37 percent of volunteers who said in 2013 they would return actually did so in 2014; CEP needs to look closely to find out what is happening and why. Research indicates volunteers who feel that they are more connected to their organization and are making effective contributions express a greater willingness to return (Galindo-Kuhn and Guzley 2001). If CEP can improve volunteer satisfaction, it should realize greater retention and by extension improved site effectiveness.
Systematically evaluation expansion. As CEP considers expansion, it should adopt a more systematic approach to site selection. Selecting the optimal location for a site entails identifying a neighborhood and choosing a specific site within that neighborhood. CEP already does some site analysis as part of its selection process. We provide a more thorough framework on which to base these decisions in appendix E.
We realize these recommendations vary in cost and implementation time, two factors which can place severe limits on organizational capacity for change. Therefore, we prioritized categories, and recommendations within each category, based on our estimation of their overall importance to CEP’s strategic plan and mission accomplishment. The most important are listed first.
Improve Site Efficiency
Recommendation 1: Fully embrace data‐driven analysis by developing a systematic process for gathering and maintaining internal data in a clean and rigorous manner.
The most important step CEP can take is to develop a more deliberate process for identifying, gathering, and maintaining relevant operational data. In our initial meeting and during ongoing discussions, CEP demonstrated a strong understanding of the value of data-driven analysis and a commitment to such a systematic approach. Indeed, CEP’s coordination with the La Follette School to for this report is a concrete demonstration of that commitment. However, missing metrics central to a useful description of the VITA program’s operations hampered our ability to
22
conduct a detailed analysis; our remaining recommendations in this section provide specific examples that would greatly enhance the possibilities for analysis.
CEP needs more detailed data than the limited information exported from the federally mandated Taxwise software system, which tracks few variables. By strengthening its internal data management system as an augmentation to Taxwise, CEP can conduct tailored analyses that are more likely to be fruitful.
Our analysis benefited from inclusion of various CEP data sources, including information from tax return preparation, volunteer and client surveys, and interviews and responses from site staff (CEP 2015d; CEP 2015e; CEP 2015f). Due to the increasing number of services provided, as well as the complexity of the information collected, one technique for implementing this recommendation is to establish a single position, perhaps titled “Data Manager,” as the central point of contact for all data collection and management issues. Information collection and analysis efforts are distributed among different staff members and departments; a data manager could coordinate the variety of analytical techniques and collection types and synthesize all information into actionable results. Responsibilities of the position would include combining and refining data sources to conduct analyses on site operations, efficiencies, and satisfaction; ensuring survey questions and respondents’ information provoke useful insights and operable information; and managing the staff’s combined data collection and processing efforts.
We therefore recommend that CEP continue to gather more data on its operations to better inform decision making at all levels within the organization, from the board down to site staff. CEP should consider adopting a performance management or process improvement approach to drive this data collection and analysis. Although these approaches do require technical expertise and a strong commitment from management for effective implementation, a systematic process of internal data management that prioritizes more thorough data-driven analysis directed at efficiency metrics can pay dividends in terms of more actionable information that would help CEP achieve its goals.
Recommendation 2: Collect client service data as part of the intake, preparation, and quality review process rather than relying solely on follow‐up surveys.
In our discussion of site operations, we noted CEP’s clientele represents a low percentage of income-eligible residents: 10 percent of the neighborhoods surrounding its sites and 1 percent of the entire study area. CEP’s low community reach suggests it can substantially grow its client base simply by serving more clients at existing sites, subject to host partner operational limitations, rather than expending significant resources to expand. However, we cannot categorically make that statement, as we lack the data to rigorously evaluate the efficiency of existing site operations, and we did not have information regarding operational limitations (e.g., host partner restrictions).
Therefore, we recommend that CEP revise its existing intake form and post-departure client survey. Each client completes an intake form upon arrival at a site, and CEP conducts client surveys via email. To increase client survey response rates, CEP should combine these two information sources into a single intake and processing form that follows the client from arrival to departure. The revised form should include not only demographic information, but processing

23
information as well. CEP could negate the need for manual data entry by investing in inexpensive tablets that clients and staff would use to complete the form digitally as the client proceeds through the VITA experience.
Two basic data elements central to any CEP client’s experience, wait time and processing time, are an example of missing information that should be included in a revised collection of client service data. Once a client arrives, how long does it take to start and complete intake? After intake is complete, how long does each client wait to see a volunteer preparer, and how long does the preparer take to complete the return? When the return is finalized, how long does each client wait for quality review and how long does that process take? CEP needs to know these times because it relies in large part on word-of-mouth promotion of its services. Waiting times for intake, return processing, and quality review might easily make the difference between positive communication about CEP’s services and negative word-of-mouth. Similarly, CEP needs to know processing times for these areas to understand how clients and volunteers interact.
In addition to capturing such detailed information, the intake/processing form can incorporate client satisfaction questions from the existing client survey. Questions regarding satisfaction and the likelihood of recommending CEP to others may have the added benefit of prompting such behavior.
If CEP maintains the existing intake form response rate of 95 percent, the dramatic increase in client survey data would give it a wealth of information it does not possess. CEP can still choose to conduct follow-up surveys; such surveys would supplement the information acquired at time of service. Because clients can complete email surveys at a time and duration of their own choosing, that remains an ideal method for soliciting in-depth responses on specific areas of interest or for providing an avenue to obtain unsolicited reviews or suggestions.
Recommendation 3: Collect and retain volunteer data as part of the intake, preparation, and quality review process. Do not rely solely on occasional reporting.
As with client data, limitations of the volunteer data hindered a more thorough statistical evaluation of site efficiency and the identification of causal factors related to apparent superficial differences in relative output among sites. Due to these limitations, we recommend that CEP examine its volunteer activities with the specific intent of identifying relevant metrics for which it can collect data. We offer two examples to show how CEP might find such data valuable for analytical efforts.
First, CEP should assign each volunteer a unique ID number and incorporate volunteer ID numbers on the revised intake/processing form suggested in Recommendation 2. We suggest ID numbers rather than names because they are easier to implement and simplify data entry—different volunteers might have the same or similar names, and names are subject to misspellings, variation in nicknames, and other inconsistencies that might confound data analysis. Once implemented, CEP can examine issues related to volunteer efficiency because it will more accurately evaluate productivity for individual volunteers within a single site and among sites. Matching intake, return processing, and quality review to the specific volunteers performing those activities will provide the visibility needed to estimate relative efficiency among volunteers (measurement of which CEP already recognizes a need). Importantly, it

24
enables longitudinal analysis of volunteer efficiency; developing the capability will give CEP the means to track an individual’s productivity gains (or losses) from year-to-year as their experience levels and hours worked change, and to determine how its sites are adapting to shifting client caseloads. These site comparisons will, in turn, allow CEP to establish reasonable performance benchmarks, reward high performers, and identify best practices.
Second, CEP should initiate daily or weekly logs to track the number of volunteer hours served, and how they accrue to specific tasks. Volunteers self-report their hours on an irregular basis, perhaps only at the end of the tax season. CEP does not distinguish volunteer hours spent on different non-preparation tasks—intake, quality review, or indirect support (site supervision, setup/cleanup, etc.). This differentiation is essential to determine effectiveness and efficiency of individual volunteers and overall site operations. Data tracking should be systematic and accurate, so we recommend CEP assign this task as a site staff duty and not consider it an individual volunteer’s responsibility. This log would allow for greater fidelity in service analysis and should not serve as a timecard. A simple clipboard and chart would be sufficient to capture the data on a daily basis. Alternatively, staff could enter upload this information directly using available computers or tablets.
Recommendation 4: Conduct a detailed evaluation of the quality review process.
We identified the quality review process as a problematic bottleneck in CEP’s tax site operations. Speeding up this step could increase return processing, holding all else constant. Therefore, we recommend CEP evaluate the quality review process and investigate alternatives to filling the position with volunteers.
A detailed analysis of the quality review process and alternative avenues of filling the quality review void should identify potential efficiencies. For example, an extra quality review employee or two on duty at certain sites may be worth the investment, even if it requires CEP staff or paid preparers to substitute for volunteers. The need for more balance is particularly evident at sites that are reportedly oversaturated with volunteers at times, such as the Loop and Aurora.
The lack of data on volunteer hours, client wait time, and site production means CEP cannot perform a cost-benefit analysis to determine if bolstering quality review with paid employees makes financial sense. Given that limitation, this recommendation fits succinctly with our first recommendation that CEP “fully embrace data-driven analysis.” Success at the QR step and maximizing site production depends on the organization making a concerted effort to collect more data on its operations.
Increase Volunteer Satisfaction and Retention
Recommendation 5: Improve volunteer recruitment, satisfaction, and retention through multiple mechanisms, including the volunteer survey, a rewards system, and learning and development opportunities.
Several interview subjects, within and outside CEP, noted that experienced volunteers enhance the tax return process in terms of speed, efficiency, and quality of the preparation. Research shows that volunteer job satisfaction is highly correlated with volunteer intention to return to the

25
organization (Galindo-Kuhn and Guzley 2001). Specifically, volunteer empowerment and engagement create an environment of volunteer satisfaction that leads to greater connection and commitment with the organization (Chacón, Vecina, and Dávila 2007).
CEP has taken steps to identify training gaps and areas of volunteer satisfaction through its annual surveys. However, survey results may be biased due to low number of responses. For example, certain questions on the latest volunteer satisfaction survey garnered a response rate of less than 10 percent (15–27 responses). These questions sought important information like the volunteer’s likelihood to recommend CEP to friends, or CEP actions that could have helped the volunteer experience. A refined survey could reveal areas where volunteers feel less engaged or connected. Addressing these areas should then increase volunteer satisfaction and retention. Ensuring that all volunteers are connected and engaged during their work sessions at tax sites will allow CEP to benefit from additional returning and highly trained volunteers.
More directly related to volunteer retention, we suggest decreasing or eliminating the 30-hour minimum participation requirement. Survey results have already demonstrated this policy’s potential impact on retention. Instead, we suggest that CEP establish a reward system that offers recognition based on the number of hours worked during a single tax season, and use 20- or 30-hour commitments as milestones within that system. The reward system should include a longevity scale that recognizes length of service for returning volunteers.
Additionally, CEP should consider providing learning and development opportunities to build stronger connections with volunteers. Improvements to education and training could be especially helpful with encouraging more participation in the quality review process. Along with other initiatives, attention to learning and development has the potential to help volunteers feel more like partners in CEP’s achievements.
Recommendation 6: Acquire data regarding employer‐based volunteer participation to identify employer motivation and employee decision‐making factors.
2014 data on returning volunteers reflect a large discrepancy in return rates among employers, as shown in Table 5. Among employers, AT&T stood out with an extremely high rate of returning volunteers, and the City of Chicago and JP Morgan Chase also boasted relatively high retention rates. Why are these employers so different from others? This metric requires more analysis to determine how CEP might influence employer or volunteer behavior to maximize the initial decision to participate or the later decision(s) to return.
The data might only be a result of random fluctuations; on the other hand, the unusually high number of returning volunteers at AT&T and other organizations may have an identifiable impetus. Particularly, CEP should seek businesses that emphasize corporate social responsibility or require their employees to volunteer in the community as potential partners. Those organizations may foster an organizational culture that is friendly to giving, or employ individuals who are more generous. They may simply communicate volunteer opportunities to their staff with greater consistency than other organizations. However, no data are available that would serve to identify potential causal factors such as these.
26
Therefore, we recommend that CEP investigate the volunteer-employer relationship, specifically for those employers who provide a high volume of repeat volunteers. In doing so, it may develop an understanding of why such differences exist. If CEP identifies an employer-specific motivator for volunteers, it can not only look for it elsewhere, but also suggest and encourage it among other metro Chicago employers.
Systematically Evaluate Expansion
By incorporating information from the interviews we conducted and the academic research we examined, we have identified criteria for CEP to use when selecting specific locations for providing VITA services. Analysis of these attributes will enable CEP to focus its efforts on ensuring the most at-need populations fully benefit from free tax preparation. Variables explored include geographic, demographic, and community partner characteristics. CEP can apply these criteria not only to select future sites, but also to evaluate current sites.
Recommendation 7: Systematically apply a quantitative framework to evaluate neighborhood suitability for tax preparation sites.
Taking the VITA program, metro Chicago demographics, and CEP’s operations into account, we identified four considerations that collectively form a framework for CEP to evaluate neighborhood suitability for its tax preparation sites: client travel, community networks and partnerships, accessibility and convenience to volunteers, and demographic factors. In addition to using this framework for future expansion, CEP can use it retroactively to prepare a relative appraisal of existing sites. Data and analysis of current client travel appear in appendix D; we address the full set of selection considerations in detail in appendix E.
Within each of these four areas, CEP should first determine which metrics it finds most useful and appropriate for rank comparison of alternatives. Then, CEP must balance these quantitative criteria with a more subjective determination: How much weight should be applied to each area or metric? That type of decision making is beyond the scope of our analysis; only CEP’s leadership can make those decisions, based on organizational priorities, available resources, and other imperatives (board guidance, donor restrictions, etc.).
As an example, CEP’s neighborhood analysis has considered client travel. Travel is a time and cost burden to clients, and may serve as a deterrent that prevents potential clients from accessing services due to difficulty with transportation, employment requirements, or disability. Based solely on the client travel criteria, CEP could prioritize three potential locations for further analysis:
Hanover Park North Side/Albany Park Area (near the I-90/I-94 split) Harvey (near the transportation center)
However, client travel alone is insufficient for full evaluation of neighborhood potential. Appendix D shows many clients traveled more than five miles to a CEP site, but it doesn’t take into account potential clients who were unwilling or unable to do so. While these neighborhoods

27
are particularly suitable from the client travel perspective, they may score very low on demographic factors and have few or relatively weak community partnerships.
Given the complicated interactions among these criteria, subjective evaluation will always be present. However, using this framework and a weighted decision matrix will help guide analysis and ensure all relevant factors receive sufficient scrutiny.
Recommendation 8: Adopt a comprehensive set of criteria to evaluate and select specific site locations.
Once CEP decides to target a particular neighborhood for expansion, assessment shifts to identification of a specific location within that area. As with neighborhood selection, we understand that certain elements of the site selection process are unavoidably subjective (e.g., quality, stability, and cooperation with specific potential community partners). However, to guide the evaluation and selection process, CEP should employ a set of site selection criteria that permit a rational, focused comparison of choices: community partner relationships, the availability of transportation or parking, client employment factors, and real estate valuation. See appendix F for a full discussion.
Limitations and Additional Research
During our research and analysis, we identified limitations and areas where additional research would be helpful. We enumerate and elaborate on several of these here to inform CEP’s short-term response and provide guidance for long-term actions.
Limitations
Several limitations prevent us from making definitive statements regarding CEP client data, Census Bureau data, or particular elements of CEP’s site operations. Where these limitations impinge on our analysis, we avoid making specific, definitive suggestions or recommendations. For instance, when we demonstrate how CEP might appraise client travel as part of neighborhood evaluation, we only make general recommendations for potential expansion to certain neighborhoods, and we do not attempt to identify specific new site locations.
Race and Ethnicity
Census and survey data collection techniques now generally offer citizens more choices for reporting their race and ethnicity; when this is the case, the resulting data are more complex and analysis is more difficult. Our report is no exception. CEP client survey respondents may report multiple races and ethnicities. For example, a respondent may consider themselves white and Hispanic, White and Black, or any other combination of available categories. We selected the first-named category within the internal CEP data. From Census data, we selected a racial category alone (White alone, Black alone, etc.).
Furthermore, in our comparison of site locations and neighborhood populations, we cannot determine with accuracy the race or ethnicity of clients or data elements marked “Other” or “Unknown.” Some communities, such as Waukegan and Pilsen, have high percentages of “Some

28
Other Race.” Among other factors, certain Hispanic identifications can skew the count for this category. For example, Cuban and Mexican are counted as “Other” within Census Bureau tabulations: “Respondents reporting entries such as multiracial, mixed, interracial, or a Hispanic, Latino, or Spanish group (for example, Mexican, Puerto Rican, Cuban, or Spanish) in response to the race question are included in this category” (Census 2013a).
Surveys
CEP should exercise caution when attempting to derive meaning from its survey responses. While they may generate useful information, the client and volunteer surveys also subject to participation and response bias. Research has shown that the design of survey questions may elicit information different from the intent or goal of the research (Rea and Parker 2007).
Because CEP does not randomize surveys, and response is optional, participation bias may skew survey results to overemphasize the views of those who decide to respond. For example, although 2013 client exit surveys show more than 97 percent of clients indicated that their tax site was “convenient and easy to get to,” these numbers only reflect those who patronized the site. Because CEP likely did not survey others who might have found it difficult or impossible to reach its sites, that response is more susceptible to bias.
Response bias may affect the survey results as well, as volunteers and clients are susceptible to reluctance about expressing their true opinions and experiences. The CEP volunteer survey has collected detailed information about tax sites, individual staff members, volunteer references and suggestions, and contact information. The inclusion of this information makes it possible for a data analyst to directly link responses to an individual volunteer. Reducing anonymity has been shown to likewise reduce the proportion of negative comments from survey respondents (Fuller 1974). Likewise, the reported satisfaction, training levels, and engagement of CEP volunteers on surveys may be biased upward.
Neighborhood and Site Evaluation
Judging the suitability of a specific neighborhood requires direct observation by individuals “on the ground,” and their knowledge acquired through experience, in addition to thorough data analysis. CEP staff considers these factors when choosing new locations and should continue to do so.
First, interview subjects noted that one of the most important criteria in selecting a location is the strength and knowledge of a community partner. Knowledgeable individuals can determine the ability of an organization to work with partners, host a short-term work site, and support necessary infrastructure.
Second, participants said that certain neighborhoods are subject to reputational issues or stigma. For example, volunteers may perceive a certain neighborhood as unsafe, or clients may not wish to cross certain neighborhood or area boundaries. Understanding specific neighborhood characteristics in the Chicago area is necessary to identify and minimize these unquantifiable factors for clients and volunteers.

29
Last, the weighting of any criteria for the framework depends in part on the value judgments of the organization. While we have included a framework that addresses need for volunteers, proper density of clients, households in highest need, targeting who benefit most from CEP tax services, and other qualitative criteria, the CEP board and/or leadership must choose the order or weighting of these criteria.
Areas for Further Research
Some topics are beyond the scope of this report. We think that further research in these areas would generate results that CEP will find useful in applying our recommendations, or expanding beyond them to further the organization’s efforts.
Decline in Average Refund
Analysis of CEP tax return data shows that the average client refund has declined somewhat, from $1,688 in 2010 to $1,551 in 2014. Anecdotal evidence attributes some of the decrease in client refund to the expiration of certain tax credits targeted at low-income working individuals, such as the Making Work Pay Tax Credit present authorized by the American Recovery and Reinvestment Act in 2009 and 2010. However, to ensure that clients receive maximum refunds, and that CEP services continue to result in a high return back into the community, staff could complete an analysis of particular tax credits or programs utilized in client returns. The latest dataset of client tax return data, via the Taxwise programs, allows for greater detail about particular tax schedules and forms completed as part of the return preparation program. Staff can also examine trends in client usage of particular schedules or tax programs to determine if volunteers need additional training in more complicated or increasingly prevalent sections of the federal tax code.
Promotion and Outreach
Much media coverage of the tax season tends to occur at the beginning and end of the filing period, when the time element makes tax preparation most “newsworthy.” Those periods also correspond to the most popular times when people generally tend to file: very early, to get a refund as soon as possible, or at the very end when faced with the filing deadline. These factors correlate with a pattern of observed spikes in processing volume shown in figure 9.
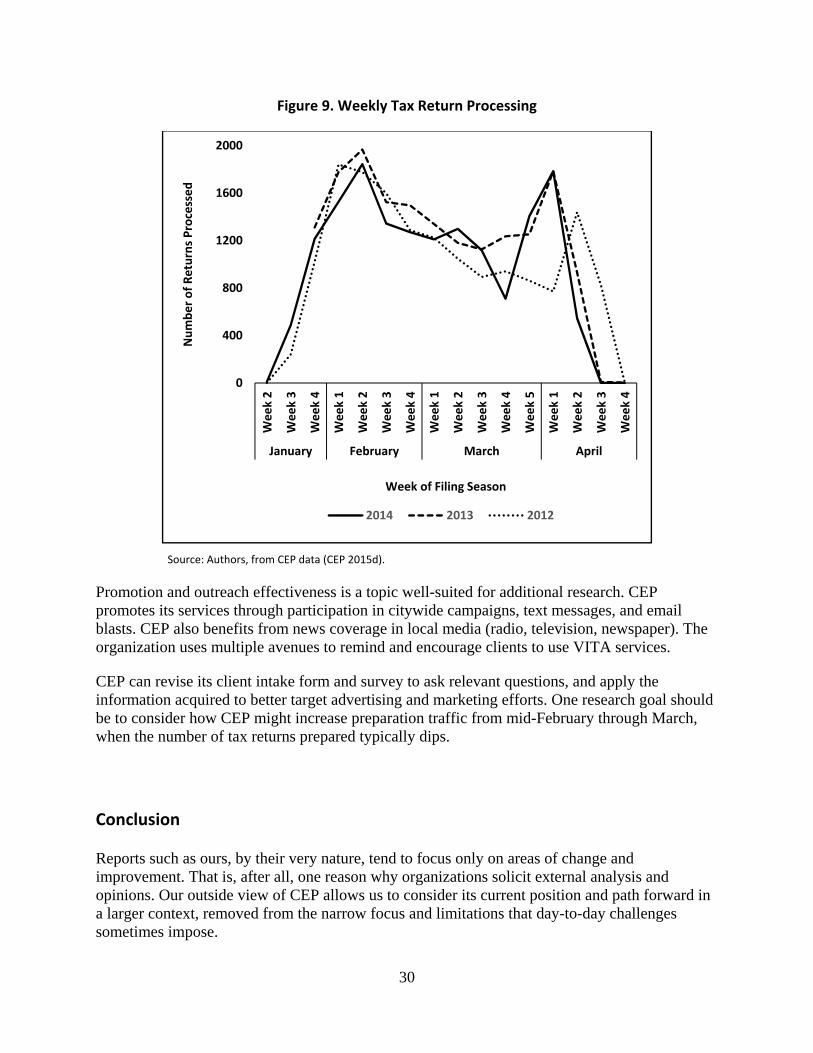
30
Figure 9. Weekly Tax Return Processing
Source: Authors, from CEP data (CEP 2015d).
Promotion and outreach effectiveness is a topic well-suited for additional research. CEP promotes its services through participation in citywide campaigns, text messages, and email blasts. CEP also benefits from news coverage in local media (radio, television, newspaper). The organization uses multiple avenues to remind and encourage clients to use VITA services.
CEP can revise its client intake form and survey to ask relevant questions, and apply the information acquired to better target advertising and marketing efforts. One research goal should be to consider how CEP might increase preparation traffic from mid-February through March, when the number of tax returns prepared typically dips.
Conclusion
Reports such as ours, by their very nature, tend to focus only on areas of change and improvement. That is, after all, one reason why organizations solicit external analysis and opinions. Our outside view of CEP allows us to consider its current position and path forward in a larger context, removed from the narrow focus and limitations that day-to-day challenges sometimes impose.
0
400
800
1200
1600
2000
Week 2
Week 3
Week 4
Week 1
Week 2
Week 3
Week 4
Week 1
Week 2
Week 3
Week 4
Week 5
Week 1
Week 2
Week 3
Week 4
January February March April
Number of Returns Processed
Week of Filing Season
2014 2013 2012
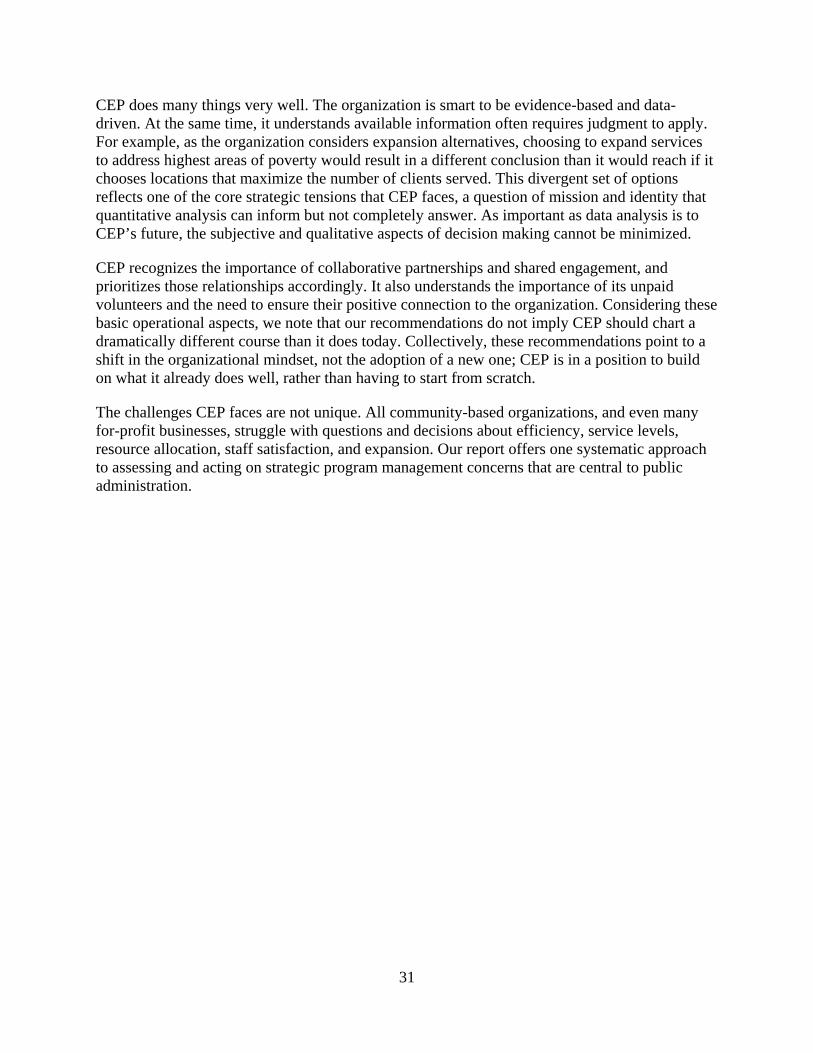
31
CEP does many things very well. The organization is smart to be evidence-based and data-driven. At the same time, it understands available information often requires judgment to apply. For example, as the organization considers expansion alternatives, choosing to expand services to address highest areas of poverty would result in a different conclusion than it would reach if it chooses locations that maximize the number of clients served. This divergent set of options reflects one of the core strategic tensions that CEP faces, a question of mission and identity that quantitative analysis can inform but not completely answer. As important as data analysis is to CEP’s future, the subjective and qualitative aspects of decision making cannot be minimized.
CEP recognizes the importance of collaborative partnerships and shared engagement, and prioritizes those relationships accordingly. It also understands the importance of its unpaid volunteers and the need to ensure their positive connection to the organization. Considering these basic operational aspects, we note that our recommendations do not imply CEP should chart a dramatically different course than it does today. Collectively, these recommendations point to a shift in the organizational mindset, not the adoption of a new one; CEP is in a position to build on what it already does well, rather than having to start from scratch.
The challenges CEP faces are not unique. All community-based organizations, and even many for-profit businesses, struggle with questions and decisions about efficiency, service levels, resource allocation, staff satisfaction, and expansion. Our report offers one systematic approach to assessing and acting on strategic program management concerns that are central to public administration.
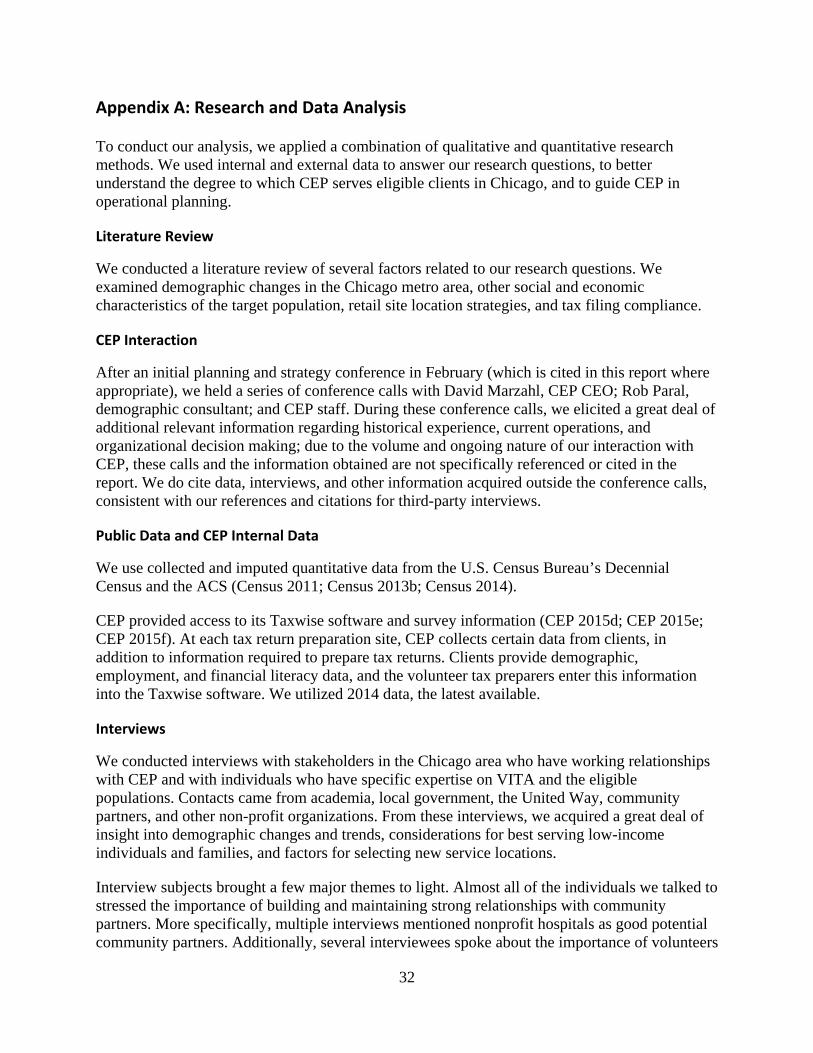
32
Appendix A: Research and Data Analysis
To conduct our analysis, we applied a combination of qualitative and quantitative research methods. We used internal and external data to answer our research questions, to better understand the degree to which CEP serves eligible clients in Chicago, and to guide CEP in operational planning.
Literature Review
We conducted a literature review of several factors related to our research questions. We examined demographic changes in the Chicago metro area, other social and economic characteristics of the target population, retail site location strategies, and tax filing compliance.
CEP Interaction
After an initial planning and strategy conference in February (which is cited in this report where appropriate), we held a series of conference calls with David Marzahl, CEP CEO; Rob Paral, demographic consultant; and CEP staff. During these conference calls, we elicited a great deal of additional relevant information regarding historical experience, current operations, and organizational decision making; due to the volume and ongoing nature of our interaction with CEP, these calls and the information obtained are not specifically referenced or cited in the report. We do cite data, interviews, and other information acquired outside the conference calls, consistent with our references and citations for third-party interviews.
Public Data and CEP Internal Data
We use collected and imputed quantitative data from the U.S. Census Bureau’s Decennial Census and the ACS (Census 2011; Census 2013b; Census 2014).
CEP provided access to its Taxwise software and survey information (CEP 2015d; CEP 2015e; CEP 2015f). At each tax return preparation site, CEP collects certain data from clients, in addition to information required to prepare tax returns. Clients provide demographic, employment, and financial literacy data, and the volunteer tax preparers enter this information into the Taxwise software. We utilized 2014 data, the latest available.
Interviews
We conducted interviews with stakeholders in the Chicago area who have working relationships with CEP and with individuals who have specific expertise on VITA and the eligible populations. Contacts came from academia, local government, the United Way, community partners, and other non-profit organizations. From these interviews, we acquired a great deal of insight into demographic changes and trends, considerations for best serving low-income individuals and families, and factors for selecting new service locations.
Interview subjects brought a few major themes to light. Almost all of the individuals we talked to stressed the importance of building and maintaining strong relationships with community partners. More specifically, multiple interviews mentioned nonprofit hospitals as good potential community partners. Additionally, several interviewees spoke about the importance of volunteers

33
at tax assistance sites. Interestingly, one interview subject pointed out an inverse relationship between the number of volunteers and clients in a given community: as the number of volunteers from a given area increases, it is more likely that the community is affluent and has a lower percentage of low-income families.
Individuals from the financial sector noted the groups that tend to have the largest tax returns are single-family households with several children and those in the top bracket of the EITC.
Explanatory Notes
All dollar amounts provided in this report are nominal and are not adjusted for inflation.
All years listed for tax filing refer to the actual calendar year, which represents the previous year’s filing season. For example, “2014 data” refers to returns filed in 2014 for the 2013 tax year, during the filing season that ended April 15, 2014.
For brevity and clarity, we use five categories of race and ethnicity. Black, White, Hispanic, and Asian correspond to the Census Bureau categories of the same name. For Native American, we apply the CEP naming convention to the Census Bureau’s “American Indian” category. Census reporting that does not correspond to these five categories is reflected as “Other” in our analysis.
Terminology: Neighborhood, Community Area, and Townships
Illinois subdivides the majority of counties into geographically similar units called “townships.” Because these subdivisions are similar in land area and consistent across the state, we use these standard boundaries as our community-level unit of analysis. For example, CEP operates a tax site in the city of Joliet. We compared data from this tax site to Census Bureau data for Joliet Township, a separate and distinct political subdivision.
For tax sites within Chicago city limits, we instead use “community areas,” a set of commonly accepted geographic boundaries created by the University of Chicago (Chicago Historical Society 2015). In these circumstances, we tabulated data by census tract and summed throughout a particular community area. For example, the tax preparation site in the Bronzeville neighborhood is within the limits of Grand Boulevard, also known as Community Area 38.
We use the generic term “neighborhood” to refer to a township or community area within which a CEP site is located. The following maps in Figures A1–A3 demonstrate this relationship for three sites within the City of Chicago.

34
Figure A‐1 (left). Pilsen Site and Neighborhood Figure A‐2 (right). Brighton Park Site and Neighborhood
Source: Rob Paral, Rob Paral and Associates.
Figure A‐3. North Lawndale Site and Neighborhood
Source: Rob Paral, Rob Paral and Associates.

35
Supplemental Data
Table A-1 shows race and ethnicity data for five sites where we identified notable differences among sites, and between some sites and their surrounding neighborhoods. Neighborhood household totals (total and income-eligible) are greater than the sum of the categories because households can report multiple racial or ethnic identities (see “Limitations” section). Figures A-4 through A-6 show the proportional distribution of gender, filing status, and income at the same five sites; variability of these factors is much lower.
Table A‐1. Neighborhood and Site Demographic Data: Race and Ethnicity
Households Clients
Total
Income‐Eligible
Percentage Income‐Eligible
Number Served
Percentage of Clients
Percentage of Households
Waukegan
White 15,700 8,515 54.2% 68 9.5% 0.8%
Black 7,325 4,966 67.8% 102 14.3% 2.1%
Native Am 111 49 44.1% 2 0.3% 4.1%
Asian 649 319 49.2% 27 3.8% 8.5%
Other 4,716 2,876 61.0% 19 2.7% 0.7%
Hispanic 12,450 7,486 60.1% 490 68.7% 6.5%
Unknown 5 0.7%
Total 29,048 17,037 58.7% 713 100.0% 4.2%
Pilsen
White 6,364 1,424 22.4% 14 1.4% 1.0%
Black 646 534 82.7% 23 2.2% 4.3%
Native Am 36 33 91.7% 1 0.1% 3.0%
Asian 207 157 75.8% 6 0.6% 3.8%
Other 4,659 3,222 69.2% 0 0.0% 0.0%
Hispanic 8,802 6,002 68.2% 978 94.5% 16.3%
Unknown 13 1.3%
Total 12,255 8,241 67.2% 1035 100.0% 12.6%
Evanston
White 21,004 7,140 34.0% 102 26.8% 1.4%
Black 4,871 2,627 53.9% 145 38.1% 5.5%
Native Am 42 19 45.2% 3 0.8% 15.8%
Asian 2,286 1,262 55.2% 34 8.9% 2.7%
Other 390 201 51.5% 42 11.0% 20.9%
Hispanic 1,786 917 51.3% 52 13.6% 5.7%
Unknown 3 0.8%
Total 29,016 11,586 39.9% 381 100.0% 3.3%
36
Table A‐1 (continued). Neighborhood and Site Demographic Data: Race and Ethnicity
Households Clients
Total Income‐Eligible
Percentage Income‐Eligible
Number Served
Percentage of Clients
Percentage of Households
Brighton Park
White 7,579 1,204 15.9% 33 10.9% 2.7%
Black 218 132 60.6% 28 9.2% 21.2%
Native Am 47 25 53.2% 2 0.7% 8.0%
Asian 733 352 48.0% 6 2.0% 1.7%
Other 2,942 1,870 63.6% 4 1.3% 0.2%
Hispanic 7,318 5,845 79.9% 225 74.0% 3.8%
Unknown 6 2.0%
Total 11,572 7,531 65.1% 304 100.0% 4.0%
Lawndale
White 413 124 30.0% 14 2.3% 11.3%
Black 10,085 7,741 76.8% 460 76.3% 5.9%
Native Am 7 3 42.9% 1 0.2% 33.3%
Asian 7 7 100.0% 4 0.7% 57.1%
Other 271 136 50.2% 3 0.5% 2.2%
Hispanic 534 287 53.7% 94 15.6% 32.8%
Unknown 27 4.5%
Total 10,852 8,490 78.2% 603 100.0% 7.1%
Source: Authors, from CEP and ACS data (CEP 2015d; Census 2014).
Figure A‐4. Site Comparison of Client Demographics: Gender
Source: Authors, from CEP data (CEP 2015d).
0%
20%
40%
60%
80%
100%
Waukegan Pilsen Evanston Brighton Park Lawndale
Percentage
of To
tal Clients
Site Locations
Male Female Married Filing Jointly Transgender Unknown

37
Figure A‐5. Site Comparison of Client Demographics: Filing Status
Source: Authors, from CEP data (CEP 2015d).
Figure A‐6. Site Comparison of Client Demographics: Income
Source: Authors, from CEP data (CEP 2015d).
0%
20%
40%
60%
80%
100%
Waukegan Pilsen Evanston Brighton Park Lawndale
Percentage
of To
tal Clients
Site Location
Single Head of HouseholdMarried Filing Separately Married Filing JointlyQualifying Widow Unknown
0%
20%
40%
60%
80%
100%
Waukegan Pilsen Evanston Brighton Park Lawndale
Percentage
of To
tal Clients
Site Location
$0 ‐ $12,500 $12,501 ‐ $25,000 $25,001 ‐ $37,500 $37,501 ‐ $50,000 $50,000+

38
Appendix B: Return Preparation Costs to Filers
Taxation is a fact for the vast majority of people in the United States, so low-income individuals and families face a choice. They can self-prepare their returns, although many lack the specialized knowledge to accurately complete the forms. They may also utilize a paid tax preparer. Most commonly, filers patronize a major tax preparation franchise, such as H&R Block, Jackson Hewitt, or Liberty Tax Service. Alternatively, filers who fall below designated income limits can obtain the services of a VITA provider, which prepares and files tax returns at no monetary cost to the filer.
Aside from tax preparation fees, filers consider additional opportunity costs. First, they base the decision to self-prepare, hire a firm, or use a VITA preparer on time. Paid preparers may offer options such as drop-off service or pre-scheduled appointments that are not available at all VITA sites. CEP has offered drop-off service at a limited number of locations, but the majority of sites operate on a walk-in basis. VITA sites, which have capacity constraints limited by space and volunteer availability, often require clients to wait in line on a walk-in basis. Filers also choose tax preparation options based on time to travel, which implies CEP should locate tax sites near or have access to public transportation (Marzahl et al. 2015; Brown 2015).
Convenience is another strong, closely related factor that influences tax preparation decisions. Informal studies have shown that individuals who choose a VITA tax preparation site would rather travel to a location with expanded hours and large availability than choose a more limited site near their workplace or home. The convenience of fitting an appointment into a busy schedule, coupled with a short wait, made large sites more attractive than smaller, appointment-based locations in a community (Brown 2015).
Potential clients may base their decisions on reputation or environment (Halpern-Meekin 2015). For example, potential clients may view attending a volunteer tax site as a negative experience due to the aspect of receiving charity or assistance from nonprofit service organizations. A filer who perceives oneself as having risen out of poverty or no longer having financial need may prefer a paid tax preparer as a declaration of status or class. Foregoing an entire customer service experience—more comfortable surroundings, dedicated office space, and the brand experience— is a related opportunity cost (Halpern-Meekin 2015).
Last, individuals make choices based on monetary cost. Paid tax preparers charge a fee based on number of federal and state returns filed, as well as the complexity of the return in certain circumstances. For example, one interview respondent reported a woman who was quoted a $5,000 fee for processing seven years of returns. VITA tax preparers offer this service at no charge, but may limit the complexity of the return based on the availability and knowledge of their volunteers (VanSingel 2015).

39
Appendix C: Volunteer Survey
We suggest CEP improve its volunteer survey process to improve respondent participation, fill in knowledge gaps, and generate more specific data on individual volunteers, their motivations, and their experience. An enhanced survey process should enable CEP to better assess its VITA services through the lens of those who work most closely with its clients.
Survey Design
CEP could revise some of the questions on the current volunteer survey to improve the clarity of the feedback. For example, question seven asks, “On a scale of 0–10 (10 being the highest), how likely are you to recommend volunteering with CEP to a friend or colleague?” (CEP 2015e) We recommend that CEP forgo the 10-point scale on some questions in favor of a graduated scale such as “very likely,” “somewhat likely,” “neutral,” “somewhat unlikely,” and “very unlikely.” A qualitative scale limits the opportunity for extreme response or agreement bias and tends to provide more accurate survey results when respondents are asked to share feelings or opinions.
In addition, CEP is likely to repeat a survey in successive years, it would be helpful to maintain questions in as similar a fashion as possible, to allow for longitudinal evaluations and comparisons.
If CEP is not already doing so, it should prepare surveys using survey design techniques and principles. Many texts are available that explain potential pitfalls and provide useful guidance for survey creation; Rea and Parker (2014) is one such reference.
Timing and Frequency
The timing of survey research is an important consideration. The time at which a survey is administered can bias individual responses. Additionally, if surveys are given at differing times across sites or populations, the results of the surveys are less valuable. Attempting to make comparisons and draw conclusions from survey data collected at different times from different populations is ill-advised. Temporal effects may skew the data in a systematic fashion.
Additionally, CEP should allow enough time for volunteers to be thoughtful with their feedback, while being mindful to capture information within a reasonable timeframe. A long delay in the time between the volunteer’s experience and receipt of the survey may limit quality feedback.
Development of multiple, shorter surveys offered at different points during the tax season could counteract concerns about delayed, low-quality feedback. An initial survey during onboarding may prove helpful, as well as a brief survey for all volunteers at the beginning of the tax season. Tailoring surveys to new volunteers or to the particular time of the tax season could provide timelier, focused information that allows management to react more quickly.
Questions and Suggestions
If CEP reconsiders its survey process as suggested in Recommendation 5 (improving volunteer recruitment, satisfaction, and retention), several questions not included in the existing survey would help shed light on volunteer motivations and insights:

40
Why did you decide to volunteer? What do you think makes for an effective volunteer? What would motivate you to volunteer as a quality reviewer? If you could change one thing about your VITA experience, what would it be? How could the VITA service at your site be improved? What does your site do best? What role do you hope to have with CEP’s VITA services next year?
While many of these questions are open-ended, and may be time-consuming to log, acquiring more useful input from the field should be worth the effort.
Any survey design or redesign effort should be attentive to the different response rates among questions. Questions that have lower response rates should be refined or restated; the reluctance of respondents to answer these questions could be a function of the survey design, or it might indicate a problem area in operations that needs management-level attention. Additionally, CEP could make an effort to openly solicit and capture general and specific suggestions from field staff and volunteers, within the survey structure or as a separate initiative.
Differences in site performance and volunteer return rate across sites suggest unknown causes are influencing outcomes. Information about these influences is best captured through surveying the volunteers who experience them firsthand. We suggest CEP direct extra attention toward returning volunteers, as their knowledge may prove particularly useful.

41
Appendix D: Evaluation of Client Travel
We performed a detailed analysis of client travel from four areas, denoted by red circles in figure 8. Examining these areas (Schaumburg–Roselle–Glendale, Northwest Chicago and Suburbs, West Cook, and South Cook), to determine where clients from these areas obtained service. This appendix is an example of how client travel might serve as one criterion in the systematic evaluation of neighborhoods we recommend that CEP conduct to establish new locations.
Schaumburg–Roselle–Glendale
In three of the four overlapping areas, CEP’s most centralized site in the Loop was the most patronized location. However, for Schaumburg–Roselle–Glendale clients, Elgin was by far the most patronized site, with 293 of 313 clients living in that area choosing that site. Figure D-1 shows 250 households in the Schaumburg–Roselle–Glendale area that traveled five miles or more to the Elgin site at Gail Borden Public Library.
The Schaumburg–Roselle–Glendale area may be the outlier of the four areas because Elgin is closer. Suburban residents may have personal discomfort with Chicago, or lack of a reason to travel into Chicago for tax preparation. Residents of this area may also be more likely to have access to a vehicle rather than having to rely on public transportation to a site.
Figure D‐1. Schaumburg–Roselle–Glendale Clients at Elgin Site
Source: Authors from CEP data (CEP 2015d), using BatchGeo (BatchGeo 2015).
CEP could consider a new site location in Hanover Park. Hanover Park has a Metra station that allows for public transportation accessibility and is near the center of the main clusters of clients traveling to the Elgin site from the nearby towns of Streamwood and Bartlett. Placing a site in the area would allow these clients to obtain services closer to their residence and reduce the burden of travel on volunteers who live nearby.

42
Northwest Chicago and Suburbs
For the 564 Northwest Chicago and Suburbs clients, the most popular sites were the Uptown site at Truman College (279 clients), followed by the Loop (150 clients), with Evanston (56 clients) in third place despite being closer than the Loop. Figure D-2 shows 250 Northwest Chicago and Suburbs households that traveled five miles or more to the Uptown site and the 150 households that traveled to the Loop. Figure D-3 shows the 56 households that traveled to Evanston.
The massive popularity of the Uptown site in the Northwest Chicago and Suburbs area is most likely due to neutral site location (Truman College) and easy public transportation access—it is less than one block away from the Wilson Street Red Line Station. The Loop location is the second highest in popularity, likely for similar reasons of accessibility. The Evanston region is a distant third although it is in a neutral space (public library) and next to an L-train stop (Davis–Purple Line). However, the Evanston site is newer and may be relatively unknown.
We suggest CEP consider a new site location in the North Side/Albany Park area, near the I-90 and I-94 split. As figure D-2 shows, both a transportation hub and a large cluster of clients who travel to the Uptown or the Loop sites are in the area.
Figure D‐2. Northwest Chicago and Suburbs Area Clients at Uptown (left) and Loop (right) Sites
Source: Authors from CEP data (CEP 2015d), using BatchGeo (BatchGeo 2015).

43
Figure D‐3. Northwest Chicago and Suburbs Area Clients at Evanston Site
Source: Authors from CEP data (CEP 2015d), using BatchGeo (BatchGeo 2015).
West Cook Area
The 443 West Cook area clients patronized site the Loop (145 clients), followed by Pilsen (114 clients) and Lawndale (68 clients). Figure D-4 shows the West Cook Area households that traveled to the Loop and Pilsen.
Both the Loop and Pilsen may be equally accessible to these residents, as no clear geographical delineations are evident to explain a choice of one site over the other. However, those traveling to the Loop appear to live farther west, while those traveling to Pilsen appear to be located further south. We do not suggest a new site location here due to the even split in travel to the two sites.
South Cook Area
Almost half of the 642 South Cook area clients patronized Chicago Heights (319 clients), with the Loop second (118 clients). Figure D-5 on page 40 shows the South Cook Area households that traveled to Chicago Heights and the Loop.
The South Cook area was another outlier, as the majority of residents traveled to the Chicago Heights site. These clients were located in the far Southern regions of the area, while those who traveled to the Loop instead tended to be located a bit further north and closer into the Chicago city limits. The geographic difference is slight, though, with overlapping distribution between the two maps.

44
Figure D‐4. West Cook Area Clients at Loop (left) and Pilsen (right) Sites
Source: Authors from CEP data, using BatchGeo (BatchGeo 2015).
Figure D‐5. South Cook Area Clients at Chicago Heights (left) and Loop (right) Sites
Source: Authors from CEP data (CEP 2015d), using BatchGeo (BatchGeo 2015).

45
Appendix E: Neighborhood Selection Framework
To evaluate proposed areas for expansion, we developed a comprehensive framework that addresses an individual’s selection of a tax preparation solution, CEP’s need to reach potential customers, and its imperative to meet operational requirements. Many factors are important, but certain criteria outweigh others. If CEP does not address client needs when selecting a neighborhood, a new site could be underutilized no matter which location it chooses, and thus the site selection criteria would be overshadowed. CEP can also evaluate its existing locations using this framework.
Client Travel
CEP has considered this criterion in recent decision making—it chose Evanston, in particular, largely because it recognized a large number of its Uptown clients came from Evanston. As we described in appendix D, a significant number of clients travel more than five miles to reach a CEP site, incurring a time and cost burden that may be a deterrent to potential clients.
Interview respondents provided mixed opinions on the necessity of public transportation. Some identified easy access to the tax site as a primary concern, suggesting that VITA providers should always place tax preparation sites in close proximity to transit hubs, such as bus or subway terminals (Brown 2015). Other respondents noted that social service agencies such as food pantries have located in commercial areas without the same level of transportation support. In these cases, clients still used the services of the agencies, even without the convenience of public transportation (Bosley 2015).
We recognize that a community agency can be located in an area without public transportation and that many clients would find a way to utilize desired services regardless of location. A study conducted in New York City concluded that clients preferred traveling to a location with convenient hours and a short wait time. In fact, they considered this combination advantageous over a location with limited hours in their own neighborhood. Thus, in New York City the VITA strategy was to open large sites near transit hubs (Brown 2015).
However, to maximize CEP’s reach to eligible filers who would benefit from its services, we believe placing tax preparation sites near bus stops, transit hubs, and other easily accessible modes of public transportation is an important consideration. Of additional importance, from our initial analysis, most public transportation lies along major corridors. These routes may also feature heavy foot traffic, a boon to CEP’s advertising potential (Readey 2015). All things considered, being in the “middle of it all” is highly advantageous to CEP’s mission (Readey 2015). However, high traffic locations near public transit also command high prices.
Community Partnerships
Almost all interview subjects noted the necessity of strong community partnerships for successful operations. They enable effective advertising, increase client referrals, and augment the potential pool of volunteers. Several interview subjects noted community partnership “brands” might be stronger than CEP’s brand, and thus lead to situations where a client may believe the host partner was preparing their taxes, not CEP. The shadowing effect illustrates the

46
importance of these partnerships, as advertising and name recognition of partner and community organizations may dominate the value of the actual tax preparation work accomplished.
From our outside standpoint, we cannot accurately judge which communities have strong non-profit and social services networks. The success of CEP’s partnerships with other organizations may depend on personal relationships. However, the importance of community partnerships and networks cannot be understated; they are crucial for enduring and successful tax preparation sites. CEP’s recognition that connectedness of community partners to other local services and organizations is essential for an effective partnership is evident in its prioritization of community partnerships during location decision making (Marzahl et al. 2015).
Accessibility and Convenience to Volunteers
One of the primary “costs” of free preparation services is waiting time. Professional tax preparers or experienced volunteers can prepare a return faster than a new volunteer can, so the supply of quality volunteers is a priority for any tax site—not just as a mechanism to maintain operations, but to increase capacity and decrease client wait times.
Geographic proximity to the site would also attract new volunteers. For example, West Chicago’s location includes nearby populations of affluent volunteers and a proximate population of low-income clients, providing the ideal conditions for a tax site (see figure 8).
Demographic Factors
Client characteristics consist of demographic descriptors that can be discretely compared across potential neighborhoods. More often than not, ACS data from the Census Bureau measures these variables at the township level. Collectively, quantitative characteristics such as income, household makeup, Supplemental Nutrition Assistance Program uptake, and English language proficiency describe the potential clients for CEP in a given township or community area.
Median Household Income
The most important descriptor is income, because it determines if residents are eligible for VITA services. CEP should use the ACS variable median individual income at the neighborhood level to identify high concentrations of eligible populations. Similarly, household income can measure couples who file jointly. Together, these variables allow CEP to locate in areas with the highest poverty rates, where it would conceivably maximize VITA’s effect.
Marital Status, Single Parent, and Family Size
Individuals with children, particularly those with two or more, are able to receive the largest EITC. Interviewees suggest that single parents are the most vulnerable and in need of VITA (Readey 2015). Using ACS variables such as with own children under 18 years models these situations and targets neighborhoods with high co-incidence of families, especially single-parent families, and poverty. Targeting this population makes sense; it gains the most from CEP’s presence because it is the most vulnerable and often eligible for a high EITC.

47
Benefit Recipients
To control for behavior associated with an uptake of CEP’s services, CEP can evaluate the ACS variable with food stamp/SNAP benefits. This variable describes people who live in poverty and utilize public services, as evidenced by their participation in the Supplemental Nutrition Assistance Program. They are excellent candidates for VITA services. Based on current use of public services, it stands to reason they would likely take advantage of VITA if it were readily available.
English Language Proficiency
Even if a potential neighborhood has many of the right demographic characteristics, volunteer tax preparers must be able to communicate effectively with clients. The primary language spoken presents a unique challenge and opportunity for CEP; if volunteers do not speak the language predominant in a neighborhood, it does not make sense to locate a site there.
Language barriers could impose costs on recipients, decrease satisfaction of volunteers, reduce overall service efficiency, and ultimately, constrain service uptake. On the other hand, other organizations have identified this cohort as some of the most vulnerable and at-need (Vasseur 2015), and CEP has expressed interest in serving Chicago’s burgeoning non-English speaking population (Marzahl et al. 2015).
To locate these potential clients, the ACS variable speak English less than “very well” indicates areas with residents who might otherwise be incapable of communicating adequately with tax preparers, and who may be disconnected from the mainstream financial system. The ACS data do not include residents’ primary language. However, it is sufficient to know whether they can speak English “very well” or not, because when a neighborhood under consideration is an area known to have many poor English speakers, other descriptors may indicate their primary language.
Other Considerations
Other considerations include location of “optimal” clients and neighborhood security.
Location of “Optimal” Clients
Several interviewees expressed a view that selecting an optimal tax site was not a question of finding clients, but rather prioritizing the needs of those who can benefit the most from VITA services. In practical terms, this group includes filers with a complex tax return. Complicating factors include multiple jobs, residency in multiple states, or unique family structures. This view also prioritized those who receive the highest tax refunds relative to income, as the income returned to the community provides the greatest return on investment in local social services programs (Castellanos-Butt 2015).
We recommend focusing on four demographic elements: percentage of single-parent family households, unemployment, percentage of family households with income under $50,000, and low percentage of high school graduates. These households would likely qualify for refundable

48
tax credits such as the EITC and the Child Tax Credit, and thus stand to benefit substantially from filing and receiving an accurate return.
Security of Neighborhood
The level of perceived or actual crime in a potential location should also play a role in site selection. Actual crime rates are quantifiable; however, the subjective perceptions that volunteers and clients have about crime and security are more important and much harder to measure. Although high crime areas may correlate with high poverty and other factors that would otherwise indicate a substantial need for services, the aversion of consumers or volunteers to travel to these areas makes them unsuitable. One solution is delivering services at neutral locations people perceive as accessible or welcoming to multiple demographics (Brown 2015). Transportation hubs provide neutrality, but other centralized sites in the community may also provide the needed neutral space. Similarly, some potential clients may be subject to an “intimidation factor” when they think of leaving their communities to go to the “big city” of Chicago (Medina 2015). This intimidation factor may build a case for locating sites in centralized suburban locations.
49
Appendix F: Site Selection Criteria
As CEP evaluates potential physical locations, it must consider the operational intricacies of these locations and other site-specific criteria. These qualitative aspects involve questions of place: specifically, partnering relationships, site accessibility, and site costs.
Host Partner Relationship
Just as community networks and partnerships are relevant at the neighborhood selection level, the relationship between CEP and its potential primary community partner is a dominating factor when choosing a specific site. A location’s success depends on the quality of the community partner that agrees to host the site. These organizations provide logistical support in addition to the tax site’s physical space, so it is essential that the partner organization have a close working relationship with the CEP and the community. These relationships are also essential because CEP typically chooses to partner with a host organization instead of placing its site in rented or purchased property.
The level of trust that the surrounding community has in the potential partner is pivotal as well. Other organizations providing tax-related services look to work with established and trusted long-term community partners, which makes advertising VITA services to their clients easier (VanSingel 2015; Cheng 2015). CEP’s placement of its newest VITA location in West Chicago, partnering with WeGo Together for Kids, a conglomerate of more than 50 organizations that provide services to support successful family life, reflects the importance of the relationship between a partner and its community. As a respected service provider with strong community integration, WeGo Together for Kids found it easy to partner with CEP to offer tax preparation as an additional service. WeGo Together for Kids stressed that ongoing dialog between CEP and a new partner is important, particularly so that the partner can ask questions as they arise during implementation and execution of VITA services (Lewe-Brady 2015).
Availability of Public Transit and/or Parking
Transportation and accessibility concerns are a main factor in assessing the potential viability of VITA sites. Locations must be accessible by public transportation or have adequate parking space; ideally, both would apply. As a complement to specific quantitative factors such as distance from transit stops or number of parking spaces, a site’s relationship to transportation hubs is a valuable consideration. In New York City, for example, survey respondents expressed a preference for traveling to larger, more centrally located sites with more volunteers over a smaller location in their neighborhood with fewer volunteers (Brown 2015). Transportation hubs have relevance in any suburban expansion, particularly if a location couples population density with special populations, transit access, and strong community partners (Readey 2015).
Operating Service Hours
The timing and quantity of a location’s operating service hours affects how clients access services. Potential VITA consumers may have multiple jobs, or one job with inconsistent hours and pay (Brown 2015). In suburban areas like Lake County, potential VITA clients who work may have a hard time accessing services because local public transportation is very limited in the

50
evening. Schedule inconsistencies may make it difficult for consumers to utilize public transportation to arrive at the VITA site or to utilize a site with incompatible operating hours (Morales 2015). One solution is for CEP to partner with local organizations to offer occasional VITA services, so-called “pop-up sites,” which enable a more flexible schedule without creating a full-time site (Morales 2015). Another way to address these concerns is offering additional services related to in-person tax preparation, such as scheduling appointments and texting clients when their when their spot in line comes up, or providing pagers when the wait is long (Quittman 2015). Implementing some small technological changes such as these would improve site quality and user experiences with VITA, which may help make the experience more appealing in comparison to other tax preparation options.
Real Estate Valuation
CEP cannot simply locate wherever it chooses; it is subject to the same concerns that many, if not most, non-profit organizations have regarding funding and resource availability. Therefore, a selection analysis can incorporate real estate values to address CEP’s limitations on available capital and as a proxy for poverty. Mapping real estate values across metropolitan Chicago enables identification of “high value” areas: those that rate well on our other variables of interest, but have relatively low real estate valuation. This combination signals a potentially effective, and affordable location for CEP (Readey 2015).
This variable becomes increasingly important if CEP follows through on its expressed interest to potentially lease space year round (Marzahl et al. 2015). Lower real estate values can save the organization money while having the added bonus of being located in an area nearer to potential clients. Locating a site year-round in neighborhoods of poverty places CEP where it can make a substantial impact. Since clients often hear about VITA through word of mouth, acquiring a dedicated space in an impoverished area makes sense.
One caution, however, is that CEP could choose real estate of inferior physical quality or located away from areas of heavy traffic. CEP has noted the importance of “walk-in” and “accidental” clients (Marzahl et al. 2015). An obvious and accessible location is paramount for the casual traffic that sometimes comprises a significant portion of clientele. An extremely inexpensive location may have limited visibility and/or few passersby. Like our other criteria, finding optimal real estate requires establishing a balance among competing demands.

51
Works Cited
BatchGeo. 2015. “Online Mapping Application.” https://batchgeo.com/.
BLS (Bureau of Labor Statistics). 2015. Volunteering in the United States — 2014. Washington, DC: U.S. Department of Labor. http://perma.cc/5MCP-Q4X2.
Bosley, Lynne. 2015. Telephone interview with President, United Way of Elgin by Ben Emmel, March 11. Notes in possession of Don Eggert.
Brown, Amy. 2015. Telephone interview with Program Officer, The Ford Foundation by Princess Ojiaku, March 16. Notes in possession of Don Eggert.
Castellanos-Butt, Jeanette. 2015. Telephone interview with Vice President, Community Investment, United Way of Metro Chicago by Ben Emmel, March 19. Notes in possession of Don Eggert.
Census (U.S. Census Bureau). 2011. “2010 Census Data.” Washington, DC: U.S. Department of Commerce. http://www.census.gov/2010census/data/.
———. 2013a. “Census 2000 Data for the State of Illinois.” Washington, DC: U.S. Department of Commerce. http://www.census.gov//census2000/states/il.html.
———. 2013b. American Community Survey and Puerto Rico Community Survey: 2013 Subject Definitions. Washington, DC: U.S. Department of Commerce. http://perma.cc/F6J4-SSZQ.
———. 2014. “2009-2013 5-Year American Community Survey.” Washington, DC: U.S. Department of Commerce. http://factfinder2.census.gov/bkmk/navigation/1.0/en/d_dataset:ACS_13_5YR.
CEP (Center for Economic Progress). 2015a. “About Us.” http://perma.cc/Z384-3QVE.
———. 2015b. “2014 Tax & Financial Services Highlights.” http://perma.cc/6PZ6-EPE2.
———. 2015c. Focus to Grow: Strategic Plan 2015-2017. Chicago, IL: Center for Economic Progress. http://perma.cc/UB8K-L9DE.
———. 2015d. 2014 tax return data uploaded to shared electronic storage for authors’ use, February 25. Data in possession of Don Eggert.
———. 2015e. 2013 and 2014 volunteer survey data uploaded to shared electronic storage for authors’ use, April 20. Data in possession of Don Eggert.
———. 2015f. 2013 and 2014 client survey data uploaded to shared electronic storage for authors’ use, April 20. Data in possession of Don Eggert.

52
Chacón, Fernando, María Luisa Vecina, and María Celeste Dávila. 2007. “The Three-Stage Model of Volunteers’ Duration of Service.” Social Behavior and Personality: An International Journal. doi:10.2224/sbp.2007.35.5.627.
Cheng, Christine. 2015. Telephone interview with Director, Ladder Up by Bennett Javenkoski and Mallory Palmer, March 5. Notes in possession of Don Eggert.
Chicago Historical Society. 2015. “Chicago’s Community Areas.” Encyclopedia of Chicago. http://www.encyclopedia.chicagohistory.org/pages/1760.html.
Clary, E. Gil, Mark Snyder, Robert Ridge, John Copeland, Arthur Stukas, Julie Haugen, and Peter Miene. 1998. “Understanding and Assessing the Motivations of Volunteers: A Functional Approach.” Journal of Personality and Social Psychology 74 (6): 1516–30. doi:10.1037/0022-3514.74.6.1516.
Dansko, LLC. 2015. “Volunteerism.” http://perma.cc/E4VL-T67G.
DeSilver, Drew. 2014. “5 Facts About Economic Inequality | Pew Research Center.” FacTank. http://perma.cc/H5EY-TXHU.
Dobson, Tyrone. 2015. Telephone interview with Volunteer Engagement Manager, Center for Economic Progress by Bennett Javenkoski, April 3. Notes in possession of Don Eggert.
Edsall, Thomas B. 2015. “The Republican Discovery of the Poor.” The New York Times, February 11. http://www.nytimes.com/2015/02/11/opinion/thomas-b-edsall-the-republican-discovery-of-the-poor.html.
Edwards, Jeremy. 2014. Tax Preparation Services in the US. Market Research Report 54121d. Los Angeles, CA: IBISWorld. http://perma.cc/7AZ7-H2FY.
Fuller, Carol. 1974. “Effect of Anonymity on Return Rate and Response Bias in a Mail Survey.” Journal of Applied Psychology 59 (3): 292–96. doi:10.1037/h0036630.
Galindo-Kuhn, Roseanna, and Ruth Guzley. 2001. “The Volunteer Satisfaction Index: Construct Definition, Measurement, Development, and Validation.” Journal of Social Service Research 28 (1): 45–68. doi:10.1300/J079v28n01_03.
GAO (U.S. Government Accountability Office). 2014. Paid Tax Preparers: In a Limited Study, Preparers Made Significant Errors. GAO-14-467T. Washington, DC. http://perma.cc/B4YV-BZ9N.
Hager, Mark, and Jeffrey Brudney. 2004. Volunteer Management Practices and Retention of Volunteers. Washington, DC: The Urban Institute. http://perma.cc/Y78G-JNDW.

53
Hall, Matthew. 2010. Population Change during Trying Times: Illinois’ New Demographic Reality. Urbana-Champaign, IL: Institute of Government and Public Affairs, University of Illinois. http://perma.cc/5DTP-S4Q3.
Halpern-Meekin, Sarah. 2015. In-person interview with Assistant Professor, School of Human Ecology, University of Wisconsin–Madison by Don Eggert, March 13. Notes in possession of Don Eggert.
Haskins, Nicole. 2015. Telephone interview with Outreach and Volunteer Engagement Specialist, Center for Economic Progress by Bennett Javenkoski, April 3. Notes in possession of Don Eggert.
Holzblatt, Janet, and Janet McCubbin. 2004. “Issues Affecting Low-Income Filers.” In The Crisis in Tax Administration, edited by Henry J. Aaron and Joel Slemrod, 148–200. Washington, DC: The Brookings Institution.
Hoynes, Hilary. 2014. Building on the Success of the Earned Income Tax Credit. Washington, DC: The Brookings Institution. http://perma.cc/25EY-U8ZJ.
IRS (U.S. Internal Revenue Service). 2014a. “IRS Statement on Court Ruling Related to Return Preparers.” http://perma.cc/7RHS-6YG6.
———. 2014b. Grant Programs Resource Guide for VITA & TCE. Publication 4883. Washington, DC: U.S. Department of the Treasury. http://perma.cc/67QC-3SC7.
———. 2014c. VITA/TCE IRS Volunteer Site Coordinator’s Handbook. Publication 1084. Washington, DC: U.S. Department of the Treasury. http://perma.cc/DW8D-44JX.
———. 2015. 1040 Instructions 2014. Washington, DC: U.S. Department of the Treasury. http://perma.cc/BWP2-FW8U.
Johnson, Kenneth M. 2002. “The Changing Face of Chicago: Demographic Trends in the 1990s.” Chicago Fed Letter, no. 176. Chicago, IL: Federal Reserve Bank. http://perma.cc/G9LG-QN84.
Lewe-Brady, Marjory. 2015. Telephone interview with Director of Partnerships for Wellness, Safety, and Achievement, West Chicago Elementary School District 33 by Princess Ojiaku, March 13. Notes in possession of Don Eggert.
Lowrey, Annie. 2013. “The Rich Get Richer Through the Recovery.” The New York Times, September 10.
Maag, Elaine. 2005. Paying the Price? Low Income Parents and the Use of Paid Tax Preparers. Washington, DC: Urban Institute. http://perma.cc/Y7TR-WK8Y.

54
———. 2015. “Earned Income Credit in the United States.” Journal of Social Security Law 22 (1). http://perma.cc/JR9S-FNJQ.
Marzahl, David, Rob Paral, Juan Villalobos, Jacob Peniston, Eric Sternberg, and Satori Bailey. 2015. In-person interview with Chief Executive Officer, Consulting Demographer, and staff, by authors, February 3. Notes in possession of Don Eggert.
Medina, Rudy. 2015. Telephone interview with President, Second Federal Community Credit Union by Mallory Palmer, March 13. Notes in possession of Don Eggert.
Morales, Maggie. 2015. Telephone interview with Manager of Community Engagement, Lake County Community Foundation by Princess Ojiaku, March 13. Notes in possession of Don Eggert.
Paral (Rob Paral and Associates). 2011. What Does the 2010 Census Tell Us About Metropolitan Chicago? Chicago, IL: The Chicago Community Trust. http://perma.cc/2YUP-59CY.
Quittman, Louisa. 2015. Telephone interview with Director, Office of Consumer Policy, Office of Financial Education, U.S. Department of the Treasury by Princess Ojiaku, March 5. Notes in possession of Don Eggert.
Rea, Louis, and Richard Parker. 2014. Designing and Conducting Survey Research: A Comprehensive Guide. 4th ed. San Francisco, CA: John Wiley & Sons.
Readey, Jay. 2015. Telephone interview with Chair, Southland Human Services Leadership Council by Bennett Javenkoski, March 5. Notes in possession of Don Eggert.
Stukas, Arthur, Mark Snyder, and E. Gil Clary. 1999. “The Effects of ‘Mandatory Volunteerism’ on Intentions to Volunteer.” Psychological Science 10 (1): 59–64. doi:10.1111/1467-9280.00107.
TIGTA (Treasury Inspector General for Tax Administration). 2012. Additional Steps Are Needed to Ensure the Volunteer Income Tax Assistance Grant Program Reaches More Underserved Taxpayers. Washington, DC: U.S. Department of the Treasury. http://perma.cc/2K2H-3J7E.
———. 2014. The IRS FY 2013 Improper Payment Reporting Continues to Not Comply with the Improper Payments Elimination and Recovery Act. Washington, DC: U.S. Department of the Treasury. http://perma.cc/K5DX-WC35.
VanSingel, Andrew. 2015. Telephone interview with Director, Low Income Tax Clinic, Prairie State Legal Services by Ben Emmel, March 10. Notes in possession of Don Eggert.
Vasseur, Ernest. 2015. Telephone interview with Executive Director, Healthcare Foundation of Northern Lake County by Bennett Javenkoski, March 10. Notes in possession of Don Eggert.

55