Strategic Planning Analysis --- Economic and Residential ...
45
Strategic Planning Analysis --- Economic and Residential Outlook --- Union County, Indiana Prepared on behalf of: Union County Economic Development Commission 26 West Union Street Liberty, IN 47353 July 26, 2021 TRACY CROSS & ASSOCIATES, INC. REAL ESTATE MARKET ANALYSIS 1375 E. WOODFIELD ROAD, SUITE 520 SCHAUMBURG, IL 60173 t 847.925.5400 f 847.925.5415 www.tcrossinc.com
Transcript of Strategic Planning Analysis --- Economic and Residential ...

Strategic Planning Analysis--- Economic and Residential Outlook ---
Union County, Indiana
Prepared on behalf of:Union County Economic Development Commission
26 West Union StreetLiberty, IN 47353
July 26, 2021
TRACY CROSS & ASSOCIATES, INC.REAL ESTATE MARKET ANALYSIS1375 E. WOODFIELD ROAD, SUITE 520
SCHAUMBURG, IL 60173t 847.925.5400 f 847.925.5415
www.tcrossinc.com

REAL ESTATE MARKET ANALYSIS 1375 E. WOODFIELD ROAD, SUITE 520
SCHAUMBURG, IL 60173 t 847.925.5400 f 847.925.5415
www.tcrossinc.com
TABLE OF CONTENTS INTRODUCTION ............................................................................................................................ Pages 1-2 EXECUTIVE SUMMARY ............................................................................................................... Pages 3-9 SECTION 1 – CONCLUSIONS AND RECOMMENDATIONS ................................................ Pages 1.1-1.8 SECTION 2 – ECONOMIC, DEMOGRAPHIC, RESIDENTIAL OUTLOOK ......................... Pages 2.1-2.10 SECTION 3 – THE RESIDENTIAL MARKETPLACE ............................................................. Pages 3.1-3.3 APPENDICES ................................................................................................................................. A2.1-A2.3

Page 1 TRACY CROSS & ASSOCIATES, INC.
INTRODUCTION At the request of the Union County Economic Development Commission (UCEDC) and the Eastern Indiana Regional Planning Commission, Tracy Cross & Associates, Inc. evaluated the market potential for residential development throughout the Eastern Indiana Region, defined as Fayette, Henry, Randolph, Rush, Union, and Wayne counties, addressing the market potential for new construction and/or adaptive residential conversion for sale and/or rental apartment housing alternatives. Our objective is to provide the UCEDC and associated stakeholders with a full understanding of relevant regional economic and residential market trends as they may impact upon existing and future residential development initiatives throughout Union County, with focus upon select Client-identified land assemblages which may represent principal areas of initial opportunity. This report, which is intended to serve as the basis for attracting and retaining high quality investment in Union County and as a guideline for policy decisions and planning implementation, establishes the following: Conclusions regarding the strength of the market for residential development in Union County over
the 2021-2025 timeframe, and for planning purposes projected through 2030, based upon current and anticipated economic, demographic, and residential construction trends which define the marketplace.
Conclusions regarding the highest and best residential development opportunities throughout the
county which best meet the needs of area residents (current and future). These conclusions will be based upon the strength of the market, demographic and socio-economic characteristics of resident households, and the alignment and condition of the area’s housing stock.
Residential product development guidelines for those housing forms viewed to hold measurable
market support now and into the future. These guidelines will address, by generic housing form, optimum unit count, plan types and sizes, product criteria/finishes, benchmark pricing/rental guidelines, etc., viewed as necessary to attain acceptable levels of absorption.
Geographic positioning and priority ranking strategies for the introduction of new housing products
throughout the County (with emphasis upon Client-identified investigative properties as appropriate), focusing on those areas and product lines viewed as most suitable for introduction over the initial 2021-2025 forecast period.
WORK PLAN The work plan for this assignment involved a series of inter-related research investigations as outlined below: A thorough field investigation to identify locational attributes and/or diseconomies of various sub-
areas of Union County which may impact residential demand and development opportunities. Analysis of all relevant regional employment and residential construction trends, as well as key
demographic and socio-economic variables of resident households. A detailed examination of all relevant market rate rental apartment and for sale alternatives
(including new and existing homes) to determine their potential impact upon future new construction/adaptive conversion initiatives.

Strategic Planning Analysis Union County Economic Development Commission
Economic and Residential Outlook Union County, Indiana
Page 2 TRACY CROSS & ASSOCIATES, INC.
An examination of projects in the planning pipeline that may pose some measure of competitive influence upon future development.
A forecast of residential construction requirements throughout the six-county Eastern Indiana Region, segmenting demand by geographic area and market segment.
THE REPORT This report is divided into three sections together with an Appendix which integrates economic, demographic, and competitive data. Of particular importance is Section 1 which characterizes the Union County environs and forwards detailed conclusions and recommendations regarding the highest and best residential uses over the next several years, with initial focus upon the subject redevelopment parcels. Not to be dismissed, however, are the remaining two sections which can be defined as fundamentals. Section 2, for instance, provides an outlook for future housing absorption in the market area based upon all demand-related variables, while Section 3 characterizes the region’s residential marketplace. CERTIFICATION AND SIGNATURE This analysis represents our objective and independent opinion regarding the market potential for residential development in Union County, Indiana as certified below: TRACY CROSS & ASSOCIATES, INC. An Illinois Corporation By: _____________________________ By: ___________________________ Erik A. Doersching HollyAnn Eageny Its: Executive Vice President and Its: Vice President Managing Partner By: _____________________________ Morghan Smith Its: Research Analyst Date: July 26, 2021

Page 3 TRACY CROSS & ASSOCIATES, INC.
EXECUTIVE SUMMARY Tracy Cross & Associates, Inc. is pleased to submit its Strategic Planning Analysis addressing residential development opportunities in Union County, Indiana. Our objective is to provide the Union County Economic Development Commission (UCEDC) and associated stakeholders with a full understanding of relevant regional economic and residential market trends as they may impact upon existing and future residential development initiatives throughout Union County, with focus upon select Client-identified land assemblages which may represent principal areas of initial opportunity. Our report is intended to serve as the basis for attracting and retaining high quality investment in Union County and as a guideline for policy decisions and implementation strategies. This section of our report serves as an Executive Summary of our analysis attached hereto. UNION COUNTY – A PERSPECTIVE Encompassing some 165 square miles, Union County is located in east central Indiana, bordering the Ohio state line. The county is approximately 40 miles west/northwest of the Dayton and Cincinnati, Ohio metropolitan regions, and 65 miles southeast of Indianapolis. The county is comprised of numerous unincorporated towns/townships with the town of Liberty representing the most populated area of the county. Representing the center of commerce in Union County, Liberty supports a variety of local merchants, banks, antique shops, cafes, and restaurants in its Downtown Square, together with numerous parks, houses of worship and other civic gathering spots. The hallmark of the Square is the historic limestone Union County Courthouse, along with the Templeton Log Cabin Memorial. This cabin, built in 1805 was relocated to the Courthouse Square in 1983 as a memorial to the county’s founding pioneer history. A variety of seasonal festivals, farmer’s markets, and open-air concerts are held on the town square annually.
Principal transportation arterials serving Union County include US 27 and State Routes 44, 101 and 227, providing east of access to employment concentrations in Union County, including NSK Corporation, an industrial bearing manufacturer, First Merchants Bank, Woodruff Foods grocery and the Union County-College Corner School District, as well as concentrations of employment throughout the six-county Eastern Indiana Region. US 27 also provides direct access southeast to Oxford, OH and Miami University as well as the greater Cincinnati metro area, while several county roads provide access to US 35 and the Dayton metro area to the northeast. Family medicine and urgent care services are provided by Neighborhood Health Clinic in Liberty, while in January 2021, the county contracted with Reid Health to provide ambulance service to Reid Heath medical campuses in Connersville (Fayette County) or Richmond (Wayne County). Union County boasts a rich agricultural heritage benefitting from it fertile, rolling topography. In fact, the county’s land mass is primarily devoted to agri-business which remains the principal economic engine of the county. The county also benefits from a measure of seasonal tourism emanating from the regionally popular Whitewater Memorial State Park as well as the Sagamore Resort on Brookville Lake. Whitewater State Park encompasses some 1,710 acres of conservancy including nine miles of hiking and horseback trails, campgrounds, picnic grounds, fishing, boating, and swimming from the Quakertown Beach area of the 200-acre Brookville Lake. The Sagamore Resort, in turn, features a 400-slip marina, boat rentals and ship store, restaurants, and lodging options, along with the 18-hole Pete Dye-designed Harbor Lake Golf Course. These recreational venues also provide seasonal employment opportunities.
Union County Courthouse / Templeton Log Cabin

Strategic Planning Analysis Union County Economic Development Commission
Economic and Residential Outlook Union County, Indiana
Page 4 TRACY CROSS & ASSOCIATES, INC.
POTENTIAL REDEVELOPMENT PROPERTIES The purpose of this analysis is to provide the Union County Economic Development Commission with an understanding of the strength of the marketplace for future residential development. As a part of this analysis, our firm focused upon select land parcels identified by the Commission as potential redevelopment opportunities. As illustrated in the following graphic, these investigative sites are in or proximate to Downtown Liberty.
CONCLUSIONS AND RECOMMENDATIONS The Eastern Indiana Regional Planning Commission and its stakeholder partners have embarked upon an ambitious and fully attainable regional development strategy to prepare the region for sustainable economic growth over the long term. This regional strategy outlines requisite infrastructure improvements, promotion of agri-business opportunities, investment in workforce education and training, expansion of health services, and the like. As a part of this regional plan, the Commission also addressed the need to ensure that constituent communities are positioned to attract and retain future workforce generations by enhancing quality of life components and Main Street investment in support of local businesses, the arts, dining, and civic amenities which are all within a reasonable distance of one’s home. Consistent with the vision for “tomorrow’s” communities, it is critical to ensure that new housing products meet the requirements of a broad consumer base which includes professional singles and couples without children, couples in their early stages of family formation, along with localized empty-nesters. Serving to instill momentum, and within the context of the regional master plan, the strongest initial residential
GEOGRAPHIC ORIENTATION: POTENTIAL REDEVELOPMENT SITES-- UNION COUNTY PMA --
Source: Google Maps and Tracy Cross & Associates, Inc.

Strategic Planning Analysis Union County Economic Development Commission
Economic and Residential Outlook Union County, Indiana
Page 5 TRACY CROSS & ASSOCIATES, INC.
development opportunities rest with market rate rental apartment forms, along with a modicum of attached for sale development. Future larger-scale single family opportunities will evolve over time, incumbent upon successful implementation of the regional master plan. RESIDENTIAL OUTLOOK As fully detailed in Section 2 of this report, in tandem with anticipated regional economic recovery, the six-county Eastern Indiana Region could support construction of 250 new residential units annually during the initial 2021-2025 forecast period (or 1,250 units through 2025) if supply were made available and market-consistent rents/sales prices are maintained. Thereafter, assuming successful implementation of regional planning initiatives, residential construction requirements could advance to an annual pace of 325 on a sustaining basis. Of the potential initial construction requirements, 165 units yearly could represent detached and low-density attached for sale idioms, with the remaining 85 units yearly reflecting market rate/workforce apartments. To this latter point, given the tightness of the market as noted in Section 3, market rate rental apartment potentials could double in any given year if (again) supply were made available. Initial projected new construction requirements primarily reflect replacement demand as large components of existing ownership and rental housing throughout the region are now at or nearing obsolescence. The 85- to 100-unit yearly regional new construction projection also considers a limited measure of potential for in-migration based upon regional commutation patterns and represents more than adequate support for new and/or adaptive conversion apartment initiatives which may be presented for consideration in Union County. As also summarized in Section 3, new construction requirements consider sales trends among existing principally single family detached alternatives, coupled with demand for housing forms which meet the transitioning needs of maturing residents throughout the region. Consistent with noted rental occupancies and closings trends, Union County could capture roughly 15.0 percent of future regional rental apartment and for sale construction requirements yearly providing competitive rents and sales prices are maintained. Further disaggregating regional for sale construction requirements, roughly 125 units yearly would represent single family detached alternatives, with the remaining 40 units yearly reflecting low-density townhome/duplex/villa forms. Based upon the distribution of household incomes in the region, together with an examination of home sales over the last 27 months (2019-1st Quarter 2021), overall Eastern Indiana
Total 250 325
For Sale 165 225
Single Family Detached 125 175
Duplex/Townhome 40 50
Market Rate/Workforce Apartment 85 + 100 +
Type 2021 - 2025 2025 - 2030
Source: Tracy Cross & Associates, Inc.
ANNUAL RESIDENTIAL POTENTIALS BY PRODUCT TYPE-- EASTERN INDIANA REGION --
2021 - 2030
Estimated Annual Absorption Potentials
Product By Time Period

Strategic Planning Analysis Union County Economic Development Commission
Economic and Residential Outlook Union County, Indiana
Page 6 TRACY CROSS & ASSOCIATES, INC.
Regional new construction for sale potentials will carry a median sales price of $205,000 in current 2021 dollars. It is estimated that roughly 70.0 percent of projected new single family detached closings will occur at price points between $150,000 and $224,999, while new attached for sale forms will hover at the $180,000 mark.
MARKET SUPPORT The following paragraphs summarize pertinent market conditions which inform our conclusions and product development recommendations: Encompassing some 2,040 square miles, the Eastern Indiana Region is defined as the counties of
Fayette, Henry, Randolph, Rush, Union, and Wayne in east central Indiana. This large geographic area represents a homogeneous region defined by its dependence upon like sources of employment; commuting patterns established along the Interstates 70, 74 and 69; US Routes 27, 35, 36, 40 and 52; and State Routes 1, 3, 38, 121, 227, and 234; socio-economic similarities in demographic and household composition; and the character of its housing stock. Four of the six component counties define micropolitan areas (MA) or components of larger metropolitan statistical areas, including the Fayette County which defines the Connersville, IN MA; the New Castle, IN MA (Henry County); and the Richmond, IN MA (Wayne County); while the host Union County is a part of the larger Cincinnati, OH-KY-IN Metropolitan Statistical Area.
As discussed in Section 2, according to the U.S. Department of Labor, the combined region supported a total nonfarm employment base of 59,040 in 2020, concentrated in manufacturing which accounted for 20.2 percent of total employment. All forms of government accounted for 17.9 percent of total employment, followed by the trade/transportation/utilities and education/health services sectors, each representing 17.7 percent of nonfarm employment in 2020. With a total covered employment payroll of 1,255 in 2020, Union County represented modest two percent of total regional employment during the year.
Under $100,000 0 0.0 0 0.0 0 0.0100,000 - 124,999 0 0.0 0 0.0 0 0.0125,000 - 149,999 17 10.3 12 9.6 5 12.5150,000 - 199,999 55 33.3 30 24.0 25 62.5200,000 - 224,999 55 33.3 45 36.0 10 25.0
25 15.2 25 20.0 0 0.05 3.0 5 4.0 0 0.05 3.0 5 4.0 0 0.0
400,000 and Above 3 1.8 3 2.4 0 0.0
Total 165 100.0 125 100.0 40 100.0
Median
ANNUAL FOR SALE POTENTIALS BY PRICE RANGE-- EASTERN INDIANA REGION --
2021 - 2025
Total Single Family Detached Townhome/Condominium
Source: Tracy Cross & Associates, Inc.
Price Range Number Number Number(In 2021 Dollars) of Sales Percent of Sales Percent of Sales
250,000 - 299,999300,000 - 399,999
Percent
225,000 - 249,999
$205,000 $212,000 $180,000

Strategic Planning Analysis Union County Economic Development Commission
Economic and Residential Outlook Union County, Indiana
Page 7 TRACY CROSS & ASSOCIATES, INC.
It must also be noted that the Eastern Indiana Region has been hard hit by the COVID-19 pandemic and ensuing economic constraints. Specifically, the six-county region experienced year-over-year job losses of 3,429 or 5.5 percent of total employment job contractions generally consistent with the 5.78 percent contraction noted nationwide in 2020. As might be expected, the majority of job losses occurred during the April-June 2020 period when (collectively) payroll losses averaged 1,074 per month, largely impacting the region’s manufacturing, education, and government sectors of employment.
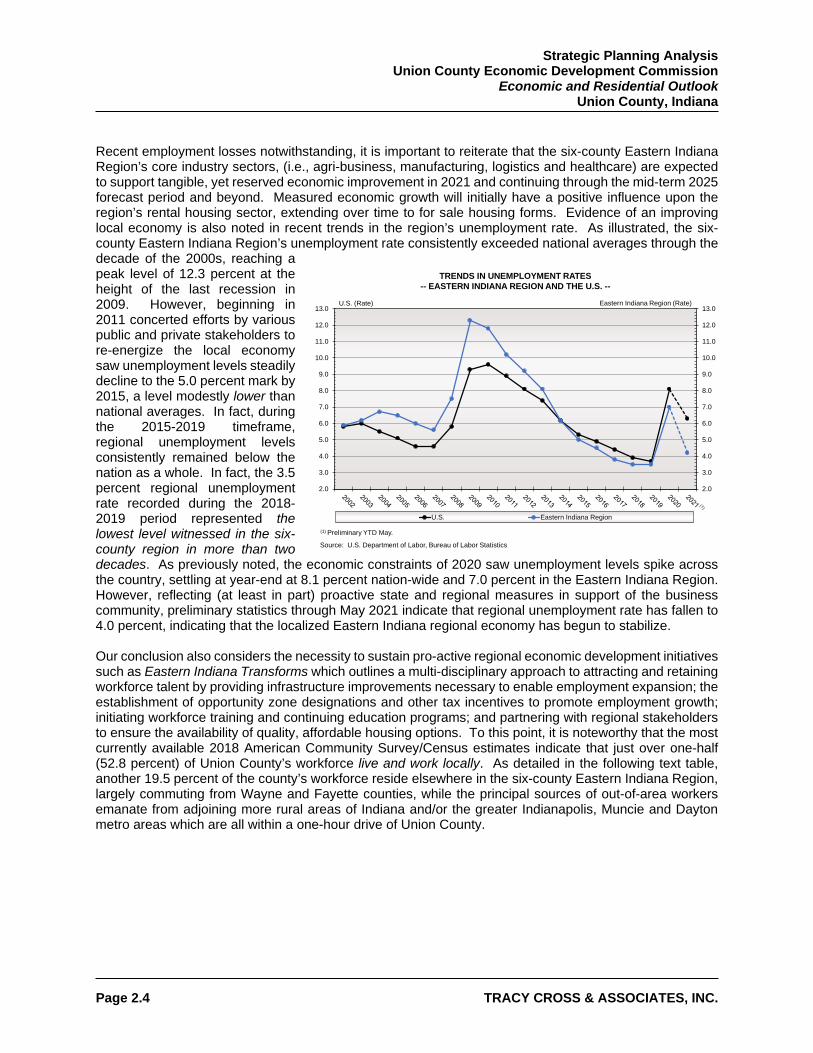
Recent employment losses notwithstanding, it is important to reiterate that the six-county Eastern Indiana Region’s core industry sectors, (i.e., agri-business, manufacturing, logistics and healthcare) are expected to support tangible, yet reserved economic improvement in 2021 and continuing through the mid-term 2025 forecast period and beyond. Measured economic growth will initially have a positive influence upon the region’s rental housing sector, extending over time to for sale housing forms. Evidence of an improving local economy is noted in recent trends in the region’s unemployment rate. As illustrated, the six-county Eastern Indiana Region’s unemployment rate consistently exceeded national averages through the decade of the 2000s, reaching a peak level of 12.3 percent at the height of the last recession in 2009. However, beginning in 2011 concerted efforts by various public and private stakeholders to re-energize the local economy saw unemployment levels steadily decline to the 5.0 percent mark by 2015, a level modestly lower than national averages. In fact, during the 2015-2019 timeframe, regional unemployment levels consistently remained below the nation as a whole. Notably, the 3.5 percent regional unemployment rate recorded during the 2018-2019 period represented the lowest level witnessed in the six-county region in more than two decades. As previously noted, the economic constraints of 2020 saw unemployment levels spike across the country, settling at year-end at 8.1 percent nation-wide and 7.0 percent in the Eastern Indiana Region. However, reflecting (at least in part) proactive state and regional measures in support of the business community, preliminary statistics through May 2021 indicate that regional unemployment rate has fallen to 4.0 percent, indicating that the localized Eastern Indiana regional economy has begun to stabilize.
TRENDS IN UNEMPLOYMENT RATES-- EASTERN INDIANA REGION AND THE U.S. --
2.0
3.0
4.0
5.0
6.0
7.0
8.0
9.0
10.0
11.0
12.0
13.0
U.S. Eastern Indiana Region
Rate
Source: U.S. Department of Labor, Bureau of Labor Statistics
(1) Preliminary YTD May.

Strategic Planning Analysis Union County Economic Development Commission
Economic and Residential Outlook Union County, Indiana
Page 8 TRACY CROSS & ASSOCIATES, INC.
Our conclusion also considers the necessity to sustain pro-active regional economic development initiatives such as Eastern Indiana Transforms which outlines a multi-disciplinary approach to attracting and retaining workforce talent by providing infrastructure improvements necessary to enable employment expansion; the establishment of opportunity zone designations and other tax incentives to promote employment growth; initiating workforce training and continuing education programs; and partnering with regional stakeholders to ensure the availability of quality, affordable housing options. To this point, it is noteworthy that the most currently available 2018 American Community Survey/Census estimates indicate that just over one-half (52.8 percent) of Union County’s workforce live and work locally. As detailed in the following text table, another 19.5 percent of the county’s workforce reside elsewhere in the six-county Eastern Indiana Region, largely commuting from Wayne and Fayette counties, while the principal sources of out-of-area workers emanate from adjoining more rural areas of Indiana and/or the greater Indianapolis, Muncie and Dayton metro areas which are all within a 60- to 90 minute drive of Union County.
In 2020, the host Union County supported a household base of 2,759, representing 3.8 percent of
the six-county region. Notably, while statistics must be viewed in context, Union County maintained fairly stable household levels during the decade, representing only six percent of total regional household losses (or an average of 18 yearly) during the 2010-2020 timeframe. Consistent with the region as a whole, household contractions in Union County are expected to subside during the 2020-2025 timeframe to a projected overall household base of 2,709 in 2025. Household growth forecasts reconcile the expectation of a slowly improving regional economy over the forecast period, offset by the distinct absence of new residential development, coupled with tighter lending controls. It is also important to recognize that Census household growth projections do not reflect potentials inherent in redevelopment initiatives to repurpose under-utilized properties to better meet the demands of resident households.
Total Civilian Employment 1,254 100.0Union County, IN(1) 662 52.8Fayette County, IN(1) 113 9.0Wayne County, IN(1) 107 8.5Franklin County, IN 67 5.3Butler County, OH 36 2.9Preble County, OH 26 2.1Marion County, IN 26 2.1Delaware County, IN 14 1.1Hamilton County, IN 14 1.1Randolph County, IN(1) 10 0.8Henry County, IN(1) 8 0.6Rush County, IN(1) 7 0.6All Other Out-of-Area(4) 164 13.1
Within a 40-minute Commute(2) 129 10.3Within a 60-minute Commute(3) 54 8.2
(1)
(2)
(3)
(4)
Source: OnTheMap; U.S. Bureau of the Census-American Community Survey 2018
Wayne County Workers
COMMUTATION TRENDS: CIVILIAN EMPLOYED WORKERS - 2018-- UNION COUNTY PMA --
County of Residence Number Percent
Representing additional out-of-region and out-of-state residents estimated to include contract/remote workers.
Counties comprising defined Eastern Indiana Region.
Out-of-Region Workforce Summary
Includes Franklin County (Brookville, IN); Preble County, OH (Dayton Metro Area); and Butler County (Hamilton/Cincinnati Metro Area).Includes Delware County (Muncie, IN); Hamilton and Marion Counties (Indianapolis Metro Area).
Union County, IN52.8%
Remainder of Eastern Indiana Region
19.5%
RemainingOut-of-Area
27.7%

Strategic Planning Analysis Union County Economic Development Commission
Economic and Residential Outlook Union County, Indiana
Page 9 TRACY CROSS & ASSOCIATES, INC.
Union County householders are relatively mature, reflecting a median age of 55 years. Specifically, 15.0 percent of market area householders are under the age of 35, with 33.1 percent in the family-oriented age groups of 35 to 54, and 39.4 percent aligning move-down categories of 55 to 74. The remaining 12.5 percent are at least 75 years of age. These age cohorts typically represent the strongest profiles for rental and/or lifestyle-oriented (i.e., low maintenance) housing alternatives. Moreover, analysis of household compositions reveals that nearly two-thirds of Union County households represent households without children under the age of 18, primarily comprised of persons living alone or in two-person arrangements (again) consistent with the suggested rental apartment and attached for sale housing idioms.
Importantly, household segments at age categories of 65 and older will increase their
representation levels over the next five years lending further support to the recommended duplex/ranch villa rental and/or for sale product idioms.
Lastly, Householders in Union County supported an estimated 2020 median annual income of
$48,451, generally consistent with incomes throughout the Eastern Indiana Region. Most germane to potential quality new residential construction development in (particularly) Liberty, nearly three-quarters of resident households under the age of 25 and those aged 25 to 44 earn at least $35,000 annually, incomes requisite to support rental rates for quality, new market rate apartment development. Further, roughly one-third of resident households aged 25 and older earn incomes in excess of $75,000 per annum, levels sufficient to support a measure of new for sale housing, especially given the likelihood of continued favorable mortgage interest rates.
2,692 2,821 84 84 41 44
8,921 8,849 329 333 95 95
10,490 9,813 407 378 144 130
12,545 11,228 506 425 131 130
14,645 13,818 555 536 133 126
13,121 14,967 531 596 136 138
10,348 10,520 347 357 121 121
72,762 72,016 2,759 2,709 801 784
(1)
Source: Environics Analytics and Tracy Cross & Associates, Inc.
2020 2025
Under 25
HOUSEHOLD GROWTH PROJECTIONS BY AGE GROUP-- EASTERN INDIANA REGION(1) AND THE UNION COUNTY PMA --
Eastern Indiana Town ofRegion(1) Liberty
Union CountyPMA
2020 2025Age Range 2020 2025
Defined as Fayette, Henry, Randolph, Rush, Union and Wayne counties, Indiana.
25-34
35-44
45-54
55-64
65-74
75 and over
Total

Page 1.1 TRACY CROSS & ASSOCIATES, INC.
1. CONCLUSIONS AND RECOMMENDATIONS Encompassing some 165 square miles, Union County is located in east central Indiana, bordering the Ohio state line. The county is approximately 40 miles west/northwest of the Dayton and Cincinnati, Ohio metropolitan regions, and 65 miles southeast of Indianapolis. The county is comprised of numerous unincorporated towns/townships with the town of Liberty representing the most populated area of the county.
Representing the center of commerce in Union County, Liberty supports a variety of local merchants, banks, antique shops, cafes, and restaurants in its Downtown Square, together with numerous parks, houses of worship and other civic gathering spots. The hallmark of the Square is the historic limestone Union County Courthouse, along with the Templeton Log Cabin Memorial. This cabin, built in 1805 was relocated to the Courthouse Square in 1983 as a memorial to the county’s founding pioneer history. Union County hosts a variety of seasonal festivals, farmer’s markets, and open-air concerts on the town square. Additional shopping including grocery, pharmacy, and other daily consumer service providers are available within retail centers which align Union County’s US 27 and IN 44 commercial corridors. The Liberty Country Club, established in 1927, also aligns US 27 and provides both daily fee and membership opportunities for area residents. The county is served by the Union County-College Corner Joint School District, the only joint school district in the state of Indiana. This school district serves residents of Union and Franklin counties in Indiana, as well as portions of Preble and Butler counties in Ohio. Elementary school campuses are located in Liberty, College Corner and Brookville, while middle school and high school campuses are centrally located in Liberty. Principal transportation arterials serving Union County include US 27 and State Routes 44, 101 and 227, providing east of access to employment concentrations in Union County, including NSK Corporation, an industrial bearing manufacturer, First Merchants Bank, Woodruff Foods grocery and the Union County-College Corner School District as well as concentrations of employment throughout the six-county Eastern Indiana Region. US 27 also provides direct access southeast to Oxford, OH and Miami University as well as the greater Cincinnati metro area, while several county roads provide access to US 35 and the Dayton metro area to the northeast. Family medicine and urgent care services are provided by Neighborhood Health Clinic in Liberty, while in January 2021, the county contracted with Reid Health to provide ambulance service to Reid Heath medical campuses in Connersville (Fayette County) or Richmond (Wayne County).
Downtown Liberty, IN Union County Courthouse / Templeton Log Cabin

Strategic Planning Analysis Union County Economic Development Commission
Economic and Residential Outlook Union County, Indiana
Page 1.2 TRACY CROSS & ASSOCIATES, INC.
Union County boasts a rich agricultural heritage benefitting from it fertile, rolling topography. In fact, the county’s land mass is primarily devoted to agri-business which remains the principal economic engine of the county. The county also benefits from a measure of seasonal tourism emanating from the regionally popular Whitewater Memorial State Park as well as the Sagamore Resort on Brookville Lake. Whitewater State Park encompasses some 1,710 acres of conservancy including nine miles of hiking and horseback trails, campgrounds, picnic grounds, fishing, boating, and swimming from the Quakertown Beach area of the 200-acre Brookville Lake. The Sagamore Resort, in turn, features a 400-slip marina, boat rentals and ship store, restaurants, and lodging options, along with the 18-hole Pete Dye-designed Harbor Lake Golf Course. These recreational venues also provide seasonal employment opportunities. Residentially, Union County is characterized by active agricultural tracts, interspersed with farmsteads and small neighborhoods of vintage homes throughout unincorporated township areas as well as adjoining the town centers of Liberty and College Corner. The county experienced a modicum of newer subdivision development concentrated in Liberty in the early 2000s. However, there has been little new residential construction in Union County since 2005, and no market rate apartment development over the last two-plus decades. In fact, the 32-unit Stonebrook of West College Corner, built in 1984 represents the newest market rate apartment project in the county. These ranch-duplex apartments provide an average 663 square feet of living area and at our May 2021 audit carried a posted rent of $700 per month. Despite the age and condition of this project, only one unit was unoccupied as of May 2021. POTENTIAL REDEVELOPMENT PROPERTIES The purpose of this analysis is to provide the Union County Economic Development Commission with an understanding of the strength of the marketplace for future residential development. As a part of this analysis, our firm focused upon select land parcels identified by the Commission as potential redevelopment opportunities. As illustrated in the following graphic, these investigative sites are in or proximate to Downtown Liberty.
Whitewater Memorial State Park Kent’s Harbor/Sagamore Resort-Liberty, IN

Strategic Planning Analysis Union County Economic Development Commission
Economic and Residential Outlook Union County, Indiana
Page 1.3 TRACY CROSS & ASSOCIATES, INC.
The following paragraphs briefly summarize each of the investigative properties for perspective: Downtown Liberty Property: The town of Liberty
identified a one-half-block area aligning US Route 27/East Seminary between Market and Fairground streets in the Downtown District for redevelopment. Currently utilized as a surface parking lot, the property is directly north of the Union County Library and east of the Courthouse. Established neighborhoods of manicured vintage homes, as well as small businesses characterize the general area.
Remaining Liberty Properties: The remaining potential redevelopment properties represent active agricultural tracts ranging in size from roughly 12- to 26 acres in size. All align the principal US 27 and/or IN 44 and 109 thoroughfares. All are proximate to existing residential areas of moderate scale, although development of some of the sites may be contingent upon access to utilities.
GEOGRAPHIC ORIENTATION: POTENTIAL REDEVELOPMENT SITES-- UNION COUNTY PMA --
Source: Google Maps and Tracy Cross & Associates, Inc.
#4: Market & Seminary Streets Property

Strategic Planning Analysis Union County Economic Development Commission
Economic and Residential Outlook Union County, Indiana
Page 1.4 TRACY CROSS & ASSOCIATES, INC.
A FRAMEWORK FOR PLANNING The Eastern Indiana Regional Planning Commission and its stakeholder partners have embarked upon an ambitious and fully attainable regional development plan to prepare the region for sustainable economic growth over the long term. This regional plan outlines requisite infrastructure improvements, promotion of agri-business opportunities, investment in workforce education and training, expansion of health services, and the like. As a part of this regional plan, the Commission also addressed the need to ensure that constituent communities are positioned to attract and retain future workforce generations by enhancing quality of life components and Main Street investment in support of local businesses, the arts, dining, and civic amenities which are all within a reasonable distance of one’s home. MODERATE-DENSITY APARTMENTS Consistent with the vision of “tomorrow’s” communities, it is critical to ensure that new housing products meet the requirements of a broad consumer base which includes professional singles and couples without children, couples in their early stages of family formation, along with localized empty-nesters. Moreover, given the overall lack of quality new construction and extremely tight market conditions as defined throughout this report, the strongest initial residential development opportunities throughout region rest with market rate rental apartment forms, along with a modicum of attached for sale development. Future larger-scale single family opportunities will evolve over time, incumbent upon successful implementation of the regional master plan and (specific to Union County), the expansion of utilities to areas outside the immediate town boundaries. Serving to instill momentum, and within the context of the regional master plan, Exhibit 1.1 forwards suggested alternative prototype apartment criteria, along with current 2021 dollar benchmark rent strategies to appropriately position new moderate-density market rate/workforce rental idioms in the marketplace. Suggested alternative product idioms offered for consideration are summarized as follows: Most suitable for adaptive conversion and/or new construction sites in downtown Liberty, a mixed-
use market rate alternative providing two- or three residential floors above first floor commercial space is suggested. Plan offerings should consist of JR-1/ convertible, one, two and three bedroom plan styles in a footage range of 500 to 1,100 square feet. As illustrated benchmark rents (again, presented in 2021 dollars) would extend from $595 to $1,140 and average $816 monthly for a 740 square foot unit, exclusive of incremental revenue sources. Assuming for analytical purposes that individual mixed-use projects would accommodate 24 to 36 units and adhering to the suggested plan matrices, individual mixed-use developments would generate a reasonable stabilization period within twelve months of initial occupancy. Also, for clarity, a JR-1/convertible provides a defined or separated sleeping area while still maintaining fully functional living areas consistent with today’s lifestyle trends. Moreover, the suggested continuum of plan types and sizes will enable the suggested project to fully align with the gradual upward movement of incomes in the marketplace. To this point, the modicum of larger two and three bedroom plan styles will also allow flexibility for potential remote work/home office or roommate conditions.
In Liberty, the suggested mixed-use market rate rental idiom is viewed as most suitable for
introduction within the Market and Seminary property and potentially within other existing, vintage buildings aligning the Square.
Representative Illustration

Total Units Per Project: 24 to 36 This prototype product line is viewed asmost appropriate for introduction in downtown
Density in Units Per Acre: NA Liberty within walking distance of shopping,banking and local employers.
Plan Types (Bedrooms): JR-1, 1, 2, 3
The recommended product form (two or threePlan Size floors over first floor retail/office) represents
Range: 500 - 1,100 an urban-oriented alternative not readilyAverage: 740 available today, while a suggested +/-35.0
percent distribution of two and three bedroomBenchmark Posted Rents plan styles will allow for remote/home office
Range: $595 - $1,140 conditions as well as shared/roommateAverage: $816 arrangements.
$/Sq. Ft.: $1.10
At a minimum, community amenities shouldinclude a secured reception lobby and mail/
Average Absorption (Units/Month) package room, an e-lounge café/social area,to 95% Stabilization 3.0 and secured bicycle storage.
Parking Ratio: NA
Enclosed Parking: NA
Total Units Per Project: 40 - 60+ Distributed in a series of two-story garden(walk-up) buildings, this product line is viewed
Density in Units Per Acre: 12 to 15 as suitable for introduction on larger parcelsaligning primary commercial corridors
Plan Types (Bedrooms): 1, 2, 3 such as US 27 and/or SR 44 and 109 in themore populated Liberty area or select
Plan Size locations elsewhere in Union County proximateRange: 650 - 1,250 to local services.Average: 915
Commensurate with the scale of a givenBenchmark Posted Rents project, community amenities should include
Range: $860 - $ 1,400 a clubhouse with social areas, secured mail/Average: $1,100 package room, fitness center, terrace with
$/Sq. Ft.: $1.20 grill stations, multi-use lawn court, and adedicated pet park.
Average Absorption (Units/Month) 3.0 to 5.0to 95% Stabilization Prototype benchmark rents do not include
a suggested incremental fee of $85 monthlyParking Ratio (Surface): 1.6 to 1.75 Per Unit for an optional detached garage. It is suggested
that end-unit garage bays be of sufficient width/Detached Garage (Optional) +/- 15.0 Percent depth to accommodate larger vehicles/trucks.
Total Units Per Project: 18 - 36 This product line can be developed in duplex,triplex, and quad (four-plex) building types,
Density in Units Per Acre: 5 to 7 and will appeal across multiple consumersegments including young families as well as
Plan Types (Bedrooms): 2, 2+Den, 3 more mature singles and childless couples.
This product type is suitable for introductionPlan Size in areas adjoining the Liberty city center and
Range: 1,200 - 1,450 infill sites; or aligning principal commercialAverage: 1,325 corridors (US 27 and IN 44 and 109).
Benchmark Posted RentsRange: $1,375 - $1,600 Commensurate with the scale of a givenAverage: $1,490 project, community amenities should include
$/Sq. Ft.: $1.12 walking paths, a multi-use lawn court andgazebo area with grill stations suitable for
Average Absorption (Units/Month) 1.5 to 3.0 social gatherings, a dedicated pet park andto 95% Stabilization (possibly) a playground and/or community
garden area.Parking Ratio: 2.0 Per Unit Enclosed
Garage (Two-Car Attached): Included
(1)
Source: Tracy Cross & Associates, Inc.
PRODUCT CRITERIA AND BENCHMARK RENTS(1): PROTOTYPE MARKET RATE APARTMENTS-- UNION COUNTY PMA --
To be used for financial modeling only. Benchmark prototype rents are presented in 2021 dollars and do not include floor or corner-unit premiums, or incremental revenues derivedfrom optional enclosed parking, pet fees, administrative fees, or other landlord-provided services. Benchmark rents assume quality interior appointments and finishes, communityamenities commensurate with the scale of a respective development, and on-site leasing and management.
Adaptive Residential Conversion and/or New Mixed-Use Construction (Two to Three Residential Floors Above Commercial at Grade)
Two-Story Garden/Walk-Up Apartments
Ranch Duplex/Villa/Quadplex with Attached Two-Car Garage
Product Line Summary
1.1

Strategic Planning Analysis Union County Economic Development Commission
Economic and Residential Outlook Union County, Indiana
Page 1.5 TRACY CROSS & ASSOCIATES, INC.
Moderate-scale two-story garden/walk-up rental development is also viewed as appropriate for introduction in areas adjoining established residential and commercial areas of Liberty. Current (2021) dollar benchmark rents should extend from $860 to $1,400 and average $1,100 monthly for a 915 square foot unit, exclusive of incremental revenue sources. Adhering to the suggested plan matrices, and based upon individual project size, the suggested garden apartment product line would generate a reasonable stabilization period within 12.0 to 15.0 months of initial occupancy or at an absorption pace in tandem with the development’s construction and delivery schedule.
• This product line could be successfully developed on larger parcels adjoining established
residential and/or commercial areas of Liberty, generally accommodating developments of 40 to 60 units in size. That said, there may be select infill sites where a smaller development of +/-20 units is desired or properties aligning US 27 or IN 44 where a planning area of 60+ units is desired to maximize densities (again) dependent upon access to utilities.
• As also noted on Exhibit 1.1, community amenities should be commensurate with the scale of a given development. For projects of fewer than 60 units, for example, community amenities should include a centrally-located community center/leasing office which provides a secured mail/package room, an e-lounge social area, a furnished terrace with outdoor grill stations and, perhaps, a multi-use lawn court. The clubhouse in larger-scale projects, in turn, should also include a service kitchen and social/activity areas, space available for remote work options, as well as a fitness center. Larger-scale projects may also elect to include gated entry to the residential buildings. All projects regardless of size should include a dedicated pet park.
• Averaging $1.20 per square foot, the benchmark rent strategy positions the suggested new
construction alternatives are well above rents currently commanded throughout the marketplace which averaged $0.81 per square foot as of May 2021. However, as detailed in Section 3, these limited market rate communities all represent developments built prior to 1990 and none provide the energy-efficiencies or modern conveniences afforded by today’s construction technologies. Nor do they feature the quality interior appointments and community amenities outlined and factored in the benchmark rental rates. Yet despite their age and condition, vacancies currently stand at a very tight 1.1 percent, reflecting only ten of 906 market rate units unoccupied. Moreover, the benchmark rent strategy fully aligns with incomes in the marketplace. Hence, development of new market rate rental alternatives will serve to alleviate a significant level of constraint, while (again) the suggested contemporary features and amenities are consistent with today’s lifestyle trends and will appeal to future workforce profiles.
Lastly, given a sizable component of mature
households aged 55 and older throughout the region, a low-density ranch-style attached product line is also viewed to hold strong appeal for move-down consumer segments wishing to transition to a low maintenance lifestyle. To this end, consideration should be given to smaller-scale projects of 18 to 36 units each which feature two and three bedroom plan styles along with a

Strategic Planning Analysis Union County Economic Development Commission
Economic and Residential Outlook Union County, Indiana
Page 1.6 TRACY CROSS & ASSOCIATES, INC.
two-car attached garage. This age-targeted but not restricted product line (which will also appeal to a component of the family market) can be developed in duplex, triplex, or quad (four-plex) building configurations which facilitate private outdoor patio areas. As outlined, suggested plan designs include two bedroom, two bedroom and den/flex and three bedroom two bath styles which range in unit size from 1,200 to 1,450 square feet. Benchmark 2021 rents extend from $1,375 to $1,600 monthly and average $1,490 for a 1,325 square foot residence. Benchmark rents yield a current dollar value ratio of $1.12 per square foot. At benchmark rents, and based upon project size, reasonable stabilization periods within 12.0 to 15.0 months of first occupancy are projected, or at a pace consistent with construction and delivery schedules.
Across all apartment idioms, the prototype matrices assume energy-efficient construction technologies, cohesive architectural design aesthetics, including color palettes and accent complimentary to their respective city center and/or outlying locations, interior appointments and finishes and appropriately-scaled community amenities consistent with new construction apartment development throughout the Midwest. These include nine-foot ceiling height, laminate plank flooring in kitchens and living areas with carpeted bedrooms and bedroom-wing hallways, contemporary kitchens with quartz/granite countertops and islands, energy-efficient stainless steel kitchen and laundry appliances, walk-in closets in most master bedrooms and adequate secondary closeting, baths with granite/quartz vanity tops and solid-surface shower surrounds. All apartments and community areas should provide internet/cable connectivity and some measure of “Smart” technology.
UNIT STANDARDS KITCHEN FEATURES BATH STANDARDS Painted Trim Designer Wood Cabinetry Ceramic or Laminate Flooring Laminate Plank Flooring in Living Areas Laminate Plank Flooring Granite/Quartz Vanity Tops "White" Interior Paint Finish Energy-Efficient Stainless Steel Appliances Wood Cabinetry Direct Wire Smoke Detectors -- Four-Burner Range Solid-Surface Tub/Shower Surround Internet/Cable/Smart Technology Connectivity -- Five-Cycle Dishwasher with Accessory Niche Carpeted Bedrooms/Bedroom-wing Hallways -- Refrigerator w/Icemaker Framed Glass Mirror Over Vanity Programmable Thermostat -- Microwave with Hood Vent Air Conditioning Undermount Stainless Steel Sink Designer Door Hardware Granite/Quartz Countertop/Island Designer Lighting Package Ceramic Tile Backsplash Private Balcony/Patio
CLOSETS, UTILITIES, AND STORAGE Walk-In MBR Closet (Per Plan) Architecturally-Enhanced Exteriors Laminate Closet Shelving Secured Access Entry Per Building Full-Size Washer/Dryer (Stacked / Side-by-Side) Secured Mail/Package Room Clubhouse with Social Area(s) and Linen Closet/Adequate Secondary Storage E-lounge/Social Area Service Kitchen Individually Metered Utilities Furnished/Landscaped Terrace / Gazebo Remote Work Area/Nooks
with Outdoor Kitchen/Grill Stations Fitness Center Fireside Lounge Multi-Use Lawn Court Dedicated Pet Park Secured Bicycle Storage (Mixed-Use Projects) Adequate Private Surface Parking
Source: Tracy Cross & Associates, Inc.
Larger Scale Developments
Features and Amenities
COMMUNITY FEATURES/AMENITIES
PRODUCT CRITERIA: PROTOTYPE MARKET RATE APARTMENTS-- UNION COUNTY PMA --

Strategic Planning Analysis Union County Economic Development Commission
Economic and Residential Outlook Union County, Indiana
Page 1.7 TRACY CROSS & ASSOCIATES, INC.
AN ATTACHED FOR SALE PROTOTYPE While the strongest elements of near-term residential demand clearly align with market rate rental idioms, there is today modest potential for attached for sale development (again) based primarily upon the strong existing and projected components of mature households throughout the region. To this end, Exhibit 1.2 forwards a suggested plan matrix and benchmark pricing strategy for ranch-style attached duplex/triplex/quad units which could be introduced in developments 18 to 36 units in the Liberty area of Union County. Similar to the suggested low-density rental idiom, suggested plan types include two and two bedroom and den/flex, two bath designs, together with a three bedroom, two bath ranch and a three bedroom two bath master-on-main two-story design in a footage range of 1,350 to 1,700 square feet. All plans include an integral two-car garage and assume slab-on-grade construction, thus expanding consumer appeal to not only more mature purchasers, but also younger components desirous of a more affordable new construction option. Corresponding benchmark base sales prices, which are presented in 2021 dollars, extend from $165,000 to $205,000 and average $185,000 which includes a 1,525 square foot residence. Introduction of this product may also attract more mature consumer components of the adjoining areas of Franklin County or Butler County, OH (for example) where new lifestyle low-maintenance alternatives are limited. Benchmark base sales prices include interior appointments and finishes consistent with new construction alternatives throughout the Midwest as outlined on Exhibit 1.2, but do not include incremental revenues derived from options, upgrades, various levels of customization or end-unit premiums. When estimates of options, upgrades and other premiums are factored, it is likely that actual closing prices will advance to $199,000 on average, reflecting consumer purchases from base at an average of 8.0 percent. It is assumed that an association fee will be required to include landscape maintenance and snow removal for all homesites and common areas, trash removal/recycling, common area lighting, insurance, and reserve for exterior unit maintenance and repair. At benchmark base sales prices, the prototype duplex series is expected to generate 1.5 sales per month or 18 sales annually, leading to overall marketing periods of 12.0 to 24.0 months based upon project size. It is important to note that no more than one (1) attached for sale developments should be concurrently marketed in Union County/Liberty at any given time.
The ranch/master-down attached idiom has been well-received in markets throughout the Midwest and affords a highly-efficient building module while providing functional living spaces and plan differentiation. The suggested benchmark strategy, in turn, aligns with localized existing home values in the marketplace where just over one-quarter of closings in 2020 occurred at price points in excess of $150,000. This pricing alignment is particularly significant vis-à-vis localized move-down consumers which typically move-down in home size but almost universally down or laterally in sales price. It is reiterated that the vast majority of these home sales reflect housing stock built prior to 1990.
The suggested ranch duplex/villa idiom(s) should be considered for development within parcels
adjoining established residential areas of Liberty and/or infill sites if re-platting is feasible. There may also be opportunity for development proximate to the Liberty Country Club, Whitewater State Park and/or Sagamore Resort areas which would complement the lifestyle orientation of this product line for younger families as well as mature components if suitable sites can be identified and utilities/services are available.

Total Units: 18 to 36 This product line can be developed in duplex,triplex, and quad (four-plex) building types,
Density in Units Per Acre: 5 to 7 and will appeal across multiple consumersegments including young families as well as
Plan Types (Bedrooms): 2, 2+Flex, 3, 3+Flex more mature singles and childless couplesdesirous of a low-maintenance lifestyle. This
Plan Size product line is suitable for introduction withinRange: 1,350 - 1,700 parcels adjoining residential areas of Liberty asAverage: 1,525 re-zoning and/or utility access allow.
Benchmark Posted Rents The ranch-style product line provides a single levelRange: $165,000 - $205,000 living alternative with sales prices reflecting slab-Average: $185,000 on-grade construction. As determined by site
$/Sq. Ft.: $121.31 conditions, optional basements may be offered.Suggested plan types include two, two and den/flex
and three bedroom styles with two baths. The Sales Forecast (Units/Month) 1.5 largest three bedroom/flex design envisions a
two-story master-on-main with flexible loft area.Parking: Attached Two-Car
UNIT STANDARDS
Solid-Core Entry Doors 42" Wood Cabinetry Separate Garden Tub and Shower with Frameless
Nine Foot First Floor Ceiling Height Energy-Efficient Stainless Steel Appliances or Allowance Glass Shower Door in Master Bath
Six-Panel Passage Doors -- Four-Burner Range Granite/Quartz Double Bowl Vanity in Master Bath
Choice of One Paint Color -- Microwave with Hood Vent with Beveled Mirrors
Painted Trim -- Built-in Five-Cycle Dishwasher Fiberglas Tub/Shower Surround in Common Bath
KwikSet Door Hardware/Knobs -- Refrigerator w/Icemaker Cultured Marble Single-Bowl Vanity in Common
Laminate Plank Flooring in Kitchens and Double-Bowl Undermount Stainless Steel Sink Bath with Beveled MirrorsLiving Area with Garbage Disposal Unilever Chrome or Nickel Faucets
Carpeted Bedrooms / Bedroom-Wing Hallways Unilever Chrome or Nickel Faucet Laminate Plan or Ceramic Bath Flooring
Direct-Wire Smoke Detectors per Code Granite/Quartz Countertop and Island Elongated Commodes in All Baths
Internet/Cable/Smart Technology Connectivity Walk-In Pantry with Wire Shelving
Designer Lighting Package Throughout Ceramic Tile Backsplash
Passage Patio Doors
CLOSETS, UTILITIES, AND STORAGE
Walk-In Master Bedroom Closet Energy-Efficient Engineered Wood Siding with Pre-Priced Options to Allow for Customization
Linen Closet Masonry Accent including but certainly not limited to, Air Conditioning,
Laminate Closet Shelving System Three (3) Architecturally-Cohesive Elevations per Plan Expanded Patio/Deck, Sunroom, Cathedral and
Separate Utility Room with Laundry Tray Low E- Double-Hung Windows Tray Ceilings, Crown Moldings, Detailed Archways,and Cabinetry Professionally Graded and Seeded Front and Rear Designer Kitchen/Bath Upgrades, Built-Ins,
No-Wax Flooring in Laundry Room/Mud Room Lawn with Foundation Plantings Fireplace, Bay Windows, Garage Door Opener,
Programmable Thermostat 10 Ft. x 10 Ft. Patio Optional Basement (Unfinished or Finished)
Energy-Efficient 40 Gal. Water Heater Front and Rear Exterior Lighting and Faucets
150-AMP Service Asphalt Driveway and Concrete Entrance Walkway
Paneled Garage Doors Multi-Use Lawn Court and Gazebo with SeatingSuitable for Social Gatherings
Bocce Ball and/or Croquet Court
Dedicated Pet Park
Master Association Fee to Include Common AreaLighting, Landscape Maintenance and Snow Removalfor all homesites, Trash Removal/Recycling. ExteriorHome Maintenance will be Responsibility of the Homeowner as Defined by Covenants.
(1)
Source: Tracy Cross & Associates, Inc.
To be used for financial modeling only. Benchmark prototype rents are presented in May 2021 dollars and do not include floor or corner-unit premiums, or incrementalrevenues derived from optional enclosed parking, pet fees, administrative fees, or other landlord-provided services. Benchmark rents assume quality interior appointmentsand finishes, community amenities commensurate with the scale of a respective development, and on-site leasing and management.
KITCHEN FEATURES BATH STANDARDS
EXTERIOR AND COMMUNITY AMENITIES CUSTOMIZATION
PRODUCT CRITERIA AND BENCHMARK SALES PRICES(1): PROTOTYPE ATTACHED FOR SALE ALTERNATIVE-- UNION COUNTY PMA --
Product Line Summary
Duplex / Triplex / Quadplex Series
Features and Amenities
1.2

Strategic Planning Analysis Union County Economic Development Commission
Economic and Residential Outlook Union County, Indiana
Page 1.8 TRACY CROSS & ASSOCIATES, INC.
SINGLE FAMILY POTENTIALS Although residential permit trends and projected residential construction requirements throughout the region suggest adequate support for continued single family detached development, in sharp contrast with rental and attached for sale opportunities, the availability of residual homesites and platted future phases of existing developments is relatively substantial. As detailed in Section 3, there is currently an ample supply of residual homesites available in various subdivisions in Fayette, Henry, and Wayne counties (in particular), while several larger-scale parcels in these adjoining county jurisdictions have also been slated for future single family development. Moreover, apart from select more discretionary developments, lot prices throughout the region generally range from the low-$20,000s to +/-$48,000 and average $31,850. Hence, additional opportunities for ground-up single family development of scale over the mid-term are limited. Specifically, until the existing supply of homesites has been depleted, the established pattern of new single family construction will continue to reflect single site activity within residual parcels of existing subdivisions and/or consumer-held property throughout the region. This conclusion considers (in part) that family households at profile age categories of 35 to 54 are likely to have been most impacted by the slowing regional economy over the last several years, further supporting recommended focus upon products which address the workforce profiles in the rental sector as well as localized mature components where housing options are quite limited.

Page 2.1 TRACY CROSS & ASSOCIATES, INC.
2. ECONOMIC, DEMOGRAPHIC AND RESIDENTIAL OUTLOOK Encompassing some 2,040 square miles, the Eastern Indiana Region is defined as the counties of Fayette, Henry, Randolph, Rush, Union, and Wayne in east central Indiana. This large geographic area represents a homogeneous region defined by its dependence upon like sources of employment; commuting patterns established along the Interstates 70, 74 and 69; US Routes 27, 35, 36, 40 and 52; and State Routes 1, 3, 38, 121, 227, and 234; socio-economic similarities in demographic and household composition; and the character of its housing stock. Collectively, the Eastern Indiana Region is within a one hour drive of the Indianapolis, Cincinnati, and Dayton metropolitan areas. Within this large geographic quadrant, however, primary support for future residential development in Union County will emanate from the host county, hereinafter defined as the Union County Primary Market Area or PMA.
EMPLOYMENT TRENDS Four of the six component counties of the Eastern Indiana Region define micropolitan areas (MA) or components of larger metropolitan statistical areas, including Wayne County which defines the Richmond, IN MA; the New Castle, IN MA (Henry County); and Connersville, IN MA (Fayette County); while the host Union County is a part of the larger Cincinnati, OH-KY-IN Metropolitan Statistical Area. This six county region supports an economy rooted in agri-business, manufacturing, logistics and healthcare. Major regional employers include (among others) Stant Corporation, Kenley Corporation, Reid Health Systems and Ivy Tech Community College in Fayette County; Henry County Community Health, Draper, Inc., TS Tech Indiana, Boar’s Head Provisions Co., and Crown Equipment Corp. in Henry County;
GEOGRAPHIC DELINEATION: THE EASTERN INDIANA REGION
Source: Google Maps and Eastern Indiana Regional Planning Commission
Wayne
Randolph
Union
Fayette
Rush
Henry

Strategic Planning Analysis Union County Economic Development Commission
Economic and Residential Outlook Union County, Indiana
Page 2.2 TRACY CROSS & ASSOCIATES, INC.
Anchor Glass Container, Astral Industries, TOA Winchester, and Ascension St. Vincent Health in Randolph County; INTAT Precision, Emerson Copeland, Fraley & Schilling, Trane Commercial Systems, and Rush Memorial Hospital in Rush County; NSK Corp., First Merchants Bank, Woodruff Foods, and J’s Dairy in Union County; and Reid Health, Belden Corp., Sugar Creek Brandworthy Food Solutions, Primex Plastics, Blue Buffalo, Inc., DOT Foods, Inc. and Earlham College in Wayne County. Government, as well, plays a major role in the six-county region including county and city administration, county primary and secondary school systems and Indiana University East, along with the New Castle State Correctional Facility in New Castle and Richmond State Hospital in Richmond. According to the U.S. Department of Labor, the combined region supported a total nonfarm employment base of 59,040 in 2020, concentrated in manufacturing which accounted for 20.2 percent of total employment. All forms of government accounted for 17.9 percent of total employment, followed by the trade/transportation/utilities and education/health services sectors, each representing 17.7 percent of covered employment in 2020. While one cannot overlook the negative impact of the last recession upon (particularly) the region’s dominant manufacturing and logistics industries, regional employment conditions began to slowly improve during the 2010-2015 timeframe, with payroll advances during this four-year period translating to an annual growth rate of 1.5 percent reflecting the average addition of 700 workers yearly. The majority of these payroll additions occurred in the manufacturing sector which added 1,004 jobs between 2010 and 2015, while another 307 net jobs were added in the education/health services sectors, offsetting periods of erosion
2020 COVERED EMPLOYMENT BY INDUSTRY SECTOR-- EASTERN INDIANA REGION(1) --
Mining/Logging/Construction5%
Manufacturing20%
Trade/Transportation/Utilities18%
Information1%
Financial Activities3%
Professional & Business Services6%
Education & Health Services18%
Leisure & Hospitality9%
Other Services2%
Government18%
(1) Includes Fayette, Henry, Randolph, Rush, Union, and Wayne counties in Indiana.
Source: U.S. Department of Labor, Bureau of Labor Statistics

Strategic Planning Analysis Union County Economic Development Commission
Economic and Residential Outlook Union County, Indiana
Page 2.3 TRACY CROSS & ASSOCIATES, INC.
in remaining employment sectors. As illustrated in the following text table, the lion’s share of employment gains during the four-year period occurred in Henry and Wayne counties.
As also illustrated, the pace of employment moderated during the subsequent 2015-2020 timeframe, reflecting the erosion of 738 jobs yearly, attributed in large measure to the economic constraints of the Covid-19 pandemic. Specifically, in 2020, the six-county region experienced year-over-year job losses of 3,429 or 5.5 percent of total employment. As might be expected, the majority of job losses occurred during the April-June 2020 period when (collectively) payroll losses averaged 1,074 per month, largely impacting the region’s manufacturing, education, and government sectors of employment.
73,636 59,232 62,731 59,040 -1,600 700 -738Fayette County 9,838 6,270 6,282 5,684 -396 2 -120Henry County 14,113 11,769 13,033 12,651 -260 253 -76Randolph County 8,048 7,097 7,471 6,255 -106 75 -243Rush County 5,718 4,588 4,892 4,609 -126 61 -57Union County 1,545 1,402 1,302 1,255 -16 -20 -9Wayne County 34,374 28,106 29,751 28,586 -696 329 -233
(1)
Source: U.S. Department of Commerce-Bureau of Labor Statistics
2010 - 2015 2015 - 2020
Total Eastern Indiana Region (1)
Includes Fayette, Henry, Randolph, Rush, Union, and Wayne counties in Indiana.
Area 2001 2010 2015 2020 2001 - 2010
EMPLOYMENT TRENDS-- EASTERN INDIANA REGION --
2001 - 2020
Total Covered Employment Average Annual Change
-10.00
-9.00
-8.00
-7.00
-6.00
-5.00
-4.00
-3.00
-2.00
-1.00
0.00
1.00
2.00
3.00
4.00
U.S. Eastern Indiana Region
Year-Over-Year Change (Percent)
Year-Over-Year 2019 - 2020U.S. Down 8,721,500 -5.78%Eastern Indiana Region Down 3,429 -5.50%
(1) Includes Fayette, Henry, Randolph, Rush, Union, and Wayne counties in Indiana.Source: U.S. Department of Labor, Bureau of Labor Statistics
EMPLOYMENT GROWTH COMPARISONS-- EASTERN INDIANA REGION(1) AND THE U.S. --
Strategic Planning Analysis Union County Economic Development Commission
Economic and Residential Outlook Union County, Indiana
Page 2.4 TRACY CROSS & ASSOCIATES, INC.
Recent employment losses notwithstanding, it is important to reiterate that the six-county Eastern Indiana Region’s core industry sectors, (i.e., agri-business, manufacturing, logistics and healthcare) are expected to support tangible, yet reserved economic improvement in 2021 and continuing through the mid-term 2025 forecast period and beyond. Measured economic growth will initially have a positive influence upon the region’s rental housing sector, extending over time to for sale housing forms. Evidence of an improving local economy is also noted in recent trends in the region’s unemployment rate. As illustrated, the six-county Eastern Indiana Region’s unemployment rate consistently exceeded national averages through the decade of the 2000s, reaching a peak level of 12.3 percent at the height of the last recession in 2009. However, beginning in 2011 concerted efforts by various public and private stakeholders to re-energize the local economy saw unemployment levels steadily decline to the 5.0 percent mark by 2015, a level modestly lower than national averages. In fact, during the 2015-2019 timeframe, regional unemployment levels consistently remained below the nation as a whole. In fact, the 3.5 percent regional unemployment rate recorded during the 2018-2019 period represented the lowest level witnessed in the six-county region in more than two decades. As previously noted, the economic constraints of 2020 saw unemployment levels spike across the country, settling at year-end at 8.1 percent nation-wide and 7.0 percent in the Eastern Indiana Region. However, reflecting (at least in part) proactive state and regional measures in support of the business community, preliminary statistics through May 2021 indicate that regional unemployment rate has fallen to 4.0 percent, indicating that the localized Eastern Indiana regional economy has begun to stabilize. Our conclusion also considers the necessity to sustain pro-active regional economic development initiatives such as Eastern Indiana Transforms which outlines a multi-disciplinary approach to attracting and retaining workforce talent by providing infrastructure improvements necessary to enable employment expansion; the establishment of opportunity zone designations and other tax incentives to promote employment growth; initiating workforce training and continuing education programs; and partnering with regional stakeholders to ensure the availability of quality, affordable housing options. To this point, it is noteworthy that the most currently available 2018 American Community Survey/Census estimates indicate that just over one-half (52.8 percent) of Union County’s workforce live and work locally. As detailed in the following text table, another 19.5 percent of the county’s workforce reside elsewhere in the six-county Eastern Indiana Region, largely commuting from Wayne and Fayette counties, while the principal sources of out-of-area workers emanate from adjoining more rural areas of Indiana and/or the greater Indianapolis, Muncie and Dayton metro areas which are all within a one-hour drive of Union County.
TRENDS IN UNEMPLOYMENT RATES-- EASTERN INDIANA REGION AND THE U.S. --
2.0
3.0
4.0
5.0
6.0
7.0
8.0
9.0
10.0
11.0
12.0
13.0
2.0
3.0
4.0
5.0
6.0
7.0
8.0
9.0
10.0
11.0
12.0
13.0
U.S. Eastern Indiana Region
U.S. (Rate)
Source: U.S. Department of Labor, Bureau of Labor Statistics
Eastern Indiana Region (Rate)
(1) Preliminary YTD May.

Strategic Planning Analysis Union County Economic Development Commission
Economic and Residential Outlook Union County, Indiana
Page 2.5 TRACY CROSS & ASSOCIATES, INC.
DEMOGRAPHICS Not surprisingly, estimates derived from the 2010 Census and carried forward to 2020 indicate that population and household growth throughout the Eastern Indiana Region has mirrored recent employment trends over the last two decades. Specifically, as summarized in Appendix A2.1, the Eastern Indiana Region supported an estimated 2020 household base of 72,762, representing the loss of 374 households yearly since 2010. Household contractions through 2025 are projected to moderate to an estimated overall household base of 72,016, reflecting the loss of 149 households yearly over the five-year period. In 2020, the host Union County supported a household base of 2,759, representing 3.8 percent of the six-county region. Notably, while statistics must be viewed in context, Union County maintained fairly stable household levels during the decade, representing only six percent of total regional household losses (or an average of 18 yearly) during the 2010-2020 timeframe. Consistent with the region as a whole, household contractions in Union County are expected to subside during the 2020-2025 timeframe to a projected overall household base of 2,709 in 2025. Household growth forecasts reconcile the expectation of a slowly improving regional economy over the forecast period, offset by the distinct absence of new residential development, coupled with tighter lending controls. It is also important to recognize that Census household growth projections do not reflect potentials inherent in redevelopment initiatives to repurpose under-utilized properties to better meet the demands of resident households.
Total Civilian Employment 1,254 100.0Union County, IN(1) 662 52.8Fayette County, IN(1) 113 9.0Wayne County, IN(1) 107 8.5Franklin County, IN 67 5.3Butler County, OH 36 2.9Preble County, OH 26 2.1Marion County, IN 26 2.1Delaware County, IN 14 1.1Hamilton County, IN 14 1.1Randolph County, IN(1) 10 0.8Henry County, IN(1) 8 0.6Rush County, IN(1) 7 0.6All Other Out-of-Area(4) 164 13.1
Within a 40-minute Commute(2) 129 10.3Within a 60-minute Commute(3) 54 8.2
(1)
(2)
(3)
(4)
Source: OnTheMap; U.S. Bureau of the Census-American Community Survey 2018
Wayne County Workers
COMMUTATION TRENDS: CIVILIAN EMPLOYED WORKERS - 2018-- UNION COUNTY PMA --
County of Residence Number Percent
Representing additional out-of-region and out-of-state residents estimated to include contract/remote workers.
Counties comprising defined Eastern Indiana Region.
Out-of-Region Workforce Summary
Includes Franklin County (Brookville, IN); Preble County, OH (Dayton Metro Area); and Butler County (Hamilton/Cincinnati Metro Area).Includes Delware County (Muncie, IN); Hamilton and Marion Counties (Indianapolis Metro Area).
Union County, IN52.8%
Remainder of Eastern Indiana Region
19.5%
RemainingOut-of-Area
27.7%

Strategic Planning Analysis Union County Economic Development Commission
Economic and Residential Outlook Union County, Indiana
Page 2.6 TRACY CROSS & ASSOCIATES, INC.
Consistent with the region overall, tenure distributions in the Union County PMA favor ownership housing which currently accounts for 72.6 percent of all occupied units. Not to be dismissed, however, an estimated 755 Union County households or 27.4 percent are renters. Renter households in Union County primarily reflect elevated participation in ownership inventory brought to the market as rentals, coupled with a modicum of age- and/or income-restricted/affordable rental development of late such as Patriot Pointe Apartments which were introduced in Liberty in the early 2000’s. As detailed in Exhibit 2.1, Union County householders are relatively mature, reflecting a median age of 55 years. Specifically, 15.0 percent of market area householders are under the age of 35, with 33.1 percent in the family-oriented age groups of 35 to 54, and 39.4 percent aligning move-down categories of 55 to 74. The remaining 12.5 percent are at least 75 years of age. In the town of Liberty, a slightly higher 17.0 percent of resident householders are under the age of 35, while 33.6 percent reflect more mature groups aged 55 to 74, and 15.1 percent align age categories of 75 and older. These age cohorts typically represent the strongest profiles for rental and/or lifestyle-oriented (i.e., low maintenance) housing alternatives. Moreover, analysis of household compositions reveals that almost two-thirds of Union County households represent households without children under the age of 18, while the following text table reveals that the county’s household base is primarily comprised of persons living alone or in two-person arrangements, consistent with typical renter and/or lifestyle profiles.
Eastern Indiana Region(1) 198,205 193,735 184,516 182,737 -447 -922 -356Union County PMA 7,349 7,516 6,943 6,780 17 -57 -33
Percent of Region 3.7 3.9 3.8 3.7 --- --- ---Town of Liberty 1,946 2,133 1,990 1,949 19 -14 -8
Percent of Region 26.5 28.4 28.7 28.7 --- --- ---
Eastern Indiana Region(1) 78,807 76,503 72,762 72,016 -230 -340 -149Union County PMA 2,793 2,938 2,759 2,709 15 -18 -10
Percent of Region 3.5 3.8 3.8 3.8 --- --- ---Town of Liberty 809 861 801 784 5 -6 -3
Percent of Region 29.0 29.3 29.0 28.9 --- --- ---
(1)
Source: U.S. Census Bureau, Environics Analytics and Tracy Cross & Associates, Inc.
POPULATION AND HOUSEHOLD TRENDS:-- EASTERN INDIANA REGION(1) AND THE UNION COUNTY PMA --
Average Annual Change 2000 -
Population
Households
Defined as Fayette, Henry, Randolph, Rush, Union and Wayne counties, Indiana.
2010 - 2020 -Area 2000 2010 2020 2025 2010 2020 2025

Total Households 72,762 100.0 2,759 100.0 801 100.0
Average Household Size
22,802 31.3 945 34.3 286 35.7
14,204 19.5 629 22.8 164 20.5
8,223 11.3 307 11.1 119 14.9
375 0.5 9 0.3 3 0.0
49,960 68.7 1,814 65.7 504 62.9
22,877 31.4 918 33.3 200 25.0
4,219 5.8 135 4.9 28 3.5
22,864 31.4 761 27.6 276 34.5
Total Households 72,762 100.0 2,759 100.0 801 100.0
2,692 3.7 84 3.0 41 5.1
8,921 12.3 329 11.9 95 11.9
10,490 14.4 407 14.8 144 18.0
12,545 17.2 506 18.3 131 16.4
14,645 20.1 555 20.1 133 16.6
13,121 18.0 531 19.2 136 17.0
7,218 9.9 241 8.7 75 9.4
3,130 4.3 106 3.8 46 5.7
11,613 16.0 413 15.0 136 17.0
23,035 31.7 913 33.1 275 34.3
27,766 38.2 1,086 39.4 269 33.6
(1)
Source: Environics Analytics and Tracy Cross & Associates, Inc.
Attribute
NonFamily
Married Couple
Households with Children
Married Couple
75 - 84
Number
55 - 64
Defined as Fayette, Henry, Randolph, Rush, Union and Wayne counties, Indiana.
- - - - - - - - - - 53.0 Years - - - - - - - - - -
Households Under 35
Households 35 - 54
Households 55 - 74
- - - - - - - - - - 54.0 Years - - - - - - - - - - - - - - - - - - - - 55.0 Years - - - - - - - - - -
Other Family
NonFamily
Households without Children
35 - 44
Other Family
HOUSEHOLDS BY TYPE AND AGE OF HOUSEHOLDER: 2020
-- EASTERN INDIANA REGION(1) AND THE UNION COUNTY PMA --
Eastern Indiana Region(1) Town of LibertyUnion County PMA
Number Percent
85 and Over
Median
45 - 54
Number Percent
- - - - - - - - - - - - 2.49 - - - - - - - - - - - -
2020 Households by Type
- - - - - - - - - - - - 2.44 - - - - - - - - - - - - - - - - - - - - - - - - 2.42 - - - - - - - - - - - -
Percent
2020 Households by Age of Householder
Under 25
25 - 34
65 - 74
2.1

Strategic Planning Analysis Union County Economic Development Commission
Economic and Residential Outlook Union County, Indiana
Page 2.7 TRACY CROSS & ASSOCIATES, INC.
Moreover, and specific to mature age categories, it is estimated household segments at age categories of 65 and older will increase their representation levels over the next five years as outlined below:
2,692 2,821 84 84 41 44
8,921 8,849 329 333 95 95
10,490 9,813 407 378 144 130
12,545 11,228 506 425 131 130
14,645 13,818 555 536 133 126
13,121 14,967 531 596 136 138
10,348 10,520 347 357 121 121
72,762 72,016 2,759 2,709 801 784
(1)
Source: Environics Analytics and Tracy Cross & Associates, Inc.
2020 2025
Under 25
HOUSEHOLD GROWTH PROJECTIONS BY AGE GROUP-- EASTERN INDIANA REGION(1) AND THE UNION COUNTY PMA --
Eastern Indiana Town ofRegion(1) Liberty
Union CountyPMA
2020 2025Age Range 2020 2025
Defined as Fayette, Henry, Randolph, Rush, Union and Wayne counties, Indiana.
25-34
35-44
45-54
55-64
65-74
75 and over
Total
72,762 100.0 2,759 3.8 801 100.01-Person Household 19,960 27.4 678 0.9 251 31.32-Person Household 26,332 36.2 994 1.4 242 30.23-Person Household 11,459 15.7 478 0.7 130 16.24-Person Household 8,717 12.0 371 0.5 109 13.65-Person Household 3,940 5.4 165 0.2 47 5.96-Person Household 1,505 2.1 53 0.1 16 2.07 or More Person Household 849 1.2 20 0.0 6 0.7
Total 1- and 2-Person Households 46,292 63.6 1,672 60.6 493 61.5
(1)
Source: U.S. Department of Commerce, Bureau of the Census: Census 2010; Environics Analytics
HOUSEHOLD COMPOSITION: 2020-- EASTERN INDIANA REGION(1) AND THE UNION COUNTY PMA --
Eastern Indiana Town ofRegion(1) Liberty
Union CountyPMA
Number Percent
Defined as Fayette, Henry, Randolph, Rush, Union and Wayne counties, Indiana.
Attribute Number Percent Number Percent
Total Households

Strategic Planning Analysis Union County Economic Development Commission
Economic and Residential Outlook Union County, Indiana
Page 2.8 TRACY CROSS & ASSOCIATES, INC.
Householders in Union County supported an estimated 2020 median annual income of $48,451, generally consistent with incomes throughout the Eastern Indiana Region. As detailed in Exhibit 2.2, median incomes in the town of Liberty are modestly lower than elsewhere in the PMA, estimated at $43,825 in 2020. Nonetheless, and most germane to potential quality new residential construction development in Union County, Exhibit 2.2 also reveals that nearly three-quarters of resident households under the age of 25 and those aged 25 to 44 earn at least $35,000 annually, incomes requisite to support rental rates for quality, new market rate apartment development. In addition, roughly one-third of resident households aged 25 and older earn incomes in excess of $75,000 per annum, levels sufficient to support a measure of new for sale housing, especially given the likelihood of continued favorable mortgage interest rates. RESIDENTIAL CONSTRUCTION TRENDS One potentially significant barrier to anticipated regional economic expansion is the definitive lack of residential construction throughout the Eastern Indiana Region over the last 30+ years. As summarized in the following text table, Census estimates indicate that less than 8.0 percent of all housing units in the six-county region have been built since 1999, and less than ten percent were built during the decade of the 1990s, while fully one-half were built prior to 1960. In Union County, the median year of a residential structure built is 1967. These statistics are further supported by analysis of regional residential construction trends over the last two decades. Specifically, since 2000 and through 2020, the six-county Eastern Indiana Region has averaged a nominal 282 residential construction authorizations yearly. As detailed in Appendix A2.2, 79.0 percent of annual permits or 222 units yearly represented single family forms (which include single-address townhomes and duplexes). As further detailed in Appendix A2.2, the host Union County PMA has accounted for 5.7 percent of total single family authorizations since 2000, averaging 14 units yearly. As also detailed, residential construction was greatly suppressed during the housing downtown which began in late-2007 to be followed by the national recession which lasted through 2011. Between 2008 and 2013, for instance, the Union County PMA saw authorizations fall to a yearly average of 6 units, down 80.0 percent compared to the 25-unit average witnessed during the previous 2000-2007 period. As also illustrated, single family development in the Eastern Indiana Region has yet to show signs of significant improvement, with regional authorizations during the more recent 2014-2020 timeframe averaging a mere 121 units yearly, and a nominal eight units annually in Union County itself.
Percent
84,569 100.0Built in 2014 or Later 337 0.4Built in 2010 to 2013 728 0.9Built 2000 to 2009 5,113 6.0Built 1990 to 1999 7,823 9.3Built 1960 to 1989 27,918 33.0Built 1959 or Earlier 42,650 50.4
Median Year Structure Built
(1)
Source: Environics Analytics
2020 HOUSING UNITS BY YEAR BUILT-- EASTERN INDIANA REGION(1) --
Total Housing Units
Defined as Fayette, Henry, Randolph, Rush, Union and Waynecounties, Indiana.
1960
Eastern Indiana
Region(1)
Attribute Number

72,762 100.0 $50,4422,692 3.7 32,8528,921 12.3 52,737
10,490 14.4 60,05812,545 17.2 68,39514,645 20.1 49,48413,121 18.0 43,6397,218 9.9 33,8363,130 4.3 26,605
2,692 3.7 $32,8521,251 46.5 ---
19,411 26.7 $56,69313,958 71.9 ---6,899 35.5 ---
27,190 37.4 $58,20922,943 84.4 ---14,539 53.5 ---
13,121 18.0 $43,6397,952 60.6 ---3,073 23.4 ---
2,759 100.0 $48,45184 3.0 27,406
329 11.9 53,628407 14.8 60,596506 18.3 61,786555 20.1 56,032531 19.2 37,695241 8.7 30,804106 3.8 25,784
84 3.0 $27,40625 29.8 ---
736 26.7 $57,481572 77.7 ---234 31.8 ---
1,061 38.5 $58,776790 74.5 ---365 34.4 ---
531 19.2 $37,695286 53.9 ---77 14.5 ---
801 100.0 $43,82541 5.1 12,38895 11.9 51,802
144 18.0 63,568131 16.4 54,644133 16.6 34,079136 17.0 28,13375 9.4 25,82246 5.7
41 1.5 $12,3887 8.3 ---
239 29.8 $58,891206 86.2 ---88 36.8 ---
264 33.0 $44,284186 70.5 ---70 26.5 ---
136 4.9 $28,13366 12.4 ---16 3.0 ---
(1)
With Incomes of $75,000 or More
Defined as Fayette, Henry, Randolph, Rush, Union and Wayne counties, Indiana.
Total Households Aged 45 to 64 YearsWith Incomes of $35,000 or MoreWith Incomes of $75,000 or More
Total Households Aged 65 to 74 YearsWith Incomes of $35,000 or More
Total Households Under 25 Years
Total Households Aged 25 to 44 YearsWith Incomes of $35,000 or MoreWith Incomes of $75,000 or More
55 - 64 Years65 - 74 Years75 - 84 Years85 Years and Over
With Incomes of $75,000 or More
Source: Environics Analytics and Tracy Cross & Associates, Inc.
Total Households
Town of Liberty
Attribute Number Percent Median
With Incomes of $35,000 or More
Total HouseholdsUnder 25 Years25 - 34 Years35 - 44 Years45 - 54 Years
With Incomes of $35,000 or More
Total Households Aged 25 to 44 YearsWith Incomes of $35,000 or MoreWith Incomes of $75,000 or More
Total Households Aged 45 to 64 YearsWith Incomes of $35,000 or MoreWith Incomes of $75,000 or More
Total Households Aged 65 to 74 Years
With Incomes of $35,000 or More
Total HouseholdsUnder 25 Years25 - 34 Years35 - 44 Years45 - 54 Years55 - 64 Years65 - 74 Years75 - 84 Years85 Years and Over
Total Households Under 25 Years
Total Households
Union County PMA
Attribute Number Percent Median
With Incomes of $75,000 or More
Total Households Aged 65 to 74 YearsWith Incomes of $35,000 or MoreWith Incomes of $75,000 or More
With Incomes of $35,000 or More
85 Years and Over
Total Households Under 25 YearsWith Incomes of $35,000 or More
Total Households Aged 25 to 44 YearsWith Incomes of $35,000 or MoreWith Incomes of $75,000 or More
Total Households Aged 45 to 64 Years
75 - 84 Years
Attribute Number Percent Median
Total HouseholdsUnder 25 Years25 - 34 Years35 - 44 Years45 - 54 Years55 - 64 Years65 - 74 Years
HOUSEHOLD AGE AND INCOME CHARACTERISTICS: 2020
-- EASTERN INDIANA REGION(1) AND THE UNION COUNTY PMA --
Total Households
Eastern Indiana Region(1)
2.2

Strategic Planning Analysis Union County Economic Development Commission
Economic and Residential Outlook Union County, Indiana
Page 2.9 TRACY CROSS & ASSOCIATES, INC.
Multifamily authorizations, in turn, have been extremely limited throughout the six-county region over the last two decades, averaging a mere 60 units annually. Multifamily construction has been concentrated in Wayne and Henry counties which (collectively) have authorized an average of 46 units yearly or 76.7 percent of all multifamily issuances in the six-county region. In fact, as also detailed in Appendix A2.2, since 2002, only 19 multifamily units have been permitted in Union County, indicative of a measure of pent-up demand on the basis of replacement requirements alone. RESIDENTIAL OUTLOOK In tandem with anticipated regional economic recovery, the Eastern Indiana Region could support construction of 250 new residential units annually during the initial 2021-2025 forecast period (or 1,250 units through 2025) if supply were made available and market-consistent rents/sales prices are maintained. Thereafter, based upon successful implementation of regional planning initiatives, residential construction requirements could advance to an annual pace of 325 on a sustaining basis. Of the potential initial construction requirements, 165 units yearly could represent detached and low-density attached for sale idioms, with the remaining 85 units yearly reflecting market rate/workforce apartments. To this latter point, given the tightness of the market as noted in Section 3, rental apartment potentials could double in any given year if (again) supply were made available. The initial projected new construction
Total 250 325
For Sale 165 225
Single Family Detached 125 175Duplex/Townhome 40 50
Market Rate/Workforce Apartment 85 + 100 +
Type 2021 - 2025 2025 - 2030
Source: Tracy Cross & Associates, Inc.
ANNUAL RESIDENTIAL POTENTIALS BY PRODUCT TYPE-- EASTERN INDIANA REGION --
2021 - 2030
Estimated Annual Absorption PotentialsProduct By Time Period
SINGLE FAMILY PERMIT TRENDS: UNION COUNTY PMA2000 – 2020
0.0
10.0
20.0
30.0
40.0
50.0
0
10
20
30
40
50
Total Permits Percent of Eastern Indiana Region
Total Permits Percent of Eastern Indiana Region
Source: U.S. Bureau of the Census: C-40 Construction Reports.
1425
58
122020:
Union County PMAAverage (Units/Yr.)
2000 - 2020:2000 - 2007:2008 - 2013:2014 - 2020:

Strategic Planning Analysis Union County Economic Development Commission
Economic and Residential Outlook Union County, Indiana
Page 2.10 TRACY CROSS & ASSOCIATES, INC.
requirements primarily reflect replacement demand as large components of existing ownership and rental housing throughout the region are now at or nearing obsolescence and also consider a limited measure of potential for in-migration based upon regional commutation patterns. As also summarized in Section 3, new construction requirements consider sales trends among existing (principally) single family detached alternatives, coupled with demand for housing forms which meet the transitioning needs of maturing residents throughout the region. Further disaggregating initial regional for sale construction requirements, roughly 125 units yearly would represent single family detached alternatives, with the remaining 40 units yearly reflecting low-density townhome/duplex/villa forms. Based upon the distribution of household incomes in the region, together with an examination of home sales over the last 27 months (2019-1st Quarter 2021), overall Eastern Indiana Region new construction for sale potentials will carry a median sales price of $205,000 in current May 2021 dollars. As delineated in the following text table, it is estimated that roughly 70.0 percent of projected new single family detached closings will occur at price points between $150,000 and $224,999, while new attached for sale forms will hover at the $180,000 mark.
Addressing rental apartment construction requirements, the 85- to 100-unit yearly regional projection represents more than adequate support for potential new and/or adaptive conversion apartment initiatives in Union County. However, as detailed in Appendix A2.3, it is unlikely that regional new construction requirements will be met as there are only three boutique-scale rental developments announced in the whole of the six-county region, collectively accounting for only 67 potential units. Similarly, while there are ten detached or attached for sale developments and a potential 210 units in some stage of the regional planning pipeline, only 59 units are currently under construction and expected to begin marketing shortly, while another 41 are expected to be introduced in the next 12 to 18 months – all found in Fayette or Henry County.
Under $100,000 0 0.0 0 0.0 0 0.0100,000 - 124,999 0 0.0 0 0.0 0 0.0125,000 - 149,999 17 10.3 12 9.6 5 12.5150,000 - 199,999 55 33.3 30 24.0 25 62.5200,000 - 224,999 55 33.3 45 36.0 10 25.0
25 15.2 25 20.0 0 0.05 3.0 5 4.0 0 0.05 3.0 5 4.0 0 0.0
400,000 and Above 3 1.8 3 2.4 0 0.0
Total 165 100.0 125 100.0 40 100.0
Median
Percent
225,000 - 249,999
$205,000 $212,000 $180,000
Source: Tracy Cross & Associates, Inc.
Price Range Number Number Number(In 2021 Dollars) of Sales Percent of Sales Percent of Sales
250,000 - 299,999300,000 - 399,999
ANNUAL FOR SALE POTENTIALS BY PRICE RANGE-- EASTERN INDIANA REGION --
2021 - 2025
Total Single Family Detached Townhome/Condominium

Page 3.1 TRACY CROSS & ASSOCIATES, INC.
3. THE RESIDENTIAL MARKETPLACE As detailed in Section 2, there has been only limited and sporadic residential construction throughout the six-county Eastern Indiana Region over the last two-plus decades. This section of our report therefore summarizes trends from a regional perspective, focusing upon those market rate rental apartment and newer construction for-sale housing alternatives viewed as representative of potential future offerings throughout the region. We begin with an overview of the rental apartment sector. THE APARTMENT MARKET – AN OVERVIEW The Eastern Indiana Region’s rental marketplace is characterized by smaller-scale and/or privately-managed developments built, for the most part, during the 1960s through the 1980s, along with former single address homes which have been converted to multi-unit structures, and a limited number of adaptive residential conversion units within former city center commercial properties throughout the region. Most represent two-story garden/walk-up developments which typically provide on-site laundry facilities and surface parking. Many developments in the region reflect income-restricted family or senior (55+) projects designated for households earning not more than 60.0 percent of area median income. Therefore, in order to assess the marketability of future market rate rental alternatives, our firm identified 17 projects providing a collective 906 market rate units for evaluation. The 17 representative market rate communities are concentrated in the city of Richmond in Wayne County, where five developments provide 407 units or 45.0 percent of the overall base, and in the city of New Castle in Henry County (251 units or 27.7 percent). Overall, the 17 representative developments are of moderate scale, averaging 53 in size and reflect an average year built of 1986. As summarized in Exhibit 3.1, as of May 2021, posted rents among the 17 representative
developments averaged $719 monthly which included an 887 square foot apartment home. Posted rents yield a current dollar value ratio of $0.81 per square foot. For the most part, plan offerings include one and two bedroom designs, along with a modicum of three bedroom plan styles which generally range in unit size from 600 to 1,200 square feet.
Vacancies among the 16 stabilized developments stood at a very tight 1.1 percent as of May 2021, reflecting a mere 10 of 874 stabilized units available. In fact, ten of the 16 stabilized developments are fully leased and all report waiting lists for residency. For perspective, market balance generally requires vacancies in the range of 5.0 to 6.0 percent to allow for filtering between communities.
The region’s newest market rate communities represent KDC Investment group’s Villa developments, including its Spiceland Villas, Knightstown Villas, and Stone Run Villas introduced in Henry County in 2017 and 2018 and, most recently, the Rushville Villas in Rush County. The following paragraph briefly summarizes this newest development for perspective.

TOTAL / AVERAGE: 906 10 1.1 887 $719 $0.81
Fayette County 130 1 0.8 1,040 $752 $0.72
Cambridge Oaks / Connersville 16 1 6.3 725 595 0.82
Fayette Apartments / Connersville 50 0 0.0 1,128 825 0.73
Towne Terrace / Connersville 64 0 0.0 1,050 735 0.70
Henry County 305 2 0.7 833 $718 $0.86
Hickory Square / Knightstown 6 0 0.0 850 588 0.69
Knightstown Villas / Knightstown 8 0 0.0 1,055 788 0.75
Stone Run Villas / Knightstown 24 0 0.0 1,055 788 0.75
Beckford Place / New Castle 41 1 2.4 576 629 1.09
Jamestown Village / New Castle 180 1 0.6 870 722 0.83
Kalia Apartments / New Castle 30 0 0.0 603 726 1.20
Spiceland Villas / Spiceland 16 0 0.0 1,055 788 0.75
Randolph County --- --- --- --- --- ---
None at this time.
Rush County 32 3 9.4 1,173 $880 $0.75
Rushville Villas / Rushville(1) 32 3 9.4 1,173 880 0.75
Union County 32 1 3.1 663 $700 $1.06
Stonebrook / West College Corner 32 1 3.1 663 700 1.06
Wayne County 407 6 1.5 874 $698 $0.80
Chester Heights / Richmond 104 0 0.0 765 681 0.89
Concorde Village / Richmond 33 0 0.0 1,060 684 0.65
Ivy Green / Richmond 100 4 4.0 848 774 0.91
Rose Stone / Richmond 64 0 0.0 576 525 0.91
Townhouse Village / Richmond 106 2 1.9 1,127 750 0.67
(1)
Source: Tracy Cross & Associates, Inc.
1967
Occupancies commenced April 2021; absorption rate of 14.5 units per month reflects 29 units occupied as of May 2021. Development excluded frommarket vacancy rate.
1974
1963
1963
1990
1987
1984
1978
1969
2017
---
2021
2021
1984
1984
1986
1980
1971
1972
1976
1993
1968
2018
2018
Development / Municipality Built of Units Vacant Vacant (Sq. Ft.) $ $/Sq.
Year Number Number Percent Unit Size
COMPOSITE SUMMARY: REPRESENTATIVE MARKET RATE APARTMENT DEVELOPMENTS-- EASTERN INDIANA REGION - MAY 2021 --
Average Average Posted
3.1

Strategic Planning Analysis Union County Economic Development Commission
Economic and Residential Outlook Union County, Indiana
Page 3.2 TRACY CROSS & ASSOCIATES, INC.
• Rushville Villas is a 32-unit development aligning 16th Street, approximately one-half mile west of SR 3 in Rushville, IN. Consistent with KDC Investments’ regional communities, the apartments are distributed among a series of eight-unit garden/walk-up buildings. Plan offerings including two and three bedroom designs which range in unit size from 1,155 to 1,231 square feet. As of May 2021, an average 1,173 square foot apartment home leases for $788 per month, translating to a value ratio of $0.75 per square foot. Common area maintenance and refuse collection are included in the monthly rent, with the resident responsible for all utilities. Interior features include nine foot ceiling height, laminate wood flooring in kitchens and baths, with carpeted living areas and bedrooms; stainless steel kitchen appliances and solid-surface countertops/islands in kitchens and baths; walk-in master bedroom closets and secondary bedroom closet systems; and ceiling fans in living room and bedrooms. All apartments provide laundry appliance hook-ups, with appliances available for an incremental monthly fee. Individual unit security systems are also available for an incremental fee. Community amenities include a picnic area with outdoor grills. The property is also adjacent to a planned 40.0-acre community park. Rushville Villas began leasing in January 2021 with initial occupancies commencing in April. As of May 2021, 29 of the 32 units had been occupied, translating to an absorption rate of 14.5 units per month.
THE FOR SALE MARKETPLACE New construction single family and attached for sale development throughout the Eastern Indiana Region is generally characterized as broker-represented and reflects single lot development or multiple builder subdivisions which have been developed in phases over an extended period of time. At present, there are no national homebuilding companies operating in the six-county region, although DR Horton maintains a presence in the adjoining Dayton, Ohio metro area. Local homebuilding companies include (among others) semi-custom and custom homebuilders such as Century Complete, Davis Homes, Trademark Homes, Taylor Homes, Hallmark Homes, and Miles Richmond marketing single family homes developed on varying lot widths which range in sales price from the low $200,000s to the high $400,000s and above. The following paragraphs highlight pertinent regional for sale sector trends for perspective: Data abstracted from the East Central Indiana Realtors Association reveals that there were 1,393
existing and new construction single family homes sold in the six-county Eastern Indiana Region in 2020 roughly on par with the 1,409 homes closed in 2019. As summarized in Exhibit 3.2, single family closings in 2020 carried a median closing price of $107,000, reflecting a sharp 18.9 percent increase over the $90,000 median noted one year earlier. The average market time for a single family home stood at 71 days, substantially lower than the 101-day average in 2019. As Exhibit 3.2 also reveals, nearly three-quarters of all closing activity occurred at price points below $150,000, likely reflecting the dominance of vintage housing stock throughout the region. Nonetheless, in 2020, 150 closings occurred at price points in excess of $225,000, reflecting a median closing price of $291,960. These latter higher-priced closings represented a 54.6 percent increase over the 97 closings priced in excess of $225,000 in 2019, while the median closing price advanced 4.9 percent compared to $278,430 median noted previously.
Rushville Villas – Rushville, IN

Under $100,000 1,583 50.6 774 54.9 650 46.7 159 48.3
100,000 - 124,999 368 11.8 173 12.3 160 11.5 35 10.6
125,000 - 149,999 416 13.3 166 11.8 212 15.2 38 11.6
150,000 - 174,999 241 7.7 113 8.0 99 7.1 29 8.8
175,000 - 199,999 169 5.4 57 4.0 86 6.2 26 7.9
200,000 - 224,999 72 2.3 29 2.1 36 2.6 7 2.1
82 2.6 32 2.3 39 2.8 11 3.3
250,000 - 299,999 86 2.7 29 2.1 43 3.1 14 4.3
300,000 - 399,999 77 2.5 25 1.8 44 3.2 8 2.4
400,000 and Above 37 1.2 11 0.8 24 1.7 2 0.6
3,131 100.0 1,409 100.0 1,393 100.0 329 100.0
(1)
(2)
Source: Paragon Mid-Eastern Indiana Real Estate Services
As of March 2021. Closings year-to-date March translate to an estimated annualized 1,700 closings.
Average Days on Market - - - - - - - - 85 - - - - - - - - - - - - - - - - 101 - - - - - - - - - - - - - - - - 71 - - - - - - - - - - - - - - - - 83 - - - - - - - -
Defined as Fayette, Henry, Randolph, Rush, Union and Wayne counties, Indiana.
- - - - - - $122,158 - - - - - -
Median Price - - - - - - $99,565 - - - - - - - - - - - - $90,000 - - - - - - - - - - - - $107,000 - - - - - - - - - - - - $109,050 - - - - - -
- - - - - - $107,435 - - - - - -
Total
Average Price - - - - - - $118,150 - - - - - - - - - - - - $124,858 - - - - - -
Closings Percent Closings Percent
225,000 - 249,999
Price Range Closings Percent Closings PercentTotal Number of Number of Number of
CLOSINGS BY PRICE RANGE: NEW AND EXISTING SINGLE FAMILY HOMES-- EASTERN INDIANA REGION(1) --
Total 2019 2020 YTD 2021(2)
Closings by Year
3.2

Strategic Planning Analysis Union County Economic Development Commission
Economic and Residential Outlook Union County, Indiana
Page 3.3 TRACY CROSS & ASSOCIATES, INC.
The generally affordable nature of the region’s single family market, as well as its apartment sector, has precluded significant development of attached for sale housing prices apart from a relatively limited number of developments featuring ranch-style duplex or villa idioms directed to localized move-down consumers. For example, as summarized in Exhibit 3.3, during the 2019-1st Quarter 2021, only 40 attached units were sold in the entire six-county region, reflecting an overall median sales price of $105,000. The average marketing time for an attached unit stood at 101 days.

Under $100,000 18 45.0 13 59.1 5 35.7 0 0.0
100,000 - 124,999 10 25.0 5 22.7 4 28.6 1 25.0
125,000 - 149,999 6 15.0 4 18.2 1 7.1 1 25.0
150,000 - 174,999 2 5.0 0 0.0 2 14.3 0 0.0
175,000 - 199,999 0 0.0 0 0.0 0 0.0 0 0.0
200,000 - 224,999 0 0.0 0 0.0 0 0.0 0 0.0
2 5.0 0 0.0 1 7.1 1 25.0
250,000 - 299,999 2 5.0 0 0.0 1 7.1 1 25.0
300,000 - 399,999 0 0.0 0 0.0 0 0.0 0 0.0
400,000 and Above 0 0.0 0 0.0 0 0.0 0 0.0
40 100.0 22 100.0 14 100.0 4 100.0
(1)
(2)
Source: Paragon Mid-Eastern Indiana Real Estate Services
As of March 2021. Closings year-to-date March translate to an estimated annualized 21 total closings.
Average Days on Market - - - - - - - - 101 - - - - - - - - - - - - - - - - 122 - - - - - - - - - - - - - - - - 83 - - - - - - - - - - - - - - - - 97 - - - - - - - -
Defined as Fayette, Henry, Randolph, Rush, Union and Wayne counties, Indiana.
- - - - - - $188,375 - - - - - -
Median Price - - - - - - $105,000 - - - - - - - - - - - - $95,000 - - - - - - - - - - - - $114,950 - - - - - - - - - - - - $184,500 - - - - - -
- - - - - - $98,611 - - - - - -
Total
Average Price - - - - - - $138,417 - - - - - - - - - - - - $128,264 - - - - - -
Closings Percent Closings Percent
225,000 - 249,999
Price Range Closings Percent Closings PercentTotal Number of Number of Number of
CLOSINGS BY PRICE RANGE: NEW AND EXISTING ATTACHED UNITS
-- EASTERN INDIANA REGION(1) --
Total 2019 2020 YTD 2021(2)
Closings by Year
3.3

198,205 7,349 1,946 5,403 78,807 2,793 809 1,984193,735 7,516 2,133 5,383 76,503 2,938 861 2,077184,516 6,943 1,990 4,953 72,762 2,759 801 1,958182,737 6,780 1,949 4,831 72,016 2,709 784 1,925
-447 17 19 -2 -230 15 5 9-922 -57 -14 -43 -374 -18 -6 -12-356 -33 -8 -24 -149 -10 -3 -7
Total Housing Units 84,569 3,173 930 2,243 Total Households 72,762 2,759 801 1,958
Total Occupied 72,762 2,759 801 1,958 Under $35,000 25,171 946 299 647Owner Occupied 51,587 2,004 495 1,509 35,000 - 49,999 10,922 479 166 313
Percent 70.9 72.6 61.8 77.1 50,000 - 74,999 13,716 622 152 47075,000 - 99,999 9,303 320 81 239
Renter Occupied 21,175 755 306 449 100,000 - 149,999 9,570 283 78 205Percent 29.1 27.4 38.2 22.9 150,000 - 199,999 1,980 78 20 58
2,100 31 5 26Vacant 11,807 414 129 285
Percent 14.0 13.0 13.9 12.7 Median $50,442 $48,452 $43,825 $50,345
184,516 6,943 1,990 4,953 84,569 3,173 930 2,2437,317 68 55 13 337 11 0 11
In Households 177,199 6,875 1,935 4,940 Built 2010 to 2013 728 3 0 3Built 2000 to 2009 5,113 302 91 211
72,762 2,759 801 1,958 Built 1990 to 1999 7,823 457 126 33127,918 1,041 301 74042,650 1,359 412 947
2.44 2.49 2.42 2.52 Median Year Structure Built 1960 1967 1966 1967
(1)
Source: U.S. Department of Commerce, Bureau of the Census: Census 2000 and 2010 and Environics Analytics
POPULATION, HOUSEHOLDS, TENURE, AND INCOME: 2020-- EASTERN INDIANA REGION - UNION COUNTY PMA --
Eastern Union Town Remainder Eastern Union Town Remainderof of
Attribute/Year Region(1) PMA Liberty PMA Attribute/Year Region PMAIndiana County of of Indiana County
Liberty PMA
Population Households
2000 20002010 20102020 20202025 2025
Average AverageAnnual Change Annual Change
2000 - 2010 2000 - 20102010 - 2020 2010 - 20202020 - 2025 2020 - 2025
2020 Household Tenure 2020 Household Income
$200,000 and Above
2020 Household Size 2020 Housing Units by Year Built
Total Population Total Housing Units
Average Persons Per Household
Defined as Fayette, Henry, Randolph, Rush, Union and Wayne counties, Indiana.
In Group Quarters Built in 2014 or Later
Total HouseholdsBuilt 1960 to 1989Built 1959 or Earlier
A2.1

619 88 209 60 77 39 146
574 62 226 65 52 43 126
725 127 229 70 90 59 150
436 59 94 58 58 29 138
650 71 168 54 114 32 211
440 25 144 42 45 25 159
314 27 62 89 38 13 85
215 27 35 22 32 13 86
129 4 20 18 25 8 54
93 11 18 16 12 7 29
197 4 22 12 10 0 149
89 4 23 7 13 9 33
77 4 16 15 11 7 24
81 11 13 15 10 6 26
133 11 18 6 10 3 85
182 11 31 21 12 3 104
206 5 51 20 11 12 107
191 3 34 17 15 7 115
231 17 51 16 18 7 122
177 11 54 15 33 11 53
153 19 57 17 14 12 34
282 29 75 31 33 17 97
497 61 146 58 63 32 138
111 6 19 14 14 6 53
182 11 42 16 16 8 89
RESIDENTIAL BUILDING PERMIT TRENDS BY COUNTY-- EASTERN INDIANA REGION --
2000 - 2020
EasternWayne
Year Total County, IN County, IN County, IN County, IN County, IN County, INIndiana Fayette Henry Randolph Rush Union
2005
2006
2007
2008
2009
2010
Total
2000
2001
2002
2003
2004
2017
2018
2019
2020
AnnualAverage
2011
2012
2013
2014
2015
2016
2000 - 2020
2000 - 2007
2008 - 2013
2014 - 2020
A2.2
A2.2, Page 1 of 3

RESIDENTIAL BUILDING PERMIT TRENDS BY COUNTY-- EASTERN INDIANA REGION --
2000 - 2020
EasternWayne
Year Total County, IN County, IN County, IN County, IN County, IN County, INIndiana Fayette Henry Randolph Rush Union
A2.2
579 88 175 60 75 39 142
474 62 136 57 52 41 126
420 63 109 68 42 21 117
415 59 94 52 58 21 131
469 71 103 54 48 32 161
348 25 83 42 45 21 132
308 27 62 89 36 13 81
199 27 35 22 32 13 70
122 4 20 18 25 3 52
93 11 18 16 12 7 29
134 4 20 12 10 0 88
89 4 23 7 13 9 33
77 4 16 15 11 7 24
79 11 13 15 10 4 26
66 11 18 2 10 3 22
111 11 23 21 12 3 41
110 5 27 20 11 12 35
117 3 34 17 15 7 41
128 17 27 16 18 7 43
161 11 54 15 17 11 53
153 19 57 17 14 12 34
222 26 55 30 27 14 71
402 53 100 56 49 25 120
99 6 18 14 14 5 42
121 11 34 15 14 8 38
2001
2002
2003
2004
2005
2006
Single Family
2000
2013
2014
2015
2016
2017
2018
2007
2008
2009
2010
2011
2012
2008 - 2013
2014 - 2020
2019
2020
AnnualAverage
2000 - 2020
2000 - 2007
A2.2, Page 2 of 3

RESIDENTIAL BUILDING PERMIT TRENDS BY COUNTY-- EASTERN INDIANA REGION --
2000 - 2020
EasternWayne
Year Total County, IN County, IN County, IN County, IN County, IN County, INIndiana Fayette Henry Randolph Rush Union
A2.2
40 0 34 0 2 0 4
100 0 90 8 0 2 0
305 64 120 2 48 38 33
21 0 0 6 0 8 7
181 0 65 0 66 0 50
92 0 61 0 0 4 27
6 0 0 0 2 0 4
16 0 0 0 0 0 16
7 0 0 0 0 5 2
0 0 0 0 0 0 0
63 0 2 0 0 0 61
0 0 0 0 0 0 0
0 0 0 0 0 0 0
2 0 0 0 0 2 0
67 0 0 4 0 0 63
71 0 8 0 0 0 63
96 0 24 0 0 0 72
74 0 0 0 0 0 74
103 0 24 0 0 0 79
16 0 0 0 16 0 0
0 0 0 0 0 0 0
60 3 20 1 6 3 26
95 8 46 2 15 7 18
12 0 0 0 0 1 11
61 0 8 1 2 0 50
Source: U.S. Department of Commerce, C-40 Construction Reports
Multi-Family
2000
2001
2002
2009
2010
2011
2012
2013
2014
2003
2004
2005
2006
2007
2008
AnnualAverage
2000 - 2020
2000 - 2007
2008 - 2013
2014 - 2020
2015
2016
2017
2018
2019
2020
A2.2, Page 3 of 3

Current Single Town- Condo-
Location Builder/Developer Status(3) Total Family Duplex homes miniums Apartments
FAYETTE COUNTY --- --- --- 78 78 --- --- --- ---
ConnersvilleWoodside Village S Co Road 200 E and Magnolia Drive Vista East Residential Properties FP 41 41 --- --- --- ---Riverbend Estates South IN-1 and East Veterans Memorial Southern Cross Development INF 29 29 --- --- --- ---Ridgewood Estates Glenco Avenue Wilmore Farms UC 8 8 --- --- --- ---
HENRY COUNTY --- --- --- 112 28 --- 84 --- ---
KnightstownRiver's Edge 345 North Adams Joe Peacock INF 22 22 --- --- --- ---
New CastleTBD SW corner of County Rd 75 N and North Main St NA PP 6 6 --- --- --- ---TBD Emerson Avenue, near the YMCA NA PP 84 --- --- 84 --- ---
RANDOLPH COUNTY --- --- --- TBD TBD --- --- --- ---
Union CityTBD North Plum Street, south of IN-28 TBD CS TBD TBD --- --- --- ---
WinchesterWinchester Golf Club 985 South Simpson Drive TBD CS TBD TBD --- --- --- ---
RUSH COUNTY --- --- --- 24 --- --- --- --- 24
RushvilleRushville Villas-Phase II 701 West 16th Street KDC Properties CS 24 --- --- --- --- 24
UNION COUNTY None at this time --- ---
WAYNE COUNTY --- --- --- 63 20 --- --- --- 43
Cambridge City None at this time
Centerville None at this time
Fountain City None at this time
RichmondElder Beerman Building 724 East Main Street TBD-looking for developer CS 23 --- --- --- --- 23TBD (80.0 acre assemblage) South 37th Street, south of Backmeyer Road TBD CS TBD TBD TBD TBD TBD TBDChester Boulevard Townhouses 1907 Chester Boulevard Brian Ballenger/Whisenhunt Constr. PP 20 --- --- --- --- 20Sandbridge Hills-Section Four Southridge Drive KT Property Group, LLC PP 15 15 --- --- --- ---Ridenour Place Polver Way Ridenour Place, Inc. PP 5 5 --- --- --- ---
277 126 0 84 0 67
(1) As of June 2021.(2) Defined as Fayette, Henry, Randolph, Rush, Union, and Wayne counties, Indiana.(3) Status Key: Concept Stage (CS); Preliminary Plat Approval (PP); Final Plat Approval (FP); Approved (A); Infrastructure/Site Improvements (INF); Permits Issued/Homes Under Construction (UC); Selling or Leasing (S or L).(4) Total includes developments where product distribution has yet to be determined.
Source: Tracy Cross & Associates, Inc.
Total Potential Units (4) :
PLANNED RESIDENTIAL DEVELOPMENT: EASTERN INDIANA REGION (1:2)
Number of Units
Municipality /
Proposed Development Name
A2.3

GENERAL LIMITING CONDITIONS
Tracy Cross & Associates, Inc. has made extensive efforts to confirm theaccuracy and timeliness of the information contained in this study. Suchinformation was compiled from a variety of sources, including interviews withdevelopers and their agents, government officials, and other third parties.Although Tracy Cross & Associates, Inc. believes all information in this study iscorrect, it does not warrant the accuracy of such information and assumes noresponsibility for inaccuracies in the information provided by third parties.
Conclusions and recommendations established in this analysis represent aprofessional opinion and are based upon forecasts into the future which couldbe significantly altered by outside occurrences. These include, among others,the possible interplay of unforeseen social, economic, physical/environmental,and governmental actions. In this regard, Tracy Cross & Associates, Inc., itsowners, and its employees shall be held harmless of changes in conditions thatmay materially result from these occurrences.
TRACY CROSS & ASSOCIATES, INC.REAL ESTATE MARKET ANALYSIS1375 E. WOODFIELD ROAD, SUITE 520
SCHAUMBURG, IL 60173t 847.925.5400 f 847.925.5415
www.tcrossinc.com