Strategic Plan Metrics - Grant PUD
39
Powering our way of life. March 9, 2021 Strategic Plan Metrics 2020 Final Results
Transcript of Strategic Plan Metrics - Grant PUD

Powering our way of life.
March 9, 2021
Strategic Plan Metrics2020 Final Results

Objective 1 – Safety PerformanceZero Recordable Incident Rate
2020 Target 2020 0 2.1
• 13 Recordables Total 2020 • 5 Lost Time • 1 Restricted Duty• 7 Recordable Injury
• Four months without a recordable injury in 2020
Changing the Culture• 93% average Safety Meeting
attendance in 2020• 572 jobsite reviews conducted in 2020
2.9 3.43.1 2.9 3.0 3.0
2.72.4 2.1
0.00
0.50
1.00
1.50
2.00
2.50
3.00
3.50
4.00
Q42018
Q12019
Q22019
Q32019
Q42019
Q12020
Q22020
Q32020
Q42020
Recordable Injury Rate12-Month Rolling

Objective 2 – Design and Sustain an Engaging and Fulfilling Grant PUD Culture
Organizational Health Index2020 Target 2020
≥ 75 42
Employee Engagement Assessment
2020 Target 2020≥ 75 26
• Value shown is from 2019 survey results• Scored every two years, next cycle this year• Target is top quartile based on McKinsey’s Organizational Health Index
• 70% participation in our first year completing the Gallup Q12 Employee Engagement survey• Had enterprise-wide report-out in December• Sample size 503, margin of error 3%, confidence 99%• Target is 75th percentile rank, which is top quartile

Objective 2 – Design and Sustain an Engaging and Fulfilling Grant PUD CultureEducational Reimbursement
Target2020 Target Current Status
To Be Determined To Be Determined
Training Effectiveness Assessment
2020 Target 20204 out of 5 stars 4.45 stars
• New educational reimbursement policy for 2021• Roll out of method to measure outcomes of employees advancing their knowledge through education coming early next year
• Based on employee-reported training results

Objective 3 – Maintain a Strong Financial PositionElectric System Liquidity
2020 Target 2020≥ $105 MM $105.7 MM
• Represents sum of Electric System reserve and contingency fund
• Doesn’t include $68 MM of Liquid Working Capital
• Reduced after financial optimization258
193 189 209 205
109110 109
105.7
0
50
100
150
200
250
300
Q42018
Q12019
Q22019
Q32019
Q42019
Q12020
Q22020
Q32020
Q42020
Electric System Liquidity

Objective 3 – Maintain a Strong Financial PositionConsolidated Return
on Net Assets2020 Target 2020
≥ 4.0% 4.3%
• Increasing target, was ≥ 3.8% for 2019
4.3
3.3 3.5 3.7 4.0
3.0
2.2
3.2
4.3
0.00.51.01.52.02.53.03.54.04.55.0
Q42018
Q12019
Q22019
Q32019
Q42019
Q12020
Q22020
Q32020
Q42020
Consolidated Return on Net Assets (%)

Objective 3 – Maintain a Strong Financial PositionConsolidated
Debt to Plant Ratio2020 Target 2020
≤ 60% 55%
• Ratio declined after financial optimization in January and additional debt refunding in March
• Based on book value• Ratio based on estimated fair market
plant value is 36%
6260 59 59
58
52 5252
55
4547495153555759616365
Q42018
Q12019
Q22019
Q32019
Q42019
Q12020
Q22020
Q32020
Q42020
Consolidated Debt to Plant Ratio (%)

Objective 3 – Maintain a Strong Financial PositionAdjusted ConsolidatedDebt Service Coverage
2020 Target 2020≥ 1.8 x 2.4 x
• DSC has remained above 2.0 and stable since Q3 2019
2.12.0 1.9 2.1 2.2 2.2 2.0 2.2
2.4
0.0
0.5
1.0
1.5
2.0
2.5
3.0
Q42018
Q12019
Q22019
Q32019
Q42019
Q12020
Q22020
Q32020
Q42020
Consolidated Debt Service Coverage

Objective 4 – Provide Long Term Low RatesRetail Operating Ratio -
Adjusted2020 Target 2020
≤ 112% 101%
• Calculated as total retail expenditures divided by total retail revenue
109106 107
109 109108
110 110
101
90
95
100
105
110
115
Q42018
Q12019
Q22019
Q32019
Q42019
Q12020
Q22020
Q32020
Q42020
Retail Operating Ratio %
Objective 4 – Provide Long Term Low Rates
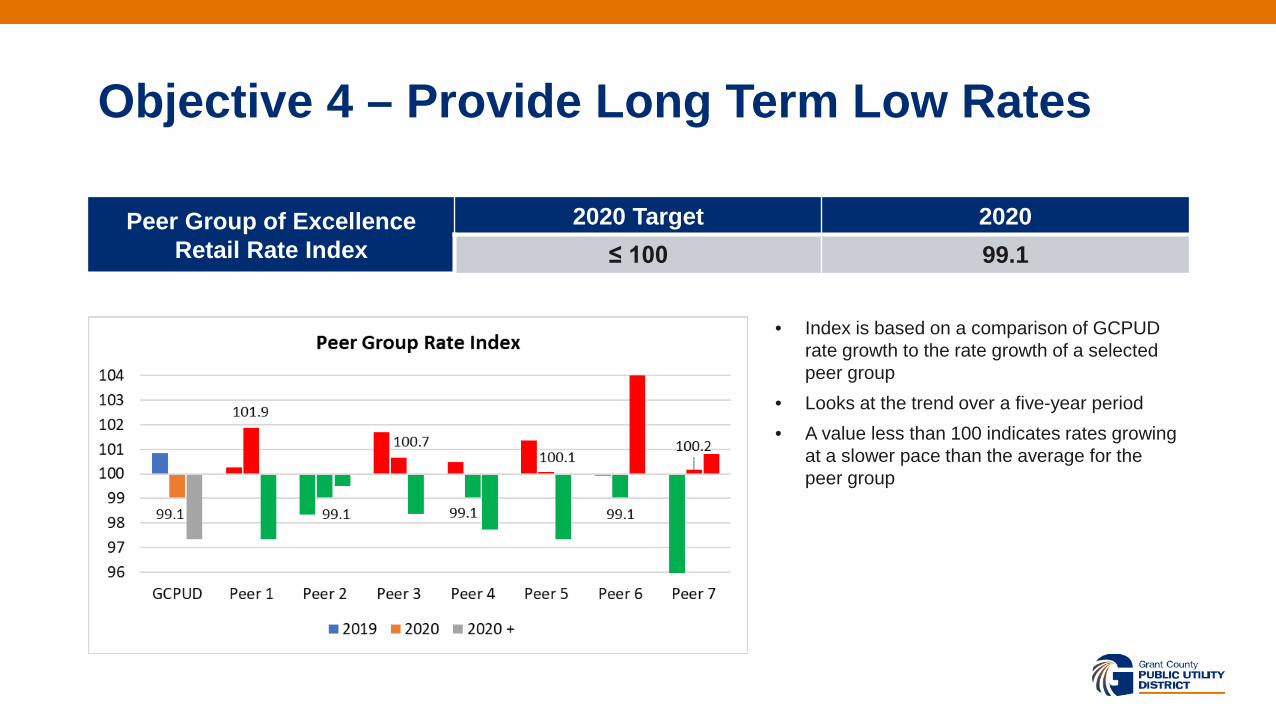
Peer Group of Excellence Retail Rate Index
2020 Target 2020≤ 100 99.1
• Index is based on a comparison of GCPUD rate growth to the rate growth of a selected peer group
• Looks at the trend over a five-year period• A value less than 100 indicates rates growing
at a slower pace than the average for the peer group

Objective 4 – Provide Long Term Low RatesDistrict Credit Rating
2020 Target 2020≥ Aa3 Aa3
System Moody’s S&P FitchElectric Aa3 AA+ AA
Outlook Stable Stable Stable
Effective Date
12/26/19 08/12/20 08/13/20
PRP Aa3 AA AAOutlook Stable Stable Stable
Effective Date
03/03/20 03/03/20 03/02/20
Items to our Favor: Ownership of competitive hydro generation, low rates, water and power price risks reduced by exchange contract, and favorable debt service coverage

Objective 5 – Outstanding Service to CustomersAverage System
Availability Index (ASAI)2020 Target 2020≥ 99.985% 99.981%
• Target is annual, but had monthly ASAI > 99.985% in Feb, Mar, Apr, Jun, Aug, Dec
-0.025-0.020-0.015-0.010-0.0050.0000.0050.0100.0150.020
Q42018
Q12019
Q22019
Q32019
Q42019
Q12020
Q22020
Q32020
Q42020
ASAI Compared to Target (%)

Objective 5 – Outstanding Service to CustomersCustomer Average
Interruption Index (CAIDI)2020 Target 2020< 110 min 141 min
• Target is annual average, but had monthly CAIDI < 110 minutes in Mar, May, Aug, Nov
-60-40-20
020406080
100120
Q42018
Q12019
Q22019
Q32019
Q42019
Q12020
Q22020
Q32020
Q42020
CAIDI Compared to Target (min)

Objective 5 – Outstanding Service to CustomersPRP Availability
2020 Target 2020Meet 12 of 12 Monthly Targets 8 of 12
-8
-6
-4
-2
0
2
4
6
8
Jan Feb Mar Apr May Jun Jul Aug Sep Oct Nov Dec
Project Availability Compared to Target (%)
-8-6-4-202468
Jan Feb Mar Apr May Jun Jul Aug Sep Oct Nov Dec
Wanapum vs. Target (%)
-8-6-4-202468
Jan Feb Mar Apr May Jun Jul Aug Sep Oct Nov Dec
Priest Rapids vs. Target (%)

Objective 6 – Operate Responsibly2020 Target 2020
Financial Statement Audit Performance Unmodified Audit Opinion 2019 Audit Unmodified Opinion
2020 Audit TBD Apr 2021
WA State Audit Office Compliance Audit No Audit Findings
Delayed at WSAO requestuntil Dec – Jan timeframewith report after Mar 2021
FERC / NERC / WECCCompliance Performance No Findings Findings *
FERC and Regulatory Filings No Late Filings No Late Filings
Environmental and Cultural No Issues No Issues
* Open Enforcement Actions are currently recognized, but not reported in this forum.

Objective 7 – Develop a Sustainable Broadband Network
Achieve Planned Capital Build2020 Target 2020
100% 141%
Average System Take Rate2020 Target 2020
≥ 60.0% 62.9%
• At $18.8M, expansion capital year to date spend is 141% of budget• At $6.3M, routine capital year to date spend is 141% of budget
Participation by CommunityCoulee City 39% Grand Coulee 63% Quincy 61%
Desert Aire 83% Mardon 54% Royal City 72%
Electric City 69% Mattawa 77% Soap Lake 60%
Ephrata 72% Moses Lake 62% George-Burke 55%
• Up from take rate of 57.5% at end of 2019• Added 3,458 new subscribers this year, for a total of 22,470. Added 2,583 potential subscribers, for a total of 35,732.

Strategic Objectives Strategic Plan Metrics 2020 Target 2020 Updates
Safety Zero Recordables Incident Rate 0 2.1 Monthly
Design and Sustain an Engaging and Fulfilling
Grant PUD Culture
Organizational Health Index ≥ 75 42 Annually
Employee Engagement Assessment ≥ 75 26 Annually
Educational Reimbursement Target TBD TBD Annually
Training Effectiveness Assessment ≥ 4 4.45 Quarterly
Maintain a Strong Financial Position
Electric System Liquidity ≥ $105 MM $105.7 MM Quarterly & Monthly
Consolidated Return on Net Assets ≥ 4.0% 4.3% Quarterly & Monthly
Consolidated Debt to Plant Ratio ≤ 60% 55% Quarterly & Monthly
Adjusted Debt Service Coverage ≥ 1.8 x 2.4 x Quarterly & Monthly
Provide Long TermLow Rates
Retail Operating Ratio ≤ 112% 101% Quarterly & Monthly
Peer Group Retail Rate Index ≤ 100 99.1 Annual
District Credit Rating ≥ Aa3 Aa3 Annual
Outstanding Service to Customers
Average System Availability Index ≥ 99.985% 99.981% Monthly
Customer Average Interruption Index < 110 min 141 min Monthly
PRP Availability 12 of 12 Monthly Targets 8 of 12 Monthly Targets Monthly
Operate Responsibly Operate Responsibly No FindingsNo Late Filings
FindingsNo Late Filings Monthly
Develop a Sustainable Broadband Network
Achieve Planned Capital Build 100% 141% Quarterly
Average System Take Rate ≥ 60.0% 62.9% Quarterly

Questions

Grant PUD Cultural Resources2020 Q4 Business Report
Grant PUD Commission Meeting – March 9, 2021

Department Purpose and Goal• The Cultural Resources department is tasked with ensuring
compliance with FERC-mandated regulatory requirements related to cultural resources. These include historic and prehistoric sites as well as Traditional Cultural Properties important to the Wanapum, Yakama and CCT people. A secondary goal is to help foster the relationship between the District and the Wanapum, all in alignment with Grant PUD’s safety, financial, and compliance goals.

Q4 Business Review• Regulatory Compliance
• Compliance Violations = 0
• NCRRP Reviews = 5
• FERC orders/notices = 0
• Summary/Listing of filings=2: -2020 HPMP Compliance Report -2020 Site Monitoring Report
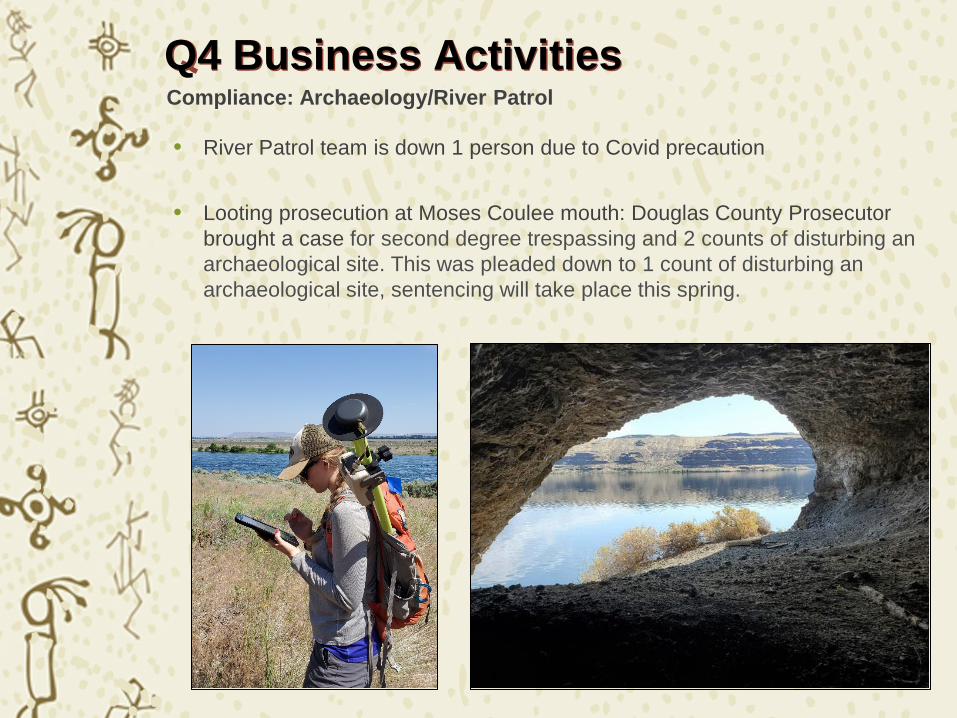
Q4 Business Activities
• River Patrol team is down 1 person due to Covid precaution
• Looting prosecution at Moses Coulee mouth: Douglas County Prosecutor brought a case for second degree trespassing and 2 counts of disturbing an archaeological site. This was pleaded down to 1 count of disturbing an archaeological site, sentencing will take place this spring.
Compliance: Archaeology/River Patrol

Q4 Business Review• Compliance: Traditional Program
• Archaeological, Historical and Traditional resources are treated equally under 36CFR800 (includes identification, development of monitoring program for each). TCP Studies are complete for the Yakama and CCT and are nearly complete for the Wanapum, however COVID has largely put this on hold.
• We’re initializing a contract to create a monitoring program for TCPs across the project. Ideally this will coincide with our archaeological monitoring.

Q4 Business ActivitiesTraditional Program: Wanapum Heritage Center
• Covid Issues:• Wanapum Heritage Center is Closed• Wanapum Discovery Unit is shutdown
• Major Efforts to meet ongoing goals• Developing Virtual Museum• Plant gathering to replace damaged mats and longhouse
frame.• Transcription of recordings from Wanapum Elders

Q4 Business Review• Major Projects: Archaeology • Major accomplishments were to meet annual
monitoring requirement: • Final 2020 archaeological monitoring report was
submitted to FERC on time; feedback is all positive.• Final 2020 compliance report was submitted on time and
has also received positive reviews.• YTC is undertaking erosion control at Hanson Creek: We
are contributing engineers drawing.

2020 Q4/2021/Q1 Forecast
• Use of Allocated Resources
Staffing –• No changes at this time.

2021 Forecast
Potential Management Challenges
• Continued discussions with stakeholders regarding mitigation of project-related adverse effects.
• BLM has interest in mitigation of long-term erosion at a site in the Wanapum pool
• Priest Rapids Right bank project will soon begin
• Wanapum to Mountainview T-line
• YTC River crossing
• Hanford Reach Erosion

2020 Q4/2021 Q1 Forecast
• Questions?

Powering our way of life.
Operate Responsibly by Attaining Environmental, Cultural Resource and Regulatory Compliance
Fish, Wildlife and Water Quality Business Unit
Grant PUD Commission Meeting March 9, 2020

Purpose & Goal The Fish and Wildlife Business Unit uses technology, innovation, strategic thinking, good stakeholder relations and skilled negotiations to ensure we are achieving compliance with our Natural Resources regulatory requirements in a safe, cost efficient and biologically sound manner while helping to maintain the long-term financial health of the District.

2021 Safety Culture ❖ One Recordable Incident;
❖ Job Site Briefs = 26 ❖ Job Site Reviews =6 (Currently at 23.1%)
❑ Goals = 10%; Stretch Goal = 15-20%
❖ Overall Safety Meeting Attendance = 100%
❖ Training Status Completion Rate = 98%
❖ Covid-19 Site Specific Work Plan Updates ❑ Juvenile white sturgeon testing & tagging❑ White Sturgeon Broodstock Collection❑ White Sturgeon Adult & Juvenile population assessment❑ Off Ladder Adult Fish Trap❑ Video Fish Counting❑ Vegetation Management❑ Fish Predator Control/USDA Angling❑ Fall Chinook Collection in Hanford Reach❑ Priest Rapids Hatchery Spawning/Monitoring & Evaluation

2021-2022 Compliance• Annual reports and plans with various agencies;
• Progress & Implementation Report (8 Combined)• Aquatic Invasive Species Control & Prevention• Bull Trout Report Annual Report• White Sturgeon Annual Report• Pacific Lamprey Annual Report• Aquatic Invasive Species (Plant Monitoring)• Wildlife Habitat Monitoring, Information & Education• Rare, Threatened and Endangered – 5-year Survey• Northern Wormwood Monitoring Annual Report• Bald Eagle Perching/Roosting Protection Plan• Native Resident Fish Annual Documentation • Fish Spill and Total Dissolved Gas Report• USFWS Annual Bull Trout Report• USFWS Annual – Special Use Permit• WDFW Scientific Collection Permit• Mitigation Site Reports (6 Annual Reports)
• Boundary Adjustment for Nason Creek Acclimation Facility (on Hold)

Projects Complete:Coulter Counter PurchaseEastbank Hatchery Modifications
Projects Cancelled:Carlton AF Intake Pool RestorationChief Joseph Hatchery Chiller
Projects Delayed: Saint Mary’s Acclimation Building
Video Fish CountingCarlton AF Heat InstallationPR LB Fish Attraction PumpTumwater Dam FishwayWells Hatchery Modernization
Projects in Progress:Carlton Acclimation Facility Production & Domestic Wells

2021 Challenges/Opportunities ➢ Maintaining day-to-day connection with staff and contractors.
➢ Building and maintain external stakeholder relationships.
➢ No-Net-Impact - Disputed language.
➢ Carlton Acclimation Facility domestic/production well.
➢ 10-Year Comprehensive Hatchery Monitoring & Evaluation Report.
➢ Preventive Maintenance Activities incorporated into Maximo (Carlton Acclimation Facility).
➢ Video Fish Count Program & System Upgrades.
➢ Hanford Reach Operation Plan Agreement (Operating Parties).
➢ Avian Predation – Maintaining Regional Focus.
➢ Nason Creek Acclimation Facility – Domestic well shutdown.
➢ Maintain existing programs to achieve compliance.
➢ Delayed invoicing/billing by contracting entities.

Powering our way of life.