STRATEGIC PLAN: 2018 - 2023 AUTOPAX PASSENGER...
37
Page 1 of 37 ` STRATEGIC PLAN: 2018 - 2023 AUTOPAX PASSENGER SERVICES (SOC) LTD
Transcript of STRATEGIC PLAN: 2018 - 2023 AUTOPAX PASSENGER...

Page 1 of 37
`
STRATEGIC PLAN: 2018 - 2023
AUTOPAX PASSENGER SERVICES
(SOC) LTD

Page 2 of 37
TABLE OF CONTENTS
1. INTRODUCTION 3
2. EXECUTIVE SUMMARY 3
3. BUSINESS OVERVIEW 6
4. AUTOPAX VISION, MISSION AND VALUES 8…
5. LEGISLATIVE AND REGULATORY FRAMEWORK 10
6. LEGAL AND OPERATING STRUCTURE 11
7. AUTOPAX OPERATING STRUCTURE 12
8. SITUATIONAL ANALYSIS 13
9. SWOT ANALYSIS. 15
10. RISK MANAGEMENT. 16
11. PILLARS GUIDING THE NEW AUTOPAX 2018-2023 18
12. KEY STRATEGIC LEVERS 19
13. PROGRAMME PERFORMANCE INDICATOR AND ANNUAL TARGET 2018/2022 24
14. BUDGET USSUMPTIONS 2017-2018. 25

Strategic Plan 2019/2023 Page 3 of 37
1. Introduction
Autopax Passenger Services (SOC) Ltd also known as Autopax is a wholly-owned subsidiary of Passenger
Rail Agency of South Africa (PRASA). Autopax exist to service the second primary mandate of PRASA
which is, provide in consultation with the Department of Transport, for long haul passenger rail and bus
services within, to and from the Republic in terms of the principles set out in section 4 of the National
Land Transport Act, 2009 (Act No. 5 of 2009).
The company derives its mandate from the shareholder’s compact. Based on the Shareholder’s
compact, Autopax is mandated to deliver quality and safe long distance bus passenger services in South
Africa with a view to grow the market share and expanding the business and thus creating shareholder
value.
2. Executive summary and background
Autopax has ambitions of assuming leadership in the long distance road passenger transport solutions.
The attainment of this ambition is centred on the company’s mission of providing a preferred,
sustainable, high quality, seamless and affordable road passenger transport services. This strategy is
necessitated by a number of business challenges that confronts the company today. In the process of
crafting a strategic plan that will return the company to a financially sustainable level, the leadership of
the business is confronted with the challenge of effectively managing the current business whilst
creating and implementing the future Autopax business based on this strategy.
The organisation finds itself in a distress state requiring, management and leadership with aptitude that
can catapult the business into new frontiers. The company is also confronted by a business unfavourable
organisational culture that permeates within its human capital that is compounded by the collapse in
employee morale and motivation. The company has overtime experienced a decline in corporate and
ethical culture, leading to collapse in corporate governance.
Due to major cash flow challenges to sustain the business, there is a high number of the bus fleet that is
off the road (parked due to mechanical breakdowns), the cash flow constraints has also contributed
hugely to poor fleet maintenance regime leading to unreliability of services.

Strategic Plan 2019/2023 Page 4 of 37
This has in the main resulted in unacceptable lower levels in passenger numbers, market share and
revenue collection. The external creditors’ book has increased to the level that threatens the continued
trading of the company. The Auditor-General South Africa has raised a finding of reckless trading during
the audit of the 2016/2017 financial year.
The lack of robust Information and Communication Technology (ICT) solutions which is a basic
requirement in any bus operations has also contributed to the multifaceted challenges that confronts
the business. These challenges include, but not limited to inadequate fleet management and
monitoring, poor revenue collection and protection systems and inadequate inventory and materials
management.
2.1. Why is the business in this state?
During the 2014/2015 financial year the company posted a profit of R7 920 829.00, however in the
following two years the company made losses. It is projected that the company will post loss of over
R300 000 00.00 at the end of the current financial year. It is clear that the challenges that the
company is currently experiencing today are a manifestation of what happened since 2015/2016
financial year.
Management has taken time to reflect on the above and concluded that the following are some of
key reasons the company has deteriorated over a period of time.
a. Lack of core technical expertise: The Company has overtime lost individuals with core technical
expertise, most of this positions have not being filled or replaced with right skills due to cash
flow challenges in the business. The business also has a number of employees in leadership,
management and at critical junior level functions without core technical skills. This challenge
permeate in a number of areas in the business including the collapse of the fleet maintenance
regime in the Technical Department. The high number of the fleet breakdowns points directly
towards lack of core technical skills in the business. This situation has been very prevalent in the
operations planning environment like bus scheduling and dispatching which is at the core of any
bus industry operations.

Strategic Plan 2019/2023 Page 5 of 37
b. Lack of management and leadership skills: Leaders and Managers in the business without
relevant experience in the bus industry has also impacted hugely on the challenges confronting
the business. This was clearly demonstrable when the company entered the commuter
operations which many commuter bus companies are able to run this business profitable, but
Autopax failed dismally in this regard. This was observed when the company deployed luxury
Mercedes Benz Translux buses in this operations instead of commuter friendly MAN Buses. The
fact that the company was not able to understand and diagnose that the Autopax products
(Tanslux and City-to-City) was in a decline stage in terms of the product life cycle is another clear
indication of ineptness in the management and leadership. The fact that the company did not
have robust plan to respond to new entrants in the long distance bus industry market is a sign of
lack of requisite management and leadership skills. When the company settled the Mercedes
Benz purchase, the management and leadership at the time was unable to ensure that the
instalment is then redirected towards Capital budget.
c. Lack of effective employee skills development: The Company has overtime invested less and
less in employee skills development and management & leadership development due to cash
flow constraints. This impacted a lot on the skills in the company across all levels of the
business. The company was previously accredited as a fleet repairer by various Original
Equipment Manufacturers, this accreditation has been lost. The issue of ineffective employee
skills development is also prevalent in all spheres of the business including Sales and Marketing.
d. Performance management: Over the years the company has failed to implement effective and
efficient performance management in the business. Consequence management has also
collapsed over a period of time. Managers and Leaders in the business are oblivious to multiple
misdemeanours by employees due to the fact that they are shy to engage in difficult discussions
with employees. This challenge also persist in the management of service providers. Most
service providers have realised this shortcomings within the business and are abusing this
situation. Service providers are not made to account in case of poor service delivery despite the
fact that the company will continue to pay for sub-standard services. The lack of effective
performance management has led to the collapse in the control and governance in the business.

Strategic Plan 2019/2023 Page 6 of 37
3. Business overview
The 2018 – 2022 strategy will begin to refocus the company towards a radical organic (Internal) growth
trajectory based on market development and market penetration. There is significant growth potential
on intercity and cross border market, diversified revenue streams need to be utilized to improve the
financial position of company focusing on Charter services and Rail Operations support. Several
operational efficiencies need to be employed to reduce the cost structure business and increase
revenue. The organizational structure must be realigned in order to achieve the strategic goals of the
business.
During the third quarter of the 2017/2018 financial year the Board of Directors of the company
approved a Turnaround plan for the business that is aimed at addressing the following key matters:
3.1. Decrease in fleet availability – Autopax is currently struggling to meet its daily operational
requirements as per the schedule. The business is still experiencing the impact of Commuter
operations on the mechanical health of the fleet, this was in the main due to the fact that the
business used the fleet that was not technical designed for commuter operations. More than half of
the total fleet is parked at the depot or with various service providers due to either mechanical
breakdowns or accidents. The reduction in fleet availability has direct detriment effect on revenue,
passengers and customer satisfaction.
3.2. Inadequate fleet maintenance regime – Due to cash flow challenges in the business the company is
unable to implement and execute an effective preventative fleet maintenance regime. The
inadequate preventative fleet maintenance regime has a negative impact on the durable lifespan of
the fleet as well reliability of the service.
3.3. Ineffective route and fleet optimisation – The Company continues to operate a service schedule
that assumes the original 100% (520 buses) fleet availability for the long distance operations. A
number of routes were subsequently cancelled due to lack of buses to operate all the scheduled
services. Again this, is as a result of the impact of the commuter operations on the mechanical
health of the fleet. The Commuter operations was prioritised over the long distance operations, this
impacted hugely on the route and fleet optimisation.

Strategic Plan 2019/2023 Page 7 of 37
3.4. Reduction in revenue and passenger number – Since the 2014/2015 financial year, the company
has been experiencing a decline in fare revenue coupled with increase in net losses. This is directly
attributable to the reduction experienced in passenger numbers due to reduced fleet available for
operational requirements. This position is further compounded by increase in cash pilferage in the
business.
3.5. Unsustainable cost structure – The Company has experienced a marked increase in the cost
structure of operating the business. The increase in the operational cost is as a result of reduced
revenue collection. Employee costs constituted 37% of Operational Expenditure as at the end of
2016/2017 financial year, this figure shot up to 42% during the 2017/2018 financial year. The other
operational costs that have increased in the last three financial years include fuel and general
operational costs.
3.6. Control environment – The Auditor General South Africa, Internal Audit and internal Risk
Management team has raised serious concerns about the collapse in the control environment within
business. This situation is compounded by the complete lack of consequence management in the
business, flagrant disregard of existing policies and procedures and in some cases absence of basic
operating procedures.
3.7. Lack of accountability – A number of key positions (Chief Executive Officer, Chief Finance Officer,
Company Secretary, Senior Manager: Fleet Maintenance) in the company are vacant or occupied by
employees in acting capacity. This has a negative impact on the business in terms of business
continuity and performance. There are a number of challenges in the company that are attributable
to the lack requisite skills and experience in certain key roles of the business. The lack of effective
and functional consequence management system within the leadership and management team is
evident in the current operations of the business. Operational efficiencies have been compromised
by the company’s inability of operate the scheduled services on time, this has negatively affected
safety and reliability of the services.

Strategic Plan 2019/2023 Page 8 of 37
3.8. Lack of necessary ICT systems – The Company operates without the necessary ICT systems to
support the business to carry out basic operational requirements. This contributes directly to
ineffective revenue collective and protection systems in the company as well as inability to
effectively management all key resources in the business including but not limited to fleet, fuel,
passengers and inventory.
4. Vision, Mission, Values and Leadership
4.1. Vision: The leader in road passenger transport solutions to the nation and SADC Region
4.2. Mission: We provide preferred, sustainable, high quality, seamless and affordable road passenger
transport services
4.3. Values: To align with the values of PRASA being:
Fairness and Integrity - Treating our customers and our colleagues the same as we would like to
be treated.
Service excellence - Provide the kind of service that ensures that our customer leaves with a
smile.
Performance driven - Developing the ability to venture into new breakthrough areas of
opportunity whilst offering quality products to our customers.
Safety - Ensuring our customers and colleagues enjoy their journey and arrive safely and
refreshed.
Communication - Sharing information with our customers and colleagues in an open and honest
way.
Teamwork - Working together with our customers to achieve a common goal and recognising
each other’s worth.

Strategic Plan 2019/2023 Page 9 of 37
4.4. Leadership
A true leader is not the one with the most followers, but it is the one who creates the most leaders.
The job of managers and supervisors at Autopax is to make it easier for their employees to serve
customers — both internal and external. Leading other people at Autopax is not a right, it is a privilege
and responsibility that must be continuously earned by serving and mentoring others to help them grow
by sharing information, providing respectful feedback and being accountable.
Autopax considers its leadership as conduits of its value system and has thus adopted an approach
towards transforming each leader into a “Servant Leader”. The approach towards servant leadership
emphasizes the serving of others as the leader’s number one priority, a holistic approach to work,
promoting a sense of community, and the sharing of power in decision making.
Complementary to the organizational values as detailed above, the following additional characteristics
or attributes will be actively cultivated in the leadership of team Autopax.
Listening: A critical communication tool, necessary for actively demonstrating respect for others.
Empathy: The ability to mentally project one’s own consciousness into that of another individual.
Healing: The servant leader recognizes the shared human desire to find wholeness in one’s self, and
support it in others.
Awareness: The ability to practice “intelligent opportunism” in a quest to maximized opportunities
for Autopax.
Persuasion: The effective servant-leader builds group consensus through ‘gentle but persistent
persuasion” and does not only rely on position as a source of power.
Conceptualization: The servant leader must conceive solutions to problems that do not currently
exist today (Scenario Planning).
Stewardship: Organizational stewards, or ‘trustees’ are concerned not only for the individual
followers within the company, but also the organization as a whole and its impact on and
relationship with all of society.
Commitment to the growth of people: A demonstrated appreciation and encouragement of others.
The secret of institution building is to be able to weld a team of such people by lifting them up to
grow taller than they would otherwise be.
Courageous: Having uncomfortable conversation and saying what needs to be said, communicating
openly when you don’t have all the answers and making a decision to move ahead.

Strategic Plan 2019/2023 Page 10 of 37
Perseverance: Ability to persevere even when the going is tough and the team morale is low.
Decisiveness: Ability to make quick decisions in a difficult or complicated situation.
5. Legislative and regulatory framework
The crafting of the Autopax Turnaround plan takes cognisance of the legislative environment with
specific reference to:
The National Land Transport Act (Act 5 of 2009).
Legal Succession Act of South African Transport Services (SATS) Act of 1989 as amended.
National Land Transport Transition Act (Act no. 22 of 2000).
Public Finance Management Act no. 1 of 1999
Companies Act no. 71 of 2008
Labour Relations Act no. 66 of 1995
Employment Equity Act no. 55 of 1998
Basic Conditions of Employment Act no. 75 of 1997

Strategic Plan 2019/2023 Page 11 of 37
6. Legal and operating structure
The PRASA legal operating structure comprises of the Board of Control, a Corporate Head Office
(PRASA), two divisions (PRASA Rail Operations and PRASA Corporate Real Estate Solutions) and two
subsidiaries (Autopax and Intersite).
Figure 1: PRASA Legal Structure
Name
Title
Name
Title
Division
PRASA Corporate Real
Estate Solutions
(PRASA CRES)
Subsidiary
Division
PRASA Rail Operations
Subsidiary
Name
Title
Mainline Passenger
Services
LUXRAIL
Division
PRASA Technical
Service delivery co-operation
Exploitation / Optimisation of asset base

Strategic Plan 2019/2023 Page 12 of 37
7. AUTOPAX OPERATING STRUCTURE
Company Secretary
Human Capital
Management Executive
Chief Financial
Officer
Chief Executive
Officer
Sales and Marketing
Executive
Long Distance
Senior Manager
Operations
Chief Operations
Officer
AUTOPAX PASSENGER SERVICES
SOC.LTD
Technical
Senior Manager
Protection
Services
ICT
Senior Manager
PRASA
Autopax Board
Internal Audit PRASA
Long Distance
Accidents and
Reporting
Inspectorate
Vehicle Reporting
CORE BUSINESS
Operations Long distance – charter, rail support
Technical Fleet maintenance – Certificate of fitness - licencing
Fleet refurbishment and recapitalisation
Safety and environment -protection services
SUPPORT FUNCTION
Sales and marketing –Communications
Finance – Supply Chain management Information Technology
Humana Capital management
CORPORATE GOVERNANCE
Company Secretariat –Risk –Governance –Legal –Compliance
Business Strategy –Business performance –business reporting (Office of the CEO)
Strategic Plan 2019/2023 Page 13 of 37
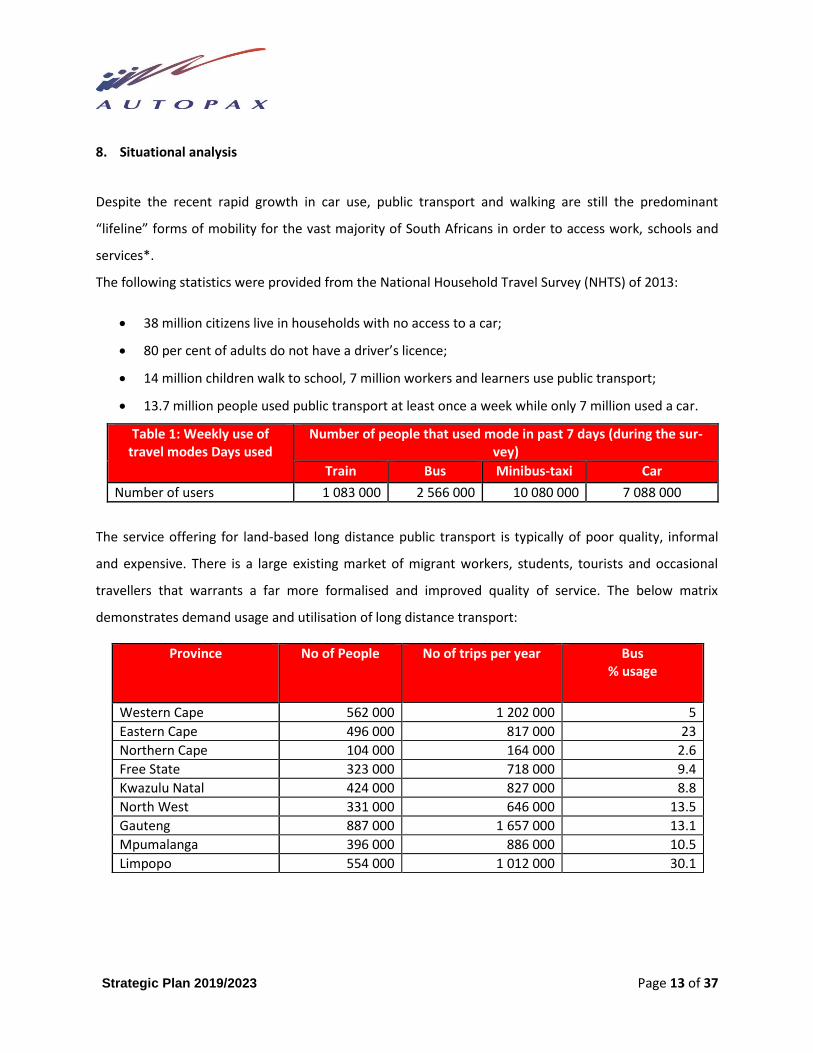
8. Situational analysis
Despite the recent rapid growth in car use, public transport and walking are still the predominant
“lifeline” forms of mobility for the vast majority of South Africans in order to access work, schools and
services*.
The following statistics were provided from the National Household Travel Survey (NHTS) of 2013:
38 million citizens live in households with no access to a car;
80 per cent of adults do not have a driver’s licence;
14 million children walk to school, 7 million workers and learners use public transport;
13.7 million people used public transport at least once a week while only 7 million used a car.
Table 1: Weekly use of travel modes Days used
Number of people that used mode in past 7 days (during the sur-vey)
Train Bus Minibus-taxi Car
Number of users 1 083 000 2 566 000 10 080 000 7 088 000
The service offering for land-based long distance public transport is typically of poor quality, informal
and expensive. There is a large existing market of migrant workers, students, tourists and occasional
travellers that warrants a far more formalised and improved quality of service. The below matrix
demonstrates demand usage and utilisation of long distance transport:
Province No of People No of trips per year Bus % usage
Western Cape 562 000 1 202 000 5
Eastern Cape 496 000 817 000 23
Northern Cape 104 000 164 000 2.6
Free State 323 000 718 000 9.4
Kwazulu Natal 424 000 827 000 8.8
North West 331 000 646 000 13.5
Gauteng 887 000 1 657 000 13.1
Mpumalanga 396 000 886 000 10.5
Limpopo 554 000 1 012 000 30.1

Strategic Plan 2019/2023 Page 14 of 37
High level overview of the performance of the business in the past five years is as follows:
In terms of the last market size estimation for long distance bus operations, it has been established that
Autopax has between 22% and 25% market share on the long distance bus market by number of buses.
Autopax has a total fleet of 518 buses. A comparative market share with other bus operators is available
monthly, however it might not serve the purpose to inform the strategic thrust for Autopax. Autopax
will in the beginning of the 2018/2019 financial year engage in a market share survey that will be led by
PRASA Group Strategy, Research and Development. This survey once completed will continue to drive
and guide Autopax growth strategy trajectory.
Strategic Plan 2019/2023 Page 15 of 37
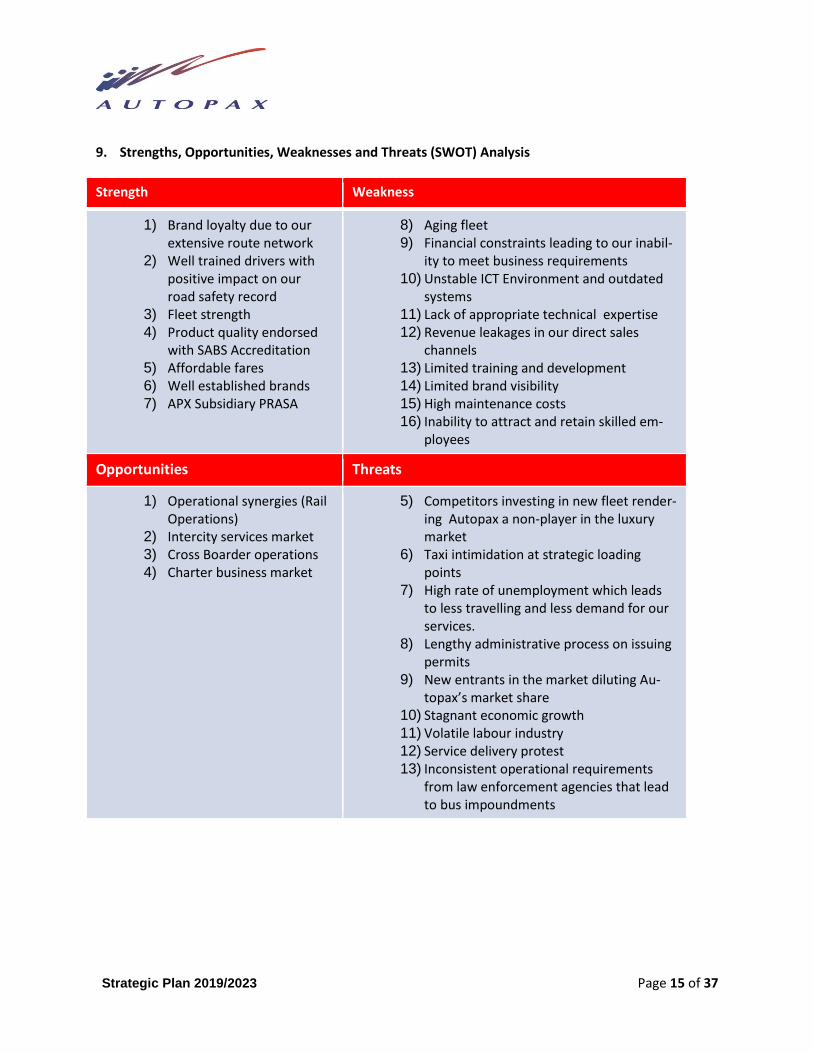
9. Strengths, Opportunities, Weaknesses and Threats (SWOT) Analysis
Strength Weakness
1) Brand loyalty due to our extensive route network
2) Well trained drivers with positive impact on our road safety record
3) Fleet strength 4) Product quality endorsed
with SABS Accreditation
5) Affordable fares 6) Well established brands 7) APX Subsidiary PRASA
8) Aging fleet 9) Financial constraints leading to our inabil-
ity to meet business requirements 10) Unstable ICT Environment and outdated
systems 11) Lack of appropriate technical expertise
12) Revenue leakages in our direct sales channels
13) Limited training and development 14) Limited brand visibility 15) High maintenance costs 16) Inability to attract and retain skilled em-
ployees
Opportunities Threats
1) Operational synergies (Rail Operations)
2) Intercity services market 3) Cross Boarder operations 4) Charter business market
5) Competitors investing in new fleet render-ing Autopax a non-player in the luxury market
6) Taxi intimidation at strategic loading points
7) High rate of unemployment which leads to less travelling and less demand for our services.
8) Lengthy administrative process on issuing permits
9) New entrants in the market diluting Au-topax’s market share
10) Stagnant economic growth
11) Volatile labour industry
12) Service delivery protest 13) Inconsistent operational requirements
from law enforcement agencies that lead to bus impoundments

Strategic Plan 2019/2023 Page 16 of 37
10. Risk Management
NO TURNAROUND FOCUS AREAS
RISK INHERENT RATING
STATUS MITIGATION RESIDUAL RATING
1. Financial Management Viability and Sustainability
Going Concern (Reckless trading)
Extreme risk Materialised Approval of turnaround plan by 31 October 2017 Low
2. Route Optimisation Inability to operate all routes High Risk Materialised Availability of funding by 15/11/17 to enable the requirement of the 270 fleet. Adopt a fluid route scheduling programme together with an optimum asset utilisation approach
Low
3. Asset Optimisation Inability to operate 270 buses by1/12/17 Inability to dispose of 249
High Risk High risk
Materialised Availability of funding by 15/11/17 to enable the requirement of the 270 fleet Approval for disposal by 31/10/17. Appointment of Auctioneers to facilitate the process.
Low
4. Cost Optimisation Unsustainable cost structure Delay and/or Non-approval of Sec.189 Non approval of waiving of annual increment 2018-2019 Delay and /or Non-approval of Divisionalisation
High Risk Materialised Approval for reduction in the staff complement by 325 heads(Effective 1/02/18) Approve to proceed with Sec.189 by 1/11/17 Approval for the waiving of the annual increment (2018-2019) by the 31/10/17 Approval of divisionalisation by the shareholder/NDoT by 30/11/17
Low
5. Control Optimisation Inability to fund control enhancement
High Risk Materialised Availability for funding by 30/11/17 Low
6. Procurement Optimisation Non-compliance to SCM policy High Risk Materialised Enforce demand management plans (2017-2019) by 1/11/17 Enforce SCM policy requirements via training and consequence management on non-compliance management issues All services procured must be preceded by a PR and PO process Effective contract management and reporting Appointment of experienced and reliable personnel to procurement committees
Low
7. Customer Service Declining customer service satisfaction levels
High Risk Materialised Improvement in service quality with focus on:
Improved departure times (Technological improvements)
Enroute monitoring and consequence management
Ensure that the fleet is cleaned as per scheduled rosters
Adherence to schedule via technological solutions (Funding required)
Prompt communication between Sale, Operations and Customers.
Low
TOP 10 STATEGIC RISK DASHBOARD AND MITIGATING ACTIONS

Strategic Plan 2019/2023 Page 17 of 37

Strategic Plan 2019/2023 Page 18 of 37
11. Pillars guiding the company’s 2018-2022 strategic thrust

Strategic Plan 2019/2023 Page 19 of 37
12. Key Strategic levers
# Strategic levers Key strategic focus area
1. Financial management, viability and sustainability
Route optimisation
Cost optimisation
Revenue Optimisation
Asset optimisation
2. Effective and Efficient Operations Asset optimisation
Revenue Optimisation
Cost optimisation
Control optimisation
Supply Chain optimisation
3. Execellent Customer service Customer centricity optimisation
Revenue optimisation
4. Performance excellence Control optimisation
Performance management
Cost optimisation

Strategic Plan 2019/2023 Page 20 of 37
12.1. Key strategic focus areas
a. Route optimization
The company has reviewed the current routes and the schedule with a view of identifying
profitable and non-profitable routes. This process has culminated in the reduction of future
routes to be serviced being reduced from 249 to 199. The identified routes will ensure that
Autopax is in a position to realise a minimum of 75% seat utilisation on each service off-peak
and 95% seat utilisation during peak. All identified non-profitable routes will be terminated
with immediate effect. The company will also implement measures to effectively combat
pilferage in the company at all level of operations.
It is management’s considered view that the implementation of the Route Optimisation will
lead the company to realise the desired financial management, viability and sustainability.
b. Revenue optimisation
The company is embarking on a radical organic growth strategy through market penetration and
market development. The main aim of pursuing this radical growth strategy will be to ensure
that the company increases its market share through improved and reliable bus service. The
market penetration strategy will have a high success rate given the passenger loyalty towards
both Brand Translux and City-to-City. On the other hand the market development growth
strategy will be realised through strengthening and resourcing the Autopax Charter Services,
complete support of Rail Operations and Cross Border Services. The Revenue optimisation will
focus on Revenue generation, Revenue collection and Revenue protection.
It is management’s considered view that the implementation of the Revenue optimisation will
lead the company to realise the desired financial management, viability and sustainability.
c. Asset optimisation
Through the process of defining what will Make Autopax Work, the strategic review has
determined that it is crucial that Autopax operate the maximum complement of fleet. The

Strategic Plan 2019/2023 Page 21 of 37
company will immediately embark on a process of identifying the fleet that can be operational
in a short space of time. The process will be supported by a robust fleet maintenance regime
that will ensure that all operational vehicles remain on the road all the times. Based on this
position Autopax will also ensure that there is adequate fleet to support Rail Operations,
strengthen Charter services and pursue the Cross Boarder market.
The implementation of the asset optimisation process will ensure that the company realises the
desired effective and efficient operations.
d. Cost optimisation
Management has engaged in a robust and detailed process of understanding the company’s
revenue generation potential and the cost of doing the business. This process was intended to
ensure that the company’s cost structure is proportionate to the revenue generation. Other
measures to realise this objective will include total moratorium on all external permanent
appointments, unless approved by the Chief Executive Officer. Through this process the
company will also review the impact of inter-company costs on the financial management,
viability and sustainability of Autopax. The fact that Autopax does not own the infrastructure
that it uses to operate its core business poses a challenge to the balance sheet of the company.
The implementation of this objective will ensure that the company realises the strategic lever of
financial management, viability and sustainability as well as effective and efficient
operations.
e. Control optimisation
Based on the harsh reviews by the Auditor-General South Africa and internal Risk Management,
the Business plan will also focus on reviewing and improving the control environment. This
process will focus on review of all business processes, policies and standard operating
procedures to ensure that the control environment is strengthened.

Strategic Plan 2019/2023 Page 22 of 37
Autopax like many of its competitors in the industry is operating in a highly technologically
advanced industry. To this end, the business plan will also focus on implementing the
Information and Communication Technology that supports the day-to-day operations of the
business. The company will also ensure that in the near future it explores the opportunities
offered by the world of Internet of Things (IoT) for improving efficacies in the operations of the
business including implementing measures that will differentiates the company from its
competitors in the eyes of the passenger. The objective of optimising the control environment
will also require entrenching the culture of consequence management in line with the Board
approved Performance Management policy.
This objective will ensure that the business realises the strategic lever of effective and efficient
operations and performance excellence.
f. Supply Chain optimisation
Due to the nature of its operations, Autopax requires a strengthened and fully functional
procurement capability. This will be supported by a business focused and aligned demand
management framework. The recently board approved Supply Chain Management policy will
implemented swiftly supported by line management capacity building programmes. The
company will place most emphasise on strategic sourcing and supplier development focusing
on Women, Youth enterprises and Cooperatives.
This objective will ensure that Autopax realises the strategic lever of effective and efficient
operations.
g. Performance management
Instilling a performance management based culture in the business is at the centre of the
company’s quest towards performance excellence. The Board has approved the company’s
policy on Performance Management. All employees on Management levels will be contracted
Strategic Plan 2019/2023 Page 23 of 37
on performance management. The company will also ensure consequence management in the
business to entrench the performance based culture.
This objective will ensure that Autopax realises the strategic lever of Performance excellence.
h. Customer centricity Optimisation
Autopax acknowledges that it is operating within a highly competitive environment. The
business plan will ensure that the company realise its full potential through passenger
confidence in the two brands. The company will also focus on reclaiming its apex position as a
dominant player in the industry. This objective will be realised through on-time departure
management, effective en-route monitoring with consequence management. The company will
ensure improved quality of service through focused customer service and provision of
passenger friendly clean fleet. The communication between the Operations and Sales
departments will be strengthened to ensure that passenger experience is improved. Customer
centricity will ensure that the company focuses on complete passenger satisfaction in terms of
Pre-trip (Point of Departure), On-Board and Post-trip. This will led to increase in market share
and improved customer satisfaction index.
It is management’s considered view that the implementation of the customer centricity will lead the company to realise the desired Excellent Customer Service.

Strategic Plan 2019/2023 Page 24 of 37
13. PROGRAMME PERFORMANCE INDICATORS AND ANNUAL TARGETS FOR 2019/2023
Asset Optimisation Revenue GenerationOperational Generated
RevenueR441 579 851
Increase revenue to R897 303 212 - R
991 756 182 by March 2019
Increase Revenue to R996 960 485 -
R1 1019 03 693 by March 2020
Increase Revenue to R1 098 162 498 - R
1 213 758 550 by March 2021
Increase Revenue to R1 205
303 941 - R 1 332 178 040 by
March 2022
Increase Revenue to R 1 323 158 713 -
R 1 462 438 577 by March 2023
0.16 liquidity ratio Improve Liquidity ratio 0.29Improve liquidity ratio to 0.47 to
0.52 by March 2019
Improve liquidity ratio to 0.95 to 1.05
by March 2020
Improve liquidity ratio to1.43 to 1.58
by March 2021
Improve liquidity ratio to 1.90
to 2.10 by March 20122
Improve liquidity ratio to 1.90 to 2.10
by March 20122
1.02 solvency ratio Improve Solvency ratio 0.52Improve solvency ratio to 1.23 to 1.36
by March 2019
Improve Solvency ratio to 0.95 to 1.05
by March 2020
Improve Solvency ratio to 0.95 to 1.05
by March 2020
Improve Solvency ratio to 0.95
to 1.05 by March 2020
Improve Solvency ratio to 0.95 to 1.05
by March 2020
Fleet Availability 39% 85% to 95% Fleet availability 85% to 95% Fleet availability 85% to 95% Fleet availability 85% to 95% Fleet availability 85% to 95% Fleet availability
Bus Servicing (On Time
service rate)34%
85% to 95% on time service rate by
March 2019
85% to 95% on time service rate by
March 2019
85% to 95% on time service rate by
March 2019
85% to 95% on time service
rate by March 2019
85% to 95% on time service rate by
March 2019
Breakdowns per 60 000
km 0.41 1 breakdowns per 60 000kms 1 breakdown per 60000kms 1 breakdown per 65000kms 1 breakdown per 65000kms 1 breakdown per 70000kms
Accidents per kilometres
travelled189 accidents
< 180 accidents per 51375959
ki lometres by March 2019
< 171 accidents per 52, 136, 955
kilometres by March 2020
< 162 accidents per 56, 136, 955
kilometres by March 2021
< 154 accidents per 62, 136,
955 kilometres by March 2022
< 146 accidents per 69, 136, 955
kilometres by March 2023
Fatalities per number of
passengers transported 1 fatalities
< 1 fata l i ties per 2,968,040
passengers by March 2019
<1 fatalities per 3,263,527
passengers by March 2020
1 fatalities per 3,410,000 passengers
by March 2021
0 fatalities per 3,751,000
passengers by March 2022
0 fatalities per 4,126,100 passengers
by March 2023
Injuries per number of
passengers transported
73 passengers
injuries
< 55 passengers injuries per
2,968,040 passengers by March 2019
< 52 passengers injuries per 3,263
527 passengers by March 2020
< 49 passengers injuries per
3,410,000 passengers by March 2021
< 47 passengers injuries per
3,751,000 passengers by March
2022
< 45 passengers injuries per 4,126,100
passengers by March 2023
ISO 9001 of 2015 and
SANS 10399 Waiting for Resuts
ISO 9001 of 2015 and SANS 10399
Certifications by March 2019
ISO 9001 of 2015 and SANS 10399
Certifications by March 2020
ISO 9001 of 2015 and SANS 10399
Certifications by March 2021
ISO 9001 of 2015 and SANS
10399 Certifications by March
2022
ISO 9001 of 2015 and SANS 10399
Certifications by March 2023
Fuel Consumption < 39.59Litres
/100km
37,05Litres /100km -40,95 Litres
/100km
37,05Litres /100km -40,95 Litres
/100km
37,05Litres /100km -40,95 Litres
/100km
37,05Litres /100km -40,95
Litres /100km
37,05Litres /100km -40,95 Litres
/100km
Audit Result Waiting for ResultsUnqualified Report for Financial and
Performance Information 2017/2018
Unqualified Report for Financial and
Performance information 2018/2019Clean Audit 2019/2020 Clean Audit 2020/2021 Clean Audit 2021/2022
Network Availability92% Network
uptime Availability
92% -95% Network Uptime
Availability
92% -95% Network Uptime
Availability 92% -95% Network Uptime Availability
92% -95% Network Uptime
Availability 92% -95% Network Uptime Availability
No funding
available (manual
Excel sheets)
Develop and Implement 2 Core
business Solutions by March 2019
Develop and Implement 1 Core
business Solutions by March 2020
Research and design approach for
Disaster Recovery Plan
Implement 100% Disaster
Recovery for following
applications (AFC, OPS, Call
Centre
Implement 100% Disaster Recovery for
SAP Finance, SCM, HCM
System went l ive in
May 2017 (phase 1)
Modernize the ticket platform by
March 2019
Integrate AFC(Automated fare
collection) with Ops, SCM, Finance
and HCM
Integrate AFC rest of the business
application 60% System Integration 100% System Integration
100% valid Contracts as per
contracts register by March 2019
100% valid Contracts as per
contracts register by March 2020
100% valid Contracts as per contracts
register by March 2021
100% valid Contracts as per
contracts register by March
2022
100% valid Contracts as per contracts
register by March 2023
Manage 100% Supplier Performance
for contract l isted on the contracts
register by March 2019
Manage 100% Supplier Performance
for contract l isted on the contracts
register by March 2020
Manage 100% Supplier Performance
for contract l isted on the contracts
register by March 2021
Manage 100% Supplier
Performance for contract l isted
on the contracts register by
March 2022
Manage 100% Supplier Performance for
contract l isted on the contracts register
by March 2023
Increased passengers/
patronage growth ( Long
Distance Operations)
1 479 413
2 819 638 - 3 116 442 passengers/
patronage on long distances routes
by March 2018
3 101 602 - 3 428 086 passenger
/patronage on long distance routes by
March 2020
3 411 762 - 3 770 895passenger/
patronage on long distance routes by
March 2021
3 752 938 - 4 147 984
passenger/ patronage on long
distance routes by March 2022
4 128 232 - 4 562 783 passenger/
patronage on long distance routes by
March 2023
On Time Departures from
Depature points64%
80% - 85% on time Departures by
March 2019
80% - 85% on time Departures by
March 2019
80% - 85% on time Departures by
March 2019
80% - 85% on time Departures
by March 2019
80% - 85% on time Departures by
March 2019
Reduced Passenger
Complaints on
passengers transported
0
<3% -5% Passenger Complaints on
passengers transported by March
2019
<3% -5% Passenger Complaints on
passengers transported by March
2019
<3% -5% Passenger Complaints on
passengers transported by March
2019
<3% -5% Passenger Complaints
on passengers transported by
March 2019
<3% -5% Passenger Complaints on
passengers transported by March 2019
Customer Satisfaction
Improved (Market
Survey)
Waiting for Results 69% - 79% Customer Satisfaction
rating for Autopax by March 2019
80% Customer Satisfaction rating for
Autopax by March 2020
85% Customer Satisfaction rating for
Autopax by March 2021
90% Customer Satisfaction
rating for Autopax by March
2022
90% Customer Satisfaction rating for
Autopax by March 2023
Performance
Management
Signed performance
contracts and
conclusion of
performance reviews for
management
34%100% Performance Reviews of all
(Management) staff by March 2019
100% Performance Reviews of all
(Management) staff by March 2020
100% Performance Reviews of all
(Management) staff by March 2021
100% Performance Reviews of
all (Management) staff by
March 2022
100% Performance Reviews of all
(Management) staff by March 2023
Training and
Development
Training plan for the
Business22%
Obtain 80% of identified training
needs by March 2019
Obtain 85% of identified training
needs by March 2020
Obtain 90% of identified training
needs by March 2021
Obtain 95% of identified
training needs by March 2022
Obtain 100% of identified training
needs by March 2023
Performance Targets 2019 - 2023
Control
Optimisation
Effective and Efficient
operations
Control Optimisation
Base
Asset Optimisation
Effective and
Functional ICT
systemsPreliminary system
design and
implementation of
business application
Robust Fleet
Maintenance
Programme
Passenger and Road
safety
2021/2022 2022/2023Performance Indicator
Performance Targets 2019 - 2023
2018/19STRATEGIC OBJECTIVE
Excellent Customer
Services
Customer centricity
optimisation Service Excellence
Performance ExcellentControl
Optimisation
2020/2021
Supply Chain
optimisation
Value for Money
through Smart and
Efficient Supply chain
Management(SCM)
Strategic Sourcing Contracts Register
Financial Management,
Viability and
Sustainability
Cost Optimisation
Strategic Priority
APX
Key Performance
Area 2019/2020
Strategic Plan 2019/2023 Page 25 of 37
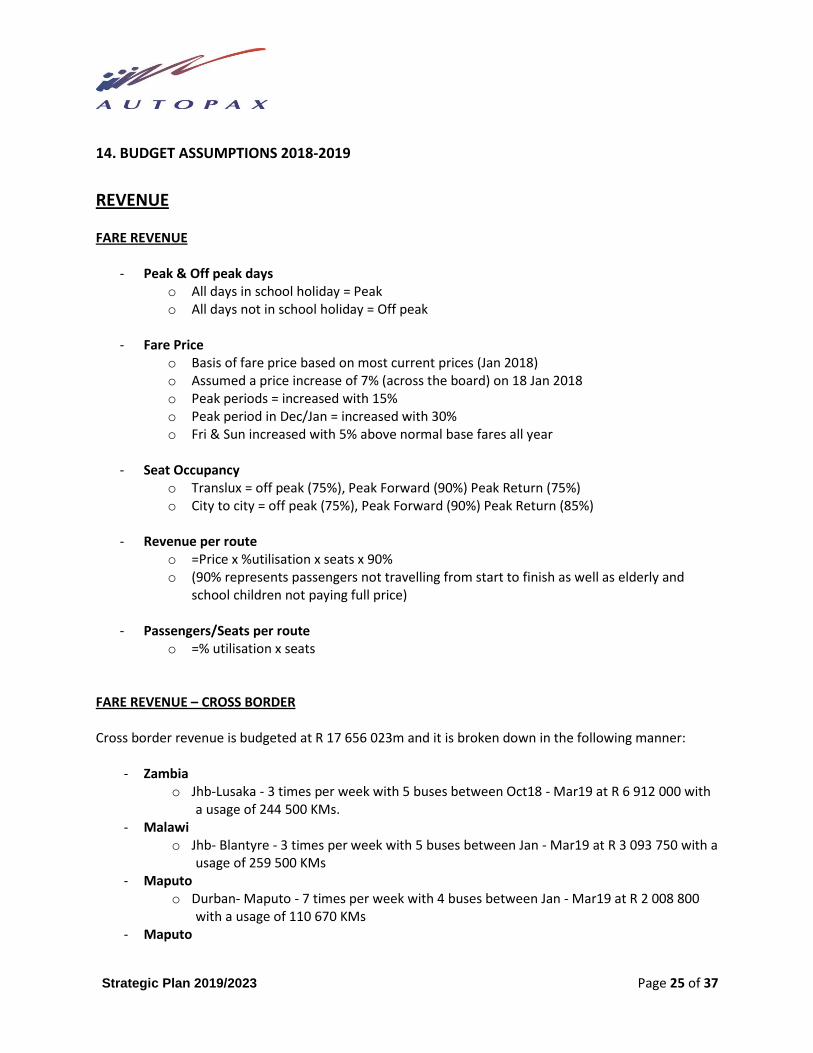
14. BUDGET ASSUMPTIONS 2018-2019
REVENUE FARE REVENUE
- Peak & Off peak days o All days in school holiday = Peak o All days not in school holiday = Off peak
- Fare Price
o Basis of fare price based on most current prices (Jan 2018) o Assumed a price increase of 7% (across the board) on 18 Jan 2018 o Peak periods = increased with 15% o Peak period in Dec/Jan = increased with 30% o Fri & Sun increased with 5% above normal base fares all year
- Seat Occupancy
o Translux = off peak (75%), Peak Forward (90%) Peak Return (75%) o City to city = off peak (75%), Peak Forward (90%) Peak Return (85%)
- Revenue per route
o =Price x %utilisation x seats x 90% o (90% represents passengers not travelling from start to finish as well as elderly and
school children not paying full price)
- Passengers/Seats per route o =% utilisation x seats
FARE REVENUE – CROSS BORDER Cross border revenue is budgeted at R 17 656 023m and it is broken down in the following manner:
- Zambia o Jhb-Lusaka - 3 times per week with 5 buses between Oct18 - Mar19 at R 6 912 000 with
a usage of 244 500 KMs. - Malawi
o Jhb- Blantyre - 3 times per week with 5 buses between Jan - Mar19 at R 3 093 750 with a usage of 259 500 KMs
- Maputo o Durban- Maputo - 7 times per week with 4 buses between Jan - Mar19 at R 2 008 800
with a usage of 110 670 KMs - Maputo

Strategic Plan 2019/2023 Page 26 of 37
AUTOPAX BUDGET ASSUMPTIONS 2018-2019 CONTINUE
o Pry- Maputo Night - 7 times per week with 4 buses between Jan - Mar19 at R 2 008 800 with a usage of 107 880 KMs
- Swaziland o Jhb- Swaziland - 7 times per week with 4 buses between Jan - Mar19 at R 1 576 443 with
a usage of 73 284 KMs - Lesotho
o Jhb-Lesotho - 7 times per week with 4 buses between Jan - Mar19 at R 2 056 230 with a usage of 123 690 KMs
FARE REVENUE - LUGGAGE Budgeted at R 4 100 000 as follows:
Revenue Stream Projected Revenue
Cross Border Luggage ( 6 months) R 1 200 000
Intercity Luggage Revenue R 2 900 000
FARE REVENUE – CHARTER/SPECIAL HIRE Revenue was budgeted as follows:
Revenue No of busses
Existing Clients 20 000 000 Min 25 busses
Potential Clients 10 000 000 Min 10 Busses
30 000 000 Min 35 Busses
Increase conversion rate from below 10% to 80%. Buses will be used inter-changeable with rail as and when require FARE REVENUE – INTER-COMPANY Budgeted at R 70 856 260m and consist of Metrorail and Shosholoza Meyl. Own bus revenue based on R375/hr and R16.50/km on own trips for Prasa Rail from Apr 2016 to Sept 2016. Plus R25m on Revenue for Bus hire plus R25m on expenses for bus leasing. The budget was allocated as follow:
- R 43 740 080 m for Metrorail Western Cape. Total annual km’s budgeted = 660 000. - R 22 358 163 m for Metrorail KZN. Total annual km’s budgeted = 240 000. - R 1 192 911 m for Metrorail Gauteng. Total annual km’s budgeted = 18 000. - R 3 565 105 m for Shosholoza Meyl. Total annual km’s budgeted = 102 000.
Kilometres travelled with Autopax own buses only.
Strategic Plan 2019/2023 Page 27 of 37
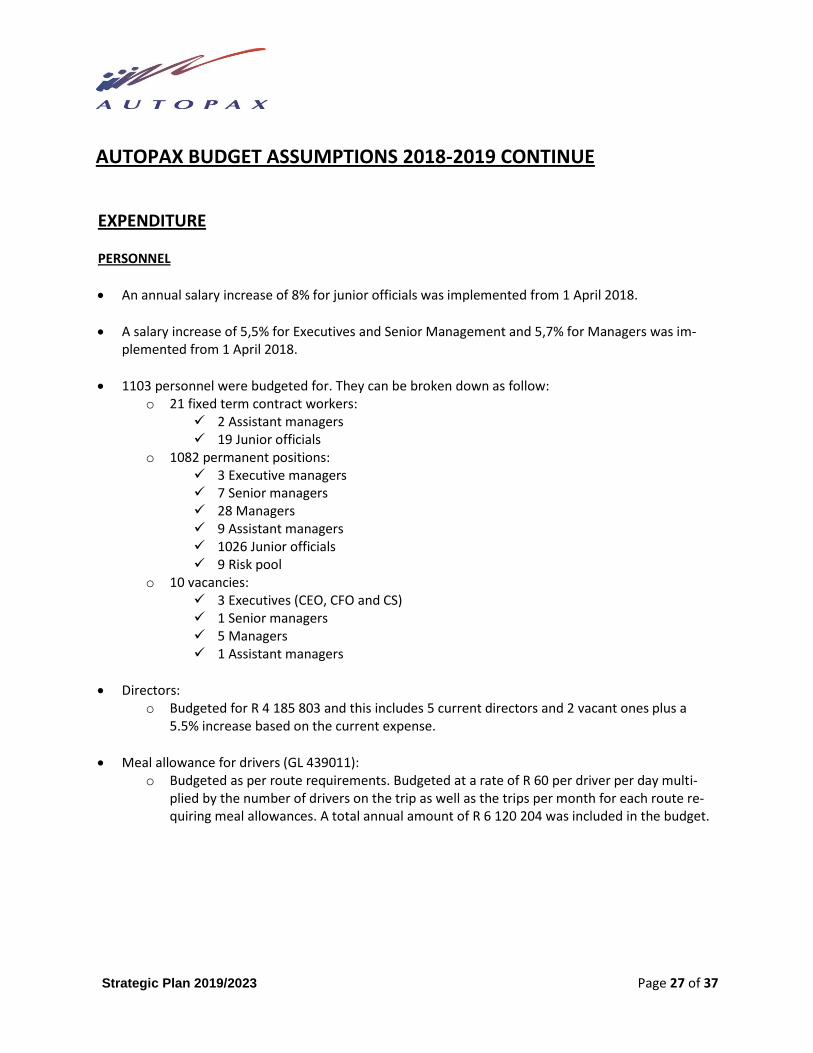
AUTOPAX BUDGET ASSUMPTIONS 2018-2019 CONTINUE
EXPENDITURE PERSONNEL
An annual salary increase of 8% for junior officials was implemented from 1 April 2018.
A salary increase of 5,5% for Executives and Senior Management and 5,7% for Managers was im-plemented from 1 April 2018.
1103 personnel were budgeted for. They can be broken down as follow: o 21 fixed term contract workers:
2 Assistant managers 19 Junior officials
o 1082 permanent positions: 3 Executive managers 7 Senior managers 28 Managers 9 Assistant managers 1026 Junior officials 9 Risk pool
o 10 vacancies: 3 Executives (CEO, CFO and CS) 1 Senior managers 5 Managers 1 Assistant managers
Directors: o Budgeted for R 4 185 803 and this includes 5 current directors and 2 vacant ones plus a
5.5% increase based on the current expense.
Meal allowance for drivers (GL 439011): o Budgeted as per route requirements. Budgeted at a rate of R 60 per driver per day multi-
plied by the number of drivers on the trip as well as the trips per month for each route re-quiring meal allowances. A total annual amount of R 6 120 204 was included in the budget.

Strategic Plan 2019/2023 Page 28 of 37
AUTOPAX BUDGET ASSUMPTIONS 2018-2019 CONTINUE TRAINING Training was budgeted at R 2.3m and can be broken down as follow:
Planned Intervention
Purpose Cost Comments
Artisan Training
Skills Development in line with the approved WSP
R 400 000.00 100 [email protected]/learner
Advance Coach Driver Training
Skills Development in line with the approved WSP
R 1 000 000.00
200 [email protected]/learner
Employee Bursary
Employee Skills development R 400 000.00 Estimated at R10 000.00 per annum for 40 employees
Other training Soft skills training (Customer Service, Office packages)
R 500 000.00 100 employees @R5000.00/leaner
CROSS BORDER EXPENSES
Commission paid - 10% of Fare revenue (GL800100). Commission calculated on 50% of sales as it is assumed that 50% sales will take place in SA and 50% cross border.
Driver accommodation - Assuming cost of R 700 per driver per trip. Utilising 2 drivers for each trip.
Driver meal allowance - Assuming cost of R 60 per driver per trip (current meal allowance). Utilising 2 drivers for each trip.
Toll fees - Assuming cost of R 750 per trip (including border entry).
Diesel o Zambia – Budgeted at 244 500 KMs and 110 025 Lts. Consumption of 45 litres per 100 km
(as bus will be pulling large trailer filled with luggage), bus takes 500L per tank. o Malawi – Budgeted at 129 750 KMs and 58 388 Lts. Consumption of 45 litres per 100 km (as
bus will be pulling large trailer filled with luggage), bus takes 500L per tank. o Mozambique – Budgeted at 218 550 KMs and 98 348 Lts. Consumption of 45 litres per 100
km (as bus will be pulling large trailer filled with luggage), bus takes 500L per tank. o Swaziland – Budgeted at 73 284 KMs and 32 978 Lts. Consumption of 45 litres per 100 km
(as bus will be pulling large trailer filled with luggage), bus takes 500L per tank. o Lesotho – Budgeted at 123 690 KMs and 55 661 Lts. Consumption of 45 litres per 100 km (as
bus will be pulling large trailer filled with luggage), bus takes 500L per tank. o The WSLP of Jan 2018 was used as base. Increased/decreased the price with the % fluctua-
tion in the forecasted oil price.

Strategic Plan 2019/2023 Page 29 of 37
Permits/cross border permit/Carbon tax to be paid at border o Zambia
R 300 000.00 - Assuming carbon tax of R 1000 per border entry (2 entries one way) R 210 000.00 - Assuming border entry of R 700 per border entry (2 entries one way) R 25 000.00 - 10 bus permits @ R 2500 per permit per annum
o Malawi R 450 000.00 - Assuming carbon tax of R 1000 per border entry (3 entries one way) R 157 500.00 - Assuming border entry of R 700 per border entry (3 entries one way) R 12 500.00 - 5 bus permits @ R 2500 per permit per annum
o Mozambique R 372 000.00 - Assuming carbon tax of R 1000 per border entry (1 entry one way) R 260 400.00 - Assuming border entry of R 700 per border entry (1 entry one way) R 20 000.00 - 8 bus permits @ R 2500 per permit per annum
o Swaziland R 186 000.00 - Assuming carbon tax of R 1000 per border entry (1 entry one way) R 130 200.00 - Assuming border entry of R 700 per border entry (1 entry one way) R 10 000.00 - 4 bus permits @ R 2500 per permit per annum
o Lesotho R 186 000.00 - Assuming carbon tax of R 1000 per border entry (1 entry one way) R 130 200.00 - Assuming border entry of R 700 per border entry (1 entry one way) R 10 000.00 - 4 bus permits @ R 2500 per permit per annum
MAINTENANCE The budget is based on the actual cost to maintain 415 expected to run at a total +/- 51m Km a year
including new cross-border routes as budgeted and agreed between operations and sales and marketing
departments. Material is price is expected to increase by 6%
Preventive Maintenance
o Bus Servicing Schedule (22 500Km Multi-grade). Since the servicing schedule is reduced to 22 500km,
a 10 000km ATI’s for all Polokwane operated buses.
o A backlog of over +/- 60 000km kilometres overdue the official service schedule.
o Backlog catch up is catered in the April and May 2018/19 services plan.
o COF preparation (Maintenance material) if we have our vehicles being maintained properly there will
be no need to waste time in preparing the bus be for it goes for COF.
o COF testing (testing fee)
The testing fee in the current financial year is R 1 125 on average p.a. (CT=R 760, PTA=R 1
120 and HRM=R 1 300) this price is not expected to increase since it’s been recently in-
creased.
o Breakdowns
All breakdowns within the 200Km radius will be attended by Autopax using the monthly
running repair material demand from the stock from the stores.

Strategic Plan 2019/2023 Page 30 of 37
AUTOPAX BUDGET ASSUMPTIONS 2018-2019 CONTINUE
All breakdowns more than 200Km radius will be done by the external breakdown supporting
suppliers
o Maintenance Campaigns (Mitigating breakdowns)
Air blockage “Air Leaks” (leading to vehicle not building air) that requires refurbishment of
the air system (two coils, two straight, u-shape and a flex pipe, 4-way protection valve,
complete air dryer, air compressor kit).
Engine Overheating (leading to engine knocks)
Thermostats, viscos fan (replacement or resetting), jockey pulley bearings and v-belts. 10%
of the projected breakdown cost +/- R1.8m over six months.
Components Change outs and overhauls
o Major Components Change outs/Overhaul (Engine, Gearboxes, Differentials)
There has been no maintenance plan for major components instead these components have been
running to failure. Our breakdowns and outwork history reflects that 98 Engine, 50 gearboxes and
102 diffs failed in the past financial years from 2010 as a result we are looking at overhauling 317
engines, 365 gear boxes and 313 diffs in alternate months.
o Minor Components change outs/ overhaul
This will go according to a maintenance plan of 6 month check and change.
Tyre Maintenance and Management
o The budgeted mileage for the next financial year based on OPS planning is +/- 51m Km, resulting to
an average of 4.3m km per month. In the previous financial year the CPK was 37 cents, assuming an
increase of 21% based on the suppliers recent quotes this will results into a CPK of 45 cents.
Body Shop maintenance
o Bus windows Replacement
During the past financial year window replacements have been +/- 650 units, the next financial year
we expect the costs to increase as the running fleet is also expected to increase from +/- 150 to 415
vehicles.
Body Refurbishment programme
o Based on body dents and scratches, minor and major accidents we have done 31 major accidents in-
terior and exterior and 140 body repairs in the last 4 years. As a result, we look at conducting 244 full
body refurb interior and exterior at about +/- R250 000 per bus that will be reflected in our capital
budget.
Workshop Equipment maintenance
o Main air compressors (Servicing & Running repair)
As per the OEM maintenance plan these compressors should be serviced at 2500 hours or once a
year. One minor R5500 and one major at R25000.

Strategic Plan 2019/2023 Page 31 of 37
AUTOPAX BUDGET ASSUMPTIONS 2018-2019 CONTINUE
o Brake Testing Machines (Calibrations & Running repairs)
As per legislation requirements, the brake testing machines should be calibrated every 6 months at
R15 000.
o Stand-by generators (Servicing & running repair)
As per the OEM maintenance plan the generators should be serviced at 600 hours or once a year.
o Oil-water separator plant maintenance (Removal of sludge)
As per the Environmental regulation there is a need to have and maintain an oil-water separator
plant. To comply with the requirement, the sludge removal will be done quarterly at R3000 from the
previous experience.
o Workshop lifting equipment (testing & repair)
As per legislation requirement for lifting equipment, the workshop lifting equipment must be tested
every 12 months with inspections every 3 months at R7000.00 from the past history.
ENERGY / DIESEL - Diesel was calculated based on the estimated whole sale list price (WSLP) of R 11.95 from April
2018 to R11.27 in March 2019. A base price of R 12.74 (WSLP in Jan 2018) was used and in-creased/decreased based on the oil price forecast for the period.
- Consumption was based on 39 litres per 100 km for all vehicles, therefore 0.39 litres per km. - Diesel calculation:
o The WSLP was multiplied by consumption (0.39) and total km’s for each budgeted route and multiplied by the number of budgeted trips per month.
o Formula = WSLP x 0.39 x km’s for trip x number of trips budgeted per month.
- It was assumed that the bus will fill up at the depart depot as soon as it leaves (assuming that it ar-rived with an empty fuel tank).
- For Metrorail, Shosholoza, the Prasa staff bus and charters the monthly average of the budgeted km’s were used for the calculation.
Strategic Plan 2019/2023 Page 32 of 37
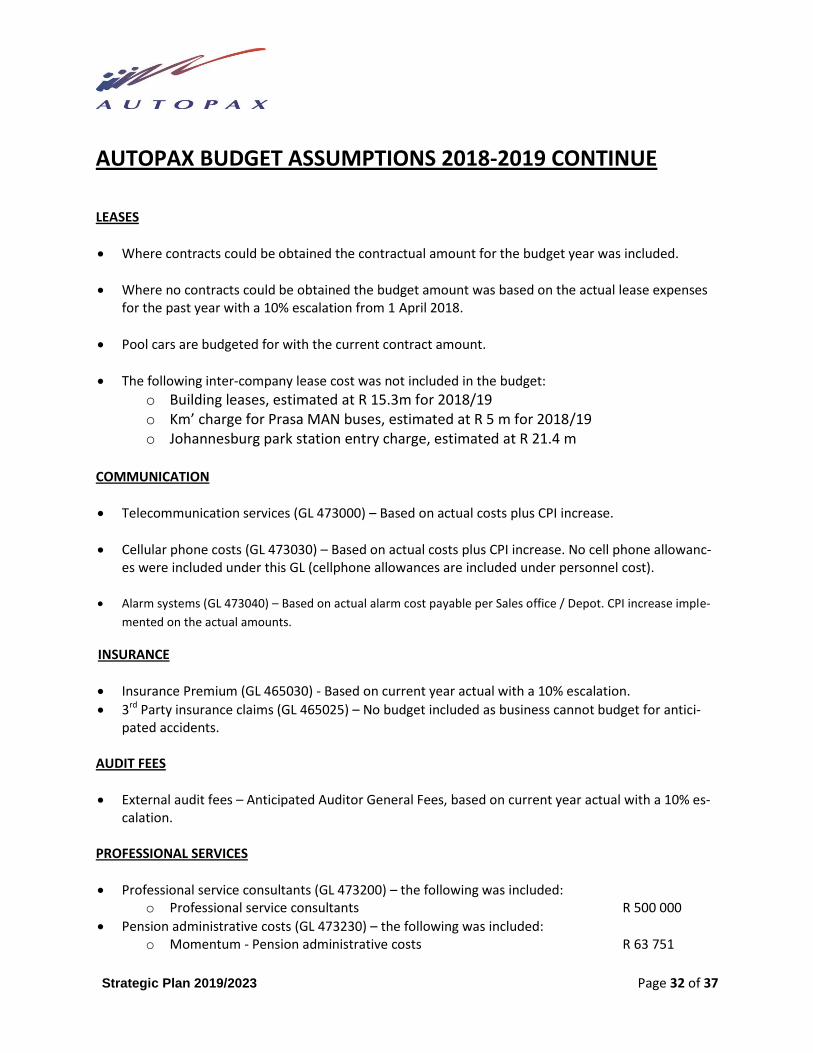
AUTOPAX BUDGET ASSUMPTIONS 2018-2019 CONTINUE LEASES
Where contracts could be obtained the contractual amount for the budget year was included.
Where no contracts could be obtained the budget amount was based on the actual lease expenses for the past year with a 10% escalation from 1 April 2018.
Pool cars are budgeted for with the current contract amount.
The following inter-company lease cost was not included in the budget:
o Building leases, estimated at R 15.3m for 2018/19 o Km’ charge for Prasa MAN buses, estimated at R 5 m for 2018/19 o Johannesburg park station entry charge, estimated at R 21.4 m
COMMUNICATION
Telecommunication services (GL 473000) – Based on actual costs plus CPI increase.
Cellular phone costs (GL 473030) – Based on actual costs plus CPI increase. No cell phone allowanc-es were included under this GL (cellphone allowances are included under personnel cost).
Alarm systems (GL 473040) – Based on actual alarm cost payable per Sales office / Depot. CPI increase imple-
mented on the actual amounts.
INSURANCE
Insurance Premium (GL 465030) - Based on current year actual with a 10% escalation.
3rd Party insurance claims (GL 465025) – No budget included as business cannot budget for antici-pated accidents.
AUDIT FEES
External audit fees – Anticipated Auditor General Fees, based on current year actual with a 10% es-calation.
PROFESSIONAL SERVICES
Professional service consultants (GL 473200) – the following was included: o Professional service consultants R 500 000
Pension administrative costs (GL 473230) – the following was included: o Momentum - Pension administrative costs R 63 751

Strategic Plan 2019/2023 Page 33 of 37
AUTOPAX BUDGET ASSUMPTIONS 2018-2019 CONTINUE
SECURITY
General security services (GL 477200) – based on an average for 9 months (Apr 17 – Dec 17) plus 5,7% CPI increase (As received from Prasa).
Cash in transit (GL 477205) – based on Dec 17 actuals plus 6,2% x 90% increase for Apr 18-Sept 18 and an increase of 5,8% x 90% for Oct 18-Mar 19 thereafter.
Inspectorate (GL 477210) – Budget based on actuals for Dec 17 plus 10% inflation increase. Inspec-tion was not budgeted for the first 2 quarters of the financial year as the market is non-responsive to tenders and internal resources will be utilised in this period.
HEALTH AND RISK
Consist of Health & Sanitation cost, Medical examination cost, cleaning of stations and offices, Fire extinguishing service, Accident Assistance and First aid kits.
Health and Sanitation (GL 466000) – includes Waste removal, bus and depot fumigation, oil water separator cleaning at wash bay as received from business units – annual amount of R 2 316 000.
Medical examination cost (GL 466005) – Budgeted at 400 employees per annum at R2000.00/employee – Annual amount of R 800 000.
Cleaning of offices (GL 466010) – as received from business units – annual amount of R 850 128.
Fire extinguishing services (GL 466015) – as received from business units – annual amount of R 220 751.
Accident Assistance (GL 466020) – as received from business units – annual amount of R 100 000.
Ex-gratia payments to the public (GL 466030) – the annual performance plan indicates 3 fatalities per 3 263 527 passengers by March 2019. Therefore budgeted for 3 fatalaties at R 25 000 per fatali-ty (adult rate).
First aid kits (GL 466040) – as received from business units – annual amount of R 27 500. TRAVEL AND ACCOMMODATION (MANAGEMENT)
Consists of Accommodation and meals, Car hire and flights – based on expected travel activities. o
Strategic Plan 2019/2023 Page 34 of 37
AUTOPAX BUDGET ASSUMPTIONS 2018-2019 CONTINUE
o Accommodation & meals: Amounts based on National Treasury Instruction 03 of
2016/2017): Maximum of R 1 400 per night per person. This rate include dinner, breakfast and parking.
o Car hire: Amounts based on Prasa guidelines: Group B Rate - R465 per day on super cover with 100km free per day.
o Flights: Amounts based on SAA rates as at 07 Aug 2017, the rates include VAT and Airport tax.
TRAVEL AND ACCOMMODATION (DRIVERS)
Budgeted as per route requirements. Budgeted on different rates per driver per night multiplied by the number of drivers and hostesses on the trip as well as the trips per month for each route requir-ing overnight accommodation. A total annual amount of R 20 445 524 was included in the budget.
OFFICE EXPENDITURE
Consist of postal services, stationery and office supplies and plant & garden maintenance. Budget based on actual requirements as received from business units. No CPI increase implemented on the budgeted amounts.
COMMISSION PAID (GL 479200)
% of Fare revenue (GL800100). Based on actual commission percentages of the past year.
PUBLICATIONS AND MARKETING
Advertising and publicity (GL 477005): o Marketing
Attract, increase and retain customers, brand building R 3 000 000 Brand Marketing
o HR Newspaper advertisements for vacant positions R 60 000
o Supply Chain Management Tender advertisements R 100 000
Books and subscription (GL 477010) o Finance
IFRS statements and Income tax act R 6 000 o Risk

Strategic Plan 2019/2023 Page 35 of 37
AUTOPAX BUDGET ASSUMPTIONS 2018-2019 CONTINUE
ISO compliance, Company registration and returns and Converting from
ISO9001:2008 to ISO9001:2015 R 124 040
Films and videos (GL 477020) o Marketing
On board entertainment R 1 000 000
Special promotions (GL 477040) o Marketing R 1 000 000
Trade shows, Charter promotions, channel promotions and in store promotions
Branding (GL 477050) o Marketing
Office and vehicle brand refreshing R 3 000 000 o Operations
Vehicle brand refreshing R 3 500 000 COMPUTER EXPENSES Consist of data network (GL 473015), computer maintenance (GL 451023), computer consumables (GL 472030) and software license fees (GL 473400).
Data network (GL 473015): o Telkom, Neotel and MTN data lines R 2 365 272
Computer maintenance (GL 451023) o Budgeted according to the below breakdown for R733 124
Description Purpose/Output
Business Connect – Call Centre System maintenance
Website revamp Website revamp
Brake testing machines System maintenance
Maintenance-Computer equipment Computer equipment maintenance
Software license fees (GL 473400): o Digicore /C-track R 1 764 558
Computer consumables (GL 472030): o Computer & Printing consumables - Printer cartridges R 636 800

Strategic Plan 2019/2023 Page 36 of 37
AUTOPAX BUDGET ASSUMPTIONS 2018-2019 CONTINUE
OTHER OPERATING COSTS
Wash & parking: o Bus cleaning as received from business units R 16 783 200
Toll fees: o Budgeted as per route requirements. Budget based on the specific rate for each toll Plaza
on the route multiplied by the number of trips per month for each route R 32 411 087
E-toll fees: o Budgeted as per route requirements. Budget based on the standard tariff for each e-toll
Plaza on the route multiplied by the number of trips per month for each route R 5 149 126
Vehicle/traffic fines were not budgeted for. FINANCE INCOME GL 804000 (Interest received – bank) - Utilise averages for April 2017 to Oct 2017 (with no increase)
R 1 420 608
FINANCE COST Interest paid to creditors were not budgeted for
CAPITAL SUBSIDY & GRANT AMORTISATION
Capital grant amortized R 52 775 980 DEPRECIATION
Based on expected future depreciation for current assets (SAP system calculated) R 65 253 298
Does not include depreciation on budgeted capital requirements.
Depreciation rates used as per Annual Financial Statement’s accounting policy.
HISTORIC DEBT
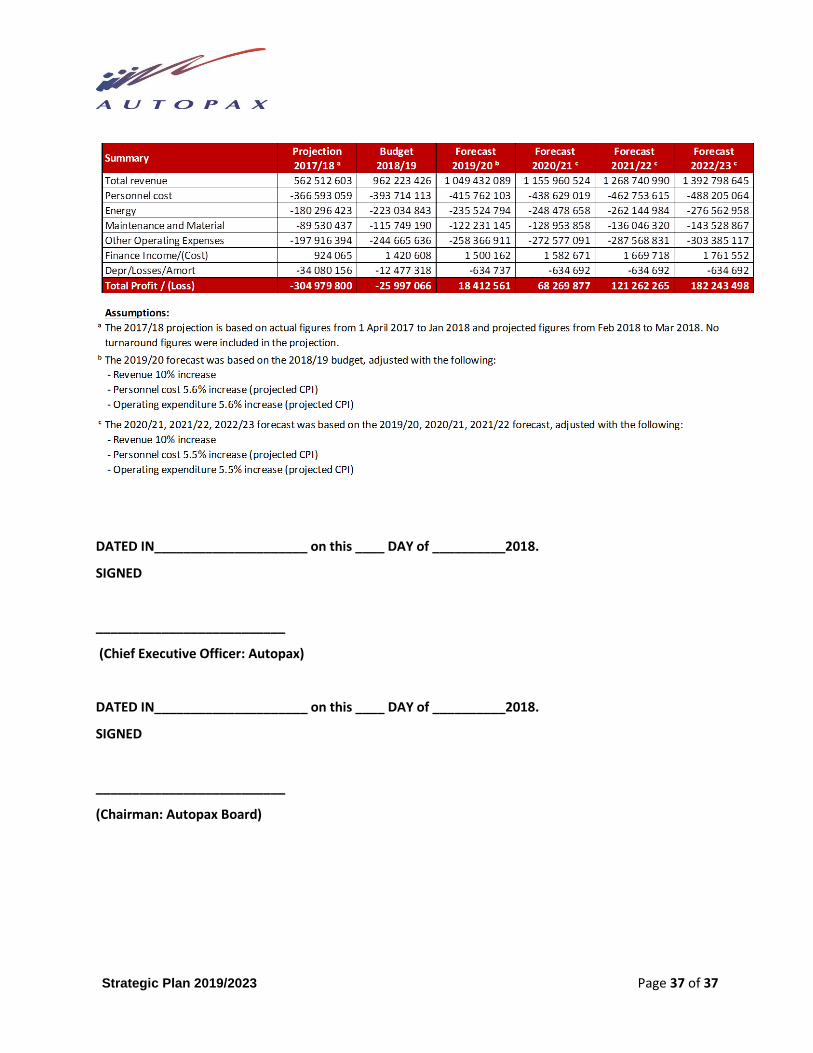
Based on the projected figures for the next 5 years (please refer to attachment C), the company will start to show profits in the 2019/2020 financial year. Therefore the settlement of historic debt will only start in 2019/2020 (Dec 2017 historic debt for external companies comes to R 148.6 m, based on the projected figures the company will only fully settle this amount by 2021/2022).
Strategic Plan 2019/2023 Page 37 of 37
DATED IN_____________________ on this ____ DAY of __________2018.
SIGNED
__________________________
(Chief Executive Officer: Autopax)
DATED IN_____________________ on this ____ DAY of __________2018.
SIGNED
__________________________
(Chairman: Autopax Board)


![[XLS]pmg-assets.s3-website-eu-west-1.amazonaws.compmg-assets.s3-website-eu-west-1.amazonaws.com/RNW3184... · Web view106879933.52 0 48116477.539999999 0 50048759.009999998 0 72170623.049999997](https://static.fdocuments.us/doc/165x107/5af7ae927f8b9a190c917535/xlspmg-assetss3-website-eu-west-1-view10687993352-0-48116477539999999-0-50048759009999998.jpg)