Strategic Outline Case Bath 28.03.2018 - bathnes.gov.uk · 6.1 Introduction ... 674726.BR.42.01...
139
Bath and North East Somerset Council Clean Air Plan: Strategic Outline Case Prepared for Bath and North East Somerset Council 28 March 2018
Transcript of Strategic Outline Case Bath 28.03.2018 - bathnes.gov.uk · 6.1 Introduction ... 674726.BR.42.01...
Bath and North East Somerset Council Clean Air Plan: Strategic Outline Case
Prepared for
Bath and North East Somerset Council
28 March 2018

III
Contents Section Page
Acronyms and Abbreviations ........................................................................................................ vii
Introduction ................................................................................................................................... 9 1.1 Overview of Study ......................................................................................................... 9 1.2 Purpose of This Report ................................................................................................. 9
1.2.1 Public Engagement ........................................................................................ 10
Strategic Case .............................................................................................................................. 11 2.1 Introduction ................................................................................................................ 11 2.2 Background and Strategic Context ............................................................................. 11 2.3 Consistency with Broader Transport Strategies ......................................................... 14
2.3.1 Background and Context ............................................................................... 14 2.3.2 Key Objectives of Transport Strategies .......................................................... 15 2.3.3 Consistency with Strategies ........................................................................... 17
2.4 Spending Objectives.................................................................................................... 18 2.5 Assessment of Existing Local Air Quality .................................................................... 18
2.5.1 Air Quality in Bath .......................................................................................... 18 2.5.2 Source Apportionment .................................................................................. 22
2.6 Benefits, Risks, Constraints and Dependencies .......................................................... 26 2.6.1 Benefits .......................................................................................................... 26 2.6.2 Risks ............................................................................................................... 27 2.6.3 Constraints ..................................................................................................... 29 2.6.4 Dependencies ................................................................................................ 29 2.6.5 Conclusions .................................................................................................... 30
Economic Case ............................................................................................................................. 31 3.1 Introduction ................................................................................................................ 31
3.1.1 Assessment Process ....................................................................................... 31 3.2 Long List of Measures ................................................................................................. 33
3.2.1 Overview ........................................................................................................ 33 3.2.2 Reference case ............................................................................................... 33 3.2.3 Justification for Consideration of Charging Measures ................................... 33 3.2.4 Non‐Charging Measures ................................................................................ 38 3.2.5 Charging Measures ........................................................................................ 41
3.3 Critical Success Factors and Evaluation Criteria ......................................................... 42 3.3.1 Primary Critical Success Factor ...................................................................... 42 3.3.2 Secondary Critical Success Factors ................................................................ 42 3.3.3 Evaluation Criteria ......................................................................................... 43
3.4 Primary Critical Success Factor Test ........................................................................... 44 3.4.1 Non‐charging Measures ................................................................................. 44 3.4.2 Charging Measures ........................................................................................ 46
3.5 Conceptual Packages .................................................................................................. 54 3.6 Assessment of Long List of Measures ......................................................................... 55
3.6.1 Non‐charging Measures ................................................................................. 55 3.6.2 Charging Measures ........................................................................................ 56 3.6.3 Way Forward .................................................................................................. 58
3.7 Shortlisted Options ..................................................................................................... 58 3.7.1 Option 1 – Benchmark option ........................................................................ 58 3.7.2 Option 2 – Small Class B charging option with complementary non‐charging
interventions .................................................................................................. 59

CONTENTS
IV
3.7.3 Option 3 – Small Class C charging option with complementary non‐charging interventions .................................................................................................. 59
3.7.4 Option 4 – Small Class D charging option with complementary non‐charging interventions .................................................................................................. 59
3.7.5 Proposed Amendments to Small Clean Air Zone ........................................... 60
Commercial Case .......................................................................................................................... 61 4.1 Introduction ................................................................................................................ 61 4.2 Possible Routes to Procurement ................................................................................ 61
4.2.1 Existing Council Frameworks ......................................................................... 62 4.2.2 OJEU Tendering .............................................................................................. 62 4.2.3 Tendering via Crown Commercial Services .................................................... 62
4.3 Division of Project Elements for Procurement ........................................................... 63 4.4 Summary of Proposed Procurement Approach .......................................................... 64 4.5 Attractiveness and Ability of Suppliers to Deliver ...................................................... 65
Financial Case .............................................................................................................................. 66 5.1 Financial Case Evaluation Approach ........................................................................... 66 5.2 Capital costs of shortlisted options ............................................................................ 66
5.2.1 Evaluation Criteria 10: Upfront capital required for scheme ........................ 66 5.3 Affordability ................................................................................................................ 67
5.3.1 Evaluation Criteria 9: Likelihood of CAZ charges revenue equating to implementation / operational costs .............................................................. 68
5.3.2 Funding sources ............................................................................................. 68 5.4 Next Steps ................................................................................................................... 69
Management Case ....................................................................................................................... 70 6.1 Introduction ................................................................................................................ 70 6.2 Management of Project .............................................................................................. 70 6.3 Financial Management ............................................................................................... 72
6.3.1 Financial Reporting ........................................................................................ 72 6.3.2 Change Control .............................................................................................. 72
6.4 Project Plan ................................................................................................................. 72 6.5 Monitoring and Evaluation ......................................................................................... 73
Summary of Shortlisted Options .................................................................................................. 74 7.1.1 Assessment of Shortlisted Options against CSF ............................................. 74
Annexes
Annex A Scoring Table for Non‐Charging Measures
Annex B Scoring Table for Charging Measures
Annex C Assessment of Timescales to Achieve Compliance for Charging Measures
Annex D Assessment of Charging Options Against Secondary CSFs
Annex E Logic Map
Table(s)
Table 2‐1: Summary of Objectives of Transport Strategies .................................................................. 16 Table 3‐1: Summary of Evaluation Criteria ........................................................................................... 43 Table 3‐2: Estimated timescales for design, procurement and installation of each scheme ............... 48 Table 3‐3: Scoring of Charging Measures against Evaluation Criteria .................................................. 57 Table 4‐1: Proposed Procurement Approach ....................................................................................... 64

CONTENTS
V
Table 5‐1: Summary of ANPR cameras required and approximate capital costs ................................. 67 Table 7‐1: Scoring of Shortlisted Options against Evaluation Criteria .................................................. 74
Figure(s)
Figure 2‐1 – Comparison of Annual Nitrogen Dioxide Concentrations Measured at Monitoring Sites in Bath and Estimated by the PCM Model ................................................................................................ 13 Figure 2‐2 – Annual mean NO2 concentrations across the Bath Urban Area in 2016 .......................... 20 Figure 2‐3 – Annual mean nitrogen dioxide concentrations in Bath at four monitoring sites with the highest concentrations in 2016 ............................................................................................................ 21 Figure 2‐4: ANPR survey locations ........................................................................................................ 24 Figure 2‐5 – Source apportionment of emissions within Bath (figures shown are %) ......................... 25 Figure 3‐1: Summary of Options Shortlisting Process .......................................................................... 32 Figure 3‐2: Census Journey to Work Mode Share: Live in Bath, work outside Bath ............................ 35 Figure 3‐3: Census Journey to Work Mode Share: Live in Bath, work in Bath City Centre ................... 35 Figure 3‐4: Census Journey to Work Mode Share: Live outside of Bath, work in Bath ........................ 36 Figure 3‐5: Historic Weekday Traffic Volumes in Bath, Source: Getting Around Bath Transport Strategy ................................................................................................................................................. 37 Figure 3‐6: Assessment of impact of 5% reduction in emissions .......................................................... 38 Figure 3‐7: Initial CAZ geographies ....................................................................................................... 41 Figure 3‐8: Summary of projected timescales to implementation for each CAZ option ...................... 47 Figure 3‐9: Number of Monitoring Sites Not Expected to Achieve Compliance with a Small CAZ ....... 49 Figure 3‐10: Number of Monitoring Sites Not Expected to Achieve Compliance with a Medium CAZ 50 Figure 3‐11: Number of Monitoring Sites Not Expected to Achieve Compliance with a Large CAZ ..... 50 Figure 3‐12: Maximum projected nitrogen dioxide concentration at any of the monitoring sites with a Small CAZ ............................................................................................................................................ 51 Figure 3‐13: Maximum projected nitrogen dioxide concentration at any of the monitoring sites with a Medium CAZ ....................................................................................................................................... 52 Figure 3‐14: Maximum projected nitrogen dioxide concentration at any of the monitoring sites with a Large CAZ ............................................................................................................................................ 52 Figure 3‐15: Proposed amendments to small Clean Air Zone .............................................................. 60 Figure 6‐1: Project Governance Structure ............................................................................................ 71 Figure 6‐2: Indicative project Plan ........................................................................................................ 73

DOCUMENT HISTORY
VI
Document history
674726.BR.42.01 Bath and North East Somerset Clean Air Plan: Strategic Outline Case
This document has been issued and amended as follows:
Version Date Description Created by Verified by Approved by
1 16/02/2018 Draft Chris Bushell, Clare Beattie, Karan Monga, Austin Cogan, Matt Langdon
Becky Lloyd
David Lear David Crockett
2 28/02/2018 Revised draft
Chris Bushell, Clare Beattie, Karan Monga, Austin Cogan, Matt Langdon
Becky Lloyd
David Lear David Crockett
3 07/03/2018 Revised draft
Chris Bushell, Clare Beattie, Karan Monga, Austin Cogan, Matt Langdon
Becky Lloyd
David Lear David Crockett
4 15/03/2018 Final Chris Bushell, Clare Beattie, Karan Monga, Austin Cogan, Matt Langdon
Becky Lloyd
David Lear David Crockett
5 19/03/2018 Final Chris Bushell, Clare Beattie, Karan Monga, Austin Cogan, Matt Langdon
Becky Lloyd
David Lear David Crockett
6 28/03/2018 Final Chris Bushell, Clare Beattie, Karan Monga, Austin Cogan, Matt Langdon
Becky Lloyd
David Lear David Crockett

VII
Acronyms and Abbreviations ANPR Automatic Number Plate Recognition
AQMA Air Quality Management Area
AQAP Air Quality Action Plan
AQO Air Quality Objective
B&NES Bath and North East Somerset Council
BCC Bristol City Council
CAZ Clean Air Zone
CSF Critical Success Factor
Defra Department for Environment, Food & Rural Affairs
DfT Department for Transport
EFT Emission Factor Toolkit
EU European Union
EV Electric Vehicle
FBC Full Business Case
GAB Getting Around Bath (Transport Strategy)
GBATS4M Greater Bristol Area Transport Study v4M
GVA Gross Value Added
HGV Heavy Goods Vehicle
IMD Indices of Multiple Deprivation
JAQU Joint Air Quality Unit
JLTP Joint Local Transport Plan
JTS Joint Transport Study
JSP Joint Spatial Plan
KRN Key Route Network
LEP Local Enterprise Partnership
LAQM Local Air Quality Management
LGV Light Goods Vehicle
NOx Nitrogen Oxides
NO2 Nitrogen Dioxide
NSC North Somerset Council
OBC Outline Business Case
PCM Pollution Climate Mapping
PHV Private Hire Vehicle

SECTION 1
VIII
PM Particulate Matter
PMP Placemaking Plan
RAG Red‐Amber‐Green
SOC Strategic Outline Case
SGC South Gloucestershire Council
WECA West of England Combined Authority
WPL Workplace Parking Levy

9
Introduction
1.1 Overview of Study
The UK has in place legislation passed down from the European Union, to ensure that certain standards of air quality are met, by setting Limit Values on the concentrations of specific air pollutants. In common with many EU member states, the EU limit value for annual mean nitrogen dioxide (NO2) is breached in the UK and there are on‐going breaches of the NO2 limit value in Bath. The UK government is taking steps to remedy this breach in as short a time as possible, with the aim of reducing the harmful impacts on public health. Within this objective, the government has published a UK Air Quality Plan and a Clean Air Zone Framework, both published in 2017. The latter document provides the expected approach for local authorities when implementing and operating a Clean Air Zone (CAZ).
Due to forecast air quality exceedances, Bath and North East Somerset Council has been directed by the Minister Therese Coffey (Defra) and Minister Jesse Norman (DfT) to produce a Clean Air Plan to achieve air quality improvements in the shortest possible time. In line with Government guidance, as part of the Plan, Bath and North East Somerset Council is considering implementation of a Clean Air Zone (CAZ), including both charging and non‐charging measures, in order to achieve sufficient improvement in air quality and public health. CH2M has been commissioned by Bath and North East Somerset Council (B&NES) to produce a Strategic Outline Case for the delivery of a package of measures which will bring about compliance with the Limit Value for annual mean NO2 in the shortest time possible in Bath.
The focus of this Clean Air Plan is on achieving air quality and public health improvements in the shortest time possible in accordance with the High Court Order in November 20161. In the legal case of Client Earth vs the UK Government, Mr Justice Garnham of the High Court found that ‘I reject any suggestion that the state can have any regard to cost in fixing the target date for compliance or in determining the route by which the compliance can be achieved where one route produces results quicker than another. In those respects, the determining consideration has to be the efficacy of the measure in question and not their cost. That, it seems to me, flows inevitably from the requirements in the Article to keep the exceedance period as short as possible”. Hence the assessment presented within this document focuses on achieving compliance in the shortest possible time, and will only consider cost when comparing between two equally quick packages of measures.
1.2 Purpose of This Report This report sets out the Strategic Outline Case for the Clean Air Plan, and a short list of packages of measures which will bring about compliance with the Limit Value for annual mean NO2 in the shortest time possible in Bath. It has been produced in line with the Inception, Evidence and Options Appraisal
packages of Guidance issued by the Joint Air Quality Unit (JAQU) in 2017, and the HM Treasury Green Book.
The report sets out a long list of options to improve air quality in Bath that were developed in conjunction with stakeholders as part of the Bath Air Quality Action Plan, the assessment of these options against a list of critical success factors, and the development of a short list of packages of measures to be taken forward for more detailed assessment.
1 November 2016 in R (ClientEarth) (NO2) V Secretary of State for Environment Food and Rural Affairs [2016] EWHC 2740 (Admin)

10
The remainder of this report is structured around the five cases, namely;
Strategic Case – sets out the case for change and the spending objectives of the Plan
Economic Case – develops a long list of options to achieve the spending objectives and appraises them against the defined critical success factors
Commercial Case – details the possible routes to procurement, supplier capability and likely delivery solution
Financial Case ‐ sets out the indicative costings for the Plan and available funding sources
Management Case – provides the governance and management arrangements to deliver a successful project
The Plan, and associated business case, will be further progressed within the Outline and Full Business Cases.
1.2.1 Public Engagement The introduction of a Bath Clean Air Plan will directly or indirectly affect a wide range of people, groups and organisations. Successful delivery will be influenced by: informing stakeholders of the proposals; obtaining their comments and inputs into the development process and decision making; generating support and addressing concerns; and keeping them informed of progress and outcomes.
There will be a significant number of affected and interested stakeholders, who will want to be informed about the Plan. To ensure technical information is available for consultation and engagement activities, and that results from these activities can feed into and inform the technical work, engagement activity will accompany the progression of the Clean Air Plan business case work and programme. Consequently, engagement activity will take place throughout 2018, include a range of engagement tools and methods to appeal to a variety of audiences.

11
Strategic Case
2.1 Introduction The purpose of the Strategic Case within this SOC is to set out the case for change by comparing the existing conditions, statutory and regulatory obligations and the desired goals of this intervention. In accordance with the Inception package of JAQUs guidance this Strategic Case considers the following;
An outline of the strategic context, in particular the national air quality plan for tackling roadside NO2, impact assessment and Clean Air Zone framework.
An overview of the local situation and how the proposal fits with existing local authority strategies.
A local air quality assessment including reference to health impacts
A determination of the spending objectives
Determination of the benefits, risks, constraints and dependencies related to address the identified issue.
Logic map or theory of change.
2.2 Background and Strategic Context Poor air quality is the largest known environmental risk to public health in the UK and investing in cleaner air and doing more to tackle air pollution are priorities for the UK government and for B&NES. However, action must be proportionate to the quantum of the air quality problem, with the health of local people at the heart of the measures implemented.
The EU and the UK Government have different requirements for air quality compliance and these are discussed below.
European requirements
The UK Government has an obligation to achieve European Air Quality Limit Values (Directive 2008/50/EC, Annex III). The most relevant are limits for nitrogen dioxide (NO2) and Particulate Matter smaller than 10 µm (PM10) which must not exceed 40 μg/m3 as an annual mean (i.e. measured over a calendar year). There are a number of requirements of the Directive, including that the Limit Value applies at locations which are accessible, including footpaths but excluding areas within 25m from major road junctions.
The Government assesses air quality compliance with the European Directive in 43 areas across the country at single locations, using both monitoring and modelling. It uses Defra’s Pollution Climate Mapping (PCM) model to forecast exceedances, which is adjusted based on the monitored data. This is the approved means of reporting air quality information to assess legal compliance with the European legislation.
In 2015, 37 of the 43 monitored areas across the country were in exceedance of the annual mean Limit Value for NO2. One of these 43 areas includes a monitoring station on London Road, Bath where the Government has forecast that exceedances will remain until 2021. As a result of this, B&NES Council has been directed to develop a Clean Air Plan to achieve compliance with the legal limit in the shortest possible time.

12
UK Government requirements
To meet UK Government regulations, local authorities must demonstrate that they are working towards the National Air Quality Objectives. The objective level for concentrations of NO2 and PM10 within the national legislation are the same as the European regulations (annual mean of 40 μg/m3), but are applied and assessed differently. Air Quality Objectives only apply where people are exposed for the averaging period of the objective (i.e. for a year) and therefore compliance with air quality objectives is assessed most commonly at building facades (where people are regularly present) including around busy major junctions.
The Government’s Local Air Quality Management (LAQM) regime requires all local authorities to regularly review and assess whether Air Quality Objectives (AQOs) have been achieved at relevant locations. Where the assessment shows exceedances at relevant locations, the authority must declare an Air Quality Management Area (AQMA), and prepare an action plan which identifies appropriate measures in pursuit of the Objectives.
The local monitoring data shows greater and more widespread exceedances than are indicated within the PCM model (for European regulations) in Bath, and our modelling shows that we expect compliance with both European and the UK’s regulation will be achieved by 2025, without measures in place. Annex C details the technical assessment undertaken to determine when compliance is anticipated to be met.
Figure 2‐1 shows the PCM modelled concentrations in Bath (required to meet European regulations), and the local monitoring data recorded by B&NES Council (required to meet UK Government regulations) as recorded in 2015/16.
How are the two requirements considered simultaneously?
The Government encourages the use of local data to provide a more detailed assessment of the specific local situation than is undertaken within the national PCM model. The assessment of measures as part of this Clean Air Plan need to take account of local evidence and understanding and provide robust evidence on the impact of measures, informed by local traffic and air quality models. The performance of the measures within this Clean Air Plan will be judged against both the European and the UK legal regulations as the measure of compliance. This will ensure that the measures identified will reduce air pollution and deliver improvements in public health.

13
Figure 2‐1 – Comparison of Annual Nitrogen Dioxide Concentrations Measured at Monitoring Sites in Bath and Estimated by the PCM Model

14
Following the publication of the UK Government’s latest air quality plan (July 2017), B&NES was directed to produce a Local Clean Air Plan to address the air quality Limit Value exceedances within Bath. The national plan sets out actions to reduce concentrations of NO2 to meet the Limit Values in the shortest time possible, while recognising that assessment by local authorities may reveal alternative approaches informed by specific local knowledge. The national plan identifies that for the majority of non‐complying zones, a network of Clean Air Zones is the most effective route to compliance of annual mean NO2 with legal limits. Defra’s vision for Clean Air Zones is: “Clean Air Zones improve the urban environment to support public health and the local economy, making cities more attractive places to live, work, do business and spend leisure time. They support cities to grow and transition to a low emission economy thus ensuring these benefits are sustainable for the long term.”
The Clean Air Zone Framework2 sets out the principles for the operation of Clean Air Zones in England. It provides the expected approach to be taken by local authorities when implementing and operating a Clean Air Zone. The need for a Clean Air Zone is to be determined by local feasibility studies aimed at understanding the extent of reduction in NO2 concentrations to achieve compliance in these zones.
2.3 Consistency with Broader Transport Strategies
2.3.1 Background and Context B&NES Council has published local policies and transport plans, as well as contributing to the development and delivery of wider plans for the West of England. As a result, it is necessary to assess how the various options considered to improve the air quality in Bath will align with and support the realisation of the strategic objectives within the policy documents.
B&NES Placemaking Plan (PMP) aims to guide development up until 2029 and ensure that any developments within this timeframe are high quality, sustainable, well located and supported by appropriate infrastructure. Under Policy PCS3 of the District PMP policy, developments will only be permitted if they meet certain air quality requirements, for example if situated within an Air Quality Management Area then the development should comply with the local air quality action plan. This policy aims to prevent new developments from exacerbating air quality issues in the area and ensures that air quality issues are fully considered.
The B&NES Getting Around Bath (GAB) Transport Strategy was adopted in November 2014 and makes provisions for the period up to 2029. GAB aims to ‘enhance Bath’s unique status by adopting measures that promote sustainable transport and reduce the intrusion of vehicles, particularly in the historic core. This will enable more economic activity and growth, while enhancing its special character and environment and improving the quality of life for local people’.
The B&NES Parking Strategy recognises the need to reduce the intrusion of vehicles into urban centres, reflecting concerns surrounding the impact of high numbers of vehicle movements on air quality. The Parking Strategy includes policies that will contribute to air quality improvements including standards for electric vehicles and car club bays in new developments, reduction in off‐street parking provision in the city centre and amendments to the charging strategy.
The B&NES Public Realm and Movement Strategy for Bath City Centre ‘is designed to give pedestrians, cyclists and public transport vehicles priority over cars, and deliver a network of beautiful, refashioned streets and public spaces’. The Strategy has the long term aim to transform Bath into a pedestrian friendly city, reducing vehicle movements and air pollution.
2 Clean Air Zone Framework for England (2017) https://www.gov.uk/government/uploads/system/uploads/attachment_data/file/612592/clean‐air‐zone‐framework.pdf

15
B&NES Council and the wider West of England local authorities are embarking on an ambitious programme of transport and planning policy reform underpinned by the emerging Joint Transport Study (JTS) and Joint Spatial Plan (JSP). At the time of writing, the West of England Combined Authority (WECA) is considering the contents of JTS and JSP in order to produce a future Vision and a final Joint Local Transport Plan for the West of England. WECA is working with B&NES in the development of these plans, to ensure consistency with the progress of this Plan.
The West of England was awarded £7m Go Ultra Low (GUL) Funding to spend over 5 years to encourage the wider use of low emission transport. The project, which is underway, will focus on increasing provision of public charging points, match funding business charge points and demonstrator cars, providing car club bays and converting 20% council fleets to ULEV. The Clean Air Plan will be developed with the GUL project in mind, to avoid inclusion of measures which are already funded and/or progressing.
It should also be noted in the context of this Strategic Outline Business Case, that Bristol, another key conurbation within the West of England is undertaking a similar study with the same objectives.
2.3.2 Key Objectives of Transport Strategies The key strategic themes and principles of the existing policies overlap with several of the critical success factors used in the economic assessment. The key objectives from the strategy documents set out in 2.3.1 are set out in Table 2‐1.

16
Table 2‐1: Summary of Objectives of Transport Strategies
Policy Objective
Economic Environmental Social Other
The District Placemaking Plan Encourage economic development, diversification and prosperity
Invest in our city, town and local centres
Pursue a low carbon and sustainable future in changing climate.
Protect and enhance the District’s natural, built and cultural heritage and provide green infrastructure
Meet housing needs
Plan for development that promotes health and well‐being
Deliver well connected places accessible by sustainable means of transport
Getting Around Bath: A Transport Strategy for Bath
Supporting and enabling economic growth, competitiveness and jobs
Improving air quality & health, reducing vehicle carbon emissions
Promoting sustainable mobility
Widening travel choice
Widening access to opportunities: jobs/learning/training
Improving the quality of life in the city
Safeguarding and enhancing the unique historic environment and World Heritage Site status
West of England Joint Transport Study
Support economic growth Reduce carbon emissions;
Improve quality of life and a healthy natural environment
Contribute to better safety, health & security;
Promote accessibility.
‘West of England Joint Spatial Plan: Towards the Emerging Spatial Strategy Document
To identify and meet the need for housing and accommodate the economic growth objectives of the LEP Strategic Economic Plan
To protect and enhance the sub‐region’s diverse and high quality environment and ensuring resilience including through protection against flood risk
To ensure that the JSP benefits all sections of our communities
To ensure a spatial strategy where new development is properly aligned with infrastructure
Parking Strategy To sustain and enhance the vitality and viability of settlements within B&NES… through parking policies which support the prosperity of the city and towns
Reduce traffic in the most congested areas and improving air quality
Manage total parking supply and manage travel demand in new developments
Public Realm and Movement Strategy for Bath City Centre
Contribute to a revitalised economy.
Redefine Bath as a healthy, ethical and sustainable city
Creating the canvas for public life and well being.
Enhance the potential of Bath as a place, to benefit visitors, businesses, and the community through enjoyment, health and wellbeing.
Improvement of public information and presentation of the city’s heritage.
To address traffic movement within and around the city centre of Bath. Working towards a walkable city and becoming the UK’s most pedestrian friendly city

17
Given the similarities between the objectives underpinning both the PMP, GAB, JTS and JSP, these objectives can be condensed into three broad themes of objectives as described below;
Economic: ‐ Improving transport economic efficiency, related to journey time, delay and reliability enhancements
‐ Safeguarding existing economic activity and promoting economic development to unlock new additional economic activity
Environmental: ‐ Reducing carbon dioxide and local air pollution emissions and coverage of West of England AQMAs
‐ Promoting mode shift to more sustainable modes of transport
Social: ‐ Promoting social inclusion, equality and affordability ‐ Enhancing quality of life and standards of public health
2.3.3 Consistency with Strategies The main objective of the packages of measures considered in this SOC is to improve air quality, and consequently public health, within Bath. Those packages which make the most significant improvements to air quality will demonstrate the most consistency with the environmental aims of the existing transport strategies, particularly those related to local air pollution. They will also produce the most significant improvement in public health.
Emissions are likely to reduce most in a Clean Air Plan which encompasses wider geographies and considers more vehicle classes, since this maximises the number of polluting trips affected and is likely to produce the greatest shift to more sustainable modes. Overall, alignment with the environmental theme of policy objectives is therefore greatest for options that cover a larger geography and encompass more types of vehicles.
There is potential for the measures identified within this Clean Air Plan to conflict with the parts of the environmental policy objectives aimed at reducing carbon. Promotion of sustainable travel will form a key part of the Clean Air Plan, however if a measure is chosen which encourages people/businesses to buy petrol vehicles rather than diesel, or increases vehicle kilometres, then carbon emissions may increase within the city. The impact of the selected measures on carbon emissions will be assessed (in detail in the Outline Business Case, to follow) and where possible steps will be taken to minimise any adverse impacts.
The Plan prioritises air quality improvements in accordance with the JAQU guidance and the ruling from the High Court Case3, and it is possible that consequently benefits or negative impacts to the economy may arise depending on the selected packages. It is desirable to select a Plan which achieves the environmental goals and has at least a neutral overall impact on the economy, and preferably a positive impact. There are two constituent elements influencing the overall economic performance of the Plan considered in this SOC; the impact of the options in terms of transport economic efficiency (reflecting a reduction in vehicle movements and journey times) and the impact on existing/new economic activity.
3 November 2016 in R (ClientEarth) (NO2) V Secretary of State for Environment Food and Rural Affairs [2016] EWHC 2740 (Admin).

18
Similarly, there are two constituent parts influencing the social theme of policy objectives; the impact on social inequality, particularly low income groups, and the impact on public health. To maximise the public health benefits the plan should aim to encompass as many trips as possible. However, the inclusion of a greater number of trips will increase the likelihood of negative impacts on low income groups. At this early stage, it is desirable to select a Plan which achieves public health benefits without creating a significant negative impact on vulnerable groups, including low income households.
The Plan is unlikely to have a major impact on Bath’s World Heritage Site status, although there could be impacts on the tourism trade. The Plan should take into account the city’s historic environment when considering the appropriateness of each measure and particularly how to deliver it. The scheme will be designed to ensure there is as little impact as possible on the attractiveness of Bath to tourists.
2.4 Spending Objectives A robust case for change requires a thorough understanding of what the project is seeking to achieve. This is defined, in accordance with DfT Green Book Supplementary Guidance4, by the spending objectives. The delivery of these objectives by proposed measures justifies the need for spending. Spending objectives should be SMART specific, measurable, achievable, relevant and time constrained.
The primary spending objective of the Plan, in accordance with JAQU Options Appraisal Guidance, is to deliver a scheme that leads to compliance with NO2 concentration Limit Values5 in the shortest possible time.
A secondary spending objective is also proposed; to deliver a scheme which leads to compliance with the LAQM air quality Objectives as set out in the Air Quality (England) Regulations (SI 2000/ 928 as amended). The difference between Limit Values and LAQM air quality Objectives are set out in Section 2.2 of this document. The packages of measures will be designed to meet both spending objectives, and any that are unable to will be rejected from the shortlist.
2.5 Assessment of Existing Local Air Quality
2.5.1 Air Quality in Bath Bath and North East Somerset Council (B&NES) has successfully implemented a number of measures to increase modal shift to public transport, cycling and walking. This has included, but is not limited to; expansion of the Park and Ride sites; public realm improvements to the High Street, Orange Grove, Upper Borough Walls/Stall Street and Seven Dials; extension of the inbound peak period bus lane on the A4 London Road from East Hayes to the A4/A46 Interchange at Lambridge; and Opening of the ‘Two Tunnels Greenway’ (with Sustrans), linking the Avon Valley cycleway with Midford and the rural area to the south of Bath. Other measures have also been implemented, aimed at reducing emissions per vehicle, for example through encouraging update of electric vehicles and the Low Carbon Bus Trial. However, air quality problems remain in Bath.
4 Public Sector Business Cases using the Five Case Model, DfT, 2015 https://www.gov.uk/government/publications/the‐green‐book‐appraisal‐and‐evaluation‐in‐central‐governent
5 The NO2 annual mean value may not exceed 40 micrograms per cubic metre (µg/m3) as defined in the air quality directive (2008/EC/50) and as reported in Air Pollution in the UK report.

19
B&NES declared an AQMA in 2002 for the annual mean NO2 objective which covers the main arterial routes and city centre roads. The designation of an AQMA does not require that a Clean Air Zone be put in place; but it does require the local authority to take action to reduce levels of pollution.
There are also two small AQMAs in B&NES at locations along Keynsham High Street and a small section of the A4 in Saltford. The breaches in these areas are not as significant as those within the AQMA in central Bath, and this feasibility study does not cover these areas. It should also be noted that new monitoring sites on A37 in Temple Cloud and Farrington Gurney have also shown exceedances of the NO2 annual mean objective and 2 further AQMAs will be declared at these locations following local consultation. New monitoring in Whitchurch also showed a possible exceedance on the A37, but monitoring is continuing before a decision is made.
Air quality monitoring in Bath is comprehensive and long standing. Bath’s monitoring network is focused on NO2, PM2.5 and PM10. The current air quality situation in Bath is presented in Figure 2‐2 showing concentrations of NO2 at locations within the city.
B&NES Council operates five automatic monitoring stations within its area, two of which are located on or close to London Road. The Council also operates a large number of diffusion tube sites across its area, with 53 of the sites being used in the analysis presented in this report. In 2018 a further 4 diffusion tubes were deployed in Bath, and some adjustments made to the locations of the existing tubes, to add to the evidence base on which this study is undertaken.

20
Figure 2‐2 – Annual mean NO2 concentrations across the Bath Urban Area in 2016
21
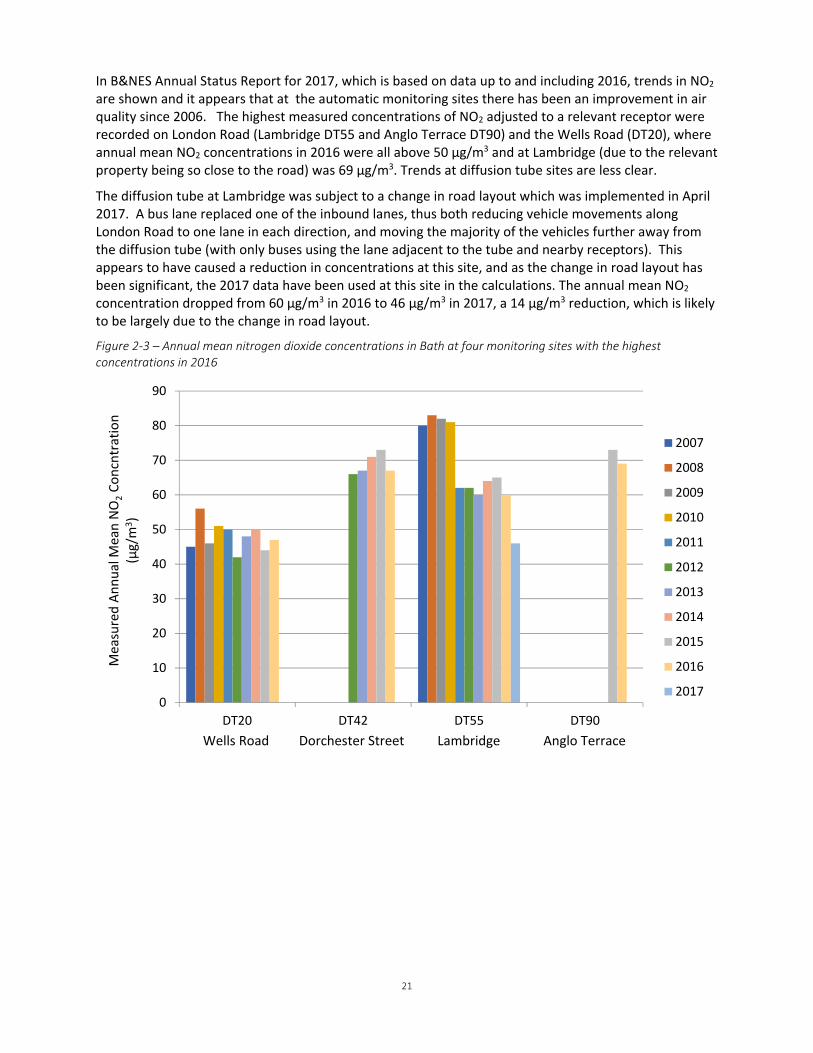
In B&NES Annual Status Report for 2017, which is based on data up to and including 2016, trends in NO2 are shown and it appears that at the automatic monitoring sites there has been an improvement in air quality since 2006. The highest measured concentrations of NO2 adjusted to a relevant receptor were recorded on London Road (Lambridge DT55 and Anglo Terrace DT90) and the Wells Road (DT20), where annual mean NO2 concentrations in 2016 were all above 50 µg/m3 and at Lambridge (due to the relevant property being so close to the road) was 69 µg/m3. Trends at diffusion tube sites are less clear.
The diffusion tube at Lambridge was subject to a change in road layout which was implemented in April 2017. A bus lane replaced one of the inbound lanes, thus both reducing vehicle movements along London Road to one lane in each direction, and moving the majority of the vehicles further away from the diffusion tube (with only buses using the lane adjacent to the tube and nearby receptors). This appears to have caused a reduction in concentrations at this site, and as the change in road layout has been significant, the 2017 data have been used at this site in the calculations. The annual mean NO2 concentration dropped from 60 µg/m3 in 2016 to 46 µg/m3 in 2017, a 14 µg/m3 reduction, which is likely to be largely due to the change in road layout.
Figure 2‐3 – Annual mean nitrogen dioxide concentrations in Bath at four monitoring sites with the highest concentrations in 2016
0
10
20
30
40
50
60
70
80
90
DT20 DT42 DT55 DT90
Mea
sured Annual M
ean NO
2Concntration
(µg/m
3)
2007
2008
2009
2010
2011
2012
2013
2014
2015
2016
2017
Wells Road Dorchester Street Lambridge Anglo Terrace

22
Air pollution has negative impacts on the health of people in Bath, especially vulnerable members of the population, in particular the elderly, children and people already suffering from pre‐existing health conditions such as respiratory and cardiovascular conditions6. Evidence suggests that it can cause permanent lung damage in babies and young children7 and exacerbates lung and heart disease in older people8. Approximately 40,000 deaths can be attributed to NO2 and fine particulate matter pollution in England every year7.
Defra’s PCM model predicts annual mean concentrations of NO2 across the country from the present day to 2020 and beyond, for the purposes of reporting Limit Value exceedances to the EU. In Bath, using the PCM outputs, only one location, London Road, remains non‐compliant past 2020, with compliance projected to be met in 2021 without measures in place. The with‐CAZ scenario included in the National Air Quality Plan analysis using the PCM, forecasts a maximum concentration of NO2 of 37 µg/m3 as an annual mean in Bath in 2021.
Our preliminary assessment based on use of air quality monitoring data projected past 2020 concluded that compliance is expected to be achieved across Bath, at all monitoring locations, by 2025 without additional measures. The disparity with Defra’s predictions is largely due to the difference in the spatial area at which the models work. The assessment presented in this document (see section 3.4.2.2 and Annex C) is based on monitoring locations within Bath, whereas the PCM is not undertaken at this resolution, and instead verified against monitoring sites across the UK. A further difference is that monitoring locations are not necessarily at the same distance back from the road as is assumed in the PCM model. In particular, diffusion tube monitors (and relevant exposure) located on London Road currently record significant exceedances of the annual mean Air Quality Objective and these locations are expected to remain uncompliant for several years .
The local assessment presented in this report is considered to give a more accurate picture of ongoing exceedances in Bath than the PCM model, since it considers a wider selection of roads within Bath and incorporates all the available local data. Therefore, the remainder of this document has been developed on the basis that compliance will not be achieved until 2025 without intervention.
2.5.2 Source Apportionment Road transport is the main contributor of emissions of nitrogen oxides (NOx) at roadside locations, and therefore the predominant cause in locations where NO2 concentrations are not complying with Limit Values or Air Quality Objectives. Nitrogen oxides is a generic term which includes both Nitrogen Oxide (NO) and NO2. According to National Atmospheric Emission Inventory (NAEI) estimates, around a third of the UK NOx emissions in 2015 arose from road transport, most of which came from diesel vehicles (NAEI, 2017).9. Some disparities exist due to the increase in the proportion of NOx emitted directly as NO2 (also known as primary NO2) from the exhausts of modern diesel vehicles, as a result of emission control systems that aim to reduce total NOx and particulate matter emissions. Contributions from transport to NOx emissions in Bath are assumed to be higher than the national average due to the high number of vehicles in built‐up areas.
6 World Health Organization, ‘Review of evidence on health aspects of air pollution – REVIHAAP Project’, 2013 http://www.euro.who.int/__data/assets/pdf_file/0004/193108/REVIHAAP‐Final‐technical‐report‐final‐version.pdf?ua=1
7 Royal College of Paediatrics and Child Health, Every breath we take – The lifelong impact of air pollution, February 2016 (URL: https://www.rcplondon.ac.uk/projects/outputs/every‐breath‐we‐take‐lifelong‐impact‐air‐pollution)
8 Simoni et al., Adverse effects of outdoor pollution in the elderly, Journal of Thoracic Disease, January 2015 (URL:https://www.ncbi.nlm.nih.gov/pmc/articles/PMC4311079/)
9 NAEI, Air Quality Pollutant Inventories for England, Scotland, Wales, and Northern Ireland: 1990‐2015 (August 2017)

23
No other major sources of NOx (e.g. from energy production, domestic combustion or other industrial processes) have been identified within Bath, and other sources of NOx are included in the background concentrations. Background concentrations are those measured well away from any significant sources of pollution, such as busy roads, railway lines or industrial sites with emissions to air, or modelled based on monitored background concentrations.
ANPR surveys were undertaken by B&NES in October and November 2017 to provide fleet composition data with which to support this study. The locations of the ANPR cameras are shown in Figure 2‐4. Processing of the data is underway and will provide an understanding of the overall fleet proportions in Bath. As the data processing progresses, this data will be relied upon heavily for detailed modelling within the Outline Business Case.

24
Figure 2‐4: ANPR survey locations

25
Emissions of NOx are a combination of nitrogen oxide (NO) and NO2 and are dependent on the type of vehicle (both in terms of size and age of the vehicle). Figure 2‐5 shows the proportion of NOx emissions by the vehicle fleet in the centre of Bath in 2016, calculated from modelled traffic data, and EFT version 8.0.1 (this does not make use of the new ANPR data currently, since proportions of vehicles based on trip frequency are not yet available). This shows that diesel vehicles contribute around 95% of the total NOx, with diesel cars (49%), diesel Buses and Coaches (17%) and diesel Light Goods Vehicles (14%) being the largest contributors. Data have also been analysed at the 3 worst case monitoring locations (with exceedances predicted post 2020) and included in the figure below. This shows similar contributions along Wells Road (DT20), but an increased proportion (10‐20% more) of Heavy Goods Vehicles (in particular Rigid HGVs) along London Road at Anglo Terrace and at Lambridge, and an equivalent decrease in diesel cars and buses at the locations.
Figure 2‐5 – Source apportionment of emissions within Bath (figures shown are %)
Petrol Cars Diesel Cars Petrol LGVs Diesel LGVs
Rigid HGVs Artic HGVs Bus / Coaches
6.0
56.4
0.0
13.1
8.2
2.014.3
4.7
44.4
0.0
17.9
20.2
5.0
7.8
3.2
34.7
0.08.6
30.7
8.3
14.65.0
48.8
0.0
14.3
11.7
3.1
17.0
DT20 ‐ Wells Road DT55 ‐ Lambridge (London Rd)
DT90 ‐ Anglo Terrace (London Rd) Average

26
2.6 Benefits, Risks, Constraints and Dependencies In accordance with the JAQU Inception Package of guidance, and the HM Treasury Green Book10 this section sets out the benefits, risks, constraints and dependencies associated with this Clean Air Plan. The selection of measures for inclusion within the Plan will seek to maximise benefits and mitigate risks wherever possible, and this is reflected in the selection of Critical Success Factors, set out in section 3.3 of this document.
2.6.1 Benefits The Clean Air Plan could provide benefits in the following areas:
Public Health, including reduced mortality rates
Transport (reduced vehicle emissions, movements, journey times, accident rates)
Financial revenue streams to re‐invest in local transport
The benefits identified within this section will be considered throughout the development of the Clean Air Plan, and will be maximised within the scheme selection and design.
Public Health
Poor air quality is the largest known environmental risk to public health in the UK11. Older people, children, people with pre‐existing lung and heart conditions, and people on lower incomes may be most at risk12 and the negative link between long‐term exposure to air pollution and chronic mortality has long been recognised. The total mortality impact of air quality is subject to notable uncertainties as set out in the National Air Quality Plan (July 2017). However, studies show that long‐term exposure to air pollution reduces life expectancy by increasing deaths from lung, heart, and circulatory conditions. Refined recommendations from the Committee on the Medical Effects on Air Pollutants (COMEAP) on the link between NO2 and mortality are included in the National Plan.
Short‐term exposure to high levels of air pollution can also cause a range of other adverse health effects including exacerbation of asthma, effects on lung function and increases in hospital admissions. There is emerging evidence of possible links with a range of other adverse health effects including diabetes, cognitive decline and dementia, and effects on the unborn child13.Further research continues to improve our understanding of the health effects of air pollution meaning the evidence is subject to change. Nevertheless, the currently available evidence indicates it is an important issue that requires action14.
10 Public Sector Business Cases using the Five Case Model, DfT, 2015 https://www.gov.uk/government/publications/the‐green‐book‐appraisal‐and‐evaluation‐in‐central‐governent
11 Public Health England (2014) Estimating local mortality burdens associated with particular air pollution. https://www.gov.uk/government/publications/estimating‐local‐mortality‐burdens‐associated‐with‐particulate‐air‐pollution
12 World Health Organization (2013) Review of evidence on health aspects of air pollution – REVIHAAP Project. http://www.euro.who.int/en/health‐topics/environment‐and‐health/air‐quality/publications/2013/review‐of‐evidence‐on‐health‐aspects‐of‐air‐pollution‐revihaap‐project‐final‐technical‐report
13 Royal College of Physicians (2016) ‘Every breath we take: the lifelong impact of air pollution’, 2016 www.rcplondon.ac.uk/projects/outputs/every‐breath‐we‐take‐lifelong‐impact‐air‐pollution
14 National Air Quality Action Plan (July 2017) https://www.gov.uk/government/publications/air‐quality‐plan‐for‐nitrogen‐dioxide‐no2‐in‐uk‐2017

27
There are public health benefits (both morbidity and mortality) associated with a reduction in pollutants, and health experts now believe that reducing concentrations of NO2 and particulate matter, regardless of whether they are under the Limit Values and National Objectives, are likely to produce improvements to public health. Achieving compliance at all locations within Bath will therefore result in public health improvements at all locations where exceedances are currently recorded, but will also reduce harm across the entire city. The improvements to public health, specifically the number of premature deaths, will be calculated and monetised at the next stage within the Outline Business Case. Impacts on morbidity are more difficult to monetise based on hospital admissions, but will be assessed quantitatively if suitable data can be obtained or qualitatively where there is no robust method for quantification.
Transport
Vehicle movements in Bath are responsible for up to 92% of total NOx concentration15. Hence the Plan will include measures to tackle this source, reducing vehicle emissions. It is possible that the Plan could also reduce vehicle movements, and realise improvements in journey times and reliability. This may also produce a reduction in road traffic collisions and noise pollution.
The Plan could include measures to increase travel by sustainable modes such as public transport, walking and cycling. An increase in use of these modes would produce health benefits through increased physical activity, resulting in reduced risk of premature death and reduced time off work for ill health.
Financial Revenue Streams
Defra’s Clean Air Zone Framework (May 2017) prevents Local Authorities from setting a charge as a revenue raising measure, but any charging scheme will need to be set at a level to produce a change in behaviour. If the selected plan includes a charging element, any excess generated over the operational costs of running the scheme is subject to stringent controls. In accordance with the Transport Act 2000 this revenue should be re‐invested to facilitate the achievement of local transport policies which aim to improve air quality and support the delivery of the ambitions of the Plan. The anticipated revenue from the Plan will be calculated alongside the operational costs to understand the potential for excess revenue which would be re‐invested in transport policies.
2.6.2 Risks The Clean Air Plan has the following risks associated with it:
Changes in carbon emissions
Changes in particulate matter emissions
Economic impacts
Conflicts with infrastructure demand
Impacts on vulnerable groups, particularly low income groups
Impact on Public Transport services
The risks identified within this chapter will be considered throughout the development of the Clean Air Plan, and where possible and appropriate will be mitigated within the scheme selection and design.
Carbon
The Plan is focused on one pollutant; nitrogen dioxide (NO2). However, the main sources of NO2, vehicles, also produce other pollutants including carbon dioxide (CO2) and particulate matter (PM). There is a risk that the selected Plan could achieve compliance with the legal limits for NO2 concentrations, but simultaneously result in an increase in other harmful pollutants.
15 http://www.bathnes.gov.uk/services/your‐council‐and‐democracy/local‐research‐and‐statistics/wiki/air‐quality

28
CO2 is particularly relevant, since the growth in diesel vehicles (which produce high levels of NO2) is largely down to the promotion of their benefits in reducing carbon emissions. A reduction in the number/usage of diesel vehicles in favour of petrol vehicles could increase levels of carbon dioxide. In addition, the declaration of a charging zone or access restrictions may result in vehicles re‐routing around the zone. This could increase fuel consumption and subsequently carbon emissions. The detailed assessment of the shortlist of options within the Outline Business Case (to follow) will consider the issue of re‐routing and the consequences.
Particulate Matter
In addition, there are Limit Values and Air Quality Objectives for particulate matter (PM), specifically PM10 and PM2.5 which will need consideration. Recent monitoring data has demonstrated that particulate matter emissions in Bath have been under both Limit Values and Objectives for several years. It is not anticipated that the Plan will produce an increase in particulate matter emissions since choices which reduce NO2 from vehicles are also likely to reduce PM.
Economy
The Plan has the potential to impact the local economy depending on the measures selected. A significant proportion of jobs in Bath are located within the city centre where some of the most significant exceedances are located. It is therefore likely that the measures will be targeted at reducing emissions in the central area of Bath, and depending on the measures selected could limit the attractiveness of jobs within the city centre. It is therefore desirable to select an option which has the least impact on the local economy, and if possible a neutral or positive impact.
Bath is a UNESCO World Heritage Site and tourism is a key contributor to the local economy. Assessments conducted in 2014 calculated that 9,213 people were employed in tourism in B&NES, there were 4.8 million day visitors to the authority, and £411 million was spent by tourists in 201416. The impact of the Clean Air Plan on tourism is therefore a key consideration, and it is desirable to select a package which produces at least a neutral impact.
Infrastructure Demand
This Plan is one of 15 similar Plans being developed across the country within the same time frame. There are 28 Local Authorities involved, but some are grouped together to deliver a joint Plan. The objectives of all these Plans are to achieve compliance with the NO2 Limit Values. It is therefore likely that similar measures could be proposed in multiple locations, putting pressure on the market supply of particular items, such as ANPR cameras or compliant buses.
Vulnerable Groups
There are specific risks that relate only to the implementation of a charging zone which may form part of the Plan. There is potential to disproportionately penalise vulnerable groups in society, depending on the geographic location, scale and the structure of vehicle compliance standards. In particular, it is appropriate to consider the differential impacts of the Plan on low income households since charging elements will be considered.
16 http://www.bathnes.gov.uk/services/your‐council‐and‐democracy/local‐research‐and‐statistics/wiki/tourism‐and‐visitor‐economy

29
Impact on Public Transport Services
Inclusion of all vehicle types within the Plan, particularly within a charging zone, would spread the requirement to change vehicles or behaviour across a wider proportion of society, requiring a lesser level of change within each group of vehicles to achieve the same overall level of air quality improvement (i.e. fewer buses/private hire/hackney carriages/good vehicles would need to alter their journeys or vehicles types, if a proportion of private car drivers also amended their journeys to improve air quality). Since upgrading to lower emission vehicles is costly, and there are limited resources available to local and central government to help assist, spreading the cost across different vehicle types would add more certainty to the delivery of the air quality improvement within the required timescales. It would also maximise the possibility of mitigating adverse impacts of the CAZ through exemptions, discounts or sunset periods (short periods of exemption to allow longer for vehicle upgrades to take place) for those groups disproportionately affected by the scheme, without delaying when compliance can be achieved.
The extent to which this problem could materialise in Bath is not understood entirely yet. However, a picture of the existing fleet in Bath is being established, and indicates that a significant proportion of the fleet consists of older diesel vehicles.
Simultaneous implementation of measures to increase bus patronage might present an opportunity to mitigate this scenario, by providing operators with an additional stream of income to support the upgrades. It could also produce a ‘virtuous circle’, where drivers of private cars are encouraged to use public transport, which in turn enables operators to expand services provided, encouraging further drivers to switch mode. The opposite situation could materialise if bus patronage is not encouraged but bus operators are required to upgrade their fleet.
2.6.3 Constraints The most significant constraint on the Plan is the legal situation through which it has materialised. Specifically, the requirement for the UK Government to achieve compliance with the Limit Values in the shortest time possible, and only considering cost when comparing between two equally quick schemes. Specifically, in November 2016 Mr Justice Garnham of the High Court found that ‘I reject any suggestion that the state can have any regard to cost in fixing the target date for compliance or in determining the route by which the compliance can be achieved where one route produces results quicker than another. In those respects, the determining consideration has to be the efficacy of the measure in question and not their cost. That, it seems to me, flows inevitably from the requirements in the Article to keep the exceedance period as short as possible”.
Following a further High Court hearing in January 2018, Mr Justice Garnham again ruled that the Government’s National Air Quality Plan was unlawful. The outcome of the hearing is that more action is required in the local authorities where the PCM is predicting current exceedances of the annual mean nitrogen dioxide Limit Value, but where predictions are currently that they will achieve compliance by 2021. However, the judge found that the Governments modelling is compliant and there was ‘no error’ in the government’s approach in tackling exceedances in areas such as B&NES. This will not directly affect the work that B&NES is undertaking in the feasibility study, or the timescales in which this will need to be undertaken.
2.6.4 Dependencies The Plan is dependent on the progression of other workstreams which may feed into the development of the options which form the final package of measures. Specifically, there are ongoing West of England Combined Authority (WECA) and B&NES projects considering public transport options, changes to parking including for coaches, and implementation of the public realm and movement strategy which may be relied upon by this Plan in order to meet the required timescales, or affect the outcome.

30
WECA have yet to determine which parts of the existing highway network will be managed and operated by them instead of the local authority. This will be known as the Key Route Network (KRN) and its extent is expected to be announced in 2018. The development of the Plan will depend on the involvement of WECA regardless of the KRN, but any overlap in links within the KRN and those affected by the package of measures proposed within this Clean Air Plan may require a greater involvement from WECA.
Similarly, Highways England (HE) currently manage and operate the A46 and A36 which enter/exit Bath on the eastern side of the city. B&NES manage the route through the city between the A4/A46 and A36, but this section of the network forms a key link within the HE Strategic Road Network (SRN). There are key exceedances of the NO2 Limit Value on London Road, which forms part of this route through Bath. As such, the management of traffic along London Road is likely to form a key part of the Plan and will rely on the involvement of Highways England to progress the business case and possibly to implement the final Plan.
Wiltshire Council will also be a key stakeholder in the development of the Plan, specifically in relation to measures targeting exceedances on London Road. If the proposed measures make the SRN route through Bath less attractive, it is likely that traffic will find alternative routes through Wiltshire. Previous schemes proposed by B&NES to target London Road traffic have received strong objections from Wiltshire Council and have been subsequently removed from consideration. These measures sought to restrict HGVs from making particular movements within the city, effectively restricting HGVs from using the strategic route through Bath. Less prohibitive measures are considered within this document which may remove this issue, and this project has a legal emphasis which differentiates it from previous circumstances.
In addition, the selected package of measures may have wider impacts across the region within Bristol, South Gloucestershire, and Somerset.
2.6.5 Conclusions Evidence from local monitoring data indicates that there are widespread exceedances of the Limit Value and Air Quality Objective for NO2 across Bath. Defra predicts that without further action exceedances will occur until 2021, but local assessments based on a more comprehensive dataset suggest that compliance would not naturally occur until 2025. Approximately 40,000 deaths can be attributed to NO2 and fine particulate matter pollution in England every year and hence there is an urgent need to reduce pollution in Bath, and specifically to comply with the Limit Values and Air Quality Objectives. Due to the forecast air quality exceedances B&NES Council has been directed by the Minister to produce a Clean Air Plan to achieve air quality improvements in the shortest possible time.
The Plan fits well with the objectives of existing policies for the city and wider region, including GAB, Placemaking Plan, PRMS, the parking strategies, JTS and JTP. The measures proposed within the Clean Air Plan are likely to be complementary to existing policy objectives and to support wider transport initiatives. B&NES Council is working closely with the newly formed WECA to ensure that emerging policy also reflects the magnitude of the air quality problem and the urgent need to address it.
Any intervention will have impacts across the region which are both positive and negative. There will be benefits to public health, and also possibly a reduction in vehicle movements and the associated impacts. Conversely, there is a risk that the chosen measures could increase carbon or particulate matter emissions, or negatively impact the economy or vulnerable groups. In addition, the development of similar plans across the country could result in high demand for particular infrastructure or services, which the existing market cannot fulfil. The risks, constraints and dependencies identified within this chapter will be considered throughout the development of the Clean Air Plan, and where possible and appropriate risks will be mitigated and benefits maximised within the scheme selection and design.

31
Economic Case
3.1 Introduction The Strategic Case outlines the case for change by comparing the existing conditions, statutory and regulatory obligations, and the desired goals of this local government intervention. Within this context the purpose of the Economic Case in the SOC document, as outlined in the JAQU’s Inception Package, is to identify a long list of options and refine them to a short‐list of packages of measures which will be appraised in greater detail as part of the Outline Business Case and Full Business Case to follow.
The Inception Package document states that shortlisting of the options requires an early appraisal of options against Critical Success Factors as well as the intervention’s spending objectives and benefit assessment criteria. The document also states that the options’ other strengths, weaknesses, opportunities and threats may also need to be considered for the shortlisting process. Finally, the Inception Package document states that this multi‐criteria analysis should be used to short list approximately four options to be explored further.
Within the above context, this Economic Case chapter includes the following:
Identify a long‐list of options for delivering the desired goal
Establish the Critical Success Factors, including the primary Critical Success Factor and other secondary Critical Success Factors as identified in the JAQU’s Options Appraisal Package document
Establish the multi‐criteria appraisal framework, including the Critical Success Factors, and the process for appraising the long list of options
Determination of a short list of at least four packages of measures, which will be appraised in greater detail as part of the Outline Business Case and the Full Business Case.
3.1.1 Assessment Process A process to assess the long list of measures has been determined, in accordance with JAQUs Inception Package guidance and the HM Treasury Green Book. The process is summarised in Figure 3‐1 overleaf.
The initial longlist is formed from public inputs into the B&NES Air Quality Action Plan (AQAP) consultation in late 2017, and hence reflects local public opinion.
The process to assess the long list of measures must comply with JAQU Guidance and the HM Treasury Green Book. This dictates that all measures should first be assessed for their ability to deliver compliance with the Limit Values in the shortest possible time, before any other impacts are considered. For those measures which are equally quick, further assessment should be undertaken to consider, as a minimum, value for money, distributional impacts, strategic fit, supply side capability/capacity, affordability and achievability.
It should be noted that in the context of the Limit Values and Air Quality Objectives, compliance is judged using annual average concentrations. Therefore, the time within which each measure can achieve compliance is assessed by year, rather than using smaller increments such as months or days.

32
Figure 3‐1: Summary of Options Shortlisting Process

33
3.2 Long List of Measures
3.2.1 Overview The Green Book, as recognised in the JAQU’s Options Appraisal Package document, requires generation of a broad range of options to ensure that all realistic interventions have been considered against the Plan’s reference case. Considering the need for change and the evidence regarding specific sources of local exceedances outlined in the Strategic Case chapter, this section of the Economic case outlines the wide range of measures which can meet the Plan’s spending objectives. Namely, to meet the statutory
NO2 Limit Values and Air Quality Objective within the shortest possible time. DEFRA’s Clean Air Zone Framework suggests that options broadly fall within two categories: non‐charging and charging options. Hence, the long list of options is initially presented across these two categories in this section before being combined into packages of complimentary measures.
Measures to address air quality exceedances in Bath are already included in the latest version of the Bath Air Quality Action Plan17. These measures were developed with input from stakeholders and were recently subject to a public consultation. Ideas from consultees in creating this list formed the starting point for developing the long list of options within this SOC, incorporating feedback from the consultation and new ideas which have emerged.
3.2.2 Reference case The Options Appraisal Package document states that the long list of options should include a ‘do nothing’ option which acts as a reference case for the intervention option. A comparison between the reference case and the intervention options allows appraisers to assess the efficiency and effectiveness of public sector investments.
The reference case for the Bath Clean Air Plan is expected to achieve compliance at all monitoring locations in Bath in 2025. By 2021, it is anticipated that 4 out of 54 monitoring locations in Bath would remain in exceedance of the air quality objectives (for details of this calculations see Annex C). As outlined in the Strategic Case chapter, the forecast non‐compliance acts as the rationale for public sector intervention.
3.2.3 Justification for Consideration of Charging Measures
3.2.3.1 Strategic assessment
In Bath there is a discrepancy between when compliance is expected to be achieved as indicated by PCM modelled concentrations and forecast concentrations using local monitoring data (both real time monitors and diffusion tubes). The PCM indicates that without any additional measures, compliance will be achieved on London Road by 2021. The assessment presented in this SOC, forecasting concentrations using local monitoring data, suggests that compliance will not be achieved in Bath until 2025 without additional measures. Full details of this assessment are provided in Annex C.
17 http://www.bathnes.gov.uk/services/environment/pollution/air‐quality/action‐plan

34
The relationship between traffic measures and NOx emissions is subject to significant uncertainty and many variables, including typical driving dynamics, the extent of acceleration, weather conditions, and others. However, overall, non‐charging interventions are expected to result in localised improvements in emissions, particularly if coupled with other more influential interventions such as charging or access restrictions. Defra (in a report authored by Ricardo, May 2016)18 reviewed evidence of the effectiveness of road transport policy measures to improve air quality, to assist in the selection of measures and to estimate the future effects of such measures on air quality. Over 400 academic papers were reviewed to assess the impact of 72 policy measures on improving air quality. According to the study, the most effective measures were accelerating the uptake of Euro 6 cars, vans and HGVs, increasing the uptake of hybrid technology, greening taxi fleets, as well as traffic management (such as discouraging zone peripheral parking) and access control measures (such as low emission zones)18.
Promotion of low emission vehicles, as opposed to reducing vehicle movements, can be considered to be as effective in delivering air quality improvements, but only if uptake rates are substantial, and if emissions of the vehicles are substantially lower than those of the vehicles they replace.
3.2.3.2 Impact of Bath’s Air Quality Action Plan
The Air Quality Management Area (AQMA) was declared in Bath in 2002 and B&NES Council published its first Air Quality Action Plan in 2006. The second iteration of this plan covering the period 2011‐2016 and delivered collaboratively between partners, the local authority, other providers including bus companies, included a number of projects:
Bath Transportation Package (resulting in an increased provision of Park and Ride spaces across existing P&R sites, as well as real time bus information, roadside variable message signs, cycling and pedestrian improvements);
Low Emission Zone Feasibility Study;
Low Carbon Buses Trial (of a hybrid diesel‐electric double bus, which led to the award of the new Park and Ride contract with 8 new hybrid diesel‐electric buses);
Improved enforcement of Traffic Regulation Orders on routes where HGVs are restricted, particularly A4 between Windsor Bridge and London Road;
Bicycle Hire scheme including electric bikes (currently progressing through Go Ultra Low);
Electric Vehicle Charging Points in council car parks (4 delivered at each park and ride plus 4 at Charlotte Street) and some employment sites (2 delivered at Lewis House, 2 at Curo, 2 at Hayden and 6 at the University of Bath);
A review of the Council fleet, resulting in the Council pledging to change 25% of its light duty fleet to ULEVs by 2021;
Council corporate Travel Plan which received a Silver award in 2013 from the West of England Business Travel Plans.
A consultation draft of an updated Action Plan was published in 2017 with the three month consultation period ending in December 2017. Responses to the consultation are currently being analysed and collated into a report, and have been used to inform this feasibility work.
18 Defra, Ricardo, ‘Exploring and appraising proposed measures to tackle air quality’ (May 2016).

35
The ongoing work on the Action Plan, alongside other policy processes such as the Bath Transportation Package and the Joint Local Transport Plan has resulted in a gradual switch from car use to more sustainable modes of transport. Figure 3‐2 and Figure 3‐3 below show the mode share in 2001 and 2011 for journeys to work made by Bath residents. In 2011, of those residents who work outside of Bath, 69.3% drove to work (reduced from 72.4% in 2001) but of those working within central Bath only 20.8% drove (reduced from 23.4% in 2001). However, this change in mode share has not resulted in reductions in concentrations of NO2 large enough to achieve compliance with the Limit Values or Air Quality Objective, as evidenced by the monitoring data across Bath presented in this report.
Figure 3‐2: Census Journey to Work Mode Share: Live in Bath, work outside Bath
Figure 3‐3: Census Journey to Work Mode Share: Live in Bath, work in Bath City Centre
There is also a significant contribution to car trips from non‐Bath residents, with 71.9% trips from outside of Bath to jobs within Bath being made by car in 2011 (reduced from 76.8% in 2001), as shown in Figure 3‐4.
0.00% 10.00% 20.00% 30.00% 40.00% 50.00% 60.00% 70.00% 80.00% 90.00% 100.00%
Car (inc taxi)
Car passenger
Walk
Rail
Bus
Cycle
Motorcycle
Other
2001 2011
0.00% 10.00% 20.00% 30.00% 40.00% 50.00% 60.00% 70.00% 80.00% 90.00% 100.00%
Car (inc taxi)
Car passenger
Walk
Rail
Bus
Cycle
Motorcycle
Other
2001 2011

36
Figure 3‐4: Census Journey to Work Mode Share: Live outside of Bath, work in Bath
The highway network in Bath is formed of radial routes into the city centre, with little opportunity for vehicles to route in such a way as to avoid the centre. The lack of alternative routes means that there is often a high demand for road space during peak periods, despite a high proportion of Bath residents using sustainable modes for travel to work (see Figure 3‐2 and Figure 3‐3). The fact that the annual mean NO2 concentrations remain above the legal thresholds 11 years after the implementation of the first AQAP in Bath, despite active implementation as outlined above, is clear evidence that these measures cannot provide sufficient air quality improvements to achieve compliance with the legal standards.
3.2.3.3 Potential Impact of Non‐Charging Measures
In recent years non‐charging measures to tackle air quality problems in Bath, and elsewhere in the country, have mainly focused on reducing car traffic by incentivising more sustainable modes. The Census Journey to Work data shows that in Bath a reduction in car trips of approximately 4.9% was achieved over the 10 year period between 2001 and 2011, equating to an approximate reduction of 0.49% per annum. Traffic surveys in central Bath have also shown a steady decrease during the same time period19. Figure 3‐5 plots the total traffic volume (weekday 12‐hour total 07:00‐19:00) in central Bath and shows a drop of around 20% between 2000 and 2013, equating to approximately 1.5% reduction per year.
19 Getting Around Bath: Supporting Document, A Transport Strategy for Bath, B&NES & Mott MacDonald, October 2014
0.00% 10.00% 20.00% 30.00% 40.00% 50.00% 60.00% 70.00% 80.00% 90.00% 100.00%
Car (inc taxi)
Car passenger
Walk
Rail
Bus
Cycle
Motorcycle
Other
2001 2011

37
Figure 3‐5: Historic Weekday Traffic Volumes in Bath, Source: Getting Around Bath Transport Strategy
B&NES Getting Around Bath (GAB) Transport Strategy predicts that the development anticipated by 2020 in Bath would result in an increase in vehicle movements over the existing levels, even with delivery of the all the sustainable travel improvements set out in the strategy. This includes delivery of rail electrification (now on hold), MetroWest and an Eastern Park and Ride site (needs further consideration to determine a suitable site/scheme), all of which require significant investment and time to deliver.
To assess the impact of continued implementation of non‐charging measures to promote sustainable travel a 5% reduction in car emissions within the AQMA has been applied to the EFT outputs for the reference case scenario. This is intended as a proxy to reflect an ambitious level of mode shift that might be produced by non‐charging measures (excluding access restriction/prohibition measures). This matches the change in car mode share achieved across Bath between 2001 and 2011 (from the census Journey to Work data) and so is highly ambitious to deliver in the timescales required for this Plan.
The results of this assessment are shown in Figure 3‐6 overleaf. The assessment found that this reduction would alter the year that compliance could be achieved by only 1 year, from 2025 to 2024, compared to when this would occur in the reference case.

38
Figure 3‐6: Assessment of impact of 5% reduction in emissions
This analysis demonstrates that measures related to mode shift and improvement of the fleet would need to be substantial, at least of the order of Metrowest, rail electrification and an Eastern Park and Ride site, in order to achieve sufficient improvements in air quality without a charging scheme. Measures of this level of significance are unlikely to be deliverable within the short term, and are unlikely to deliver compliance more quickly than a charging scheme.
3.2.3.4 Summary
Achievement of the required improvement in air quality is unlikely to be feasible in Bath if only non‐charging options (excluding access restrictions/prohibitions) are considered for this Plan. This drives the need for inclusion of either measures to restrict vehicle access or targeted charging options as part of the long list of potential interventions for the Plan. A long list of non‐charging interventions, including access restrictions/prohibitions, has been identified and are considered alongside charging measures.
3.2.4 Non‐Charging Measures The long list of non‐charging measures from Bath Air Quality Action Plan Consultation considered for the Plan are;
Parking
Restrict residents parking permits to one car per household within AQMA
Implement reduced residents’ parking permit cost for low emission vehicles
Widen residents parking zones to stop commuter parking on the outskirts
Implement parking permit system in residential areas for visitors/commuters to city (alongside RPZs)
Reduce long stay commuter parking capacity in the city centre
Increase parking prices in city centre to discourage car trips
Reduce parking spaces in city centre (on and/or off street)

39
Introduce differential car parking charges based on vehicle fuel type, to discourage polluting vehicles and promote ULEV
Introduce Smart parking systems (possibly to include pre‐booking)
Review residents' parking scheme zoning structure and hours of operation, and implement changes as appropriate
Review operation of central area zones to reduce parking for non‐residents and implement changes as appropriate
Review parking standards for new development to promote low emission/electric vehicles
Consolidate public off‐street car parking stock into fewer facilities
Increase the number and usage of existing VMS signs to provide information about parking and reduce unnecessary trips into the city centre
Encourage car sharing by providing priority parking areas for those sharing their ride
Taxis and Private Hire Vehicles
Promote low emission vehicles for taxi work, through taxi licensing
Targeted Hackney carriage/private hire investment incentive scheme
Public information
Deliver Bath air quality publicity campaign
Use variable message signs to promote air quality improvement messages
Provide an air quality smart phone app: issue warnings when levels are at or approaching harmful concentrations and encourage action to reduce
Public Transport
Promote smart ticketing and existing BathRider multi operator ticket
Implement public transport route improvements including bus priority, passenger information and waiting facilities (could target particular routes or demographics)
Introduce a revised TRC mandating that buses meet the Euro VI emissions standard
Subsidise local rail season tickets
Introduce cheaper bus fares for groups (it's more expensive for multiple people to use the bus than park the car)
Reduce/remove the need for buses to traverse the city centre
Metro‐West rail project
Reduce bus movements in the off‐peak periods and make more use of demand‐responsive transport alternatives
Encourage West of England Mayor to introduce advanced Bus Quality Partnerships and Direct Franchising
Introduce mandatory compliance (Euro 4 petrol, Euro 6 Diesel) for buses, taxis and private hire to access bus lanes/franchise routes
Traffic Management
Develop and implement city centre traffic reduction plan to reduce through traffic and car dependency, particularly at Manvers Street, Dorchester Street and Queen Square
Replace experimental TRO for bus lane on London Road with permeant TRO
Introduce traffic gating (soft including real time traffic management system)
Implement traffic free street trials. To demonstrate how we could reduce dependence on car use
Introduce targeted traffic management or improved bus priority on A367 Wells Road
Extend and enforce a 20mph zone within the city to reduce vehicle emissions
Disincentivise drivers from using the trunk road
Introduce car share lanes/use of existing bus lanes by high occupancy vehicles

40
Private Vehicles
Expansion of car club network in Bath
Introduce local investment incentive scheme for private vehicles
Promote car sharing through pilot of smartphone application
Active Transport Modes
Provide additional cycle parking across the city centre in visible locations and pilot a management scheme to improve proper usage of cycle parking
Extend walking and cycling priority schemes and encourage greater modal shift. Provide a safer environment for cycling and walking
Pedestrianise the city centre
Replace bus priority infrastructure with cycle priority infrastructure
Introduce electric cycle hire to the city
Electric Cars/Low Emissions Vehicles
Continue installation of electric car charging points in off street car parks and extend to on street
Encourage car club operator to introduce electric cars (including family‐sized EVs)
Encourage car hire operators to introduce electric cars/vans
Require contractors operating fleets on Council business to use low emission vehicles
Coaches
Restrict coach vehicles from entering the city centre in peak periods
Provide a coach park outside the city centre
Restrict Access for Certain Vehicles
Introduce an AM peak prohibition for non‐compliant vehicles (would need to be linked to concessionary travel passes etc for low income areas)
Prohibit diesel cars (or other vehicles, based on level of contribution to problem) from the city centre
Introduce Odd/Even number plate access restrictions (possibly restricted to certain weeks or time periods)
Include Sunset period to exempt Euro 5 diesel vehicles to enable longer for upgrades
Freight and Deliveries
Promote greater use of low emission delivery services and 'Last mile' freight/post schemes
Promote use of low emission vehicles for freight, refuse, recycling and delivery services, where possible
Encourage operators to offer lower delivery charges if already visiting area
Review existing delivery hours restrictions for businesses in Bath city centre and amend where beneficial and viable
Develop a Bath freight consolidation centre, providing storage (for stock replenishment) and delivery depot for local businesses, ideally to be operated by cargo bikes or Ultra‐Low Emission Vehicles
Park and Ride
Expand Bath's existing Park & Ride provision, both in terms of sites and operating times
Expansion of Bath's Park & Ride provision on new sites
Create smaller P&R sites on existing bus routes
Policy and Guidance Documents
Ensure that air quality improvement measures are given sufficient prominence in the West of England Joint Spatial Plan and replacement Joint Local Transport Plan
Produce developer guidance or Supplementary Planning Guidance relating to Air Quality

41
Infrastructure
Roll out superfast broadband to promote home working
Encourage private investment into the provision of sustainable transport infrastructure
A36/A46 link road
Investigate the possibility of installing a CNG refuelling station just outside the city centre
Behaviour Change
Implement advisory or mandatory engine switch off/anti‐idling zones
Reduce traffic congestion by staggering business and school hours Extend the current Business engagement scheme to encourage employers to promote sustainable transport through promotion of Employers Travel Forum and adoption of Travel Plans
3.2.5 Charging Measures Charging options considered include all possible combinations of three geographical scopes and four charging classes of CAZ. In the first instance, the three geographical scopes of the Plan include:
1. Large ‐ the Bath urban area, bounded by the A36, London Road and A46 to the west (thus excluding the Park and Ride sites)
2. Medium – the Bath Air Quality Management Area, extending out along key arterial routes to encompass Bathwick Street and London Road to the north east and Upper Bristol Street, A36 and A367 to the west and south respectively.
3. Small – the Bath city centre area only, predominantly located north of the River Avon (with a small extension encompassing the A36 gyratory to the south of the river).
Figure 3‐7 shows the boundary of each zone assessed. These are anticipated to evolve throughout the length of the study as more detailed assessments are available and stakeholders are consulted.
Figure 3‐7: Initial CAZ geographies
42
The CAZ classes assessed were as defined in the Defra/DfT’s Clean Air Zone Framework. The framework sets out which vehicles are affected by each CAZ class and what the minimum Euro standards are for each vehicle type. The four CAZ classes include:
1. Class A charging – buses, coaches, taxis, private hire vehicles 2. Class B charging – buses, coaches, taxis, private hire vehicles and HGVs 3. Class C charging – buses, coaches, taxis, private hire vehicles, HGVs and LGVs 4. Class D charging – buses, coaches, taxis, private hire vehicles, HGVs, LGVs and cars
In each Class of CAZ, petrol vehicles that are pre‐Euro 4 (approximately registered before 2006) and diesel vehicles that are pre‐Euro 6 (approximately registered before 2015) would be charged to enter the zone.
All potential combinations of the three geographic scopes and four CAZ charging classes result in a long list of twelve charging options for the Plan.
3.3 Critical Success Factors and Evaluation Criteria JAQU’s Options Appraisal Package document states that a list of Critical Success Factors (CSFs) is required to conduct a high‐level comparative assessment of the options. This process is considered to result in a shortlist of options which are envisaged to be appraised in greater detail as part of the Outline Business Case and Full Business Case. Guidance from JAQU suggests that local authorities need to identify two types of CSFs: primary CSF and secondary CSFs. These CSFs for the Plan and the rationale for their inclusion are presented in this section.
3.3.1 Primary Critical Success Factor
JAQU require that local authorities appraise their options against one primary (pass/fail) CSF and any options which do not meet this CSF should be rejected. Building on the guidance provided in the Options Appraisal Package document, the primary CSF for the Plan is:
Deliver compliance with NO2 air quality Limit Values and Air Quality Objectives in the shortest possible timescales
It should be noted that the primary critical success factor reflects both the primary and secondary spending objectives by including compliance both the EU Limit Values and the UK Air Quality Objectives.
3.3.2 Secondary Critical Success Factors JAQU’s Options Appraisal Package document states that while the primary CSF allows appraisers to test whether an option meets the minimum requirements, other secondary CSFs are needed to undertake a comparative assessment of the options. The guidance states that these may include factors such as value for money, distributional impacts, wider strategic air quality policy alignment, affordability and achievability.
Following this guidance, a number of secondary CSFs have been defined for the Plan against which each of the options has been assessed. The secondary CSFs defined for this Plan have been grouped using the five case model approach set out in the DfT’s guidance on ‘Transport Business Cases’ (2013) as a framework. The CSF’s are;
Strategic
All trip purposes treated equitably
Compliance with Defra Draft CAZ framework, including minimum requirements Economic
Mitigate financial impact on low income groups

43
Maximise health improvements of low income groups
Net economic benefit
Improve general public health Commercial
Is the market able to supply in the time available? Financial
Likelihood of revenue equating to implementation/operational costs20
Upfront capital required for scheme20
Risk of financial penalty to the Council/s Management
Public acceptability
Local, regional and national political acceptability
3.3.3 Evaluation Criteria The primary CSF has been brought together with the other secondary CSFs to develop the evaluation criteria with which the options will be refined. The evaluation criteria are summarised in Table 3‐1.
Table 3‐1: Summary of Evaluation Criteria
Cases ID Evaluation Criteria Priority
Strategic
1 Deliver compliance with NO2 air quality Limit Values and Air Quality Objectives in the shortest possible timescales
Pass/Fail
2 All trip purposes treated equitably Low
3 Compliance with the CAZ framework, including minimum requirements High
Economic
4 Mitigate financial impact on low income groups High
5 Maximise health improvements of low income groups Very High
6 Net economic benefit High
7 Improve general public health Very High
Commercial 8 Is the market able to supply in the time available? High
Financial
9 Likelihood of revenue equating to operational costs High
10 Upfront capital required for scheme Low
11 Risk of financial penalty to the Council Medium
Management 12 Public acceptability Medium
13 Local, regional and national political acceptability Medium
The JAQU guidance states that the primary CSF, evaluation criteria 1, should be scored on a pass or fail basis – any option which fails this criteria is not assessed against any other CSFs. For all other evaluation criteria, a scoring system was devised for the option assessment which provides a score of High (3), Medium (2) or Low (1) for the performance of each option. The options have been scored relatively within each evaluation criteria; a low score does not necessarily indicate a negative impact, just that of all the options considered it is among the worst performing (and vice versa for high).
20 Complying with the legal test which was set out by the High Court in November 2016 in R (ClientEarth) (NO2) V Secretary of State for Environment Food and Rural Affairs [2016] EWHC 2740 (Admin), only shortlisted options which achieve compliance with the NO2 Limit Value in the shortest possible time, are appraised across this criterion. The relevant analysis is presented in the Financial Case chapter.

44
Each evaluation criteria was given a priority level of either Low (1), Medium (2), High (3), or Very High (4) based on judgement of their importance to B&NES Council and B&NES residents in the selection of a suitable option. This reflects feedback from the recent AQAP public consultation. These priority scores were multiplied with the 1‐3 score of performance to give an overall weighted score for each option. The priority score of each criteria is summarised in Table 3‐1.
The legal test which was set out by the High Court in November 2016 in R (ClientEarth) (NO2) V Secretary of State for Environment Food and Rural Affairs [2016] EWHC 2740 (Admin) confirms that when selecting measures to tackle air quality exceedances, the determining factor must be which measure will achieve compliance in the shortest time. The test also indicates that only where two measures are equally timely and effective can considerations such as cost be taken into account. Hence, no assessment is undertaken for the Financial Evaluation Criteria 9 and 10 as part of the shortlisting of options. The shortlisted options which meet compliance in the shortest possible time and perform better than other alternatives have been appraised across these criteria and the analysis is presented in the Financial Case chapter.
3.4 Primary Critical Success Factor Test
3.4.1 Non‐charging Measures Considering the evidence regarding sources of local exceedances, B&NES has considered a wide range of deliverable non‐charging options. It is not anticipated that any of these measures in isolation could achieve compliance in the required timescales, but at this stage, with such a lengthy list, it is difficult to propose plausible packages of these measures.
Each measure on the long list of non‐charging measures was assessed against the primary CSF: deliver compliance with NO2 air quality Limit Values and Air Quality Objectives in the shortest possible timescales. This requirement is also reflected in the primary and secondary spending objectives of the Clean Air Plan (section 2.4). Therefore, any options which were not deemed to be deliverable by 2021 were discounted from this initial very long list of non‐charging options. It is worth noting that many of the non‐charging options discounted as possible interventions for this Plan will continue to be considered as part of the long‐term air quality strategy for the city within the Air Quality Action Plan or through other suitable projects.
Following the application of the primary CSF, the following long list of non‐chargeable options were considered as possible interventions for this Plan:
Parking
Restrict residents parking permits to one car per household within AQMA
Implement reduced residents’ parking permit cost for low emission vehicles
Widen residents parking zones to stop commuter parking on the outskirts
Implement parking permit system in residential areas for visitors/commuters to city (alongside RPZs)
Encourage car sharing by providing priority parking areas for those sharing their ride
Reduce long stay commuter parking capacity in the city centre
Increase parking prices in city centre to discourage car trips
Reduce parking spaces in city centre (on and/or off street)
Introduce differential car parking charges based on vehicle fuel type, to discourage polluting vehicles and promote ULEV
Review residents' parking scheme zoning structure and hours of operation, and implement changes as appropriate
Review operation of central area zones to reduce parking for non‐residents and implement changes as appropriate

45
Increase the number and usage of existing VMS signs to provide information about parking and reduce unnecessary trips into the city centre
Taxis and Private Hire Vehicles
Promote low emission vehicles for taxi work, through taxi licensing
Targeted Hackney carriage/private hire investment incentive scheme
Public information
Deliver Bath air quality publicity campaign
Use variable message signs to promote air quality improvement messages
Provide an air quality smart phone app: issue warnings when levels are at or approaching harmful concentrations and encourage action to reduce
Public Transport
Promote smart ticketing and existing BathRider multi operator ticket
Implement public transport route improvements including bus priority, passenger information and waiting facilities (could target particular routes or demographics)
Introduce a revised TRC mandating that buses meet the Euro VI emissions standard
Introduce cheaper bus fares for groups (it's more expensive for multiple people to use the bus than park the car)
Introduce mandatory compliance (Euro 4 petrol, Euro 6 Diesel) for buses, taxis and private hire to access bus lanes/franchise routes
Traffic Management
Replace experimental TRO for bus lane on London Road with permeant TRO
Introduce traffic gating (soft including real time traffic management system)
Implement traffic free street trials. To demonstrate how we could reduce dependence on car use
Introduce targeted traffic management or improved bus priority on A367 Wells Road
Extend and enforce a 20mph zone within the city to reduce vehicle emissions
Disincentivise drivers from using the trunk road
Introduce car share lanes/use of existing bus lanes by high occupancy vehicles
Private Vehicles
Expansion of car club network in Bath
Introduce local investment incentive scheme for private vehicles
Promote car sharing through pilot of smartphone application
Active Transport Modes
Provide additional cycle parking across the city centre in visible locations and pilot a management scheme to improve proper usage of cycle parking
Extend walking and cycling priority schemes and encourage greater modal shift. Provide a safer environment for cycling and walking
Replace bus priority infrastructure with cycle priority infrastructure
Introduce electric cycle hire to the city
Electric Cars/Low Emissions Vehicles
Continue installation of electric car charging points in off street car parks and extend to on street
Encourage car club operator to introduce electric cars (including family‐sized EVs)
Encourage car hire operators to introduce electric cars/vans
Require contractors operating fleets on Council business to use low emission vehicles
Coaches
Restrict coach vehicles from entering the city centre in peak periods
Provide a coach park outside the city centre

46
Restrict Access for Certain Vehicles
Introduce an AM peak prohibition for non‐compliant vehicles (would need to be linked to concessionary travel passes etc for low income areas)
Prohibit diesel cars (or other vehicles, based on level of contribution to problem) from the city centre
Include Sunset period to exempt Euro 5 diesel vehicles to enable longer for upgrades
Freight and Deliveries
Promote greater use of low emission delivery services and 'Last mile' freight/post schemes
Promote use of low emission vehicles for freight, refuse, recycling and delivery services, where possible
Review existing delivery hours restrictions for businesses in Bath city centre and amend where beneficial and viable
Behaviour Change
Implement advisory or mandatory engine switch off/anti‐idling zones
Extend the current Business engagement scheme to encourage employers to promote sustainable transport through promotion of Employers Travel Forum and adoption of Travel Plans
3.4.2 Charging Measures
3.4.2.1 Delivery Timescales for Charging Options
The stages of the project leading up to, and including, full implementation are listed below. It is assumed that these tasks would start in early 2019. The time anticipated for some elements is dependent on the number of camera locations required for the CAZ (though not the class of CAZ) whilst other elements are common to all options. This is indicated in brackets.
Refinement of ANPR camera locations (dependent on CAZ option)
Non‐Site Specific Detailed Design (common to all CAZ options)
o Technical specification for ANPR cameras and back office system
o Standard designs for ANPR installations (e.g. mountings, pillars, cabinets, cabling)
o Standard designs for signage and publicity
Site Specific Detailed Design (dependent on CAZ option)
o Site visits to confirm camera/signage position, obstructions, etc
o General arrangement drawings (and other information) for each ANPR location
o General arrangement drawings (and other information) for signage
o Source and location of power supplies
o Consultation, approvals and consents
Tendering and Procurement (common to all CAZ options)
o Production of contract documents
o Production of tender package and supporting information
o Tender period (assuming OJEU single stage tender approach)
o Tender assessment and shortlisting
o Identification of preferred bidder
o Council approval of preferred bidder(s) and proposed solution
o Contract award
Implementation (dependent on CAZ option)
o Installation of cameras
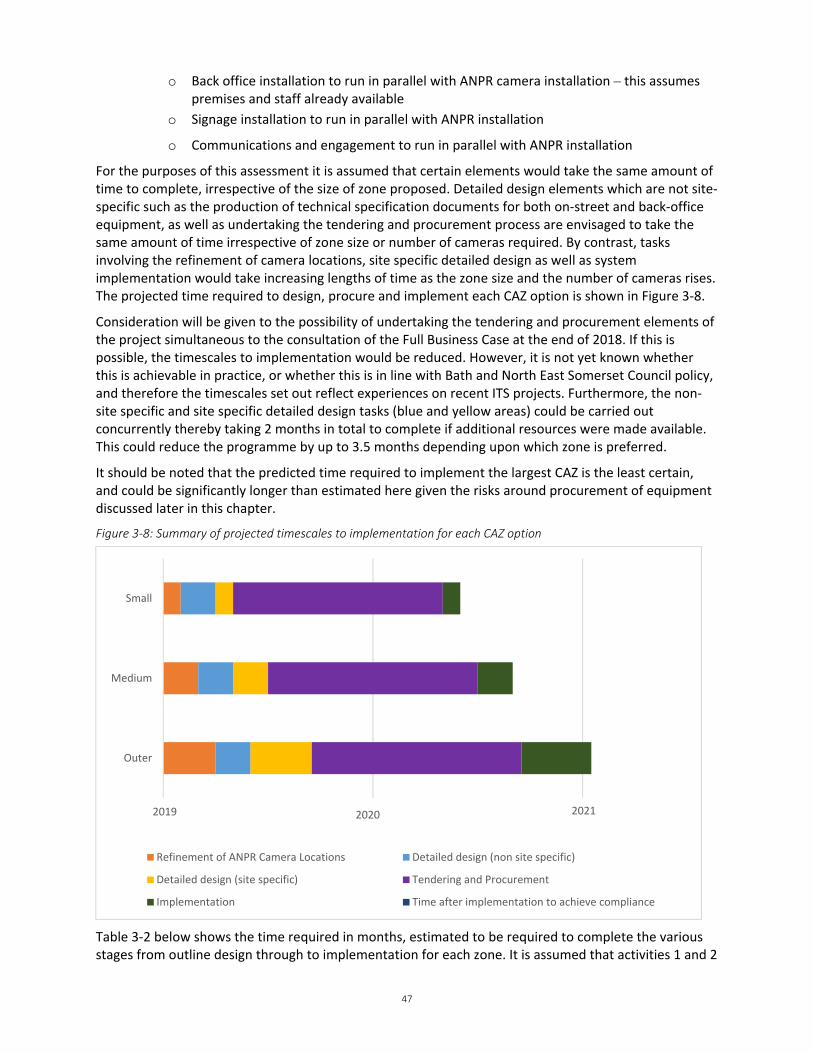
47
o Back office installation to run in parallel with ANPR camera installation – this assumes premises and staff already available
o Signage installation to run in parallel with ANPR installation
o Communications and engagement to run in parallel with ANPR installation
For the purposes of this assessment it is assumed that certain elements would take the same amount of time to complete, irrespective of the size of zone proposed. Detailed design elements which are not site‐specific such as the production of technical specification documents for both on‐street and back‐office equipment, as well as undertaking the tendering and procurement process are envisaged to take the same amount of time irrespective of zone size or number of cameras required. By contrast, tasks involving the refinement of camera locations, site specific detailed design as well as system implementation would take increasing lengths of time as the zone size and the number of cameras rises. The projected time required to design, procure and implement each CAZ option is shown in Figure 3‐8.
Consideration will be given to the possibility of undertaking the tendering and procurement elements of the project simultaneous to the consultation of the Full Business Case at the end of 2018. If this is possible, the timescales to implementation would be reduced. However, it is not yet known whether this is achievable in practice, or whether this is in line with Bath and North East Somerset Council policy, and therefore the timescales set out reflect experiences on recent ITS projects. Furthermore, the non‐site specific and site specific detailed design tasks (blue and yellow areas) could be carried out concurrently thereby taking 2 months in total to complete if additional resources were made available. This could reduce the programme by up to 3.5 months depending upon which zone is preferred.
It should be noted that the predicted time required to implement the largest CAZ is the least certain, and could be significantly longer than estimated here given the risks around procurement of equipment discussed later in this chapter.
Figure 3‐8: Summary of projected timescales to implementation for each CAZ option
Table 3‐2 below shows the time required in months, estimated to be required to complete the various stages from outline design through to implementation for each zone. It is assumed that activities 1 and 2
0 12 24
Outer
Medium
Small
Refinement of ANPR Camera Locations Detailed design (non site specific)
Detailed design (site specific) Tendering and Procurement
Implementation Time after implementation to achieve compliance
20202019 2021
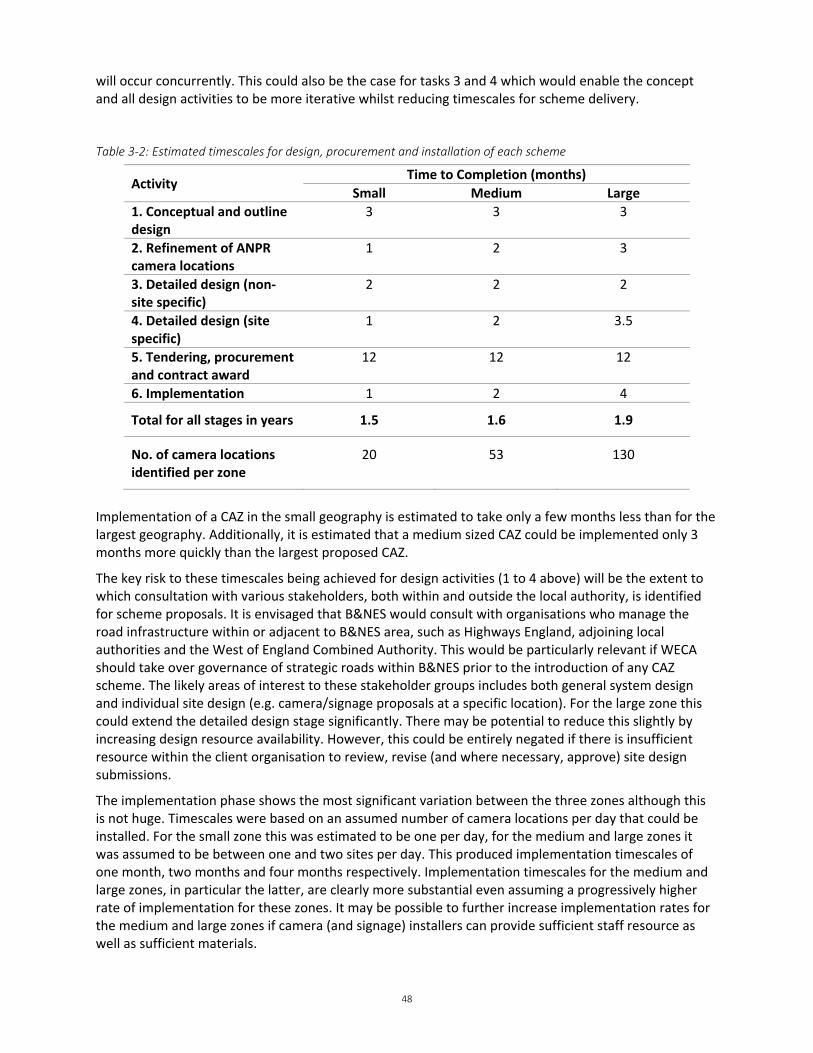
48
will occur concurrently. This could also be the case for tasks 3 and 4 which would enable the concept and all design activities to be more iterative whilst reducing timescales for scheme delivery. Table 3‐2: Estimated timescales for design, procurement and installation of each scheme
Activity Time to Completion (months)
Small Medium Large
1. Conceptual and outline design
3 3 3
2. Refinement of ANPR camera locations
1 2 3
3. Detailed design (non‐site specific)
2 2 2
4. Detailed design (site specific)
1 2 3.5
5. Tendering, procurement and contract award
12 12 12
6. Implementation 1 2 4
Total for all stages in years 1.5 1.6 1.9
No. of camera locations identified per zone
20 53 130
Implementation of a CAZ in the small geography is estimated to take only a few months less than for the largest geography. Additionally, it is estimated that a medium sized CAZ could be implemented only 3 months more quickly than the largest proposed CAZ.
The key risk to these timescales being achieved for design activities (1 to 4 above) will be the extent to which consultation with various stakeholders, both within and outside the local authority, is identified for scheme proposals. It is envisaged that B&NES would consult with organisations who manage the road infrastructure within or adjacent to B&NES area, such as Highways England, adjoining local authorities and the West of England Combined Authority. This would be particularly relevant if WECA should take over governance of strategic roads within B&NES prior to the introduction of any CAZ scheme. The likely areas of interest to these stakeholder groups includes both general system design and individual site design (e.g. camera/signage proposals at a specific location). For the large zone this could extend the detailed design stage significantly. There may be potential to reduce this slightly by increasing design resource availability. However, this could be entirely negated if there is insufficient resource within the client organisation to review, revise (and where necessary, approve) site design submissions.
The implementation phase shows the most significant variation between the three zones although this is not huge. Timescales were based on an assumed number of camera locations per day that could be installed. For the small zone this was estimated to be one per day, for the medium and large zones it was assumed to be between one and two sites per day. This produced implementation timescales of one month, two months and four months respectively. Implementation timescales for the medium and large zones, in particular the latter, are clearly more substantial even assuming a progressively higher rate of implementation for these zones. It may be possible to further increase implementation rates for the medium and large zones if camera (and signage) installers can provide sufficient staff resource as well as sufficient materials.

49
However, it is not known to what extent, if any, existing systems providers could achieve this, particularly if they are also simultaneously undertaking CAZ installations for other local authorities across the UK. Given the large number of cameras and associated mountings, housings and other equipment proposed for the medium and large zones, the ability of such hardware to be manufactured at the desired rate may also be a determining factor, particularly if there is simultaneous demand from other local authorities implementing CAZ areas.
There would also be other practical limitations to the rate at which implementation could be achieved, such as the need to accommodate other (i.e. non‐CAZ) streetwork activities and to ensure that disruption to vehicles, pedestrians and others was minimised during CAZ works. Restricted hours working and streetworks embargos over the Christmas period may well be stipulated for example, which would impact upon delivery timescales. The ability of third‐party service providers such as power and communications network services to deliver at an equal rate throughout the delivery phase also needs to be accounted for when considering how rapidly implementation could be achieved.
In comparison with site installation, provision of back office systems are not expected to be a determining factor, assuming control centre premises and staff are already in place. Council IT hardware and network capacity will also require testing to satisfy any system supplier during Acceptance Testing. It is assumed that any new system would, as a minimum, require the assistance of B&NES IT department to enable the establishment of remote ‘dial in’ access via a Virtual Private Network (VPN), across the Councils firewall or such like. IP Networking would also be required and delays could arise during implementation should the Council be under resourced in this area or staff have alternative workload priorities.
3.4.2.2 Timescales to Compliance
In each year, the number of existing monitoring sites in Bath not expected to achieve compliance following implementation of each charging CAZ option has been calculated, and is summarised in Figure 3‐8, Figure 3‐9 and Figure 3‐10 alongside the reference case (no CAZ). Full details of the assessment of timescales to compliance are provided in Annex C. The figure on each bar indicates the number of monitoring sites predicted to remain in exceedance of the legal limits. Where compliance is predicted to be fully achieved this is indicated with a ‘0’.
Figure 3‐9: Number of Monitoring Sites Not Expected to Achieve Compliance with a Small CAZ
4
3
2
1
0
3
2
1
0 0
1
0 0 0 00 0 0 0 00 0 0 0 00
1
2
3
4
5
2021 2022 2023 2024 2025Uncompliant Monitoring Sites
Reference Case Type A Type B Type C Type D

50
Figure 3‐10: Number of Monitoring Sites Not Expected to Achieve Compliance with a Medium CAZ
Figure 3‐11: Number of Monitoring Sites Not Expected to Achieve Compliance with a Large CAZ
The assessment demonstrates that compliance is expected to be achieved in all locations by 2025 without a CAZ (reference case scenario). Prior to 2025, only four monitoring sites are not expected to reach compliance without any intervention. The maximum projected NO2 concentration at any of the monitoring sites is presented in Figure 3‐12, Figure 3‐13 and Figure 3‐14 for each year and for the implementation of each charging CAZ option as well as the reference case (no CAZ), with small, medium and large CAZs, respectively.
4
3
2
1
0
3
2
1
0 0
1
0 0 0 0
1
0 0 0 00 0 0 0 00
1
2
3
4
5
2021 2022 2023 2024 2025Uncompliant Monitoring Sites
Reference Case Type A Type B Type C Type D
4
3
2
1
0
3
2
1
0 0
1
0 0 0 0
1
0 0 0 00 0 0 0 00
1
2
3
4
5
2021 2022 2023 2024 2025Uncompliant Monitoring Sites
Reference Case Type A Type B Type C Type D

51
It should be noted that this analysis is high level, and relies on a number of assumptions, including that any changes in emissions will produce equivalent changes in concentrations. The modelling undertaken is suitable for this stage of assessment, and importantly provides a good indication of which schemes are most likely to achieve compliance within the required timescales. However, more detailed modelling will be required (within the OBC) to confirm in more detail the level of improvement these schemes could achieve.
Figure 3‐12: Maximum projected nitrogen dioxide concentration at any of the monitoring sites with a Small CAZ

52
Figure 3‐13: Maximum projected nitrogen dioxide concentration at any of the monitoring sites with a Medium CAZ
Figure 3‐14: Maximum projected nitrogen dioxide concentration at any of the monitoring sites with a Large CAZ

53
The assessment indicates that compliance is expected to be achieved in 2025 if no measures are implemented. Further, the analysis illustrates that the legal obligation will:
be almost met in 2024 with no CAZ;
not be met with a Class A CAZ until 2024;
will almost be met in 2021 with a Class B small, medium or large CAZ;
will be achieved in 2021 by a Class C small CAZ;
will almost be met in 2021 by Class C medium and large CAZs; and
will be achieved in 2021 by Class D small, medium and large CAZs.
The assessment has demonstrated that a Class D small, medium and large CAZ are all predicted to achieve compliance in 2021 at all monitoring sites. The assessment has also demonstrated that Class B small, medium and large CAZ, and Class C medium and large CAZ are all predicted to achieve compliance in 2021 at all monitoring sites except one. This site is to the south of Bath city centre, along the A367. A Class C small CAZ is expected to bring compliance to all locations in 2021.
This may seem counter‐intuitive, as the small CAZ does not cover such a large geographical area, and so would be expected to have a smaller impact on the exceedances than the medium or large. However, in the baseline case (without a CAZ) the A367 arm of the A367/A36 Churchill Gyratory is over capacity (i.e. there is more traffic demand than can get through the junction, causing queueing). In the medium and large CAZ scenarios, the cross flow on the A36 decreases due to the CAZ, allowing the capacity of the A367 arm to increase. This results in an increase in traffic and leads to a greater exceedance of nitrogen dioxide at this location. However, with the small CAZ not all river crossing points are included within the charging zone, which leads to re‐routing away from the A367 where the CAZ charge would be implemented, and consequently a reduction in concentrations. In summary, the size of the small CAZ means it is more effective at diverting trips away from this problem location.
With the implementation of these CAZs, the nitrogen dioxide concentration at this single uncompliant monitoring site is estimated to exceed the limit value by up to 0.7 µg/m3. Such an exceedance is considered to be within the realm of uncertainty of the assessment and any additional non‐charging measures will help to reduce this concentration. The most successful CAZ options in bringing forward the timescale are thus considered to be Class B, C and D small, medium and large CAZ.
The implementation of a Class D CAZ appears to provide the most certainty that compliance would be met in 2021, although a Class B or C may have sufficient impact. In addition, inclusion of all vehicle types would spread the requirement to change vehicles or behaviour across a wider proportion of society, requiring a lesser level of change within each group of vehicles to achieve the same overall level of air quality improvement (i.e. fewer buses/private hire/hackney carriages/good vehicles would need to alter their journeys or vehicles types, if a proportion of private car drivers also amended their journeys to improve air quality). Given the difficulties that drivers of all vehicle types may face in finding sufficient resources to comply with the vehicle standards of a CAZ, this would add certainty to the delivery of the air quality improvement within the required timescales. It would also maximise the possibility of mitigating adverse impacts of the CAZ through exemptions, discounts or sunset periods for those groups disproportionately affected by the scheme, without delaying when compliance can be achieved.
3.4.2.3 Summary
Following the test against the primary CSF, the following long list of chargeable options are considered as appropriate interventions for this Plan:
Small geography, CAZ Class B – charging
Small geography, CAZ Class C – charging

54
Small geography, CAZ Class D – charging
Medium geography, CAZ Class B – charging
Medium geography, CAZ Class C – charging
Medium geography, CAZ Class D – charging
Large geography, CAZ Class B – charging
Large geography, CAZ Class C – charging
Large geography, CAZ Class D – charging
The CAZ B option is maintained within the shortlist although the technical assessment indicates that
there would still be a single exceedance in 2021, when a CAZ C and D are expected to achieve
compliance. The remaining exceedance with a Class B CAZ of any size is very minor and is considered to
be within the realm of uncertainty of the assessment undertaken. More detailed analysis is therefore
required to determine that a Class B is not sufficient, and it cannot be ruled out at this point within the
process.
3.5 Conceptual Packages Until this point the charging and non‐charging measures have been considered separately from each other in order to refine the lists to a more manageable length. However, it is likely that a package of multiple measures would achieve compliance quicker than single measures in isolation. Hence it is necessary to consider how these long lists of measures might be logically brought together into packages. At this stage, there is still some further refinement of the long lists to be completed against the secondary CSFs and so the packages presented here are ‘conceptual’. More clearly defined packages are presented in section 3.7 following further analysis of the options.
Evidence has been presented (in section 3.2.3) to demonstrate that either a charging zone or access restrictions are predicted to be required to deliver compliance in the shortest time possible. However, it is anticipated that the impact of a charging zone or access restrictions could be further enhanced by simultaneous implementation of non‐charging measures to either encourage further behaviour change, ensure that the anticipated impacts are realised (by enabling change) or to mitigate any unwanted or negative impacts. It is therefore necessary to consider the possibility that a lower class of CAZ combined with a suitable selection of non‐charging measures could deliver compliance in the same timeframe as a higher class of CAZ. However, the delivery of multiple non‐charging measures alongside a CAZ would require a greater level of resource, and inclusion of too many, or too onerous, non‐charging measures within a package could affect the implementation timescales
The packages presented below are based around the list of charging measures which comply with the Primary CSF. As discussed in the section 3.4.2.2, the CAZ B option is maintained within the shortlist although the technical assessment indicates that there would still be a single exceedance in 2021, when a CAZ C and D are expected to achieve compliance. The remaining exceedance with a Class B CAZ of any size is very minor and is considered to be within the realm of uncertainty of the assessment undertaken. More detailed analysis is therefore required to determine that a Class B is not sufficient, and it cannot be ruled out at this point within the process.

55
The modelling undertaken to assess the charging options at this stage is high level, and relies on a number of assumptions, including that any changes in emissions will produce equivalent changes in concentrations. The modelling undertaken is suitable for this stage of assessment, and importantly provides a good indication of which schemes are most likely to achieve compliance within the required timescales. However, the exact level of improvement these schemes could achieve is not known at this point, and hence non‐charging measures are included with all charging options within the packages. Further work will be undertaken in the OBC to more accurately determine the impact of both the charging and non‐charging measures, enabling a more refined list of measures to be produced.
Hence, the following conceptual packages of schemes are considered for assessment against the critical success factors;
Small geography, CAZ Class B – charging plus appropriate non‐charging measures
Small geography, CAZ Class C – charging plus appropriate non‐charging measures
Small geography, CAZ Class D – charging plus appropriate non‐charging measures
Medium geography, CAZ Class B – charging plus appropriate non‐charging measures
Medium geography, CAZ Class C – charging plus appropriate non‐charging measures
Medium geography, CAZ Class D – charging plus appropriate non‐charging measures
Large geography, CAZ Class B – charging plus appropriate non‐charging measures
Large geography, CAZ Class C – charging plus appropriate non‐charging measures
Large geography, CAZ Class D – charging plus appropriate non‐charging measures
It is envisaged that a selection of the non‐charging measures would be included within each package which contains a charging scheme.
3.6 Assessment of Long List of Measures This section presents an overview of the options’ assessment against the secondary evaluation criteria, other than criteria 9 and 10, for the reasons outlined previously. Full details of the scoring can be found in Annex A and B.
3.6.1 Non‐charging Measures The number of non‐charging options at this stage includes 50 individual measures. It is not considered feasible for any more than a small number of these to be delivered simultaneously within the required timescales, with or without a charging zone. Hence, in order to include non‐charging measures within a package of measures the list must be refined to only include those that are most likely to offer benefit to the Plan (either through improving air quality or offsetting potential negative impacts of the scheme), and are implementable within the required timescales. The evaluation criteria have been used to sift through the list and produce a refined list of options which can be assessed as part of a package of measures either with or without charging options. The primary CSF has already been applied to the very long list of non‐charging measures to discount those not deliverable by 2021, in compliance with the required legal test. The primary CSF is used again in this secondary analysis to indicate of the level of impact of the measure in terms of air quality improvements, as a contribution towards achieving compliance.
A detailed assessment of the non‐charging measures against the evaluation criteria is difficult due to the number of measures currently on the list (50) and the level of detail available for each measure. Instead a qualitative assessment has been undertaken to provide a score against each evaluation criteria.
A record of the scoring of each option, and the reasons for discounting them or otherwise, is provided in Annex A. It should be noted that some non‐charging measures have been maintained on the list despite their anticipated minimal impact on air quality, since they represent a way to mitigate other undesirable effects of charging/access restriction measures.

56
Following the assessment against the evaluation criteria, the short list of non‐charging measures is therefore; Provide additional cycle parking across the city centre in visible locations and pilot a management
scheme to improve proper usage of cycle parking
Extend walking and cycling priority schemes and encourage greater modal shift. Provide a safer environment for cycling and walking
Implement reduced residents’ parking permit cost for low emission vehicles
Expand proposal (included in Go Ultra Low package) to introduce electric cycle hire to the city
Pilot car sharing priority parking areas
Promote low emission vehicles for taxi work, through taxi licensing policy changes
Promote car sharing through pilot of smartphone application
Expansion of car club network in Bath
Implement public transport route improvements including bus priority, passenger information and waiting facilities (target particular routes or demographics)
Use variable message signs to promote air quality improvement messages. Potentially mobile and real‐time responsive signs
Increase the number or usage of existing VMS signs to provide information about parking and reduce unnecessary trips into the city centre
Targeted traffic management or improved bus priority on A367 Wells Road
Sunset period to exempt Euro 5 diesel vehicles to enable longer for upgrades
Replace experimental TRO for bus lane on London Road with permanent TRO
3.6.2 Charging Measures The long list of charging measures which comply with the primary CSF have been scored against secondary CSFs to determine their likely impact. The scoring is determined through a series of quantitative and qualitative assessments, detail of which is provided in Annex D. The final scoring of each charging measure is shown in Table 3‐3.
Note that whilst indicative scores are provided for the evaluation criteria ‘likelihood of revenue equating to implementation/operational costs’ and ‘upfront capital required for scheme’, these scores are only provided for presentational purposes. They do not influence the weighted scoring and selection of shortlisted options. Please see the Financial Case chapter for analysis and commentary related to these criteria, for the shortlisted options only.
The highest score available in the scoring system is 81. Any option which scores more than 75% of the total possible mark, a score of 61 or higher, has been accepted as feasible and will be taken forward for more detailed assessment within the OBC. A full summary of the scoring of charging measures against all CSFs is provided in Annex B. The three highest scoring options are a small geography with Class B, C and D. The small zone provides the following benefits, over a large or medium geography:
It is expected to achieve compliance in the same timescales as a medium or large zone (by 2021)
It minimises the inclusion of residential areas within the zone, therefore minimising impacts on vulnerable groups. This is also expected to maximise public acceptability of the zone since fewer households will be affected.
It minimises the number of businesses included within the zone, and therefore reduces the risk of adverse impacts on the local economy
It only includes areas with a known, and evidenced, air quality problem (i.e. within the AQMA)
It requires the least amount of infrastructure to be implemented on street, including signage, road markings and ANPR cameras. This reduces the risk that suppliers may not be able to deliver within the required timescales.
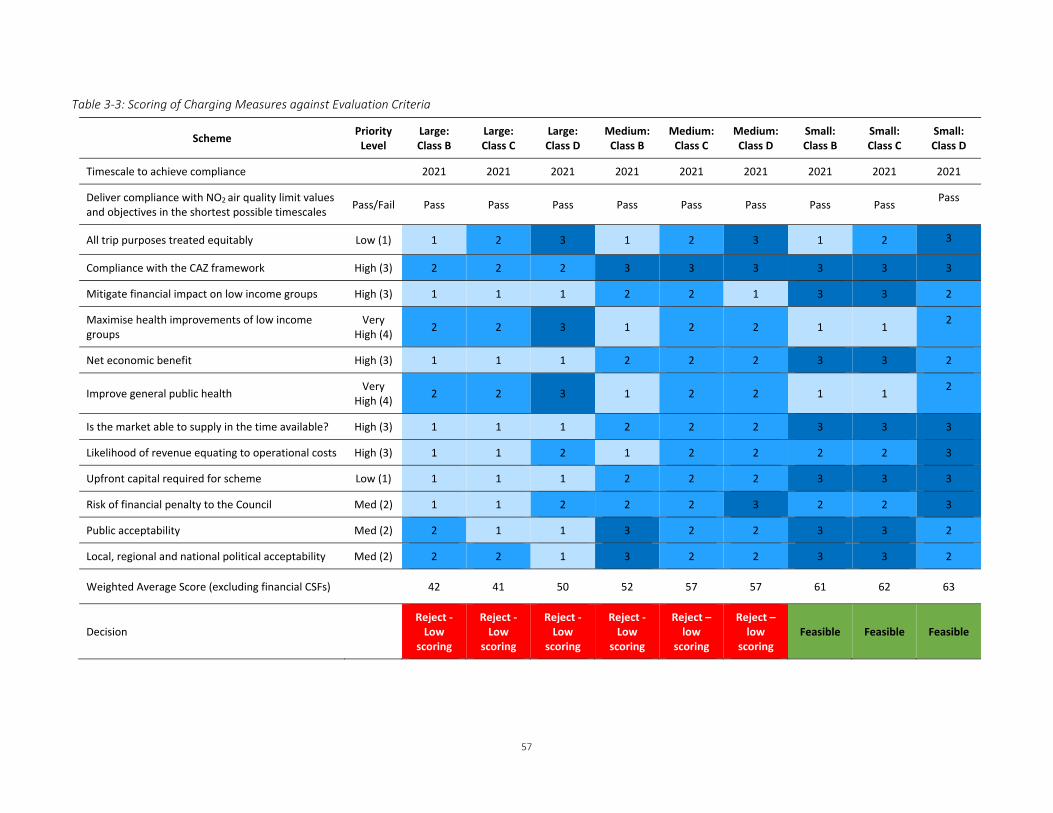
57
Table 3‐3: Scoring of Charging Measures against Evaluation Criteria
Scheme Priority Level
Large: Class B
Large: Class C
Large: Class D
Medium: Class B
Medium: Class C
Medium: Class D
Small: Class B
Small: Class C
Small: Class D
Timescale to achieve compliance 2021 2021 2021 2021 2021 2021 2021 2021 2021
Deliver compliance with NO2 air quality limit values and objectives in the shortest possible timescales
Pass/Fail Pass Pass Pass Pass Pass Pass Pass Pass Pass
All trip purposes treated equitably Low (1) 1 2 3 1 2 3 1 2 3
Compliance with the CAZ framework High (3) 2 2 2 3 3 3 3 3 3
Mitigate financial impact on low income groups High (3) 1 1 1 2 2 1 3 3 2
Maximise health improvements of low income groups
Very High (4)
2 2 3 1 2 2 1 1 2
Net economic benefit High (3) 1 1 1 2 2 2 3 3 2
Improve general public health Very
High (4) 2 2 3 1 2 2 1 1
2
Is the market able to supply in the time available? High (3) 1 1 1 2 2 2 3 3 3
Likelihood of revenue equating to operational costs High (3) 1 1 2 1 2 2 2 2 3
Upfront capital required for scheme Low (1) 1 1 1 2 2 2 3 3 3
Risk of financial penalty to the Council Med (2) 1 1 2 2 2 3 2 2 3
Public acceptability Med (2) 2 1 1 3 2 2 3 3 2
Local, regional and national political acceptability Med (2) 2 2 1 3 2 2 3 3 2
Weighted Average Score (excluding financial CSFs) 42 41 50 52 57 57 61 62 63
Decision Reject ‐
Low scoring
Reject ‐ Low
scoring
Reject ‐ Low
scoring
Reject ‐ Low
scoring
Reject – low
scoring
Reject – low
scoring Feasible Feasible Feasible

58
3.6.3 Way Forward The assessment of long list of charging and non‐charging measures against the evaluation criteria has provided a short list of both charging and non‐charging measures which can be combined into packages to take forward for further assessment. A total of 14 non‐charging measures and 3 charging measures remain on the shortlist.
The assessment demonstrates that the most successful charging measures across both primary and secondary CSFs are the small Class B, C and D charging options. That said, their performance may be enhanced further by supplementing these options with relevant non‐charging measures, particularly those which do not duplicate effort. This approach has been adopted in order to refine the conceptual packages of measures presented in 3.5.
3.7 Shortlisted Options Based on the assessment of options presented earlier in this Chapter and the detailed scoring presented in Annexes A and B, this section presents the details of the shortlisted options. These options along with the reference case will be appraised in greater detail as part of the Outline Business Case and Full Business Case. A logic map is provided in Annex E to capture the impacts of the proposed measures within the shortlisted packages.
The CAZ B option is maintained within the shortlist although the technical assessment indicates that there would still be a single exceedance in 2021, when a CAZ C and D are expected to achieve compliance. The remaining exceedance with a Class B CAZ of any size is very minor and is considered to be within the realm of uncertainty of the assessment undertaken. More detailed analysis is therefore required to determine that a Class B is not sufficient, and it cannot be ruled out at this point within the process.
The modelling undertaken to assess the charging options at this stage is high level, and relies on a number of assumptions, including that any changes in emissions will produce equivalent changes in concentrations. The modelling undertaken is suitable for this stage of assessment, and importantly provides a good indication of which schemes are most likely to achieve compliance within the required timescales. However, the exact level of improvement these schemes could achieve is not known at this point, and hence non‐charging measures are included with all charging options within the packages. Further work will be undertaken in the OBC to more accurately determine the impact of both the charging and non‐charging measures, enabling a more refined list of measures to be produced within each package.
3.7.1 Option 1 – Benchmark option JAQU’s Option Appraisal Guidance identifies the need to establish a benchmark option that reflects a charging CAZ only. The benchmark needs to provide confidence that it is the lowest class required to achieve compliance in shortest possible timescales. The benchmark option represents an important tool for defining what the shortest possible timescale is and provides a comparator against which other policy options can be compared. Within this context, and following discussion with JAQU, the focus of this option will be to introduce charging for Class C at small geography level.

59
3.7.2 Option 2 – Small Class B charging option with complementary non‐charging interventions
The focus of this option will be to introduce charging for Class B at small geography level. A Class B zone would apply a charge to buses, coaches, taxis, private hire vehicles and heavy goods vehicles (HGVs) which are pre‐Euro 4 petrol and pre‐Euro 6 diesel. In addition, this option will also include the following non‐charging options:
Provide additional cycle parking across the city centre in visible locations and pilot a management scheme to improve proper usage of cycle parking (abatement)
Extend walking and cycling priority schemes and encourage greater modal shift. Provide a safer environment for cycling and walking (abatement)
Implement reduced residents’ parking permit cost for low emission vehicles (abatement)
Promote low emission vehicles for Hackney carriages/private hire through review of taxi licensing policy (abatement)
Implement public transport route improvements including bus priority, passenger information and waiting facilities (target particular routes or demographics) (abatement)
Use variable message signs to promote air quality improvement messages. Potentially mobile and real‐time responsive signs (abatement)
Increase the number or usage of existing VMS signs to provide information about parking and reduce unnecessary trips into the city centre (abatement)
Targeted traffic management or improved bus priority on A367 Wells Road (abatement)
Sunset period to exempt Euro 5 diesel vehicles to enable longer for upgrades (mitigation)
Replace experimental TRO for bus lane on London Road with permanent TRO (abatement)
3.7.3 Option 3 – Small Class C charging option with complementary non‐charging interventions
The focus of this option will be to introduce charging for Class C at small geography level. A Class C zone would apply a charge to buses, coaches, taxis, private hire vehicles, heavy goods vehicles (HGVs) and light good vehicles (LGVs) which are pre‐Euro 4 petrol and pre‐Euro 6 diesel. In addition, this option will also include the same non‐charging options as option 2.
3.7.4 Option 4 – Small Class D charging option with complementary non‐charging interventions
The focus of this option will be to introduce charging for Class D at small geography level. A Class D zone would apply a charge to buses, coaches, taxis, private hire vehicles, heavy goods vehicles (HGVs), light good vehicles (LGVs) and cars which are pre‐Euro 4 petrol and pre‐Euro 6 diesel. This option will also include the same non‐charging options as option 2 and 3, with the exception of ‘targeted traffic management or improved bus priority on A367 Wells Road’, which will not be included within this package. In addition to the non‐charging options mentioned in options 2 and 3, this option will also include the following non‐charging options:
Expand proposal (included in Go Ultra Low package) to introduce electric cycle hire to the city (abatement)
Pilot car sharing priority parking areas (abatement)
Expansion of car club network in Bath (abatement)

60
3.7.5 Proposed Amendments to Small Clean Air Zone Based on the assessment work undertaken to date, and ongoing discussions with key stakeholders within the Council, some amendments to the small zone have been proposed for the next stage of assessment. These revisions are primarily focused on preventing re‐routing of trips around the zone which could result in worsened air quality outside of the zone, or undesirable congestion issues. The latest revision to the small zone is shown below in Figure 3‐15
Figure 3‐15: Proposed amendments to small Clean Air Zone

61
Commercial Case
4.1 Introduction JAQU’s Inception package guidance requires the Commercial case of the SOC to provide an assessment of relevant current procurement arrangements, likely services required and likely attractiveness of the project to potential service providers.
The predominant element of infrastructure in all packages of measures selected to be taken forward to the Outline Business Case is the installation of an ANPR system. As such, the procurement of ANPR and associated systems for all packages has been dealt with simultaneously.
Bath and North East Somerset Council and its partners have considerable expertise in the procurement of similar technologies for Bath and the surrounding area. Examples of recent similar technology procurements in Bath include an ANPR enforcement system incorporating cameras located at several bus gate locations across the city as well as some joint working with Avon & Somerset Police ANPR camera network. A procurement exercise for a new ANPR system at Bath’s largest Park and Ride site (incorporating a new coach park) will occur imminently.
Bath and North East Somerset Council has also undertaken several procurement exercises for provision of various management systems and CCTV monitoring cameras at their relocated integrated CCTV Operations Centre in Bath and back up control room in Keynsham. Both facilities afford integrated CCTV management whilst the larger Bath operations room, in addition to transport, social and crime network monitoring has a number of management services, which have been consolidated into one fully‐coordinated facility. The information provided within this chapter is informed by Bath and North East Somerset Council’s experience.
4.2 Possible Routes to Procurement The most appropriate procurement approach for the selected Plan is dependent upon several factors, namely:
The final measures included within the Plan (non‐charging and/or charging)
The type of system to be implemented (centralised, localized or hybrid);
The extent to which the technical and operational solution is specified (e.g. whether fully specified or open to market proposals as a performance‐based solution);
The method by which it is proposed to operate (“in‐house” or third‐party service provider);
Ongoing maintenance and development;
Whether it is to be designed, implemented and operated by a single service provider or by multiple providers; and
Timescales for delivery.
There are four key procurement routes available:
Local authority tendering through an Approved List (shortlist) of invited suppliers;
Through existing City Council Frameworks;
Open tender through the Official Journal of the European Union (OJEU); and
Through Crown Commercial Services (CCS), the UK Government’s professional procurement service for the public sector.

62
Given the scale of CAZ implementation, it is not thought likely that the procurement value of any element of this work will fall under that required for the Approved List procurement approach, so this leaves either the existing frameworks, OJEU or CCS processes as options for procurement.
4.2.1 Existing Council Frameworks There are several currently active frameworks established by Bath and North East Somerset Council for highways design, installation and maintenance services. These frameworks offer the advantage of being readily available to provide “fast track” procurement of the various services required for the Plan. They are suitable for the design and specification elements of the Plan and implementation of on‐road and roadside infrastructure (such as signage, road markings and physical changes to road layouts), back office CAZ technology and ongoing maintenance of the CAZ roadside infrastructure. They can also be used for the communications network elements and for on‐street electrical power supplies.
4.2.2 OJEU Tendering The OJEU tender process can take several forms ‐ open, restricted, competitive dialogue, competitive procedure with negotiation or innovation partnership. Given the nature of the work proposed for this Plan, it is expected that only open or restricted procedures would apply.
For implementation of the CAZ, OJEU tendering is considered a preferable option to that of using the CCS Framework (see below). However, B&NES would prefer to utilise existing framework contracts which are in place to reduce workload and timescales required whilst building upon existing established infrastructure.
It would be possible to procure the delivery of the selected non‐charging measures which relate to traffic management or fleet upgrades through an OJEU process should the existing B&NES Council frameworks be insufficient.
4.2.3 Tendering via Crown Commercial Services Central Government has existing central framework contracts, in place most prominently the CCS, which could be used to purchase back office systems and ANPR cameras. Central Government would not consider setting up any other frameworks for this purpose.
CCS offers a number of frameworks under which procurement of goods and services can be made. Of particular relevance to this Plan is the Traffic Management Technology 2 (RM1089) Agreement, more commonly known as the “TMT2 Framework”. There are a number of Lots within TMT2 that could be used for the various proposed Plan elements. These include:
Lot 2 ‐ Traffic Monitoring and Traffic Enforcement Cameras
Lot 6 ‐ Environmental Monitoring Systems (fixed and mobile)
Lot 11 ‐ Traffic Management Communications
Lot 12 ‐ Traffic Management Professional Services
Lot 13 ‐ Ancillary Roadside Equipment
Lot 14 ‐ Intelligent Transport Systems (ITS)
One question that the CCS approach raises is whether it is possible under TMT2 to let a single contract to one service provider across a range of CAZ elements, i.e. covering several of these Lots, or whether it would be necessary to undertake a separate procurement exercise for each element that falls with a given Lot. This would obviously have implications for the delivery timescales in requiring more work to carry out procurement; it would also potentially involve multiple suppliers at the implementation and operations stage which could increase the challenge in managing these suppliers.

63
One advantage of using CCS for procurement is that it offers services such as supplier events where local authorities can engage in dialogue with suppliers to communicate their requirements and understand what the market can provide. This also allows suppliers to gain an understanding of what the local authority needs and, crucially, when it needs to be delivered. The other advantage of such activities is that they allow local authorities across the country to come together in a coordinated approach to procurement. It should be noted that JAQU have offered to facilitate joint procurement across multiple local authorities through CCS. This could have considerable cost savings through economies of scale should a large number of local authorities come together for a joint procurement arrangement. However, it may increase delivery risk in needing all authorities to reach mutual agreement on requirements for tendering, which is likely to take more time than if a single authority determined its own requirements.
One other possible limitation of using CCS is that only those suppliers who have secured a place on the CCS framework for the specific Agreement (in this case TMT2) can provide goods and services. Thus, if there is a need or desire to consider any other supplier for any element of the Plan then it would need to be procured by another approach, most likely through OJEU. It has yet to be determined whether the key systems suppliers are able to provide goods and services under TMT2 or via other CCS agreement.
Overall, the CCS is not considered to be the preferred route for procurement of this Clean Air Plan since it may not be sufficiently flexible in terms of available suppliers of delivery timescales. There are a number of existing B&NES framework which can be utilised instead to provide greater certainty.
4.3 Division of Project Elements for Procurement Irrespective of the procurement channel used, there are several areas where procurement could be split or combined depending on the preferred approach. These are:
Design and specification
Communications and engagement
Roadside technology (ANPR cameras)
On‐road infrastructure (signs, road markings, physical changes to the network)
Communications networks (roadside to back office and back office system‐to‐system)
Back office databases and data processing facilities
Back office payment and penalty systems
Operations (staffing, provision of control room facilities
Enforcement/review of non‐payment (e.g. appeals, civil proceedings)
Maintenance and support
Ongoing development (e.g. expansion of CAZ area, back office system functionality)
JAQU has considered three options for the type of CAZ adopted by each local authority:
Centralised system, with one national front end portal and back office for all local authority CAZs
Localised system, with each local authority CAZ having its own charging portal and back office
Hybrid system, with a mixture of national and local elements.
The current JAQU preference is for each authority to employ a hybrid system. In this scenario, Central Government would take responsibility for elements of the back office data processing and payments, and possibly also penalty charge payment. The local authority would adopt all other responsibilities for procurement, implementation and operation.
If this hybrid approach was to be adopted then it is assumed that Central Government would undertake procurement of those elements for which they are responsible, leaving the remaining elements to be procured by each local authority (or collective of authorities) as they see fit.

64
However, B&NES Council already have a back office data processing and payments/penalty charge system in place, which uses ANPR technology with existing bus gate and bus lanes located across the city. It may therefore be more cost effective and time‐efficient to utilise the existing infrastructure which is in place, or undertake a procurement exercise through existing framework arrangements to expand the current system arrangement. If this arrangement was taken forward clearly some form of defined design guidance would be required from JAQU for the local authority to adhere to and follow. It may be more straightforward given the prescribed timescales to adopt a local approach but ensure scheme delivery meets specific criteria so that national sharing of data/connectivity is not precluded in future.
4.4 Summary of Proposed Procurement Approach Table 4‐1 below lists the various design, implementation and operations activities identified above along with the proposed procurement arrangement for each element, assuming adoption of the hybrid approach proposed above. This will be subject to further discussion with JAQU as to the CAZ elements to be procured centrally.
Table 4‐1: Proposed Procurement Approach
Activity Proposed Procurement Route
Traffic Management Existing B&NES Framework
CAZ design and specification Existing B&NES Framework
Communications & Engagement In‐house and existing B&NES Framework
Roadside technology (ANPR cameras) Existing B&NES Framework
On‐road infrastructure (signs, road markings, physical changes to the network)
Existing B&NES Framework or OJEU
Communications networks (roadside to back office and back office system‐to‐system)
Existing B&NES Framework
Back office databases and data processing facilities (excluding DEFRA/DfT elements)
Existing B&NES Framework
Back office payment and penalty systems (excluding DEFRA/DfT elements)
Existing B&NES Framework
CAZ operations (staffing, provision of control room facilities) Existing B&NES Framework
Enforcement/review of non‐payment (e.g. appeals, civil proceedings)
Existing B&NES Framework
Maintenance and support – back office Existing B&NES Framework
Maintenance and support – roadside infrastructure?? Existing B&NES Framework
Ongoing development (e.g. expansion of CAZ area, back office system functionality)
Existing B&NES Framework

65
Given the potential benefits and risks associated with each of these procurement routes it is believed that the most favourable route at this time in order to deliver a scheme including associated infrastructure would be via either:
the award of various specialist works packages utilising existing Council framework contracts
the award of a dedicated works package as a stand‐alone contract under OJEU
a combined option which includes the two routes mentioned above
As previously discussed, the final scheme selected for implementation will influence which of these options is best suited to procure a solution, which meets B&NES quality and cost requirements in a timely manner. It is anticipated that a combined option may offer the optimum solution utilising existing B&NES Council framework contracts where best placed to do so. However, any activities comprising the chosen scheme should be identified at the earliest opportunity where existing contractors could have a resourcing or supply chain issue and consideration given to undertaking a separate OJEU tendering exercise as required.
4.5 Attractiveness and Ability of Suppliers to Deliver In terms of likely attractiveness of the CAZ to suppliers, and their capability to deliver, it is expected that from a purely commercial perspective they will of course wish to be involved given that the technology – both in terms of ANPR cameras and back office systems ‐ is well‐developed, so there is likely to be little in terms of technical development risk to them.
The key question is not necessarily one of attractiveness but of deliverability. This is difficult to answer without first determining a proposed timescale from contract award to completion and clarifying any dependencies, e.g. what elements other suppliers, or the local authority, need to provide or complete in order to maintain the required delivery timescale. This will depend to some degree upon which procurement approach is taken including how many different suppliers are involved and when their services are procured.
Suppliers’ ability to deliver will also depend significantly upon the scale of the proposed Plan in Bath; the larger the scheme, the more technology (and supporting infrastructure such as signage and communications networks) is needed and the more time required to implement. This will also be impacted by the extent of all other Clean Air Plans nationally, as the same suppliers are likely to be engaged to deliver those projects as well. As such, deliverability cannot be considered in isolation for Bath and needs to be evaluated as part of a wider national picture.

66
Financial Case
5.1 Financial Case Evaluation Approach This chapter sets out the overall financial case for the delivery of each of the four shortlisted options identified in section 3.7 of the ‘Economics case’. Whilst following the JAQU guidance outlined in Inception Package document, the approach has been based on a proportional assessment to reflect analysis required at a Strategic Outline Case stage.
The Financial Case evaluation criteria 9 and 10 presented in section 3.3.3, following the legal test set out by the High Court in November 2016 in R (ClientEarth) (NO2) V Secretary of State for Environment Food and Rural Affairs [2016] EWHC 2740 (Admin), were not considered for shortlisting option. That said, the performance of the shortlisted options against these criteria is presented in this Chapter.
In summary, this chapter thus focuses solely on setting out:
Indicative costs for the short list of options
Discussion on existing capital and revenue constraints, including setting out our current cost assessment for each of the shortlisted options
Setting out the current financial situation and available resources, including other funding sources that have been bid for to allow delivery and operations of the intervention and affordability of the scheme
Next steps in order to further develop and refine the financial case, including a more detailed cashflow analysis of costs and funding requirements, including funding requirements from JAQU.
At this stage, the Financial Case presents the current assessment of shortlisted options. It does not provide any recommendation on shortlisted options.
5.2 Capital costs of shortlisted options
5.2.1 Evaluation Criteria 10: Upfront capital required for scheme The assessment summarised in this section presents initial ranges of upfront capital costs required to implement the options. This assessment represents the analysis of the shortlisted options against evaluation criteria 10. It should also be noted that it has not been possible to assess the costs related to the non‐chargeable interventions at this stage. This reflects the fact that these options are currently insufficiently scoped to be able to undertake a reasonable cost assessment. The cost estimates for these interventions will be developed as part of the development of the Outline Business Case.
Hence, the key drivers for the cost analysis, which focuses on the charging element of each of the shortlisted option, have been:
The number and location of ANPR cameras: Cameras are critical to effective monitoring and identification of vehicles entering and moving within the CAZ. This requires an ANPR camera at each point of entry into the CAZ (referred to herein as the “boundary camera”) as well as ANPR cameras within the CAZ (referred to herein as an "intra‐zone" camera) to identify those vehicles that move within the CAZ. The more complex the road network and the more entry points the greater the number of cameras that will be required.

67
Costs associated with road signs, road markings, back‐office operational costs, maintenance, communication links, power supply and publicity requirements: The number of ANPR cameras required, and the associated costs related to road signage and road markings (to make drivers aware), make up a significant proportion of the overall cost of a CAZ and these elements are related to the geographic size of the CAZ.
Based on the above criteria, the overall CAZ areas were assessed using Ordnance Survey Autocad mapping, existing B&NES Council junction layout drawings in conjunction with a desktop (Google Earth©) analysis of the road network. The approach was as follows:
To determine the number of boundary cameras, roads entering the CAZ boundary were identified and the number of cameras required was determined based on traffic lanes requiring monitoring.
To determine the number of intra‐zone cameras, a more holistic view was taken. This involved analysing the mapping and effectively reducing the medium and larger zones into smaller zones, permitting only very short localised trips (within a small number of residential streets) before intra‐zone cameras would be passed.
At this SOC stage we have not considered the need for additional traffic management to restrict alternative movements around the CAZ.
The summary of the charging elements of each of the shortlisted options is summarised in Table 5‐1 below. Further details of this assessment for all CAZ geographies is provided in Annex D.
Table 5‐1: Summary of ANPR cameras required and approximate capital costs
Number of ANPR Cameras Approximate Capital Cost
Option 1 ‐ Benchmark 40 £1‐3 million*
Option 2 (charging elements only – Small Class B)
40 £1‐3 million*
Option 3 (charging elements only – Small Class C)
40 £1‐3 million*
Option 4 (charging elements only – Small Class D)
40 £1‐3 million*
* Approximate capital costs include a 40% optimism bias
The costs of the non‐charging measures have not been included in this business case due to the level of detail currently identified for each of these schemes. Providing a figure for the cost of delivering these measures would be highly speculative and would suggest a degree of certainty that has not yet been achieved. It is anticipated that these costs would be relatively minor in comparison to the cost of implementing a charging CAZ and so their exclusion will not alter the conclusions of a relative comparison of potential options.
The precise costs for the shortlist of options and the recommended option for implementation will be refined as further detail is understood for each option. It is likely that the boundaries of the zone/s will be refined as the option progresses, impacting the number of cameras required.
5.3 Affordability This section presents an initial comparison of likely costs and revenues for the shortlisted options. This assessment represents the analysis across evaluation criteria 9 presented in section 3.3.3 of this document. Furthermore, this section outlines the likely need for funding and potential funding sources for delivering the shortlisted options.

68
5.3.1 Evaluation Criteria 9: Likelihood of CAZ charges revenue equating to implementation / operational costs
The charging elements of the shortlisted options are likely to generate revenue. This assessment assumes that non‐charging interventions will not be able to generate any revenue.
Defra’s Clean Air Zone Framework states that the level of charging for a CAZ should not be set in order to raise revenue, however any excess revenue above the costs of operation should be ‘re‐invested to facilitate the achievement of local transport policies and these should aim to improve air quality and support the delivery of the ambitions of the zone’. This is interpreted as any additional revenues received above the operating and maintenance costs for CAZ should be used by the Council to pursue other ‘Clean Air’ initiatives that are outside of the compliance criteria of the CAZ scheme, or to fund the delivery of additional non‐charging measures to support the charging CAZ.
The revenue accumulated from the CAZ will be used to cover the cost of operation and maintenance. However, should this not be sufficient it is expected that contributions from the Implementation Fund will cover this shortfall.
Currently, detailed revenue modelling has not been undertaken. However, initial qualitative assessment for charging elements of shortlisted options suggests that:
Options with larger geographic coverage will have larger implementation and ongoing operational and maintenance costs
Options with less overall vehicle movements within them will provide less revenue even with all vehicle categories included
On the above basis, it is expected that shortlisted options that have a higher concentration of vehicle movements per square mile are most likely to recover sufficient revenues to cover operational and maintenance costs.
Excluding vehicle categories from the charging mechanisms would reduce revenue and thus affordability of options.
Increased proportions of non‐charging components of options will reduce the affordability of options
5.3.2 Funding sources There are four main funding sources for the implementation of CAZ. These are:
A £255 million Implementation Fund ‐ this is designed to support local authorities in the planning and delivery of targeted action to improve air quality
An Early Measures Fund ‐ this is expected to support small, ambitious and good value early measures to improve air quality and start to reduce concentrations in Clean Air Zone. A maximum of £3m per local authority has been allocated for this funding which is part of the Clean Air Fund.
A £220 million Clean Air Fund ‐ an opportunity for local authorities to implement additional measures tailored to their area which minimise the potential impact of local air quality plans ‐ either by enabling the local authority to implement local plans that collectively impact on fewer people, or by providing direct support to those impacted.
Revenue from CAZ charges ‐ funding will become available from the charges that are applied to each CAZ. The appropriate level of charge for each option has not yet been determined and so at this stage the quantum of this value has not yet been assessed.
69
Additional funding may also be available through the Go Ultra Low project: the West of England was awarded £7m to spend over 5 years to encourage the wider use of low emission transport. There is also expected to be a further opportunity to bid for additional Low Emission Bus Funds later in 2018.
Bath and North East Somerset Council will look to the Implementation, Clean Air and Early Measures funds from Central Government in order to implement the Plan and to cover the shortfall for any ongoing operational and maintenance costs. Bath and North East Somerset Council has not assigned any additional resources to the implementation of the Plan, it is not currently bidding for other funding sources to provide support for implementation and maintenance costs.
5.4 Next Steps In order to progress the financial case from the Strategic Outline Case we will:
Refine the shortlist options, including scope and associated capital costs of the non‐charging options / components of options
Assess the ongoing operating and maintenance costs of each of the options, including the non‐charging options / components of options
Assess the expected revenue from each option
Assess the overall present value costs and present value benefits from each option to determine the most financially attractive option
Assess the overall funding gap for operational costs
Assess the funding requirement for capital costs
Assess the overall funding requirement from the implementation fund / JAQU.

70
Management Case
6.1 Introduction The purpose of the Management Case within this SOC is to set out how the scheme/s will be delivered successfully. In accordance with the Inception package of JAQUs guidance this Strategic Case considers the following;
An outline of who is involved in the project including key stakeholders.
An outline of how the project will be managed and any other key managerial considerations, including: change management, training, evaluation and timetable
An indicative project plan
An indicative organogram of project team and governance structure
6.2 Management of Project The project will be run in accordance with the B&NES Corporate Project Management System, which reflects the principles of PRINCE2 but is tailored to the B&NES Transport Service environment. The project will sit within a wider programme of changes to movement in the city centre of Bath. An organogram of the project team and governance structure is provided in overleaf.
A number of key roles have been identified for delivery of the project within the organogram and are set out below along with the responsibilities of each role;
Senior Responsible Officer and Programme Board – responsible for coordination of the project within the wider programme of infrastructure improvements as part of the Public Realm & Movement Strategy, Parking Strategy and GAB Transport Strategy, and managing the inter‐dependencies with other projects and workstreams across the authority.
Project Delivery Board – responsible for providing overall direction and management of the project, and making key decisions such as the commitment of resources. Responsible for making sure that the project delivers the required asset life and will meet the needs of users. Responsible for ensuring coordination and delivery of the supply chain partners and that materials, products and technologies are delivered in conformance with the specifications. Responsible for overseeing the engagement and awareness raising strategy to prepare the public for the implementation of the scheme.
Project Manager – responsible for day‐to‐day management of the project and work tasks and will delegate responsibility for the delivery of these to the Project Team, specialists or consultants as appropriate. Responsible for delivering an engagement and awareness raising strategy to prepare the public for implementations of the scheme.
Project Team – will deliver work packages as identified by the Project Manager through utilisation of internal resources, consultants and technical specialists as appropriate e.g. Framework contract. The project team will comprise officers from Traffic Signals, Network Management, Engineering Design, Procurement, Legal Services, and others as appropriate.
Political oversight of the project will be through representation at the Project Board and regular reports to the Council’s Senior Management Team, Cabinet and relevant Scrutiny Panel(s).
Key stakeholders in the delivery of this project will include JAQU, Highways England, WECA and the neighbouring local authorities; Wiltshire, Bristol, South Gloucestershire, Somerset and North Somerset Councils.

71
Figure 6‐1: Project Governance Structure
Clean Air Plan Programme Board
Business Change Managers:
Transport Operations
Highway Maintenance
Public Transport
Parking Services
Economic Development
Planning
Sustainable City
Public Health
Senior Responsible Officer
Service Director, Transport
Clean Air Plan Project Delivery Board Transport Programme Team
Senior Users
Senior Suppliers
Network Management
Policy & Strategy
Engagement and Awareness Raising
Clean Air Zone
Project Team
Project Manager Other B&NES
Transport
Projects
Finance Business
Partner
Complementary
measures to the
Clean Air Zone
Political Cabinet and Councillors

72
6.3 Financial Management
6.3.1 Financial Reporting The Project Manager will be responsible for undertaking regular financial reporting to inform the Project Board of the project’s progress and performance. A Project Initiation Document will be developed to provide a firm foundation for the initiation of the project. It will set out the direction and scope of the project, and form the 'contract' between the Project Team, Project Manager, Project Board and Senior Responsible Officer.
Following initiation, the Project Manager will produce monthly highlight reports which will be submitted to the Project Board. These will record the progress of the project, the financial status and any issues arising. The Project Managers will also complete a monthly budget forecast in line with corporate requirements relating to the management of the overall B&NES capital programme. The Council’s Financial Regulations set the delegations for budget transfers and reprofiles, and the authorisation levels for project expenditure.
Scrutiny and oversight of the project’s financial management will be provided by the Project Team under the guidance and direction of an officer from the Council’s Finance Team.
6.3.2 Change Control It is expected that elements of the agreed plan, budget or scope will need to be changed at some point during the project. It is important that means of controlling these changes are agreed before starting so that they can be dealt with simply and at the correct level.
All changes to the scheme will be dealt with in accordance with the Bath and North East Somerset Council Project Management Handbook. A change will be identified through the monthly highlight report where activities are not being carried out according to the plan or for the agreed cost, or an issue has arisen to affect the scope. Changes to the scheme will be recorded on a Change Order form to specify why the change has come about, what actions are proposed to counter it, and at what level decision‐making sits.
A set of tolerances will be determined, in accordance with the B&NES Project Management Handbook, so that each level of management in the project has the defined authority to agree certain changes before having to refer to a higher level. The agreed tolerances will be recorded in the Project Initiation Document, as will the period within which changes are cumulative.
6.4 Project Plan An indicative project plan for each of the shortlisted options is provided in Figure 6‐2 below. This will be refined, and further detail added, as the project progresses within the OBC and FBC.

73
Figure 6‐2: Indicative project Plan
6.5 Monitoring and Evaluation Bath and North East Somerset Council has existing monitoring programmes for traffic and air quality which can be utilised, and if necessary developed, to provide a comprehensive method for monitoring and evaluating the impact of this project. The existing data will provide a baseline against which to assess any changes to traffic flows, and NO2 and PM concentrations.
B&NES currently undertake an annual monitoring programme of air quality, specifically NO2 and PM concentrations, through their network of real‐time monitoring stations and diffusion tubes. This network has been extended in January 2018 to support the monitoring and evaluation of the Clean Air Plan.
B&NES currently undertake an annual monitoring programme of traffic flows including:
Inner and outer cordon surveys which measure traffic flows, in, out and across the city. These include pedestrian and cycle counts
Pedestrian and cycle surveys (included within cordon surveys above)
Public transport surveys of Bus and Rail use
The Council also operate a network of Automatic Monitoring Count sites across the city which record traffic and cycle flows throughout the year. Records are also kept of occupancy within B&NES car parks, and on‐street parking usage where charges apply.
Depending on the final measures selected for the project, it may be necessary to monitor impacts on other aspects of the city. This could include impacts on retail activity or business in general, usage of installed infrastructure (for example car clubs or electric vehicle charging points) and uptake of grants/subsidies.
0 6 12 18 24 30 36
Small CAZ
Refinement of ANPR Camera Locations Detailed design (non site specific)
Detailed design (site specific) Tendering and Procurement
Implementation Testing & Finessing
Monitoring & Evaluation after Implementation
Months After Project Initiation

74
Summary of Shortlisted Options 7.1.1 Assessment of Shortlisted Options against CSF The three shortlisted options have been assessed against the primary and secondary CSFs (including the financial evaluation criteria) by combining the analysis undertaken for the charging and non‐charging measures individually. A summary of the scoring of each option, comparative against the other two shortlisted options, is presented below in Table 7‐1. These options will be taken forward to the OBC to be assessed in greater detail.
Table 7‐1: Scoring of Shortlisted Options against Evaluation Criteria
Scheme
Small Class B Charging Option with
complementary non‐charging interventions
Small Class C Charging Option with
complementary non‐charging interventions
Small Class D Charging Option with
complementary non‐charging interventions
Timescale to achieve compliance 2021 2021 2021
Deliver compliance with NO2 air quality limit values and objectives in the shortest possible timescales
Pass Pass Pass
Provide equity across different vehicle types and trip purposes
1 2 3
Compliance with the CAZ framework
3 3 3
Mitigate financial impact on low income households
3 2 1
Improve health of low income households
1 2 3
Economic effect 3 2 1
Improve public health 1 2 3
Delivery timescale risks of procurement
3 3 3
Risk of financial penalty to the Council/s
1 2 3
Likelihood of revenue equating to implementation/operational costs
3 3 3
Upfront capital required for scheme
1 2 3
Public acceptability 3 2 1
Political acceptability 3 2 1
Weighted Average Score 65 69 73

I
Annex A Scoring Table for Non‐Charging
Measures

B1 B3A B3B B3C B3E B3F C1 D1A D1B D1C D1D D1E D1F D10 D11A D11B D12A D2 D3A D3B D3C D8 D9D D9E D9FProvide additional cycle parking across the city centre in visible locations and pilot a management scheme to improve proper useage of cycle parking
Extend walking and cycling priority schemes and encourage greater modal shift. Provide a safer environment for cycling and walking.
Extend and enforce a 20mph zone within the city to reduce vehicle emissions
Disincentives drivers from using the trunk road
Replace bus priority infrastructure with cycle priority infrastructure
Expand proposal (included in Go Ultra Low package) to introduce electric cycle hire to the city. Assumed at most 1,000 could be delivered
Extend the current Business engagement scheme to encourage employers to promote sustainable transport through promotion of Employers Travel Forum and adoption of Travel Plans
Review residents' parking scheme zoning structure and hours of operation, and implement changes as appropriate
Review operation of central area zones to reduce parking for non-residents and implement changes as appropriate
Restrict residents parking permits to one car per household within AQMA
Implement reduced residents’ parking permit cost for low emission vehicles.
Wider residents parking zones to stop commuter parking on the outskirts
Implement parking permit system in residential areas for visitors/commuters to city (alongside RPZs)
Pilot car sharing priority parking areas
Promote low emission vehicles for Hackney carriages/private hire through review of taxi licensing policy
Targeted Hackney carriage/private hire investment incentive scheme
Promote car sharing through pilot of smartphone application
Continue installation of electric car charging points in off street car parks and extend to on street
Expansion of car club network in Bath
Encourage car club operator to introduce electric cars (including family-sized EVs).
Encourage car hire operators to introduce electric cars/vans
Introduction of differential car parking charges based on vehicle fuel type, to discourage polluting vehicles and promote ULEV
Reduce long stay commuter parking capacity in the city centre
Reduce parking spaces in city centre (on and/or off street)
Increase parking prices in city centre to discourage car trips
2019 2021 2019 2020 2021 2019 2019 2020 2020 2020 2019 2021 2021 2020 2019 2019 2019 2019 2019 2019 2020 2020 2020 2020 2020
Deliver compliance with NO2 air quality Limit Values and Air Quality Objectives in the shortest possible timescales
Pass/Fail 4 1 2 1 1 1 1 1 1 1 1 1 1 1 1 2 2 1 1 1 1 1 1 2 2 2
All trip purposes treated equitably Low 1 N/A N/A N/A N/A N/A N/A N/A N/A N/A N/A N/A N/A N/A N/A N/A N/A N/A N/A N/A N/A N/A N/A N/A N/A N/A
Compliance with the CAZ framework High 3 3 3 2 2 2 3 3 3 3 3 3 3 3 3 3 3 3 3 3 3 3 3 3 3 3
Mitigate financial impact on low income groups High 3 2 2 1 1 1 2 2 2 1 1 2 2 2 2 1 1 2 1 2 2 1 1 1 1 1
Maximise health improvements of low income groups Very High 4 1 2 1 1 1 1 1 1 1 1 1 1 1 1 1 1 1 1 1 1 1 1 1 1 1
Net economic benefit High 3 2 3 1 1 1 2 2 1 1 1 1 1 1 2 1 1 2 1 2 2 1 1 1 1 1
Improve general public health Very High 4 1 2 1 1 1 1 1 1 1 1 1 1 1 1 1 1 1 1 1 1 1 1 2 2 1
Is the market able to supply in the time available? High 3 3 2 3 1 2 2 3 3 3 3 3 2 2 2 1 2 2 3 2 2 2 1 2 2 3
Likelihood of revenue equating to operational costs High 3 N/A N/A N/A N/A N/A N/A N/A N/A N/A N/A N/A N/A N/A N/A N/A N/A N/A N/A N/A N/A N/A N/A N/A N/A N/A
Upfront capital required for scheme Low 1 3 2 3 3 2 2 3 2 2 3 3 2 2 2 3 2 1 2 2 3 3 3 3 3 3
Risk of financial penalty to the Council Medium 2 1 2 1 1 1 1 1 1 1 1 1 1 1 1 2 2 1 1 1 1 1 1 2 2 2
Public acceptability Medium 2 3 2 2 1 1 2 3 2 2 1 2 1 1 3 3 3 3 3 3 3 3 2 2 1 1
Local, regional and national political acceptability Medium 2 3 2 2 1 2 2 3 3 2 1 3 1 1 3 3 3 3 3 3 3 3 2 2 1 1
Potentially Feasible ‐ the
impact on air quality is
likely to be minimal since
even a large % increase
in cycling represents a
small proportion of the
overall trips in Bath.
There is limited space
within the public realm,
and parking spaces
would need to be
reallocated. However,
this could be effective at
providing alternative
options for travel with a
CAZ D
Potentially Feasible ‐
this would enable a
greater proportion of
trips to be undertaken by
cycling or walking.
However, large scale
schemes could be
unfeasible to deliver
within the required
timescales
Reject ‐ large parts of
central Bath are already
20mph (or congestion
requires that traffic
moves below 20mph) so
benefit would be
minimal. Reductions in
speed in areas with a
speed limit >20mph
could increase emissions
Reject ‐ would need to
provide a viable
alternative route which
is not readily available or
within B&NES control
Reject ‐ this would
disincentive bus use in
Bath, making private car
use more popular. It may
also increase delays for
buses, increasing their
emissions whilst queued
or moving slowly
Potentially Feasible ‐ the
impact of this measure
on it's own is likely to be
small. However, it would
overcome a significant
obstacle to cycling in
Bath (the terrain) and
could be effective in
providing alternative
travel options with a CAZ
D. Particular focus
needed on determining a
commercially viable
model
Reject ‐ significant
engagement is currently
taking place so further
promotion is unlikely to
have a significant impact
on air quality.
Reallocate ‐ unlikely to
alter the number of trips
within the RPZs, or the
type of vehicles, and
therefore has little
impact on air quality.
Being progressed
through the Parking
Strategy
Reallocate ‐ would
reduce visitors trips but
could increase circulating
traffic searching for
parking and/or increase
number of residents
trips. Impact on air
quality unlikely to be
significant and could
impact on revenue relied
upon by Council to fulfil
statutory duties. Being
progressed through
Parking Strategy
Reallocate ‐ Residents in
the central parking zone
are already limited to
one permit per
household. In other RPZs
across Bath approx. 800
second permits are
issued, so impact on air
quality is likely to be
small. Being progressed
through Parking
Strategy, linked with
D1A.
Potentially Feasible ‐
would encourage uptake
of low emission vehicles
in Bath
Reallocate ‐ this has
been assessed in some
areas and rejected by
residents. Could take a
long time to agree and
implement. Where
under consideration,
being progressed
through Parking Strategy
Reallocate ‐ Could be
very difficult to agree
boundary's in reasonable
time, and all on‐street
parking within zones
would need to be
formalised which is time
consuming. Enforcement
would be manual and is
therefore expensive with
significant ongoing
operational costs.
Progress consideration
of option through
Parking Strategy and
review of RPZ system
Potentially Feasible ‐
incentivising car sharing
would mitigate the
impacts of a CAZ D but
may have limited impact
otherwise. Pilot required
to investigate a technical
solution for
enforcement.
Potentially Feasible ‐
tackles emissions from
taxis/private hire which
undertake a large
proportion of miles
within the AQMA
Reject ‐ would support
and enable changes in
response to license
changes but difficult to
offer meaningful
incentives which comply
with State Aid
Regulations
Potentially Feasible ‐
would encourage uptake
of car sharing and can be
implemented quickly.
However, impact is
dependent on uptake.
Would need to be
combined with measures
to restrict highway
capacity in order to
result in a reduction in
highway traffic
Reallocate ‐ progressing
through the Go Ultra
Low project. Not
considered achievable to
implement additional
charging points within
required timescales
Potentially Feasible ‐
this would encourage
drivers to use a cleaner
vehicles, but would be
most effective combined
with a charging scheme
Reallocate ‐ progressing
through the Go Ultra
Low project
Reject ‐ this is
progressing in the
market naturally and is
also promoted through
the Parking Strategy.
Further
incentivisation/investme
nt is unlikely to produce
a significant change
within the required
timescales
Reallocate ‐ this would
encourage uptake of less
polluting and ULEV in the
city centre. Already
being progressed
through the Parking
Strategy
Reallocate ‐ being
progressed through the
Parking Strategy which
includes a policy to
balance any increases in
short stay capacity with
reductions in long stay
capacity, and a policy
regarding reprovision of
spaces within the
Enterprise Area
Reallocate ‐ being
progressed through the
Parking Strategy which
includes a policy to
maintain or reduce
overall off‐street parking
capacity
Reallocate ‐ being
progressed through
Parking Strategy, and
initial proposals
approved by Cabinet in
February 2018.
Significant increases
would need to be
balanced with increases
in provision of
alternatives, particularly
expansion of P&R.
E4A E4C E7A E7B E8A E8B H2E H3 H5A H5B H5C H5D H5E H5G H8 H9 J2A J5A J5B J6 D15 E4BPromote smart ticketing and existing BathRider multi operator ticket.
Implement public transport route improvements including bus priority, passenger information and waiting facilities (target particular routes or demographics)
Deliver Bath air quality publicity campaign
Local investment incentive for private vehicles
Use variable message signs to promote air quality improvement messages. Potentially mobile and real-time responsive signs.
Provide an air quality smart phone app: issue warnings when levels are at or approaching harmful concentrations and encourage action to reduce
Increase the number or usage of existing VMS signs to provide information about parking and reduce unnecessary trips into the city centre
Implement traffic free street trials. To demonstrate how we could reduce dependence on car use
Review existing delivery hours restrictions for businesses in Bath city centre and amend where beneficial and viable.
Restrict coaches vehicles from entering the city centre in peak periods
Provide a coach park outside the city centre
AM peak prohibition for non-compliant vehicles (would need to be linked to concessionary travel passes etc for low income areas)
Prohibition of diesel cars (or other vehicles, based on level of contribution to problem) from the city centre
Traffic gating (soft including real time traffic management system)
Car share lanes/use of existing bus lanes by high occupancy vehicles
Implement advisory or mandatory engine switch off/anti-idling zones
Promote use of low emission vehicles for freight, refuse, recycling and delivery services, where possible.
Introduce a revised TRC mandating that buses meet the Euro VI emissions standard
Mandatory compliance (Euro 4 petrol, Euro 6 Diesel) for buses, Hackney carriages and private hire to access bus lanes/franchise routes
Promote greater use of low emission delivery services and 'Last mile' freight/post schemes
Require contractors operating fleets on Council business to use low emission vehicles
Targeted traffic management or improved bus priority on A367 Wells Road
Sunset period to exempt Euro 5 diesel vehicles to enable longer for upgrades
Replace experimental TRO for bus lane on London Road with permanent TRO
Cheaper bus fares for groups (it's more expensive for multiple people to use the bus than park the car)
2021 2021 2018 2021 2019 2019 2021 2019 2020 2020 2020 2021 2021 2021 2019 2020 2021 2021 2021 2020 2020 2021 2020 2019 2020
Deliver compliance with NO2 air quality Limit Values and Air Quality Objectives in the shortest possible timescales
Pass/Fail 4 1 1 1 2 1 1 1 1 1 1 1 2 3 1 1 1 1 3 3 2 1 2 1 3 1
All trip purposes treated equitably Low 1 N/A N/A N/A N/A N/A N/A N/A N/A N/A N/A N/A N/A N/A N/A N/A N/A N/A N/A N/A N/A N/A N/A N/A N/A N/A
Compliance with the CAZ framework High 3 3 3 3 2 3 3 3 2 3 3 3 2 2 3 3 3 3 3 2 3 3 3 1 3 3
Mitigate financial impact on low income groups High 3 2 3 1 1 1 1 2 1 1 1 1 1 1 1 1 1 1 1 1 1 1 1 2 2 3
Maximise health improvements of low income groups Very High 4 1 1 1 2 1 2 1 1 1 1 1 2 2 1 1 1 1 2 2 1 1 2 1 2 2
Net economic benefit High 3 2 3 1 1 1 1 2 1 2 1 1 1 1 2 2 1 2 1 1 1 1 2 2 2 2
Improve general public health Very High 4 1 1 1 2 1 2 1 1 1 1 1 2 2 1 1 1 1 2 2 1 1 2 1 2 1
Is the market able to supply in the time available? High 3 2 3 3 3 3 1 3 2 3 3 3 1 3 3 3 3 3 2 3 3 2 3 3 3 3
Likelihood of revenue equating to operational costs High 3 N/A N/A N/A N/A N/A N/A N/A N/A N/A N/A N/A N/A N/A N/A N/A N/A N/A N/A N/A N/A N/A N/A N/A N/A N/A
Upfront capital required for scheme Low 1 3 1 3 1 3 2 2 3 3 2 2 2 2 2 3 2 3 3 2 2 2 2 3 3 3
Risk of financial penalty to the Council Medium 2 1 1 1 2 1 1 1 1 1 1 1 2 3 1 1 1 1 3 3 2 1 2 1 3 1
Public acceptability Medium 2 3 3 2 2 3 3 3 3 3 2 2 1 1 1 2 3 3 3 3 3 3 1 3 3 3
Local, regional and national political acceptability Medium 2 3 3 3 3 3 3 3 3 1 1 2 1 1 1 2 2 3 2 3 3 3 1 3 3 3
Reallocate ‐ this is being
progressed but has been
delayed due to technical
difficulties and lack of
operator engagement.
Now within WECAs
control and continues to
be progressed. Delivery
uncertain within
required timescales
Potentially Feasible ‐
could have a significant
impact on car trips with
or without a charging
zone, and would be
particularly good at
mitigating adverse
impacts of a charging
scheme on low income
households. Could be
delivered through
enhanced quality
partnerships if bus
patronage is increased
through implementation
of a CAZ
Reallocate ‐ this should
form part of the
engagement package
within the Feasibility
Study, but would not
deliver long‐term air
quality benefits
Reject ‐ unlikely to be
affordable and/or
deemed a proper use of
public funds
Potentially Feasible ‐
would increase public
understanding of air
quality, and their
contribution to the
problem
Reallocate ‐ impact of
messaging is uncertain:
could encourage more
driving to avoid exposure
when walking/cycling.
Being considered by
public health team and
work is ongoing
Potentially Feasible ‐
would encourage use of
P&R or other modes
rather than driving into
AQMA
Reallocate ‐ this could
form part of the
engagement package to
deliver the project, but
would not deliver long‐
term air quality benefits
Reallocate ‐ there are
existing delivery
restrictions in the core of
Bath, but this could be
extended to increase the
impact. Being progressed
through Public Realm
Movement Strategy and
GAB Transport Strategy
Reject ‐ recent surveys
show that most coaches
arrive/leave Bath outside
of the peak hours
already so the impact of
this would be minimal.
Strategy for coaches
currently being
developed.
Reallocate ‐ may
increase coach trips
between drop‐off and
parking locations, but
could reduce circulating
and/or idling coaches in
AQMA. Overall impact
on air quality likely to be
negligible, or possibly
detrimental, unless
combined with P&R
service to avoid need for
coaches to travel in city
centre. Being progressed
as part of Coach Parking
Strategy
Reject ‐ air quality
impact is likely to be
similar to a charging CAZ
D, but reduces choices
available and therefore
distributional, social and
economic impacts likely
to be more severe
Reject ‐ prohibition
rather than charge
reduces the choices
available and hence
could risk damage to the
local economy, residents
choices and the tourism
trade in central Bath if
sufficient alternatives
are not provided. It is
unlikely that sufficient
additional capacity could
be provided in public
transport networks
within the required
timescales to support
this measure.
Reject ‐ the network of
traffic signals in Bath is
not extensive and
opportunities to gate
traffic are mostly located
in built‐up areas where
queued traffic could
cause an additional air
quality exceedance
Reject ‐ can only be
implemented where
there is space for two
lanes. Such locations are
limited within the AQMA
without reallocating a
bus lane to general
traffic use, which would
result in an overall
increase in highway
capacity and therefore a
worsening of pollution
Reallocate ‐ advisory
schemes can be
delivered as part of the
engagement package
within the Feasibility
Study, but air quality
impact is limited.
Enforcement of
mandatory scheme has
associated ongoing
operational costs which
the Council cannot
commit to meeting.
Reallocate ‐ this is being
progressed through the
Go Ultra Low project and
ongoing Council contract
renewals
Reallocate ‐ this will now
be progressed by WECA
and timescales are
uncertain since WECA
policy is only just
emerging. Risk that if
operators cannot replace
their vehicles quickly in
response to a TRC
services could be
discontinued, causing a
knock‐on increase in car
traffic.
Reject ‐ this is an
alternative mechanism
to achieve the same
change as a CAZ A, but
further limits the choices
available. Also it could
only be implemented
sparsely across the city
at locations where bus
lanes exist
Reallocate ‐ being
piloted under Go Ultra
Low project and the
result will determine if it
is feasible to expand and
give an indication of the
likely impacts.
Reallocate ‐ this is being
progressed already and
is reflected in the
Councils procurement
policy. Timescales for the
renewal of
frameworks/contracts
are difficult to alter
Potentially Feasible ‐
this could tackle ongoing
exceedances on A367
Wells Road but detailed
investigation is needed
to consider available
options, impact on air
quality and deliverability
within required
timescales
Potentially Feasible ‐
this would reduce the
impact of a CAZ but
would mitigate some of
the potential economic
and social disbenefits
Potentially Feasible ‐ the
experimental TRO has
resulted in a large
reduction in roadside
concentrations at
Lambridge and
converting it to a
permanent TRO would
secure this improvement
Reallocate ‐ already
progressing as part of
GAB Transport Strategy
C2C H2F H5F E4D J2B H2A H2B H2C D9A C2A C2B A3 A1 A2 J1 C8 D6 J4 C4 C3 E6 D4 F1Smaller P&R sites on existing bus routes
Pedestrianisation of the city centre
Odd/Even number plate access restrictions (possibly restricted to certain weeks or time periods)
Subsidise local rail season tickets
Investigate the possibility of installing a CNG refuelling station just outside the city centre
Develop and implement city centre traffic reduction plan to reduce through traffic and car dependency, particularly at Manvers Street, Dorchester Street and Queen Square.
Reduce/remove the need for buses to traverse the city centre.
Reduce bus movements in the off peak periods and make more use of demand-responsive transport alternatives.
Introduction of Smart parking systems (possibly to include pre-booking)
Expand Bath's existing Park & Ride provision, both in terms of sites and operating times.
Expansion of Bath's Park & Ride provision on new sites
Review parking standards for new development to promote low emission/electric vehicles
Ensure that air quality improvement measures are given sufficient prominence in the West of England Joint Spatial Plan and replacement Joint Local Transport Plan
Produce developer guidance or Supplementary Planning Guidance relating to Air Quality
Develop a Bath freight consolidation
centre, providing storage (for stock
replenishment) and delivery depot for local businesses,
ideally to be operated by cargo bikes or Ultra-Low Emission Vehicles
Encourage West of England Mayor to introduce advanced Bus Quality Partnerships and Direct Franchising
Roll out superfast broadband to promote home working
Encourage operators to offer lower delivery charges if already visiting area
Metro-West rail project
Encourage private investment into the provision of sustainable transport infrastructure
Reduce traffic congestion by staggering business and school hours
Consolidate public off-street car parking stock into fewer facilities
A36/A46 link road
2025 2029 2025 2024 2030 2023 2030 2025 2022 2022 2025 2024 2029 2024 2029 2025 2029 2029 2030 2029 2029 2029 2035
Deliver compliance with NO2 air quality Limit Values and Air Quality Objectives in the shortest possible timescales
Pass/Fail 4
All trip purposes treated equitably Low 1 N/A N/A N/A N/A N/A N/A N/A N/A N/A N/ACompliance with the CAZ framework High 3Mitigate financial impact on low income groups High 3Maximise health improvements of low income groups Very High 4Net economic benefit High 3Improve general public health Very High 4Is the market able to supply in the time available? High 3
Likelihood of revenue equating to operational costs High 3 N/A N/A N/A N/A N/A N/A N/A N/A N/A N/AUpfront capital required for scheme Low 1Risk of financial penalty to the Council Medium 2Public acceptability Medium 2Local, regional and national political acceptability Medium 2
Postpone ‐ can't be
implemented before a
CAZ could achieve
compliance. Continue to
progress through Bath
AQAP and GAB Transport
Strategy
Postpone ‐ can't be
implemented before a
CAZ could achieve
compliance. Continue to
progress through Bath
AQAP, GAB Transport
Strategy and Public
Realm & Movement
Strategy
Postpone ‐ can't be
implemented before a
CAZ could achieve
compliance. Continue to
progress consideration
of option through Bath
AQAP
Postpone ‐ can't be
implemented before a
CAZ could achieve
compliance. Continue to
progress consideration
of option through Bath
AQAP
Postpone ‐ can't be
implemented before a
CAZ could achieve
compliance. Continue to
progress consideration
of option through Bath
AQAP
Reallocate ‐ feasibility
work ongoing, and will
progress through the
GAB Transport Strategy
and Public Realm &
Movement Strategy.
Can't be fully
implemented before a
CAZ could achieve
compliance
Postpone ‐ can't be
implemented before a
CAZ could achieve
compliance. Could
encourage use of private
cars to access city centre,
worsening air quality.
Continue to
consider/progress
through Bath AQAP
Postpone ‐ can't be
implemented before a
CAZ could achieve
compliance. Continue to
progress through Bath
AQAP
Reallocate ‐ can't be
fully implemented
before a CAZ could
achieve compliance.
Already progressing as
separate project through
Parking Strategy
Postpone ‐ can't be
implemented before a
CAZ could achieve
compliance. Continue to
progress through Bath
AQAP and GAB Transport
Strategy
Postpone ‐ can't be
implemented before a
CAZ could achieve
compliance. Continue to
progress through Bath
AQAP and GAB Transport
Strategy
Reallocate ‐ standards
set out within Parking
Strategy. Revisions will
continue through
updates to the Strategy
Postpone ‐ impact
would not be realised
until development
comes forward and
therefore this does not
contribute to improving
existing air quality
problems. Continue to
progress through the
Bath AQAP in order to
maintain benefits of
Clean Air Plan in future.
Postpone ‐ impact
would not be realised
until development
comes forward and
therefore this does not
contribute to improving
existing air quality
problems. Continue to
progress through the
Bath AQAP in order to
maintain benefits of
Clean Air Plan in future.
Reallocate ‐ pilot
scheme progressing as
part of Go Ultra Low
project
Postpone ‐ can't be
implemented before a
CAZ could achieve
compliance. Continue to
progress consideration
of option through JLTP
Postpone ‐ can't be
implemented before a
CAZ could achieve
compliance. Continue to
progress through Bath
AQAP
Postpone ‐ can't be
implemented before a
CAZ could achieve
compliance. Continue to
progress through Bath
AQAP
Postpone ‐ can't be
implemented before a
CAZ could achieve
compliance. Continue to
progress through GAB
Transport Strategy and
JLTP
Postpone ‐ can't be
implemented before a
CAZ could achieve
compliance. Continue to
progress through Bath
AQAP
Reject ‐ can't be
implemented before a
CAZ could achieve
compliance. Also, could
lead to an increase in
trips across the day,
worsening air quality.
Postpone ‐ can't be
implemented before a
CAZ could achieve
compliance. Continue to
progress through Bath
AQAP
Postpone ‐ can't be
implemented before a
CAZ could achieve
compliance. Continue to
progress through GAB
Transport Strategy
Decision
Scheme
Timescale for Implementation
Reference in Bath AQAP
Decision
Reference in Bath AQAP
Cri
tica
l S
ucc
ess
Fac
tors
Scheme
Timescale for Implementation
Cri
tica
l S
ucc
ess
Fac
tors
Cri
tica
l S
ucc
ess
Fac
tors
Reference in Bath AQAP
Scheme
Timescale for Implementation
Decision

II
Annex B Scoring Table for Charging Measures

Large: Class A Large: Class B Large: Class C Large: Class D Medium: Class A Medium: Class B
2023 2021 2021 2021 2023 2021
Deliver compliance with NO2 air quality Limit Values and Air
Quality Objectives in the shortest possible timescalesPass/Fail 4 Fail Pass Pass Pass Fail Pass
All trip purposes treated equitably Low 1 3 1 2 3 1 1
Compliance with the CAZ framework High 3 3 2 2 2 1 3
Mitigate financial impact on low income groups High 3 3 1 1 1 3 2
Maximise health improvements of low income groups Very High 4 3 2 2 3 1 1
Net economic benefit High 3 3 1 1 1 2 2
Improve general public health Very High 4 3 2 2 3 1 1
Is the market able to supply in the time available? High 3 3 1 1 1 2 2
Likelihood of revenue equating to operational costs High 3 3 1 1 2 2 1
Upfront capital required for scheme Low 1 3 1 1 1 2 2
Risk of financial penalty to the Council Medium 2 3 1 1 2 2 2
Public acceptability Medium 2 3 2 1 1 3
Local, regional and national political acceptability Medium 2 3 2 2 1 3
42 41 50 52
Reject ‐ not
anticipated to
achieve compliance
in shortest possible
timescales
Reject ‐ Low scoring
option
Reject ‐ Low scoring
option
Reject ‐ Low scoring
option
Reject ‐ not
anticipated to
achieve compliance
in shortest possible
timescales
Reject ‐ Low scoring
option
Medium: Class C Medium: Class D Small: Class A Small: Class B Small: Class C Small: Class D
2021 2021 2023 2021 2021 2021
Deliver compliance with NO2 air quality Limit Values and Air
Quality Objectives in the shortest possible timescalesPass/Fail 4 Pass Pass Fail Pass Pass Pass
All trip purposes treated equitably Low 1 2 3 1 1 2 3
Compliance with the CAZ framework High 3 3 3 1 3 3 3
Mitigate financial impact on low income groups High 3 2 1 3 3 3 2
Maximise health improvements of low income groups Very High 4 2 2 1 1 1 2
Net economic benefit High 3 2 2 3 3 3 2
Improve general public health Very High 4 2 2 1 1 1 2
Is the market able to supply in the time available? High 3 2 2 3 3 3 3
Likelihood of revenue equating to operational costs High 3 2 2 3 2 2 3
Upfront capital required for scheme Low 1 2 2 3 3 3 3
Risk of financial penalty to the Council Medium 2 2 3 3 2 2 3
Public acceptability Medium 2 2 2 3 3 2
Local, regional and national political acceptability Medium 2 2 2 3 3 2
57 57 61 62 63
Reject ‐ Low scoring
option
Reject ‐ Low scoring
option
Reject ‐ not
anticipated to
achieve compliance
in shortest possible
timescales
Feasible Feasible Feasible
Scheme
Timescale to achieve complianceCritical Success Factors
Decision
Scheme
Timescale to achieve compliance
Critical Success Factors
Weighted Average Score (excluding financial CSFs)
Decision
Weighted Average Score (excluding financial CSFs)

III
Annex C Assessment of Timescales to Achieve Compliance for Charging Measures

B A T H C L E A N A I R L O C A L P L A N
1
Bath and North East Somerset Council Clean Air Local Plan: Transport and Air Quality Compliance Timescales, Assumptions and Calculations PREPARED FOR: Bath and North East Somerset
Council
PREPARED BY: Austin Cogan, Clare Beattie and Katherine Williams
CHECKED BY Piercarlo Smith and Chris Bushell
DATE: 28 March 2018
PROJECT NUMBER: 674726.BR.42.01
REVISION NO.: 3 ‐ Final
APPROVED BY: Becky Lloyd
1.0 Introduction
1.1 Overview
Due to forecast air quality exceedances of the European Union Limit Value for nitrogen dioxide Bath and North East Somerset Council (B&NES) has been directed by Defra to produce a Local Plan to achieve air quality improvements in the shortest time possible. As part of the Local Plan B&NES is considering implementation of a Clean Air Zone (CAZ), possibly including both charging and non‐charging measures. CH2M has been commissioned by Bath and North East Somerset Council (BCC) to produce a Strategic Outline Case for the delivery of a package of measures which will bring about compliance with the Limit Value for annual mean NO2 in the shortest time possible in Bath.
This technical note outlines the Transport and Air Quality modelling assumptions and calculations undertaken to estimate the relative timescales to achieve compliance of each charging option for the option sifting stage of the project. Further modelling work will be undertaken at the next stage of the project based on additional data which will provide more accurate estimates of compliance timescales.
1.2 Options Assessed
In total 12 charging options were identified, reflecting three different geographical areas and four CAZ classes. The following four CAZ charging classes, as set out in Defra / DfT’s Clean Air Zone Framework have been assessed:
1. Class A charging – buses, coaches, taxis, private hire vehicles 2. Class B charging – buses, coaches, taxis, private hire vehicles and HGVs 3. Class C charging – buses, coaches, taxis, private hire vehicles, HGVs and LGVs 4. Class D charging – buses, coaches, taxis, private hire vehicles, HGVs, LGVs and cars The geographical scopes assessed are listed below and shown in Figure 1;
1. Large ‐ the Bath urban area 2. Medium ‐ incorporating an area reflecting the AQMA in Bath 3. Small ‐ a smaller area within central Bath

B A T H C L E A N A I R L O C A L P L A N
2
Figure 1: Boundaries of CAZ geographical scopes assessed.

B A T H C L E A N A I R L O C A L P L A N
3
The assessment of timescales to achieve compliance has been undertaken for the following 12 options;
Large geography, CAZ Class A – charging
Large geography, CAZ Class B – charging
Large geography, CAZ Class C – charging
Large geography, CAZ Class D – charging
Medium geography, CAZ Class A – charging
Medium geography, CAZ Class B – charging
Medium geography, CAZ Class C – charging
Medium geography, CAZ Class D – charging
Small geography, CAZ Class A – charging
Small geography, CAZ Class B – charging
Small geography, CAZ Class C – charging
Small geography, CAZ Class D – charging
2.0 Transport Modelling Assumptions
2.1 Overview
This section sets out the transport modelling methodology, and assumptions, used to estimate the timescales in which compliance could be achieved for 12 CAZ charging options.
2.2 Base Model
B&NES commissioned Mott MacDonald to update the existing GBATH model in 2014. The 2014 G‐BATH transport model is a large strategic model covering Bath and the surrounding area in the simulation model and key external routes within the buffer area. The GBATH model consists of:
A Highway Assignment Model representing vehicle based movements across Bath and surrounding area for a 2014 autumn weekday morning peak hour (08:00‐09:00), an average inter‐peak hour (10:00‐16:00) and an evening peak hour (17:00‐18:00);
A Public Transport (PT) Assignment Model representing bus and rail based movements across the same area and time periods; and
A five‐stage multi‐modal incremental Variable Demand Model (VDM) that forecasts changes in trip frequency and choice of main mode, time period of travel, destination, and sub‐mode choice, in response to changes in generalised costs across the 24‐hour period.
2.3 Reference Case Model
The existing future year model reflects 2029, which is too far into the future for use in this assessment. The existing 2029 model was developed using two methods to produce the future year trip ends. For the city of Bath region, the trip generation of the proposed development in the Uncertainty Log was derived using specific trip rates. The trip totals for Bath were then controlled to the predicted National Trip End Model (NTEM) growth, for all modes and purposes. The areas external to Bath had NTEM growth factors applied directly to the base year matrices. Light and heavy goods vehicle growth was based on forecasts from the DfT’s Road Transport Forecasts for 2015. These future year matrices were then run through the VDM until convergence was achieved within the limits specified by the DfT.
The G‐BATH model is considered to be the best local model for testing strategic schemes of this kind. The SATURN highway model was used for the CAZ tests in isolation, due to the complexity of the

B A T H C L E A N A I R L O C A L P L A N
4
responses within a CAZ, the current structure of the VDM and level of detail required for the sifting exercise.
A 2021 reference case model was developed by interpolating between the base 2014 and future year 2029 highway models. The Uncertainty Log for 2029 was collated in 2015, including any developments and infrastructure deemed ‘near certain’ and ‘more than likely’, in line with WebTAG.
2.4 CAZ Option Modelling
The G‐BATH 2021 SATURN Highway reference case model was used to undertake initial approximate tests of vehicle trip responses to the implementation of a large Class D CAZ, medium Class D CAZ and a small Class D CAZ.
The expected responses to the implementation of a CAZ have been taken from the ‘Draft UK Air Quality Plan for tackling nitrogen dioxide’ May 2017, Table 4.4, as shown below in Figure 2. These responses were applied to the non‐compliant vehicles only, namely: pre‐Euro 4 for petrol and pre‐Euro 6 for diesel. As the highway matrices are not split into compliant/non‐compliant trips, national non‐compliant vehicle percentages were calculated from the Defra Emissions Factor Fleet Toolkit (EFT, version 8), as shown in Tables 1 and 2, and applied to the matrices and traffic link data during post‐processing respectively.
Figure 2: Table 4.4 from the Draft UK Air Quality Plan for tackling Nitrogen Dioxide – Technical Report
Table 1: 2021 National Non‐Compliant Vehicle Percentages by Vehicle Type
Year Cars LGVs HGVs
2021 20% 29% 14%
Table 2: 2021 National Non‐Compliant Vehicle Percentages by Vehicle/Fuel Type
Year Cars LGVs HGVs
Petrol Diesel Petrol Diesel Diesel
2021 1.71% 34.19% 3.06% 29.39% 14.19%
The G‐BATH SATURN Highway model was used to replicate these responses in 2021 using the following methodology:

B A T H C L E A N A I R L O C A L P L A N
5
1. Pay Charge – no change to the model;
2. Avoid Zone – a charge was applied to each inbound CAZ link to replicate the above percentage change of non‐compliant cars and LGV’s avoiding the CAZ (HGV’s not included since ‘Avoid zone’ response is 0%);
3. Cancel journey / change mode – this was modelled by reducing the number of trips made by non‐compliant vehicles to/from the CAZ area and within it, to replicate the percentage change from the reference case, as shown above. This was undertaken by identifying the zones within each CAZ area and applying reduction factors (non‐compliant % x response %) for all trips to/from/within the CAZ boundary;
4. Replace Vehicle – no change to the model, however calculations were carried out using model outputs to determine the links which would be affected by the percentage change from non‐compliant to compliant vehicles from the reference case. This was achieved by undertaking two‐way select cordon analysis and outputting these link flows into a spreadsheet for post‐processing. The select cordon identifies trips not only on the cordon boundary, but the routes taken by these trips, therefore accounting for changes in fleet as a result of a CAZ on links throughout Bath and beyond. For links within the CAZ boundary, total link flow was used. Post‐processing to calculate the replace vehicle response followed the following steps:
Apply factors to calculate AADT flows from AM, Inter and PM peak flows (total and select cordon)
Split the highway link flows by fuel type using the WebTAG Databook, Table A1.3.9
Calculate the number of non‐compliant vehicles that are expected to replace vehicle (non‐compliant % x response %) by link and vehicle/fuel type.
Each of these responses were modelled individually, as the responses stated above are compared to the reference situation. A final SATURN Highway model assignment was undertaken, including the charge required for achieving the avoid the zone response and the adjusted matrices from the cancel journey / change mode response. Link flows were extracted from these models and post‐processing was undertaken using the following methodology:
Apply factors to calculate AADT flows from AM, Inter and PM peak flows
Split the highway link flows by fuel type using the WebTAG Databook, Table A1.3.9
Calculate the impact of the Avoid Zone and Cancel Journey / Change Mode by link (Final CAZ assignment – reference case)
Calculate the number of non‐compliant trips by link and vehicle/fuel type as a result of a CAZ (link value x non‐compliant % ‐ number of vehicles replaced + avoid zone /cancel journey / change model impact)
Calculate the number of compliant trips by link and vehicle/fuel type as a result of a CAZ (link value x compliant % + number of vehicles replaced ‐ avoid zone /cancel journey / change model impact)
2.5 Other Years
Other years were also required for estimating the year of compliance. Each year has not been modelled explicitly. Instead the 2021 transport flow data was extrapolated to 2022‐2025 using the following methodology:
Reference Case 1. Tempro (V7.2) growth factors, as shown in Table 3, were applied by vehicle type to each
modelled link flow;
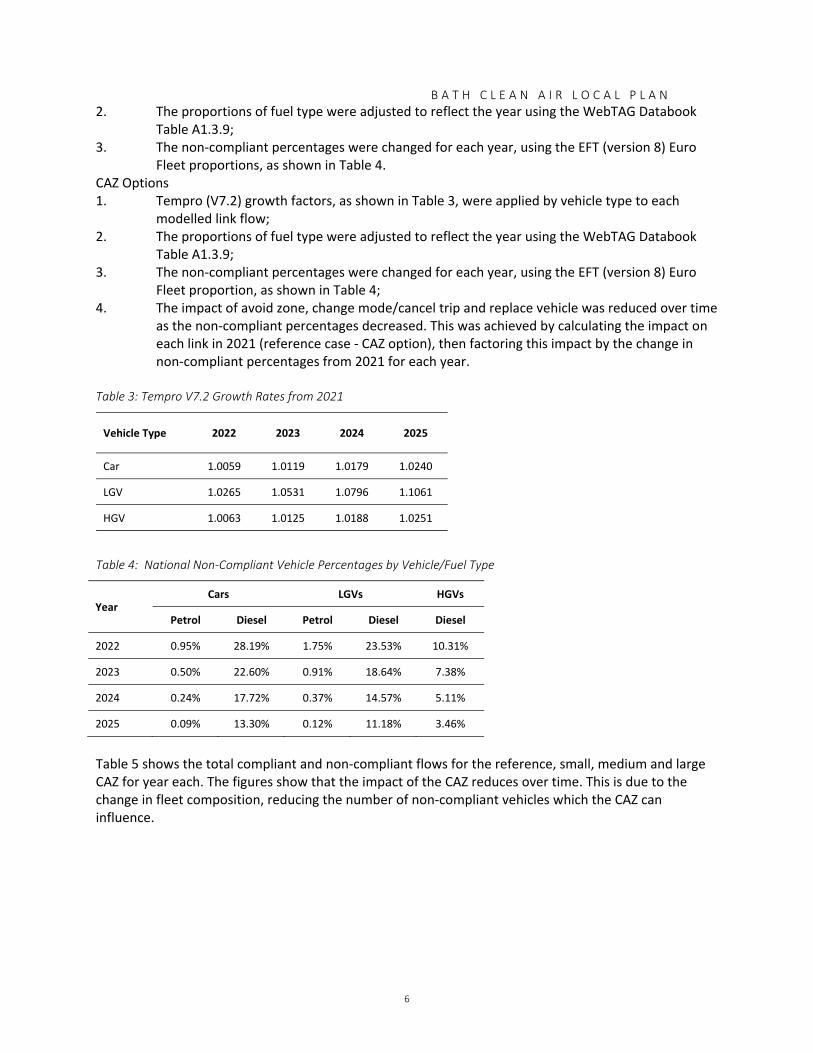
B A T H C L E A N A I R L O C A L P L A N
6
2. The proportions of fuel type were adjusted to reflect the year using the WebTAG Databook Table A1.3.9;
3. The non‐compliant percentages were changed for each year, using the EFT (version 8) Euro Fleet proportions, as shown in Table 4.
CAZ Options 1. Tempro (V7.2) growth factors, as shown in Table 3, were applied by vehicle type to each
modelled link flow; 2. The proportions of fuel type were adjusted to reflect the year using the WebTAG Databook
Table A1.3.9; 3. The non‐compliant percentages were changed for each year, using the EFT (version 8) Euro
Fleet proportion, as shown in Table 4; 4. The impact of avoid zone, change mode/cancel trip and replace vehicle was reduced over time
as the non‐compliant percentages decreased. This was achieved by calculating the impact on each link in 2021 (reference case ‐ CAZ option), then factoring this impact by the change in non‐compliant percentages from 2021 for each year.
Table 3: Tempro V7.2 Growth Rates from 2021
Vehicle Type 2022 2023 2024 2025
Car 1.0059 1.0119 1.0179 1.0240
LGV 1.0265 1.0531 1.0796 1.1061
HGV 1.0063 1.0125 1.0188 1.0251
Table 4: National Non‐Compliant Vehicle Percentages by Vehicle/Fuel Type
Year Cars LGVs HGVs
Petrol Diesel Petrol Diesel Diesel
2022 0.95% 28.19% 1.75% 23.53% 10.31%
2023 0.50% 22.60% 0.91% 18.64% 7.38%
2024 0.24% 17.72% 0.37% 14.57% 5.11%
2025 0.09% 13.30% 0.12% 11.18% 3.46%
Table 5 shows the total compliant and non‐compliant flows for the reference, small, medium and large CAZ for year each. The figures show that the impact of the CAZ reduces over time. This is due to the change in fleet composition, reducing the number of non‐compliant vehicles which the CAZ can influence.
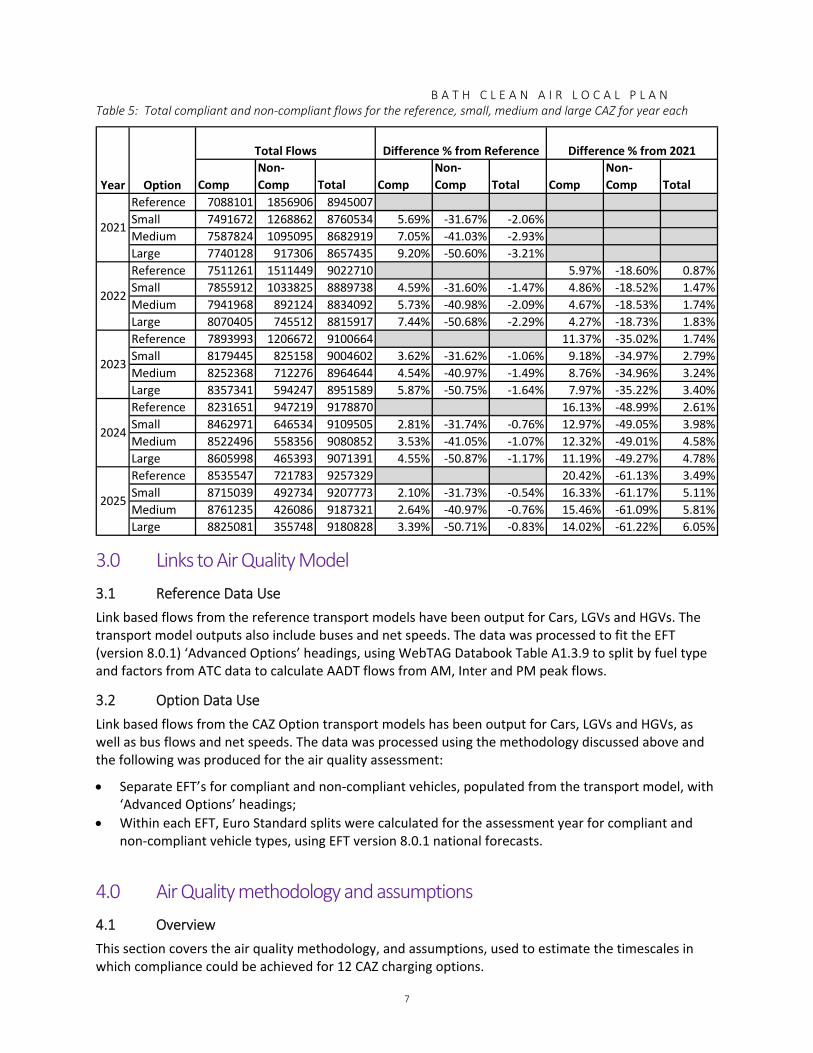
B A T H C L E A N A I R L O C A L P L A N
7
Table 5: Total compliant and non‐compliant flows for the reference, small, medium and large CAZ for year each
3.0 Links to Air Quality Model
3.1 Reference Data Use
Link based flows from the reference transport models have been output for Cars, LGVs and HGVs. The transport model outputs also include buses and net speeds. The data was processed to fit the EFT (version 8.0.1) ‘Advanced Options’ headings, using WebTAG Databook Table A1.3.9 to split by fuel type and factors from ATC data to calculate AADT flows from AM, Inter and PM peak flows.
3.2 Option Data Use
Link based flows from the CAZ Option transport models has been output for Cars, LGVs and HGVs, as well as bus flows and net speeds. The data was processed using the methodology discussed above and the following was produced for the air quality assessment:
Separate EFT’s for compliant and non‐compliant vehicles, populated from the transport model, with ‘Advanced Options’ headings;
Within each EFT, Euro Standard splits were calculated for the assessment year for compliant and non‐compliant vehicle types, using EFT version 8.0.1 national forecasts.
4.0 Air Quality methodology and assumptions
4.1 Overview
This section covers the air quality methodology, and assumptions, used to estimate the timescales in which compliance could be achieved for 12 CAZ charging options.
Comp
Non‐
Comp Total Comp
Non‐
Comp Total Comp
Non‐
Comp Total
Reference 7088101 1856906 8945007
Small 7491672 1268862 8760534 5.69% ‐31.67% ‐2.06%
Medium 7587824 1095095 8682919 7.05% ‐41.03% ‐2.93%
Large 7740128 917306 8657435 9.20% ‐50.60% ‐3.21%
Reference 7511261 1511449 9022710 5.97% ‐18.60% 0.87%
Small 7855912 1033825 8889738 4.59% ‐31.60% ‐1.47% 4.86% ‐18.52% 1.47%
Medium 7941968 892124 8834092 5.73% ‐40.98% ‐2.09% 4.67% ‐18.53% 1.74%
Large 8070405 745512 8815917 7.44% ‐50.68% ‐2.29% 4.27% ‐18.73% 1.83%
Reference 7893993 1206672 9100664 11.37% ‐35.02% 1.74%
Small 8179445 825158 9004602 3.62% ‐31.62% ‐1.06% 9.18% ‐34.97% 2.79%
Medium 8252368 712276 8964644 4.54% ‐40.97% ‐1.49% 8.76% ‐34.96% 3.24%
Large 8357341 594247 8951589 5.87% ‐50.75% ‐1.64% 7.97% ‐35.22% 3.40%
Reference 8231651 947219 9178870 16.13% ‐48.99% 2.61%
Small 8462971 646534 9109505 2.81% ‐31.74% ‐0.76% 12.97% ‐49.05% 3.98%
Medium 8522496 558356 9080852 3.53% ‐41.05% ‐1.07% 12.32% ‐49.01% 4.58%
Large 8605998 465393 9071391 4.55% ‐50.87% ‐1.17% 11.19% ‐49.27% 4.78%
Reference 8535547 721783 9257329 20.42% ‐61.13% 3.49%
Small 8715039 492734 9207773 2.10% ‐31.73% ‐0.54% 16.33% ‐61.17% 5.11%
Medium 8761235 426086 9187321 2.64% ‐40.97% ‐0.76% 15.46% ‐61.09% 5.81%
Large 8825081 355748 9180828 3.39% ‐50.71% ‐0.83% 14.02% ‐61.22% 6.05%
Year
2021
2022
2023
2024
Difference % from 2021
Option
Total Flows Difference % from Reference
2025

B A T H C L E A N A I R L O C A L P L A N
8
The latest available Defra Emissions Factor Toolkit (EFT v8.0.1) was used to obtain vehicle fleet proportions for road links in the study area for the reference (without CAZ) scenarios. EFT v8.0.1 uses emission factors from COPERT 5, which is the most up‐to‐date vehicle emissions database available. Changes in vehicle fleet over time have been adopted from EFT, which reflects changes in emissions and compliance rates with respect to Euro standards for each vehicle type. Further detail is provided in the transport section above.
4.2 EU Compliance
Defra’s latest Pollution Climate Mapping (PCM) model assessment outputs show that nitrogen dioxide (NO2) concentrations exceed the Limit Values on London Road until 2021 without any additional measures. The PCM model CAZ scenario projections also forecast compliance to be achieved in Bath by 2021. These projections are presented in Figure 2 overleaf.
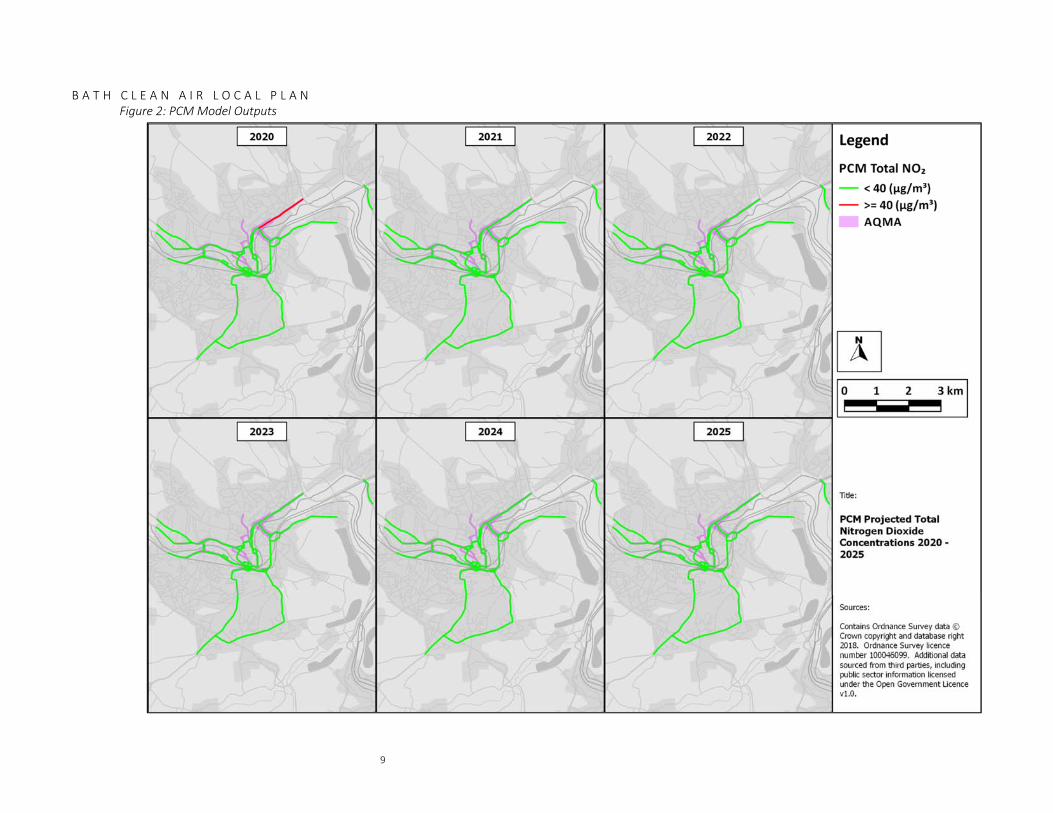
B A T H C L E A N A I R L O C A L P L A N
9
Figure 2: PCM Model Outputs

B A T H C L E A N A I R L O C A L P L A N
10
4.3 Local Air Quality Management Compliance
Data from around 53 monitoring sites were considered from B&NES’ monitoring network. As concentrations fall off rapidly as you move away from the roadside, annual mean NO2 concentrations were adjusted using Defra’s Nitrogen Dioxide fall off with distance calculator to estimate the annual mean NO2 at receptor considered as sites of relevant exposure based on Defra’s Technical Guidance (TG16).
The annual mean NO2 concentrations were projected forward based on the Defra future projections used to represent improvements in ambient air quality at roadside locations in the future. Monitoring data shows widespread exceedances in Bath across the extent of the AQMA, close to arterial and local roads.

B A T H C L E A N A I R L O C A L P L A N
11
Figure 3: Monitored (2016) and forecast (2021) NO2 concentrations

B A T H C L E A N A I R L O C A L P L A N
12
Measured annual mean NO2 concentrations were source apportioned making use of guidance set out in Defra’s Technical Guidance (TG16, Box 7.5), and Defra background maps1 were used to apportion the local (road) contribution from the total annual mean NO2 concentrations. This enabled the number of compliant locations (within AQS Objective limit) to be identified with and without each class of CAZ for each year.
The receptors considered were all monitors within the Bath urban area, with 2016 data being used in all cases, other than at the Lambridge diffusion tube site, which experienced road layout changes in April 2017 which have affected concentrations at that site. A bus lane replaced one of the inbound lanes, thus both reducing vehicle movements along London Road to one lane in each direction, and moving the majority of the vehicles further away from the diffusion tube (with only buses using the lane adjacent to the tube and nearby receptors). This appears to have caused a reduction in concentrations at this site compared to 2016. Therefore, at this site, the 2017 concentration was used as a more representative data point for the current road layout (with bus lane implemented). These annual mean values were also distance corrected to represent values relevant to the Air Quality Objective for annual mean NO2.
4.4 Vehicle Emissions by Fleet
The EFT was used to obtain NOx emission outputs for all scenarios. The ‘Advanced Options’ function in EFT was used to include user defined Euro standards and fleet compositions. The EFT was run for 2021 and subsequent years to establish a reference scenario (assuming no CAZ) and to reflect the implementation of a CAZ for each year. ‘Additional Outputs’ functions were also selected to obtain emissions broken down by vehicle type and to allow outputs to be source apportioned. Emissions calculations were undertaken using EFT v8.0.1 using the ‘Alternative Technologies’ option of the EFT for each road link. The year for calculation was set at 2021 to match the reference traffic year. The ‘User Euro’ function was selected to allow the proportion of each vehicle type by Euro Standard to be defined according to data derived from the response of the non‐compliant vehicles, described in the transport methodology.
The EFT was run to account for the varying proportions of vehicle type by Euro Standard. The EFT then provided the emission rate (g/km/s) for each link entered by vehicle type. This information was used to determine the relative contribution of each vehicle type by Euro standard at selected receptors.
The EFT outputs were run for each road link in the model. Each monitoring site was assigned to a road link which runs past the site. Where the monitoring site was located at or near to a junction, the road links which would influence emissions at that site were apportioned in relation to distance from the site (i.e. those nearest would have most influence and therefore have most contribution).
Changes in emissions between the no CAZ and CAZ scenario were used to estimate the corresponding change in local NO2 contributions at each monitoring location. The % NOx emission reduction was assumed to produce the same % reduction in local road NO2 concentration, as the receptors considered were all roadside measurements. This is only an approximation of the likely reduction of each CAZ is expected to be, and is not as robust as detailed air quality dispersion modelling which will follow in the next stage of the feasibility work.
1 Defra Background Maps, Accessed from: https://uk‐air.defra.gov.uk/data/laqm‐background‐maps?year=2015 on 13/11/17

B A T H C L E A N A I R L O C A L P L A N
13
5.0 Timescales to Achieve Compliance
5.1.1 Time Taken to Achieve Compliance Once Operational
In each year, the number of existing monitoring sites not expected to achieve compliance following implementation of each charging CAZ option has been calculated, and is summarised in Figure 4, Figure 5 and Figure 6 below, alongside the reference case (no CAZ).
Figure 4: Number of Monitoring Sites Not Expected to Achieve Compliance with a Small CAZ
Figure 5: Number of Monitoring Sites Not Expected to Achieve Compliance with a Medium CAZ
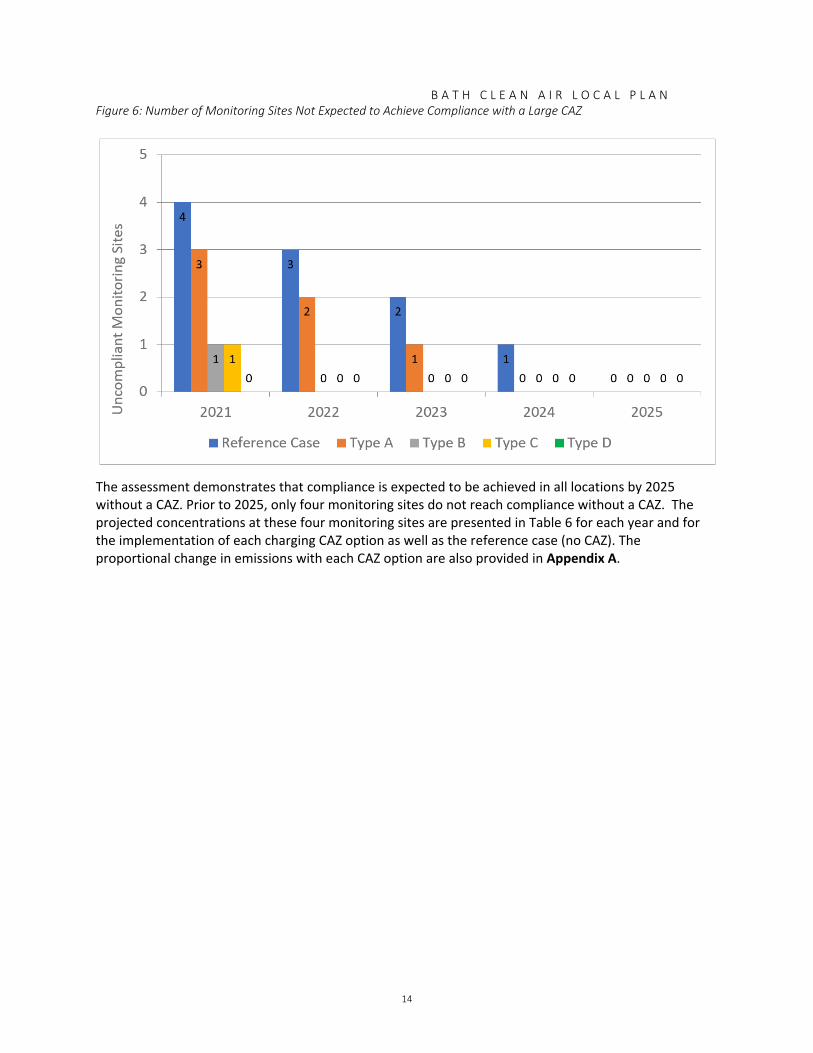
B A T H C L E A N A I R L O C A L P L A N
14
Figure 6: Number of Monitoring Sites Not Expected to Achieve Compliance with a Large CAZ
The assessment demonstrates that compliance is expected to be achieved in all locations by 2025 without a CAZ. Prior to 2025, only four monitoring sites do not reach compliance without a CAZ. The projected concentrations at these four monitoring sites are presented in Table 6 for each year and for the implementation of each charging CAZ option as well as the reference case (no CAZ). The proportional change in emissions with each CAZ option are also provided in Appendix A.

B A T H C L E A N A I R L O C A L P L A N
15
Table 6: Projected nitrogen dioxide concentrations at the four uncompliant monitoring sites for the reference, small, medium and large CAZ for each year
Monitoring Site
Small CAZ Medium CAZ Large CAZ
Reference
Case
Type A
Type B
Type C
Type D
Reference
Case
Type A
Type B
Type C
Type D
Reference
Case
Type A
Type B
Type C
Type D
2021
DT20 44.6 42.3 40.7 39.4 38.0 44.6 42.3 40.7 40.2 38.8 44.6 42.2 40.6 40.1 37.6
DT42 40.7 36.8 35.9 35.6 35.2 40.7 36.8 35.8 35.5 35.1 40.7 36.8 35.6 35.5 35.5
DT55 43.5 41.8 37.3 37.0 35.3 43.5 41.8 37.2 36.1 32.8 43.5 41.8 37.4 35.6 30.9
DT90 47.3 44.4 38.2 38.1 37.6 47.3 44.3 38.0 37.4 35.4 47.3 44.3 39.1 38.2 34.3
2022
DT20 42.1 40.3 39.1 38.0 36.5 42.1 40.3 39.1 38.6 37.1 42.1 40.3 39.1 38.6 36.4
DT42 38.4 35.5 34.8 34.6 34.2 38.4 35.5 34.7 34.5 34.1 38.4 35.4 34.6 34.4 34.4
DT55 41.0 39.7 36.3 36.1 34.6 41.0 39.7 36.3 35.3 32.4 41.0 39.7 36.5 34.9 30.9
DT90 44.6 42.3 37.6 37.4 37.0 44.6 42.3 37.5 36.9 35.1 44.6 42.3 38.4 37.6 34.2
2023
DT20 40.1 38.6 37.8 36.8 35.7 40.1 38.6 37.8 37.4 36.2 40.1 38.6 37.8 37.4 35.7
DT42 36.5 34.4 34.0 33.8 33.6 36.5 34.4 34.0 33.8 33.5 36.5 34.4 33.9 33.7 33.7
DT55 39.0 38.0 35.5 35.4 34.3 39.0 38.0 35.5 34.7 32.4 39.0 38.0 35.6 34.3 31.1
DT90 42.4 40.6 37.1 37.1 36.8 42.4 40.6 37.1 36.6 35.1 42.4 40.6 37.8 37.1 34.3

B A T H C L E A N A I R L O C A L P L A N
16
2024
DT20 38.1 37.0 36.4 35.6 34.5 38.1 37.0 36.3 35.9 34.5 38.1 37.0 36.4 36.0 34.4
DT42 34.7 33.1 32.8 32.6 32.4 34.7 33.1 32.8 32.6 32.4 34.7 33.1 32.7 32.5 32.4
DT55 37.1 36.3 34.5 34.3 33.3 37.1 36.4 34.8 34.4 33.3 37.1 36.3 34.6 33.4 30.6
DT90 40.3 38.9 36.4 36.3 35.9 40.3 39.0 36.9 36.6 35.9 40.3 38.9 36.8 36.2 33.9
2025
DT20 36.2 35.5 35.1 34.4 33.5 36.2 35.5 35.1 34.8 33.8 36.2 35.5 35.1 34.8 33.5
DT42 33.0 32.0 31.8 31.6 31.5 33.0 32.0 31.7 31.6 31.4 33.0 32.0 31.7 31.6 31.5
DT55 35.3 34.8 33.5 33.3 32.5 35.3 34.8 33.5 32.9 31.2 35.3 34.8 33.6 32.6 30.4
DT90 38.4 37.4 35.6 35.5 35.2 38.4 37.4 35.6 35.2 34.1 38.4 37.4 36.0 35.5 33.7

B A T H C L E A N A I R L O C A L P L A N
17
The assessment has demonstrated that a Class D small, medium and large CAZ are all predicted to achieve compliance in 2021 at all monitoring sites. The assessment has also demonstrated that Class B small, medium and large CAZ, and Class C medium and large CAZ are all predicted to achieve compliance in 2021 at all monitoring sites except one. This site is to the south of Bath city centre, along the A367. A Class C small CAZ is expected to bring compliance to all locations in 2021.
This may seem counter‐intuitive, as the small CAZ does not cover such a large geographical area, and so would be expected to have a smaller impact on the exceedances than the medium or large. However, in the baseline case the A367 arm of the A367/A36 Churchill Gyratory is over capacity. With the medium and large CAZ, the cross flow on the A36 decreases due to the CAZ, allowing the capacity of the A367 arm to increase. This results in an increase in traffic and leads to a greater exceedance of nitrogen dioxide at this location. However, with the small CAZ not all river crossing points are included within the charging zone, which leads to re‐routing away from the A367 where the CAZ charge would be implemented, and consequently a reduction in concentrations. In summary, the size of the small CAZ means it is more effective at diverting trips away from this problem location.
With the implementation of small, medium and large CAZ, and Class C medium and large CAZ, the nitrogen dioxide concentration at this single uncompliant monitoring site is estimated to exceed the limit value by up to 0.7 µg/m3. Such an exceedance is considered to be within the realm of uncertainty of the assessment and any additional non‐charging measures will help to reduce this concentration.
A Class A small, medium or large CAZ is estimated to not achieve compliance until 2024. It is anticipated that with some additional measures focused on the monitoring locations DT20 and DT90, compliance may be achieved in 2023 with a Class A CAZ within either the small, medium or large sized boundary. Since compliance may be achieved by Class B, C and D CAZs in 2021, Class A charging zones are discounted from the list of charging options.
Therefore, the most successful CAZ options in bringing forward the timescales for compliance are considered to be Class B, C and D small, medium and large CAZ.
6.0 Recommendations Based on the assessment of timescales required to achieve compliance set out in this report the following options are recommended to be taken forward for further assessment;
Small geography, CAZ Class B – charging
Small geography, CAZ Class C – charging
Small geography, CAZ Class D – charging
Medium geography, CAZ Class B – charging
Medium geography, CAZ Class C – charging
Medium geography, CAZ Class D – charging
Large geography, CAZ Class B – charging
Large geography, CAZ Class C – charging
Large geography, CAZ Class D – charging The CAZ B option is maintained within the shortlist although the technical assessment indicates that there would still be a single exceedance in 2021, when a CAZ C and D are expected to achieve compliance. The remaining exceedance with a Class B CAZ of any size is very minor and is considered to be within the realm of uncertainty of the assessment undertaken. More detailed analysis is therefore required to determine that a Class B is not sufficient, and it cannot be ruled out at this point within the process.

18
Appendix A Changes in emissions from each CAZ
Class

19
Figure A.1 ‐ Percentage Changes in Vehicle Emissions in 2021 With a Small CAZ
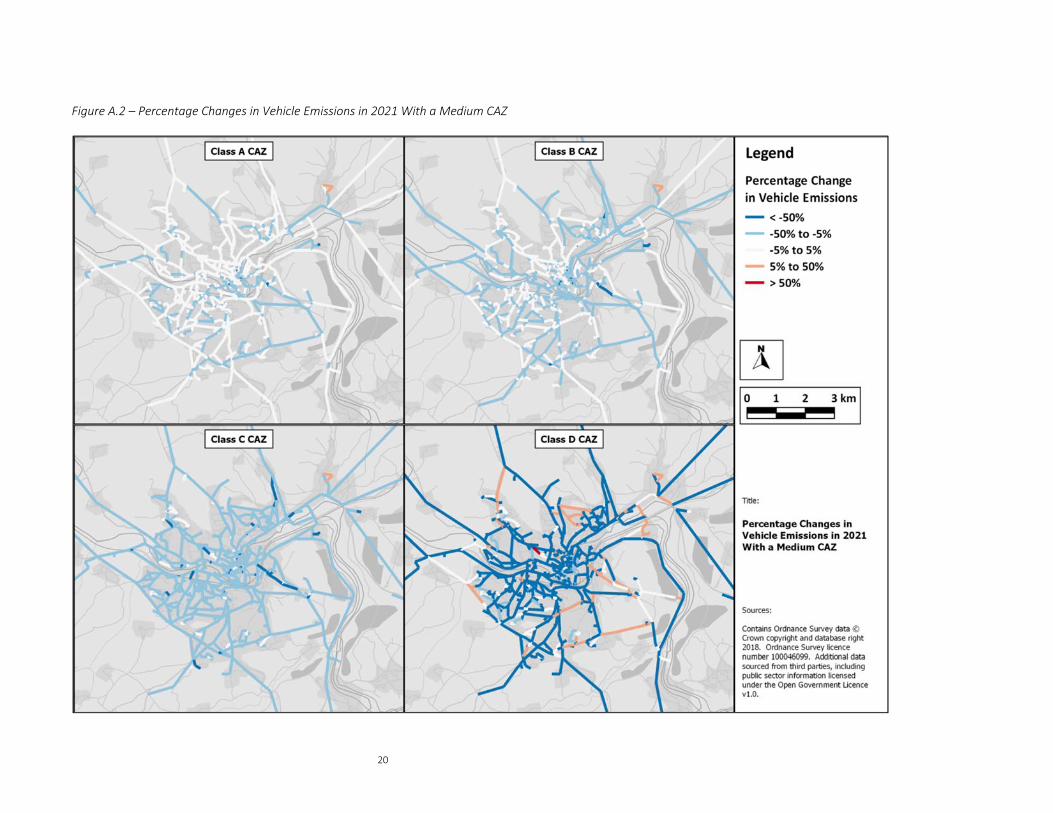
20
Figure A.2 – Percentage Changes in Vehicle Emissions in 2021 With a Medium CAZ

B A T H C L E A N A I R L O C A L P L A N
21
Figure A.3 –Percentage Changes in Vehicle Emissions in 2021 With a Large CAZ

IV
Annex D Assessment of Charging Options
Against Secondary CSFs

Bath Clean Air Local Plan: Assessment of Charging Measures Against Secondary Critical Success Factors
Prepared for
Bath and North East Somerset Council
28 March 2018

III
Contents Introduction ........................................................................................................................................ 2
1.1 Overview ............................................................................................................................. 2 1.2 Options ................................................................................................................................ 2 1.3 Critical Success Factors and Evaluation Criteria ................................................................. 4
Strategic Evaluation Criteria ................................................................................................................ 5 2.1 Evaluation Criteria 1: Deliver compliance with NO2 air quality Limit Values and Air
Quality Objectives in the shortest possible timescales (Pass or Fail) ................................. 5 2.2 Evaluation Criteria 2: All trip purposes treated equitably (low priority) ............................ 5 2.3 Evaluation Criteria 3: Compliance with the CAZ framework (high priority) ....................... 5
Economic Evaluation Criteria ............................................................................................................... 7 3.1 Introduction ........................................................................................................................ 7 3.2 Evaluation Criteria 4: Mitigate financial impact on low income groups (high priority) ..... 8 3.3 Evaluation Criteria 5: Maximise health improvements of low income groups (very high
priority) ............................................................................................................................. 10 3.4 Evaluation Criteria 6: Net economic benefit (high priority) ............................................. 10 3.5 Evaluation Criteria 7: Improve general public health (very high) ..................................... 21
Commercial Evaluation Criteria ......................................................................................................... 23 4.1 Evaluation Criteria 8: Is the market able to supply in the time available? (high priority) 23
Financial Evaluation Criteria .............................................................................................................. 25 5.1 Evaluation Criteria 9: Likelihood of revenue equating to operational costs (high priority)25 5.2 Evaluation Criteria 10: Upfront capital required for scheme (low priority) ..................... 25 5.3 Evaluation Criteria 11: Risk of financial penalty to the Council (medium priority) .......... 28
Management Evaluation Criteria ....................................................................................................... 29 6.1 Evaluation Criteria 12: Public acceptability (medium priority) ......................................... 29 6.2 Evaluation Criteria 13: Local, regional and national political acceptability (medium
priority) ............................................................................................................................. 29
Summary .......................................................................................................................................... 30
Appendices
Appendix A 2016 Measured Annual Mean NO2
Table(s)
Table 1‐1: Evaluation Criteria ........................................................................................................................ 4 Table 3‐1: Summary of Impact Categories to be Considered for Each Social or Business Group ................ 7 Table 5‐1: Summary of ANPR cameras required and approximate capital costs ....................................... 28 Table 7‐1: Scoring of Charging Measures against Evaluation Criteria ........................................................ 31

CONTENTS
IV
Figure(s)
Figure 1‐1: Initial CAZ geographies ............................................................................................................... 3 Figure 3‐1: Distribution of income deprivation by households across Bath and North East Somerset (source: Indices of Multiple Deprivation, 2015) ........................................................................................... 9 Figure 3‐2: Distribution of businesses across Bath and North East Somerset (source: UK Business Counts, 2016) ........................................................................................................................................................... 12 Figure 3‐3: Distribution of children across Bath and North East Somerset (source: ONS Mid‐Year Population Estimates, 2016) ....................................................................................................................... 15 Figure 3‐4: Distribution of people aged over 65 across Bath and North East Somerset (source: ONS Mid‐Year Population Estimates, 2016) ............................................................................................................... 17 Figure 3‐5: Distribution of disability deprivation across Bath and North East Somerset (source: Indices of Multiple Deprivation, 2016) ........................................................................................................................ 18 Figure 3‐6: Distribution of females across Bath and North East Somerset (source: ONS Mid‐Year Population Estimates, 2016) ....................................................................................................................... 19 Figure 3‐7: Distribution of ethnic minority groups across Bath and North East Somerset (source: ONS Mid‐Year Population Estimates, 2016) ....................................................................................................... 20

1
Document history
674726.BR.42.01 Bath Clean Air Local Plan: Assessment of Charging Measures Against Secondary Critical Success Factors
This document has been issued and amended as follows:
Version Date Description Created by Verified by Approved by
1 16/02/2018 Draft Clare Beattie (AQC), Karan Monga, Gary Wilson, Matt Langdon
Becky Lloyd David Lear & David Crockett
2 28/02/2018 Revised draft
Clare Beattie (AQC), Karan Monga, Gary Wilson, Matt Langdon
Becky Lloyd David Lear & David Crockett
3 15/03/2018 Final Clare Beattie (AQC), Karan Monga, Gary Wilson, Matt Langdon
Becky Lloyd David Lear & David Crockett
4 28/03/2018 Final Clare Beattie (AQC), Karan Monga, Gary Wilson, Matt Langdon
Becky Lloyd David Lear & David Crockett
2
Introduction
1.1 Overview Due to forecast air quality exceedances Bath and North East Somerset Council (B&NES) has been directed by the Defra to produce a Local Plan to achieve air quality improvements in the shortest possible time. As part of the Local Plan, B&NES Council is considering implementation of a Clean Air Zone (CAZ), including both charging and non‐charging measures. CH2M has been commissioned by B&NES Council to produce a Strategic Outline Case for the delivery of a package of measures which will bring about compliance with the European Limit Value for annual mean nitrogen dioxide in the shortest time possible in Bath.
The Economic Case of the Strategic Outline Case (SOC) considers a long list of potential options and refines them to a short list of packages, to be assessed in greater detail in the Outline Business Case. To support the assessment of the long list of options, this report provides justification for the scoring of the charging measures proposed against the defined evaluation criteria.
1.2 Options Charging options considered include all possible combinations of three geographical scopes and four charging classes of CAZ.
In the first instance, the three geographical scopes of the Plan include:
1. Large ‐ the Bath urban area, bounded by the A36, London Road and A46 to the west (thus excluding the Park and Ride sites)
2. Medium – the Bath Air Quality Management Area, extending out along key arterial routes to encompass Bathwick Street and London Road to the north east and Upper Bristol Street, A36 and A367 to the west and south respectively.
3. Small – the Bath city centre area only, predominantly located north of the River Avon (with a small extension encompassing the A36 gyratory to the south of the river).
Figure 1‐1 shows the boundary of each zone assessed. These are anticipated to evolve throughout the length of the study, as further stakeholder and public engagement is undertaken.

3
Figure 1‐1: Initial CAZ geographies
The CAZ classes assessed were as defined in the Defra/DfT’s Clean Air Zone Framework. The framework sets out which vehicles are affected by each CAZ class and what the minimum Euro standards are for each vehicle type. The four CAZ classes include:
1. Class A charging – buses, coaches, taxis, private hire vehicles 2. Class B charging – buses, coaches, taxis, private hire vehicles and HGVs 3. Class C charging – buses, coaches, taxis, private hire vehicles, HGVs and LGVs 4. Class D charging – buses, coaches, taxis, private hire vehicles, HGVs, LGVs and cars
All potential combinations of the three geographic scopes and four CAZ charging classes results in a long list of twelve charging options for the Plan.

4
1.3 Critical Success Factors and Evaluation Criteria In total thirteen evaluation criteria have been defined against which to assess the potential options. These have been to determined to cover the six areas required by JAQU in their Options Appraisal Guidance (Value for money, distributional impacts, strategic and wider air quality fit, supply side capacity and capability, affordability and achievability), but with a local focus. The list of evaluation criteria includes a primary Critical Success Factor (CSF), deliver compliance with NO2 air quality Limit Values and Air Quality Objectives in the shortest possible timescales, and twelve secondary CSFs. The evaluation criteria are summarised in Table 3‐2.
Table 1‐1: Evaluation Criteria
Cases ID Evaluation Criteria Priority
Strategic
1 Deliver compliance with NO2 air quality Limit Values and Air Quality Objectives in the shortest possible timescales
Pass/Fail
2 All trip purposes treated equitably Low
3 Compliance with the CAZ framework, including minimum requirements High
Economic
4 Mitigate financial impact on low income groups High
5 Maximise health improvements of low income groups Very High
6 Net economic benefit High
7 Improve general public health Very High
Commercial 8 Is the market able to supply in the time available? High
Financial
9 Likelihood of revenue equating to operational costs High
10 Upfront capital required for scheme Low
11 Risk of financial penalty to the Council Medium
Management 12 Public acceptability Medium
13 Local, regional and national political acceptability Medium
The primary CSF, evaluation criteria 1, is scored on a pass or fail basis – any option which fails this criteria is not assessed against any other CSFs. For all other evaluation criteria, a scoring system was devised for the option assessment which provides a score of High (3), Medium (2) or Low (1) for the performance of each option. The options have been scored relatively within each evaluation criteria; a low score does not necessarily indicate a negative impact, just that of all the options considered it is among the worst performing (and vice versa for high).
Each evaluation criteria was given a priority level of either Low (1), Medium (2), High (3), or Very High (4) based on judgement of their importance to B&NES Council and B&NES residents, in the selection of a suitable options. These priority scores were multiplied with the 1‐3 score of performance to give an overall weighted score for each option. The priority score of each criteria is summarised in Table 1‐1.
The legal test which was set out by the High Court in November 2016 in R (ClientEarth) (No2) V
Secretary of State for Environment Food and Rural Affairs [2016] EWHC 2740 (Admin) confirms that
when selecting measures to tackle air quality exceedances, the determining factor must be which
measure will achieve compliance in the shortest time. The test also indicates that only where two measures are equally timely and effective can considerations such as cost be taken into account. Hence, no assessment is undertaken for the Financial Evaluation Criteria 9 and 10 as part of the shortlisting of options. The shortlisted options which meet compliance in the shortest possible time and perform better than other alternatives have been appraised across these criteria and the analysis is presented in the Financial Case chapter of the SOC.

5
Strategic Evaluation Criteria
2.1 Evaluation Criteria 1: Deliver compliance with NO2 air quality Limit Values and Air Quality Objectives in the shortest possible timescales (Pass or Fail)
The assessment of the options against this evaluation criteria, the primary CSF, is not provided in this report. It is summarised within the Economic Case of the SOC, and is reported in detail in Annex C, ‘Bath and North East Somerset Council Clean Air Local Plan: Transport and Air Quality Compliance Timescales, Assumptions and Calculations’, February 2018. The primary CSF test reduced the list of charging options to the following;
Small geography, CAZ Class B
Small geography, CAZ Class C
Small geography, CAZ Class D
Medium geography, CAZ Class B
Medium geography, CAZ Class C
Medium geography, CAZ Class D
Large geography, CAZ Class B
Large geography, CAZ Class C
Large geography, CAZ Class D
For information, the existing exceedance in B&NES are mapped in Appendix A.
These options are assessed against the remainder of the evaluation criteria within this document.
2.2 Evaluation Criteria 2: All trip purposes treated equitably (low priority)
The assessment of each charging CAZ option against this evaluation criteria has focused on the vehicle types included and the likely trip purposes of these vehicles. Clearly, the more vehicle types included within a CAZ, the greater equity is achieved, and so a Class B or C CAZ scores poorly in comparison to a Class D.
Class B and C zones include buses, coaches, taxis, private hire vehicles and some, if not all, goods vehicles. This is anticipated to primarily affect leisure trips or business related trips but also some commuting trips. In particular, the inclusion of LGVs may disproportionately impact small and medium sized businesses who rely on the use of their vehicles to operate their business. A Class D CAZ includes all vehicle types and hence has the most equitable impact.
2.3 Evaluation Criteria 3: Compliance with the CAZ framework (high priority)
The ‘DfT/Defra Clean Air Zone Framework’, May 2017, sets out the classes and vehicle standards of charging CAZ that would be acceptable for implementation. All CAZ options assessed apply one of these CAZ classes and as such are in compliance with the Clean Air Zone Framework.

6
In addition, the Clean Air Zone Framework sets out minimum requirements which any CAZ should meet including the expectation that it should ‘be in response to a clearly defined air quality problem, seek to address and continually improve it and ensure this is understood locally’. The Framework also states that ‘A Clean Air Zone designed in line with the principles in this framework will give an additional advantage to an authority bidding for competitive central government funding’. Hence, any CAZ which is not in compliance with the minimum requirements reduces the likelihood of central funding being obtained. The small and medium CAZ boundaries are clearly in response to an existing air quality problem, complying with the Clean Air Zone Framework minimum requirements. The compliance of the largest zone is less certain, since it contains large areas of the city in which there is no known air quality problem.
The Clean Air Zone Framework also identifies that CAZs should take account of Local Air Quality Management. The CAZ options assessed take account of both Air Quality Objective and Limit Value exceedances in Bath.

7
Economic Evaluation Criteria
3.1 Introduction The various CAZ options are likely to have differential impacts on the economy‐based secondary critical success factors. The approach to assessing the differential impact is set out in JAQU’s Option Appraisal Guidance. The Guidance highlights a number of receptors (or business or social group variables, including deprivation/income, children, elderly people, disability, sex, ethnicity, business counts, LGVs) that need to be appraised against three core CAZ impacts: air quality, accessibility, affordability. A matrix of impact categories and business or social groups is presented in Table 6 of the Guidance and replicated below. This provides the basis for the economic evaluation.
Table 3‐1: Summary of Impact Categories to be Considered for Each Social or Business Group
The various combinations of impact category and business or social group categories can be aligned with the four economic evaluation criteria presented in Table 3‐1:
CSF 4 ‐ Mitigate financial impact on low income groups: with a focus on affordability impacts of CAZ options on low‐income households.
Affordability – deprivation/income
CSF 5 ‐ Maximise health improvements of low income groups: with a focus on air quality impacts of CAZ options on low‐income households.
Air quality – deprivation/income
CSF 6 ‐ Net economic benefit: with a focus on economic activity (in terms of business, jobs and productivity) and accessibility impacts (on a range of vulnerable groups), acting as proxies for the overall impact of CAZ options on the local economy.
Accessibility – deprivation/income Accessibility – children Accessibility – elderly people Accessibility – disability Accessibility – sex1 Accessibility – ethnicity Affordability – business count
CSF 7 ‐ Improve general public health: with a focus on air quality impacts of CAZ options on a range of vulnerable groups.
Air quality – children
1 Note that the focus here relates to the distribution and accessibility issues relating to females only, as per JAQU’s Option Appraisal Guidance

8
Air quality – elderly people Air quality – disability
In line with the Options Appraisal Guidance the assessment is predicated on comparative mapping of the various socio‐economic groups outlined above in relation to the CAZ charging boundaries. It should be noted that based on the Guidance, the mapping compares communities in Bath and North East Somerset (measured at LSOA scale in most cases) against the national average. The analysis is only limited to Bath and North East Somerset and the wider study area (including the West of England authorities and other neighbouring authorities) where business counts are assessed. This reflects the sub‐regional rather than national focus on business counts, as outlined in the requirements of the Options Appraisal Guidance.
The comparative analysis also relates to the various CAZ charging options assessed. The impacts associated with each CAZ are compared across options, meaning that some impacts which are common across options are not considered in detail in the analysis below. For example, restricting access to the central area of Bath will be a feature of all charging options irrespective of extent of the zone. Therefore, resulting impacts related to reduced access to the central area will be consistent across options for residents of the central area. The differentiating factor is the extent to which each option will affect more people under a wider geography.
3.2 Evaluation Criteria 4: Mitigate financial impact on low income groups (high priority)
Implementation of a CAZ has the potential to disproportionately penalise vulnerable groups in society, depending on the geographic location, scale and the structure of vehicle compliance standards. In line with HM Treasury Green Book recommendations, any public‐sector intervention must consider the differential affordability impacts of proposals on vulnerable groups, including low income groups.
To understand affordability implications for different options, the distribution of low income groups in Bath has been determined through analysis of the Indices of Multiple Deprivation (2015) ‘Income Domain’. This analysis demonstrates which CAZ geographies incorporate specific concentrations of income‐deprived communities. Figure 3‐1 maps the distribution of low income households, and demonstrates that Bath and North East Somerset, as well as the rest of the wider West of England region, is considered to be a relatively affluent location in the UK.
That said, the analysis demonstrates that some central locations in Bath suffer from relatively high‐income deprivation, with city centre LSOAs featuring in the 20‐40% quintile for income deprivation. This may be surprising given the proximity to the historic core and affluent neighbourhoods in Bath City Centre. However, given that the income domain measures those people that are out‐of‐work and those that are in work but who have low earnings, the concentration of relative deprivation can be attributed two prevailing socioeconomic trends for city centre residents in Bath:
A high illness/disability ratio reflecting significant disability deprivation and potentially a high number of benefit claimants/people out‐of work;
A relatively high number of elderly residents, contributing to a high rate of people out‐of‐work.

9
Figure 3‐1: Distribution of income deprivation by households across Bath and North East Somerset (source: Indices of Multiple Deprivation, 2015)

10
Figure 3‐1 illustrates that some of the most income deprived communities nationally lie at the western extent of the large CAZ boundary. The small and medium CAZ boundaries predominantly cover more affluent communities located at the core of Bath City Centre. This suggests that a higher proportion of low‐income households are likely to be affected by the large CAZ boundary option and may be subject to affordability concerns.
Affordability issues are also likely to vary according to the structure of vehicle compliance standards. Affordability could be a material factor under Class D CAZ options, as a significant proportion of private vehicles will not be compliant with CAZ rules under such conditions and will therefore be charged. This could particularly be the case amongst low income groups where households may own older, less environmentally friendly cars.
Car owners in the low‐income areas are more likely to be impacted by Class D CAZ proposals as their vehicles are anticipated to be less compliant with standards. Moreover, those within the low‐income areas may not be able to afford to purchase a compliant vehicle. Therefore, existing car owners in low‐income areas are likely to be disproportionately penalised by CAZ proposals.
As a result, the best performing options from the perspective of affordability and minimising the impact of CAZ on low income groups are those options which propose a smaller geography and those options that do not seek to extend the CAZ charge to private vehicles (i.e. all Classes other than D).
3.3 Evaluation Criteria 5: Maximise health improvements of low income groups (very high priority)
To evaluate the effect of reduced emissions on public health, the annual emissions of NOx within each CAZ was assessed to understand the potential for reductions in ambient concentrations and human exposure. Air quality impacts effectively act as a proxy for the public health implications of CAZ options. Clean Air Zone options which cover a larger geographical area, and restrict a greater proportion of the vehicle fleet, will provide the greatest benefits in terms of public health. This is because such options reduce travel by non‐compliant transport modes more than other CAZ options. However, the analysis in the previous section of this report highlights that low‐income households are likely to be disproportionately exposed to pollutants due to the types of vehicles they drive, the locations in which they live and the type of jobs that they undertake. Therefore, the interaction between CAZ boundaries and the location of low income groups also needs to be considered.
As established above, low income groups in Bath and North East Somerset are concentrated to the west of Bath City Centre. These communities are located within the large CAZ boundary, but fall outside of the small and medium CAZ definitions. Therefore, not only will options covering the largest geographical area provide the greatest benefits in terms of public health in general, they will also maximise health improvements for low income groups specifically. Similarly, CAZ options that discriminate against a wider range of vehicle types (e.g. Class D), will reduce car usage to the greatest degree, thereby improving air quality impacts to the greatest degree and maximising health improvements for low‐income groups.
3.4 Evaluation Criteria 6: Net economic benefit (high priority)
Clean Air Zones have the potential to produce significant impacts for local economies. Evidence from congestion zones and other forms of charging in other locations (e.g. London) suggest that implementation of such schemes can have a range of positive and negative implications on local economies. Overall, London’s experience with its congestion zone suggests a broadly neutral impact of the scheme on economic and business activity once all positive and negative effects are combined.

11
Three broad types of economic impacts are considered in this assessment:
Transport economic efficiency impacts: related to journey time, delay and reliability enhancements.
‘Real’ Economy Impacts: related to safeguarding existing economic activity and promoting economic development to unlock new additional economic activity.
Accessibility impacts: allowing vulnerable groups to access economic opportunities and fully integrate with the local economy (as well as leisure, health and education opportunities).
Transport economic efficiency analysis is typically undertaken as part of conventional WebTAG‐compliant economic appraisal for transport business cases. For this project, such detailed analysis is not proposed until short‐listed options are taken forward to the next stage. Therefore, to inform the shortlisting process, a high‐level, qualitative analysis of the likely network‐wide performance under each CAZ option was undertaken. This analysis helped to identify the types of options that have the potential to support enhancements to transport economic efficiency most significantly.
For example, CH2M’s professional experience suggests that vehicle delay/journey times/congestion would be reduced most where the CAZ is implemented over the widest geographical area. Similarly, these metrics are likely to improve most where a wider range of vehicles are subjected to CAZ charging. This is because the number of vehicles affected by implementation of CAZ increases to the greatest degree as geographic and vehicle‐type coverage widens, meaning more vehicle users are incentivised to upgrade their vehicles and make alternative travel choices. However, it should be noted that transport economic efficiency benefits such as reduced vehicle delay, improved journey times and reduced congestion may only be temporary in nature, as highway capacity is taken up by latent travel demand and drivers that switch to compliant vehicles. In addition, the implementation of a Clean Air Zone may result in redistribution of trips outside of the zone, either within B&NES or in other authorities.
‘Real’ economy impacts relate to the change in metrics such as the number of businesses, jobs and gross value added (GVA) in response to implementation of CAZ options. These metrics are key indicators of economic activity and economic growth. The assessment of potential real economy impacts across CAZ options is underpinned by the assumption that implementation of CAZ could reduce the attractiveness of Bath and North East Somerset as a location to work and do business, due to more difficult access to/for consumer and labour markets.
Figure 3‐2 presents the distribution of businesses across Bath and North East Somerset. The mapping demonstrates high concentrations of businesses in central Bath, which will feature in all CAZ geographical extents.

12
Figure 3‐2: Distribution of businesses across Bath and North East Somerset (source: UK Business Counts, 2016)

13
Outside of central Bath, the majority of businesses in Bath and North East Somerset are located on the eastern and northern peripheries of the city. These locations fall outside of the identified geographic boundaries for the CAZ options. Instead, the large CAZ boundary extends primarily to the south‐west of central Bath, incorporating communities with fewer businesses and less economic activity. That said, the scale of existing economic activity potentially affected by CAZ boundaries will still increase significantly with widening geographic coverage of CAZ. Indeed, as demonstrated in Table 3‐1, the scale of economic activity located in the large CAZ zone doubles relative to the small CAZ zone.
Table 3‐1: Summary of businesses, jobs and GVA within each geographical boundary
CAZ Geographical Coverage No. of Businesses Jobs GVA per Annum
Small 2,425 28,000 £1.5 billion
Medium 3,395 40,000 £2.1 billion
Large 4,975 56,350 £3.0 billion
Taken together, this evidence suggests that from a ‘real’ economy impacts perspective, those options which propose a tighter geographical boundary and minimise the potential for vehicle non‐compliance are likely to pose a lesser threat to existing and future economic activity in Bath.
As noted, the case study evidence from London suggests that the net effect of congestion charges and similar interventions on economic activity is neutral overall. This is borne out in the high‐level analysis above, which suggests there may be a trade‐off between transport economic efficiency impacts and ‘real’ economy impacts. In particular, those options that induce improvements to transport economic efficiency (i.e. wider geographical boundaries, more discriminatory definitions of vehicle compliance) will have a potentially greater negative impact on ‘real’ economy metrics (businesses/jobs/GVA), and vice versa. In effect, schemes with a wider geographical coverage and wider definition of vehicles subject to CAZ charging could lead to the most beneficial impacts in terms of journey time savings but the most detrimental impacts from a business, employment and GVA uplift perspective. Conversely, schemes with a narrow geographical coverage and narrow definition of vehicles subject to the CAZ will have more limited positive effects on journey times and congestion, but a more limited negative impact in the attractiveness of Bath as a place to do business also.
The net economic consequences of the CAZ options can also be viewed in terms of the accessibility impacts affecting different vulnerable groups. The analysis is predicated on the assumption that where more people are likely to be exposed to CAZ conditions (e.g. with widening geographical coverage and/or widening definition of vehicle non‐compliance), accessibility will be reduced. As accessibility reduces, the potential to access employment and other economic opportunities will fall, leading to negative implication on the local economy. In effect, worsening accessibility leads to worsening economic conditions for those people affected. Within this context, the analysis below briefly considers the following vulnerable groups that could be impacted by accessibility changes in light of implementation of CAZ: low‐income groups, children, elderly people, people with disabilities, different sexes and ethnicity. The vulnerable groups could suffer from negative economic consequences as a result of reduced accessibility, if CAZ options discriminate against communities in which they are located.

14
As established in Section 3.1 and illustrated in Figure 3‐1, there are few areas with a high concentration of low‐income groups in the study area. Those areas that do exist are concentrated on the western outskirts of the Bath City, within the large CAZ boundary option only. As such, low‐income groups are more likely to suffer from reduced accessibility and subsequent reduction in economic opportunities under the large CAZ boundary option. Any impacts incurred via implementation of the small and medium CAZ boundaries will also be felt by the same receptors in these locations under the large boundary option too. As low‐income groups have a higher propensity for non‐compliant vehicles too (see Section 3.1), their accessibility is more likely to be impacted by Class D CAZ options.
Figure 3‐3 presents the distribution of children across Bath and North East Somerset, and demonstrates that there are few areas with a high concentration of children in the study area. Those that do exist are concentrated at the west and southern edges of Bath, within the large CAZ boundary option only. With imposition of the large CAZ boundary option, children in these communities will be disadvantaged in terms of access to education opportunities. They will be largely unaffected with implementation of the small and medium CAZ boundary options. Further, any accessibility impacts accruing for young people within the small and medium CAZ boundaries will also be felt by the same receptors in the same locations under the large boundary option too. Similarly, they will be more affected under wider definitions of vehicle non‐compliance.

15
Figure 3‐3: Distribution of children across Bath and North East Somerset (source: ONS Mid‐Year Population Estimates, 2016)

16
Figure 3‐4 presents the distribution of elderly people (aged over 65) across Bath and North East Somerset and shows that the study area is home to a large elderly population, which is primarily concentrated on the peripheral areas of Bath City, within the wider CAZ boundary option. Again, this means that the large CAZ boundary will impede accessibility for elderly residents to a greater degree than the small and medium boundary options. Further, any accessibility impacts accruing for young people under the small and medium CAZ boundaries will also be felt by the same receptors in the same locations under the large boundary option too. The larger CAZ zones will therefore impact on access to economic, health and leisure opportunities to a greater extent for elderly residents.
Figure 3‐5 provides the distribution of disability deprivation across Bath and North East Somerset, measured using the ‘illness and disability ratio’ (Indices of Multiple Deprivation, 2015). This indicates the number of residents with work‐limiting morbidity and disability, based on the number receiving benefits due to inability to work through ill health. The map indicates that communities with a high disability ratio are located throughout the study area, and are particularly concentrated in central Bath and on the western periphery. The disabled population in central Bath will suffer from reduced accessibility with the imposition of CAZ zones of all scales. However, whilst disabled residents on the western periphery will be restricted from the central area under all CAZ boundary options, the extent of accessibility impacts are likely to be greater under the largest CAZ boundary option as a greater range of economic opportunities and services are affected by larger CAZ designation. As such, larger CAZ extents will impact on accessibility, and therefore the economic opportunities for disabled people, to a greater degree than smaller CAZ boundary options.
Figure 3‐6 provides the distribution of females2 across Bath and North East Somerset, and demonstrates that females are disproportionately located on the periphery of Bath City. Central areas are home to communities with a relatively low proportion of women. As such, imposition of the smallest CAZ boundary will have lesser impacts on accessibility for females than larger CAZ zones.
Figure 3‐7 provides the distribution of ethnic minorities across Bath and North East Somerset, and demonstrates that few people with ethnic minority backgrounds reside in the study area. Therefore, minimal differentiation in the distributional impacts of the different types of CAZ zones is expected for ethnic minority groups.
In summary, the accessibility analysis of CAZ options on vulnerable groups generally suggests that larger CAZ geographies, and zones with a wider definition of vehicle non‐compliance, will reduce access to economic, health, leisure and education opportunities to a greater degree than narrower approaches. This is because peripheral locations in the study area, which are included to a greater extent in the larger CAZ zones, tend to have a higher number of vulnerable people. Further, vulnerable groups, and in particular low‐income groups, are more likely to own cars that are non‐compliant with wider definitions of CAZ vehicle classes than the general population (e.g. see Section 3.3). In addition, larger geographies restrict access to a greater number of jobs and service centres than smaller geographies, although the highest concentration of such facilities is within the city centre which is included in all assessed CAZ options.
2 As above, Note that the focus here relates to the distribution and accessibility issues relating to females only, as per JAQU’s Option Appraisal Guidance
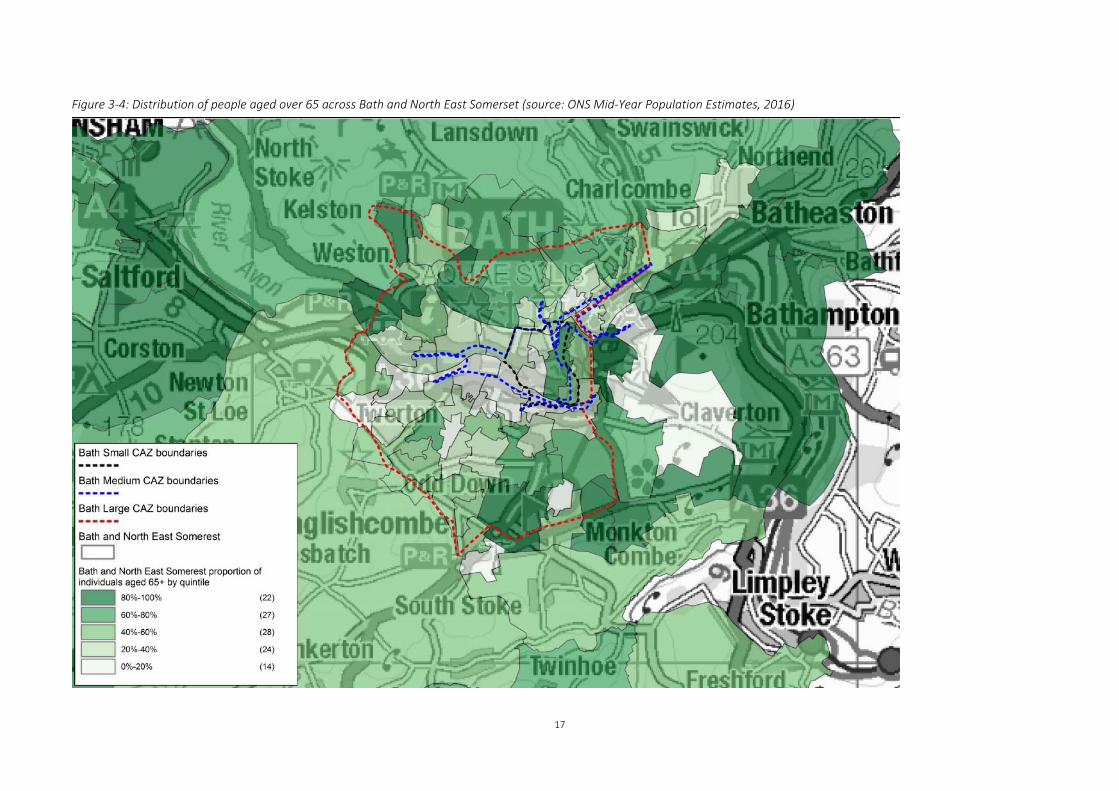
17
Figure 3‐4: Distribution of people aged over 65 across Bath and North East Somerset (source: ONS Mid‐Year Population Estimates, 2016)

18
Figure 3‐5: Distribution of disability deprivation across Bath and North East Somerset (source: Indices of Multiple Deprivation, 2016)

19
Figure 3‐6: Distribution of females across Bath and North East Somerset (source: ONS Mid‐Year Population Estimates, 2016)

20
Figure 3‐7: Distribution of ethnic minority groups across Bath and North East Somerset (source: ONS Mid‐Year Population Estimates, 2016)
21
3.5 Evaluation Criteria 7: Improve general public health (very high)
General public health impacts can be identified through air quality impacts of CAZ proposals. Within this context, CAZ options which cover a larger geographical area, and restrict a greater proportion of the vehicle fleet, will enhance air quality to the greatest degree and therefore provide the greatest benefits in terms of public health. This is because such options reduce travel by non‐compliant transport modes more than other CAZ options.
Whilst the air quality and subsequent public health impacts on low‐income groups was considered under Evaluation Criteria 5 (health improvements for low income groups), the focus of the ‘general public health’ Evaluation Criteria relates to distributional impacts on other vulnerable receptors including children, elderly people and people with disabilities.
LSOA‐level analysis revealed the Bath and North East Somerset is home to a relatively elderly population with a lower proportion of young people and a higher proportion of people aged over 65 relative to the national average. This is demonstrated in Figure 3‐3 and Figure 3‐4. Only two LSOAs in the study area feature in the top quintile for the proportion of children within their population, both of which feature within the large CAZ boundary only. The majority of LSOAs covered by all CAZ boundaries have a small proportion of children as residents, and therefore feature in the bottom two quintiles. As a result, there is only minor differentiation in the air quality and subsequent public health impacts for children across the various CAZ options, with the larger CAZ options likely to affect a higher number of children. From a vehicle compliance perspective, a Class D CAZ option would restrict non‐compliant vehicle usage more than other CAZ options, further enabling air quality improvements and therefore general health improvements for children.
LSOAs with a high proportion of residents aged over 65 are distributed on the periphery of the City of Bath and in rural areas as shown in Figure 3‐5, with the city centre core supporting a relatively younger, working‐age population. The concentration of LSOAs with an elderly population is higher to the south and north of Bath and as a result, the small and medium CAZ boundaries do not include LSOAs with high proportions of elderly people. Therefore, options restricted to smaller geographical areas are unlikely to have a significant impact on air quality and public health in LSOAs with high concentrations of elderly people. Conversely, options with larger geographic coverage are more likely to bestow air quality and public health benefits on elderly populations in peripheral communities. From a vehicle compliance perspective, a Class D CAZ option would restrict non‐compliant vehicle usage more than other CAZ options, further enabling air quality improvements and therefore general health improvements for elderly residents.
Measured in terms of the comparative ‘illness and disability ratio’ (Indices of Multiple Deprivation, 2015), Bath and North East Somerset is characterised by relatively low levels of disability‐based deprivation as shown in Figure 3‐5. This map demonstrates that two LSOAs in central Bath and a number of LSOAs on the western edge of the city are amongst the most deprived communities nationally from the perspective of disability. As a result, the air quality impacts associated with all CAZ options will significantly improve public health for some communities with high rates of disability. That said, only the deprived LSOAs in central Bath are likely to directly benefit from air quality improvements under the small and medium CAZ geographic coverage. Those deprived LSOAs on the western edge of the city will only directly benefit if the large CAZ boundary is implemented. From a vehicle compliance perspective, Class D CAZ options restrict non‐compliant vehicle usage more than other CAZ options, further enabling air quality improvements and therefore general health improvements for people with disabilities.

22
In summary, general public health improvements correlate with air quality improvements, which tend to be more significant under options which cover a larger geographical area and restrict a greater proportion of the vehicle fleet. Focussing on three specific vulnerable receptors generally supports these findings:
Few LSOAs have a high proportion of young people, therefore there is only minor differentiation between the potential distributional impact of different CAZ options on children, but;
A number of LSOAs have a high proportion of elderly people. These are located in peripheral locations and would therefore only be directly, beneficially affected under CAZ options with wider geographical coverage, and;
A number of LSOAs have a high rate of disability deprivation. Whilst these are located throughout the City of Bath, only those CAZ options with the widest geographical coverage would directly benefit all of these communities.

23
Commercial Evaluation Criteria
4.1 Evaluation Criteria 8: Is the market able to supply in the time available? (high priority)
A significant commercial risk for a CAZ is the ability to deliver an effective service for monitoring and managing of the CAZ within a defined timescale. This risk exists for all proposed charging CAZ options and relies upon adopting a suitable approach to design, procurement, supplier selection and implementation of the chosen solution. Currently, monitoring of a CAZ can only be done effectively through the use of technology, specifically that which identifies the vehicle registration mark (VRM, commonly known as the ‘number plate’) of all vehicles entering and/or moving within the CAZ.
The procurement approach for the CAZ is likely to be the same, or similar, regardless of the chosen CAZ option and is discussed further in the Commercial Case of the Strategic Outline Case. The key determining factors for risks related to procurement and installation of an ANPR system within the identified timescale are the number of ANPR cameras required and the associated signage and road markings to be installed. The central system, being largely unaffected by the extent of the CAZ, is less of an issue in terms of deliverability. The larger the number of ANPR cameras needed, and the greater volume of signage required, the longer time period will be needed for:
CAZ system designers to determine locations and provide designs for each boundary and intra‐zone ANPR camera and all associated road signage and road markings;
CAZ system supplier(s) to manufacture and supply the ANPR cameras;
CAZ system supplier(s) (or the camera installer(s), if different) to install, test and commission the cameras;
road signage suppliers to manufacture and supply the required signage; and
civils works contractors to install signage and road markings, as well as any other associated physical changes to the road network (e.g. road/junction realignment, barriers).
Each of the identified CAZ areas was examined to determine the extent of roadside equipment (i.e. ANPR cameras) and road signage/markings needed to provide effective monitoring of vehicles entering and moving within the CAZ, and to ensure that drivers were made aware when they were about to enter the CAZ or were inside it. A direct correlation was then made between the volume of cameras and road signage/markings needed and the delivery risk whereby the greater the volume needed, the greater the risk.
It was determined that the small CAZ required the lowest volume of cameras and road signage/markings from all options and therefore carries the lowest delivery risk. In comparison, the medium zones require a considerable volume of cameras and road signage/markings and therefore could carry a considerably higher delivery risk. It is noted that the AQMA boundary could be further refined to produce a more logical boundary for a CAZ, and reduce the number of cameras required. This will be considered within the OBC if the medium charging option is progressed for further assessment.
The deliverability of the project also will depend to some degree upon which procurement approach is taken including how many different suppliers are involved and when their services are procured. This will also be impacted by the extent of all other Clean Air Plans nationally, as the same suppliers are likely to be engaged to deliver those projects as well. As such, deliverability cannot be considered in isolation for Bath and needs to be evaluated as part of a wider national picture.
There are four key routes available for procurement and these are:
Local authority tendering through an approved List (shortlist) of invited suppliers;
Through existing City Council Frameworks;
Open tender through the Official Journal of the European Union (OJEU); and

24
Through Crown Commercial Services (CCS), the UK Government’s professional procurement service for the public sector.
Each has advantages and disadvantages which are discussed in the Commercial Case of the Strategic Outline Case and the current preference would be to procure the majority of works utilising existing Council framework documents, where established relationships and supply chains are in place. Where this is not appropriate a separate procurement process through OJEU would be undertaken.
Although the CCS appears favourable for a large scale single procurement exercise which could bring economy of scale benefits to JAQU and all authorities collectively involved, there is significant risk that agreement amongst all local authority parties involved on issues such as specification, functionality as well as ongoing maintenance could take a long time to establish and ultimately delay scheme delivery. Furthermore, access would only be provided to a limited pool of suppliers using CCS who may then struggle to meet the demands of the 15 Local Plans (29 Local Authorities) simultaneously.
Consideration should also be given as to the most effective way to provide access to the DVLA database for checks to be carried out on vehicle type and classification, especially where any disputes or appeals may arise. A live link would have benefits of providing timely data however it may be preferable to undertake larger data downloads during quieter periods eg. overnight to reduce strain and any associated costs using communications networks.
The current assumption is that B&NES staff would utilise the existing JAQU access arrangement given the cost is quite significant to receive the DVLA database and this would reduce expenditure. However, there could be a number of competing demands for this access once a number of schemes nationally become ‘live’. However, B&NES could establish their own direct access to the DVLA database which may be more appropriate once a CAZ scheme is launched. This would also offer benefits across other B&NES schemes/projects which would look to make use of the same data. Costs could potentially be shared within the Authority thereby reducing the overhead on the CAZ project.

25
Financial Evaluation Criteria
5.1 Evaluation Criteria 9: Likelihood of revenue equating to operational costs (high priority)
If the charges for a Clean Air Zone are set at a level which maximises behaviour change, and therefore air quality improvements, the level of revenue generated by the scheme is likely to be minimal since few people will pay the charge and instead choose to replace their vehicle, switch mode or alter/cancel their trip. The likelihood of revenue equating to operational costs is therefore an important consideration when designing the scheme.
Defra’s Clean Air Zone Framework states that the level of charging for a CAZ should not be set in order to raise revenue, however any excess revenue above the costs of operation should be ‘re‐invested to facilitate the achievement of local transport policies and these should aim to improve air quality and support the delivery of the ambitions of the zone’. This is interpreted as any additional revenues received above the operating and maintenance costs for CAZ could be used by the Council to pursue other ‘Clean Air’ initiatives that are outside of the compliance criteria of the CAZ scheme.
The revenue accumulated from the CAZ will be used to cover the cost of operation and maintenance. However, should this not be sufficient it is expected that contributions from the Implementation Fund will cover this shortfall.
Currently, detailed revenue modelling has not been undertaken. However, initial qualitative assessment for charging elements of shortlisted options suggests that:
Options with larger geographic coverage will have larger implementation and ongoing operational and maintenance costs
Options with less overall traffic concentrations within them will provide less revenue even with all vehicle categories included
On the above basis, it is expected that shortlisted options that have a higher concentration of traffic per square mile are most likely to recover sufficient revenues to cover operational and maintenance costs.
Excluding vehicle categories from the charging mechanisms would reduce revenue and thus affordability of options.
Increased proportions of non‐charging components of options will reduce the affordability of options
5.2 Evaluation Criteria 10: Upfront capital required for scheme (low priority)
The assessment summarised in this section presents initial ranges of upfront capital costs required to implement the options. The key drivers for the cost analysis, which focuses on the charging element of each of the shortlisted option, have been:
The number and location of ANPR cameras: Cameras are critical to effective monitoring and identification of vehicles entering and moving within the CAZ. This requires an ANPR camera at each point of entry into the CAZ (referred to herein as the “boundary camera”) as well as ANPR cameras within the CAZ (referred to herein as an "intra‐zone" camera) to identify those vehicles that move within the CAZ. The more complex the road network and the more entry points the greater the number of cameras that will be required.

26
Costs associated with road signs, road markings, back‐office operational costs, maintenance, communication links, power supply and publicity requirements: The number of ANPR cameras required, and the associated costs related to road signage and road markings (to make drivers aware), make up a significant proportion of the overall cost of a CAZ and these elements are related to the geographic size of the CAZ.
Indicative unit costs were generated for each element of the CAZ system based upon average market prices for roadside, back office and communications infrastructure and services required to deliver the system. Required quantities of equipment (e.g. number of ANPR cameras) were estimated for each of the three zones and overall capital and operating costs for each zone were generated from factoring the unit prices and quantities.
The major cost in all cases is for supply and installation of the ANPR cameras. The number of cameras in each zone was estimated using a two‐stage map‐based analysis. The first stage involved identifying the number of boundary cameras by examining the camera requirement for each entry point into the zone using digital maps and Google Street View™ mapping service as references. This included identifying any restrictions that could influence the number of cameras needed at each entry point (e.g. number of lanes, no entries, banned turns).
The second stage differed according to zone size. For the small zone, a detailed examination of all routes within the zone was carried out to determine whether there were suitable locations for cameras to maximise potential for capture of vehicles travelling within the zone. It was felt due to the small zone size and limited route choice through it that the most practical solution was to install cameras only at the boundary entry/exit points. These would capture all vehicle movements both into and out of the zone.
The medium zone which comprises the small zone plus various extensions which follow the alignment of the existing AQMA area, followed a similar methodology using digital mapping and Google Street View™. However, a small number of intra‐zone cameras were proposed as well as additional boundary cameras. Drivers in a limited number of instances would be able to travel short distances within the zone effectively making ‘staggered’ movements in order to cross it without penalty. This is due to the medium zone alignment comprising single roads only in places. That said, in the majority of cases vehicles would be detected making short journeys inside the zone. The medium zone would include the cameras from the small zone so future expansion from the small zone to the medium sized zone would be relatively straightforward should this approach be taken.
The large zone covers several larger residential areas on the outskirts of the city and the ANPR cameras proposed within this sized zone would allow some short journeys to be made within each residential area using a limited number of streets before vehicles were detected. Cameras are proposed in most instances at junction locations sometimes on separate posts to reduce the number of cameras required whilst capturing all turning movements.
With the larger zone we have been especially strict in precluding the ability of drivers to undertake intra‐zone trips. Due to the number of residential streets involved within the largest zone coupled with the Unesco heritage status of Bath it was felt that increases in traffic on adjacent/alternative residential streets would be unacceptable. Therefore, several intra‐zone cameras are located where air quality is currently of an acceptable level but could rise sharply, should drivers seek an alternative residential route in order to avoid CAZ charges.
The other notable "on‐road" costs are for streetworks, data communications and power supplies. This includes camera mounting, housings, power and communications equipment as well as CAZ signing and road markings. The total cost for such works was factored by the number of locations where one or more cameras are required, i.e. not by the number of cameras as there will often be multiple cameras at each location.

27
In estimating capital cost for the data communications services, it was assumed that the existing Council owned private optical fibre network would be used where available; this network is extensive within the small zone and in many parts of the medium zone. However, coverage reduces significantly approaching the boundary of the large zone, although there is still coverage on some major roads. Nonetheless, for indicative costing purposes private Council fibre is envisaged to be provided (a nominal charge per site has been assumed) to each camera location within the small and medium zone. Within the large zone only 50% of sites are assumed to be connected via Council owned private fibre. The same approach has been taken for all three zones for streetworks and power supplies i.e. factoring the number of camera locations by the unit costs per location.
Back office system costs comprise two elements. The first is a nominal unit cost factored by the number of cameras in the zone. In practice there will be economies of scale to central system implementation that may significantly reduce this unit value. The second element is a nominal value for control room selection and fitting‐out, assuming that a new control room is required. In Bath there may be an opportunity to utilise existing Council control room facilities but such opportunities are not clear at this stage so a "worst case scenario" has been assumed for a new control centre facility.
The other notable capital cost identified is for project management at 20% of total system cost (on‐road and back office). This is a typical guideline percentage for such costs at this initial design stage, which is expected to reduce once the details of the proposed scheme become clear.
Operating costs were calculated on similar lines to capital costs. The major operating cost is for maintenance of roadside equipment, whereby a unit (per camera) maintenance cost was derived and factored by the required number of cameras. Maintenance of signing and road markings was also calculated, as were those for the communications network and ongoing costs of power supplies, all of which were derived as a percentage (20%) of the capital cost for these elements. It should be noted that ongoing costs for the communications network assume that the Council‐owned private fibre network is used with no ongoing cost for this provision.
A nominal number of 3G sim cards (20) within the small and medium zone have been assumed. This would enable communication service to any camera site where fibre connection may not be able to be provided. This number rises significantly to 150 3G sim cards within the large zone although the assumed fibre connection cost will be avoided. The cost of annual maintenance of the fibre (per site) is similar to the annual cost of a 3G sim card so operating costs would be similar per annum, whichever communications medium is used.
Bath and North East Somerset Council will shortly introduce a wi‐fi network predominantly across the central zone which may be able to be utilised but at this time the project has not yet commenced so this is unclear. There could of course be issues with latency and/or security so it is likely not appropriate for use in this instance. In any case the cost apportioned for 3G communications is relatively small by comparison to other project costs, so any saving made using a Council wireless network would be negligible.
Maintenance of the back office CAZ system and control centre building maintenance are also included as a percentage (20%) of their respective capital costs.
Other operating costs include staffing (up to 12 operations staff and 3 supervisory staff, depending on zone size) and a nominal fixed ongoing charge (£50,000/year) for DVLA database enquiries. This latter element will, however, be highly dependent on the extent to which national government provides such data services on behalf of those local authorities implementing CAZ systems.
A 20% uplift for contingency was included for all of the above capital and operating costs, and costs were further uplifted through the inclusion of optimism bias at 40%.

28
It is likely that capital and operating costs for each zone will be revised downwards as further detail is known of the precise requirement for cameras (and associated signing, etc.) and the specification for the back office facilities is further developed. Also, the extent to which national government provides CAZ data services (e.g. VRM enquiries to DVLA) on behalf of local authorities will bring about further refinement of the capital and operating costs for the central system.
It should also be noted that costs for the medium zone are also largely dependent upon the proposed shape of the boundary. The boundary is currently defined by a number of corridors rather than comprising a simple boundary bisecting radial routes as for the small and large zones. This increases the number of cameras needed to capture the large number of entry points onto each corridor. As this boundary become more refined it is expected that the number of cameras will reduce accordingly, and thus the capital and operating costs associated with the medium zone.
At this SOC stage we have not considered the need for additional traffic management to restrict alternative movements around the CAZ.
The summary of the charging elements of each of the shortlisted options is summarised in Table 5‐1 below. The analysis confirms that the costs are sensitive to the geographic scale rather than the charging classes. In summary, the options which cover larger geographies will result in higher implementation costs.
Table 5‐1: Summary of ANPR cameras required and approximate capital costs
Number of ANPR Cameras Approximate Capital Cost
Small CAZ (any Class) 40 £1‐3 million*
Medium CAZ (any Class) 85 £4‐6 million*
Large CAZ (any Class) 220 £8‐12 million*
* Approximate capital costs include a 40% optimism bias
5.3 Evaluation Criteria 11: Risk of financial penalty to the Council (medium priority)
This evaluation criteria captures the potential risk that financial penalties could be enforced by the EU on the UK government in response to ongoing exceedances of the legal limit of NO2. This risk is minimised by options which improve the concentrations within Bath to below the legal limits.
Analysis undertaken has demonstrated that it is likely that any of the geographies assessed would be sufficient to rectify exceedances in Bath in 2021. The small geography assessed provides the least certainty to this assumption since there are of number of known exceedances outside of the boundary. The medium and large geographies include all known exceedances and so has a greater potential to reduce this risk.

29
Management Evaluation Criteria
6.1 Evaluation Criteria 12: Public acceptability (medium priority)
A public consultation on the BANES Air Quality Action Plan was undertaken in Autumn 2017. Overall 277 responses were received; and 1199 individual comments. The list of measures that were consulted on included a feasibility study considering a Clean Air Zone in Bath (a generic scheme, rather than specific to a particular boundary or Class) which received 79% support from the public.
The engagement work with the public in relation to the project has only just commenced, and so little feedback has been established on the public acceptability of the CAZ options considered within this document. Ongoing engagement and consultation work will be undertaken throughout the remainder of the feasibility study which will provide the opportunity for this to be established, and for the public to contribute to the development of the scheme.
The scoring of each option against this evaluation criteria has been undertaken by assessing the likely response from the public based on the proportion of the population included within the CAZ, and the types of vehicles and trips impacted by the CAZ. Particular focus has been given to the impact on businesses and low income areas.
Those options which include car trips, Class D, are anticipated to provoke the strongest public reaction. In addition, the larger the proportion of the city included within the CAZ, the greater the potential for public opposition since a higher number of residents are included within it. A larger zone also has higher potential to impact on low income groups and businesses since a wider geographic coverage incorporates a larger number of both.
6.2 Evaluation Criteria 13: Local, regional and national political acceptability (medium priority)
Politicians are elected to represent the public in local and national government. As such, the political acceptability of a CAZ scheme is intrinsically linked to the public acceptability. However, there is mounting pressure on the UK government to tackle the issue of air quality in the UK and particularly in urban areas where the associated damage to public health is most pronounced. The ‘UK Air Quality Plan for tackling nitrogen dioxide concentrations’ July 2017, places much of the responsibility for implementing measures to effectively reduce concentrations of harmful pollutants in the hands of local authorities.
Local politicians have been, and continue to be, supportive of measures to improve air quality and recognise the importance of understanding air quality impacts when determining appropriate action throughout a range of ongoing transport projects. The Clean Air Plan is viewed as an opportunity to improve Bath city centre by providing a cleaner and more pleasant environment for residents and visitors alike. The legal obligations upon the Council are well understood by local politicians and this is anticipated to be reflected in their viewpoints.
Accounting for all these elements, it is anticipated that political acceptability will largely be correlated with public acceptability, but in certain instances may be more favourable than general public opinion.

30
Summary The final scores allocated to each option against each evaluation criteria is set out in Table 7‐1 overleaf.
The highest score available in the scoring system is 81. Any option which scores more than 75% of the total possible mark, a score of 61 or higher, has been accepted as feasible and will be taken forwards for more detailed assessment within the OBC.

31
Table 7‐1: Scoring of Charging Measures against Evaluation Criteria
Scheme Priority Level
Large: Class B
Large: Class C
Large: Class D
Medium: Class B
Medium: Class C
Medium: Class D
Small: Class B
Small: Class C
Small: Class D
Timescale to achieve compliance 2021 2021 2021 2021 2021 2021 2021 2021 2021
Deliver compliance with NO2 air quality limit values and objectives in the shortest possible timescales
Pass/Fail Pass Pass Pass Pass Pass Pass Pass Pass Pass
All trip purposes treated equitably Low (1) 1 2 3 1 2 3 1 2 3
Compliance with the CAZ framework High (3) 2 2 2 3 3 3 3 3 3
Mitigate financial impact on low income groups High (3) 1 1 1 2 2 1 3 3 2
Maximise health improvements of low income groups
Very High (4)
2 2 3 1 2 2 1 1 2
Net economic benefit High (3) 1 1 1 2 2 2 3 3 2
Improve general public health Very
High (4) 2 2 3 1 2 2 1 1
2
Is the market able to supply in the time available? High (3) 1 1 1 2 2 2 3 3 3
Likelihood of revenue equating to operational costs High (3) 1 1 2 1 2 2 2 2 3
Upfront capital required for scheme Low (1) 1 1 1 2 2 2 3 3 3
Risk of financial penalty to the Council Med (2) 1 1 2 2 2 3 2 2 3
Public acceptability Med (2) 2 1 1 3 2 2 3 3 2
Local, regional and national political acceptability Med (2) 2 2 1 3 2 2 3 3 2
Weighted Average Score (excluding financial CSFs) 42 41 50 52 57 57 61 62 63
Decision Reject ‐
Low scoring
Reject ‐ Low
scoring
Reject ‐ Low
scoring
Reject ‐ Low
scoring
Reject – low
scoring
Reject – low
scoring Feasible Feasible Feasible

Appendix A 2016 Measured Annual Mean NO2


V
Annex E Logic Map

Inputs Outputs Outcome Impacts
Use variable message signs to promote
air quality improvement messages.
Potentially mobile and real-time
responsive signs
Increase public awareness
of air quality issues
Increase in active travel
modes
Increase the number or usage of existing
VMS signs to provide information about
parking and reduce unnecessary trips
into the city centre
Increased usage of P&R or
other sustainable modes
Reduction of trips made
using a polluting vehicle
Vehicles spend less time
searching for a car parking
space in the city centre
Reduction in vehicle
kilometres and queueing in
the city centre
Expansion of car club network in BathIncreased oppurtunity to
access the city centre
Reduction in
use/ownership of
uncompliant vehicles
Implement reduced residents’ parking
permit cost for low emission vehicles
More residents buy low
emission vehicles
Increase in number of
journeys made in a low
emission vehicle rather
than conventional vehicle
Reduced spend on
parking permits
Promote low emission vehicles for
Hackney carriages/private hire through
review of taxi licensing policy
Increase in use/purchase of
low emission vehicles
Additional cost to the
Hackney carriage/private
hire business if bringing
purchase forward
Temporary reduction in
profitability during
transition period
Promote car sharing through pilot of
smart phone applicationIncrease in car sharing
Reduction in number of
vehicles making journeys
Pilot car sharing priority parking areas
Reduction in parking spaces
for people not sharing rides
Reduction in accessibility of
the city centre for journeys
where car sharing is
impractical
Modal shift to walking,
cycling, public transport
Sunset period to exempt Euro 5 diesel
vehicles to enable longer for upgrades
People have more time to
upgrade their vehicle
More polluting vehicles are
used for a longer time
period
Smaller reduction in NO2
and PM during this time
Soften the financial
implications of upgrading
vehicle by allowing a longer
time period
Reduce peak in demand for
less polluting vehicles
Market more able to
meet demand for less
polluting vehicles
Targeted traffic management or
improved bus priority on A367 Wells
Road
Temporary delays to
vehicles during
construction
Temporary disruption to
road network
Reduction in queueing or
vehicles numbers at the
junction
Replace experimental TRO for bus lane
on London Road with permanent TRO
Maintain improvement in
journey time for buses
Reduced time bus is slow
moving or queuing
National
funding
streams
Increased pressure on
public transport services
Revenue
Implement public transport route
improvements including bus priority,
passenger information and waiting
facilities (target particular routes or
demographics)
Increased use of public
transport services
Increased revenue from
public transport
Investment in public
transport services
Modal shift from private
vehicles to public transport
Attractive places
Reduction in journeys
made using a polluting
vehicle
Reduced
congestion
Cancellation of journeys Benefit to local economy
Reduced footfall to local
businesses
Journeys made as before
but at a cost to the driver
Increased percentage of
the public's income spent
on travel
Reduced options
for access to city
centre especially
low income
households
Damage to local economy
Retail/ business
activity relocated
Benefit to other
authorities local economy
Avoid zone - Drive
somewhere different
Reduced traffic
emissions within
the zone
Increased traffic
emissions outside
of the zone
Disbenefit to public
health
Buy
different
vehicle
Benefit to economy
Increase in pollutants
such as CO2
Provide additional cycle parking across
the city centre in visible locations. Pilot
a management scheme for use of cycle
parking
Increase in journeys made
using a less polluting
vehicle
Expand proposal (included in Go Ultra
Low package) to introduce electric cycle
hire to the city. Assumed at most 1,000
could be delivered
Modal shift from private
vehicles to walking and
cycling causing increase in
active travel
Reduction in
journeys made
using polluting
vehicles
Health benefits associated
with active travel
Extend walking and cycling priority
schemes and encourage greater modal
shift. Provide a safer environment for
cycling and walking
Reduced accidents
involving pedestrians and
cyclists
Charging Zone
Reduction in
NO2 and PM
emissions
Benefits to
public health
Increased
attractiveness
as a place to
live, work and
visit