Strategic management - Class1 group 10-presentation-case 34- keurig
46
Keurig case Group 10: Le Hoang Kim Duyen-2959 Class 1 - Group 10 – Case 34 Le Hoang Kim Duyen – 295895 Tran Nhat Ha – 295921 Nguyen Hoang Hung – 295907
-
Upload
hung-nguyen-hoang -
Category
Business
-
view
664 -
download
8
description
Strategic management
Transcript of Strategic management - Class1 group 10-presentation-case 34- keurig

Keurig case
Group 10:
Le Hoang Kim Duyen-2959
Class 1 - Group 10 – Case 34
Le Hoang Kim Duyen – 295895
Tran Nhat Ha – 295921
Nguyen Hoang Hung – 295907

Industry Overview
Company History
Mission Statement and Vision
Products
Brands and the patented technology
Maps of where the company does business
Operational Structure
Financial Statement
SWOT Analysis

Where is the Keurig product in the life cycle?
How To Expand
Financial Conditions
Marketing Advertisement
E-commerce
Analyzing The Presence Market
The Competition -The Competitive Advantages
Internal Factor Matrix
External Factor Matrix
Competitive Profile Matrix
SPACE Matrix
GRAND Matrix
Quantitative Strategic Planning Matrix
The Problems-Market Development
The Timetable

The single cup coffee industry has grown in recent years:
• 2010 sales: 14 million dollars
• 2012 sales: 63 million dollars
45% growth
Conversely, bagged coffee has sagged
• 2010 sales: 274.8 million dollars
• 2012 sales: 297 million dollars
8% growth
Industry Overview

Company History
• Founded in the mid-90’s by Peter
Dragone and John Slyvane who believed
coffee should always be served fresh –
whether at home or at the office.
• Launched first commercial single-cup
brewer in 1998
• Keurig was acquired in 2006 by Green
Mountain Coffee Roasters, Inc.(GMCR)
and is a wholly-owned subsidiary of
GMCR

Mission and Vision
Mission Statement:
Brewing excellence one cup at a time®
Vision:
Keurig vision is to be the leading
specialty coffee company by providing
the highest quality coffee, having the
largest market share in the targeted
market while maximizing the company
value.

• K-Cup® System is an original single-cup brewing maker which is designed
to brew a single cup of coffee, tea, hot chocolate, or other hot beverage
• Keurig also obtains, produces, and sells various kinds of coffee, teas, cocoa
and other form of beverages in K-cup portion packs and coffee in
conventional packaging style

Keurig Vue System
Keurig improves its technology with the advent of Vue® System as a huge step
of innovation.
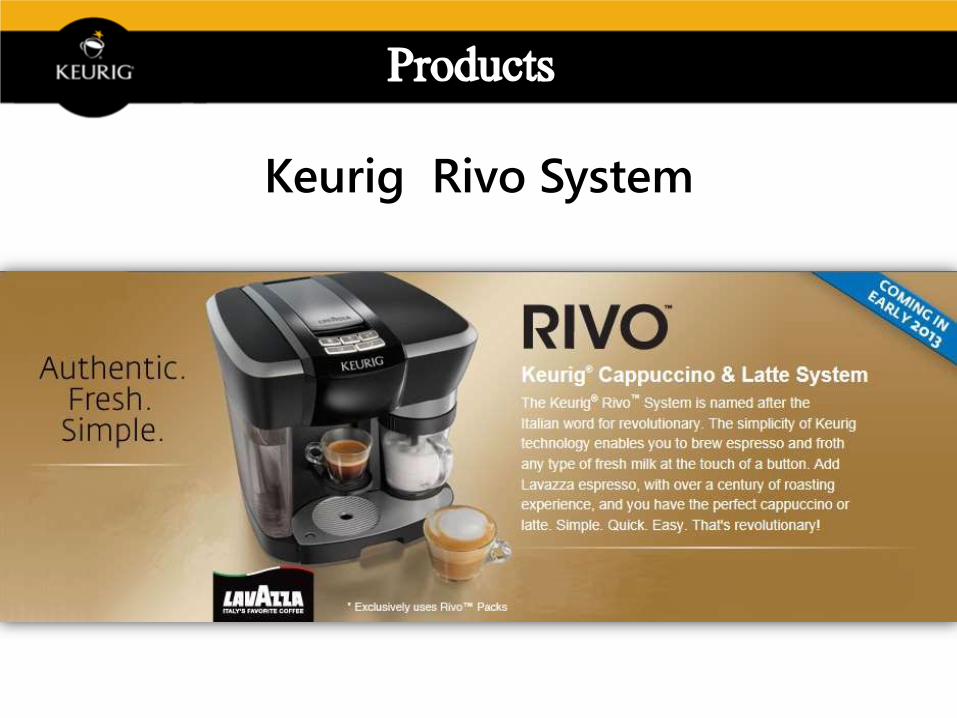
Keurig Rivo System

Owned Brands
®
Licensing/Manufacturing Agreements

Our Global Supply Chain Footprint

Sumner, Wa Montreal, Canada
Vermont *
Toronto, Canada Reading, MA
Castroville, CA
Knoxville, TNOur facilities
Canadian Business Unit
Keurig Business Unit
Specialty Coffee Business Unit
Enterprise Staff

Supply-chain partnerships
As our supply chain spans the globe, so does our supply-
chain outreach
CIAT /Catholic Relief Services
Central America, Guatemala
• Climate change adaptation
• Food security
Partners in Health
Mexico, Guatemala
• Health care - Food security
• Child and maternal health
• Environmental health
Grounds for Health
Mexico, Central America
• Women’s health
The Coffee Trust
Guatemala
• Food security - Education
• Income diversification
Coffee kids
Nicaragua, Guatemala, Mexico, Peru,
• Education - Income diversification
Heifer International
Mexico, Honduras, Peru
• Food security
Save The Children
Nicaragua, Honduras, Bolivia
• Children’s health - Food security
• Income diversification
Community Agro Ecology
Network
Nicaragua
• Food security - Youth training
Planting hope
Nicaragua
• Food Security
• Education
Café Femenino
Peru
• Access to clean water
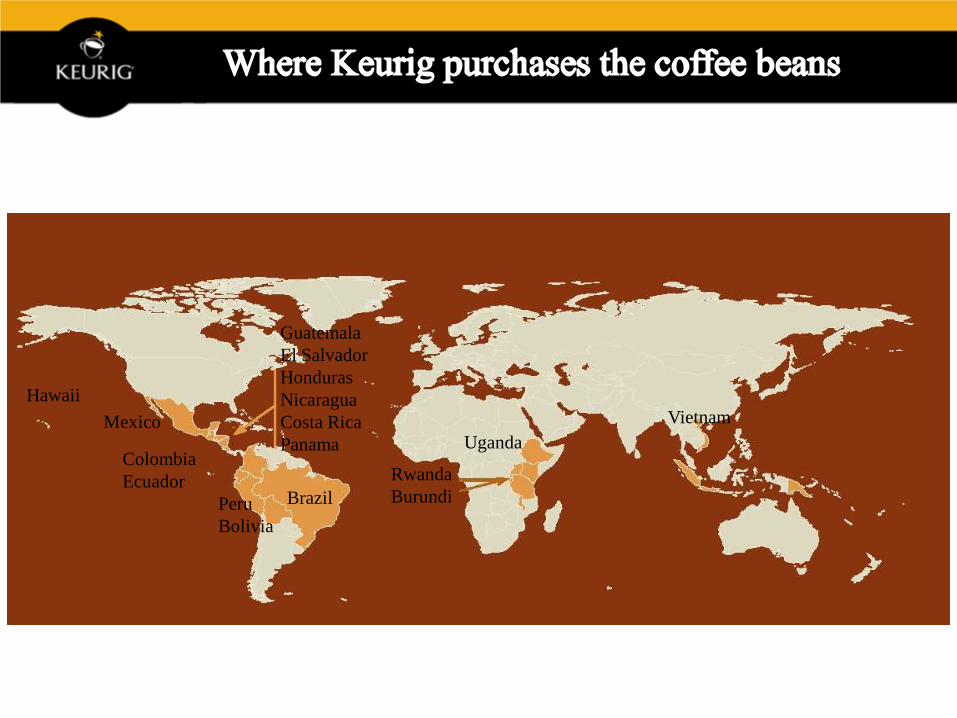
Hawaii
Mexico
Colombia
Ecuador
Peru
Bolivia
Brazil
Guatemala
El Salvador
Honduras
Nicaragua
Costa Rica
Panama Uganda
Rwanda
Burundi
Vietnam


Period Ending 29-Sep-12 24-Sep-11Net Income $ 362,628 $ 199,501
Operating Activities, Cash Flows Provided By or Used In
Depreciation 187,697 119,794
Adjustments To Net Income 150,182 19,782
Changes In Accounts Receivables (159,317) (157,329)
Changes In Liabilities 35,954 205,368
Changes In Inventories (92,862) (375,709)
Changes In Other Operating Activities (7,369) (12,169)
Total Cash Flow From Operating Activities $ 477,785 $ 785
Investing Activities, Cash Flows Provided By or Used In
Capital Expenditures (401,121) (283,444)
Investments 137,733 -
Other Cash flows from Investing Activities (2,257) (904,228)
Total Cash Flows From Investing Activities (265,645) (1,187,672)
Financing Activities, Cash Flows Provided By or Used In
Dividends Paid - -
Sale Purchase of Stock (64,378) 981,472
Net Borrowings (124,099) 223,317
Other Cash Flows from Financing Activities 3,283 -1,063
Total Cash Flows From Financing Activities (173,124) 1,199,845
Effect Of Exchange Rate Changes 1,124 790
Change In Cash and Cash Equivalents $ 45,300 $ 8,588
Cash Flow

Short-term solvency, or liquidity, ratios 2011 2012
Current ratio 2.4 2.55
Quick ratio 0.98 1.07
Cash ratio 0.03 0.11

Long-term solvency, or financial leverage,
ratios2011 2012
Total debt ratio 0.4 0.37
Debt-equity ratio 0.3 0.2
Equity multiplier 1.67 1.6
Time interest earned ratio 1.54 0.27
Cash coverage ratio 1.54 6.17
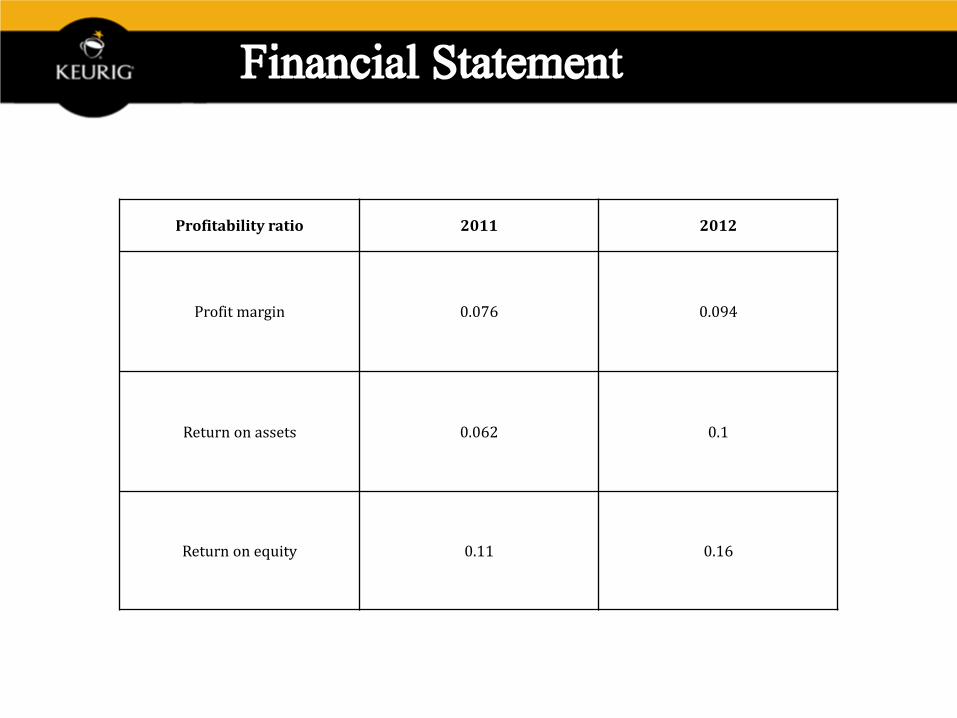
Profitability ratio 2011 2012
Profit margin 0.076 0.094
Return on assets 0.062 0.1
Return on equity 0.11 0.16

Strengths:
The patented technology
Large varieties
Quality of product
Longer shelf life of product
Customer brand loyalty
Brand awareness
Opportunities:
Global market typically untapped
Increasing in the growth of industry
Quality considered important by
consumers
Increasing trend of specialty coffee
drinkers
Weaknesses:
Past failure strategic decision
Inappropriate strategic vision
Little brand presence
Few strategic alliances
Threats:
Decline in coffee consumption
High competition
Price volatility
Heavy reliance on specialty coffee
farms

Where is the Keurig product in the life cycle?

How To Expand
• Growing our Keurig® hot brewing system in North America.
• Launching new brewer technologies.
• Entering new beverage categories.
• Expanding in current channels.
• Offering new brands.
• Entering new geographies, with an initial focus on four countries
worldwide.
• Executing operationally by focusing on continued quality improvement and
lowering overall costs.

Financial Conditions
0
500,000
1,000,000
1,500,000
2,000,000
2,500,000
3,000,000
3,500,000
4,000,000
4,500,000
Revenue Gross income Profit Total currentassets
2011
2012
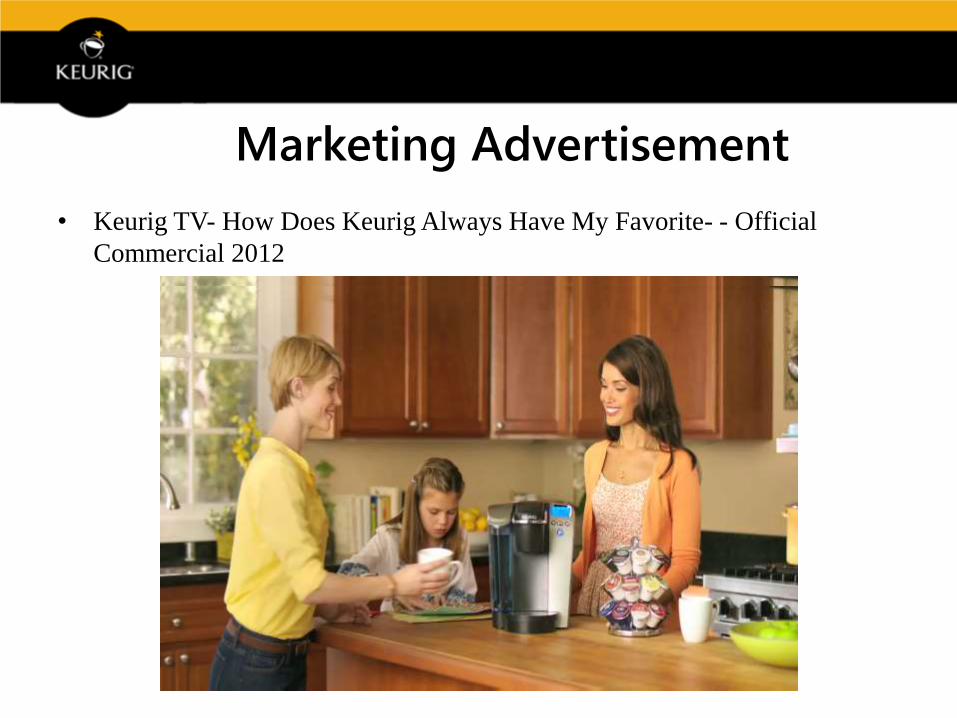
Marketing Advertisement
• Keurig TV- How Does Keurig Always Have My Favorite- - Official
Commercial 2012

Enhanced search: allow consumers to
easily find their favorite K-Cup® portion
packs by refining their search by options.
New comparison tools: Use the drag and
drop brewer comparison wizard for a side-by-
side comparison of brewer features and
specifications to find the perfect fit.
Store locator: Positioned within the site to
make it as easy as possible to purchase
Keurig products online or at thousands of
retail locations in both the U.S. and Canada.

Consumer engagement tools: product ratings
and review, and a social media share bar integrated
into the website to streamline sharing consumer
product passion on Facebook, Twitter and other
social media channels.
Fun and interactive experience: Visit the
Explore area to review and print delicious recipes,
view product demos, indulge in love letters from fans
and learn about seasonal offerings.
Improved loyalty program: Keurig's Coffee
Club program awards 1 point for every K-Cup
purchased on Keurig.com, starting with the first
order.

Analyzing The Presence Market
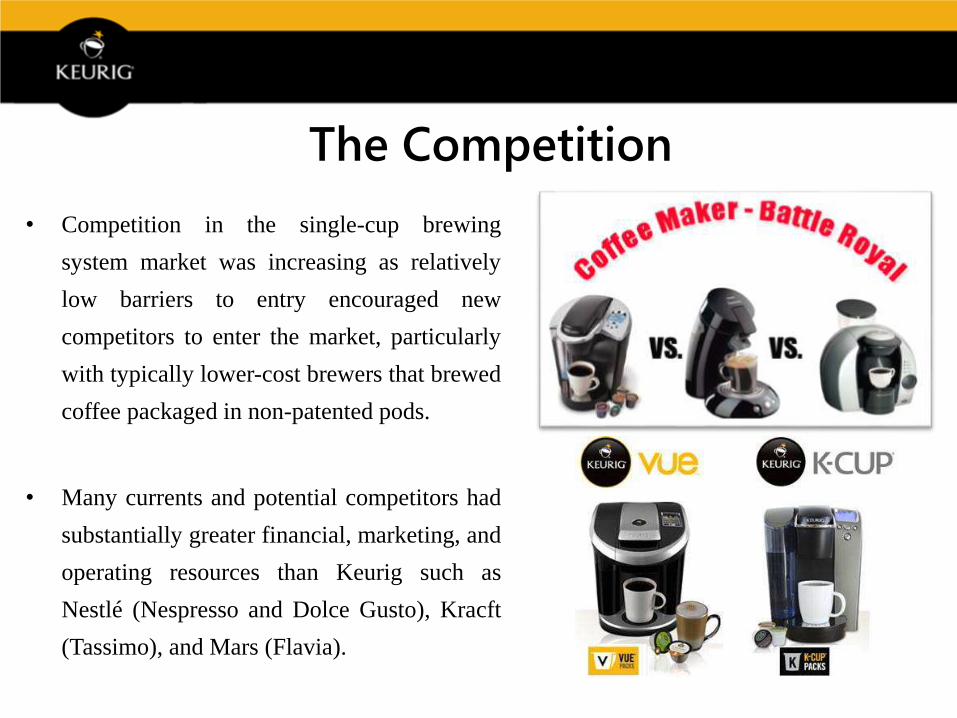
The Competition
• Competition in the single-cup brewing
system market was increasing as relatively
low barriers to entry encouraged new
competitors to enter the market, particularly
with typically lower-cost brewers that brewed
coffee packaged in non-patented pods.
• Many currents and potential competitors had
substantially greater financial, marketing, and
operating resources than Keurig such as
Nestlé (Nespresso and Dolce Gusto), Kracft
(Tassimo), and Mars (Flavia).

Nestle
• Nestle, which has a 35% global share
of the single-serve market, has only a
tiny presence in North America
• Wants a bigger share of the market in
the U.S.
• North America is the second-largest
market in the $8 billion single-serve
market
• Nestle dominates the European
market with a commanding 70% share

The Competitive Advantages
• Keurig has a strong brand in the field of the single-serve brewing coffee. It
is introduced in 1997.
• The partnership is one of the largest strengths of Keurig compared to other
competitors.
• Keurig is available in many different distribution channels.
• Strength of Keurig is related to the patented technology.
• The large majority of customers said that they feel enjoy with Keurig
products and services

The Competitive Advantages
Keurig is a advanced, personal beverage system:
• A premium experience brought into the home.
• A network system effect.
• A brand accelerator.
• An in-home beverage creation system.
• An enabler to understand the demand signal in home
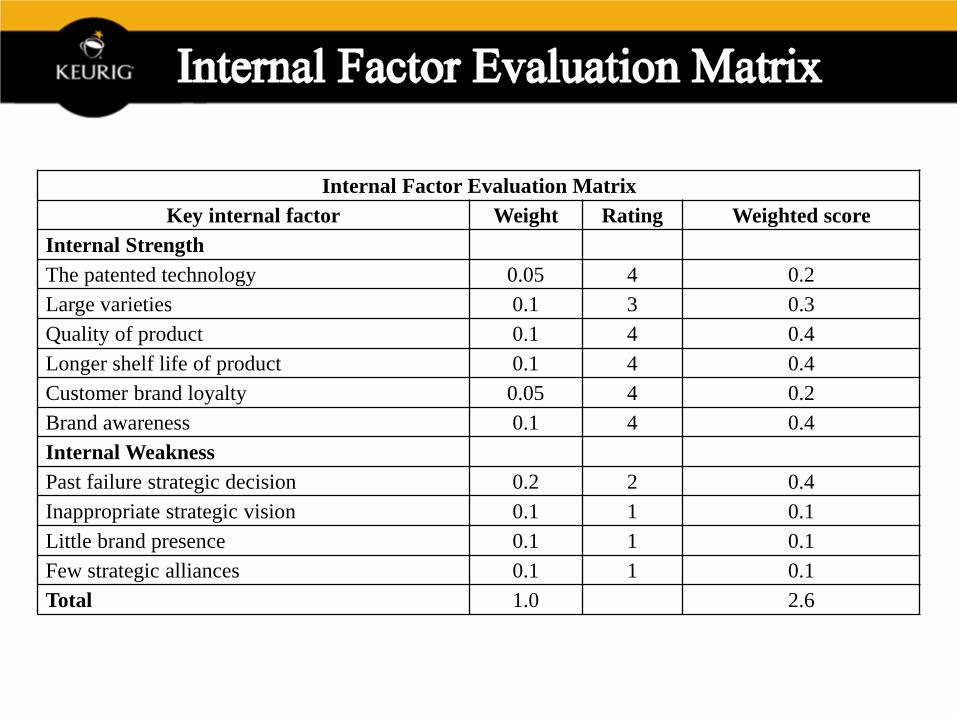
Internal Factor Evaluation Matrix
Key internal factor Weight Rating Weighted score
Internal Strength
The patented technology 0.05 4 0.2
Large varieties 0.1 3 0.3
Quality of product 0.1 4 0.4
Longer shelf life of product 0.1 4 0.4
Customer brand loyalty 0.05 4 0.2
Brand awareness 0.1 4 0.4
Internal Weakness
Past failure strategic decision 0.2 2 0.4
Inappropriate strategic vision 0.1 1 0.1
Little brand presence 0.1 1 0.1
Few strategic alliances 0.1 1 0.1
Total 1.0 2.6

Key external factor Weight RatingWeighted
score
Opportunities
Global market typically untapped 0.15 2 0.3
Increasing in the growth of industry 0.15 2 0.3
Quality considered important by consumers 0.10 3 0.3
Increasing trend of specialty coffee drinkers 0.15 3 0.45
Threats
Decline in coffee consumption 0.1 1 0.1
Decline in coffee consumption 0.1 2 0.2
Price volatility 0.05 2 0.1
Heavy reliance on specialty coffee farms 0.2 2 0.4
Total 1.0 2.15
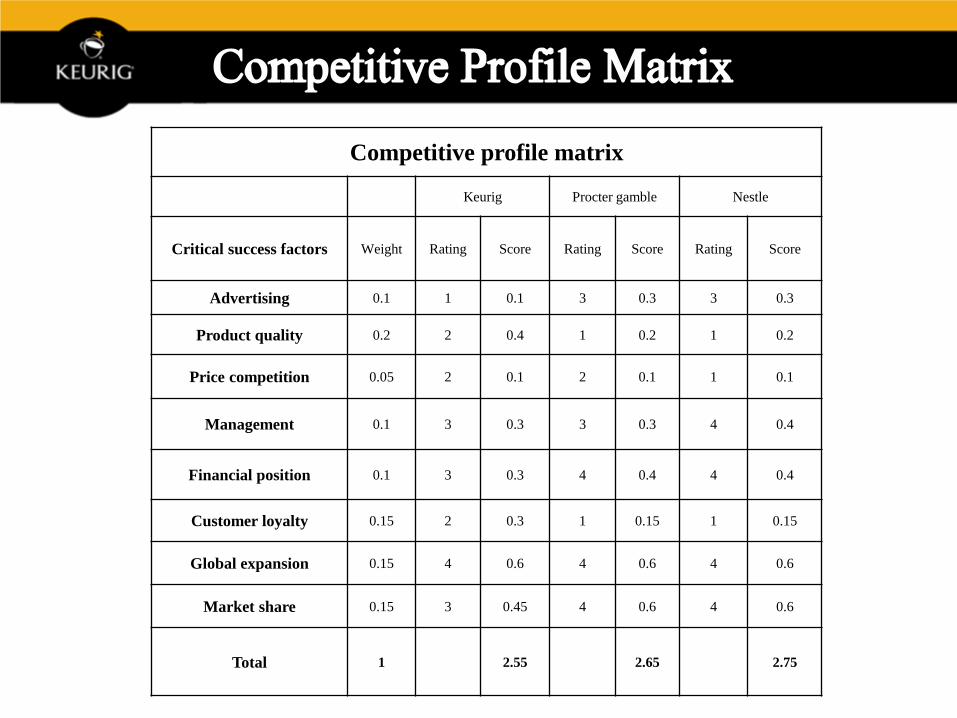
Competitive profile matrix
Keurig Procter gamble Nestle
Critical success factors Weight Rating Score Rating Score Rating Score
Advertising 0.1 1 0.1 3 0.3 3 0.3
Product quality 0.2 2 0.4 1 0.2 1 0.2
Price competition 0.05 2 0.1 2 0.1 1 0.1
Management 0.1 3 0.3 3 0.3 4 0.4
Financial position 0.1 3 0.3 4 0.4 4 0.4
Customer loyalty 0.15 2 0.3 1 0.15 1 0.15
Global expansion 0.15 4 0.6 4 0.6 4 0.6
Market share 0.15 3 0.45 4 0.6 4 0.6
Total 1 2.55 2.65 2.75

Internal Strategic Position External Strategic Position
Financial Strength
• Return of investment: 6
• Financial and operating leverage: 5
• Liquidity: 6
• Working capital: 4
• Cash flows: 5
Average: 5.2
Industry Strength
• Growth potential: 5
• Profit potential: 6
• Financial stability: 6
• Resource availability: 4
• Ease of entry: 5
• Capacity utilization: 3
Average: 4.8
Competitive Advantage
• Market share: -5
• Quality: -2
• Product life cycle: -2
• Customer preference: -2
• Technological innovation: -1
• Sound supply chain: -2
Average: 2.3
Environmental Stability
• Technological changes: -5
• Inflation: -5
• Demand elasticity: -5
• Competitor’s price ranges: -1
• Barriers to entry: -3
• Competitive pressure: -6
• Ease of exit: -5
• Price elasticity of demand: -5
• Risk exposure: -3
Average: 4.2


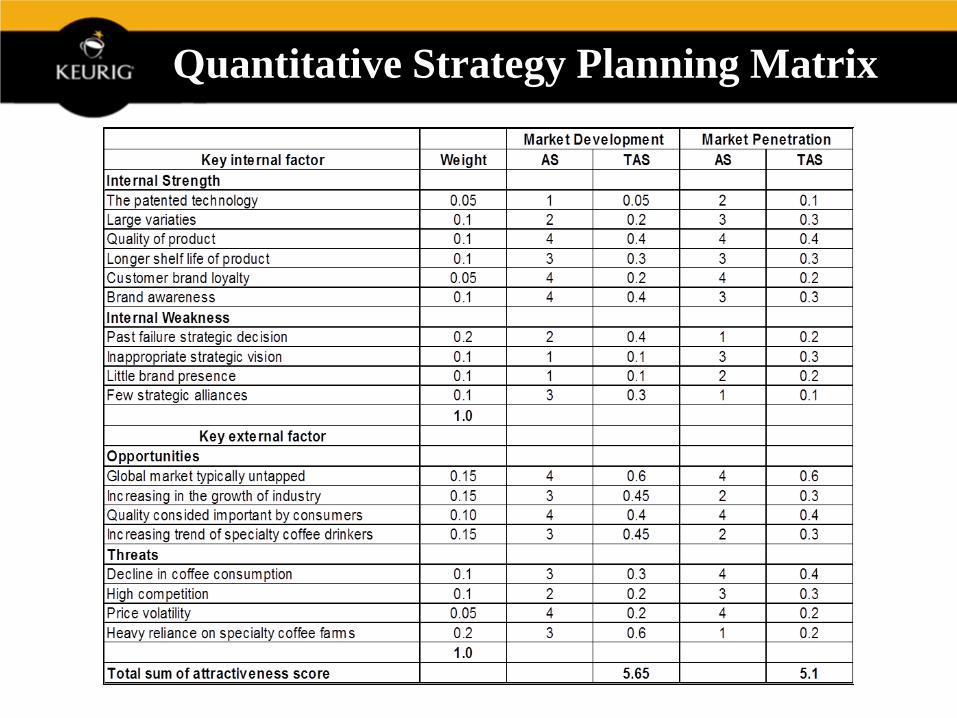
Quantitative Strategy Planning Matrix

Key internal factor Weight
Market Development
The innovative
strategy
The multi-
channel strategy
The creative
strategy
AS TAS AS TAS AS TAS
Internal Strength
The patterned technology 0.05 4 0.2 3 0.15 4 0.2
Large varieties 0.1 1 0.1 2 0.2 1 0.1
Quality of product 0.1 4 0.4 4 0.4 4 0.4
Longer shelf life of product 0.1 3 0.3 4 0.4 3 0.3
Customer brand loyalty 0.05 4 0.2 4 0.2 3 0.15
Brand awareness 0.1 3 0.3 3 0.3 4 0.4
Internal Weakness
Past failure strategic decision 0.2 1 0.2 1 0.2 1 0.2
Inappropriate strategic vision 0.1 2 0.2 2 0.2 2 0.2
Little brand presence 0.1 1 0.1 1 0.1 1 0.1
Few strategic alliances 0.1 2 0.2 3 0.3 1 0.1
Total 1.0
Key external factor
Opportunities
Global market typically untapped 0.15 2 0.3 1 0.15 1 0.15
Increasing in the growth of industry 0.15 3 0.45 2 0.3 2 0.3
Quality considered importantly by consumers 0.10 4 0.4 4 0.4 4 0.4
Increasing trend of specialty coffee drinkers 0.15 3 0.45 3 0.45 3 0.45
Threats
Decline in coffee consumption 0.1 4 0.4 3 0.3 4 0.4
High competition 0.1 3 0.3 3 0.3 3 0.3
Price volatility 0.05 3 0.15 4 0.2 2 0.1
Heavy reliance on specialty coffee farms 0.2 1 0.2 2 0.4 1 0.2
Total 1.0
Total sum of attractiveness score 4.85 4.95 4.45
Quantitative Strategy Planning Matrix

The Problems
The product price
The financial debt

Market Development
Innovative Strategy
Multi-channel Strategy
Creative Strategy
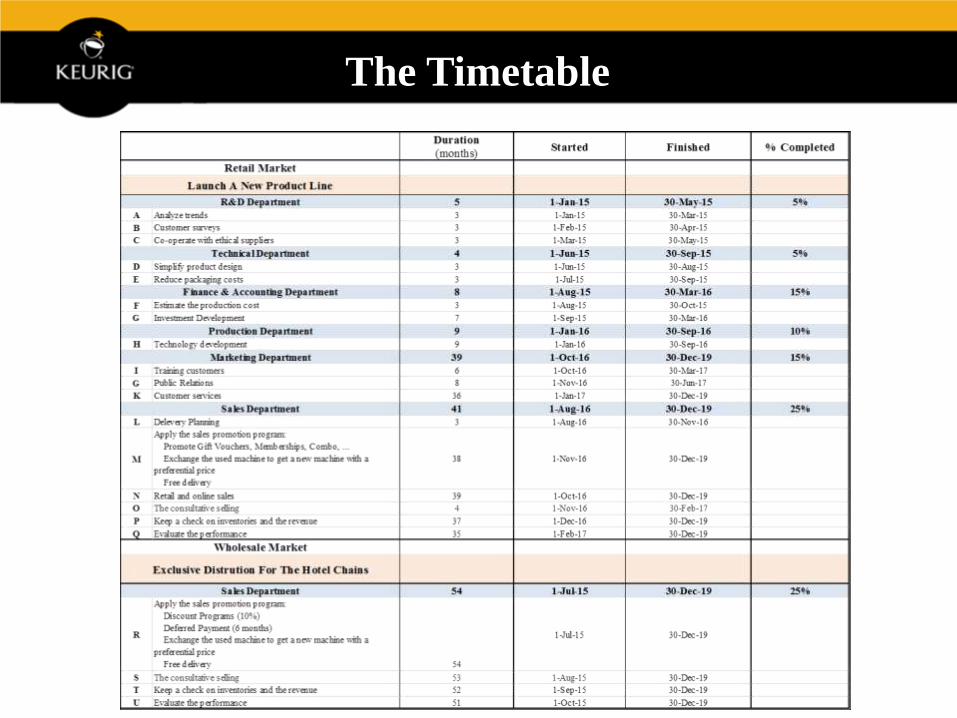
The Timetable

The Timetable