Strategic Management Case Study Coca-Cola Co. - Ecom...
61
Strategic Management Case Study Coca-Cola Co. Presented by: Carter Vaillancourt, Megan Land, and Emily Michaud UMFK, 2013
-
Upload
trinhhuong -
Category
Documents
-
view
217 -
download
3
Transcript of Strategic Management Case Study Coca-Cola Co. - Ecom...
Strategic Management Case StudyCoca-Cola Co.
Presented by: Carter Vaillancourt, Megan Land, and Emily Michaud
UMFK, 2013
Overview1. Company Overview A brief history about Coca Cola Existing Mission and Vision Statement Existing Objectives and Strategies New Mission and Vision Statement2. External Audit Industry Analysis Current Opportunities and Threats CPM Matrix EFE Matrix3. Internal Assessment Organizational Structure Strengths and Weaknesses Financial Condition IFE Matrix
4. Strategy Formation SWOT matrix Space Matrix BCG Matrix Grand Strategy Matrix Matrix Analysis QSPM Matrix5. Strategic Plan for the Future Strategies6. Implementation EPS/EBIT Projected Financials7. Evaluation Balanced Score Card8. Coca-Cola Update

The Coca-Cola Bottle from the Beginning, to Present

1886-1892 1893
-1904
1905-1918 1919
-1940
1941-1959 1960-
1981
1982-1890 1990
-1999
In 1886 is when Atlanta pharmacist created the first Coca-Cola mixture out various ingredients, where he then put it up for sale for 5 cents a glass
1984 is when Joseph Biedenharn was hired to be the first to put theCoca Colain bottles
Due to beverage companies copying Coca-Cola they began to manufacture the contour bottle in 1916
In the 1928 Olympics located in Amsterdam, Coca-Cola traveled with the team andbegan global expansion
In 1943, during WWII General Eisenhower requested 10 bottle plants to be shipped to them overseas, which then created an overseas business.
After 70 years, Coca-Cola added new flavors: Fanta®, originally developed in the 1940s and introduced in the 1950s; Sprite® followed in 1961, with TAB® in 1963 and Fresca® in 1966
In 1985, was the release of a new taste for Coca-Cola, the first change in formulation in 99 years. It wasn’t long until they changed to their original
New beverages joined the Company's line-up, including Powerade® sports drink, Qoo® children's fruit drink and Dasani® bottled water

Revenue and Cash Flow Growth 2005-2010

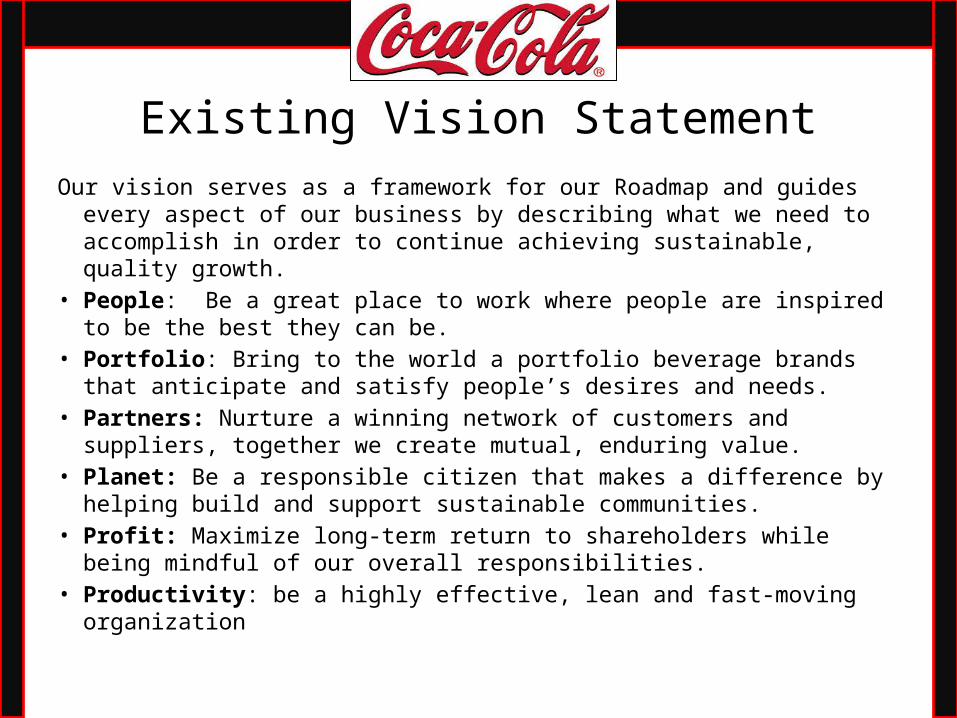
Existing Vision StatementOur vision serves as a framework for our Roadmap and guides every
aspect of our business by describing what we need to accomplish in order to continue achieving sustainable, quality growth.
• People: Be a great place to work where people are inspired to be the best they can be.
• Portfolio: Bring to the world a portfolio beverage brands that anticipate and satisfy people’s desires and needs.
• Partners: Nurture a winning network of customers and suppliers, together we create mutual, enduring value.
• Planet: Be a responsible citizen that makes a difference by helping build and support sustainable communities.
• Profit: Maximize long-term return to shareholders while being mindful of our overall responsibilities.
• Productivity: be a highly effective, lean and fast-moving organization

Existing Mission Statement
Our Roadmap starts with out mission, which is enduring. It declares our purpose as a company and serves as the standard against which we weigh our actions and decisions.
• To refresh the world…• To inspire moments of optimism and
happiness…• To create value and make a difference.
Existing Growth Strategy
• Driving global beverage leadership• Accelerate innovation• Leverage our balanced geographic
portfolio

Proposed Vision Statement
Coca-Cola’s vision is to inspire moments of
happiness while refreshing the world.
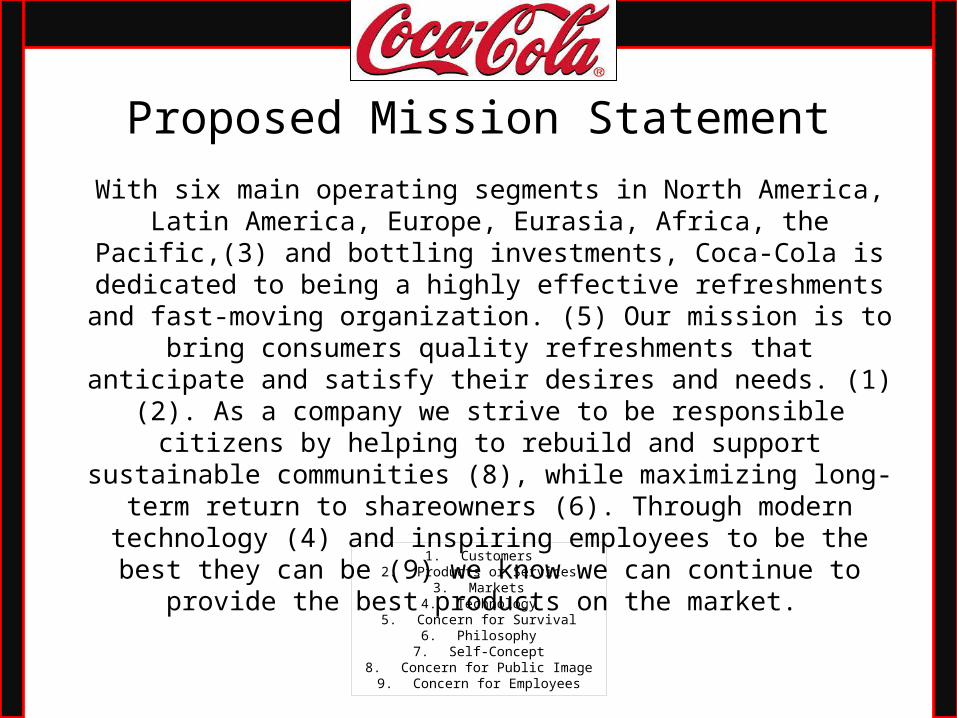
Proposed Mission StatementWith six main operating segments in North America, Latin America, Europe, Eurasia, Africa, the Pacific,(3) and bottling investments, Coca-Cola is dedicated to
being a highly effective refreshments and fast-moving organization. (5) Our mission is to bring consumers
quality refreshments that anticipate and satisfy their desires and needs. (1)(2). As a company we strive to
be responsible citizens by helping to rebuild and support sustainable communities (8), while maximizing long-term return to shareowners (6). Through modern technology (4) and inspiring employees to be the best they can be (9) we know we can continue to provide
the best products on the market. 1. Customers
2. Products or Services3. Markets
4. Technology5. Concern for Survival
6. Philosophy7. Self-Concept
8. Concern for Public Image9. Concern for Employees
External Audit

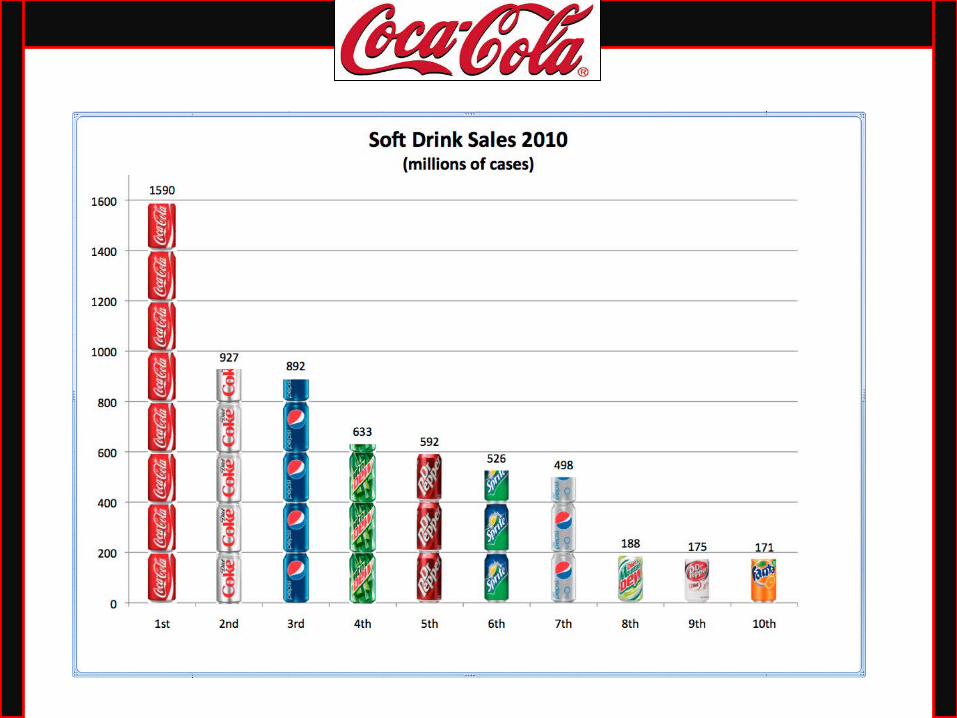
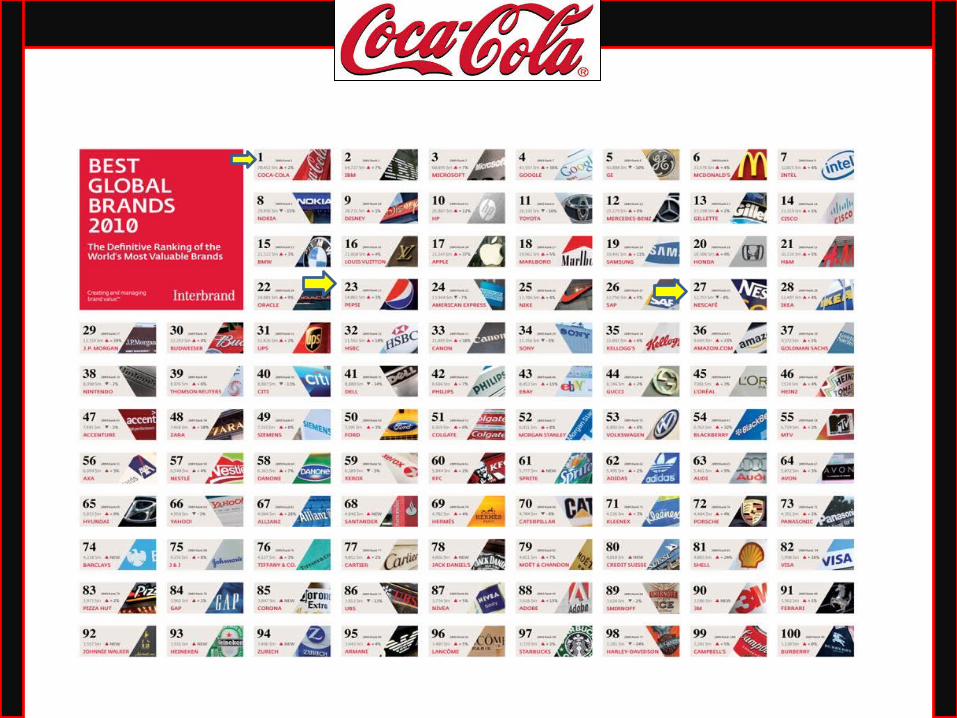
Industry Market Analysis

Coca Cola Pepsi Cola Nestle Dr. Pepper Snapple 0
10
20
30
40
50
60
70Stock Price 2010
Stock Price 2010
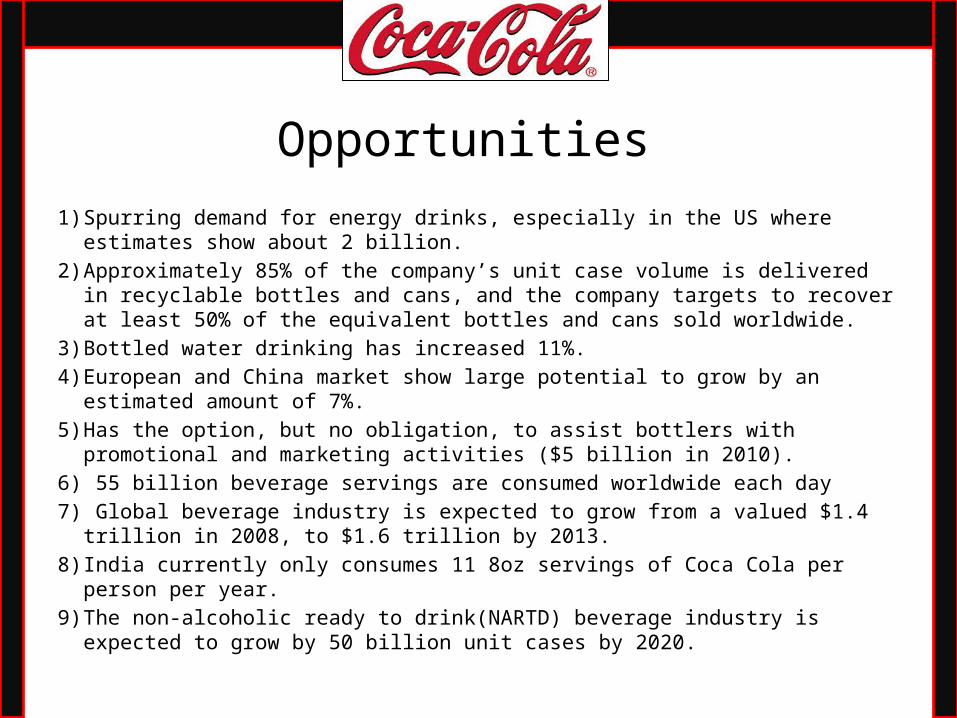
1) Spurring demand for energy drinks, especially in the US where estimates show about 2 billion.
2) Approximately 85% of the company’s unit case volume is delivered in recyclable bottles and cans, and the company targets to recover at least 50% of the equivalent bottles and cans sold worldwide.
3) Bottled water drinking has increased 11%. 4) European and China market show large potential to grow by an estimated
amount of 7%. 5) Has the option, but no obligation, to assist bottlers with promotional and
marketing activities ($5 billion in 2010).6) 55 billion beverage servings are consumed worldwide each day7) Global beverage industry is expected to grow from a valued $1.4 trillion in
2008, to $1.6 trillion by 2013.8) India currently only consumes 11 8oz servings of Coca Cola per person per
year.9) The non-alcoholic ready to drink(NARTD) beverage industry is expected to
grow by 50 billion unit cases by 2020.
Opportunities

Threats1) Increasing preference for non carbonated healthy drinks. The Coca Cola soda saw a
5% volume declines respectively in the carbonated soda brands category.2) With rising obesity rates of 35.7% for adults and 17% for youth in the U.S. alone,
health concerns may cause reduced consumption of sugar sweetened beverages, impacting profitability.
3) Water is the main and most significant ingredient in beverages, quality and abundance of water is scarce worldwide, where 70% is used for agriculture and irrigation.
4) With $24.5 billion in net operating revenue generated from international markets, and operating in over 200 countries, unstable economic conditions in foreign countries can dramatically decrease revenues.
5) The primary beverage of Coca Cola is sparkling beverages, the most popular drinks consumed worldwide, in their respective order, are water, tea, and beer.
6) Changes in currency rates. Coca-cola uses 74 functional currencies in 2010.7) In 2010 had approximately 18,600 associates represented by labor unions.8) PEP operating income and revenues both exceeded KO's by .85 Billion and 7.67
Billion respectively. They are strong competitors in the market9) PepsiCo dominated North America with sales of US $22billion,while Coca-Cola only
had about US $7billion.

KO NSRGY PEPCritical Success factors Weights Rating Weighted Score Rating Weighted Score Rating Weighted Score
0.0 to 1.0 1 to 4 1 to 4 1 to 4
Advertising 0.08 4 0.32 3 0.24 4 0.32
Product Quality 0.12 4 0.48 3 0.36 3 0.36
Price Competitiveness 0.10 4 0.4 3 0.3 4 0.4
Finanical Position 0.10 3 0.30 4 0.40 3 0.30
Customer Loyalty 0.14 4 0.56 3 0.42 4 0.56
Global Expansion 0.11 4 0.44 3 0.33 3 0.33
Market Share 0.07 3 0.21 4 0.28 3 0.21
Organization Structure 0.06 4 0.24 3 0.18 3 0.18
Customer Service 0.08 4 0.32 3 0.24 3 0.24
Production Capacity 0.10 4 0.40 3 0.30 4 0.40
Employee Dedication 0.04 3 0.12 4 0.16 3 0.12
Totals 1.00 3.79 3.21 3.42
CPM

Key External Factors Weights Rating Weighted Score 0.0 to 1.0 1 to 4
Opportunities
This is spurring demand for energy drinks, especially in the US which according to the latest industry estimates is about 2 billion 0.06 4 0.24Approximately 85% of the company’s unit case volume is delivered in recyclable bottles and cans, and the company targets to recover at least 50% of the equivalent bottles and cans sold worldwide 0.04 3 0.12Bottled water drinking has increased 11%. 0.04 2 0.08European and China market show large potential to grow, growing into these divisions more will help the revenue sales 0.04 2 0.08Has the option, but no obligation, to assist bottlers with promotional and marketing activities ($5 billion in 2010). 0.05 2 0.155 billion beverage servings are consumed worldwide each day 0.06 3 0.18Global beverage industry is expected to grow from a valued $1.4 trillion in 2008, to $1.6 trillion by 2013 0.05 3 0.15India currently only consumes 11 8oz servings of KO per person per year 0.04 2 0.08The non-alcoholic ready to drink(NARTD) beverage industry is expected to grow by 50 billion unit cases by 2020 0.05 3 0.15Threats 0Increasing preference for non carbonated healthy drinks. The Coca Cola soda saw a 5% volume declines respectively in the carbonated soda brands category 0.06 3 0.18With rising obesity rates of 35.7% for adults and 17% for youth in the U.S. alone, health concerns may cause reduced consumption of sugar sweetened beverages, impacting profitability. 0.06 2 0.12Water is the main and most significant ingredient in beverages, quality and abundance of water is scarce worldwide, where 70% is used for agriculture and irrigation 0.09 2 0.18With $24.5 billion in net operating revenue generated from international markets, and operating in over 200 countries, unstable economic conditions in foreign countries can dramatically decrease revenues 0.07 3 0.21The primary beverage of Coca Cola is sparkling beverages, the most popular drinks consumed worldwide, in their respective order, are water, tea, and beer 0.07 4 0.28Changes in currency rates. Coca-cola uses 74 functional currencies in 2010 0.04 2 0.08In 2010 had approximately 18,600 associates represented by labor unions 0.05 2 0.1
PEP operating income and revenues both exceeded KO's by .85 Billion and 7.67 Billion respectively. They are strong competitors in the market 0.05 4 0.2PepsiCo dominated North America with sales of US $22billion,while Coca-Cola only had about US $7billion 0.08 4 0.32Totals 1 2.85
EFE
Internal Audit

Financial InformationIncome Statement

Financial InformationBalance Sheet (1)

Financial InformationBalance Sheet (2)
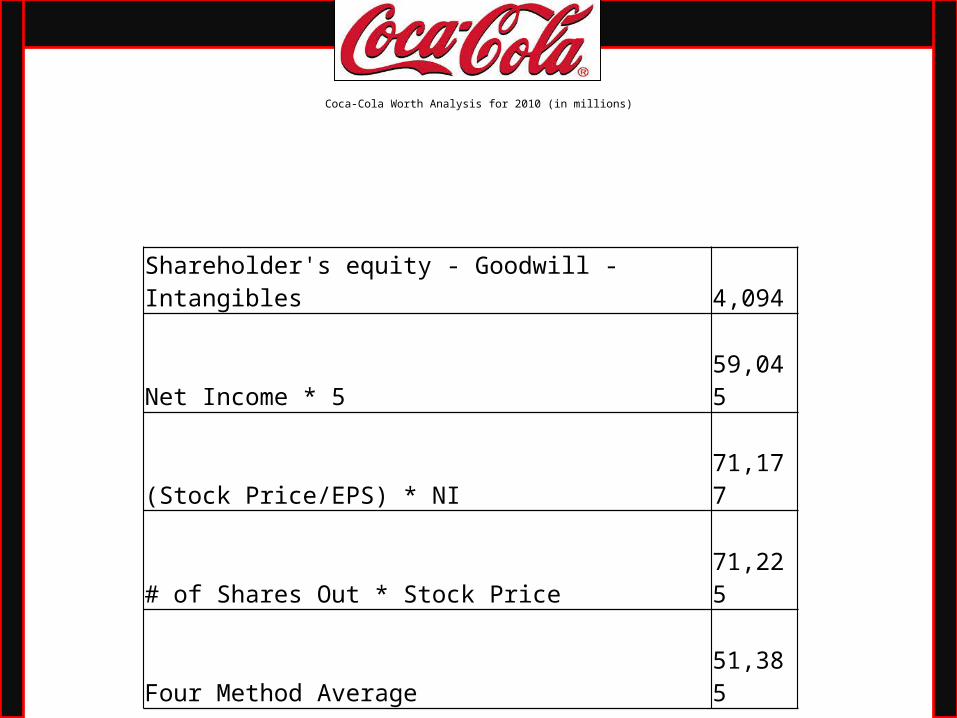
Coca-Cola Worth Analysis for 2010 (in millions)
Shareholder's equity - Goodwill - Intangibles 4,094
Net Income * 5 59,045
(Stock Price/EPS) * NI 71,177
# of Shares Out * Stock Price 71,225
Four Method Average 51,385

Ratio AnalysisRatio (2010) Coca-Cola Pepsi Nestle
Liquidity Ratios
Current 1.17 1.11 1.29
Quick 1.02 0.89 1.03
Leverage Ratios
Debt to total assets 0.57 0.68 0.44
Debt to equity 1.35 2.19 0.78
Long-term debt to equity 0.45 0.94 0.12
Times-interest-earned ratio 20.43 9.23 41.25
Activity Ratios
Fixed Assets Turnover 2.38 3.03 5.12
Total Assets Turnover 0.48 0.85 0.98
Inventory Turnover 13.25 17.15 13.84
Profitability Ratios
Gross Profit Margin % 63.86 54.05 58.21
EBT Margin % 40.56 14.23 34.69
Net Profit Margin % 33.63 10.93 31.2
Return on total assets % 19.42 11.7 27.56
Return on Stockholder's equity % 38.09 33.27 49.17
Price-earnings ratio 6.03 15.35 5.43
Growth Ratios
Sales Growth (5-years) 8.74% 12.18% 3.80%
Net Income Growth (5-years Average) 19.37% 9.16% 32.08%
Earnings per share Growth (5-year Average) 19.92% 10.35% 37.77%

Strengths1) With revenues of $35,119,000 million, Coca-Cola is one of the largest
beverage manufacturers globally.2) Coca-Cola owns four of the world’s top five nonalcoholic sparkling
beverage brands including Coca-Cola, Diet Coke, Sprite and Fanta.3) Sold 25.5 billion cases of products in 20104) Accounted for 51% of U.S. unit case volume, and 50% of non-U.S. case
volume for 20105) Has ownership interest in its bottling/distributing partners; 23% in Coca-
Cola Hellenic, 32% in Coca-Cola FEMSA, and 30% in Coca-Cola Amatil.6) Acquired Coca-Cola Enterprises, Inc., one of the major bottlers for Coca-
Cola in North America which had $3.6 billion in revenues7) In Eurasia and Africa, unit case volume increased 12% in 20108) Coca-Cola has more than 500 brands and 3,500 beverages and products. 9) Coca-Cola sells 1.7 Billion servings of beverages per day in over 200
countries. 10) Coca-Cola generated 9.5 billion in cash from operations in 2010, up 16%
over 2009.
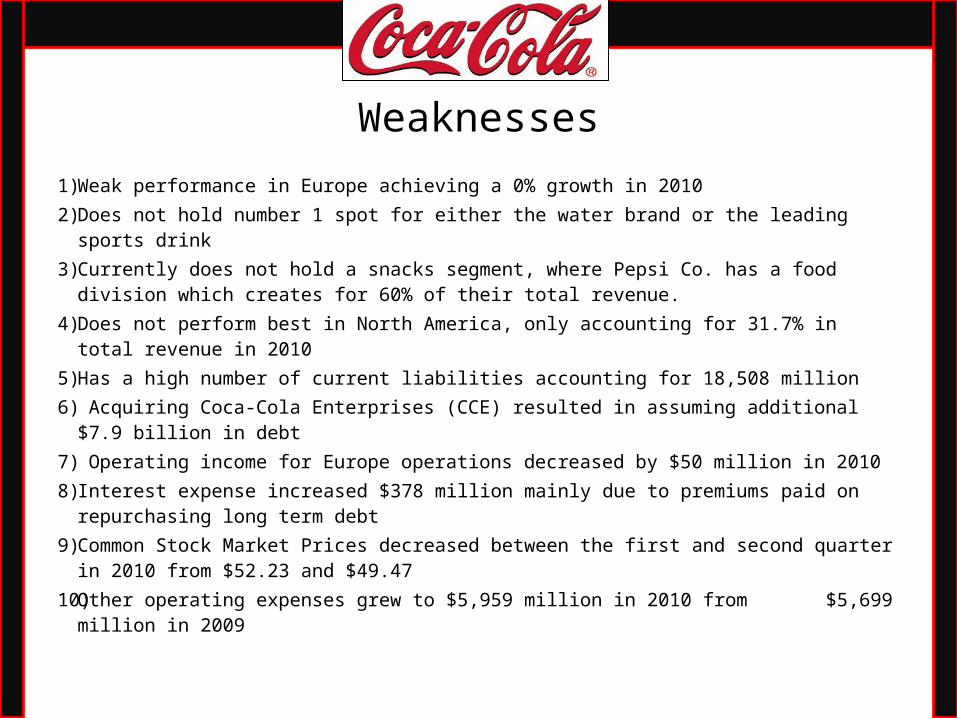
Weaknesses1) Weak performance in Europe achieving a 0% growth in 20102) Does not hold number 1 spot for either the water brand or the leading
sports drink 3) Currently does not hold a snacks segment, where Pepsi Co. has a food
division which creates for 60% of their total revenue. 4) Does not perform best in North America, only accounting for 31.7% in
total revenue in 20105) Has a high number of current liabilities accounting for 18,508 million6) Acquiring Coca-Cola Enterprises (CCE) resulted in assuming additional
$7.9 billion in debt7) Operating income for Europe operations decreased by $50 million in
20108) Interest expense increased $378 million mainly due to premiums paid on
repurchasing long term debt9) Common Stock Market Prices decreased between the first and second
quarter in 2010 from $52.23 and $49.4710) Other operating expenses grew to $5,959 million in 2010 from $5,699
million in 2009
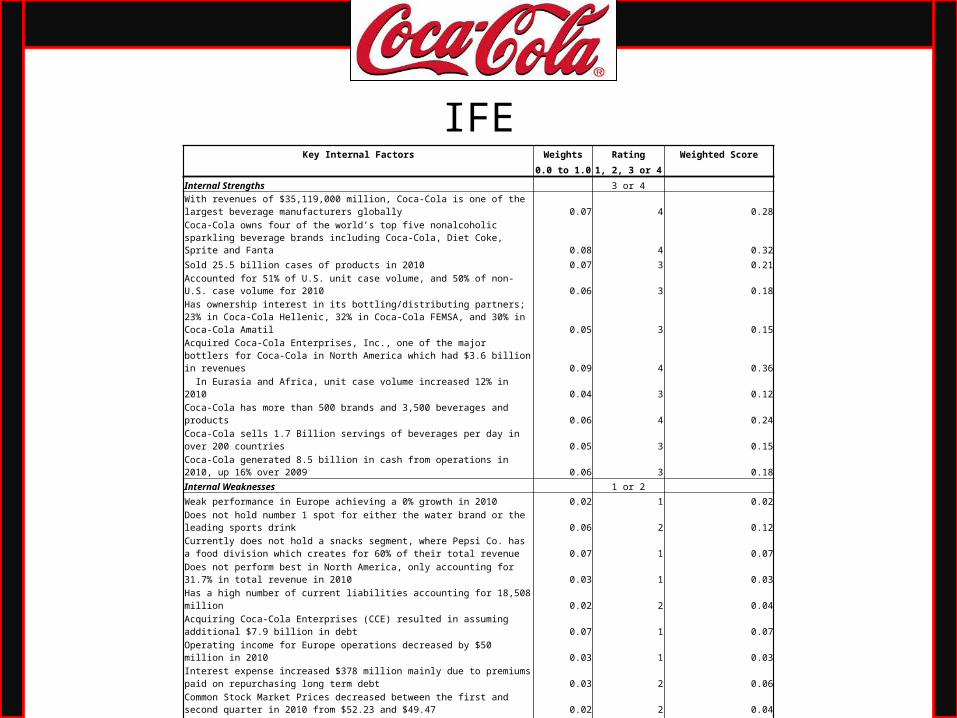
Key Internal Factors Weights Rating Weighted Score 0.0 to 1.0 1, 2, 3 or 4
Internal Strengths 3 or 4 With revenues of $35,119,000 million, Coca-Cola is one of the largest beverage manufacturers globally 0.07 4 0.28Coca-Cola owns four of the world’s top five nonalcoholic sparkling beverage brands including Coca-Cola, Diet Coke, Sprite and Fanta 0.08 4 0.32Sold 25.5 billion cases of products in 2010 0.07 3 0.21Accounted for 51% of U.S. unit case volume, and 50% of non-U.S. case volume for 2010 0.06 3 0.18
Has ownership interest in its bottling/distributing partners; 23% in Coca-Cola Hellenic, 32% in Coca-Cola FEMSA, and 30% in Coca-Cola Amatil 0.05 3 0.15Acquired Coca-Cola Enterprises, Inc., one of the major bottlers for Coca-Cola in North America which had $3.6 billion in revenues 0.09 4 0.36 In Eurasia and Africa, unit case volume increased 12% in 2010 0.04 3 0.12
Coca-Cola has more than 500 brands and 3,500 beverages and products 0.06 4 0.24Coca-Cola sells 1.7 Billion servings of beverages per day in over 200 countries 0.05 3 0.15Coca-Cola generated 8.5 billion in cash from operations in 2010, up 16% over 2009 0.06 3 0.18Internal Weaknesses 1 or 2 Weak performance in Europe achieving a 0% growth in 2010 0.02 1 0.02Does not hold number 1 spot for either the water brand or the leading sports drink 0.06 2 0.12Currently does not hold a snacks segment, where Pepsi Co. has a food division which creates for 60% of their total revenue 0.07 1 0.07Does not perform best in North America, only accounting for 31.7% in total revenue in 2010 0.03 1 0.03
Has a high number of current liabilities accounting for 18,508 million 0.02 2 0.04Acquiring Coca-Cola Enterprises (CCE) resulted in assuming additional $7.9 billion in debt 0.07 1 0.07
Operating income for Europe operations decreased by $50 million in 2010 0.03 1 0.03Interest expense increased $378 million mainly due to premiums paid on repurchasing long term debt 0.03 2 0.06Common Stock Market Prices decreased between the first and second quarter in 2010 from $52.23 and $49.47 0.02 2 0.04Other operating expenses grew to $5,959 million in 2010 from $ 5,699 million in 2009 0.02 2 0.04Totals 1 2.71
IFE

Strategy Formation
SWOT MatrixStrengths
Weaknesses
Opportunities
Threats
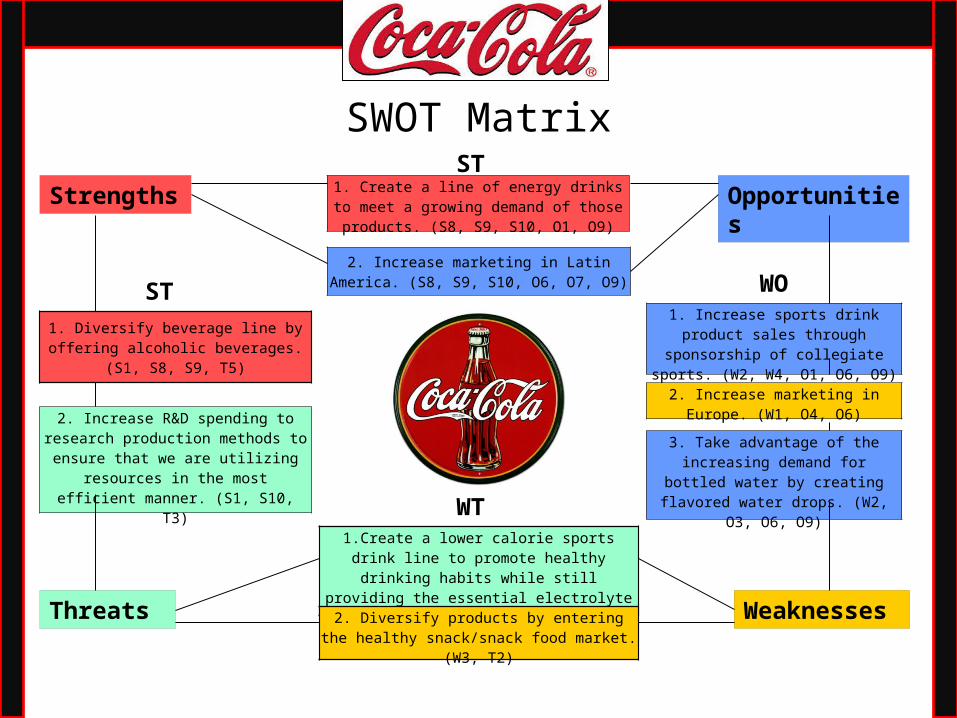
1. Diversify beverage line by offering alcoholic beverages. (S1,
S8, S9, T5)
2. Increase R&D spending to research production methods to
ensure that we are utilizing resources in the most efficient
manner. (S1, S10, T3)
1.Create a lower calorie sports drink line to promote healthy drinking habits while still providing the essential electrolyte
balance. (W2, W4, T1, T2)
2. Diversify products by entering the healthy snack/snack food market. (W3, T2)
1. Create a line of energy drinks to meet a growing demand of those products.
(S8, S9, S10, O1, O9)
2. Increase marketing in Latin America. (S8, S9, S10, O6, O7, O9)
1. Increase sports drink product sales through sponsorship of
collegiate sports. (W2, W4, O1, O6, O9)
2. Increase marketing in Europe. (W1, O4, O6)
3. Take advantage of the increasing demand for bottled
water by creating flavored water drops. (W2, O3, O6, O9)
ST
ST
WO
WT
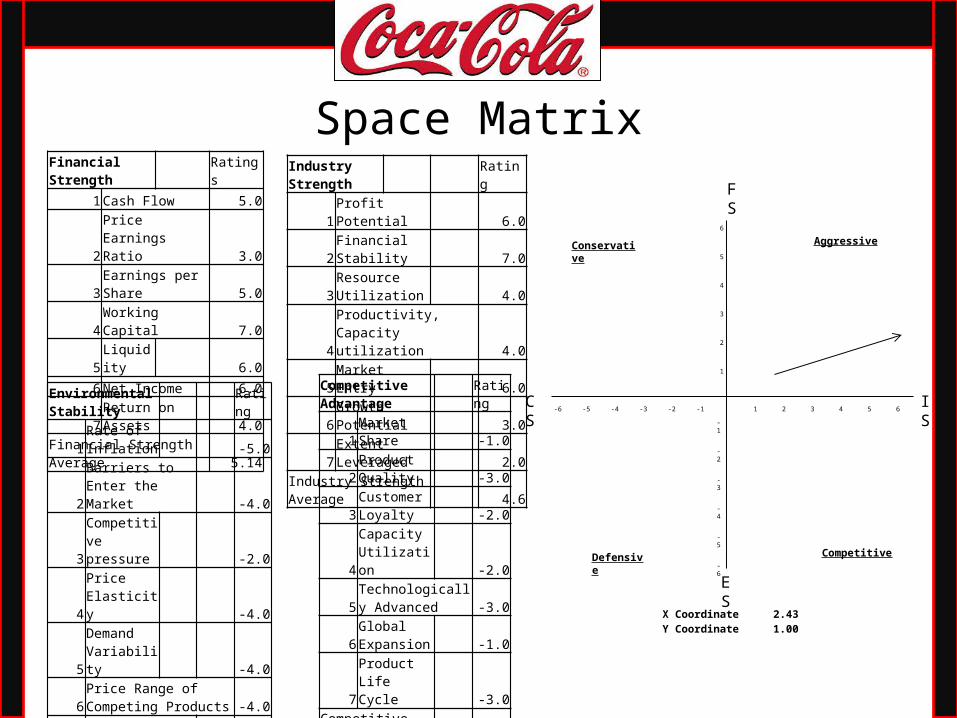
Space MatrixFinancial Strength Ratings
1 Cash Flow 5.0
2Price Earnings Ratio 3.0
3 Earnings per Share 5.04 Working Capital 7.05 Liquidity 6.06 Net Income 6.07 Return on Assets 4.0
Financial Strength Average 5.14
Industry Strength Rating
1 Profit Potential 6.0
2Financial Stability 7.0
3Resource Utilization 4.0
4Productivity, Capacity utilization 4.0
5 Market Entry 6.06 Growth Potential 3.07 Extent Leveraged 2.0
Industry Strength Average 4.6
Environmental Stability Rating
1Rate of Inflation -5.0
2Barriers to Enter the Market -4.0
3Competitive pressure -2.0
4Price Elasticity -4.0
5Demand Variability -4.0
6Price Range of Competing Products -4.0
7Ease of Exit from Market -6.0
Environmental Stability Average -4.14
Competitive Advantage Rating
1 Market Share -1.0
2Product Quality -3.0
3Customer Loyalty -2.0
4Capacity Utilization -2.0
5Technologically Advanced -3.0
6Global Expansion -1.0
7Product Life Cycle -3.0
Competitive Advantage Average -2.14
FS
CS
ES
IS-1-2-3-4-5-6 654321
Conservative Aggressive
CompetitiveDefensive
1
2
3
4
5
6
-6
-5
-4
-3
-2
-1
X Coordinate 2.43Y Coordinate 1.00

BCG Matrix
Segments Revenue %rev profit %pft Relative Market Share Industry Growth Rate (%)North America $11,205.00 39.45% $1,520.00 15.31% 1.00 4.40%
Pacific $5,271.00 18.56% $2,048.00 20.63% 1.00 5.60%
Europe $5,249.00 18.48% $2,976.00 29.97% 1.00 5.30%
Latin America $4,121.00 14.51% $2,405.00 24.22% 1.00 6.00%
Eurasia & Africa $2,556.00 9.00% $980.00 9.87% 1.00 6.50%
Total $28,402.00 100.00% $9,929.00 100.00%

BCG Continued

Grand Strategy MatrixRapid Market Growth
Weak Competitve Position
Strong Competitive Position
Slow Market Growth
Quadrant II1. Market development2. Market penetration3. Product development4. Horizontal integration5. Divestiture6. Liquidation
Quadrant III1. Retrenchment2. Related diversification3. Unrelated diversification4. Divestiture5. Liquidation
Quadrant IV1. Related diversification2. Unrelated diversification3. Joint ventures
Quadrant I1. Market development2. Market penetration3. Product development4. Forward integration5. Backward integration6. Horizontal integration7. Related diversification

Matrix AnalysisAlternative Strategies IE SPACE GRAND BCG COUNT
Forward Integration x x X 3
Backward Integration x x X 3
Horizontal Integration x x X 3
Market Penetration x x X 3
Market Development x x X 3
Product Development x x X 3
Related Diversification x x 2
Unrelated Diversification x 1
Retrenchment
Divestiture
Liquidation

Strategy Evaluation Integration Strategies• We have integrated into many suppliers prior to 2010• We recently purchased CCE which helps integrate our bottling
and marketingProduct and Market Development• We are highly established worldwide prior to 2010Market Penetration• We are currently in 200 different countries prior to 2010Unrelated or Related Diversification• We don’t offer a food segment (Unrelated)• None of our main competitors offer an alcoholic beverage
(Related)

Quantitative Strategic Planning Matrix-QSPM
Create a lower calorie sports
drink line/ while still providing essential
electrolyte balance.
Diversify products by entering the
healthy snack/snack food market.
Diversify beverage line
by offering alcoholic
beverages.
Key factors Weight AS TAS AS TAS AS TAS
External 1 to 4 1 to 4 1 to 4 Opportunities 1. There is spurring demand for energy drinks, especially in the US which according to the latest industry estimates is about 2 billion 0.06 4 0.24 2. Approximately 85% of the company’s unit case volume is delivered in recyclable bottles and cans, and the company targets to recover at least 50% of the equivalent bottles and cans sold worldwide. 0.04 3. Bottled water drinking has increased 11%. 0.04 4. European and China market show large potential to grow, growing into these divisions more will help the revenue sales. 0.04 3 0.12 5. Has the option, but no obligation, to assist bottlers with promotional and marketing activities ($5 billion in 2010). 0.05 2 0.1 3 0.156. 55 billion beverage servings are consumed worldwide each day 0.06 4 0.24 4 0.247. Global beverage industry is expected to grow from a valued $1.4 trillion in 2008, to $1.6 trillion by 2013. 0.05 4 0.2 4 0.28. India currently only consumes 11 8oz servings of KO per person per year. 0.04 2 0.08 3 0.12 2 0.089. The non-alcoholic ready to drink(NARTD) beverage industry is expected to grow by 50 billion unit cases by 2020. 0.05 4 0.2Threats 1. Increasing preference for non carbonated healthy drinks. The Coca Cola soda saw a 5% volume declines respectively in the carbonated soda brands category. 0.06 2 0.12 2. With rising obesity rates of 35.7% for adults and 17% for youth in the U.S. alone, health concerns may cause reduced consumption of sugar sweetened beverages, impacting profitability. 0.06 2 0.12 4 0.24 3. Water is the main and most significant ingredient in beverages, quality and abundance of water is scarce worldwide, where 70% is used for agriculture and irrigation. 0.09 1 0.09 4 0.36 1 0.094. With $24.5 billion in net operating revenue generated from international markets, and operating in over 200 countries, unstable economic conditions in foreign countries can dramatically decrease revenues. 0.07 5. The primary beverage of Coca Cola is sparkling beverages, the most popular drinks consumed worldwide, in their respective order, are water, tea, and beer. 0.07 4 0.286. Changes in currency rates. Coca-cola uses 74 functional currencies in 2010. 0.04 7. In 2010 had approximately 18,600 associates represented by labor unions 0.05 8. PEP operating income and revenues both exceeded KO's by .85 Billion and 7.67 Billion respectively. They are strong competitors in the market 0.05 1 0.05 4 0.2 2 0.19. PepsiCo dominated North America with sales of US $22billion,while Coca-Cola only had about US $7billion. 0.08 1 0.08 4 0.32 2 0.16 total should be 1.0 1
QSPM

Strengths 1. With revenues of $35,119,000 million, Coca-Cola is one of the largest beverage manufacturers globally. 0.07 1 0.07 4 0.28 2 0.142. Coca-Cola owns four of the world’s top five nonalcoholic sparkling beverage brands including Coca-Cola, Diet Coke, Sprite and Fanta. 0.08 2 0.163. Sold 25.5 billion cases of products in 2010 0.07 2 0.14 3 0.214. Accounted for 51% of U.S. unit case volume, and 50% of non-U.S. case volume for 2010 0.06 2 0.12 3 0.185. Has ownership interest in its bottling/distributing partners; 23% in Coca-Cola Hellenic, 32% in Coca-Cola FEMSA, and 30% in Coca-Cola Amatil. 0.05 6. Acquired Coca-Cola Enterprises, Inc., one of the major bottlers for Coca-Cola in North America which had $3.6 billion in revenues 0.09 7. In Eurasia and Africa, unit case volume increased 12% in 2010 0.04 8. Coca-Cola has more than 500 brands and 3,500 beverages and products. 0.06 3 0.18 4 0.249. Coca-Cola sells 1.7 Billion servings of beverages per day in over 200 countries. 0.05 3 0.15 3 0.1510. Coca-Cola generaged 8.5 billion in cash from operations in 2010, up 16% over 2009. 0.06 2 0.12 4 0.24 2 0.12Weaknesses 1. Weak performance in Europe achieving a 0% growth in 2010. 0.02 3 0.062. Does not hold number 1 spot for either the water brand or the leading sports drink. 0.06 3 0.18 3. Currently does not hold a snacks segment, where Pepsi Co. has a food division which creates for 60% of their total revenue. 0.07 4 0.28 4. Does not perform best in North America, only accounting for 31.7% in total revenue in 2010. 0.03 3 0.09 2 0.065. Has a high number of current liabilities accounting for 18,508 million 0.02 6. Acquiring Coca-Cola Enterprises (CCE) resulted in assuming additional $7.9 billion in debt 0.07 7. Operating income for Europe operations decreased by $50 million in 2010 0.03 8. Interest expense increased $378 million mainly due to premiums paid on repurchasing long term debt 0.03 9. Common Stock Market Prices decreased between the first and second quarter in 2010 from $52.23 and $49.47. 0.02 10. Other operating expenses grew to $5,959 million in 2010 from $ 5,699 million in 2009. 0.02
total should be 1.0 1
2.28 2.25 2.82
Create a lower calorie sports
drink line/ while still providing essential
electrolyte balance.
Diversify products
by entering
the healthy
snack/snack food market.
Diversify beverage
line by offering
alcoholic beverages
.
QSPM (2)

Strategic Fit Competitive Risks• Pepsi Co. and Nestle currently have market
share in the Food IndustryFunding Aggressive Growth• Market Capitalization of 190 billion • Current Assets exceed current liabilities by
over 3 billionStrong Brand Utilization• Moving into the food industry and having
very strong customer loyalty, customers will be drawn to new products

Kellogg Company• Currently located in 180 different
countries • Sales totaled 12.4 billion in 2010• Includes brands such as: Special K,
Cheez-It, Pringles, Keebler, Austin, Famous Amos, and Townhouse Crackers
• Food Consumer Products Industry Kellogg's is ranked number 2, behind Pepsi Co. and ahead of General Mills
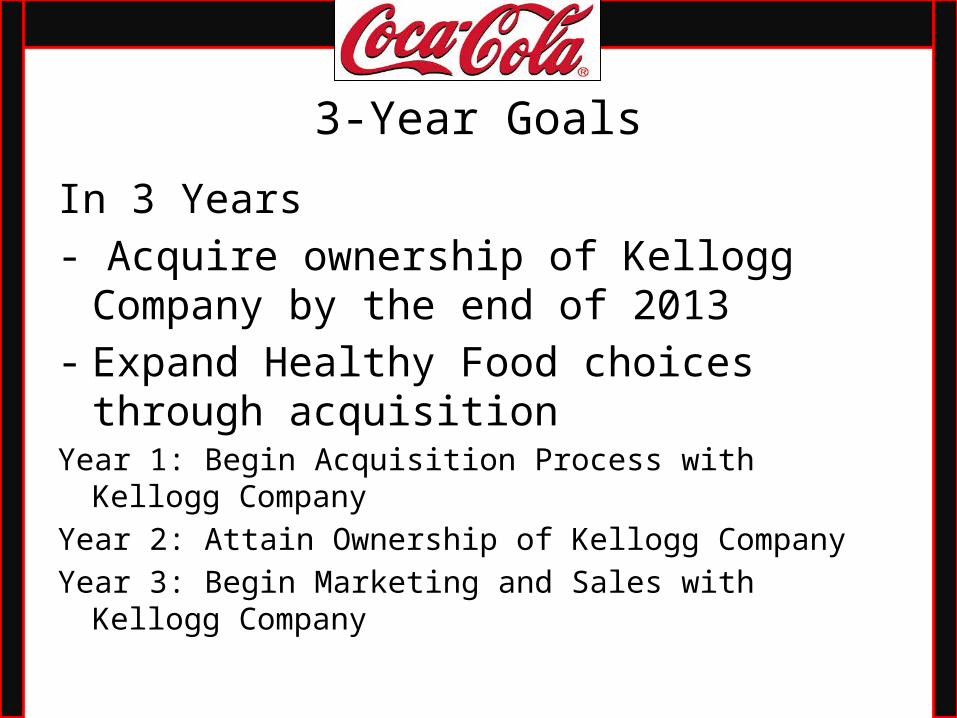
3-Year GoalsIn 3 Years- Acquire ownership of Kellogg Company
by the end of 2013- Expand Healthy Food choices through
acquisitionYear 1: Begin Acquisition Process with Kellogg
Company Year 2: Attain Ownership of Kellogg Company Year 3: Begin Marketing and Sales with Kellogg
Company
Strategic Implementation

Kelloggs Worth Analysis for 2010 (in millions)
Shareholder's equity - Goodwill - Intangibles
(2,930)
Net Income * 5 6,235
(Stock Price/EPS) * NI 17,849
# of Shares Out * Stock Price 17,868
Four Method Average 9,755
Kellogg Company Net Worth Analysis

EPS/EBIT
Capital Needed 6,000,000,000
EBIT Range $7 bil. - $15 bil.Interest Rate 4%Tax Rate 16%Stock Price (Dec. 31, 2010-year end) 30.86Current Shares Outstanding (Basic) 2,308,000,000
CS Shares needed 194,426,442
Assumptions
Common Stock Financing Recession Normal BoomEBIT 7,000,000,000 10,000,000,000 15,000,000,000
Interest -
-
-
EBT 7,000,000,000 10,000,000,000 15,000,000,000 Taxes 2,030,000,000 2,900,000,000 4,350,000,000 EAT 4,970,000,000 7,100,000,000 10,650,000,000 # of Shares 2,502,426,442 2,502,426,442 2,502,426,442 EPS 1.99 2.84 4.26
Debt Financing Recession Normal Boom
EBIT 7,000,000,000
10,000,000,000
15,000,000,000
Interest 240,000,000
240,000,000
240,000,000
EBT 6,760,000,000 9,760,000,000
14,760,000,000
Taxes 1,960,400,000 2,830,400,000 4,280,400,000
EAT 4,799,600,000 6,929,600,000
10,479,600,000
# of Shares 2,308,000,000 2,308,000,000 2,308,000,000
EPS 2.08 3.00 4.54

Stock needed 5,400,000,000
Debt needed 600,000,000
Interest 24,000,000
CS shares needed 174,983,798
Assumptions
Stock needed 600,000,000
Debt needed 5,400,000,000
Interest 216,000,000
CS shares needed 19,442,644
90% Stock - 10% Debt Financing Recession Normal Boom
EBIT 7,000,000,000 10,000,000,000
15,000,000,000
Interest 24,000,000
24,000,000
24,000,000
EBT 6,976,000,000 9,976,000,000 14,976,000,000
Taxes 2,023,040,000 2,893,040,000 4,343,040,000
EAT 4,952,960,000 7,082,960,000 10,632,960,000
# of Shares 2,482,983,798 2,482,983,798 2,482,983,798 EPS 1.99 2.85 4.28
10% Stock - 90% Debt Financing Recession Normal Boom
EBIT 7,000,000,000 10,000,000,000
15,000,000,000
Interest 216,000,000
216,000,000
216,000,000
EBT 6,784,000,000 9,784,000,000 14,784,000,000
Taxes 1,967,360,000 2,837,360,000 4,287,360,000
EAT 4,816,640,000 6,946,640,000 10,496,640,000
# of Shares 2,327,442,644 2,327,442,644 2,327,442,644 EPS 2.07 2.98 4.51
EPS/EBIT Continued
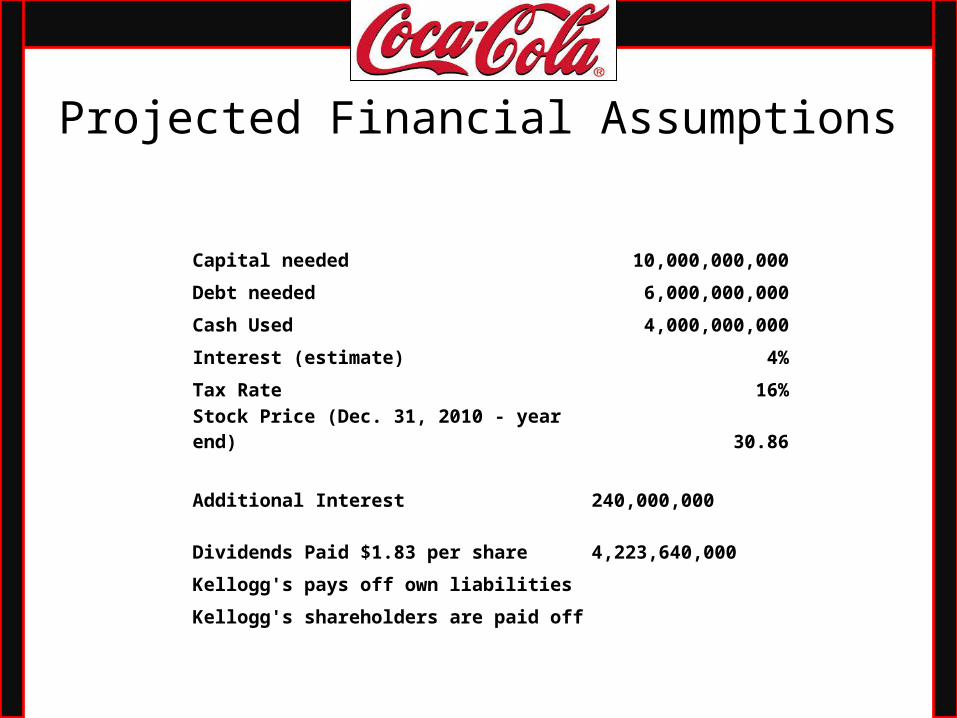
Projected Financial Assumptions
Capital needed 10,000,000,000Debt needed 6,000,000,000Cash Used 4,000,000,000Interest (estimate) 4%Tax Rate 16%Stock Price (Dec. 31, 2010 - year end) 30.86
Additional Interest 240,000,000
Dividends Paid $1.83 per share 4,223,640,000
Kellogg's pays off own liabilitiesKellogg's shareholders are paid off
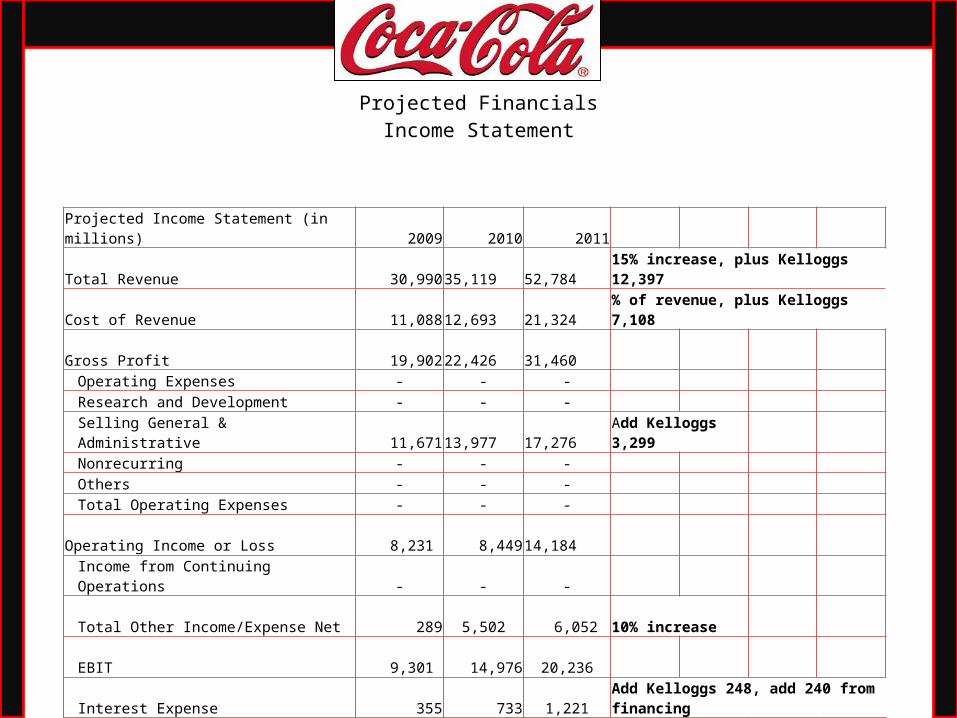
Projected FinancialsIncome Statement
Projected Income Statement (in millions) 2009 2010 2011Total Revenue 30,990 35,119 52,784 15% increase, plus Kelloggs 12,397Cost of Revenue 11,088 12,693 21,324 % of revenue, plus Kelloggs 7,108 Gross Profit 19,902 22,426 31,460
Operating Expenses - - - Research and Development - - - Selling General & Administrative 11,671 13,977 17,276 Add Kelloggs 3,299Nonrecurring - - -Others - - - Total Operating Expenses - - -
Operating Income or Loss 8,231 8,449 14,184 Income from Continuing Operations - - - Total Other Income/Expense Net 289 5,502 6,052 10% increaseEBIT 9,301 14,976 20,236 Interest Expense 355 733 1,221 Add Kelloggs 248, add 240 from financingIncome Before Tax 8,946 14,243 19,015 Income Tax Expense 2,040 2,384 3,042 16% tax rateConsolidated Net Income 6,906 11,859 15,973 Less: Non-Controlling Interests 82 50 50 Same
Net Income 6,824 11,809 15,923
Basic EPS 2.95 5.12 6.90 Diluted EPS 2.93 5.06 6.82Basic Average Shares Outstanding 2,314 2,308 2,308 SameDiluted Average Shares Outstanding 2,329 2,333 2,333 Same
Dividends Per Share 1.64 1.76 1.83

Projected Financials Balance Sheet (1)
Projected Balance Sheet (in millions)ASSETS
Current AssetsCash & Cash Equivalents 6,959 8,379 4,379 Decrease by $4 billion for funds Short-term Investments 2,192 2,820 3,666 30% increaseNet Receivables 3,758 4,430 5,316 20% increaseInventory 2,354 2,650 4,236 20% increase, plus Kelloggs 1,056Other Current Assets 2,226 3,162 4,336 30% increase, plus Kelloggs 225
Total Current Assets 17,551 21,579 21,933 Long-term Investments 6,755 7,585 9,861 30% increaseProperty Plant & Equipment 9,561 14,727 21,537 25% increase, plus Kelloggs 3,128Goodwill 4,224 11,665 15,876 5% increase, plus Kelloggs 3,628Intangible Assets 8,604 15,244 18,696 10% increase, plus Kelloggs 1,456Accumulated Amortization - - -
Other Assets 1,976 2,121 2,989 7% increase like previous year, add Kelloggs 720
Deferred Long-term Asset Charges - - - Total Assets 48,671 72,921 90,892
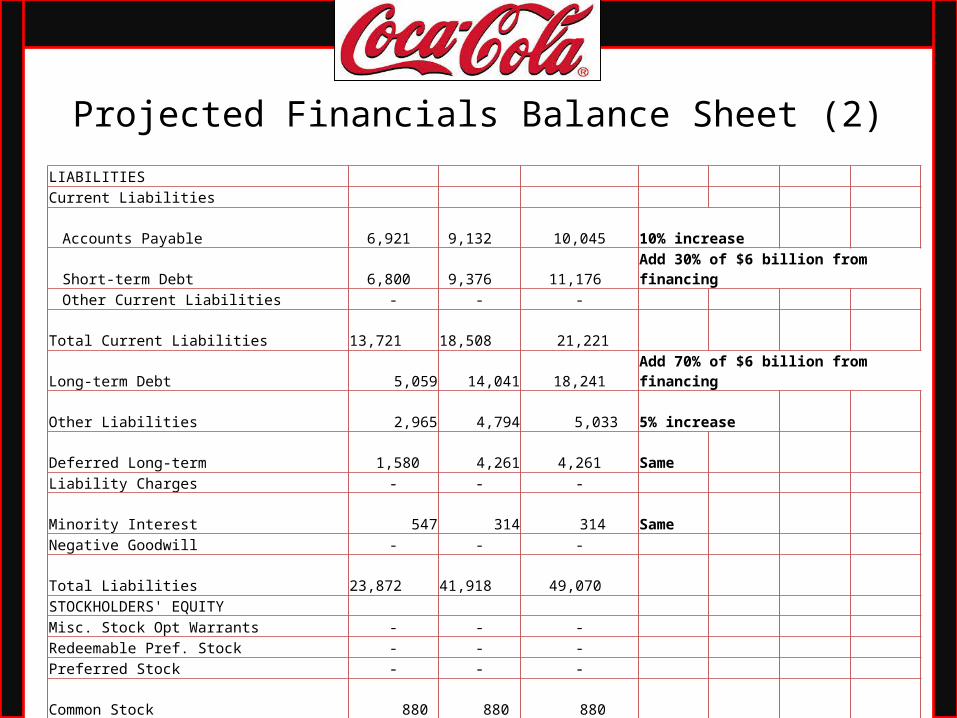
Projected Financials Balance Sheet (2)LIABILITIESCurrent Liabilities
Accounts Payable 6,921 9,132 10,045 10% increaseShort-term Debt 6,800 9,376 11,176 Add 30% of $6 billion from financingOther Current Liabilities - - -
Total Current Liabilities 13,721 18,508 21,221 Long-term Debt 5,059 14,041 18,241 Add 70% of $6 billion from financingOther Liabilities 2,965 4,794 5,033 5% increase Deferred Long-term 1,580 4,261 4,261 SameLiability Charges - - -Minority Interest 547 314 314 SameNegative Goodwill - - - Total Liabilities 23,872 41,918 49,070 STOCKHOLDERS' EQUITYMisc. Stock Opt Warrants - - - Redeemable Pref. Stock - - - Preferred Stock - - - Common Stock 880 880 880
Retained Earnings 41,537 49,278 60,977 Increases from Net Income, Dividends paid out
Treasury Stock (25,398) (27,762) (27,762) SameCapital Surplus 8,537 10,057 10,057 Same
Other Stockholders' Equity (757) (1,450) (1,450) SameTotal Stockholders' Equity 24,799 31,003 41,822 Total Liabilities and Stockholders' Equity 48,671 72,921 90,892

Coca-Cola's Projected Ratios 2010 v. 2011 2010 2011
Current Ratio 1.17 0.97
Quick Ratio 1.02 0.83
Debt to Total Assets 0.57 0.54
Debt to Equity 1.35 1.17
Times Interest Earned 20.43 16.57
Fixed Asset Turnover 2.38 2.45
Total Asset Turnover 0.48 0.58
Inventory Turnover 13.25 12.46
Gross Profit Margin % 63.86 59.60
Return on Stockholders' Equity % 38.09 38.07
Projected Financial Ratios
Strategic Evaluation

Balanced Scorecard
Area of Objectives Measure or TargetTime Expectation
Primary Responsibility
Customers 1 Brand Identity Industry reports/Market Cap. Yearly Marketing Officer2 Satisfaction Customer Survey Yearly Marketing OfficerEmployees 1 Employee Moral Survey Yearly People Officer
2 Service Training # of seminars YearlyAdministrative Officer
Operations 1 Diversify product line Acquire Kelloggs Company Yearly
Administrative Officer
Business Ethics 1 Ethics Training # of ethics training sessions Yearly People Officer2 Recycling Recycle 50% of total wastes Financial 1 Revenues Increase by 50% each year Yearly Financial Officer
2 Ratio AnalysisBetter than competitors/industry Avg. Yearly Financial Officer

Update
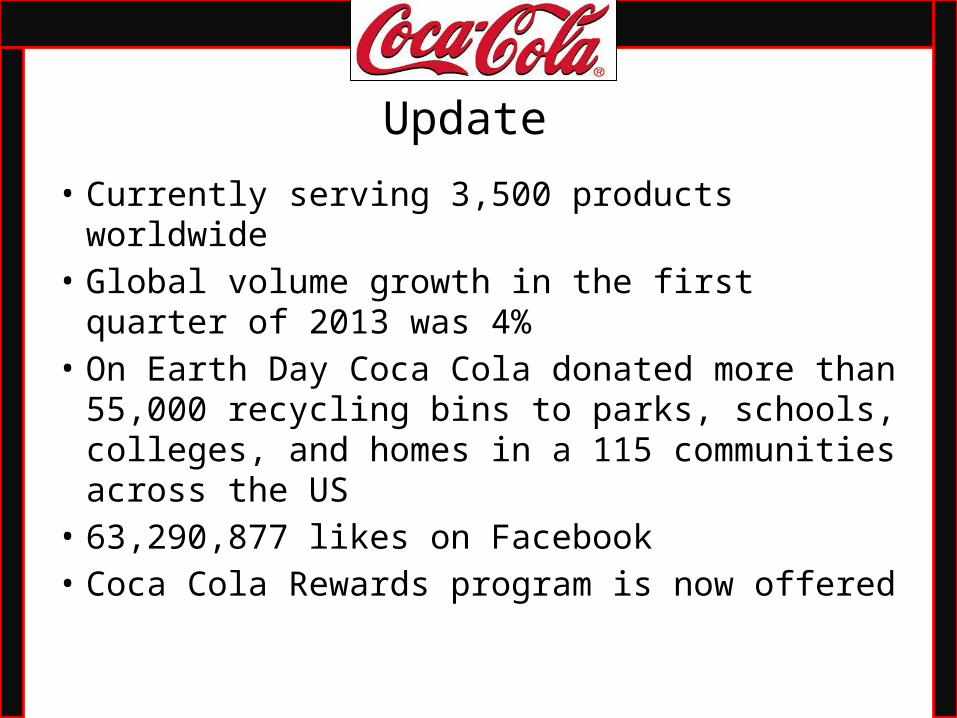
Update • Currently serving 3,500 products worldwide • Global volume growth in the first quarter of
2013 was 4%• On Earth Day Coca Cola donated more than
55,000 recycling bins to parks, schools, colleges, and homes in a 115 communities across the US
• 63,290,877 likes on Facebook • Coca Cola Rewards program is now offered

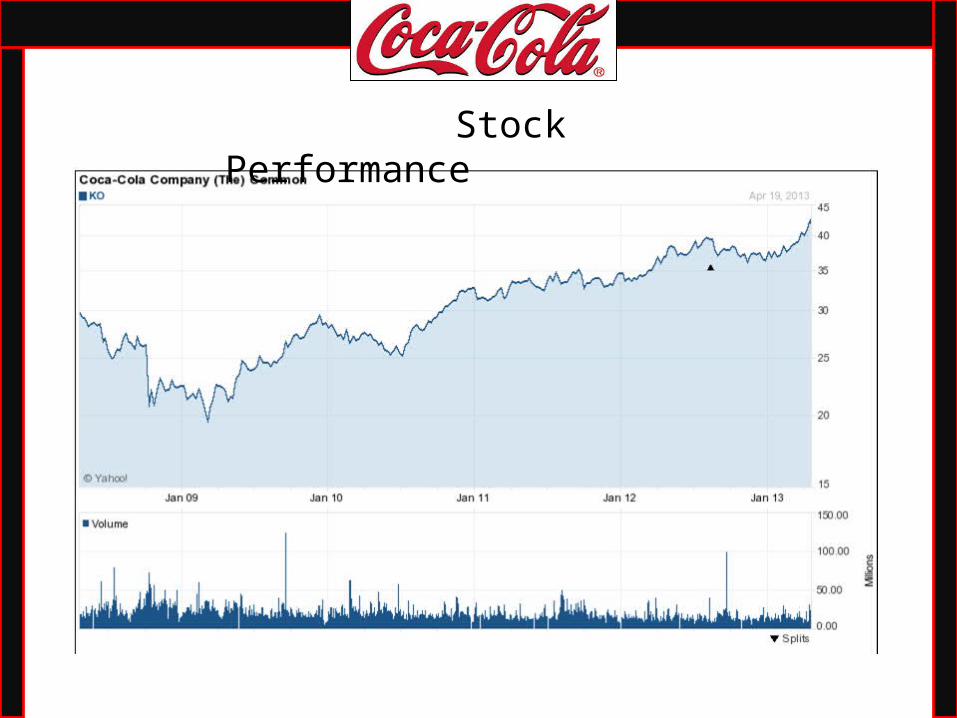
Stock Performance