STRATEGIC INTENTIONS - Corrections Department NZ 2016 · STRATEGIC INTENTIONS 2015 ... those with...
56
STRATEGIC INTENTIONS 2015 – 2019 Presented to the House of Representatives Pursuant to Section 39 of the Public Finance Act 1989 E.61 SI (15)
Transcript of STRATEGIC INTENTIONS - Corrections Department NZ 2016 · STRATEGIC INTENTIONS 2015 ... those with...

STRATEGIC INTENTIONS2015 – 2019
Presented to the House of RepresentativesPursuant to Section 39 of the Public Finance Act 1989
E.61 SI (15)


DEPARTMENT OF CORRECTIONS 1
TABLE OF CONTENTS
Foreword – Minister of Corrections 2
Introduction from the Chief Executive 4
Chief Executive Statement of Responsibility 5
Responsible Minister Statement 5
Agency Nature and Scope 6
The Justice Sector 8
Corrections’ Role within the Justice Sector 9
Managing Functions and Operations 10
Strategic Choices, Opportunities and Challenges 12
Strategic Objectives 15
Performance Framework 16
Public Safety is Improved 17
Re-offending is Reduced 22
Equal Employment Opportunities 28
Annual Legislative Reporting 29
Statement of Performance 2015/16 33
Financial Summary 34
Appendix A – Outcome and Intermediate Outcome Measure Performance and Baseline Comparison 50
STRATEGIC INTENTIONS 2015 – 20192
FOREWORD – MINISTER OF CORRECTIONS
The work of the Department of Corrections is incredibly varied. Whether managing people in the community or in prison, there is one underlying reason for the work we do – public safety. Secure containment of prisoners, rehabilitation programmes, drug and alcohol treatment, industry training, education and support ahead of release all help keep communities safe, and public safety will always be the bottom line.
In 2015-2016 the Reducing Reoffending by 25% Boost Programme will support Corrections to achieve its goal of reducing reoffending by investing in the resources where we can make the most difference. This includes a focus on the more than 5900 prisoners each year serving short (two years or less) terms of imprisonment and the more than 14000 offenders beginning community work sentences. Within these groups there will be a particular focus on family violence offenders, those with drug and alcohol problems and recidivist traffic offenders.
In particular, Corrections will:
> Continue the Out of Gate service to help offenders make a safe and supported transition on their release from prison
> Develop a package of alcohol and drug interventions that tailor intensity to different levels of risk and need
> Provide domestic violence and alcohol and drug education to all new short-serving sentenced prisoners
> Match more prisoners to jobs on release from prison through the employer partnership programme
> Invest more in supported accommodation for released prisoners who are at higher risk of reoffending
> Deliver road safety training through the work and living skills programme for thousands of community based offenders who have driving-related offences.
I will work alongside other stakeholder ministers to ensure Corrections wraps its services around offenders and their families to ultimately reduce the level of reoffending and make our communities safer.
DEPARTMENT OF CORRECTIONS 3
Offender education and helping offenders into jobs reduces their risk of reoffending. Corrections will increase the total learner places available to prisoners by 90 per cent to 1700 this year.
Since becoming Minister of Corrections in October 2014 I have visited prisons and Community Corrections sites to see for myself how our policies work on a practical level. This is very important to me because no matter how earnest our strategic intent and objectives, they will not translate into the outcomes we want to achieve without the support and willingness of our staff, volunteers and partners on the front line of Corrections.
I reaffirm the government’s commitment to the Better Public Services target of reducing reoffending by 25 per cent by 2017 and look forward to supporting Corrections’ progress towards this goal.
Hon Peseta Sam Lotu-IigaMinister of Corrections

STRATEGIC INTENTIONS 2015 – 20194
INTRODUCTION FROM THE CHIEF EXECUTIVE
Every person we prevent from going on to re-offend means at least one less person becoming a victim of crime.
Over the next four years, Corrections will maintain its strong and unified focus on helping each offender to gain the life skills, rehabilitation, treatment, employment and support outcomes they need to remain crime-free.
When we reduce re-offending, we create lasting change for communities. This is why in 2014 we placed RR25% at the centre of our strategy for 2014-2017. When the goal to reduce re-offending by 25% by 2017 was set back in 2012 it was an ambitious goal, but one that remains achievable.
We have shown that it is possible to reduce re-offending; but it is clear more needs to be done in order for us to achieve our 25% target. We will do this in 2015 through the RR25% Boost Programme, which will target those offenders with whom we can achieve the greatest impact.
In May 2015 we opened the Auckland South Corrections Facility. This means more prisoners will be able to be accommodated in fit for purpose prisons closer to their support networks. We are also restructuring our prisons to lift productivity within the prison system. All of this, combined with a concentrated effort on key rehabilitation areas and all prisons becoming places of industry, learning and treatment by 2017 will have a noticeable and positive impact on reducing re-offending.
The number of people re-offending is continuing to reduce. They are coming down because of the work our people, in collaboration with others across the justice sector do every day with every offender to support our priorities:
> community support
> working prisons
> modern infrastructure
> visible leadership.
In the efforts to reduce re-offending we must never lose sight of the need to manage offenders in a way that holds them to account for their offending and keeps the public, our staff, and other offenders safe from harm. In all of our endeavours public safety is very firmly our bottom line.
Ray SmithChief Executive

DEPARTMENT OF CORRECTIONS 5
CHIEF EXECUTIVE STATEMENT OF RESPONSIBILITY
In signing this information, I acknowledge that I am responsible for the information on strategic intentions for the Department of Corrections.
This information has been prepared in accordance with section 38 and section 40 of the Public Finance Act 1989.
Ray SmithChief ExecutiveDepartment of Corrections
RESPONSIBLE MINISTER STATEMENT I am satisfied that the information on strategic intentions prepared by the Department of Corrections is consistent with the policies and performance expectations of the Government.
Hon Peseta Sam Lotu-IigaMinister of Corrections

STRATEGIC INTENTIONS 2015 – 20196
AGENCY NATURE AND SCOPE
Improving public safety and contributing to the maintenance of a just society
The purpose of the Department of Corrections, as defined by the Corrections Act 2004, is to improve public safety and contribute to the maintenance of a just society by:
> ensuring that custodial and community-based sentences and orders imposed by the Courts and the New Zealand Parole Board are administered in a safe, secure, humane, and effective manner
> providing for Corrections’ facilities to be operated in accordance with the Corrections Act 2004 that are based, amongst other matters, on the United Nations Standard Minimum Rules for the Treatment of Prisoners
> assisting in the rehabilitation of offenders and their reintegration into the community through the provision of programmes and other interventions
> providing information to the Courts and the New Zealand Parole Board to assist their decision-making.
We notify victims of crime, registered by the NZ Police on the Victims Notification Register, of information requirements as set out in the Victims’ Rights Act 2002. We also refer registered victims to specialist support organisations for appropriate assistance.
We manage offenders:
> serving sentences and orders in the community
> remanded in custody
> serving custodial sentences.
The average prison population in 2014/15 was approximately 8,700 individuals, and a further 30,000 were serving a community sentence or order. The Department of Corrections employs nearly 8,000 people1 who work in our 18 prisons2 and 167 Community Corrections Sites.
We aim for a 25% reduction in re-offending by 2017, to be achieved through collaborative work with our sector partners. Achieving this will significantly enhance public safety, reducing victims of crime by 18,500 per year.
1 Equivalent to 7,570 full time established positions.2 This figure includes two privately managed prisons (MECF and ASCF) operated by Serco.
DEPARTMENT OF CORRECTIONS 7
The principles we observeIn meeting our purpose, we uphold the following principles:
> maintaining public safety – the maintenance of public safety is the paramount consideration in decisions about the management of persons under control or supervision of the department
> in order to reduce the risk of re-offending, offenders are given access to activities and programmes that will contribute to their rehabilitation and reintegration into the community
> the corrections system ensures the fair treatment of offenders
> victims’ interests are considered in decisions related to offenders
> ensuring fair treatment of offenders, taking into account their cultural background, ethnicity, and language
> encouraging and supporting contact between offenders and their families/whänau where appropriate.

STRATEGIC INTENTIONS 2015 – 20198
THE JUSTICE SECTOR
The Justice Sector provides accessible justice, and encourages a safe and just society where people enjoy civil and democratic rights. To do this, a wide range of agencies are involved in providing services within the civil and criminal justice system. Justice Sector Ministers and agencies work together to achieve the best outcomes.
The Justice Sector aims to achieve a 20% reduction in the overall crime rate by 2018, as part of a series of Better Public Services goals that include reducing violent crime by 20%, youth crime by 25%, and re-offending by 25%.
A Sector Leadership Board drives performance across the justice system. This Board coordinates, plans, and modernises activities throughout the sector, working to reduce costs, improve services, and further enhance public safety. The Board is chaired by the Secretary for Justice and comprises the Chief Executives of the Ministry of Justice and Department of Corrections, as well as the Commissioner of Police.
Sector prioritiesThe overall outcome for the Justice Sector is to provide a safe and just society. This outcome is supported by the following five shared priority areas, which guide planning and activity across the sector:
1. Reduce the harm caused by crime
2. Reduce the volume of crime
3. Maintain strong institutions
4. Improve services
5. Manage investment.
PerformanceThe sector reports performance quarterly across three Key Performance Indicators:
> The number of people entering the criminal justice system
> The time it takes for cases to proceed through the court system
> The rate of re-offending.
DEPARTMENT OF CORRECTIONS 9
CORRECTIONS’ ROLE WITHIN THE JUSTICE SECTOR
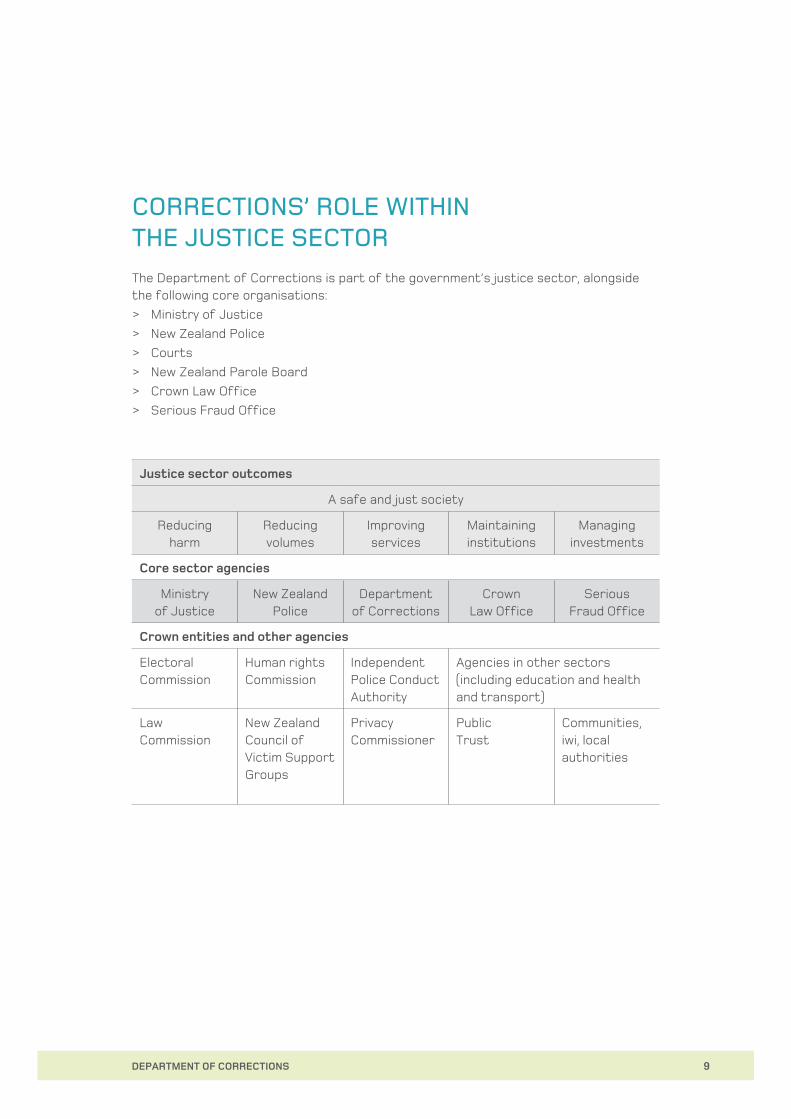
The Department of Corrections is part of the government’s justice sector, alongside the following core organisations:
> Ministry of Justice
> New Zealand Police
> Courts
> New Zealand Parole Board
> Crown Law Office
> Serious Fraud Office
Justice sector outcomes
A safe and just society
Reducing harm
Reducing volumes
Improving services
Maintaining institutions
Managing investments
Core sector agencies
Ministry of Justice
New Zealand Police
Department of Corrections
Crown Law Office
Serious Fraud Office
Crown entities and other agencies
Electoral Commission
Human rights Commission
Independent Police Conduct Authority
Agencies in other sectors (including education and health and transport)
Law Commission
New Zealand Council of Victim Support Groups
Privacy Commissioner
Public Trust
Communities, iwi, local authorities
STRATEGIC INTENTIONS 2015 – 201910
MANAGING FUNCTIONS AND OPERATIONS
Managing operations in a fiscally constrained environmentThe department’s financial strategy is based on its commitment to live within its 2011 forecast baseline levels until 2020, while reprioritising its resources to ensure funding is available to meet top-line investment in priorities. The department will create fiscal capacity to respond to cost pressures through reprioritisation over the medium term, while continuing with its capital investment programme established to support and enhance its operations, improve public safety and contribute to the overall goal of reducing re-offending.
The offender populationCorrections continues to adapt to changes in the make-up of the prison and community offender populations that we manage. Changes to legislation in 2007 resulted in a growth in the volume of offenders serving their sentence on home detention. The number of offenders serving indeterminate sentences has increased steadily, due to these individuals spending longer average periods in custody. The proportion of the imposed sentence served by longer-serving prisoners generally has also increased, from around 65% in 2009, to over 75% currently. A much greater proportion of the present prison population is comprised of offenders serving longer sentences for very serious offences, with a corresponding decrease in the proportion serving shorter sentences for offences such as dishonesty and traffic-related offences.
Our peopleThe Department of Corrections employs nearly 8,000 people and operates a 24/7 service. Staffing levels are dependent on offender numbers, the type of offence committed and the level of offender needs.
Corrections requires prisoner and offender/staff ratios that maintain safety and security and allow the level of interaction and interventions necessary to deliver an effective service. Staffing levels are also influenced by the practice models we operate under. These practice models have been designed to support an integrated approach to offender management and ensure the safety of our staff.
We invest in our staff to assist them to be more effective in their roles and ensure they have the appropriate skills to respond to the challenges of working with the prisoner and offender population. Enhancement of our staff safety work programme and our relentless focus on health and safety will ensure we do our best to prevent harm to our people on the frontline.

DEPARTMENT OF CORRECTIONS 11
In 2015, the strategic priorities of year three of the Staff Safety programme will focus on:
> intelligence led risk management systems – utilising information gained through intelligence to involve and task our people to coordinate risk management responses
> effective and enduring staff and offender engagement – ensuring prisoners and staff interact in a way that encourages good custodial practice that optimises the opportunities time in custody offers prisoners
> empowering our frontline staff – considering a framework of incentives and earned privileges that staff can use to ensure prisoners engage in structured and busy days.
The third year of the Staff Safety programme will consolidate the work of the previous years and allow us to assess the achievement of the programme’s goal – that safety is at the heart of everything we do.
We will continue to recognise the talent of our people and develop it at all levels by embedding the Emerging Leaders programme nationally, ensuring talent is recognised and given opportunity to thrive as well as investing in our staff through our new Frontline Futures initiative.
STRATEGIC INTENTIONS 2015 – 201912
STRATEGIC CHOICES, OPPORTUNITIES AND CHALLENGES
Strategic choicesCorrections’ commitment to live within its 2011 forecast baseline levels until 2020 requires us to effectively manage resources to ensure funding is available to invest in improving public safety and reducing re-offending. We will drive this through prudent investment choices and continuous improvement in delivering value through our programmes, interventions, and practice.
Maintaining safe and secure prisons, managing and monitoring offenders in the community and continuing to improve staff safety will remain our core business.
Effectively managing resourcesThe department manages over $2.5 billion of assets, providing facilities, technology, and equipment that support our operations that run the length of the country. Many of these facilities operate 24 hours a day, 7 days a week. The estate includes 18 prisons, two of which are privately operated by Serco, and a remand centre in New Plymouth. The department works from 167 community sites across the country, which are either leased or owned, and this includes the use of court sites. We also provide facilities for offender employment activities and rehabilitative programmes.
Our facilities must be safe and fit-for purpose, secure, well maintained and must foster purposeful opportunities for rehabilitation and offender employment.
Our large asset base provides limited flexibility in the short term to reduce asset management costs given the purpose built nature of prisons and their geographical spread. The department will ensure that its capital assets are utilised effectively.
We will succeed in providing better public value through our capital and asset management programme by:
> improving our facilities to engage prisoners in work or training
> modernising Community Corrections sites, creating hubs that encourage more efficient interactions between staff, offenders, and service providers in the community
> co-locating work premises with our Justice Sector partners, including the Christchurch Justice and Emergency Services Precinct (CJESP) where Corrections and NZ Police will share a custodial suite designed for initial offender inductions and court servicing
> implementing efficiency and effectiveness reviews and strategies to mitigate future cost pressures and contribute to living within our 2011 funding baseline until 2020
> incorporating centralised services and outcomes based contracting to ensure resources are used efficiently in the work we do with offenders.
DEPARTMENT OF CORRECTIONS 13
Strategic opportunities
Lifting productivity and performance in New Zealand prisonsTo fully realise a 25% reduction in re-offending by 2017 we will put further focus on improving outcomes for offenders while in prison.
We have invested significantly in our prisons over the last four years, making them more secure, safer places for staff, prisoners and visitors and providing an environment that encourages rehabilitation and learning.
Changes to the staffing structure of prisons and decommissioning assets that have reached the end of their economic life will be implemented throughout 2015; lifting productivity and performance in prisons. This will be delivered by unifying key operational delivery functions under a single management structure and preventing expenditure on the remedial costs of updating and maintaining end of life facilities.
The opening of the 960 bed men’s prison at Auckland South Corrections Facility provides an opportunity to maintain capacity to meet the prison population demand, while reducing our asset costs elsewhere in the estate.
The unified structure for each prison will enable us to lift productivity and performance in New Zealand’s prisons by:
> providing a structure and clarity of purpose to our prison operations that will enable us to meet our reducing re-offending goal of 25% by 2017, particularly with offenders in prison
> streamlining the process of rehabilitation, employment, and treatment in prisons
> addressing facilities that are no longer fit for purpose.
One of the projected outcomes of the changes in staffing structures in prisons will be to strengthen practice leadership nationally.
The unified structure for each prison will see all custodial, educational, employment, reintegration, treatment, health, and rehabilitation services under the leadership of a prison director. Prison directors will have full access to the resources needed to build further leadership and capability support to enable the roll out of working prisons and create lasting change in the lives of offenders.
Ongoing challengesCorrections can make an enduring contribution in maintaining the integrity and improving the performance of the Justice Sector3. There will always be a requirement to maintain a high level of sentence compliance, and to do that in a way that meets society’s expectations for the treatment of victims and offenders, as well as consistent improvements in terms of value for money.
3 Performance Improvement Framework – Follow-up Review of the Department of Corrections April 2014
STRATEGIC INTENTIONS 2015 – 201914
Achieving the current re-offending reduction target is likely to require even more emphasis on reducing the harm that re-offending causes.
A continuing focus on harm reduction would see a sharper focus given to the most harmful type of offending and to reducing the seriousness of offending in those cases where re-offending does occur.
All of these factors suggest that Corrections will need to be able to:
> continue to innovate and evaluate new approaches, and increase interventions that are shown to be the most effective
> produce better individual-level data and analytics that can predict likely outcomes for specific offenders. This will require more effective partnerships with both public and private sector organisations, which target and prioritise offenders with the highest likelihood of causing harm over their remaining lifetimes
> further expand the use of Electronic Monitoring technologies, for example GPS tracking and containment and geo-spatial information, to enable safer community-based sentences and more efficient operation
> show greater effectiveness in converting reduced crime and re-offending rates to lower prison musters and cost savings, in order to meet future pressures and invest in scaling more effective interventions.

DEPARTMENT OF CORRECTIONS 15
STRATEGIC OBJECTIVES
Our vision Creating lasting change by breaking the cycle of re-offending
Our goal To reduce re-offending by 25% by 2017
Our goal is the Government’s target to reduce re-offending by 25% by 2017. Our vision is to create lasting change by breaking the cycle of re-offending. Public safety remains our bottom line.
The department has achieved significant gains in reducing re-offending. This was achieved through brief and focused interventions towards low-level offending, and saw significant reductions in imprisonment for offenders who had previously been convicted for low-level traffic, drug, or similar crimes. When the goal to reduce re-offending by 25% by 2017 was set in 2012 it was an ambitious goal, but one that remains achievable.
A review of our efforts and a refreshed approach will see a greater focus on key population groups that have historically not been targeted, and a strategic approach to reducing the harm of re-offending. This includes more emphasis on success with short-serving prisoners and increasing delivery of interventions to a higher volume of community-based offenders. Key initiatives are also being developed or expanded to support further reductions in re-offending by better targeting offenders’ needs.
In order to achieve reducing re-offending and improving public safety outcomes, the department will focus on five intermediate outcomes. A series of Key Performance Indicators sets out how we will measure our performance.
Our targeted approach to reducing re-offending has seen us develop strategies in specific delivery areas, with a focus on outcomes that we know contribute to a reduction in re-offending.
We will continue to deliver alcohol and other drug treatment as well as new and expanded rehabilitation interventions for prisoners and community-based offenders. More prisoners will receive education and employment training while we continue to work with employers and industries to provide jobs for community offenders and prisoners released from prison. We will partner with community groups to deliver rehabilitation and assist with reintegration into the community.

STRATEGIC INTENTIONS 2015 – 201916
PERFORMANCE FRAMEWORK
Re-offending is Reduced
INTERMEDIATE OUTCOMES
OUTCOMES
HOW THIS WILL BE
ACHIEVED
KEY PERFORMANCE
INDICATORS
Public Safety is Improved
Offenders’ capability to lead law abiding lives
is improved
Offenders’ ability to integrate into the community
is improved
The proportion of prisoners with an identifi ed need
who have a programme placement
The proportion of prisoners who
demonstrate statistically
signifi cant gains through intensive
literacy and numeracy provision
The total number of qualifi cations
achieved by prisoners while in
prison
There is a reduction in rates
of re-offending
Reintegration initiatives ensure sustainability of
rehabilitation interventions
The number of offenders that are
referred to a reintegration intervention
All public prisons to be transitioned
to the working prisons framework and achieving 100%
prisoner engagement by
30 June 2017
The total number of offenders that
are referred to employment
support services
The number of breakout escapes
The percent of self-harm threat to life interventions where an unnatural death did not occur
The proportion of general random drug tests that have a positive result
The number of unnatural deaths
The proportion of complaints by prisoners to the Corrections Inspectorate upheld for reasons of materiality
Offenders are held to account
There is a reduction in the seriousness of re-offending
The proportion of community-based
offenders complying with
their sentence or order
The proportion of community-based offenders being
held to account for non-compliance
A reduction in the rate of offenders
who started a community
sentence or order then committed a new against-the-person offence
during the following period of
management
Community sentences address
safety and rehabilitation
needs
The proportion of community-based offenders with an
identifi ed need who have a programme
placement
The proportion of offenders on Electronic
Monitoring who are reconvicted of a new offence while under EM
conditions
Re-offending while on a sentence or order and within
the 12 month follow up period
resulting in a reconviction
A reduction in the rate of offenders who started home detention or parole
and then committed a new
offence during the following period of
management, compared to the
previous year
Harm levels of re-offending
are reduced
The integrity of sentences and
orders is improved
A safe and secure Corrections system is assured
Custodial environments are safe and humane
JUSTICE SECTOR OUTCOME: SAFE AND JUST SOCIETY
Individual offender rehabilitation
needs are identifi ed and met
JUSTICE SECTOR OUTCOME: SAFE AND JUST SOCIETY

DEPARTMENT OF CORRECTIONS 17
PUBLIC SAFETY IS IMPROVED
Harm levels of re-offending are reduced
Offenders are held to account
Reducing the harm of re-offendingAn increase in our Electronic Monitoring capabilities will contribute to public safety outcomes, with enhanced GPS options for monitoring the whereabouts of any breaches of conditions by offenders. Access to standardised real-time information on the location of offenders, through the 3M Electronic Monitoring system, allows breaches to be detected at an early stage, protecting the public and reducing the harm that offenders can cause before their breach is identified.
The new system will detect violations of sentences and orders as soon as they occur and will keep the department informed of the offender’s movements, meaning that responses will be faster and more accurate. The opportunities for offenders to commit new offences are therefore substantially reduced.
Audio-visual links (AVL) technologyOur use of AVL technology reduces the security risks associated with transporting prisoners to court. Expanding our use of this technology will allow more prisoners to engage in court processes and other activities without leaving prison.
ProgrammesIn the community, we will be increasing our rehabilitative provision in three main areas:
> new alcohol and other drug maintenance programmes for offenders released from custody on parole or conditions
> increase medium intensity programmes, including family violence and AOD interventions, for offenders on intensive supervision and supervision orders
> increase drink-drive and driver licence education interventions for offenders on community work.
STRATEGIC INTENTIONS 2015 – 201918
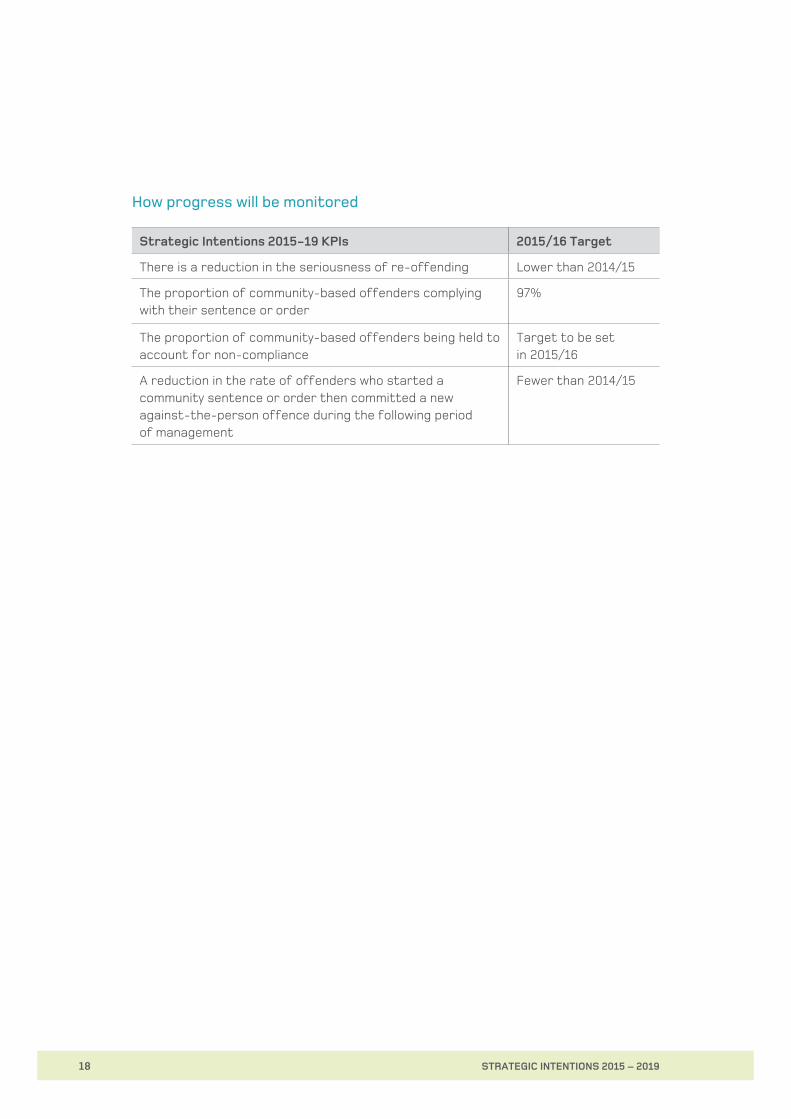
How progress will be monitored
Strategic Intentions 2015-19 KPIs 2015/16 Target
There is a reduction in the seriousness of re-offending Lower than 2014/15
The proportion of community-based offenders complying with their sentence or order
97%
The proportion of community-based offenders being held to account for non-compliance
Target to be set in 2015/16
A reduction in the rate of offenders who started a community sentence or order then committed a new against-the-person offence during the following period of management
Fewer than 2014/15

DEPARTMENT OF CORRECTIONS 19
The integrity of sentences and orders is improved
Community sentences address safety and rehabilitation needs
Ensuring offenders complete their sentences as ordered by the courts contributes to public safety. To achieve this, Corrections will continue to enhance its technology and services to ensure offenders in the community comply with their sentences and orders, and risks to public safety are managed. To deliver this, we will improve services in Electronic Monitoring of offenders. Frontline staff have also received secure smart phones with expanded capability to access real-time offender movement information, optimising information sharing, communication and safety.
Increased capacity for Electronic Monitoring of offenders in the communityEnd to end Electronic Monitoring of high-risk offenders in the community and people remanded to Electronically Monitored bail is now delivered by one supplier, 3M. The 3M contract is the result of a consolidation of several contracts for supply of monitoring services. The new contract has raised the service level and creates a more robust system of monitoring, capable of monitoring a higher volume of offenders. 3M’s point of difference is the monitoring of more offenders with GPS whose whereabouts is fundamental to sentence or order compliance.
The enhanced GPS technology employed will ensure that offenders are held to account if they breach the conditions of their sentences and orders. From June 2015, 55% of the offenders electronically monitored in the community will be monitored by GPS, compared to 5% in November 2014. Other forms of monitoring will continue, such as home visits and reporting in with probation officers. The 3M contract provides for monitoring up to 4,500 offenders. Offenders who would be eligible for GPS monitoring include:
> Prisoners on Released to Work
> Offenders sentenced to home detention
> Offenders with community-based sentences and orders (excluding community work)
> High-risk offenders in the community
> People on Electronically Monitored bail.
STRATEGIC INTENTIONS 2015 – 201920
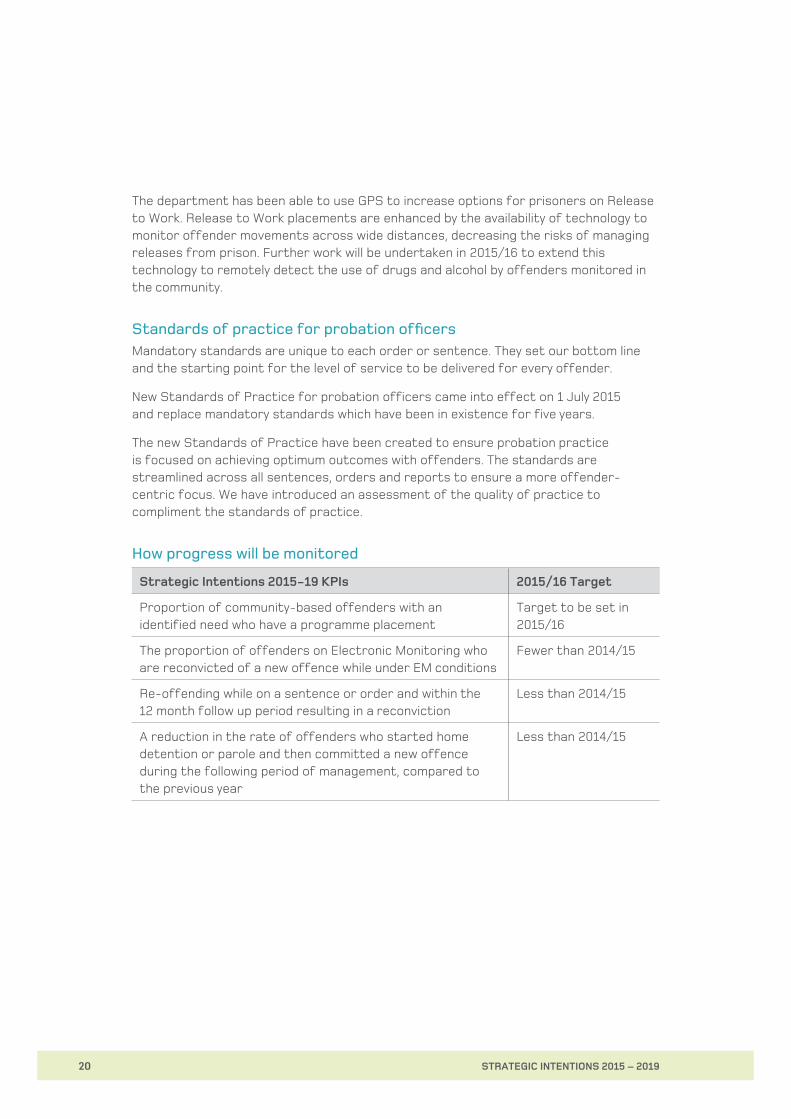
The department has been able to use GPS to increase options for prisoners on Release to Work. Release to Work placements are enhanced by the availability of technology to monitor offender movements across wide distances, decreasing the risks of managing releases from prison. Further work will be undertaken in 2015/16 to extend this technology to remotely detect the use of drugs and alcohol by offenders monitored in the community.
Standards of practice for probation officersMandatory standards are unique to each order or sentence. They set our bottom line and the starting point for the level of service to be delivered for every offender.
New Standards of Practice for probation officers came into effect on 1 July 2015 and replace mandatory standards which have been in existence for five years.
The new Standards of Practice have been created to ensure probation practice is focused on achieving optimum outcomes with offenders. The standards are streamlined across all sentences, orders and reports to ensure a more offender-centric focus. We have introduced an assessment of the quality of practice to compliment the standards of practice.
How progress will be monitored
Strategic Intentions 2015-19 KPIs 2015/16 Target
Proportion of community-based offenders with an identified need who have a programme placement
Target to be set in 2015/16
The proportion of offenders on Electronic Monitoring who are reconvicted of a new offence while under EM conditions
Fewer than 2014/15
Re-offending while on a sentence or order and within the 12 month follow up period resulting in a reconviction
Less than 2014/15
A reduction in the rate of offenders who started home detention or parole and then committed a new offence during the following period of management, compared to the previous year
Less than 2014/15
DEPARTMENT OF CORRECTIONS 21
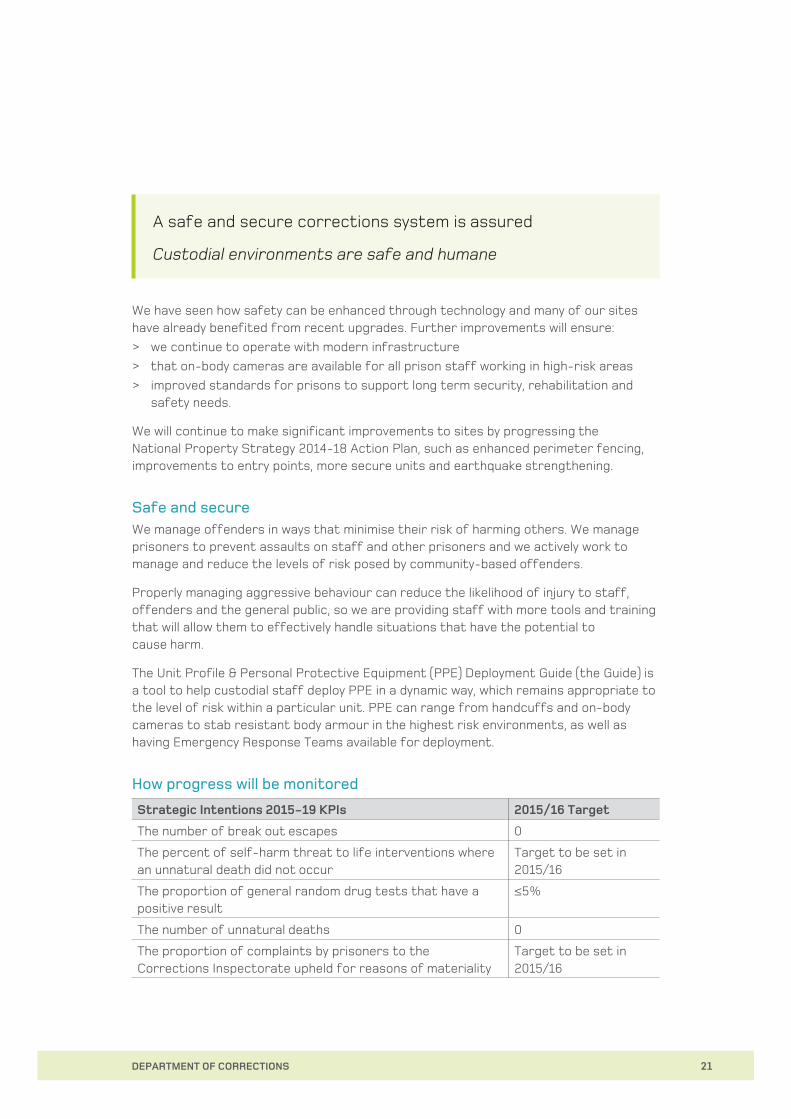
A safe and secure corrections system is assured
Custodial environments are safe and humane
We have seen how safety can be enhanced through technology and many of our sites have already benefited from recent upgrades. Further improvements will ensure:
> we continue to operate with modern infrastructure
> that on-body cameras are available for all prison staff working in high-risk areas
> improved standards for prisons to support long term security, rehabilitation and safety needs.
We will continue to make significant improvements to sites by progressing the National Property Strategy 2014-18 Action Plan, such as enhanced perimeter fencing, improvements to entry points, more secure units and earthquake strengthening.
Safe and secureWe manage offenders in ways that minimise their risk of harming others. We manage prisoners to prevent assaults on staff and other prisoners and we actively work to manage and reduce the levels of risk posed by community-based offenders.
Properly managing aggressive behaviour can reduce the likelihood of injury to staff, offenders and the general public, so we are providing staff with more tools and training that will allow them to effectively handle situations that have the potential to cause harm.
The Unit Profile & Personal Protective Equipment (PPE) Deployment Guide (the Guide) is a tool to help custodial staff deploy PPE in a dynamic way, which remains appropriate to the level of risk within a particular unit. PPE can range from handcuffs and on-body cameras to stab resistant body armour in the highest risk environments, as well as having Emergency Response Teams available for deployment.
How progress will be monitored
Strategic Intentions 2015-19 KPIs 2015/16 Target
The number of break out escapes 0
The percent of self-harm threat to life interventions where an unnatural death did not occur
Target to be set in 2015/16
The proportion of general random drug tests that have a positive result
≤5%
The number of unnatural deaths 0
The proportion of complaints by prisoners to the Corrections Inspectorate upheld for reasons of materiality
Target to be set in 2015/16
STRATEGIC INTENTIONS 2015 – 201922
RE-OFFENDING IS REDUCED
Offenders’ capability to lead law abiding lives is improved
Individual offender rehabilitation needs are identified and met
RehabilitationCorrections assesses the effectiveness of its rehabilitation programmes by measuring their impact through the Rehabilitation Quotient (RQ). The RQ shows the extent to which re-offending is reduced by comparing rates of reconviction and reimprisonment amongst offenders who completed a rehabilitative intervention, with the rates observed amongst similar offenders (matched to a range of risk-related factors) who had no involvement in the programmes.
We understand what drives variability and use this knowledge to improve our effectiveness. We have built a suite of programmes and interventions that range from ‘light-touch’ brief motivational interventions that can be delivered in large volumes to offenders, through to 12 month residential treatment in therapeutic communities known as Special Treatment Units, reserved for offenders with the highest risks and needs.
As well as ensuring compliance with sentences and orders and the safe and secure containment of prisoners, we will continue to reduce re-offending rates by providing the timely assessment of rehabilitative and reintegration needs of offenders.
The 2012 Reducing Re-offending programme set delivery targets of new and expanded rehabilitation interventions for 7,855 additional prisoners and community-based offenders by 2017. In 2013/14, 7,439 prisoners and 6,596 community-based offenders started a rehabilitation programme. As a result of an expansion of programmes, by 2017 an additional 120 prisoners per year will be treated in one of the department’s six Special Treatment Units (STU) for high-risk offenders.
STU programmes are high intensity, psychological interventions that focus on the specific recidivism risk factors associated with offending such as sexual offending against children or violent offending. An increase in these high intensity programmes compliments the increase in low intensity programmes for lower-level offending introduced as part of the refreshed approach to reducing re-offending by 25% by 2017.
A key enabler to improving rehabilitation will be embedding an end-to-end case management approach. Offenders will move through planned phases of assessment, education, treatment, maintenance and skills development. Alongside this, interventions will be delivered as determined by case managers and probation staff.
DEPARTMENT OF CORRECTIONS 23
Working prisonsA working prison engages prisoners in treatment, learning and industry to prepare them for integrating into society and finding employment on release. All our public prisons will be converted to working prisons by 30 June 2017. The intention is for people to be engaged for 40 hours per week wherever possible. All prisoners are eligible and the number of hours they participate per week depends on the individual.
The readiness of a prison to make the transition to a working prison is dependent on security and infrastructure, capability to provide programmes and location to employment opportunities. We have been increasing the capability and security of our sites as part of a wider modernisation programme to enhance New Zealand prisons and to uphold safety.
Corrections’ transformational business programme will fundamentally change the way we do business in our custodial environment. The overall purpose of the programme is to configure our prison network, leadership and front line workforce to better meet the operational demands and challenges of the future and to meet our reducing re-offending target.
Each site offers different activities and support that is tailored for the type of prisoners held and employment opportunities available. As more sites become working prisons, they will work together as a network to co-ordinate the best placement for a prisoner based on their specific needs and offender pathway.
Self-directed, vocational learning and Release to Work programmes are offered across all prison sites. Practical training and programmes vary between sites based on location and available resources, for example the construction yard at Rolleston Prison.
Ultimately, our prisons will be more effective if they operate as part of a network with individual sites working to their strengths without duplicating resources. Corrections will create a prison system where offenders are placed in prisons depending on their employment, education and rehabilitative needs at any given time, as well as their sentence and risk level. The network will include centres of excellence for specific groups, such as young offenders.
Upgrades to community corrections sitesThe department is in the second year of a programme to upgrade 70% of its Community Corrections sites by improving the safety and amenity of facilities so staff can best support offenders to be rehabilitated, develop effective life skills, get a stable job and not re-offend. The upgraded sites will provide improved rehabilitation and learning venues and safer meeting areas for probation staff to work directly with offenders. Sites that are safe as well as functional provide enhanced opportunities for offenders to interact with staff and comply with their sentences and orders. Given the geographical spread of the offender population, accessible Community Corrections sites that meet offender needs will maximise the potential to reduce re-offending.
STRATEGIC INTENTIONS 2015 – 201924
The National Property Strategy also provides for the consolidation of sites, reducing the overall facility footprint and (where appropriate) joining with other justice and social sector agencies.
Enable greater offender participationCorrections will develop and implement a system of Custodial Management Assessment (CMA). This is part of the suite of a newly revised Prisoner Placement System which is the key process for determining a prisoner’s unit allocation within the prison and the level of supervision required for the safe and secure management of that prisoner outside the unit. The system consists of two distinctive parts:
> Prisoner Placement Tool: an assessment, with a focus on offender history, to determine whether a prisoner is suitable to reside in low, high or maximum security accommodation. The prisoner placement tool assesses the risk posed by a prisoner while inside or outside prison, including the risk of escape and the risk that escape would pose to the public.
> Custodial Management Assessment: an assessment, with a focus on offender history and other dynamic factors, to determine the necessary level of restraint and supervision required for the safe management of a prisoner in their interaction with other prisoners, staff and/or the community either in, or outside the prison.
Specific funding for quality programmesIn 2014 Corrections signed a Memorandum of Understanding with the Tertiary Education Commission. This procurement approach will lead to more prisoners being supported with their literacy needs while gaining industry relevant skills and qualifications.
The Memorandum sets out funding that will be made available for prison-based education and training in 2015/2016. The funding is intended for the provision of industry relevant levels 1 and 2 NZQF qualifications. All 1 and 2 level NZQA qualifications have embedded literacy.
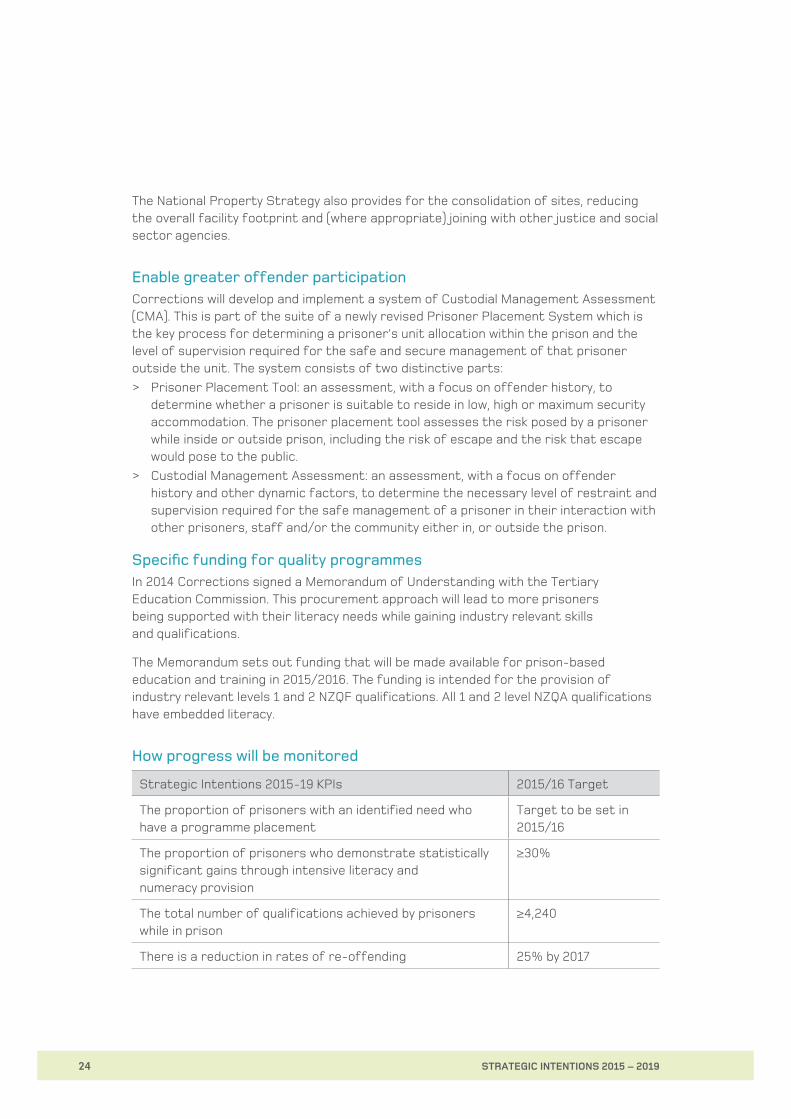
How progress will be monitored
Strategic Intentions 2015-19 KPIs 2015/16 Target
The proportion of prisoners with an identified need who have a programme placement
Target to be set in 2015/16
The proportion of prisoners who demonstrate statistically significant gains through intensive literacy and numeracy provision
≥30%
The total number of qualifications achieved by prisoners while in prison
≥4,240
There is a reduction in rates of re-offending 25% by 2017
DEPARTMENT OF CORRECTIONS 25
Offenders’ ability to integrate into the community is improved
Reintegration initiatives ensure sustainability of rehabilitation interventions
Community support will see offenders and their families receiving the support they need to help them reintegrate in society and remain crime free.
We know from our recidivism data that the risk of re-offending is most pronounced during the period immediately following release; a fifth of reimprisonments happen in the first three months after release and half happen within 12 months.
The department currently invests over $13 million in reintegration services. These services offer assistance to offenders aimed at reducing re-offending.
Partnerships and collaborationAll prisoners are eventually released and return to the community, requiring reintegration support. Churches, iwi groups and volunteer bodies offer scope to foster more community support for ex-offenders. Private sector employers can benefit from the skills ex-offenders have gained in prisons. This means building on the success of events like Prison Gate to Plate, one of a range of events transforming the way people see Corrections and the potential to employ offenders. In many cases, government agencies are improving outcomes for the same high needs groups, including reintegrating prisoners and their families. Combining efforts offers mutual benefits, such as our partnership with Housing New Zealand for prisoners at Rolleston Prison who are building houses for the Christchurch re-build.
Reviewing prison industriesCorrections is assessing its prison industries and prisoners’ placement within them, and evolving our sites to ensure the approach to prison industries is in line with local employment needs. This assessment will also allow us to profile individual prisons and identify its core function as it relates to the opportunities that local industry and other opportunities provide, ie should the prison’s focus be on rehabilitation and education, or training and employment. The outcome of the assessment will be to ensure that prison industries represent the most cost effective way of giving prisoners employment experience while decreasing our need to compete in the marketplace and optimising the opportunities for offender employment and training.
In some areas, there are opportunities to reduce our capital asset base and our exposure to commodity fluctuations. For example, our large scale farming and timber operations at Tongariro/Rangipö will be significantly reduced in size and re-purposed to become a fully-fenced training farm, which will increase training opportunities for prisoners and reduce financial risk.

STRATEGIC INTENTIONS 2015 – 201926
Out of GateOut of Gate is an outcomes-based navigation service that improves reintegration into the community by helping offenders access or establish suitable accommodation, budgeting advice, employment advice and support to address their needs. There have been over 4,000 referrals to date and this service will assist 2,150 offenders under this initiative each year.
Out of Gate is aimed at prisoners being released from a sentence of two years or less. These offenders make up the majority of those to be released and often have the most acute needs.
We intend to increase investment to continue the reintegrative Out of Gate service.
Supported accommodationCorrections currently contracts a number of service providers, such as the Salvation Army, to provide transitional accommodation for up to 90 days for prisoners released from a sentence of two years or longer (long serving prisoners). This service provides a 90 day window for released prisoners to receive further navigational services in order to secure suitable longer term accommodation options. These services are concentrated in the six metropolitan centres of Auckland, Hamilton, Napier, Wellington, Christchurch and Dunedin.
We aim to continue to grow our capacity in supported accommodation service provision, and are working with providers to improve both supply of service and suitable accommodation stock in other areas of the country.
For released prisoners with a high-risk of re-offending, we contract services to provide intensive residential programmes for a small number of offenders. These offenders are monitored in accordance with the monitoring conditions on their post-release orders and the accommodation service can last up to two years.
Current demands on supported accommodation are challenging for the department. The department currently supports up to 214 released offenders through its existing supported accommodation network and proposes to increase that to 284 next financial year, which will go some way towards resolving these pressures.
Real jobs on releaseCorrections aims to equip both prisoners and community offenders with the skills, support and resilience they require to be successful in the labour market. There are a number of initiatives that the department has introduced to achieve this goal. This includes transforming our prisons into working prisons, contracting external providers to deliver employment support, developing employer partnership agreements and upskilling and utilising our frontline staff so they can deliver employment assistance or refer offenders to specialist providers.

DEPARTMENT OF CORRECTIONS 27
In 2014 Corrections contracted employment support providers to deliver individualised assistance to prisoners and offenders to support them to find and maintain paid employment. The service is targeted at eligible prisoners and community offenders who have been identified as most likely to succeed in finding and retaining a job, but require a high level of support to do so.
We have signed partnership agreements with employers who are interested in committing to hiring prisoners upon release on an ongoing basis. We will continue to grow the number of employer partnerships we have in the future.
Results based contractsAs part of the government’s drive to deliver better public services, a consistent approach to government agencies contracting NGOs to deliver social services is being developed.
The overall aim is to reduce the compliance cost burden on NGOs, so greater effort and funding is directed to delivering front line services to the New Zealanders that need them.
The three year project entitled “Streamlined Contracting with NGOs” will equip government agencies and NGOs with skills and tools that will make working together more efficient and coordinated.
The new contracting framework increases the focus on outcomes. It makes sure agencies and NGOs are doing and measuring the things that make a difference, not just counting activity.
The results based contract terms and conditions are more balanced and fairer for NGOs than any other agreements that government agencies enter into with NGO providers.
How progress will be monitored
Strategic Intentions 2015-19 KPIs 2015/16 Target
The number of offenders that are referred to a reintegration intervention
4,000
All public prisons to be transitioned to the working prisons framework and achieving 100% prisoner engagement by 30 June 2017
16 by 2017
The total number of offenders that are referred to employment support services
Target to be set in 2015/16

STRATEGIC INTENTIONS 2015 – 201928
EQUAL EMPLOYMENT OPPORTUNITIES
Medium-term planDelivering on our stated outcomes to improve public safety and to achieve a 25% reduction in re-offending by 2017 requires us to ensure our staff can relate to and represent the communities we work with. As a consequence, we look to ensure our recruitment practices, including advertising, are targeted specifically at encouraging and selecting a gender-balanced and diverse workforce. In the medium term we will continue to monitor and report on our staffing profile and assess our selection practice in line with any significant changes to our offender population.
Leadership development is also critical to our future success and diversity in our leadership pool of talent is important. In future we will look for opportunities to target individual development for women, Mäori, and Pacific Peoples into senior positions.
For all our staff, Corrections offers significant career pathways and development opportunities, and our profile for women in particular at senior and middle management levels continues to track very well. Through our leadership and talent management programmes we are continually looking at ways in which we can expose our top talent to a wide variety of leadership models and development opportunities within the department, the Justice Sector and wider public sector.
Short-term planA refresh of our recruitment, learning and career pathways for our key frontline roles as part of the Frontline Futures project is a key focus for the next 12 months. All aspects of our HR processes and systems as they relate to attraction, development and retention for these frontline roles are being reviewed. Changes we are making are being well tested against a range of criteria, including with our cultural advisers and frontline managers and staff to ensure they meet and reflect our own needs, as well as those of the offenders and communities we serve.
DEPARTMENT OF CORRECTIONS 29
ANNUAL LEGISLATIVE REPORTING
The department is required to provide additional reporting at the end of each financial year under the Corrections Act 2004, the Parole Act 2002 and the Public Safety (Public Protection Orders) Act 2014.
Corrections will continue to release high-value public data on the offender population, prison statistics, and community sentences and orders statistics, in accordance with the Declaration on Open and Transparent Government.
Corrections Act 2004
Section 190(1)(a)Requires the Chief Executive to report on how he has carried out his functions under section 8(1)(k) and prison directors have carried out their functions under section 12(d), of ensuring that processes are established and maintained to identify communities significantly affected by policies and practices in the corrections system, and giving opportunities for those communities to give their views on those policies and practices, and ensuring those views are taken into account.
Section 190(1)(b)A report on the work undertaken by the Corrections Inspectorate, including statistical information about the disposition of complaints made by people under control or supervision and comment on issues arising from complaints or visits.
Section 190(1)(c)(d)(e)A report on the processes and systems in place to supervise and control the monitoring of prisoner phone calls, including statistics on the proportion of prisoner calls monitored (otherwise than merely by being recorded) and the number and percentage of calls disclosed under section 117(1) and (2):
> to any person other than an employee of the Chief Executive or a contractor
> to an employee of the Chief Executive or a contractor
> of those disclosed, the number of proceedings against a person for a disciplinary offence in which a recording of any of those calls was used in evidence.
Legislative authority for the department to monitor prisoners’ telephone calls is provided under section 113 of the Corrections Act 2004.
Section 190(1)(f)A report on measures to reduce drug and alcohol use by prisoners and the effectiveness of those measures, random-testing programmes and the results of those programmes.

STRATEGIC INTENTIONS 2015 – 201930
Section 190(1)(g)A report on the operation of every security contract in force for the whole, or any part, of the year to which the Annual Report relates, including:
> a summary of reports forwarded to the Chief Executive under section 171(2) or (3) and a summary of reports made to the Chief Executive under section 172(2)(b)
> a summary of actions taken in relation to the operation of security contracts as a result of matters raised in any report forwarded or made.
Section 190(1)(h)A report on the operation of every contract prison in operation in whole or in part in the year, including:
> a summary of reports forwarded to the Chief Executive under section 199D (1A), (2) and (3)
> a summary of reports made to the Chief Executive under section 199E(3)(b)
> a summary of actions taken in relation to the management of contract prisons as a result of matters raised in any report forwarded or made.
Parole Act 2002
Section 15A of the Parole Act 2002Section 15A(4) of the Parole Act 2002 requires the department to include in its annual report information about the use of Electronic Monitoring. The information required covers:
> the number of offenders who were at any time subject to an Electronic Monitoring condition
> the average number of offenders who were subject to an Electronic Monitoring condition and the average duration of the condition
> the percentage of offenders who, while subject to an Electronic Monitoring condition attached to an extended supervision order, were convicted for a breach of the condition, or convicted of any other offence
> a description of processes and systems relating to Electronic Monitoring that were in place during the year reported on.
DEPARTMENT OF CORRECTIONS 31
Public Safety (Public Protection Orders) Act 2014
Section 121 of the Public Safety (Public Protection Orders) Act 2014 (1) The department’s annual report under section 43 of the Public Finance Act 1989 must state in respect of the year to which the report relates:
> the number of persons who, at the end of that year, are detained, under this Act, in residences and state, for each person so detained, the number of months for which the person has been detained in a residence
> the number of persons who, at the end of that year, are detained, under this Act, in prisons and state, for each person so detained, the number of months for which the person has been detained in prison, and the reasons for that detention
> the number of persons who have been released on protective supervision
> the number of persons who were on protective supervision and who have again been detained under this Act
> the number of times that the Chief Executive applied to the court, ahead of time and pursuant to a direction of the review panel, for a review of a public protection order
> the number of appeals against orders made under this Act, and the outcome of each appeal
> the number and nature of any serious incidents involving residents or staff members of residences, or both
> the number and nature of any incidents involving the use of significant force or restraints on residents
> the number of times seclusion was imposed on residents, and the duration of, and reasons for, each episode of seclusion
> the number of times that residents were hospitalised
> the number of residents who died
> the number of emergencies in residences that required assistance from correction officers
> any other matter that the chief executive considers should be included in the annual report.
(2) The annual report referred to in subsection (1) must also include a report on the activities undertaken by inspectors during the year to which the annual report relates.

STRATEGIC INTENTIONS 2015 – 201932
DEPARTMENT OF CORRECTIONS 33
STATEMENT OF PERFORMANCE 2015/16
For the Year Ending 30 June 2016
As part of the Information Supporting the Estimates 2015/16 BUDGET 2015
STRATEGIC INTENTIONS 2015 – 201934
FINANCIAL SUMMARY
The following financial highlights for the Department of Corrections present a performance forecast for the year ending 30 June 2016.
In 2015/16 Corrections expects to earn total income of $1,273.796 million:
> $1,241.616 million in revenue from the Crown
> $32.180 million in revenue from other sources.
Corrections expects to incur $1,273.796 million of expenditure over its five output classes, as follows:
> a total of just under $814 million (63.89% of the Vote) for the provision of custodial services for offenders lawfully required to be detained in custody. This includes remand prisoners (people awaiting trial, and offenders convicted but not yet sentenced), those offenders sentenced to imprisonment, and any other offender required to be lawfully detained in custody
> a total of just over $212 million (16.68% of the Vote) for the management and delivery of sentences and orders served in the community, and electronic monitoring of people on bail
> a total of just over $192 million (15.10% of the Vote) for the provision of case management and interventions designed to address the underlying causes of criminal re-offending
> a total of just under $51 million (3.99% of the Vote) for the provision of information about offenders to victims of crime, the Judiciary and the New Zealand Parole Board, and the provision of administrative, financial and secretariat services to the New Zealand Parole Board
> a total of just over $3 million (0.26% of the Vote) for the provision of advice (including second opinion advice and contributions to policy advice led by other agencies) to support decision-making by Ministers on government policy matters, and
> a total of just over $1 million (0.08% of the Vote) for Department responses to ministerial correspondence and parliamentary questions.
DEPARTMENT OF CORRECTIONS 35
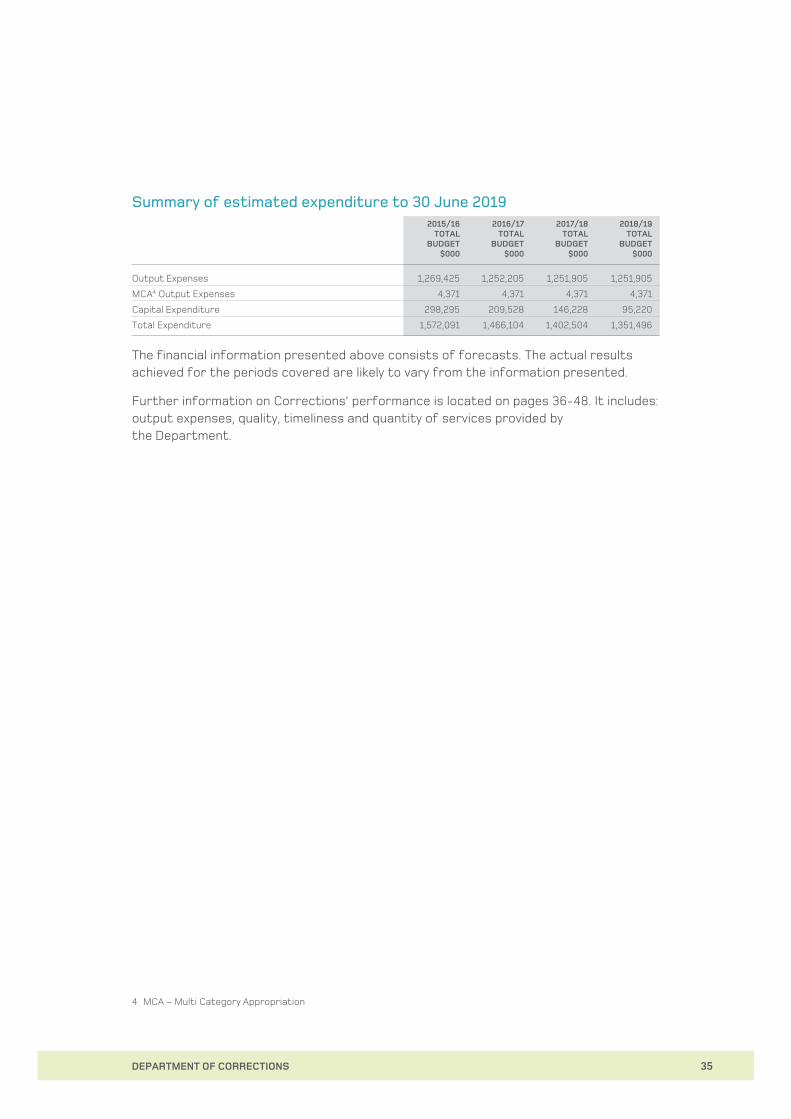
Summary of estimated expenditure to 30 June 20192015/16
TOTAL BUDGET
$000
2016/17 TOTAL
BUDGET $000
2017/18 TOTAL
BUDGET $000
2018/19 TOTAL
BUDGET $000
Output Expenses 1,269,425 1,252,205 1,251,905 1,251,905
MCA4 Output Expenses 4,371 4,371 4,371 4,371
Capital Expenditure 298,295 209,528 146,228 95,220
Total Expenditure 1,572,091 1,466,104 1,402,504 1,351,496
The financial information presented above consists of forecasts. The actual results achieved for the periods covered are likely to vary from the information presented.
Further information on Corrections’ performance is located on pages 36-48. It includes: output expenses, quality, timeliness and quantity of services provided by the Department.
4 MCA – Multi Category Appropriation
STRATEGIC INTENTIONS 2015 – 201936
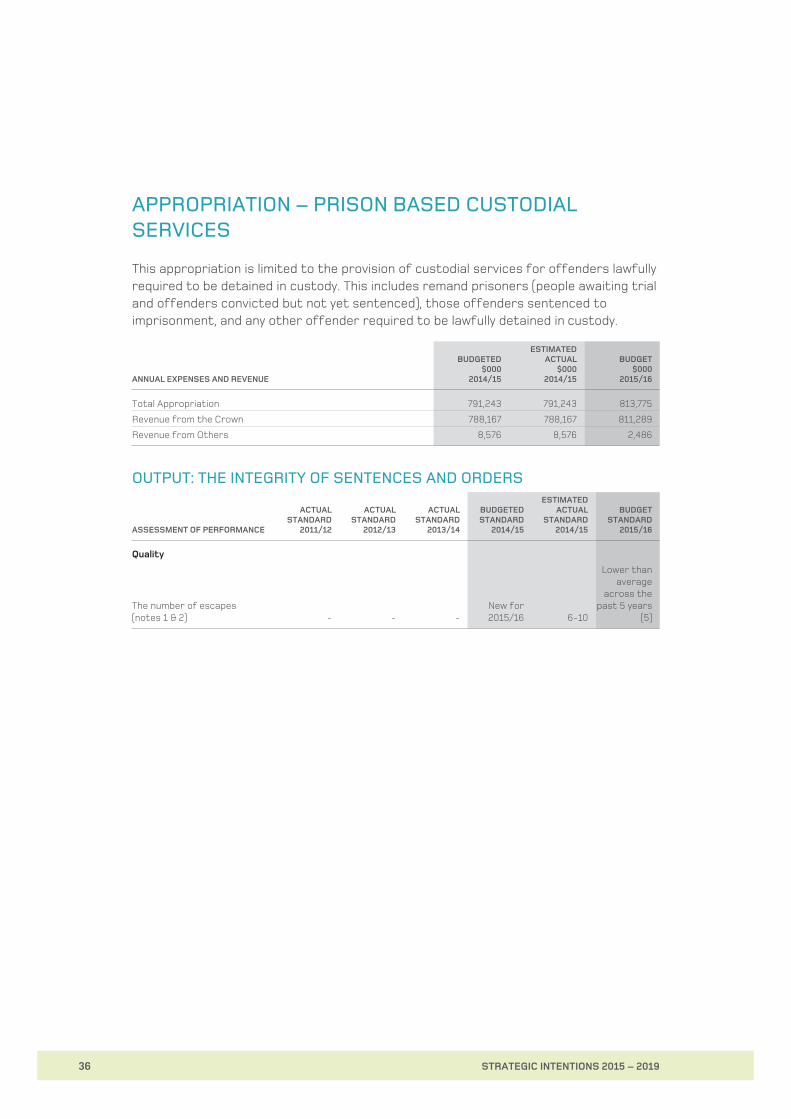
APPROPRIATION – PRISON BASED CUSTODIAL SERVICES
This appropriation is limited to the provision of custodial services for offenders lawfully required to be detained in custody. This includes remand prisoners (people awaiting trial and offenders convicted but not yet sentenced), those offenders sentenced to imprisonment, and any other offender required to be lawfully detained in custody.
ANNUAL EXPENSES AND REVENUE
BUDGETED $000
2014/15
ESTIMATED ACTUAL
$000 2014/15
BUDGET $000
2015/16
Total Appropriation 791,243 791,243 813,775
Revenue from the Crown 788,167 788,167 811,289
Revenue from Others 8,576 8,576 2,486
OUTPUT: THE INTEGRITY OF SENTENCES AND ORDERS
ASSESSMENT OF PERFORMANCE
ACTUAL STANDARD
2011/12
ACTUAL STANDARD
2012/13
ACTUAL STANDARD
2013/14
BUDGETED STANDARD
2014/15
ESTIMATED ACTUAL
STANDARD 2014/15
BUDGET STANDARD
2015/16
Quality
The number of escapes (notes 1 & 2) - - -
New for 2015/16 6-10
Lower than average
across the past 5 years
(5)
DEPARTMENT OF CORRECTIONS 37
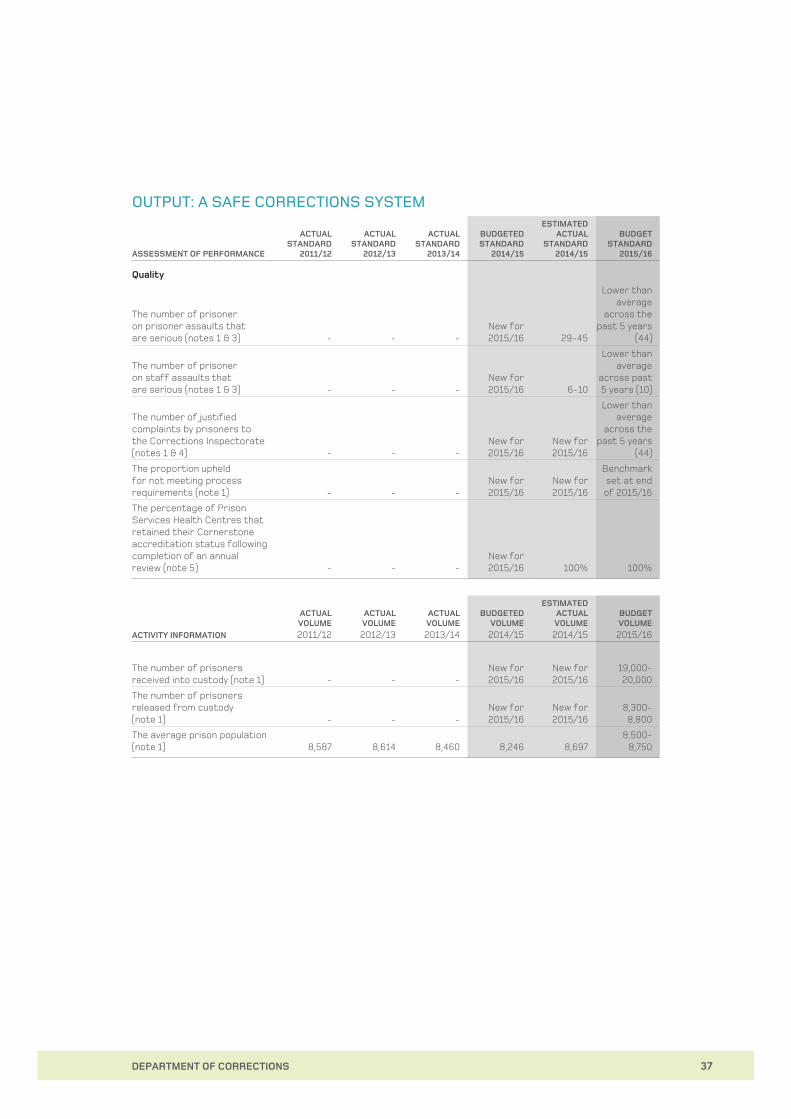
OUTPUT: A SAFE CORRECTIONS SYSTEM
ASSESSMENT OF PERFORMANCE
ACTUAL STANDARD
2011/12
ACTUAL STANDARD
2012/13
ACTUAL STANDARD
2013/14
BUDGETED STANDARD
2014/15
ESTIMATED ACTUAL
STANDARD 2014/15
BUDGET STANDARD
2015/16
Quality
The number of prisoner on prisoner assaults that are serious (notes 1 & 3) - - -
New for 2015/16 29-45
Lower than average
across the past 5 years
(44)
The number of prisoner on staff assaults that are serious (notes 1 & 3) - - -
New for 2015/16 6-10
Lower than average
across past 5 years (10)
The number of justified complaints by prisoners to the Corrections Inspectorate (notes 1 & 4) - - -
New for 2015/16
New for 2015/16
Lower than average
across the past 5 years
(44)
The proportion upheld for not meeting process requirements (note 1) - - -
New for 2015/16
New for 2015/16
Benchmark set at end of 2015/16
The percentage of Prison Services Health Centres that retained their Cornerstone accreditation status following completion of an annual review (note 5) - - -
New for 2015/16 100% 100%
ACTIVITY INFORMATION
ACTUAL VOLUME
2011/12
ACTUAL VOLUME
2012/13
ACTUAL VOLUME
2013/14
BUDGETED VOLUME
2014/15
ESTIMATED ACTUAL VOLUME
2014/15
BUDGET VOLUME
2015/16
The number of prisoners received into custody (note 1) - - -
New for 2015/16
New for 2015/16
19,000-20,000
The number of prisoners released from custody (note 1) - - -
New for 2015/16
New for 2015/16
8,300- 8,800
The average prison population (note 1) 8,587 8,614 8,460 8,246 8,697
8,500- 8,750

STRATEGIC INTENTIONS 2015 – 201938
APPROPRIATION – SENTENCES AND ORDERS SERVED IN THE COMMUNITY
This appropriation is limited to the management and delivery of sentences and orders served in the community, and electronic monitoring on bail.
ANNUAL EXPENSES AND REVENUE
BUDGETED $000
2014/15
ESTIMATED ACTUAL
$000 2014/15
BUDGET $000
2015/16
Total Appropriation 215,188 215,188 212,539
Revenue from Crown 215,151 215,151 212,539
Revenue from Other 37 37 -
OUTPUT: MANAGEMENT AND DELIVERY OF SENTENCES AND ORDERS IN THE COMMUNITY
ASSESSMENT OF PERFORMANCE
ACTUAL STANDARD
2011/12
ACTUAL STANDARD
2012/13
ACTUAL STANDARD
2013/14
BUDGETED STANDARD
2014/15
ESTIMATED ACTUAL
STANDARD 2014/15
BUDGET STANDARD
2015/16
Quality and Timeliness
Compliance with mandatory standards for home detention sentences (note 6)
New for 2012/13 96% 94% 98% 95% 98%
Compliance with mandatory standards for community-based sentences (note 6)
New for 2012/13 95% 93% 98% 95% 98%
Compliance with mandatory standards for post-release orders (note 6)
New for 2012/13 98% 96% 98% 98% 98%
ACTIVITY INFORMATION
ACTUAL VOLUME 2011/12
ACTUAL VOLUME 2012/13
ACTUAL VOLUME 2013/14
BUDGETED VOLUME 2014/15
ESTIMATED ACTUAL VOLUME 2014/15
BUDGET VOLUME 2015/16
The average number of home detention sentences being served 2,693 2,854 2,947 2,896 2,896 2,700-3,000
The total number of new home detention sentences commenced 3,363 3,527 3,340 3,552 3,424 3,300-3,500
The average number of community-based sentences being served 33,076 30,359 27,676 27,239 27,239
26,500-29,500
The total number of new community-based sentences commenced 58,726 54,561 49,018 49,786 47,642
47,000-49,000
The average number of post-release orders being served 5,968 5,917 5,899 5,916 5,916 5,400-5,700
The total number of new post-release orders commenced 6,140 5,999 5,779 5,714 5,954 5,700-6,000
DEPARTMENT OF CORRECTIONS 39
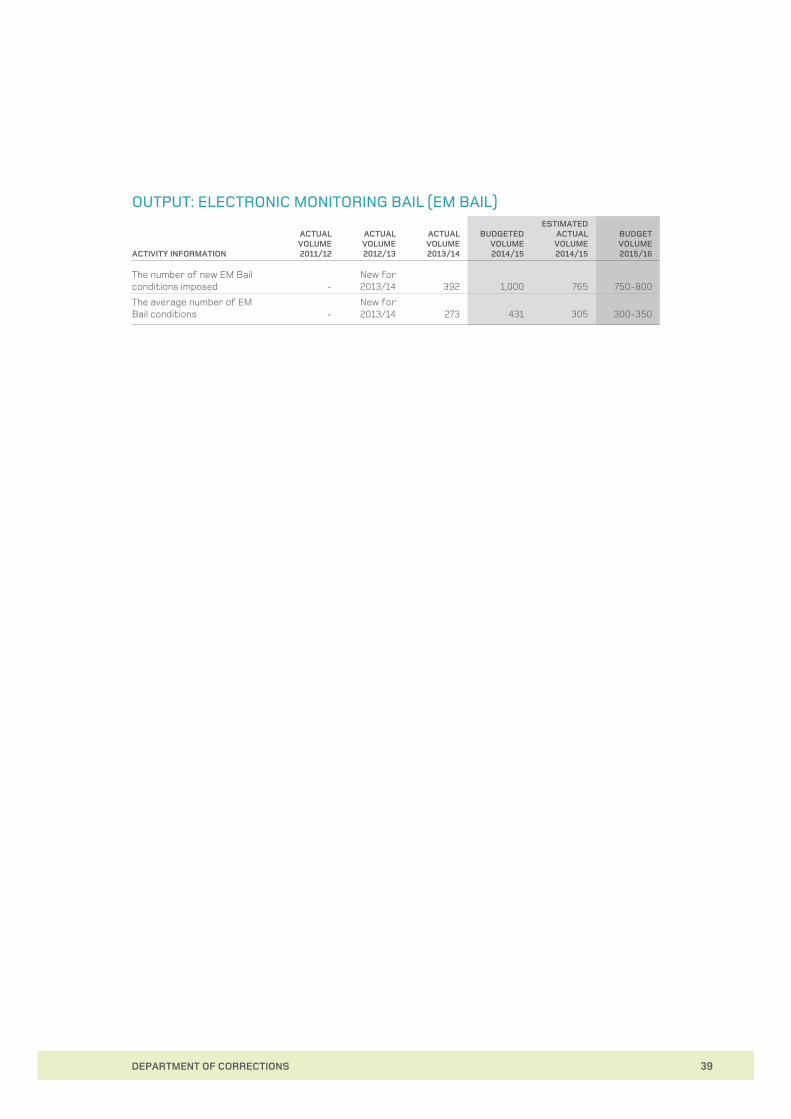
OUTPUT: ELECTRONIC MONITORING BAIL (EM BAIL)
ACTIVITY INFORMATION
ACTUAL VOLUME 2011/12
ACTUAL VOLUME 2012/13
ACTUAL VOLUME 2013/14
BUDGETED VOLUME 2014/15
ESTIMATED ACTUAL VOLUME 2014/15
BUDGET VOLUME 2015/16
The number of new EM Bail conditions imposed -
New for 2013/14 392 1,000 765 750-800
The average number of EM Bail conditions -
New for 2013/14 273 431 305 300-350

STRATEGIC INTENTIONS 2015 – 201940
APPROPRIATION – REHABILITATION AND REINTEGRATION
This appropriation is limited to the provision of case management and interventions designed to address the underlying causes of criminal re-offending.
ANNUAL EXPENSES AND REVENUE
BUDGETED $000
2014/15
ESTIMATED ACTUAL
$000 2014/15
BUDGET $000
2015/16
Total Appropriation 169,594 169,594 192,343
Revenue from Crown 134,770 134,770 162,649
Revenue from Other 34,824 34,824 29,694
OUTPUT: CASE MANAGEMENT
ASSESSMENT OF PERFORMANCE
ACTUAL STANDARD
2011/12
ACTUAL STANDARD
2012/13
ACTUAL STANDARD
2013/14
BUDGETED STANDARD
2014/15
ESTIMATED ACTUAL
STANDARD 2014/15
BUDGET STANDARD
2015/16
Quality and Timeliness
The percentage of prisoners entitled to receive an offender plan that received one (note 1 & 7) 96% 98% 99% 95% 95% 95%
The proportion of prisoners entitled to receive an offender plan that received one within Practice framework timelines (note 1) - - -
New for 2015/16 75% 85%

DEPARTMENT OF CORRECTIONS 41
OUTPUT: REHABILITATION AND REINTEGRATION
ASSESSMENT OF PERFORMANCE
ACTUAL STANDARD
2011/12
ACTUAL STANDARD
2012/13
ACTUAL STANDARD
2013/14
BUDGETED STANDARD
2014/15
ESTIMATED ACTUAL
STANDARD 2014/15
BUDGET STANDARD
2015/16
Quality
The percentage of offenders who start and complete a rehabilitation programme:
> PrisonersNew for 2012/13 86% 85% 75% 85% 85%
> Community-based offenders
New for 2012/13 63% 63% 65% 62% 65%
Quantity
The total number of qualifications achieved by prisoners while in prison (note 8) 3,145 3,160 3,858 3,505 3,860 4,240
The average number of hours engaged in industry and learning activities per prisoner - - -
New for 2015/16 32
Benchmark set at end of 2015/16
The number of prisoners who start reintegration services (note 9) - - -
New for 2015/16
New for 2015/16 4,300
ACTIVITY INFORMATION
ACTUAL VOLUME 2011/12
ACTUAL VOLUME 2012/13
ACTUAL VOLUME 2013/14
BUDGETED VOLUME 2014/15
ESTIMATED ACTUAL VOLUME 2014/15
BUDGET VOLUME 2015/16
The number of offenders who have completed a rehabilitation programme:
> Prisoners - - -New for 2015/16 5,549 5,549
> Community-based offenders - - -
New for 2015/16 3,039 3,134

STRATEGIC INTENTIONS 2015 – 201942
APPROPRIATION – INFORMATION AND ADMINISTRATIVE SERVICES TO THE JUDICIARY AND NEW ZEALAND PAROLE BOARD
This appropriation is limited to the provision of information about offenders to victims of crime, the Judiciary and the New Zealand Parole Board, and the provision of administrative, financial and secretariat services to the New Zealand Parole Board.
ANNUAL EXPENSES AND REVENUE
BUDGETED $000
2014/15
ESTIMATED ACTUAL
$000 2014/15
BUDGET $000
2015/16
Total Appropriation 51,698 51,698 50,768
Revenue from Crown 51,687 51,687 50,768
Revenue from Other 11 11 -
OUTPUT: INFORMATION SERVICES TO THE JUDICIARY
ASSESSMENT OF PERFORMANCE
ACTUAL STANDARD
2011/12
ACTUAL STANDARD
2012/13
ACTUAL STANDARD
2013/14
BUDGETED STANDARD
2014/15
ESTIMATED ACTUAL
STANDARD 2014/15
BUDGET STANDARD
2015/16
Timeliness
The percentage of reports provided to court within agreed timeframes before sentencing: (note 10)
> Probation reports 95% 94% 94% 95% 95% 95%
> Psychological reports 98% 84% 94% 95% 89% 95%
ACTIVITY INFORMATION
ACTUAL VOLUME 2011/12
ACTUAL VOLUME 2012/13
ACTUAL VOLUME 2013/14
BUDGETED VOLUME 2014/15
ESTIMATED ACTUAL VOLUME 2014/15
BUDGET VOLUME 2015/16
The number of court attendance hours 102,159 97,561 106,740 99,227 100,348
99,000-101,000
The number of Electronic Monitoring Bail (EM Bail) applications submitted to court -
New for 2013/14 1,319 2,500 2,522 2,500
DEPARTMENT OF CORRECTIONS 43
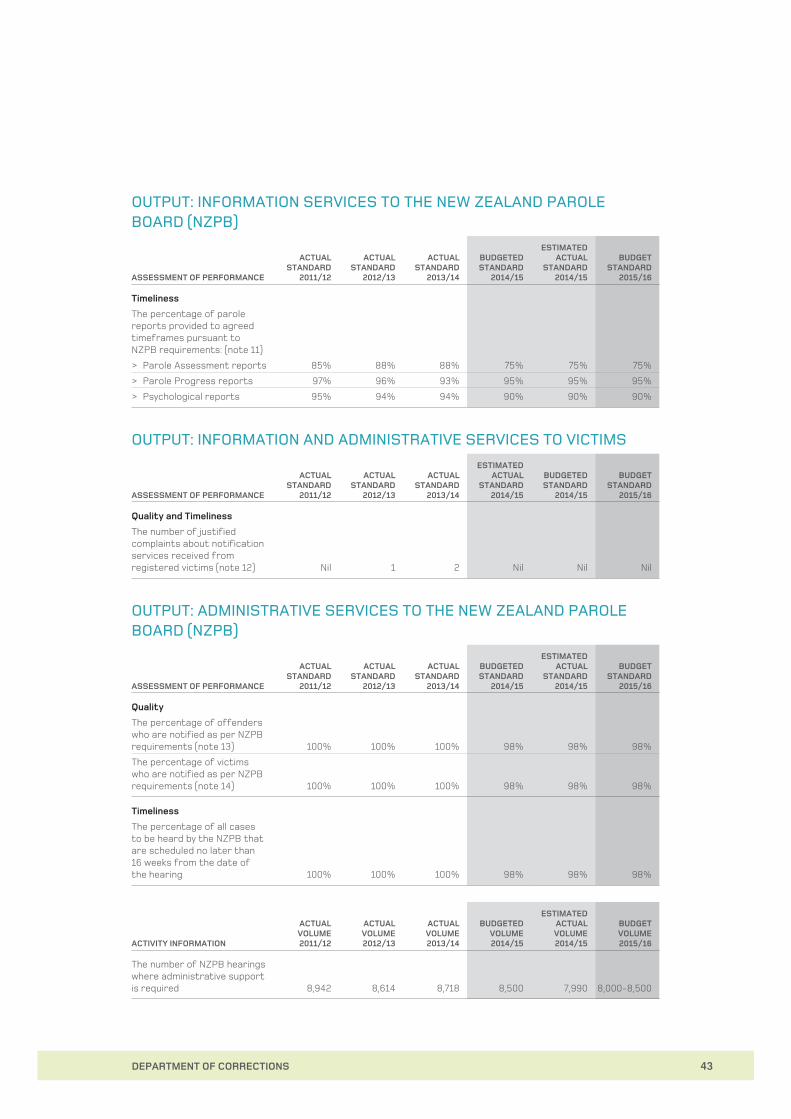
OUTPUT: INFORMATION SERVICES TO THE NEW ZEALAND PAROLE BOARD (NZPB)
ASSESSMENT OF PERFORMANCE
ACTUAL STANDARD
2011/12
ACTUAL STANDARD
2012/13
ACTUAL STANDARD
2013/14
BUDGETED STANDARD
2014/15
ESTIMATED ACTUAL
STANDARD 2014/15
BUDGET STANDARD
2015/16
Timeliness
The percentage of parole reports provided to agreed timeframes pursuant to NZPB requirements: (note 11)
> Parole Assessment reports 85% 88% 88% 75% 75% 75%
> Parole Progress reports 97% 96% 93% 95% 95% 95%
> Psychological reports 95% 94% 94% 90% 90% 90%
OUTPUT: INFORMATION AND ADMINISTRATIVE SERVICES TO VICTIMS
ASSESSMENT OF PERFORMANCE
ACTUAL STANDARD
2011/12
ACTUAL STANDARD
2012/13
ACTUAL STANDARD
2013/14
ESTIMATED ACTUAL
STANDARD 2014/15
BUDGETED STANDARD
2014/15
BUDGET STANDARD
2015/16
Quality and Timeliness
The number of justified complaints about notification services received from registered victims (note 12) Nil 1 2 Nil Nil Nil
OUTPUT: ADMINISTRATIVE SERVICES TO THE NEW ZEALAND PAROLE BOARD (NZPB)
ASSESSMENT OF PERFORMANCE
ACTUAL STANDARD
2011/12
ACTUAL STANDARD
2012/13
ACTUAL STANDARD
2013/14
BUDGETED STANDARD
2014/15
ESTIMATED ACTUAL
STANDARD 2014/15
BUDGET STANDARD
2015/16
Quality
The percentage of offenders who are notified as per NZPB requirements (note 13) 100% 100% 100% 98% 98% 98%
The percentage of victims who are notified as per NZPB requirements (note 14) 100% 100% 100% 98% 98% 98%
Timeliness
The percentage of all cases to be heard by the NZPB that are scheduled no later than 16 weeks from the date of the hearing 100% 100% 100% 98% 98% 98%
ACTIVITY INFORMATION
ACTUAL VOLUME 2011/12
ACTUAL VOLUME 2012/13
ACTUAL VOLUME 2013/14
BUDGETED VOLUME 2014/15
ESTIMATED ACTUAL VOLUME 2014/15
BUDGET VOLUME 2015/16
The number of NZPB hearings where administrative support is required 8,942 8,614 8,718 8,500 7,990 8,000-8,500
STRATEGIC INTENTIONS 2015 – 201944
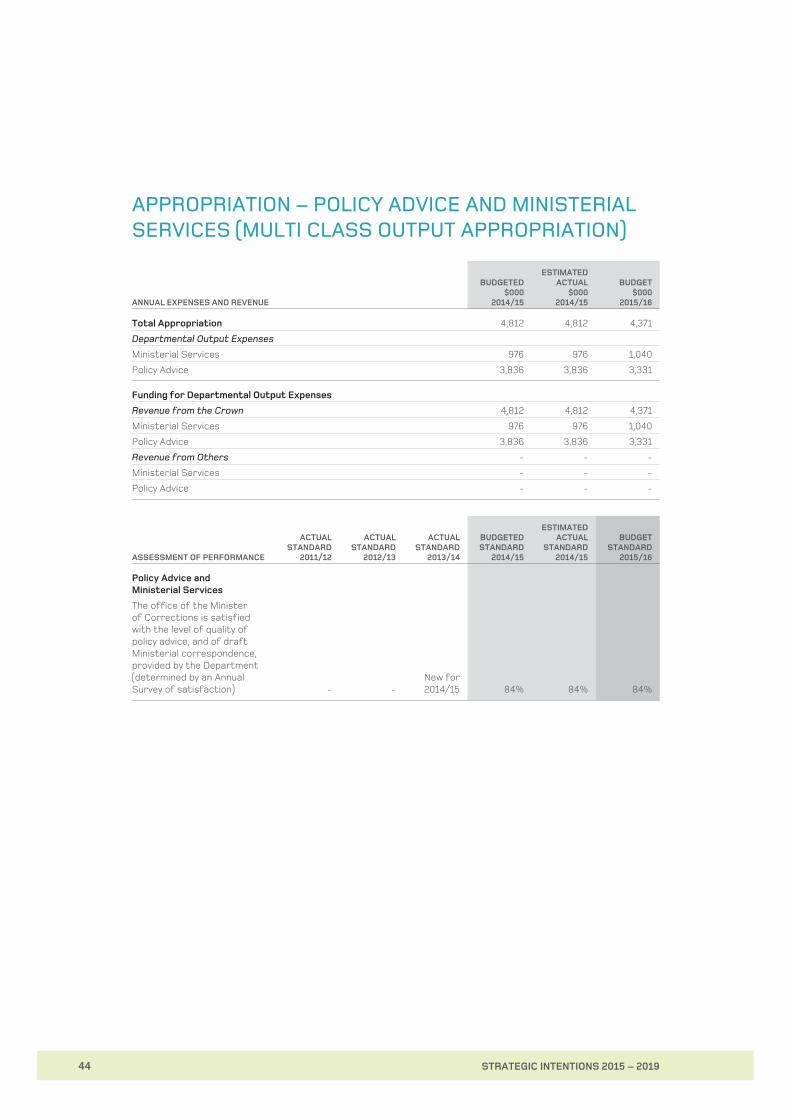
APPROPRIATION – POLICY ADVICE AND MINISTERIAL SERVICES (MULTI CLASS OUTPUT APPROPRIATION)
ANNUAL EXPENSES AND REVENUE
BUDGETED $000
2014/15
ESTIMATED ACTUAL
$000 2014/15
BUDGET $000
2015/16
Total Appropriation 4,812 4,812 4,371
Departmental Output Expenses
Ministerial Services 976 976 1,040
Policy Advice 3,836 3,836 3,331
Funding for Departmental Output Expenses
Revenue from the Crown 4,812 4,812 4,371
Ministerial Services 976 976 1,040
Policy Advice 3,836 3,836 3,331
Revenue from Others - - -
Ministerial Services - - -
Policy Advice - - -
ASSESSMENT OF PERFORMANCE
ACTUAL STANDARD
2011/12
ACTUAL STANDARD
2012/13
ACTUAL STANDARD
2013/14
BUDGETED STANDARD
2014/15
ESTIMATED ACTUAL
STANDARD 2014/15
BUDGET STANDARD
2015/16
Policy Advice and Ministerial Services
The office of the Minister of Corrections is satisfied with the level of quality of policy advice, and of draft Ministerial correspondence, provided by the Department (determined by an Annual Survey of satisfaction) - -
New for 2014/15 84% 84% 84%
DEPARTMENT OF CORRECTIONS 45
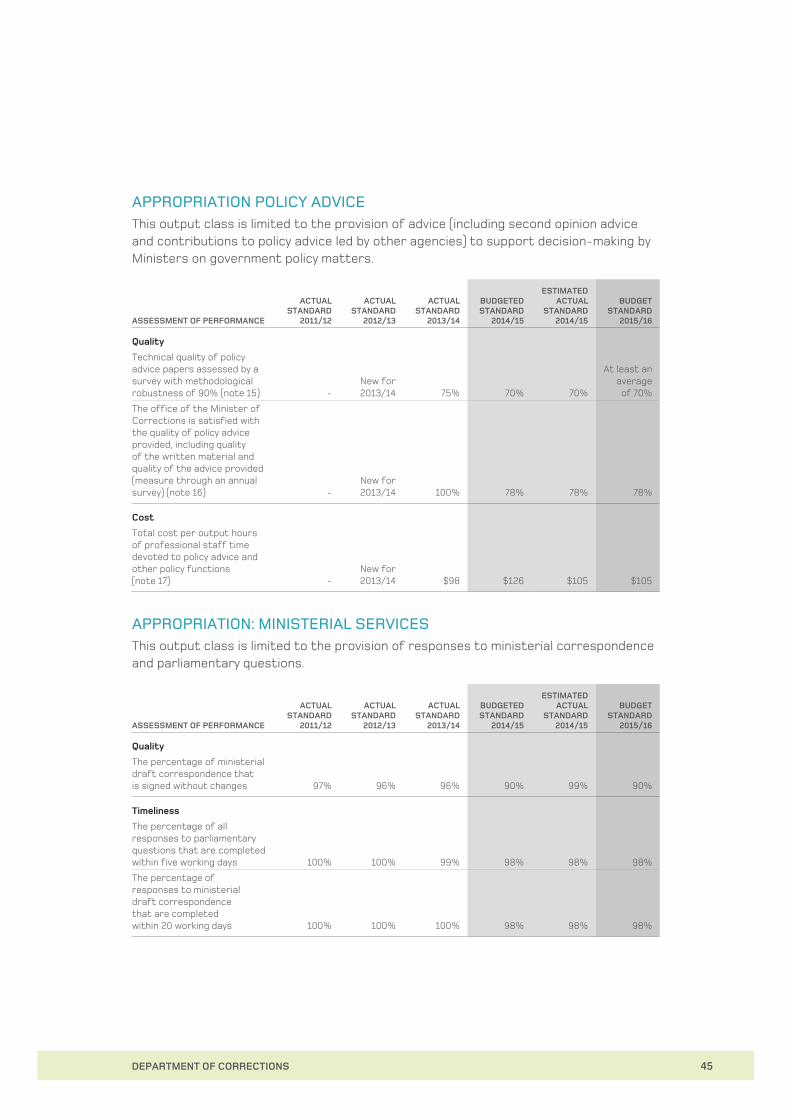
APPROPRIATION POLICY ADVICEThis output class is limited to the provision of advice (including second opinion advice and contributions to policy advice led by other agencies) to support decision-making by Ministers on government policy matters.
ASSESSMENT OF PERFORMANCE
ACTUAL STANDARD
2011/12
ACTUAL STANDARD
2012/13
ACTUAL STANDARD
2013/14
BUDGETED STANDARD
2014/15
ESTIMATED ACTUAL
STANDARD 2014/15
BUDGET STANDARD
2015/16
Quality
Technical quality of policy advice papers assessed by a survey with methodological robustness of 90% (note 15) -
New for 2013/14 75% 70% 70%
At least an average of 70%
The office of the Minister of Corrections is satisfied with the quality of policy advice provided, including quality of the written material and quality of the advice provided (measure through an annual survey) (note 16) -
New for 2013/14 100% 78% 78% 78%
Cost
Total cost per output hours of professional staff time devoted to policy advice and other policy functions (note 17) -
New for 2013/14 $98 $126 $105 $105
APPROPRIATION: MINISTERIAL SERVICESThis output class is limited to the provision of responses to ministerial correspondence and parliamentary questions.
ASSESSMENT OF PERFORMANCE
ACTUAL STANDARD
2011/12
ACTUAL STANDARD
2012/13
ACTUAL STANDARD
2013/14
BUDGETED STANDARD
2014/15
ESTIMATED ACTUAL
STANDARD 2014/15
BUDGET STANDARD
2015/16
Quality
The percentage of ministerial draft correspondence that is signed without changes 97% 96% 96% 90% 99% 90%
Timeliness
The percentage of all responses to parliamentary questions that are completed within five working days 100% 100% 99% 98% 98% 98%
The percentage of responses to ministerial draft correspondence that are completed within 20 working days 100% 100% 100% 98% 98% 98%

STRATEGIC INTENTIONS 2015 – 201946
NOTES TO PERFORMANCE MEASURES
NOTE # REFERENCE / PERFORMANCE MEASURE DEFINITION
1 Performance measure includes both the Department and private prisons
The aggregated standard (budget and actual) includes performance results for the Department and privately managed prisons (MECF and ASCF).
2 The number of escapes ‘Escape’ refers to any incident when a prisoner has become free of custodial control. Escapes are categorised irrespective of whether external charges are laid against the prisoner for escaping custody. The Department has four categories of escape:
> Breakout – prisoner breaches the area contained by the outermost perimeter security fence or if there is no such fence, from the prison building. Examples include going over, under, through or around security barriers; forced exit from facilities.
> From escort – prisoner escapes from escort, while under supervision, including escorted outings and court escorts either by prisons, Serco or another contractor.
> Absconding – prisoner physically leaves the designated area and is away from direct custodial control (including walking away from work parties).
> Breach of temporary release – prisoner is found to have breached a condition of their temporary release which results in either an internal or external charge of escaping (includes failing to return within reasonable time without reasonable reason).
3 The number of prisoner on prisoner/staff assaults that are serious
A ‘serious assault’ is defined as an act of physical violence that involves one or more of the following:
> Sexual assault of any form and degree.
> Bodily harm requiring medical intervention by medical staff followed by overnight hospitalisation in a medical facility.
> Bodily harm requiring extended periods of ongoing medical intervention.
4 Justified complaints Justified complaints received by the Inspectorate are about the treatment of prison-based offenders, where the complaint has required the Inspector’s intervention in order to bring about a resolution.
5 The percentage of Prison Services Health Centres that retained their Cornerstone® accreditation status following completion of an annual review
To demonstrate that the level of care in prison meet the standards of care that are available in the community, all heath centres are required to be accredited under the Cornerstone® process. The accreditation process demonstrates that prison heath centres meet the Royal New Zealand College of General Practitioners’ (NZCGP) Aiming for Excellence Standards for New Zealand general practice.
In order to retain their accreditation each health centre undertakes an internal review annually and updates the NZCGP on completion.
6 Compliance with mandatory standards Mandatory standards set the bottom line and the starting point for the level of service to be delivered by probation officers. Probation’s purpose is to contribute to safer communities by holding offenders to account and managing them to: comply with their sentences and orders, reduce their likelihood of re-offending, and minimise their risk of harm to others. Each mandatory standard links to at least one of the three elements of probation’s purpose providing a rationale for that standard. A set of definitions is provided to probation officers to ensure consistency of understanding and application.
Mandatory standards are part of the Department’s drive to improve performance across all sentences and orders served in the community. They are designed to ensure probation officers are doing the basics correctly and effectively, and enable them to focus their time on making supported decision about how to reduce the risk of re-offending and how to minimise the risk of harm to others posed by medium and high risk offenders.

DEPARTMENT OF CORRECTIONS 47
NOTE # REFERENCE / PERFORMANCE MEASURE DEFINITION
7 The percentage of prisoners entitled to receive an offender plan that received one
Corrections Act 2004 – Section 51 Management Plans
This section applied to every prisoner who is:
a) Sentenced to imprisonment for a term of more than two months, or
b) In custody for a continuous period of more than two months on remand.
8 The total number of qualifications achieved by prisoners while in prison
Includes:
> New Zealand Qualifications Framework (NZQF) National Certificates and other NZQF certificates levels 2, 3 or above as a completed qualification
> Limited Credit Programmes and Modularised Training Programmes
> Trade Tickets (industry specific license to practice e.g., welding)
> Vocational driver’s licenses
> Health and Safety qualification accredited by Industry Training Organizations (ITOs), e.g., First Aid, Grow Safe and Site Safe
> NCEA qualifications completed while in prison.
Excludes:
> The literacy and numeracy programmes currently done in prison (both by OE embedded within other qualifications and through the Foundation Skills programmes) as they support offenders to undertake more complex training and education, rather than providing a qualification
> NCEA qualifications which prisoners were awarded before entering the prison system.
9 The number of prisoners who start reintegration services
Reintegration services build upon the rehabilitation programme provide within New Zealand’s prisons, enabling and supporting the offender’s transition into the community, or to assist offenders serving sentences in the community to fulfil the conditions of their sentence or order.
Reintegration services are demand driven and can be accessed by offenders while in custody (remand and sentenced) and post release. The timing of reintegration is based on the offender’s needs and supports other interventions.
The Department contracts reintegration providers to assist offenders with accommodation, employment or training, financial management, managing relationships and connecting with family/whanau, community support, victim related issues and healthcare.
10 The percentage of reports provided to court within agreed timeframes before sentencing
Probation reports are completed to timeframes as set out in the Integrated Practice Framework. Specific timeframes are provided in respect of each of the individual report types that are included under the heading of ‘probation’ reports.
Psychological reports are provided to court at least two working days before sentencing where a request is received.
11 The percentage of reports provided to agreed timeframes pursuant to NZPB requirements
Parole assessment reports are provided to the NZPB at least 15 working days prior to the hearing date.
Parole progress reports are provided to the NZPB at least 10 working days prior to the hearing date.
Psychological reports are prepared for the NZPB at least five weeks prior to the hearing date.
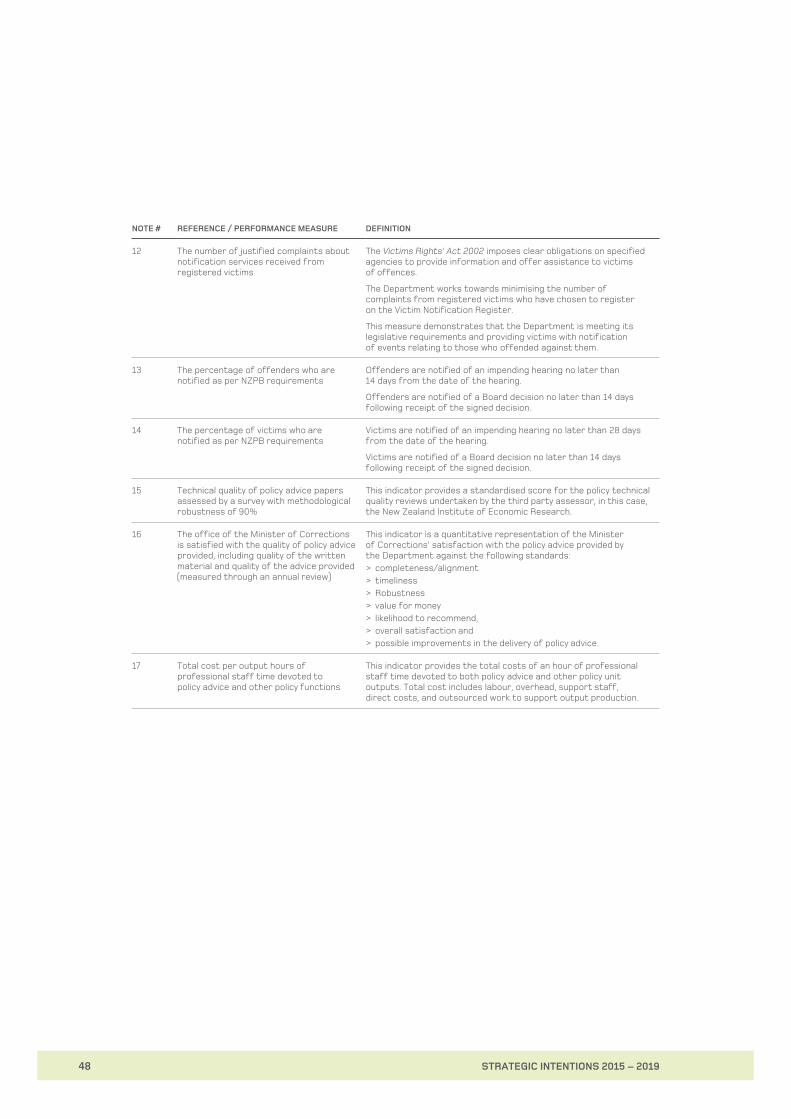
STRATEGIC INTENTIONS 2015 – 201948
NOTE # REFERENCE / PERFORMANCE MEASURE DEFINITION
12 The number of justified complaints about notification services received from registered victims
The Victims Rights’ Act 2002 imposes clear obligations on specified agencies to provide information and offer assistance to victims of offences.
The Department works towards minimising the number of complaints from registered victims who have chosen to register on the Victim Notification Register.
This measure demonstrates that the Department is meeting its legislative requirements and providing victims with notification of events relating to those who offended against them.
13 The percentage of offenders who are notified as per NZPB requirements
Offenders are notified of an impending hearing no later than 14 days from the date of the hearing.
Offenders are notified of a Board decision no later than 14 days following receipt of the signed decision.
14 The percentage of victims who are notified as per NZPB requirements
Victims are notified of an impending hearing no later than 28 days from the date of the hearing.
Victims are notified of a Board decision no later than 14 days following receipt of the signed decision.
15 Technical quality of policy advice papers assessed by a survey with methodological robustness of 90%
This indicator provides a standardised score for the policy technical quality reviews undertaken by the third party assessor, in this case, the New Zealand Institute of Economic Research.
16 The office of the Minister of Corrections is satisfied with the quality of policy advice provided, including quality of the written material and quality of the advice provided (measured through an annual review)
This indicator is a quantitative representation of the Minister of Corrections’ satisfaction with the policy advice provided by the Department against the following standards:
> completeness/alignment
> timeliness
> Robustness
> value for money
> likelihood to recommend,
> overall satisfaction and
> possible improvements in the delivery of policy advice.
17 Total cost per output hours of professional staff time devoted to policy advice and other policy functions
This indicator provides the total costs of an hour of professional staff time devoted to both policy advice and other policy unit outputs. Total cost includes labour, overhead, support staff, direct costs, and outsourced work to support output production.

DEPARTMENT OF CORRECTIONS 49

STRATEGIC INTENTIONS 2015 – 201950
APPENDIX A – OUTCOME AND INTERMEDIATE OUTCOME MEASURE PERFORMANCE AND BASELINE COMPARISON
OUTCOME: RE-OFFENDING IS REDUCED
Intermediate Outcomes
How this will be achieved
Key Performance Indicator
Actual StandardEstimated Actual
StandardBudget Standard
2011/12 2012/13 2013/14 2014/15 2015/16
Offenders’ capability to lead law abiding lives is improved
Individual offender rehabilitation needs are identified and met
The proportion of prisoners with an identified need who have a programme placement – – – New measure for 2015/16 To be set in 2015/16
The proportion of prisoners who demonstrate statistically significant gains through intensive literacy and numeracy provision
– – – New measure for 2015/16 ≥30%
The total number of qualifications achieved by prisoners while in prison 2,650 3,089 3,505 3,860 ≥4,240
There is a reduction in rates of re-offending – 5.9% 10.6% 8.6% 25% by 2017
Offenders’ ability to integrate into the community is improved
Reintegration initiatives ensure sustainability of rehabilitation interventions
The number of offenders that are referred to an reintegration intervention – – – New measure for 2015/16 4,000
All public prisons to be transitioned to the working prisons framework and achieving 100% prisoner engagement by 30 June 2017
– – – New measure for 2015/16 16 by 2017
The total number of offenders that are referred to employment support services – – – New measure for 2015/16 To be set in 2015/16
OUTCOME: PUBLIC SAFETY IS IMPROVED
Intermediate Outcomes
How this will be achieved
Key Performance Indicator
Actual StandardEstimated Actual
StandardBudget Standard
2011/12 2012/13 2013/14 2014/15 2015/16
Harm levels of re-offending are reduced
Offenders are held to account
There is a reduction in the seriousness of re-offending
Released prisoners – 318 Released prisoners – 349 Released prisoners – 337
– Lower than 2014/15Community-sentenced offenders – 150
Community-sentenced offenders – 162
Community-sentenced offenders – 162
The proportion of community-based offenders complying with their sentence or order – – – New measure for 2015/16 97%
The proportion of community-based offenders being held to account for non-compliance – – – New measure for 2015/16 To be set in 2015/16
A reduction in the rate of offenders who started a community sentence or order then committed a new against-the-person offence during the following period of management
Home Detention – 2.8% Home Detention – 2.7% Home Detention – 2.6%
– Fewer than 2014/15
Intensive Supervision – 14.2% Intensive Supervision – 12.1% Intensive Supervision – 12.6%
Parole – 8.3% Parole – 8.9% Parole – 7.3%
Post Detention Conditions – 4.3%
Post Detention Conditions – 4.0%
Post Detention Conditions – 4.5%
Released on Conditions – 17.5%
Released on Conditions – 17.6%
Released on Conditions – 18.0%
Supervision – 7.9% Supervision – 7.5% Supervision – 7.7%
The integrity of sentences and orders is improved
Community sentences address safety and rehabilitation needs
The proportion of community-based offenders with an identified need who have a programme placement
– – – New measure for 2015/16 To be set in 2015/16
The proportion of offenders on Electronic Monitoring who are reconvicted of a new offence whilst under EM conditions
– – – New measure for 2015/16 Fewer than 2014/15
Re-offending while on a sentence or order and within the 12 month follow up period resulting in a reconviction
Home Detention – 9.2% Home Detention – 8.5% Home Detention – 8.7%
– Less than 2014/15
Intensive Supervision – 35.9% Intensive Supervision – 32.8% Intensive Supervision – 34.6%
Parole – 22.4% Parole – 23.0% Parole – 21.1%
Post Detention Conditions – 15.6%
Post Detention Conditions – 15.7%
Post Detention Conditions – 15.6%
Released on Conditions – 44.1%
Released on Conditions – 44.7%
Released on Conditions – 43.7%
Supervision – 22.0% Supervision – 20.5% Supervision – 20.8%
A reduction in the rate of offenders who started home detention or parole and then committed a new offence during the following period of management, compared to the previous year
Home Detention – 9.2% Home Detention – 8.5% Home Detention – 8.7%Less than 2014/15
Parole – 22.4% Parole – 23.0% Parole – 21.1% –
A safe and secure Corrections system is assured
Custodial environments are safe and humane
The number of breakout escapes 3 0 0 0 0
The percent of self-harm threat to life interventions where an unnatural death did not occur – – – New measure for 2015/16 To be set in 2015/16
The proportion of general random drug tests that have a positive result 4.3% 4.3% 6.2% 4.0% ≤5%
The number of unnatural deaths 5 3 3 8 0
The proportion of complaints by prisoners to the Corrections Inspectorate upheld for reasons of materiality
– – – New measure for 2015/16 To be set in 2015/16
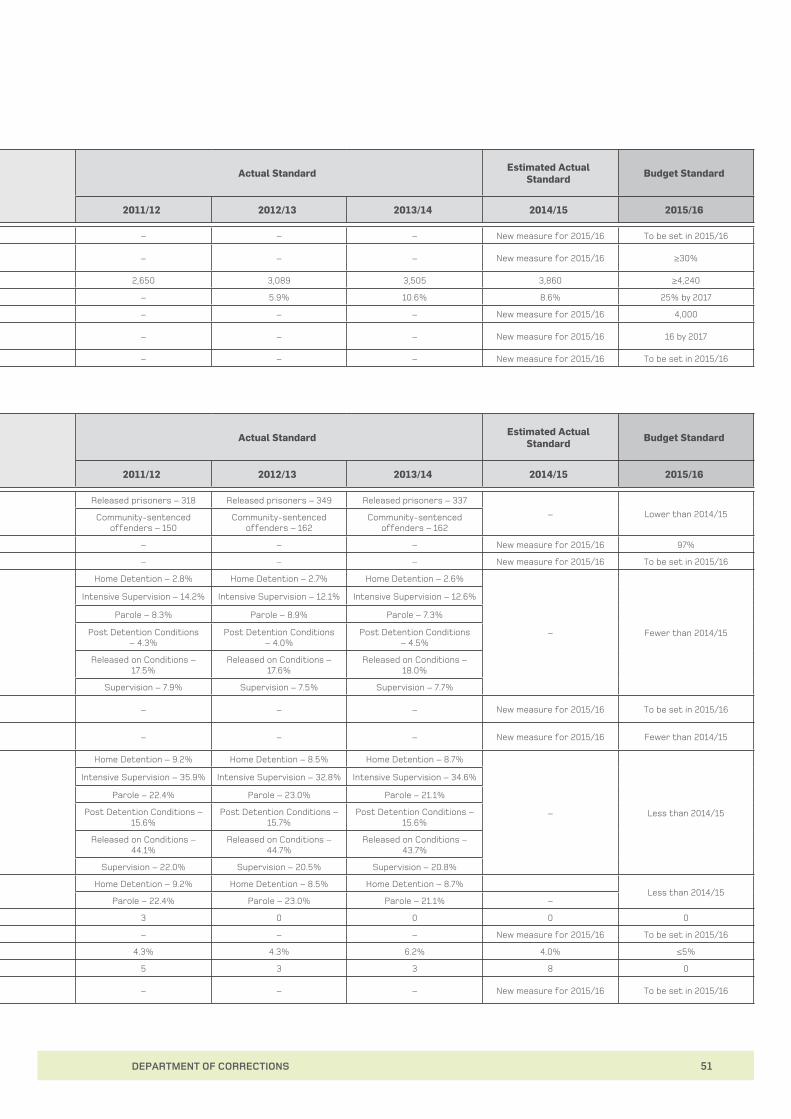
DEPARTMENT OF CORRECTIONS 51
APPENDIX A – OUTCOME AND INTERMEDIATE OUTCOME MEASURE PERFORMANCE AND BASELINE COMPARISON
OUTCOME: RE-OFFENDING IS REDUCED
Intermediate Outcomes
How this will be achieved
Key Performance Indicator
Actual StandardEstimated Actual
StandardBudget Standard
2011/12 2012/13 2013/14 2014/15 2015/16
Offenders’ capability to lead law abiding lives is improved
Individual offender rehabilitation needs are identified and met
The proportion of prisoners with an identified need who have a programme placement – – – New measure for 2015/16 To be set in 2015/16
The proportion of prisoners who demonstrate statistically significant gains through intensive literacy and numeracy provision
– – – New measure for 2015/16 ≥30%
The total number of qualifications achieved by prisoners while in prison 2,650 3,089 3,505 3,860 ≥4,240
There is a reduction in rates of re-offending – 5.9% 10.6% 8.6% 25% by 2017
Offenders’ ability to integrate into the community is improved
Reintegration initiatives ensure sustainability of rehabilitation interventions
The number of offenders that are referred to an reintegration intervention – – – New measure for 2015/16 4,000
All public prisons to be transitioned to the working prisons framework and achieving 100% prisoner engagement by 30 June 2017
– – – New measure for 2015/16 16 by 2017
The total number of offenders that are referred to employment support services – – – New measure for 2015/16 To be set in 2015/16
OUTCOME: PUBLIC SAFETY IS IMPROVED
Intermediate Outcomes
How this will be achieved
Key Performance Indicator
Actual StandardEstimated Actual
StandardBudget Standard
2011/12 2012/13 2013/14 2014/15 2015/16
Harm levels of re-offending are reduced
Offenders are held to account
There is a reduction in the seriousness of re-offending
Released prisoners – 318 Released prisoners – 349 Released prisoners – 337
– Lower than 2014/15Community-sentenced offenders – 150
Community-sentenced offenders – 162
Community-sentenced offenders – 162
The proportion of community-based offenders complying with their sentence or order – – – New measure for 2015/16 97%
The proportion of community-based offenders being held to account for non-compliance – – – New measure for 2015/16 To be set in 2015/16
A reduction in the rate of offenders who started a community sentence or order then committed a new against-the-person offence during the following period of management
Home Detention – 2.8% Home Detention – 2.7% Home Detention – 2.6%
– Fewer than 2014/15
Intensive Supervision – 14.2% Intensive Supervision – 12.1% Intensive Supervision – 12.6%
Parole – 8.3% Parole – 8.9% Parole – 7.3%
Post Detention Conditions – 4.3%
Post Detention Conditions – 4.0%
Post Detention Conditions – 4.5%
Released on Conditions – 17.5%
Released on Conditions – 17.6%
Released on Conditions – 18.0%
Supervision – 7.9% Supervision – 7.5% Supervision – 7.7%
The integrity of sentences and orders is improved
Community sentences address safety and rehabilitation needs
The proportion of community-based offenders with an identified need who have a programme placement
– – – New measure for 2015/16 To be set in 2015/16
The proportion of offenders on Electronic Monitoring who are reconvicted of a new offence whilst under EM conditions
– – – New measure for 2015/16 Fewer than 2014/15
Re-offending while on a sentence or order and within the 12 month follow up period resulting in a reconviction
Home Detention – 9.2% Home Detention – 8.5% Home Detention – 8.7%
– Less than 2014/15
Intensive Supervision – 35.9% Intensive Supervision – 32.8% Intensive Supervision – 34.6%
Parole – 22.4% Parole – 23.0% Parole – 21.1%
Post Detention Conditions – 15.6%
Post Detention Conditions – 15.7%
Post Detention Conditions – 15.6%
Released on Conditions – 44.1%
Released on Conditions – 44.7%
Released on Conditions – 43.7%
Supervision – 22.0% Supervision – 20.5% Supervision – 20.8%
A reduction in the rate of offenders who started home detention or parole and then committed a new offence during the following period of management, compared to the previous year
Home Detention – 9.2% Home Detention – 8.5% Home Detention – 8.7%Less than 2014/15
Parole – 22.4% Parole – 23.0% Parole – 21.1% –
A safe and secure Corrections system is assured
Custodial environments are safe and humane
The number of breakout escapes 3 0 0 0 0
The percent of self-harm threat to life interventions where an unnatural death did not occur – – – New measure for 2015/16 To be set in 2015/16
The proportion of general random drug tests that have a positive result 4.3% 4.3% 6.2% 4.0% ≤5%
The number of unnatural deaths 5 3 3 8 0
The proportion of complaints by prisoners to the Corrections Inspectorate upheld for reasons of materiality
– – – New measure for 2015/16 To be set in 2015/16

STRATEGIC INTENTIONS 2015 – 201952


Department of Corrections, Mayfair House, 44-52 The Terrace, Wellington
Phone: (64 4) 460 3000 Fax: (64 4) 460 3208 www.corrections.govt.nz


![Nr. 3[24]/2007 · Power indicators and strategic intentions of North Korea - Marina MUSCAN/p.70 ... CONTENTS IMPACT STRATEGIC Nr. 3/2007 STRATEGIC IMPACT POINT OF VIEWS Policy and](https://static.fdocuments.us/doc/165x107/5e4ad98e31276c48fa4d2d94/nr-3242007-power-indicators-and-strategic-intentions-of-north-korea-marina.jpg)