Pedestrian Safety Program Strategic Plan - FHWA Safety Program

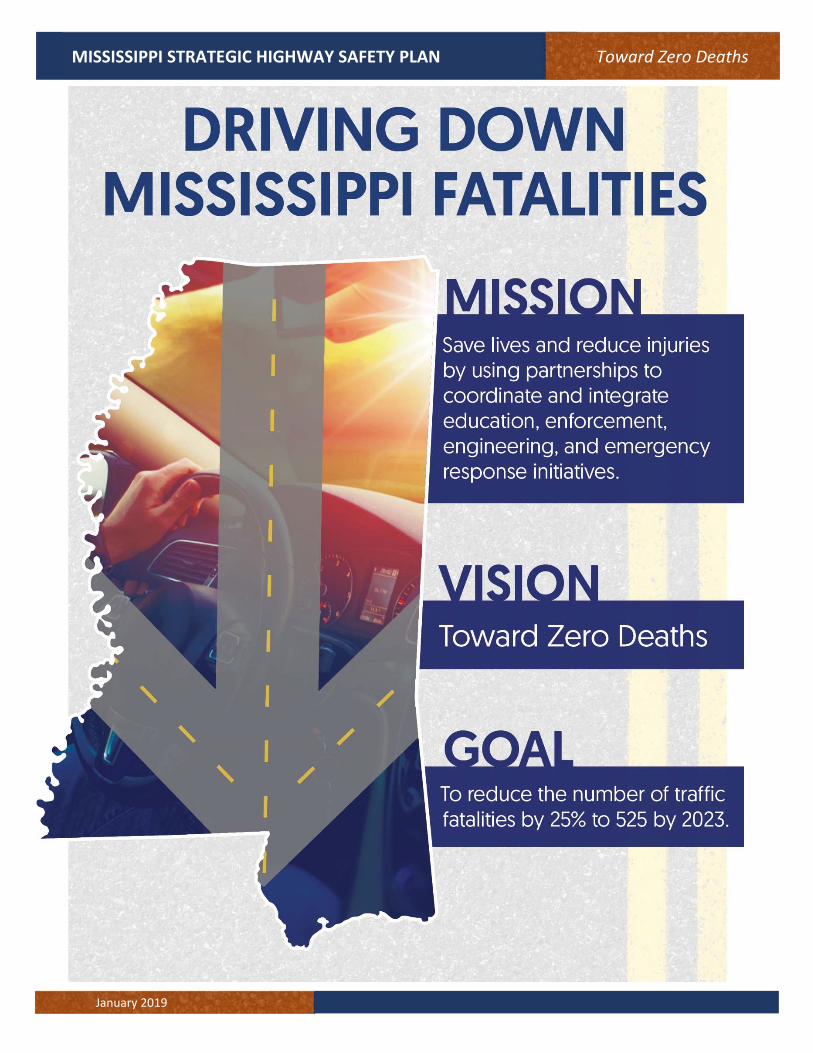
VISION: TOWARD ZERO DEATHS
Strategic HighwaySAFETY PLAN
JANUARY 2019
January 2019
MISSISSIPPI STRATEGIC HIGHWAY SAFETY PLAN Toward Zero Deaths

January 2019 ii
MISSISSIPPI STRATEGIC HIGHWAY SAFETY PLAN Toward Zero Deaths
Contents Contents .............................................................................................................................................. ii Executive Summary ............................................................................................................................. v High Risk Rural Roads (HRRR) .............................................................................................................. vi 1.0 Introduction and Background .................................................................................................. 1
1.1 Background and Purpose .................................................................................................... 1
National and State Context – Traffic Fatalities ............................................................. 1
Mississippi’s Safety Planning Efforts and Goal ............................................................. 2
Brief History of Mississippi’s Highway Safety Investments .......................................... 3
Engineering ................................................................................................................... 3
Enforcement ................................................................................................................. 5
Education ...................................................................................................................... 6
Emergency Medical Services (EMS).............................................................................. 7
Data .............................................................................................................................. 7 1.2 SHSP History ........................................................................................................................ 8
2019 Edition SHSP ........................................................................................................ 8 1.3 SHSP Process ....................................................................................................................... 8 1.4 Partners ............................................................................................................................... 9 1.5 National Context – The Focus is Results ........................................................................... 10 1.6 Prior Strategies and Emphasis Areas ................................................................................ 11
2.0 Critical Emphasis Areas .......................................................................................................... 12 2.1 Crash Data Evaluation ....................................................................................................... 12
Data Overview – Fatal Crashes on Mississippi’s Roads .............................................. 12
Mississippi’s State Highway Critical Emphasis Areas ................................................. 13 2.2 Driver Behavior Emphasis Areas ....................................................................................... 15
Unlicensed Drivers ...................................................................................................... 15
Drug and Alcohol Impaired Driving ............................................................................ 15
Unbelted Vehicle Occupants ...................................................................................... 16 2.3 Highway Emphasis Areas .................................................................................................. 16
Lane Departure Crashes ............................................................................................. 16
Intersection Crashes ................................................................................................... 17 2.4 Additional Emphasis Area Considerations ........................................................................ 17
Distracted Driving ....................................................................................................... 17
Data Quality ................................................................................................................ 17 3.0 Stakeholders Meeting ............................................................................................................ 18
3.1 Background ....................................................................................................................... 18 3.2 Consultation ...................................................................................................................... 19 3.3 Stakeholders Meeting ....................................................................................................... 20
Workshop Details ....................................................................................................... 20 4.0 Priority Safety Strategies ....................................................................................................... 22
4.1 Strategies for Reducing Fatal Intersection Crashes .......................................................... 23 4.2 Strategies for Reducing Fatal Lane Departure Crashes .................................................... 26 4.3 Strategies for Reducing the Number of Unbelted Vehicle Occupant Fatalities ............... 29 4.4 Strategies for Reducing Impaired Driving Fatalities ......................................................... 30 4.5 Strategies for Reducing Unlicensed, Suspended, or Revoked (USR) License Drivers ....... 33
Appendix ........................................................................................................................................... 34
January 2019 iii
MISSISSIPPI STRATEGIC HIGHWAY SAFETY PLAN Toward Zero Deaths
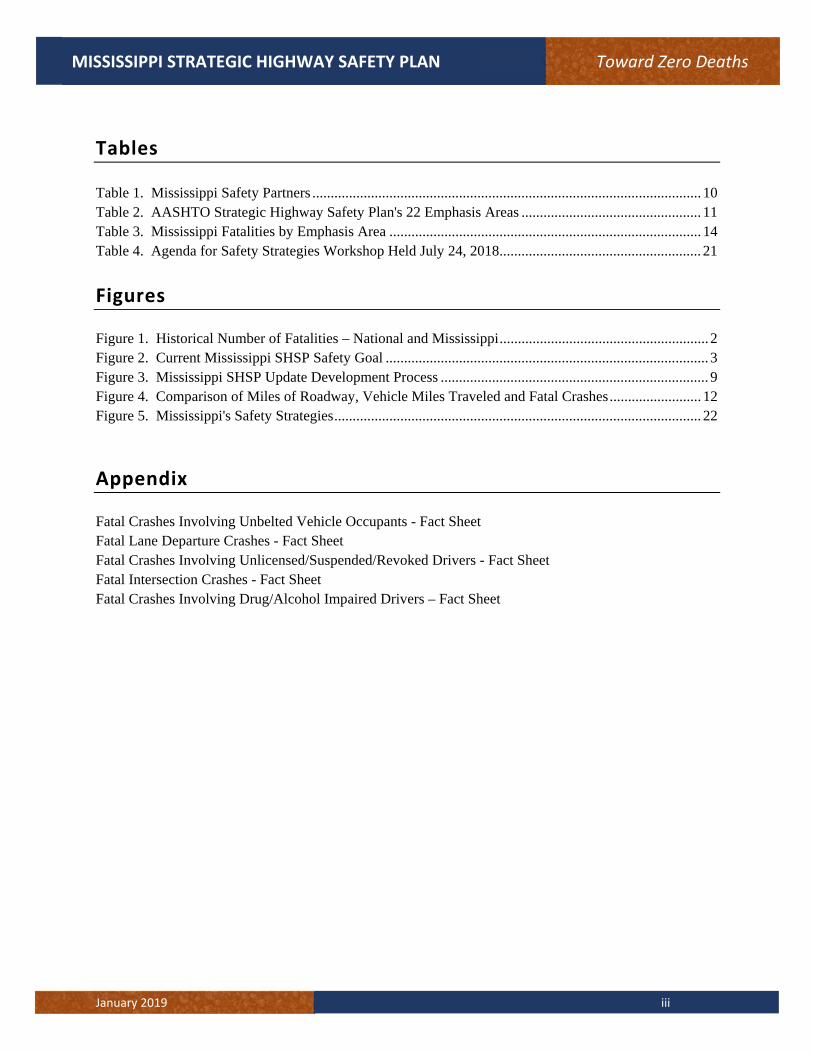
Tables Table 1. Mississippi Safety Partners .......................................................................................................... 10 Table 2. AASHTO Strategic Highway Safety Plan's 22 Emphasis Areas ................................................. 11 Table 3. Mississippi Fatalities by Emphasis Area ..................................................................................... 14 Table 4. Agenda for Safety Strategies Workshop Held July 24, 2018 ....................................................... 21
Figures Figure 1. Historical Number of Fatalities – National and Mississippi ......................................................... 2 Figure 2. Current Mississippi SHSP Safety Goal ........................................................................................ 3 Figure 3. Mississippi SHSP Update Development Process ......................................................................... 9 Figure 4. Comparison of Miles of Roadway, Vehicle Miles Traveled and Fatal Crashes ......................... 12 Figure 5. Mississippi's Safety Strategies .................................................................................................... 22
Appendix Fatal Crashes Involving Unbelted Vehicle Occupants - Fact Sheet Fatal Lane Departure Crashes - Fact Sheet Fatal Crashes Involving Unlicensed/Suspended/Revoked Drivers - Fact Sheet Fatal Intersection Crashes - Fact Sheet Fatal Crashes Involving Drug/Alcohol Impaired Drivers – Fact Sheet

January 2019 iv
MISSISSIPPI STRATEGIC HIGHWAY SAFETY PLAN Toward Zero Deaths
Acronyms and Abbreviations 4Es........................ Engineering, Enforcement, Education, and Emergency Medical Services
AASHTO .............American Association of State Highway and Transportation Officials
ADT .....................Average Daily Traffic
CEA......................Critical Emphasis Area
DUI ......................Driving Under the Influence
EMS .....................Emergency Medical Services
FARS....................Fatality Analysis Reporting System
FAST ....................Fixing America’s Surface Transportation - FAST Act
FHWA ..................Federal Highway Administration
FMCSA ................Federal Motor Carrier Safety Administration
GIS .......................Geographic Information System
HSIP .....................Highway Safety Improvement Program
JOL .......................Judicial Outreach Liaison
MADD .................Mothers Against Drunk Driving
MDOT ..................Mississippi Department of Transportation
MDPS ...................Mississippi Department of Public Safety
MOHS ..................Mississippi Office of Highway Safety
MPH .....................Miles per Hour
MS ........................Mississippi
NCHRP ................National Cooperative Highway Research Program
NEMSIS ...............National EMS Information System
OP ........................Occupant Protection
OSARC ................Office of State Aid Road Construction
PI&E ....................Public Information and Education
SAMS ...................Safety Analysis Management System
SHSP ....................Strategic Highway Safety Plan
U.S. ......................United States
VPD......................Vehicles per Day
VMT .....................Vehicle Miles Traveled

January 2019 v
MISSISSIPPI STRATEGIC HIGHWAY SAFETY PLAN Toward Zero Deaths
Executive Summary In 2019, Mississippi completed an update to its Strategic Highway Safety Plan (SHSP), building on plans from 2007 and 2014, respectively. Following guidance from the Federal Highway Administration (FHWA), the plan identifies the areas of need for the state, and a roadmap of how various agencies and disciplines can make a positive impact on crash issues in the years to come. Based upon crash data analyses conducted during the plan development process, the emphasis areas selected were:
Unlicensed Drivers
Impaired Driving
Unbelted Vehicle Occupants
Road Departure Crashes
Intersection Crashes The plan also touches on the topics of distracted driving and data quality, and how improvements in the five outlined emphasis areas can incorporate these topics. Though the state did not have specific data to support their inclusion, driver behavior statistics and the data needs discussed by various agencies through the process made it evident that these were topics that would be a vital part of any improvements in the state’s fatal and serious injury crashes. The plan also outlines how stakeholders from across the state were involved in the process, including the stakeholder’s meeting in the summer of 2018. At this meeting, agencies ranging from the Department of Public Safety to local public works departments were all briefed on what a statewide crash data analysis found, as well as the emphasis areas identified as a result of that analysis. The group discussed these emphasis areas in great detail and produced lists of strategies that have been incorporated into this plan. The new plan concludes with a list of screened strategies that can help reduce fatal and serious injury crashes in Mississippi in the selected emphasis areas. The strategies represent a healthy mix of opportunities for improvement across each of the 4Es: Engineering, Enforcement, Education and Emergency Management Services. It is our belief that these strategies and the guidance outlined in this document will help reduce crash related fatalities in Mississippi.
January 2019 vi
MISSISSIPPI STRATEGIC HIGHWAY SAFETY PLAN Toward Zero Deaths
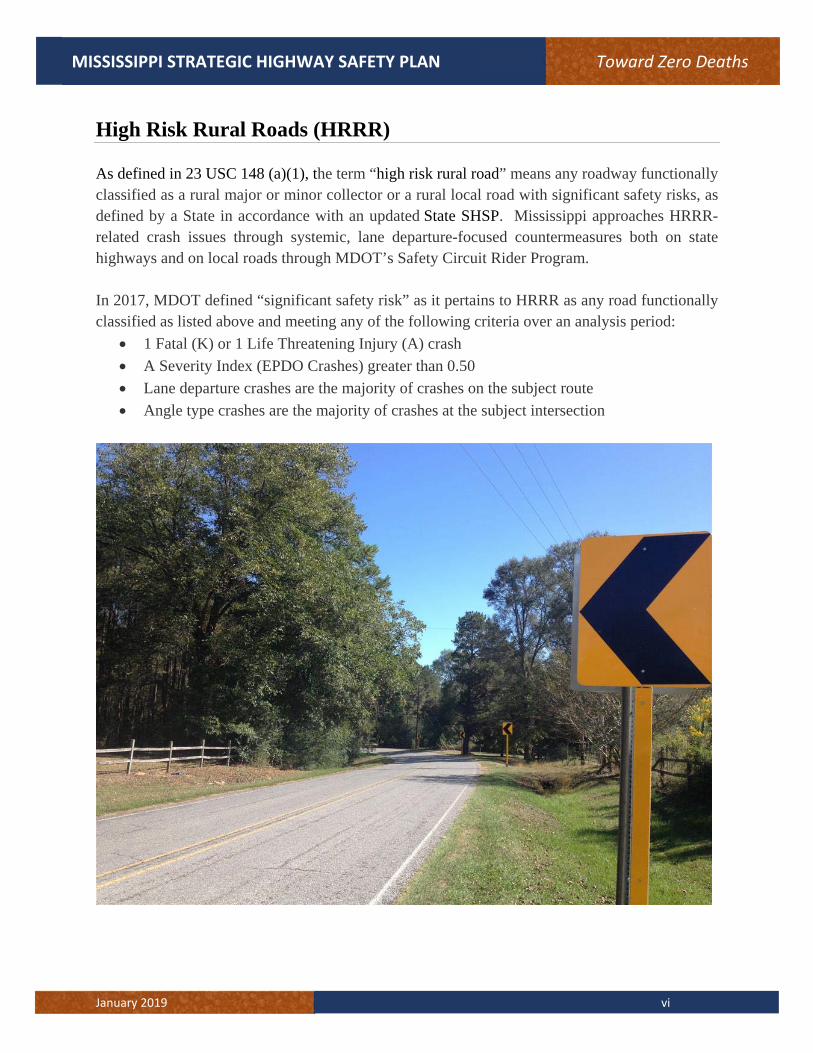
High Risk Rural Roads (HRRR) As defined in 23 USC 148 (a)(1), the term “high risk rural road” means any roadway functionally classified as a rural major or minor collector or a rural local road with significant safety risks, as defined by a State in accordance with an updated State SHSP. Mississippi approaches HRRR-related crash issues through systemic, lane departure-focused countermeasures both on state highways and on local roads through MDOT’s Safety Circuit Rider Program. In 2017, MDOT defined “significant safety risk” as it pertains to HRRR as any road functionally classified as listed above and meeting any of the following criteria over an analysis period:
1 Fatal (K) or 1 Life Threatening Injury (A) crash
A Severity Index (EPDO Crashes) greater than 0.50
Lane departure crashes are the majority of crashes on the subject route
Angle type crashes are the majority of crashes at the subject intersection
January 2019 1
MISSISSIPPI STRATEGIC HIGHWAY SAFETY PLAN Toward Zero Deaths
1.0 Introduction and Background
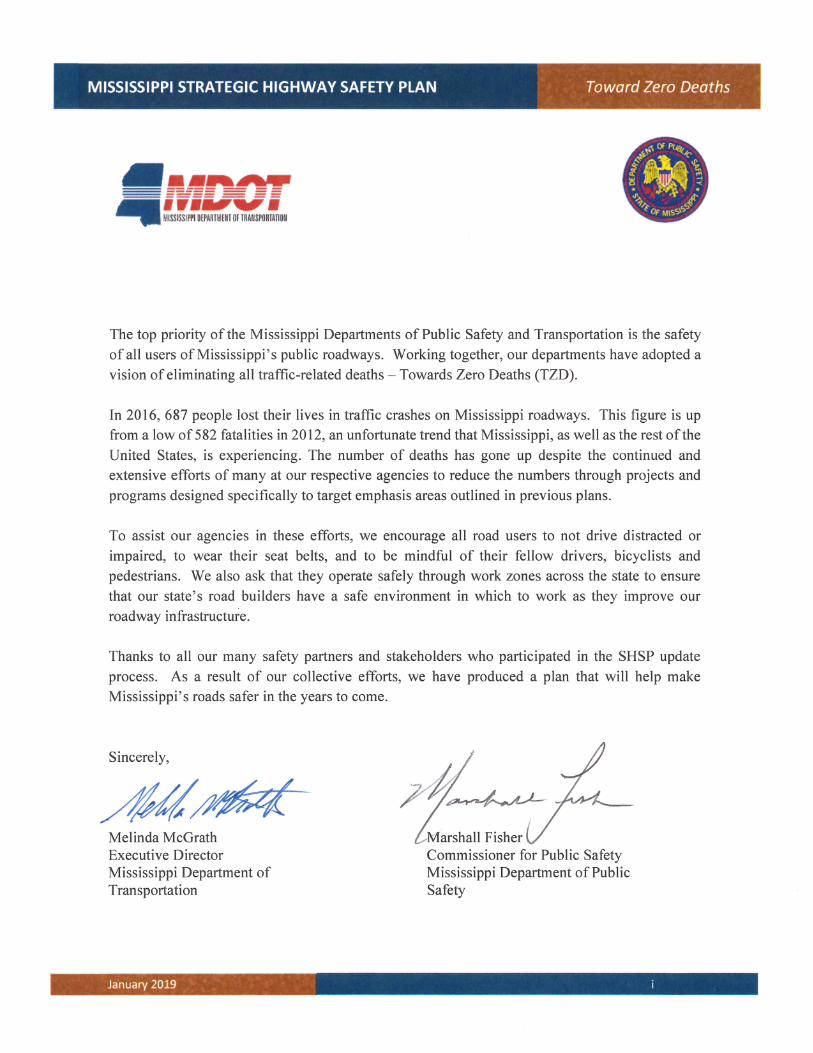
1.1 Background and Purpose Mississippi has made positive strides towards improving traffic safety for road users in the state by employing a multitude of efforts through the 4 Es. Regardless of the area of specialty or expertise, Mississippi highway safety advocates focus their efforts in reducing crashes based on the vision set forth in the state’s Strategic Highway Safety Plan (SHSP). Since 2007, Mississippi has maintained and worked from an aggressive SHSP focused on the data-driven needs of the state. The plans implemented since that time have outlined emphasis areas and strategies aimed at helping the state reach its goal of no loss of life on Mississippi roadways. In recent years, Mississippi has seen the plan be an instrument for success in these efforts. In 2012, the state reduced its traffic-related fatalities to 582, the lowest number in the state in 36 years. Other realized accomplishments in recent years are detailed on page 9 in the brief history of Mississippi’s Highway Safety Investments. While these are all accomplishments to be proud of, the task of reducing fatal crashes to zero remains a significant effort. Traffic-related fatalities – in Mississippi as well as nationwide – have begun to trend upward in the last several years. In 2016, 687 people lost their lives on Mississippi roadways, a figure that is unacceptable to those charged with maintaining and improving our highways. With that in mind, the refocusing of efforts through a new SHSP update has never been more needed than it is now. Over the next five years that this SHSP is in place, the state of Mississippi intends to continue its work spending time and resources towards areas of emphasis that can help the state one day become a place where traffic fatalities are a part of the past.
National and State Context – Traffic Fatalities Fatal and serious injury (severe) crashes are a major public health issue in the United States. In 2016, latest estimates show 37,461 people were killed in traffic crashes—an average of 102 people killed every day. From a high of 55,704 fatalities in 1972, there has been a trend of significant reductions in traffic related fatalities in the U.S. (Figure 1). This trend was interrupted between the early 1990s and 2000-2004 as traffic fatalities began to increase. However, there was a trend in the mid-2000s where traffic fatalities decreased dramatically to the lowest number of fatalities in recent history (32,479) recorded in 2011. That decrease was interrupted in 2015 and 2016, with an increase in fatalities nationally and in Mississippi.

January 2019 2
MISSISSIPPI STRATEGIC HIGHWAY SAFETY PLAN Toward Zero Deaths
Figure 1. Historical Number of Fatalities – National and Mississippi
Mississippi’s Safety Planning Efforts and Goal Since the early 1990s, Mississippi has mostly followed the national trend for traffic related fatalities. As shown in Figure 1, the number of traffic fatalities in Mississippi grew steadily until 2005, with a minor dip to 784 in 2001. Between 2005 and 2012, traffic fatalities in the state dropped every year, reaching a low of 582 in 2012 - a 37 % reduction in traffic fatalities. The original 2007 Mississippi SHSP included a goal of reducing traffic fatalities to 700 or fewer by 2011. Figure 1 shows that the state’s goal was met two years early in 2009. The 2014 plan set a goal of reducing fatalities to 525 by 2017. The State achieved a significant amount of success over prior year fatality totals through the focus on safety and outreach efforts but was unable to achieve the 2017 goal. While the original goal of 700 or fewer is still being met, the 525 goal represents a reduction of 24% over current levels. Figure 2 shows the achievement of the original Mississippi SHSP goal, trend lines, and the proposed new goal. The new goal is to reduce annual traffic fatalities by 25 percent by 2023. This is an aggressive goal but shows Mississippi’s dedication to driving fatalities to zero.
38,702
36,981
37,910
38,137
38,091 40,804 43,56447,700
49,163
51,524
51,559
53,831
55,032
53,672
53,761
55,704
54,589
46,078
45,500
45,523
47,878 50,331
51,103
51,093
49,301
43,945
42,589
44,257
43,795
46,056
46,385
47,087
45,555
44,529
41,162
39,250
40,115
40,716
41,817
42,065
42,013
41,501
41,717
41,945
42,196
43,005
42,884
42,836
43,510
42,708
41,259
37,423
33,883
32,999
32,479
33,782
32,893
32,744 35,485
37,461
546 581
684
784
715
695 744
730
715
679
662
771
756
722
727 750
714 766 813
791868
811 861
948
927 949
784
885
872 900 931
911
884
783
700
641
630
582 613
607677
687
0
200
400
600
800
1000
1200
1400
1600
1800
2000
0
10000
20000
30000
40000
50000
60000
1955 1960 1965 1970 1975 1980 1985 1990 1995 2000 2005 2010 2015 2020
Mississippi Traffic Fatalities
National Traffic Fatalities
Year
National
Mississippi

January 2019 3
MISSISSIPPI STRATEGIC HIGHWAY SAFETY PLAN Toward Zero Deaths
Figure 2. Current Mississippi SHSP Safety Goal
Brief History of Mississippi’s Highway Safety Investments
Mississippi has a long tradition of investing in all phases of highway safety. Examples of strategies and programs that have been successfully deployed to address safety along the State’s highway system are identified based on the 4 Es: Engineering, Enforcement, Education and Emergency Medical Services (EMS). Some examples of these strategies and programs include:
Engineering
MDOT has worked extensively in the last five years towards budgeting and installing more innovative intersection treatments. These types of treatments include two of FHWA’s proven safety countermeasures: Restricted Crossing U-turns (RCUTs) and Roundabouts. Both treatments continue to produce encouraging results from a crash reduction perspective where they have been installed.
546
581
684
784
715
695
744
730
715
679
662
771
756
722
727 750
714
766
813
791
868
811
861
948
927
949
784
885
872 900 931
911
884
783
700
641
630
582 613
607
677 687700
525
0
100
200
300
400
500
600
700
800
900
1,000
1975 1980 1985 1990 1995 2000 2005 2010 2015 2020 2025
Mississippi Traffic Fatalities
Year
Mississippi
Goal
January 2019 4
MISSISSIPPI STRATEGIC HIGHWAY SAFETY PLAN Toward Zero Deaths
MDOT continues to deploy edge line treatments such as rumble strip and rumble stripe to help reduce the likelihood of roadway departure crashes on the many rural sections of Mississippi roadway. MDOT also recently updated its pavement marking policy to allow for the use of new pavement marking technologies such as audible thermoplastic stripe where shoulders are not wide enough to install a rumble strip. Some local roadway agencies are deploying edge line treatments on some of their projects, as well. All these efforts help to ensure that more of Mississippi’s roads can offer a warning (of various types) for drivers potentially leaving the roadway.
MDOT is following the national trend of focusing more funding on systemic treatments such as the restriping and resigning of routes, rumble strips, and other measures. The use of these treatments allows MDOT to treat more of the many miles of highway it maintains, as well as spread its funding further.
MDOT’s Safety Analysis Management System (SAMS) project was initiated in 2004 to design and develop a web-based, geographic information system (GIS)-enabled application and supporting geospatial data repository through which crash data can be quickly and easily analyzed. SAMS enhances the ability of MDOT safety staff to perform both basic and advanced analyses of crash data (and roadway characteristics). These analyses range from a simple query of crashes and visualization of their locations on a map to comprehensive statewide analyses of high-crash locations. With MDOT focusing its safety funding on data-driven areas of need, SAMS is the backbone of the HSIP.
MDOT implemented the Safety Circuit Rider Program in 2012. This program was created to provide training and technical assistance to local roadway officials and managers. The goal of this effort was to extend the culture of safety and the ability to make safety improvements to the local roadway system. The program uses dedicated personnel to aid local officials in reviewing crash data for their jurisdictions, making site visits to assess road and intersection conditions, and make engineering recommendations to improve safety. Improvements are offered either through a warning and advisory signage program that provides free signage to locals for their installation as crash data warrants, as well as HSIP-funded projects.
MDOT has participated in multiple Every Day Counts initiatives hosted by FHWA, working collaboratively with the Federal agencies to help reduce fatalities in Mississippi and move safety projects through the design/construction process faster.

January 2019 5
MISSISSIPPI STRATEGIC HIGHWAY SAFETY PLAN Toward Zero Deaths
Enforcement
On May 27, 2006, Mississippi became the 22nd State to implement a primary safety belt law (Mississippi Code Ann. §63-2-1). Effective, July 1, 2017, Mississippi joined other states by implementing an all passenger seatbelt law. Historically, most of the drivers and passengers that die in traffic crashes are not belted. Although safety belts cannot save all persons, it is estimated that fatalities are reduced 50 to 65 percent when safety belts are used, resulting in injuries rather than fatalities.
In 2015, there were 565 occupant fatalities and 55% were not wearing safety belts. However, of the 76 young drivers and passengers ages 16 to 20 who were killed in 2015, 53% were unbelted. Many of these young motorists could have been saved with seat belt use. With sustained statewide law enforcement, coupled with public information and education, Mississippi stands poised to save hundreds of lives and reduce thousands of injuries each year from increased safety belt usage by motorists.
The MS Office of Highway Safety (MOHS) funds enforcement activities over five blitz periods each year to conduct Saturation Patrols, Sobriety Checkpoints, and Selective Traffic Enforcement by local enforcement departments and all districts of MS Highway Patrol. The local departments are selected based on traffic record studies of crashes and citations such that traffic safety activities are data driven.
Mississippi lawmakers passed a law targeting distracted drivers (Mississippi Code Ann. §63-33-1). This law prohibits all motorists from driving while using a handheld mobile telephone or portable electronic device to write, send, or read a text message, or access, read or post to a social network site.
January 2019 6
MISSISSIPPI STRATEGIC HIGHWAY SAFETY PLAN Toward Zero Deaths
Seatbelts, air bags, other restraint systems and anti-lock brakes have significantly contributed to reducing injuries and deaths from traffic crashes, but these technological advances are only a step in the process. Continued improvements in vehicle design are necessary to protect occupants, along with education and behavior modification. Effective and ongoing traffic enforcement is a key factor in improving or maintaining a community’s quality of life. As crime increases and more demands are placed on law enforcement agencies, the importance of effective traffic enforcement rises.
The Federal Motor Carrier Safety Administration (FMCSA) provides grants to the Mississippi Highway Patrol, MDOT Office of Enforcement, and Mississippi Department of Revenue to conduct enforcement activities to reduce the number of commercial vehicle collisions on Mississippi’s roadways. The specific activities and locations are chosen by the agencies based on the location of inspection facilities, as well as commercial vehicle crash data information from the Fatality Analysis Reporting System (FARS) system.
Education
The “Drive Sober or Get Pulled Over” Public Information and Education (PI&E) campaign to address driving under the influence (DUI) has been successful in increased DUI arrests statewide, particularly for offenders under 21.
The most recent “Drive Sober or Get Pulled Over” PI&E campaign, coupled with strict traffic enforcement by State and local departments, identified that the State had made significant progress in reducing deaths and injuries on MS roadways.
To help increase seatbelt use and reduce unrestrained fatalities, Mississippi continues to participate in the nationwide “Click It or Ticket” campaign held in the summer. This campaign has helped Mississippi raise its observed seatbelt use by nearly 10% over the last decade.
Mississippi has a strong zero-tolerance statute aimed at underage drinking and has a grant funded DUI court-monitoring system with the Mississippi chapter of Mothers Against Drunk Driving (MADD). Impaired driving has been affected by the trends in nationwide increases in opioid use and greater acceptance in other States of legalized marijuana use.
Alcohol impaired fatalities increased from 172 in 2014 to 175 in 2015. In 2015, 26% of all fatalities were alcohol impaired. MOHS plans to continue efforts to reduce overall crashes, fatal crashes, injuries and the economic losses caused by traffic crashes. Alcohol impaired traffic crashes will continue to be a priority in program planning for MOHS.
January 2019 7
MISSISSIPPI STRATEGIC HIGHWAY SAFETY PLAN Toward Zero Deaths
The “Survive Your Drive” Safety Education Program raises awareness of highway traffic safety issues faced by Mississippi motorists, including occupant protection/seat belt use, impaired driving and distracted driving. Safety professionals provide education and outreach at schools and community events across the state. Through presentations and simulator demonstrations, the public is educated with the driving knowledge and skills to make Mississippi highways safe. The program annually reaches more than 15,000 Mississippi residents through these presentations and demonstrations. The program also provides the public with Mississippi Department of Education-approved and common-core-aligned safety education lesson plans for use in middle and high school classrooms.
Emergency Medical Services (EMS)
Statewide Trauma System has been established.
Linking data between EMS, enforcement agencies, ambulance services, emergency departments, and hospitals to produce crash-outcome studies.
Ensure the EMS management information system maintains the National EMS Information System (NEMSIS) Standards.
Data
SAMS Version 2 (SAMSv2) will build and improve upon the foundation of SAMS Version 1. Since the implementation of SAMSv1, new algorithms and approaches to traffic safety have become available that will help improve the way SAMS identifies potential areas of crash concern and suggests mitigation alternates. SAMSv2 will add Safety Performance Functions as well as a multi-linear referencing system that will improve the output from SAMS to help to identify high hazard locations.
The State of Mississippi is currently working to replace its existing electronic crash reporting software and data warehouse, ReportBeam, with a more robust application, eCrash. The new system will help the state become compliant with the Minimum Model Uniform Crash Criteria (MMUCC)’s 5th edition, ahead of the deadline to become MMUCC 4 compliant by April 2019.
January 2019 8
MISSISSIPPI STRATEGIC HIGHWAY SAFETY PLAN Toward Zero Deaths
1.2 SHSP History
FHWA first introduced the SHSP in the transportation funding bill in 2005 called the Safe, Accountable, Flexible, Efficient Transportation Equity Act: A Legacy for Users (SAFETEA-LU). This bill required that State’s develop a SHSP to receive federal transportation funding. The current transportation bill, the FAST Act (Fixing America’s Surface Transportation), continues the HSIP as a core federal program. The HSIP provides funding to States to implement safety related projects and programs. The SHSP is one of three main components of the HSIP. The SHSP is a statewide coordinated safety plan that provides a comprehensive framework for reducing highway fatalities and serious injuries on all public roads. This update is intended to replace the previous update of the Plan, completed in 2014.
2019 Edition SHSP
The 2019 SHSP is the second update to the original plan, which was completed in 2007. MDOT’s first update was implemented in 2014. The original plan and its updates were completed through a joint effort by MDOT and the Mississippi Department of Public Safety (MDPS). The most recent plan identified five critical emphasis areas and 33 critical strategies. Mississippi traffic fatalities trended downward from 2007 to 2012 from 884 to 582 (34% decrease) and have trended upward from 2012 to 2016 from 582 to 687 (18% increase). National vehicle miles of travel (VMT) have seen similar trends during these time periods, just not to the same magnitude. This plan is intended to document the efforts to use data analysis, public outreach, and coordination with supporting/affected agencies to help update the emphasis areas.
1.3 SHSP Process Similar to the prior editions of the SHSP, this update:
Addresses the frequency, rate and primary factors contributing to fatalities on all roads in Mississippi,
Is consistent with FHWA procedural guidance,
Establishes a mission, vision, and goal for all safety partners in the State of Mississippi,
Incorporates input provided by safety partners representing national, state, and local agencies; and private safety advocacy groups,
Follows a data driven process that considers all users on all roads,
Provides a guide for future safety investments, and
Addresses the 4Es of safety: Engineering, Enforcement, Education, and Emergency medical services)

January 2019 9
MISSISSIPPI STRATEGIC HIGHWAY SAFETY PLAN Toward Zero Deaths
Figure 3 shows the process used to develop the Mississippi SHSP. Beginning with the crash analysis and concluding with the SHSP report, this approach is the culmination of more than a year of working with MDOT and its safety partners.
Figure 3. Mississippi SHSP Update Development Process
1.4 Partners
The 2019 Mississippi SHSP was developed through coordination with a variety of stakeholders from public and private agencies. Stakeholders outside of the traditional safety planning process (such as planning organizations, non-profit agencies, universities, and cities) were included when countermeasures were developed to address specific safety issues. Individuals representing the 4Es were also invited to participate in the SHSP process. Those representing other modes of transportation – bicycle, pedestrian, commercial vehicles, motorcycles, etc. – were asked to participate as well. The complete list of safety partners who participated in the development of the SHSP are listed in Table 1.
Crash Analysis
Select Safety Emphasis
Areas
Develop Comprehensive List of Safety Strategies
Safety Strategy
Workshop
Update Mississippi
SHSP
Identify Short List of Critical
Strategies
Project Programming
Project Development
Implementation
Evaluation
Refinement & Update SHSP

January 2019 10
MISSISSIPPI STRATEGIC HIGHWAY SAFETY PLAN Toward Zero Deaths
Table 1. Mississippi Safety Partners American Academy of Pediatrics Mississippi Judicial College American Automobile Association (AAA) Mississippi Municipal League AMR Ambulance Services Mississippi Office of Highway Safety City of Jackson, Biloxi, Brookhaven, Gulfport, Hattiesburg Mississippi Office of State Aid Road Construction City of Natchez, Olive Branch, Southaven, Tupelo, Vicksburg Mississippi Operation Lifesaver Federal Highway Administration (FHWA) Mississippi Police Chiefs’ Association Federal Motor Carrier Safety Administration Mississippi Railroad Association Harrison County Road Department Mississippi Road Builders Association Hinds County Sheriff’s Office Mississippi Safe Kids MASEP-MS Alcohol Safety Education Program Mississippi Sheriffs’ Association Meridian Police Department Mississippi State University – Center for Advanced Vehicular Systems Metropolitan Planning Organizations - GRPC, Hattiesburg, Mississippi State University – Social Science Research Center Memphis, Central MS Planning and Development District Mississippi Trucking Association Mississippi Association of Supervisors Mothers Against Drunk Driving Mississippi Brain Injury Association MS Alcohol Beverage Control Mississippi Coroner-Medical Examiner’s Association National Highway Traffic Safety Administration (NHTSA) Mississippi Department of Education Office of the Attorney General Mississippi Department of Health Oxford Police Department/MS Law Enforcement Training Director Mississippi Department of Mental Health Preusser Research Group Mississippi Department of Public Safety Sherman Police Department (Including Planning and State Patrol) Sobriety Trained Officers Representing Mississippi (STORM) Mississippi Department of Revenue University of Alabama/CAPS Mississippi Department of Transportation University of Mississippi Medical Center
1.5 National Context – The Focus is Results
FHWA encourages States to start with fundamentals to create a plan that can be successfully implemented and evaluated. This is consistent with FHWA’s vision of eliminating fatalities and serious injuries on the Nation’s roadways. FHWA has placed a focus on the most severe crashes – those crashes resulting in a fatality and/or life-changing injuries – using a data-driven process. FHWA’s vision is intended to reverse the trend with the recent uptick in roadway deaths after a decade of reducing fatalities and serious injuries. In 2016, 37,461 people lost their lives on US roadways. FHWA’s goal is to work with each State to develop a safety culture to reverse this trend and reduce the number of fatalities on the Nation’s roads to zero.
January 2019 11
MISSISSIPPI STRATEGIC HIGHWAY SAFETY PLAN Toward Zero Deaths
1.6 Prior Strategies and Emphasis Areas
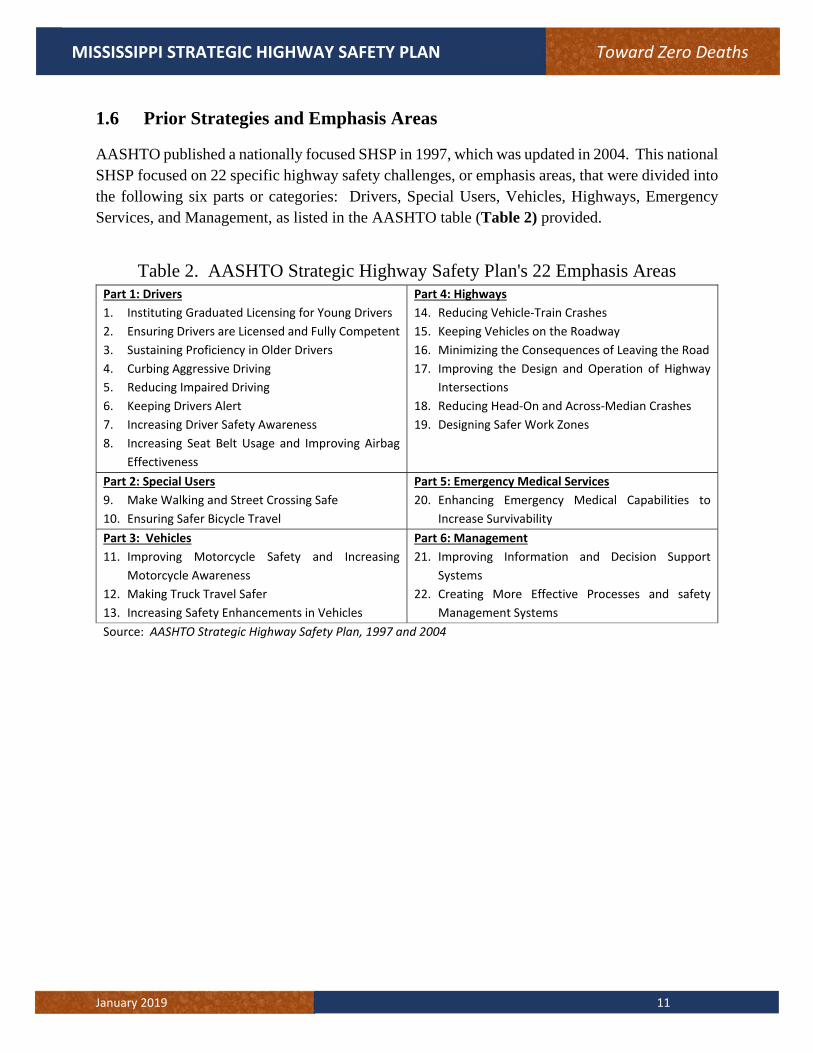
AASHTO published a nationally focused SHSP in 1997, which was updated in 2004. This national SHSP focused on 22 specific highway safety challenges, or emphasis areas, that were divided into the following six parts or categories: Drivers, Special Users, Vehicles, Highways, Emergency Services, and Management, as listed in the AASHTO table (Table 2) provided.
Table 2. AASHTO Strategic Highway Safety Plan's 22 Emphasis Areas Part 1: Drivers
1. Instituting Graduated Licensing for Young Drivers
2. Ensuring Drivers are Licensed and Fully Competent
3. Sustaining Proficiency in Older Drivers
4. Curbing Aggressive Driving
5. Reducing Impaired Driving
6. Keeping Drivers Alert
7. Increasing Driver Safety Awareness
8. Increasing Seat Belt Usage and Improving Airbag
Effectiveness
Part 4: Highways
14. Reducing Vehicle‐Train Crashes
15. Keeping Vehicles on the Roadway
16. Minimizing the Consequences of Leaving the Road
17. Improving the Design and Operation of Highway
Intersections
18. Reducing Head‐On and Across‐Median Crashes
19. Designing Safer Work Zones
Part 2: Special Users
9. Make Walking and Street Crossing Safe
10. Ensuring Safer Bicycle Travel
Part 5: Emergency Medical Services
20. Enhancing Emergency Medical Capabilities to
Increase Survivability
Part 3: Vehicles
11. Improving Motorcycle Safety and Increasing
Motorcycle Awareness
12. Making Truck Travel Safer
13. Increasing Safety Enhancements in Vehicles
Part 6: Management
21. Improving Information and Decision Support
Systems
22. Creating More Effective Processes and safety
Management Systems
Source: AASHTO Strategic Highway Safety Plan, 1997 and 2004

January 2019 12
MISSISSIPPI STRATEGIC HIGHWAY SAFETY PLAN Toward Zero Deaths
2.0 Critical Emphasis Areas
2.1 Crash Data Evaluation Data Overview – Fatal Crashes on Mississippi’s Roads There are 77,027 miles of public streets and roadways in Mississippi, of which 10,890 miles are state maintained and a part of the state highway system. According to a detailed analysis of crashes from 2012 through 2016, it was determined that 65 percent of the statewide traffic fatalities occur on the state system, making roads under the state’s jurisdiction the most at-risk part of Mississippi’s roadway system. Even though fatal crashes predominantly occur on state roads, Mississippi understands the importance of creating a SHSP that covers the safety of all road users on all roads in the state.
Figure 4. Comparison of Miles of Roadway, Vehicle Miles Traveled and Fatal Crashes
City Maintained County Maintained State Maintained
Miles of Roadway 16% 70% 14%
VMT 16% 23% 61%
Fatal Crashes 11% 25% 64%
0%
10%
20%
30%
40%
50%
60%
70%
80%
90%
100%
Miles of Roadway VMT Fatal Crashes

January 2019 13
MISSISSIPPI STRATEGIC HIGHWAY SAFETY PLAN Toward Zero Deaths
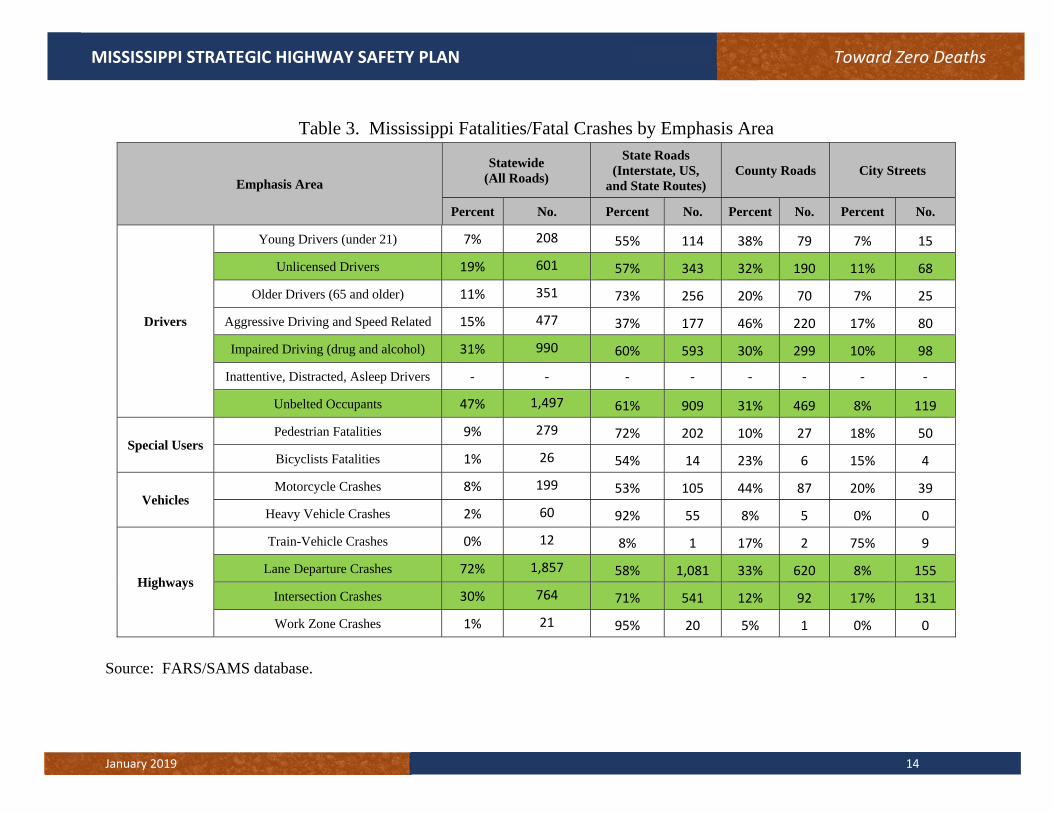
Mississippi’s State Highway Critical Emphasis Areas A more detailed analysis of fatal crashes was conducted to provide a complete overview of the crash types that represent both the greatest need for safety investment as well as the greatest opportunity to reduce crashes. This analysis was completed using data from the FARS database. The data used for this analysis came from five years (2012-2016) of crash records and included 3,166 fatal crashes. This data was reviewed and then disaggregated into AASHTO’s 22 critical emphasis areas discussed in Section 1. The number of fatalities or fatal crashes in each critical emphasis area (CEA) were evaluated. Based on the results of the analysis, the top CEA’s for Mississippi are as follows: • Lane Departure Crashes (72%) • Unbelted Vehicle Occupants (47%) • Drug/Alcohol Impaired Drivers (31%) • Intersection Crashes (30%) • Unlicensed/Suspended License/Revoked License (USR) Drivers (19%) The State of Mississippi believes that these five emphasis areas represent the greatest potential to significantly reduce the number of severe crashes throughout Mississippi. Table 3 identifies the detail of Mississippi’s fatalities and fatal crashes as they relate to AASHTO’s emphasis areas.
January 2019 14
MISSISSIPPI STRATEGIC HIGHWAY SAFETY PLAN Toward Zero Deaths
Table 3. Mississippi Fatalities/Fatal Crashes by Emphasis Area
Emphasis Area
Statewide (All Roads)
State Roads (Interstate, US,
and State Routes) County Roads City Streets
Percent No. Percent No. Percent No. Percent No.
Drivers
Young Drivers (under 21) 7% 208 55% 114 38% 79 7% 15
Unlicensed Drivers 19% 601 57% 343 32% 190 11% 68
Older Drivers (65 and older) 11% 351 73% 256 20% 70 7% 25
Aggressive Driving and Speed Related 15% 477 37% 177 46% 220 17% 80
Impaired Driving (drug and alcohol) 31% 990 60% 593 30% 299 10% 98
Inattentive, Distracted, Asleep Drivers - - - - - - - -
Unbelted Occupants 47% 1,497 61% 909 31% 469 8% 119
Special Users Pedestrian Fatalities 9% 279 72% 202 10% 27 18% 50
Bicyclists Fatalities 1% 26 54% 14 23% 6 15% 4
Vehicles Motorcycle Crashes 8% 199 53% 105 44% 87 20% 39
Heavy Vehicle Crashes 2% 60 92% 55 8% 5 0% 0
Highways
Train-Vehicle Crashes 0% 12 8% 1 17% 2 75% 9
Lane Departure Crashes 72% 1,857 58% 1,081 33% 620 8% 155
Intersection Crashes 30% 764 71% 541 12% 92 17% 131
Work Zone Crashes 1% 21 95% 20 5% 1 0% 0
Source: FARS/SAMS database.
January 2019 15
MISSISSIPPI STRATEGIC HIGHWAY SAFETY PLAN Toward Zero Deaths
2.2 Driver Behavior Emphasis Areas
Unlicensed Drivers
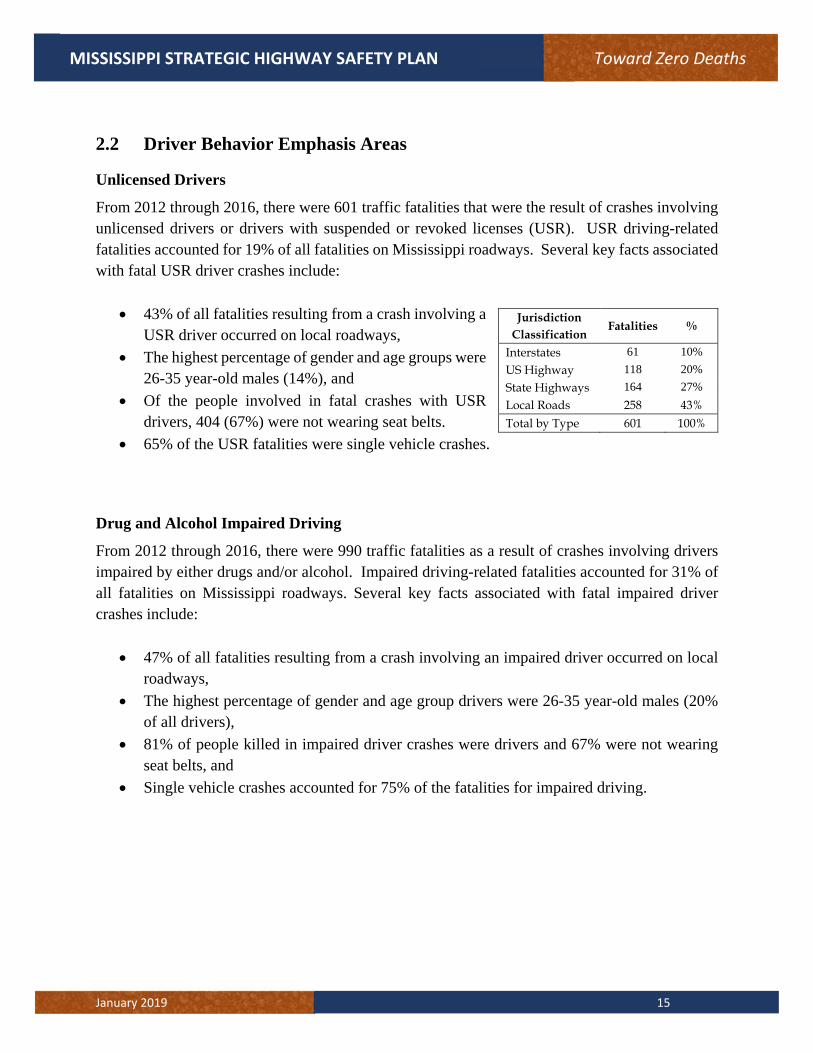
From 2012 through 2016, there were 601 traffic fatalities that were the result of crashes involving unlicensed drivers or drivers with suspended or revoked licenses (USR). USR driving-related fatalities accounted for 19% of all fatalities on Mississippi roadways. Several key facts associated with fatal USR driver crashes include:
43% of all fatalities resulting from a crash involving a USR driver occurred on local roadways,
The highest percentage of gender and age groups were 26-35 year-old males (14%), and
Of the people involved in fatal crashes with USR drivers, 404 (67%) were not wearing seat belts.
65% of the USR fatalities were single vehicle crashes.
Drug and Alcohol Impaired Driving
From 2012 through 2016, there were 990 traffic fatalities as a result of crashes involving drivers impaired by either drugs and/or alcohol. Impaired driving-related fatalities accounted for 31% of all fatalities on Mississippi roadways. Several key facts associated with fatal impaired driver crashes include:
47% of all fatalities resulting from a crash involving an impaired driver occurred on local roadways,
The highest percentage of gender and age group drivers were 26-35 year-old males (20% of all drivers),
81% of people killed in impaired driver crashes were drivers and 67% were not wearing seat belts, and
Single vehicle crashes accounted for 75% of the fatalities for impaired driving.
Jurisdiction Classification
Fatalities %
Interstates 61 10%
US Highway 118 20%
State Highways 164 27%
Local Roads 258 43%
Total by Type 601 100%

January 2019 16
MISSISSIPPI STRATEGIC HIGHWAY SAFETY PLAN Toward Zero Deaths
Unbelted Vehicle Occupants
From 2012 through 2016, there were 1,497 traffic fatalities as a result of crashes involving unbelted vehicle occupants. Unbelted occupant related fatalities accounted for 47% of all fatalities on Mississippi roadways during this five-year period. Several key facts associated with fatal unbelted occupant crashes include:
52% of all fatalities resulting from a crash involving an unbelted occupant occurred on State or US Highways,
The highest percentage of gender and age group fatalities were 26-35 year-old males (14% of all fatalities), with men comprising 71% of all fatalities,
35% of people killed in unbelted occupant fatal crashes were totally ejected from the vehicle and 8% were partially ejected, and
Single vehicle crashes accounted for 69% of the fatalities for unbelted vehicle occupants.
2.3 Highway Emphasis Areas
Lane Departure Crashes
During the five-year study period, there were 1,857 fatal crashes (72%) on Mississippi roadways related to lane departure crashes. These lane departure crashes include single vehicle run-off-the-road, and head-on crashes. Significant contributing factors were identified to include:
Local roads accounted for the highest percentage (41%) of all lane departure crashes,
60% of fatalities in lane departure crashes were unbelted,
76% of the drivers in these fatal crashes were male and the largest age group represented by drivers were 26-35 year-old males (14% of all drivers), and
76% of lane departure crashes were single vehicle run-off-the-road crashes.
January 2019 17
MISSISSIPPI STRATEGIC HIGHWAY SAFETY PLAN Toward Zero Deaths
Intersection Crashes
From 2012 through 2016, there were 764 fatal crashes that were intersection related. Intersection related crashes accounted for 30% of all fatalities on Mississippi roadways during this five-year period. Several key facts associated with fatal intersection crashes included:
77% of intersection related crashes occurred on State or US Highways,
59% of the intersection related fatalities occurred on 2-lane roadways,
69% of the drivers in these fatal crashes were male, and
The largest age group represented by drivers in intersection crashes were >65 for both male and female drivers (29% of all drivers).
2.4 Additional Emphasis Area Considerations
Distracted Driving
Though not selected as an emphasis area for the state, Mississippi did want to address the emphasis area of Distracted Driving in this plan. Distracted driving has become a nationwide problem with cell phones usage and in-car entertainment/distractions at an all-time high. The key issue for the state is finding a way to measure and quantify the effects that distraction has on fatal and serious injury crashes. Over the five-year period that this plan is in place, Mississippi, like many states, anticipates technical advances to help quantify driver distraction and to incorporate qualitative measures to reduce this distraction level and correspondingly a reduction in the associated loss of life.
Data Quality
Data quality is another area that Mississippi intends to place additional emphasis on in the next five years. Though data quality is not a quantifiable emphasis area like the five selected for this plan, the quality of the data has relevance. As data quality improves in the state, so will our understanding of the crashes occurring and how we can ultimately reduce these serious crashes. As mentioned previously, MDOT and MDPS are both currently working on improvements to their crash data reporting and analysis systems, with the intention that in the years to come, the process from data capture to statewide data screening will improve greatly, aiding in the goal of reducing fatal crashes.

January 2019 18
MISSISSIPPI STRATEGIC HIGHWAY SAFETY PLAN Toward Zero Deaths
3.0 Stakeholders Meeting
3.1 Background
Following the identification of the Critical Emphasis Areas (CEAs), a comprehensive list of potential safety improvement strategies was assembled for each Emphasis Area, and a prioritization exercise was conducted at Mississippi’s stakeholder meeting. The source of the initial list of potential safety strategies was the National Cooperative Highway Research Program (NCHRP) Report 500: Guidance for Implementation of the AASHTO Strategic Highway Safety Plan. This series of guides was developed to assist state and local highway agencies in reducing the number of crashes in targeted safety emphasis areas. The guides correspond to the emphasis areas outlined in AASHTO’s Strategic Highway Safety Plan. Each guide contains a “best practices” list of strategies with value added information including relative implementation costs and the expected safety effectiveness. The expected safety effectiveness of each strategy is assigned into one of the following categories:
• Proven - widely deployed, subject to a rigorous statistical testing, and consistent results from statistical tests. • Tried - widely deployed but either lacking the statistical testing or with inconclusive results. • Experimental - too narrowly deployed to provide statistically significant results.
January 2019 19
MISSISSIPPI STRATEGIC HIGHWAY SAFETY PLAN Toward Zero Deaths
The information about implementation costs and effectiveness are key components in the development of statewide safety programs.
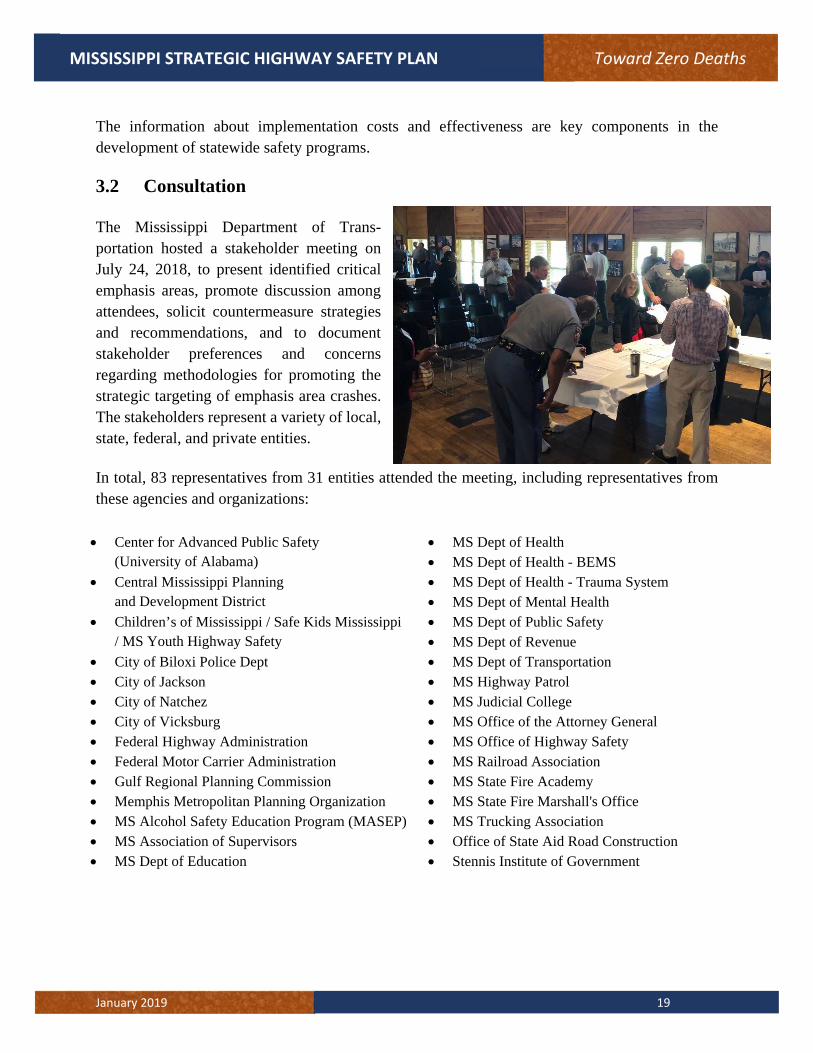
3.2 Consultation The Mississippi Department of Trans-portation hosted a stakeholder meeting on July 24, 2018, to present identified critical emphasis areas, promote discussion among attendees, solicit countermeasure strategies and recommendations, and to document stakeholder preferences and concerns regarding methodologies for promoting the strategic targeting of emphasis area crashes. The stakeholders represent a variety of local, state, federal, and private entities. In total, 83 representatives from 31 entities attended the meeting, including representatives from these agencies and organizations: Center for Advanced Public Safety MS Dept of Health
(University of Alabama) MS Dept of Health - BEMS Central Mississippi Planning MS Dept of Health - Trauma System
and Development District MS Dept of Mental Health Children’s of Mississippi / Safe Kids Mississippi MS Dept of Public Safety
/ MS Youth Highway Safety MS Dept of Revenue City of Biloxi Police Dept MS Dept of Transportation City of Jackson MS Highway Patrol City of Natchez MS Judicial College City of Vicksburg MS Office of the Attorney General Federal Highway Administration MS Office of Highway Safety Federal Motor Carrier Administration MS Railroad Association Gulf Regional Planning Commission MS State Fire Academy Memphis Metropolitan Planning Organization MS State Fire Marshall's Office MS Alcohol Safety Education Program (MASEP) MS Trucking Association MS Association of Supervisors Office of State Aid Road Construction MS Dept of Education Stennis Institute of Government
January 2019 20
MISSISSIPPI STRATEGIC HIGHWAY SAFETY PLAN Toward Zero Deaths
3.3 Stakeholders Meeting
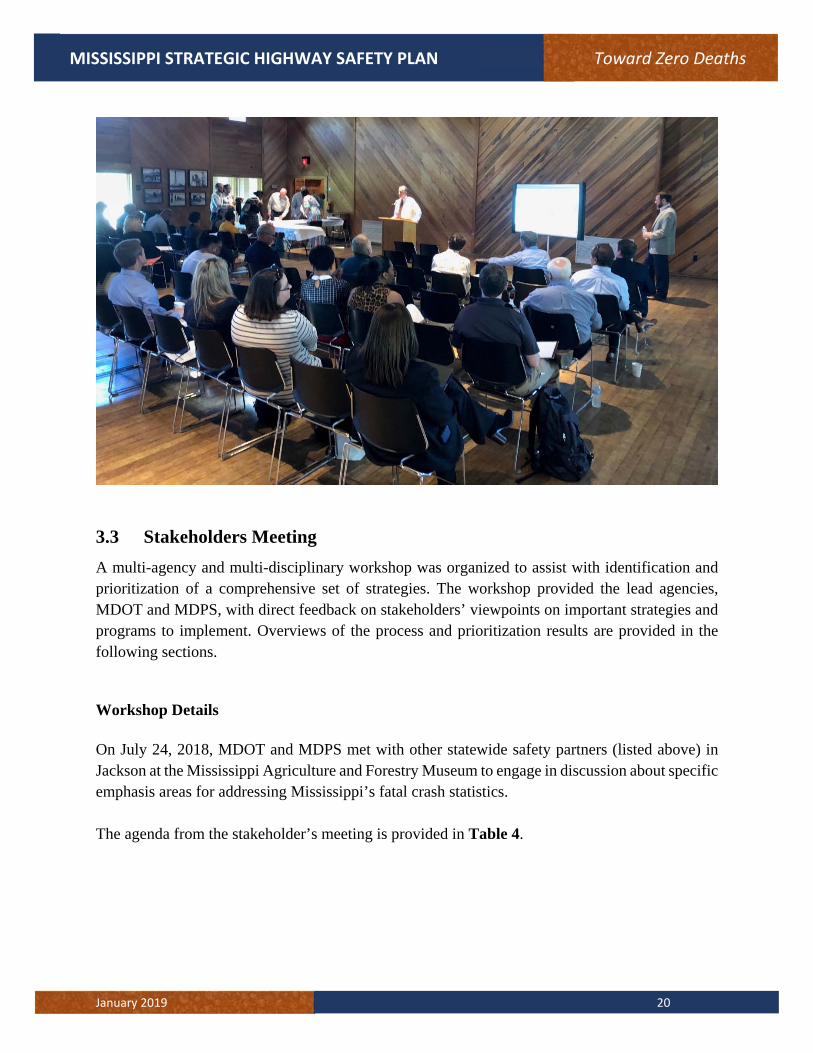
A multi-agency and multi-disciplinary workshop was organized to assist with identification and prioritization of a comprehensive set of strategies. The workshop provided the lead agencies, MDOT and MDPS, with direct feedback on stakeholders’ viewpoints on important strategies and programs to implement. Overviews of the process and prioritization results are provided in the following sections.
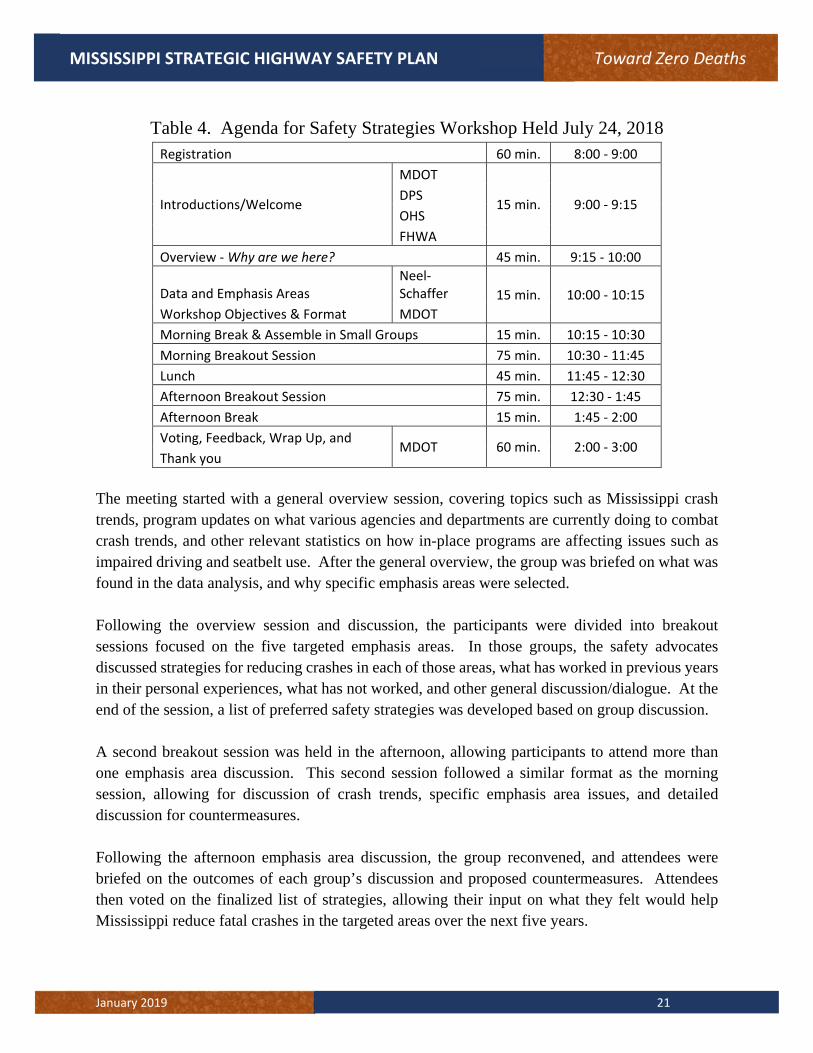
Workshop Details On July 24, 2018, MDOT and MDPS met with other statewide safety partners (listed above) in Jackson at the Mississippi Agriculture and Forestry Museum to engage in discussion about specific emphasis areas for addressing Mississippi’s fatal crash statistics. The agenda from the stakeholder’s meeting is provided in Table 4.
January 2019 21
MISSISSIPPI STRATEGIC HIGHWAY SAFETY PLAN Toward Zero Deaths
Table 4. Agenda for Safety Strategies Workshop Held July 24, 2018 Registration 60 min. 8:00 ‐ 9:00
Introductions/Welcome
MDOT
15 min. 9:00 ‐ 9:15 DPS
OHS
FHWA
Overview ‐ Why are we here? 45 min. 9:15 ‐ 10:00
Data and Emphasis Areas Neel‐Schaffer 15 min. 10:00 ‐ 10:15
Workshop Objectives & Format MDOT
Morning Break & Assemble in Small Groups 15 min. 10:15 ‐ 10:30
Morning Breakout Session 75 min. 10:30 ‐ 11:45
Lunch 45 min. 11:45 ‐ 12:30
Afternoon Breakout Session 75 min. 12:30 ‐ 1:45
Afternoon Break 15 min. 1:45 ‐ 2:00
Voting, Feedback, Wrap Up, and MDOT 60 min. 2:00 ‐ 3:00
Thank you
The meeting started with a general overview session, covering topics such as Mississippi crash trends, program updates on what various agencies and departments are currently doing to combat crash trends, and other relevant statistics on how in-place programs are affecting issues such as impaired driving and seatbelt use. After the general overview, the group was briefed on what was found in the data analysis, and why specific emphasis areas were selected. Following the overview session and discussion, the participants were divided into breakout sessions focused on the five targeted emphasis areas. In those groups, the safety advocates discussed strategies for reducing crashes in each of those areas, what has worked in previous years in their personal experiences, what has not worked, and other general discussion/dialogue. At the end of the session, a list of preferred safety strategies was developed based on group discussion. A second breakout session was held in the afternoon, allowing participants to attend more than one emphasis area discussion. This second session followed a similar format as the morning session, allowing for discussion of crash trends, specific emphasis area issues, and detailed discussion for countermeasures. Following the afternoon emphasis area discussion, the group reconvened, and attendees were briefed on the outcomes of each group’s discussion and proposed countermeasures. Attendees then voted on the finalized list of strategies, allowing their input on what they felt would help Mississippi reduce fatal crashes in the targeted areas over the next five years.

January 2019 22
MISSISSIPPI STRATEGIC HIGHWAY SAFETY PLAN Toward Zero Deaths
4.0 Priority Safety Strategies With the crash data analysis and stakeholders’ meeting complete, MDOT and MDPS staff evaluated and screened strategies from the initial and voted-on lists of strategies developed from the NCHRP Report 500 series and discussion among safety partners. The result of these efforts is a comprehensive list of strategies that the agencies feel will best serve the crash reduction efforts of statewide agencies involved in this process. The implementation of these high priority strategies will be the primary focus of safety investments throughout the life of this Plan and represent the greatest opportunity for the continued reduction of severe crashes on Mississippi roadways. The general process used to develop safety strategies is shown in Figure 5.
Figure 5. Mississippi's Safety Strategies

January 2019 23
MISSISSIPPI STRATEGIC HIGHWAY SAFETY PLAN Toward Zero Deaths
4.1 Strategies for Reducing Fatal Intersection Crashes
The greatest opportunity to reduce fatal and serious injury crashes at state and local roadway intersections are through geometric improvements, improvements to the intersection traffic control, enhancing the visibility of the intersection, and making low cost, systemic improvements. This plan identifies several strategies and countermeasures with quantifiable crash reduction benefits as outlined in the Crash Modification Factor (CMF) warehouse. These strategies should include, but not be limited to: Strategy 1 – Modify existing traffic control at an intersection In locations where crash severity and patterns warrant, installation of countermeasures such as roundabouts, Restricted Crossing U-turns (RCUTs, also known as J-Turns), and other innovative measures can be ideal in reducing fatal crashes. MDOT bases a majority of its project programming approach for intersections on FHWA’s list of proven safety countermeasures, of which roundabouts and RCUTs are two.
January 2019 24
MISSISSIPPI STRATEGIC HIGHWAY SAFETY PLAN Toward Zero Deaths
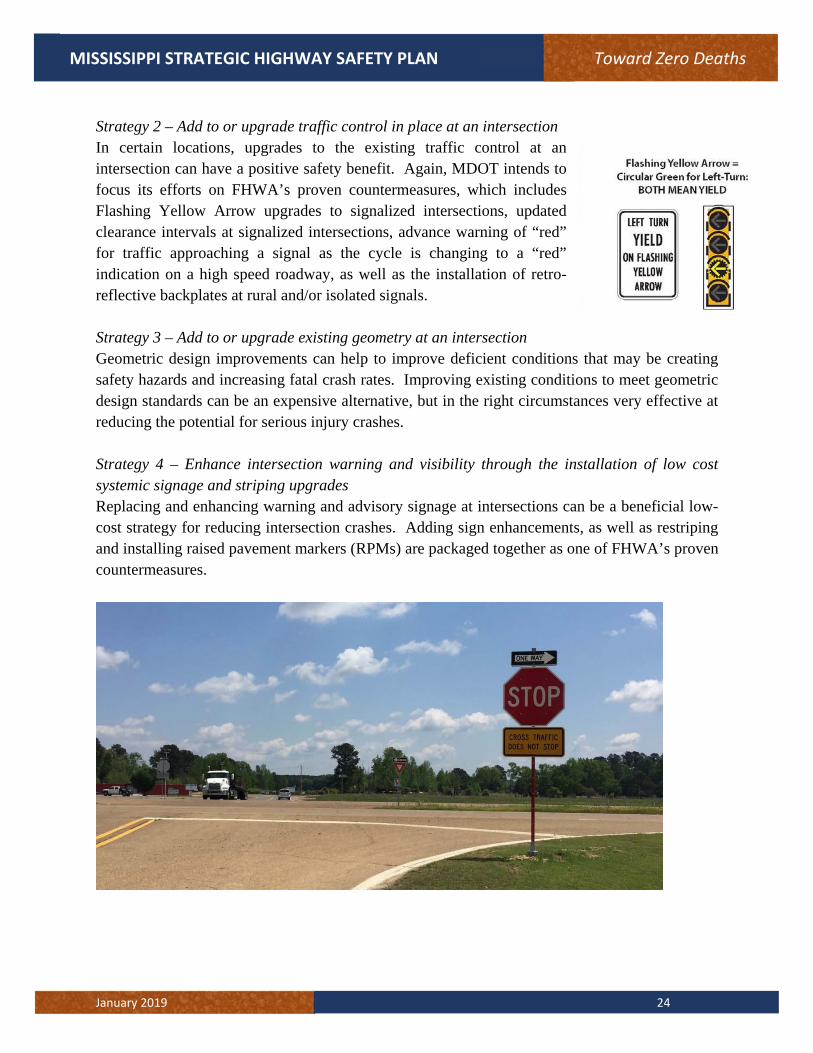
Strategy 2 – Add to or upgrade traffic control in place at an intersection In certain locations, upgrades to the existing traffic control at an intersection can have a positive safety benefit. Again, MDOT intends to focus its efforts on FHWA’s proven countermeasures, which includes Flashing Yellow Arrow upgrades to signalized intersections, updated clearance intervals at signalized intersections, advance warning of “red” for traffic approaching a signal as the cycle is changing to a “red” indication on a high speed roadway, as well as the installation of retro-reflective backplates at rural and/or isolated signals. Strategy 3 – Add to or upgrade existing geometry at an intersection Geometric design improvements can help to improve deficient conditions that may be creating safety hazards and increasing fatal crash rates. Improving existing conditions to meet geometric design standards can be an expensive alternative, but in the right circumstances very effective at reducing the potential for serious injury crashes. Strategy 4 – Enhance intersection warning and visibility through the installation of low cost systemic signage and striping upgrades Replacing and enhancing warning and advisory signage at intersections can be a beneficial low-cost strategy for reducing intersection crashes. Adding sign enhancements, as well as restriping and installing raised pavement markers (RPMs) are packaged together as one of FHWA’s proven countermeasures.
January 2019 25
MISSISSIPPI STRATEGIC HIGHWAY SAFETY PLAN Toward Zero Deaths
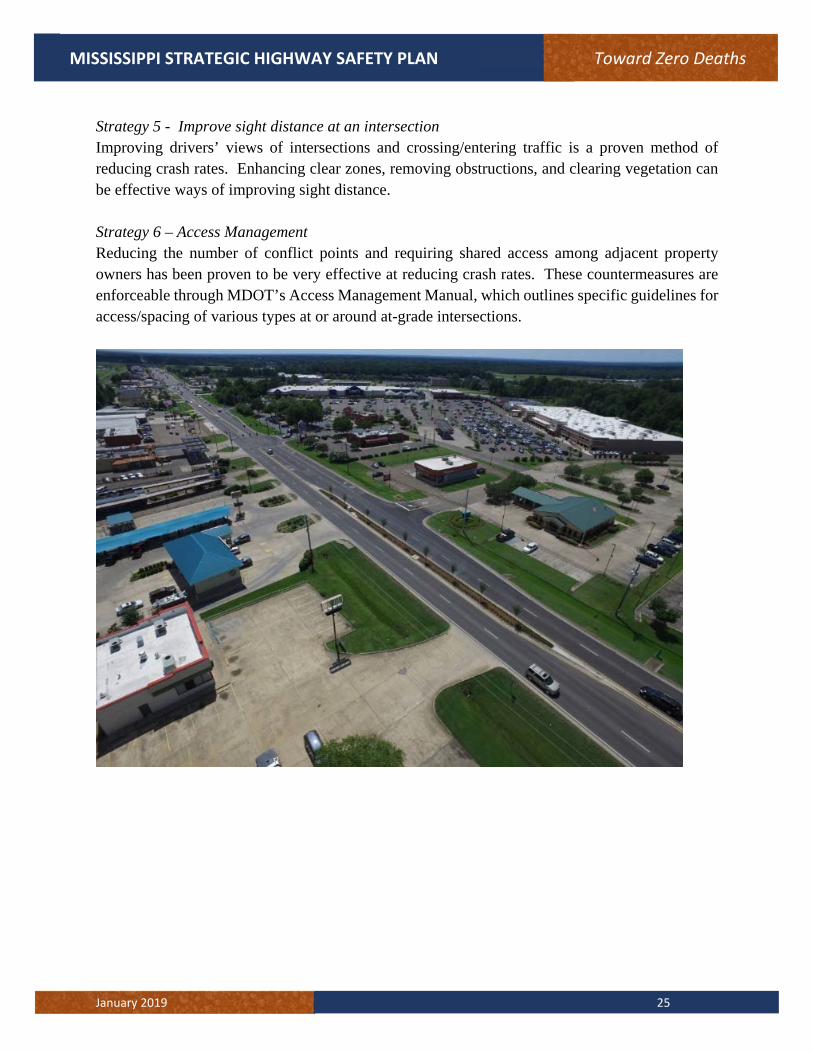
Strategy 5 - Improve sight distance at an intersection Improving drivers’ views of intersections and crossing/entering traffic is a proven method of reducing crash rates. Enhancing clear zones, removing obstructions, and clearing vegetation can be effective ways of improving sight distance. Strategy 6 – Access Management Reducing the number of conflict points and requiring shared access among adjacent property owners has been proven to be very effective at reducing crash rates. These countermeasures are enforceable through MDOT’s Access Management Manual, which outlines specific guidelines for access/spacing of various types at or around at-grade intersections.

January 2019 26
MISSISSIPPI STRATEGIC HIGHWAY SAFETY PLAN Toward Zero Deaths
Strategy 7 – Implement Local Road Safety Plans Local Road Safety Plans provide a framework for identifying, analyzing, and prioritizing roadway safety improvements on local roads. They are tailored to local issues and needs and help to prioritize issues, risks, actions and improvements. These plans have a proven track record of helping to reduce fatal and serious injury crashes on the local road network.
4.2 Strategies for Reducing Fatal Lane Departure Crashes
Lane departure crashes constitute the greatest area of need and potential for reduction on Mississippi’s roadways. This plan identifies several strategies and countermeasures with quantifiable crash reduction benefits as outlined in the Crash Modification Factor (CMF) warehouse. MDOT and other involved safety partners realize that the greatest opportunities to reduce crashes in the area include, but are not limited to, the following strategies: Strategy 1 – Installation of edge line rumble stripe or other delineation on rural roadways Rumble stripes are a proven cost-effective safety method to help reduce run-off-the-road crashes in rural areas to address the high percentage of fatal crashes resulting from vehicles leaving the roadway. All rural roads are candidates for edge line delineation to help reduce the single vehicle run-off-the-road crashes, particularly when resurfacing of these roads takes place. Strategy 2 – Installation of center line rumble strip/stripe or other delineation on rural roadways Centerline rumble strips/stripes are very cost effective and provide an audible warning to drivers helping to address lane departure crashes, the highest percentage of fatal crashes in Mississippi. This countermeasure has a proven track record of reducing lane departure crashes - particularly run-off-the-road left, head-on, and sideswipe crashes, and thus reducing fatalities on roadways where this countermeasure has been implemented.

January 2019 27
MISSISSIPPI STRATEGIC HIGHWAY SAFETY PLAN Toward Zero Deaths
Strategy 3 – Install low cost measures including striping, signing and raised pavement markers on roadways Improved lane markings, roadway signing and reflective raised pavement markers are a low cost method to improve the visibility and roadway alignment of roadways, particularly in rural areas where the majority of fatal crashes are occurring in Mississippi. Many of the crashes are single-vehicle crashes, and providing a more defined, visible roadway is proven to reduce fatal crashes. Signing/striping improvements are some of the most cost-effective methods to reduce fatal crashes on roadways.
Strategy 4 – Improve roadway geometry Improving roadway geometrics can be one of the more expensive alternates for reducing fatal crashes, but also can be the most effective by eliminating or correcting geometrically deficient alignments/intersections, thus removing (or significantly reducing) the hazard. Improving roadway geometrics is recommended when other more cost-effective methods have not been successful in addressing the safety deficiencies. In areas where low cost, systemic improvements or edge line delineation have not proven effective, it may become necessary to consider the realignment of severe curves on specific roadways. Because of the time and cost to implement this countermeasure, this strategy is recommended to be pursued after other strategies on the list have been tried.
January 2019 28
MISSISSIPPI STRATEGIC HIGHWAY SAFETY PLAN Toward Zero Deaths
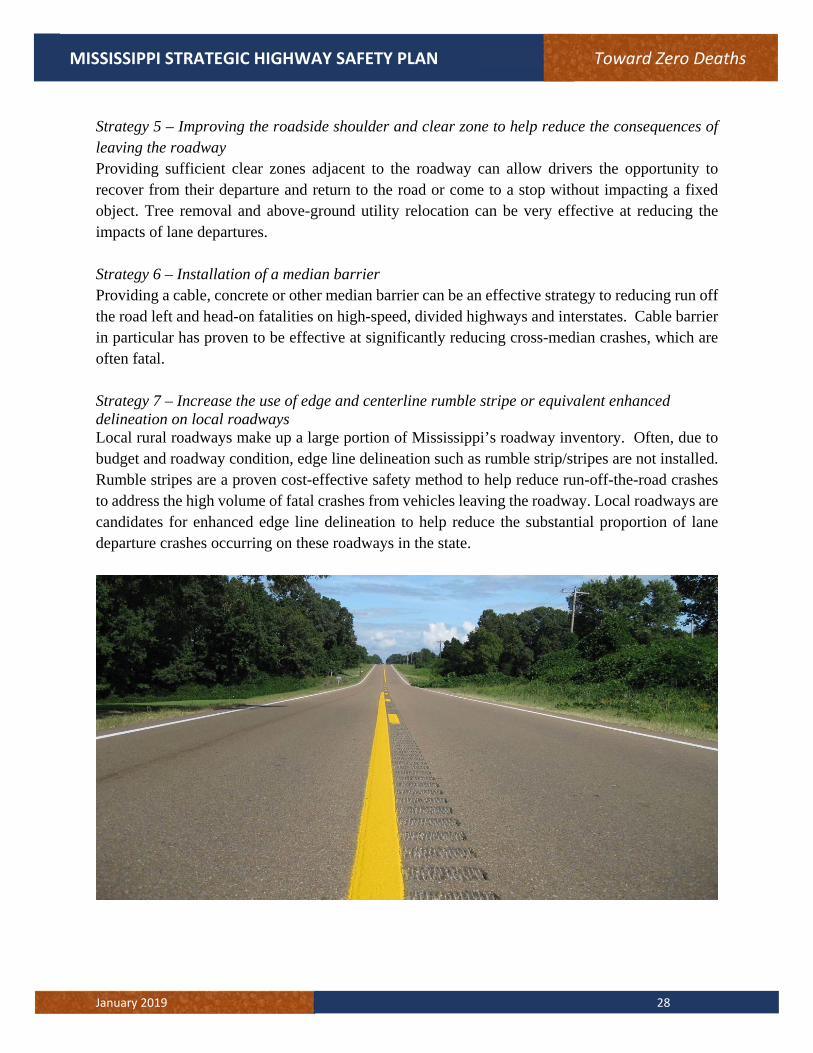
Strategy 5 – Improving the roadside shoulder and clear zone to help reduce the consequences of leaving the roadway Providing sufficient clear zones adjacent to the roadway can allow drivers the opportunity to recover from their departure and return to the road or come to a stop without impacting a fixed object. Tree removal and above-ground utility relocation can be very effective at reducing the impacts of lane departures. Strategy 6 – Installation of a median barrier Providing a cable, concrete or other median barrier can be an effective strategy to reducing run off the road left and head-on fatalities on high-speed, divided highways and interstates. Cable barrier in particular has proven to be effective at significantly reducing cross-median crashes, which are often fatal. Strategy 7 – Increase the use of edge and centerline rumble stripe or equivalent enhanced delineation on local roadways Local rural roadways make up a large portion of Mississippi’s roadway inventory. Often, due to budget and roadway condition, edge line delineation such as rumble strip/stripes are not installed. Rumble stripes are a proven cost-effective safety method to help reduce run-off-the-road crashes to address the high volume of fatal crashes from vehicles leaving the roadway. Local roadways are candidates for enhanced edge line delineation to help reduce the substantial proportion of lane departure crashes occurring on these roadways in the state.

January 2019 29
MISSISSIPPI STRATEGIC HIGHWAY SAFETY PLAN Toward Zero Deaths
Strategy 8 – Improve Roadway Friction As roadways’ pavements age, areas of polishing can begin to contribute to lane departure crashes, particularly in curves and/or during wet weather. High Friction Surface Treatment (HFST) and other specialty pavement treatments are effective at reducing and sometimes eliminating completely, the targeted crash types. Strategy 9 – Implement local road safety plans Local Road Safety Plans provide a framework for identifying, analyzing, and prioritizing roadway safety improvements on local roads. They are tailored to local issues and needs and help to prioritize issues, risks, actions and improvements. These plans have a proven track record of helping to reduce fatal and serious injury crashes on the local road network.
4.3 Strategies for Reducing the Number of Unbelted Vehicle Occupant Fatalities
Strategy 1 - Statewide Child Passenger Safety (CPS) Coordination Program: Provide a comprehensive Statewide CPS Coordination program; Conduct CPS Surveys; Fund the Mississippi Department of Health to provide child passenger seats; Provide funding for law enforcement programs to conduct specific High-Visibility Enforcement (HVE) seat belt and child passenger seat enforcement checkpoints and saturation patrols; and assign MOHS staff to manage enforcement and outreach grants, promote seatbelt safety, and provide assistance where needed for the Occupant Protection (OP) Program. Strategy 2 - Child Passenger Seat Technician Training Child Passenger Seat Technician Training will provide training to certify technicians on how to properly install child passenger seats. The training will help explain the use and effectiveness of properly installed child safety seats and provide certifications for technicians. MOHS will plan to:
Increase training opportunities and retention of child passenger safety (CPS) technicians and instructors;
Continue to provide assistance to Safe Kids Mississippi to provide training opportunities to individuals and agencies allowing for Child Passenger Safety Seat Technician certification;
Provide the NHTSA approved CPS training for law enforcement to build the base for Child Passenger Safety Seat Technicians in the State;
Increase the number of Emergency Medical service and Fire Department personnel who are CPS fitting stations; and
Increase the number of CPS checkpoint locations across Mississippi and in target areas identified with low child safety seat usage rates.
January 2019 30
MISSISSIPPI STRATEGIC HIGHWAY SAFETY PLAN Toward Zero Deaths
Strategy 3 - Child Passenger Seat Enforcement Increase proper use of CPS in motor vehicles; Increase CPS checkpoint locations throughout the State; Conduct pre and post seatbelt surveys; Fund law enforcement programs for day and night enforcement; Assign MOHS staff to manage OP enforcement and outreach grants; Promote seatbelt safety through MDOT’s Survive Your Drive Safety Program; Promote seatbelt safety through earned and paid media; and provide technical assistance when needed for the OP Program. Strategy 4 - Public Information and Education Improve education on new and/or updated laws related to OP and Child Restraints; supply services through the Law Enforcement Liaison (LEL) Program; and provide information through MAHSL (Mississippi Association of Highway Safety Leaders) Meetings and special MOHS Task Forces; Provide educational activities and information through MDOT’s Survive Your Drive Safety Education Program. Strategy 5 - Teen Driver Seatbelt Program Develop and promote a statewide education and media campaign that will focus on teen seatbelt use and increasing seatbelt usage rates among teens. Provide public information and education programs with an emphasis in teen occupant protection, and fund law enforcement programs to focus on teen seatbelt use. Strategy 6 – High Visibility Enforcement Support sustained HVE of occupant protection laws, which includes supporting the National OP Enforcement Campaign, Click It or Ticket (CIOT). Provide public information and education programs with an emphasis in occupant protection. Develop and promote a comprehensive media campaign for the CIOT mobilization and develop and promote a comprehensive media campaign for a night-time enforcement mobilization.
4.4 Strategies for Reducing Impaired Driving Fatalities Strategy 1 - Selective Traffic Enforcement Programs (STEP) Fund Impaired Driving checkpoints and/or saturation patrols; ID project agencies within a high-risk location to plan to conduct at least one special ID enforcement operation per month; and Distribute National Impaired Driving Campaign Blitz information/reporting packets. Each project will generate earned media and will plan to use the earned media before, during and after scheduled high visibility enforcement efforts conducted during the National Impaired Driving Blitz Campaigns and State holiday campaigns.
January 2019 31
MISSISSIPPI STRATEGIC HIGHWAY SAFETY PLAN Toward Zero Deaths
Strategy 2 - High Visibility Enforcement (HVE) Implement activities in support of national highway safety targets to reduce fatal and serious injury crashes. All programs are required to complete the HVE compliance form in the grant agreement, which defines the mobilization and sustained enforcement activities; Enforcement agencies will be advised to ensure the checkpoint has maximum visibility from each direction and has sufficient illumination to function safely during night inspection along with the use of reflective vest (use of vest outlined by MDOT); Enforcement efforts from county, local law enforcement and the MHP are planned to be concentrated in areas that have been identified as high driving fatality and severe injury crash locations in Mississippi; Seek to expand in the areas of enforcement, training, public awareness and community outreach, etc., in an effort to address impaired highway safety issues. Fund special wave grants for law enforcement. Strategy 3 - National Blitz Participate in the National Blitz campaign; Distribute public information and education materials; Fund enforcement to multiple agencies (checkpoints/saturation patrols); Fund full time DUI Officers; Fund STEP HVE activities; Issue press releases and participate in earned media; and Fund paid media. Strategy 4 - Training Continue funding the MOHS Law Enforcement (LE) Training Program; Provide classes free of cost for law enforcement; and provide technical support for law enforcement agencies through statewide LEL and LEL coordinators. Strategy 5 - Evaluation MOHS will evaluate the programs to see that projects that are funded are having the desired effect on the Statewide ID program; Evaluate grant funded impaired driving activities; review monthly cost and activity reports; review progress reports; conduct in-house and on-site monitoring; and review surveys and analysis of data collected.
Strategy 6 - DUI-(TSRP) Judicial Training; DUI Outreach/Court Monitoring; continue funding a Traffic Safety Resource Prosecutor (TSRP) to assist with training for prosecutors and law enforcement; work in conjunction with other ID programs; and address the decline in impaired driving (DUI) conviction rates throughout the State.
Strategy 7 - Public Information and Enforcement Implement educational ID programs aimed at reducing the number of impaired drivers under the age of 21, to include parent education; continue funding and support for MDOT’s Survive Your Drive Safety Education program, which teaches the consequences of impaired driving through

January 2019 32
MISSISSIPPI STRATEGIC HIGHWAY SAFETY PLAN Toward Zero Deaths
interactive experiences; continue supporting youth ID programs across the State, with a focus in youth, teens and young adults; continue funding and support MOHS youth programs to reach youth through peer to peer education and programs across the State; continue to support high school, college and university youth programs to reach youth through peer to peer education; fund and conduct internal and external education programs; and provide driver education materials and information.
Strategy 8 - Education Improve education on new and/or updated laws related to alcohol/drug impaired driving; supply services through the LEL Program and Traffic Safety Resource Prosecutor Program; provide information through Mississippi Association of Highway Safety Leaders (MAHSL) meetings and special MOHS Task Forces; provide education and information on impaired driving through MDOT’s Survive Your Drive Safety Education Program; enforce Underage Drinking Laws through enforcement and education; and provide Prosecutorial and Judicial Training through the following programs: TSRP Conferences
Judicial College; and Mississippi Alcohol Safety Education Program (MASEP).

January 2019 33
MISSISSIPPI STRATEGIC HIGHWAY SAFETY PLAN Toward Zero Deaths
4.5 Strategies for Reducing Unlicensed, Suspended, or Revoked (USR) License Drivers
Strategy 1 – Apply Special Enforcement Practices/Increased Enforcement in Selected Areas Identify areas with high levels of USR drivers and provide license check points with officers to help keep offenders off the public roadway system. Strategy 2 – Equalize Penalty & Improve Tracking for USR driving Many drivers choose not to be licensed since fines/penalties for unlicensed driving are less in Mississippi if the driver has never been licensed. The tracking of offenders is also more difficult for offenders who have never been licensed, as there is no record in the system to attach/track penalties or traffic tickets. Developing a tracking system for unlicensed (never licensed) drivers would help to attach penalties to the offender’s driving record to identify repeat offenses/crimes. Increasing the fines/penalties for drivers who have never been licensed could be an incentive to get these unlicensed (never licensed) drivers licensed. Strategy 3 – Ignition Interlock Device While ignition interlock devices are commonly used in DUI offences/penalties, technology could provide a system where a valid driver’s license would be required to start/operate a motor vehicle on the public road system. While we are not aware of a system currently in place that would provide such a service, the potential for a digital system that would implement a driver’s license restriction is not outside of the realm of possibility in this digital age.

January 2019 34
MISSISSIPPI STRATEGIC HIGHWAY SAFETY PLAN Toward Zero Deaths
Appendix

Mississippi Strategic Highway Safety Plan
JULY 24, 2018
Fatal Crashes Involving Unbelted Vehicle Occupants MISSISSIPPI STRATEGIC HIGHWAY SAFETY PLAN
582 613 607 677 690
302 295 285 313 302
0
100
200
300
400
500
600
700
800
2012 2013 2014 2015 2016
Mississippi Traffic FatalitiesStatewide and Unbelted Occupants
Statewide unbelted
Statewide, Mississippi had 3,169 fatalities from 2012-2016, with 1,497 of these (47%) unbelted.
What are the Contributing Factors?
The Vehicle Occupant Men were 71% (1,068 of 1,497) of unbelted
vehicle occupant fatalities.
Age Group Male Female
< 13 27 (2%) 25 (2%)
14 – 20 138 (9%) 65 (4%)
21 – 25 156 (10%) 42 (3%)
26 – 35 204 (14%) 85 (6%)
36 – 45 161 (11%) 74 (5%)
46 – 55 167 (11%) 57 (4%)
56 – 65 112 (7%) 40 (3%)
66+ 103 (7%) 41 (3%)
Gender Totals 1,068 429
528 (35%) of the unbelted vehicle occupants that were killed were totally ejected during the crash-359 male/169 female.
114 (8%) of the unbelted vehicle occupants that were killed were partially ejected during the crash-91 male/23 female.
The Driver Men were drivers in 77% of unbelted fatal
crash. The largest age group for men drivers was 26-35, at 20%.
Crash Type 69.4% (1,039 of 1,497) of unbelted fatalities
occurred during a single vehicle crash. Head-on crashes were the second most frequent crash type and accounted for 11% (163 of 1,497) of fatalities.
Crash Type Fatalities Percentage
Single Vehicle 1,039 69.4%
Head-On & Side-swipe (Opp)
195 13%
Angle 126 8.4%
Rear End & Side-swipe (Same)
92 6%
Other/Unknown 45 3%
Facility Type Of all jurisdictions, local roads accounted for
the greatest number of unbelted fatalities (588 of 1,497; 39%).
Jurisdiction Classification Fatalities %
Interstates 133 9%
US Highway 319 21%
State Highways 457 31%
Local Roads 588 39%
Total by Area Type 1,497 100%
The posted speed limit was 45 mph or higher for 78% of the unbelted fatalities.
Posted Speed Limit Fatalities Percentage
45 mph 281 19% 55 mph 541 36% 65 mph 209 14% 70 mph 141 9%
For interstate crashes, unbelted represented 44% of all interstate fatalities.
A1

Strategies for Preventing or Reducing Unbelted/No Occupant Restraint Fatal Crashes
PAGE 2
Objectives and Strategies for Resolving the Problem Three objectives were identified for the occupant restraint area:
1. Initiate programs to maximize use of occupant restraints by all vehicle occupants 2. Insure that child and infant restraints are properly used 3. Provide access to appropriate information, materials, and guidelines for those imple-
menting programs to increase occupant restraint use
The intent of these objectives is to enable primarily local and regional entities, but also entire states, to implement programs to increase use of restraints and to ensure that those systems are properly used. Targeted programs to increase restraint usage have been proven effective. Local-ities in some states have implemented programs that have increased local restraint use by 20 to 30 percentage points over statewide averages at the start of their program. Entire states have also implemented programs that have increased use substantially. The combination of enforcement and public information campaigns appears to be the key to achieving meaningful, lasting increases in restraint usage. Studies by the Insurance Institute for Highway Safety (IIHS) (Insurance Institute for Highway Safety, 2001) show that public educa-tion efforts alone, without an enforcement component, are generally not successful. Maximize Use of Occupant Restraints by All Vehicle Occupants
o Conduct highly publicized enforcement campaigns to maximize restraint use o Provide enhanced public education to population groups with lower than average re-
straint use rates o Encourage the enactment of local laws that will permit standard enforcement of restraint
laws Insure that Restraints, Especially Child and Infant Restraints, are Properly Used
o Provide community locations for the instruction in proper child restraint use, including both public safety agencies and health care providers, that are almost always available
o Conduct high-profile “child restraint inspection” events at multiple community locations o Train law enforcement personnel to check for proper child restraint use in all motorist
encounters Provide Access to Appropriate Information Materials and Guidelines for those Implement-
ing Programs to Increase Occupant Use o Create state-level clearing houses for materials that offer guidance in implementing pro-
grams to increase restraint use Source: NCHRP, 500: A Guide for Increasing Seatbelt Use
A2

Mississippi Strategic Highway Safety Plan
JULY 24, 2018
Fatal Lane Departure Crashes MISSISSIPPI STRATEGIC HIGHWAY SAFETY PLAN
582613 607
677 690
409 417363
440 439
50 56 5494 95
329 324276
314 328
0
100
200
300
400
500
600
700
800
2012 2013 2014 2015 2016
Mississippi Traffic FatalitiesStatewide, Lane Departure, Head‐on, and SVROR
Statewide Lane Departure Head on SVROR
Statewide, Mississippi had 3,169 fatalities from 2012-2016. Lane departure crash fatalities totaled 2,068 (65%) of the statewide total.
What are the Contributing Factors?
Road and Area Type Combining rural and urban roadways, local
roads accounted for the greatest number of lane departure fatalities (41%). The jurisdic-tion with the second highest number of lane departure fatalities was State Highways with 33%.
Jurisdiction Classification Fatalities %
Interstates 217 10% US Highway 329 16% State Highways 676 33% Local Roads/Other 846 41%
Total by Area Type 2,068 100%
All together, 82% (1,693 of 2,068) of fatalities occurred on roadways with a posted speed limit of 45 mph or greater. The top three are:
Posted Speed Limit
Fatalities Percentage
45 mph 393 19% 55 mph 810 39% 65 mph 218 11%
Location 1,693 fatalities (82%) were on roadways with a
posted speed limit of at least 45 mph.
80% (1,660 of 2,068) of lane departure fatalities occurred on 2-lane roadways, with another 18% (375 of 2,068) on 4-lane roadways.
26% (552 of 2,068) of lane departure fatalities occurred on segments of road reported as “curved.”
Contributing Factors 60% (1,237 of 2,068) of the vehicle occupant
fatalities in lane departure crashes were not us-ing safety belts. By gender, 61% of males and 56% of females killed were unbelted.
52% of lane departure fatalities were during daylight conditions and 44% during dark driv-ing conditions.
The Driver There were 1,631 drivers involved in a fatal
lane departure crash. Of these, approximately 76% were male.
The highest age group represented was 26-35 year old drivers at 19%.
11% of drivers involved in a fatal lane depar-ture crash were under the age of 21.
Age Group Male Female Total
< 20 10% 13% 11%
21 – 25 13% 11% 12%
26 – 35 19% 18% 19%
36 – 45 15% 16% 15%
46 – 55 18% 19% 18%
56 – 65 15% 12% 14%
66+ 11% 9% 11%
A3
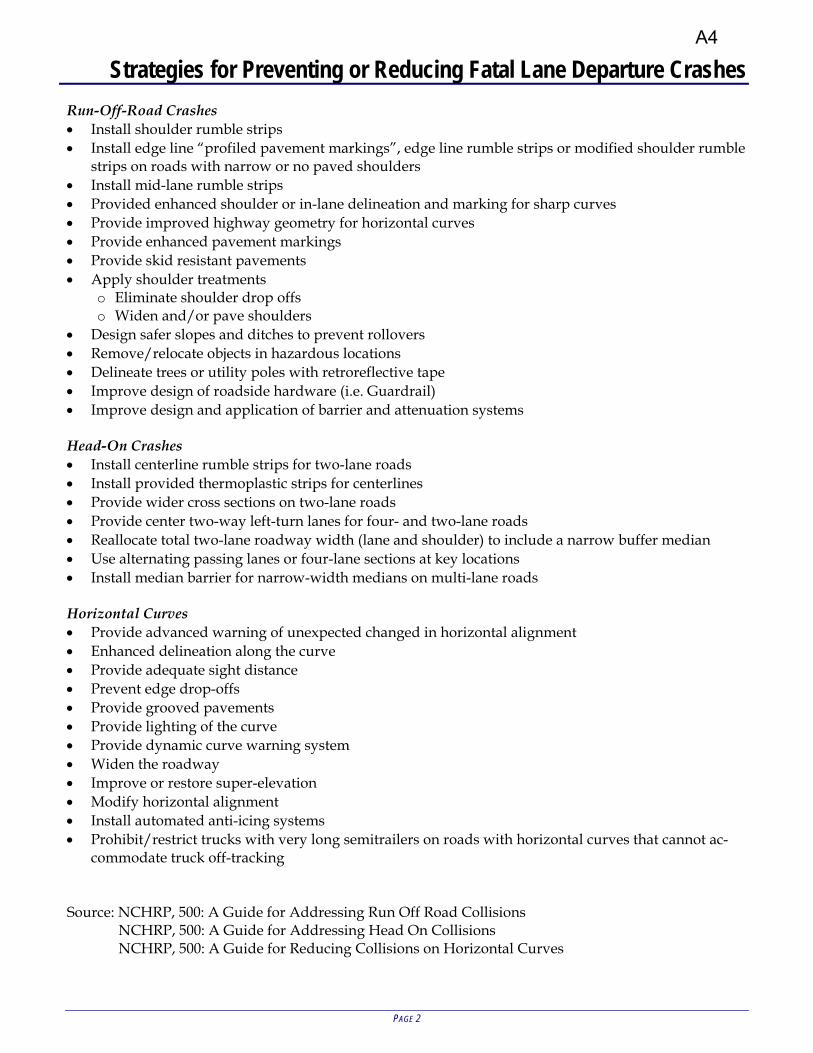
Strategies for Preventing or Reducing Fatal Lane Departure Crashes
PAGE 2
Run-Off-Road Crashes Install shoulder rumble strips Install edge line “profiled pavement markings”, edge line rumble strips or modified shoulder rumble
strips on roads with narrow or no paved shoulders Install mid-lane rumble strips Provided enhanced shoulder or in-lane delineation and marking for sharp curves Provide improved highway geometry for horizontal curves Provide enhanced pavement markings Provide skid resistant pavements Apply shoulder treatments
o Eliminate shoulder drop offs o Widen and/or pave shoulders
Design safer slopes and ditches to prevent rollovers Remove/relocate objects in hazardous locations Delineate trees or utility poles with retroreflective tape Improve design of roadside hardware (i.e. Guardrail) Improve design and application of barrier and attenuation systems Head-On Crashes Install centerline rumble strips for two-lane roads Install provided thermoplastic strips for centerlines Provide wider cross sections on two-lane roads Provide center two-way left-turn lanes for four- and two-lane roads Reallocate total two-lane roadway width (lane and shoulder) to include a narrow buffer median Use alternating passing lanes or four-lane sections at key locations Install median barrier for narrow-width medians on multi-lane roads Horizontal Curves Provide advanced warning of unexpected changed in horizontal alignment Enhanced delineation along the curve Provide adequate sight distance Prevent edge drop-offs Provide grooved pavements Provide lighting of the curve Provide dynamic curve warning system Widen the roadway Improve or restore super-elevation Modify horizontal alignment Install automated anti-icing systems Prohibit/restrict trucks with very long semitrailers on roads with horizontal curves that cannot ac-
commodate truck off-tracking Source: NCHRP, 500: A Guide for Addressing Run Off Road Collisions NCHRP, 500: A Guide for Addressing Head On Collisions NCHRP, 500: A Guide for Reducing Collisions on Horizontal Curves
A4

Mississippi Strategic Highway Safety Plan
JULY 24, 2018
Fatal Crashes Involving Unlicensed/Suspended/Revoked Drivers MISSISSIPPI STRATEGIC HIGHWAY SAFETY PLAN
582 613 607
677 690
89 68
151 146 147
0
100
200
300
400
500
600
700
800
2012 2013 2014 2015 2016
Mississippi Traffic FatalitiesStatewide & Unlicensed Drivers
Statewide Unlicensed/Suspended/Revoked
Statewide, Mississippi had 3,169 fatalities from 2012-2016. Unlicensed drivers, or drivers with a suspended license or a revoked or restricted (U/S/R) driver’s license accounted for 601 (19%) of the statewide total fatalities.
What are the Contributing Factors? Age/Gender/Seat Belt Usage There were 601 fatalities involved with U/S/R
driving. Of these, 443 (74%) were male and 158 (26%) were female.
Age Group Male Female
< 13 19 (4%) 12 (8%)
14 – 20 41 (9%) 24 (15%)
21 – 25 71 (10%) 22 (3%)
26 – 35 109 (14%) 41 (6%)
36 – 45 75 (11%) 31 (5%)
46 – 55 74 (11%) 14 (4%)
56 – 65 36 (7%) 5 (3%)
66+ 18 (7%) 9 (3%)
Gender Totals 443(74%) 158 (26%)
There were 348 male U/S/R drivers (81%)/82 female U/S/R drivers (19%) killed, along with 95 male passengers and 76 female passengers.
Of the people involved in fatal crashes with U/S/R drivers, 404 (67%) were not wearing seat belts. Of these, males represented 76% of the unbelted fatalities.
Data reveals that 126 (21%) of U/S/R driver crashes were speed related and 36% of the oc-cupants in these crashes were totally or partially ejected from the vehicle.
Road and Area Type Combining rural and urban roadways, local
roads accounted for 43% of the fatalities. The jurisdiction with the second highest number of fatalities was State Highways with 27%.
Jurisdiction Classification
Fatalities %
Interstates 61 10% US Highway 118 20% State Highways 164 27% Local Roads 258 43%
Total by Area Type 601 100%
Altogether, 79% (472 of 601) of fatalities oc-curred on roadways with a posted speed limit of 45 mph or greater. The top three are:
Posted Speed Limit Fatalities Percentage
45 mph 116 19% 55 mph 204 34% 65 mph 62 10%
Crash Type Lane Departure crashes accounted for the
greatest number of fatalities for U/S/R drivers (472 out of 601, or 79%).
Single vehicle crashes accounted for 65% (389 fatalities out of 601). Head-on & sideswipe (opposite) crashes accounted for 17% (79 of 601) of fatalities.
Crash Type Fatalities Percentage
Single Vehicle 389 65%
Head-On & Side-swipe (Opposite)
79 13%
Angle 69 11%
Rear End & Side-swipe (Same)
39 6%
A5
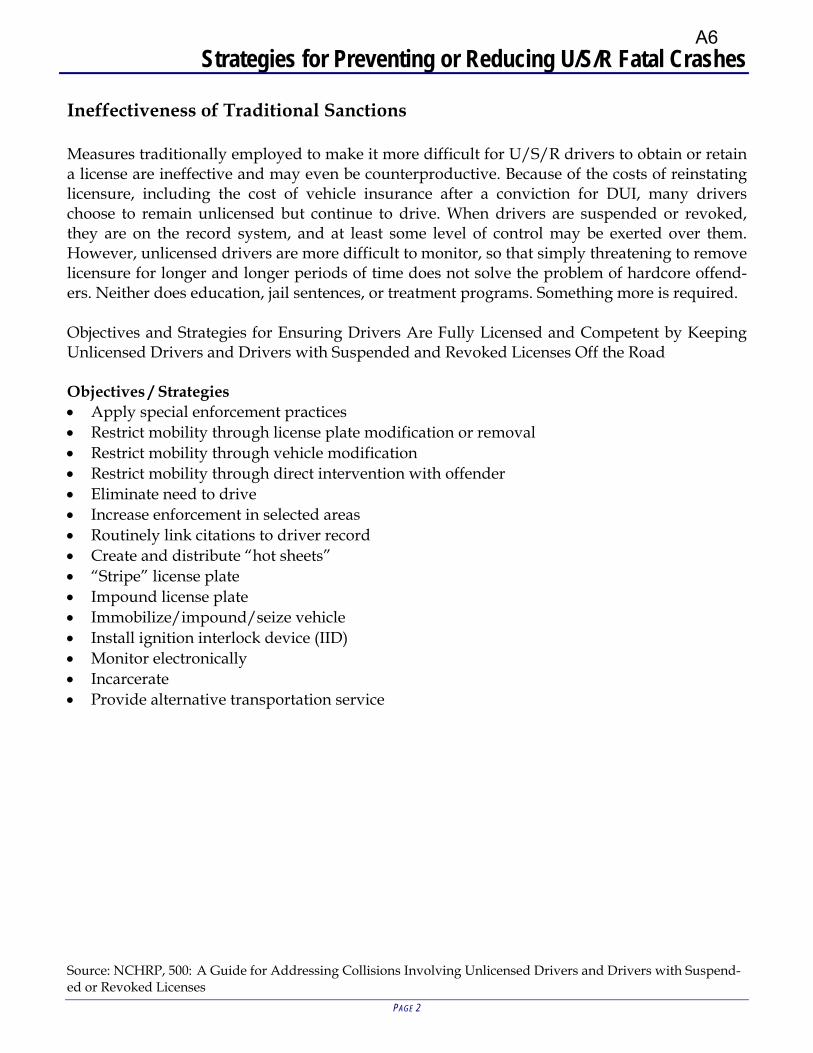
Strategies for Preventing or Reducing U/S/R Fatal Crashes
PAGE 2
Ineffectiveness of Traditional Sanctions Measures traditionally employed to make it more difficult for U/S/R drivers to obtain or retain a license are ineffective and may even be counterproductive. Because of the costs of reinstating licensure, including the cost of vehicle insurance after a conviction for DUI, many drivers choose to remain unlicensed but continue to drive. When drivers are suspended or revoked, they are on the record system, and at least some level of control may be exerted over them. However, unlicensed drivers are more difficult to monitor, so that simply threatening to remove licensure for longer and longer periods of time does not solve the problem of hardcore offend-ers. Neither does education, jail sentences, or treatment programs. Something more is required. Objectives and Strategies for Ensuring Drivers Are Fully Licensed and Competent by Keeping Unlicensed Drivers and Drivers with Suspended and Revoked Licenses Off the Road Objectives / Strategies Apply special enforcement practices Restrict mobility through license plate modification or removal Restrict mobility through vehicle modification Restrict mobility through direct intervention with offender Eliminate need to drive Increase enforcement in selected areas Routinely link citations to driver record Create and distribute “hot sheets” “Stripe” license plate Impound license plate Immobilize/impound/seize vehicle Install ignition interlock device (IID) Monitor electronically Incarcerate Provide alternative transportation service
Source: NCHRP, 500: A Guide for Addressing Collisions Involving Unlicensed Drivers and Drivers with Suspend-ed or Revoked Licenses
A6
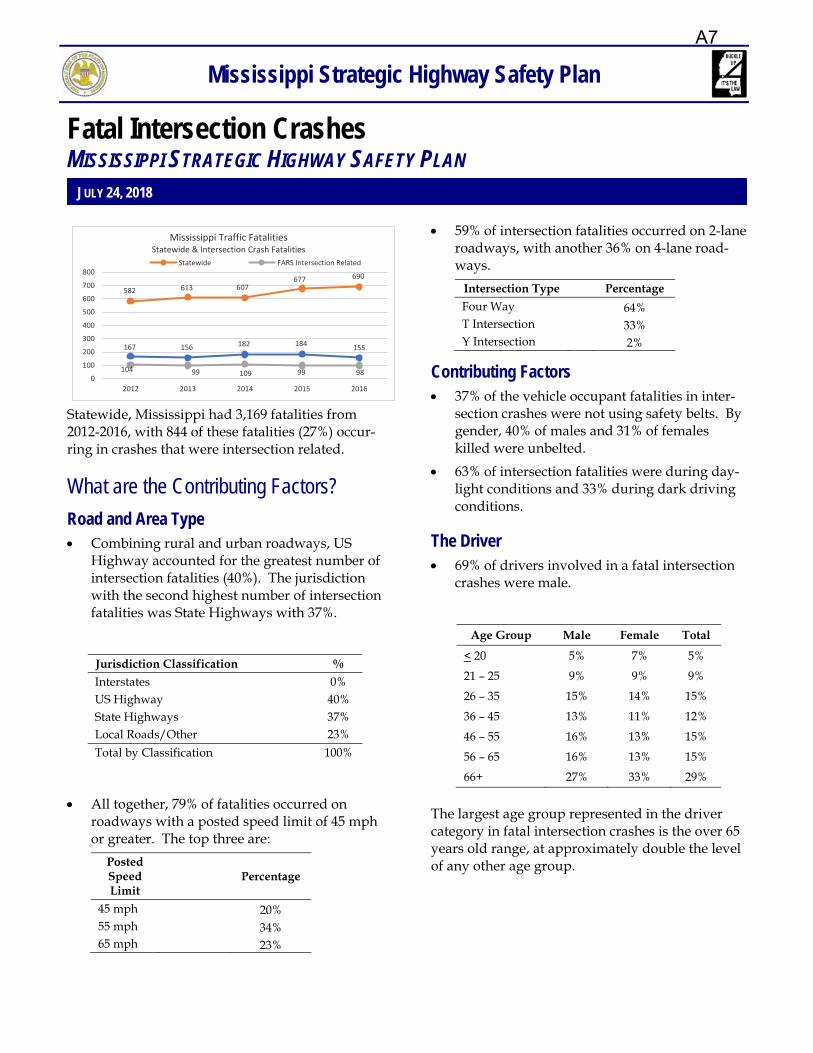
Mississippi Strategic Highway Safety Plan
JULY 24, 2018
Fatal Intersection Crashes MISSISSIPPI STRATEGIC HIGHWAY SAFETY PLAN
582 613 607677 690
104 99 109 99 98
167 156 182 184155
0
100
200
300
400
500
600
700
800
2012 2013 2014 2015 2016
Mississippi Traffic FatalitiesStatewide & Intersection Crash Fatalities
Statewide FARS Intersection Related
Statewide, Mississippi had 3,169 fatalities from 2012-2016, with 844 of these fatalities (27%) occur-ring in crashes that were intersection related.
What are the Contributing Factors?
Road and Area Type Combining rural and urban roadways, US
Highway accounted for the greatest number of intersection fatalities (40%). The jurisdiction with the second highest number of intersection fatalities was State Highways with 37%.
Jurisdiction Classification % Interstates 0% US Highway 40% State Highways 37% Local Roads/Other 23%
Total by Classification 100%
All together, 79% of fatalities occurred on roadways with a posted speed limit of 45 mph or greater. The top three are:
Posted Speed Limit
Percentage
45 mph 20% 55 mph 34% 65 mph 23%
59% of intersection fatalities occurred on 2-lane roadways, with another 36% on 4-lane road-ways.
Intersection Type Percentage Four Way 64% T Intersection 33% Y Intersection 2%
Contributing Factors 37% of the vehicle occupant fatalities in inter-
section crashes were not using safety belts. By gender, 40% of males and 31% of females killed were unbelted.
63% of intersection fatalities were during day-light conditions and 33% during dark driving conditions.
The Driver 69% of drivers involved in a fatal intersection
crashes were male.
Age Group Male Female Total
< 20 5% 7% 5%
21 – 25 9% 9% 9%
26 – 35 15% 14% 15%
36 – 45 13% 11% 12%
46 – 55 16% 13% 15%
56 – 65 16% 13% 15%
66+ 27% 33% 29%
The largest age group represented in the driver category in fatal intersection crashes is the over 65 years old range, at approximately double the level of any other age group.
A7
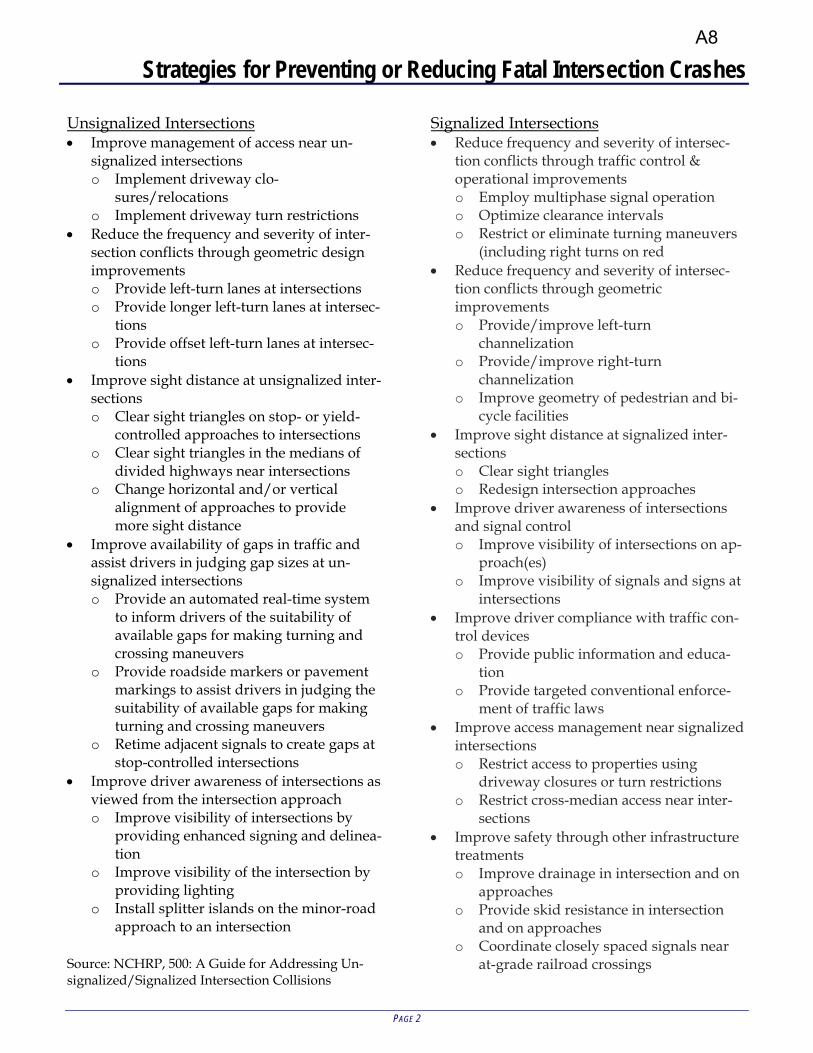
Strategies for Preventing or Reducing Fatal Intersection Crashes
PAGE 2
Unsignalized Intersections Improve management of access near un-
signalized intersections o Implement driveway clo-
sures/relocations o Implement driveway turn restrictions
Reduce the frequency and severity of inter-section conflicts through geometric design improvements o Provide left-turn lanes at intersections o Provide longer left-turn lanes at intersec-
tions o Provide offset left-turn lanes at intersec-
tions Improve sight distance at unsignalized inter-
sections o Clear sight triangles on stop- or yield-
controlled approaches to intersections o Clear sight triangles in the medians of
divided highways near intersections o Change horizontal and/or vertical
alignment of approaches to provide more sight distance
Improve availability of gaps in traffic and assist drivers in judging gap sizes at un-signalized intersections o Provide an automated real-time system
to inform drivers of the suitability of available gaps for making turning and crossing maneuvers
o Provide roadside markers or pavement markings to assist drivers in judging the suitability of available gaps for making turning and crossing maneuvers
o Retime adjacent signals to create gaps at stop-controlled intersections
Improve driver awareness of intersections as viewed from the intersection approach o Improve visibility of intersections by
providing enhanced signing and delinea-tion
o Improve visibility of the intersection by providing lighting
o Install splitter islands on the minor-road approach to an intersection
Source: NCHRP, 500: A Guide for Addressing Un-signalized/Signalized Intersection Collisions
Signalized Intersections Reduce frequency and severity of intersec-
tion conflicts through traffic control & operational improvements o Employ multiphase signal operation o Optimize clearance intervals o Restrict or eliminate turning maneuvers
(including right turns on red Reduce frequency and severity of intersec-
tion conflicts through geometric improvements o Provide/improve left-turn
channelization o Provide/improve right-turn
channelization o Improve geometry of pedestrian and bi-
cycle facilities Improve sight distance at signalized inter-
sections o Clear sight triangles o Redesign intersection approaches
Improve driver awareness of intersections and signal control o Improve visibility of intersections on ap-
proach(es) o Improve visibility of signals and signs at
intersections Improve driver compliance with traffic con-
trol devices o Provide public information and educa-
tion o Provide targeted conventional enforce-
ment of traffic laws Improve access management near signalized
intersections o Restrict access to properties using
driveway closures or turn restrictions o Restrict cross-median access near inter-
sections Improve safety through other infrastructure
treatments o Improve drainage in intersection and on
approaches o Provide skid resistance in intersection
and on approaches o Coordinate closely spaced signals near
at-grade railroad crossings
A8

Mississippi Strategic Highway Safety Plan
JULY 24, 2018
Fatal Crashes Involving Drug/Alcohol Impaired Drivers MISSISSIPPI STRATEGIC HIGHWAY SAFETY PLAN
582613 607
677 690
198245
188 187 131
0
100
200
300
400
500
600
700
800
2012 2013 2014 2015 2016
Mississippi Traffic FatalitiesStatewide & Impaired Driving Crash Fatalities
Statewide FARS Impaired Driving
What are the Contributing Factors?
Age/Gender/Seat Belt Usage The fatalities involved with impaired driving
identified that 85% were male drivers and 15% were female. The male age group from 26-35 was highest age group represented.
Age Group Male Female Both
<21 7% 8% 7%
21 – 25 14% 12% 13%
26 – 35 24% 20% 23%
36 – 45 18% 26% 19%
46 – 55 20% 26% 21%
56 – 65 13% 7% 12%
66+ 5% 1% 5%
100%
29% of the drivers in impaired driving fatal crashes were not licensed and 13% had prior DWI convictions and/or previous suspensions or revocations.
32% of the impaired driving fatalities were totally or partially ejected from the vehicle. un-licensed drivers (81%)/82 female unlicensed drivers (19%) killed, along with 95 male pas-sengers and 76 female passengers.
Of the people killed in impaired driver fatal crashes, 81% were drivers. 67% of the people killed were not wearing a seat belt and 25% of these crashes were listed as speed related.
Data reveals that 33% of the impaired driver speed related fatalities resulted in the occu-pants being totally or partially ejected from the vehicle.
Road and Area Type The roadway alignment was straight for 71%
of the impaired driving fatalities, with 29% in curves.
Combining rural and urban roadways, local roads accounted for 47% of the fatalities. The jurisdiction with the second highest number of fatalities was State Highways with 31%.
Jurisdiction Classification
Percentage
Interstates 7.5% US Highway 14.5% State Highways 31% Local Roads 47%
Total 100%
All together, 76% of impaired driver fatalities occurred on roadways with a posted speed limit of 45 mph or greater. The top three are:
Posted Speed Limit Percentage
45 mph 19% 55 mph 36% 65 mph 10%
Crash Type Lane Departure crashes accounted for the
greatest number of fatalities for impaired driv-ers 89%.
Single vehicle crashes accounted for 75% of the fatalities for impaired driving. Head-on & sideswipe (opposite) crashes accounted for 13% of fatalities.
Crash Type Percentage
Single Vehicle 75% Head-On & Sideswipe (Opp) 13%
Angle 4%
Rear End & Sideswipe (Same) 4%
A9

Strategies for Preventing or Reducing Drug/Alcohol Fatal Crashes
PAGE 2
A large number of strategies to reduce alcohol-related crashes have been tried; many have not been evaluated and others have shown no benefits when evaluated. The strategies presented here are considered to be the most promising based on either results from well-designed evalua-tion studies or the opinion of top experts in the field. Although these strategies often require state-level action, several can also be adapted and productively used in individual communities. To determine which strategies will most likely produce the greatest benefit in a given jurisdic-tion, an important first step is to conduct a careful assessment of the nature of the local drinking-driving problem and how the current DWI countermeasure system is currently func-tioning. This is best done by a task force that represents all the key elements of this issue. Without such an approach, a fragmented and incomplete understanding of the problem(s) is likely, and progress will be difficult. The system for dealing with alcohol-impaired driving may be the most complex and inherently interrelated of any in traffic safety. Reduce Excessive Drinking and Underage Drinking
o Increase the State Excise Tax on Beer o Require Responsible Beverage Service Policies for Alcohol Servers and Retailers o Conduct Well-Publicized Compliance Checks of Alcohol Retailers to Reduce Sales to Un-
derage Persons o Employ Screening and Brief Interventions in Health Care Settings
Enforce DWI Laws o Conduct Regular Well-Publicized DWI Checkpoints o Enhance DWI Detection Through Special DWI Patrols and Related Traffic Enforcement o Publicize and Enforce Zero Tolerance Laws for Drivers Under Age 21
Prosecute, Impose Sanctions on, and Treat DWI Offenders o Suspend Driver’s License Administratively upon Arrest o Establish Stronger Penalties for BAC Test Refusal than for Test Failure o Eliminate Diversion Programs and Plea Bargains to Lesser, Non-Alcohol Offenses o Screen All Convicted DWI Offenders for Alcohol Problems and Require Treatment when
Appropriate Control High BAC and Repeat Offenders
o Seize Vehicle or Vehicle License Plates Administratively upon Arrest o Require Ignition Interlocks as a Condition for License Reinstatement o Monitor All Convicted DWI Offenders Closely o Incarcerate Offenders
Source: NCHRP, 500: A Guide for Reducing Alcohol-Related Collisions
A10