Strategic Housing Market Assessment: Telford and Wrekin · Strategic Housing Market Assessment:...
284
Strategic Housing Market Assessment: Telford and Wrekin Council Final Report February 2014 www.housingvision.co.uk
Transcript of Strategic Housing Market Assessment: Telford and Wrekin · Strategic Housing Market Assessment:...

Strategic Housing Market Assessment: Telford and Wrekin Council
Final Report
February 2014
www.housingvision.co.uk

Telford and Wrekin SHMA
ii
Strategic Housing Market Assessment: Telford and Wrekin 2014 Final Report Client Contact: Darren Oakley
Principal Planning Officer Environment and Planning Policy Telford & Wrekin Council Wellington Civic Centre Larkin Way Wellington Telford TF1 1LX 01952 384240 [email protected]
Project Director:
Dr Richard Turkington Director Housing Vision 59 Stocks Lane Newland Malvern Worcs. WR13 5AZ 01886 833118 07714 106386 [email protected] www.housingvision.co.uk
Date: 24th February 2014

Telford and Wrekin SHMA
iii
Contents
Page
Executive Summary 1 1. Introduction: setting the context 6 The economic context 6 The housing market context 8 The strategic housing context 9 The national planning policy context 10
The local policy context 11 The approach to the SHMA 13
Data sources 15
Accuracy and rounding 18
Boundaries 18 Defining the Telford and Wrekin Housing Market Area and Sub Areas 22
2. Key Influences and Drivers 26 Executive summary 26
Introduction 32
Demographic profile 32
Population and household changes and projections 81 International migration 92
Internal migration 98 Commuting to work 113

Telford and Wrekin SHMA
iv
The local economy and employment trends, plans for growth 122
3. Housing Stock and Supply 127 Executive summary 127
Introduction 130 Setting the baseline: patterns and trends in the housing stock 130 Trends in residential completions 146
The private rented sector 150
The home ownership sector 173 The intermediate housing sector 178
The social rented sector 180
Housing supply: the views of estate and lettings agents 185
4. The Need and Demand for Housing 188 Executive summary 188 Introduction 189 The need and demand for affordable housing 189 The need and demand for specialised housing 193
Who is being housed in the intermediate housing sector? 194
The demand for housing: the views of estate and lettings agents 196
Determining the affordability of housing 198
The impact of housing and welfare reforms 215
5. Determining Housing Requirements 218
Introduction 218 1. The backlog of need for affordable housing 218

Telford and Wrekin SHMA
v
2. The future need for affordable housing over the 5 year policy period to 2016 220
3. Matching affordable housing need and supply 230 4. Determining future housing requirements, 2011-2031 234 Projected gross requirement for housing by tenure and bedsize 243 Projected gross requirement for housing by age and bedsize 244
Projected net requirement for housing by tenure and bedsize 246 Projected net requirement for housing by age and bedsize 252 Housing requirements identified by adjacent SHMAs 254
Determining special housing requirements 260
6. Conclusions and Recommendations 265 Introduction 265
Issues and problems 265
Interventions 267
The requirement for further research and intelligence 268
APPENDICES 1. Index of Multiple Deprivation ONS Lower Super Output Areas in Telford and Wrekin 270 2. Output Area Classifications and indicators 273 3. Data sources for monitoring and updating 276
Telford and Wrekin SHMA
vi
Acronyms & Abbreviations APS Annual Population Survey ASHE Annual Survey of Hours and Earnings BIS Business Information & Skills BRMA Broad Rental Market Area CLG Communities and Local Government CORE COntinuous REcording of lettings and sales of social housing CPI Consumer Price Index CT Council Tax DWP Department for Work and Pensions ESA Employment and Support Allowance GIS Geographical Information System GP General Practitioner HB Housing Benefit HESA Higher Education Statistics Agency HMSA Housing Market Sub area HSSA Housing Strategy Statistical Appendix IMD Index of Multiple Deprivation JSA Job Seekers Allowance LEP Local Economic Partnership LFS Labour Force Survey LHA Local Housing Allowance NHS National Health Service NHSCR National Health Service Central Register NINO National Insurance Number NOMIS National Online Manpower Information System NPPF National Planning Policy Framework ONS Office for National Statistics p.a. Per Annum PRDS Patient Register Data Service RP Registered Provider RSL Registered Social Landlord SHLAA Strategic Housing Land Availability Assessment SHMA Strategic Housing Market Assessment SMA Sub-market Areas UA Unitary Authority UC Universal Credit VOA Valuation Office Agency

Telford and Wrekin SHMA
1
Executive Summary ES1 Housing market dynamics are shaped by an area’s social and housing history
and by the interaction between the two. For example, a local authority’s ‘housing offer’ may be shaped by a legacy of family housing but if that area is unattractive to families, for example through poor educational, leisure and ‘quality of life’ provision, such housing may be in low demand. Moreover, a mismatch between the existing housing stock in an area and the housing requirements – needs and aspirations – of current and future households can create challenges for local economies and housing markets.
ES2 In the case of Telford and Wrekin, both its housing and wider ‘offer’ as a
destination are working to strengthen its established role in housing families. To take a few illustrative statistics, paragraph 3.23 of the main report shows that more than one third (36.4%) of accommodation is semi-detached houses, ranking Telford and Wrekin 77th out of 348 local authorities for this type of accommodation. Moreover, 30.5% of accommodation was in detached homes in Telford and Wrekin.
ES3 Telford and Wrekin’s tenure profile is fairly consistent with regional and
national profiles. Data from the 2011 Census shows that: 63.7% of homes in Telford and Wrekin are owner occupied, and reflecting national and regional trends since 2001, this represents a reduction (from 68.2%); almost one fifth (19.7%) of homes are social rented, with the proportion in the Telford sub area being much higher than those in the other two sub areas; 15.0% of homes are private rented; and 0.4% of homes are shared ownership (paragraph 3.24).
ES4 The mean age in Telford and Wrekin is 38.1, slightly younger than the
regional and national means, but the Mean Age in the Telford sub area was significantly younger at 37.4, and correspondingly much higher in the two other sub areas. In ranked terms, this places Telford and Wrekin at 274th from 348 local authorities, which means that 79% of local authorities have an older Mean Age (paragraph 2.35). In terms of household size and age, Telford and Wrekin has a lower percentage of single person households than the region and England, and the proportion of households which are 65 plus years is lower than the region and England. However, whilst the proportion of older households is lower, there are four small areas in the Telford sub area where more than one fifth of households are Lone Persons Over 65 (paragraphs 2.36 and 2.37).
ES5 Telford and Wrekin has a higher percentage of low Council Tax Band (A and B) homes than in the West Midlands (56.4%) and in England (44.4%) (paragraph 3.27). Whilst there is a lower proportion of 1 bed properties which is a concern in terms of access to the housing market in a lower income area, the higher proportions of properties in the lower Council Tax bands is likely to counteract this to some extent.

Telford and Wrekin SHMA
2
ES6 The average number of rooms per household in Telford and Wrekin is 5.7
which is above average (paragraph 3.25). Also from the 2011 Census, paragraph 3.26 shows that the average number of bedrooms per households was 2.9 in Telford and Wrekin, a little higher than in the West Midlands (2.8) and in England (2.7). The above average no. of bedrooms is mainly down to a much higher proportion of 3 bedroom properties.
ES7 Average house prices have fallen 2% over the past 5 years in Telford and
Wrekin (paragraph 3.64). The number of sales of terraced homes is greater than their proportion of the total stock, whereas sales of flats made up a smaller percentage than their proportion of the total stock. However, see paragraph 3.65, with most sales being houses, it can be seen that the home ownership sector is currently more effective in meeting the requirements of families and less effective for singles and couples, demand from whom will continue to increase.
ES8 The pattern of a high proportion of family housing is replicated across tenures.
In the case of the private rented sector, and as can be seen in paragraphs 3.46 through to 3.49, there are more homes suitable for families and less accommodation suitable for smaller households. However, data also shows that the sector plays an important role in housing these smaller households, with 51% of private renting households consisting of 1 or 2 people. Distribution of private rented accommodation is uneven across Telford and Wrekin, with much higher concentrations in particular small areas within the Telford sub area (paragraph 3.44). Furthermore, a higher percentage of households in the private rented sector fall within household categories that are likely to have lower earnings (paragraph 3.55).
ES9 Telford and Wrekin has a smaller non-white population than the region and
England, and this was particularly the case in the Newport and Rural sub areas. The percentage of Telford and Wrekin’s population who are White Other is, however, higher than the West Midlands region (paragraph 2.39). It is nonetheless not possible, in circumstances of low ethnic populations, to generalise from studies undertaken with concentrated ethnic populations. Paragraphs 2.88 to 2.90 in the main report show that the there has been an increase in ‘NINO Registrations’ in Telford and Wrekin over the past decade, which in 2005/06. More than one third of the total registrations were people from Poland. The impact on the housing market is difficult to quantify but the typical pattern is to seek housing in the private rented sector.
ES10 In common with all areas, Telford and Wrekin’s tenure pattern has changed
over the 10 years to 2011, incorporating a doubling in size of the private rented sector which has been almost entirely matched by a decrease in owner occupation, whilst the proportion of social rented stock has changed very little. (see paragraphs 3.42 and 3.43) In the main report, paragraph 3.12 reflects on the implications of the private rented sector’s growth.

Telford and Wrekin SHMA
3
ES11 The private rented sector now provides over one in 7 homes in Telford and Wrekin, and 2011 Census data confirms that it typically houses younger people in lower income employment, including families. An estimated supply in the region of 3,000 lettings per year is provided which is more than double the contribution of either the social rented or owner occupied sectors. However, the profile of this supply is vastly different to the overall stock of the sector, with lettings of flats and apartments being much higher than the proportion of stock they make up. However, owing to the prevalence of houses, there is still a skewing of lettings towards this accommodation type, and the result of these dynamics is that it appears that the private rented sector is able to meet the requirements of both smaller single/couple households and family households. Turnover is estimated to be in the region of 36% per annum in this sector (paragraph 3.58) which slightly exceeds the average of 32% identified by the 2011-12 English Housing Survey.
ES12 Shared ownership has declined in Telford and Wrekin, both in real terms and
as a proportion of stock, and this tenure continues to make a negligible contribution to the local housing stock (see paragraph 3.69). Paragraph 3.70 shows that the proportion of shared ownership is less than regional and national proportions. Consultation with estate agents found that there is felt to be a market for intermediate homeownership products, but that it is not always seen as ‘value for money’ (paragraphs 4.35 and 4.36).
ES13 At September 2013, there were 15,748 registered applicants and 12,567
excluding transfer applicants. Excluding transfer applicants, 10,594 were in the Urgent and Needing priority bands. Over the past 5 years, turnover has supplied around 1,200 properties, of which 80% are general needs. Excluding transfer applicants, supply to those in the Urgent and Needing priority bands ha been in the region of 870 lettings per annum. Supply is skewed towards smaller properties (paragraph 3.74). Demand for properties, according to the ratio of ‘choices’ to vacancies, is strongest for 2, 3 and 4 bed properties; registrations are dominated by younger households (paragraphs 4.16 and 4.17).
ES14 There are a number of strong dynamics currently at work in the housing
market in Telford and Wrekin:
1. The homeownership sector provides just over a fifth of housing supply although it represents almost two thirds of total stock. Transactions per year fell dramatically because of the financial and economic crisis and have yet to recover to pre-2008 levels.
2. The private rented sector provides the largest single source of housing supply (over half), although it constitutes only 16% of all stock. However, average rents in this sector are above Local Housing Allowance (LHA) rates and thus present an affordability challenge.

Telford and Wrekin SHMA
4
3. Through application of the ‘HMA and Housing Requirements’ Toolkit, it can be seen that those on lower quartile incomes are very much excluded from market housing options, unless housing support is accessed.
ES15 The area has relatively high levels of economic activity and, as has been
reported, a high proportion of family households. 2011 Census data reveals that Telford and Wrekin ranked 256th out of 348 local authorities for percentages of residents in professional occupations. Analysis of deprivation data further evidences that low incomes are a particular issue within the Telford sub area. Data specifically considering benefit claimants shows that just under 80% of all people claiming benefits - as at August 2012 - were claiming Out of Work benefits, which is lower than the region and national percentages.
ES16 Over the 10 year period between 2001 and 2011, Telford and Wrekin lost
3,600 people through internal migration within England and Wales, an annual average of 360 per year equivalent to in the region of 190 households. There is a symbiotic relationship with the wider West Midlands with which the largest numbers of moves take place. There is also a loss of people to the North West, and an outward migration of note to the South West. Analysis shows that the biggest losses are people aged 16-24, followed by those in the 25-44 age group (see paragraphs 2.93 to 2.96).
ES17 Linked to the above, and also incorporating travel to work patterns, Telford
and Wrekin can clearly be seen to have a relationship to a Housing Market Area which is not geographically contiguous with its boundary, and which consists of parts of both the urban and rural West Midlands (paragraph 1.52). Solely in terms of commuting, over half of all commuters in from elsewhere travel into Telford and Wrekin from Shropshire (paragraph 2.103).
ES 18 Whilst it is extremely difficult to separate cause from effect, new home
completions may well be enabling or encouraging movement to the area by certain households. 3,934 new homes were completed between 2006 and 2013 at an average of 562 per annum, and a net gain taking account of losses through demolition of 3,638 homes (paragraph 3.37). 40% of new homes were 1 or 2 bed; however, 21% of all completions were detached homes, in particular 4 bedroom houses. Consultation with agents (paragraph 3.90) found that there was felt to be a recent oversupply of this type and size of new housing.
ES19 Most new housing has been in the owner occupied sector (77%). Properties
sold for owner occupation may be purchased by private landlords and immediately ‘transferred’ to the private rental market. All agents reported an active investor market with purchasers buying cheaper property which would formerly have gone to first-time buyers or doing deals with developers on new build estates (paragraph 4.38).
Telford and Wrekin SHMA
5
ES20 ONS 2010-based population projections estimated a total population of 165,500 in Telford and Wrekin at 2011 compared with a Census estimate of 166,641. Consequently the projections presented below should be considered a slight underestimate (paragraph 2.76). There is projected dramatic growth in single person households and a reduction in family households with the exception of lone parent families (paragraph 2.87).
ES21 Paragraph 5.41 onwards identifies that most additional requirement for
housing will arise from households aged 65+ for the period 2011 to 2031, and there will be a decline in the requirement for housing from those aged 15-24, 45-54; and 55-59. This has major implications for meeting future housing requirements, particularly in relation to the proportion of older households who are under-occupying their existing homes and the extent to which they are able/want to downsize.
ES22 Overall, there is a net requirement for 10,651 additional homes in the Telford
and Wrekin area between 2011 and 2031. Amongst all tenures, there is a projected large growth (67%) in the requirement for 1 bed housing; 10% growth in the requirement for 2 bed; 26% growth in the requirement for 3 bed housing and a slight decline in the requirement for 4 bed housing. Almost all the additional housing requirement falls in the Telford sub area.
ES23 In order to clear the housing register backlog over the period 2011-2016 and
to meet the requirements of those falling into housing need, there is an estimated need from those in the Urgent and Priority Needs bands for 2,493 affordable homes per annum. In the context of projected supply, this implies a shortfall of 1,608 homes per annum with the greatest pressure experienced in relation to 3 bed and then 2 bed homes. This is equivalent to 8,040 affordable homes over 5 years.
ES24 Taking account of both the requirement for affordable housing from the
existing population between 2011 and 2016 and the requirements for all housing arising from projected household growth over the period 2011-2031, there is a net requirement for 18,691 additional dwellings in the Telford and Wrekin area between 2011 and 2031.

Telford and Wrekin SHMA
6
1. Introduction: setting the context 1.1 This chapter reviews the national and local policy context for the SHMA,
summarises the approach adopted and establishes the Telford and Wrekin Housing Market Area.
1.2 The Strategic Housing Market Assessment for Telford and Wrekin has been
prepared against a rapidly changing national background. The responsibility for assessing housing need and demand has moved from regional and sub-regional to local authority levels; the planning system has changed radically and the housing market remains at best uncertain.
1.3 The overriding factor is the economy and the spin-off effects of the financial
crises of 2007-8. These include the 2010 government’s adoption of an austerity programme and the banks’ virtual strangulation of the mortgage market, despite interest rates being at a record low. Drastic cuts in public expenditure have had an effect on jobs in both the public and the private sectors; on new house building; and on the ability of low income households to cover their housing costs.
The economic context 1.4 Economic indicators over the past 3 or 4 years have been somewhat
disappointing and have failed to confirm whether or not the long recession has ended, despite interest rates remaining at a historic low of 0.5%.
1.5 The update of August 7th 2013 1 provided the new Governor of the Bank of
England’s first official assessment of the UK economy. He indicated that Britain had suffered an unprecedented financial crisis but that "a renewed recovery" was under way. The most recent official figures showed manufacturing output surged in June, while surveys have also indicated gathering strength in the service sector and housing market. The Bank has raised its growth forecasts, predicting economic growth would reach an annual rate of at least 2% by the end of 2013 - a year sooner than previously predicted.
1.6 Under the forward guidance, the Bank will not consider raising interest rates
until unemployment has fallen from its current rate of 7.8% to 7% or below. This is to avoid “unnecessary fears” that interest rates will rise in response to the improving economy. Although the improving economic news was welcome, the Governor indicated that the "legacy of the financial crisis means that the recovery remains weak by historical standards and there is still a significant margin of spare capacity in the economy, this is most clearly evident in the high rate of unemployment."
1 Bank of England Inflation Report, August 2013

Telford and Wrekin SHMA
7
1.7 Longer term certainty over interest rates means businesses intending to invest will be able to plan ahead with more confidence and may also give banks and mortgage lenders the ability to "lock-in" customers at lower rates for longer. With short-term interest rates already at historic lows, the aim is to reduce longer-term interest rates.
1.8 The Bank's guidance is subject to three provisos; breaching any of them
would sever the link between interest rates and unemployment levels. These so-called 'knock-outs' are:
• CPI inflation is judged more likely than not to be at or above 2.5% over an 18-month to two-year horizon;
• inflation looks like it could get out of control in the medium term; and
• the Bank's Financial Policy Committee judges this stance poses a significant threat to financial stability.
Figure 1.1
1.9 The Bank’s view is that the economy is still fragile; hence, its decision to
maintain historically low interest rates

Telford and Wrekin SHMA
8
The housing market context 1.10 There is inconsistent evidence on housing market performance nationally.
The recently observed rise in house prices disguises considerable regional variation. Whilst the London area is seeing strong demand and consequent price rises, which spill over into places within commuting distance of the capital, the market in other parts of the country - lacking the confidence of buyers in the capital - remains flat.
The sales market 1.11 The second hand sales market is driven by the existence of first time buyers
and buy to let investors; without them, residents who need to trade up cannot find purchasers for their property at a price which allows them to buy another home. There is a dilemma here in that first time buyers and investors are often competing for the same property but investors will only buy if they can obtain sufficient yield through rental income and first time buyers can only buy if they have sufficient deposit and can get a mortgage.
1.12 The government is seeking to address the issues in the sales market by
offering assistance to would-be purchasers. So far, these have been targeted on new build schemes - seeking primarily to stimulate the construction industry- but the latest initiative, Help to Buy2, extends assistance to the second hand market. It covers buyers who have at least a 5% deposit and who can raise the remainder via a mortgage; the government offers a mortgage guarantee of 15% of the value of the home, which can be up to £600,000. Whilst this may well help to get the second hand market moving, some commentators have expressed concern that it may also fuel another housing “bubble” similar to that which burst in 2007.
The rental market 1.13 With mortgages still hard to obtain for average earners looking to buy their
first home and who lack the backing of the “bank of mum and dad”, there is a ready market for rented homes in many parts of the country, including Telford. In many places, demand exceeds the supply of rented homes, meaning landlords can pick and choose their tenants. This, coupled with changes to welfare benefits (see below), means there is greater reluctance to house tenants dependant on Local Housing Allowance.
The strategic housing context 1.14 Under the previous administration, housing needs were assessed at regional
and sub-regional level, with local authorities expected to provide the local detail in accordance with the regional assessment of housing need in their areas. With the abolition of Regional Planning Bodies and the scrapping of
2 Help to Buy: Home ownership schemes – DCLG 2013

Telford and Wrekin SHMA
9
Regional Spatial Strategies under the Localism Act 2011, the duty of assessing future housing requirements has devolved to local councils. Each council is expected to undertake a Strategic Housing Market Assessment which will feed into their Local Plan (see below).
1.15 The power of the Secretary of State under the Local Government Act 2003 to
require local housing authorities to prepare housing strategies and housing statements is to be repealed under the Deregulation Bill, currently in draft form and awaiting consideration by Parliament.
Housing supply 1.16 As indicated above, the major push from national government has been
targeted on stimulating the supply of new homes. Measures include:
• Help to Buy and its predecessor schemes which assist the purchase of brand new properties – the scheme will extend to the second hand market in January 2014.
• Growing Places Fund3 to support infrastructure investment for housing and economic growth
• Reconsideration of Section 106 agreements4 on affordable housing where it can be shown these obligations have stalled new build schemes
• New Homes Bonus5, paid to local councils over a 5 year period following the delivery of new homes in their area
1.17 The social housing sector has seen investment cut back and housing
associations required to build new homes at “affordable rents” - up to 80% of market rents - rather than social rents. On the positive side, the removal of the Housing Revenue Account regime for local authorities is leading to a number of stock owning councils planning to deliver the first new council homes for some years.
The ‘Right to Buy’ 6 1.18 Discounts available to tenants to purchase their council home have been
increased dramatically to a maximum of £100,000 in London and £75,000 elsewhere. To avoid a constantly diminishing stock, this is coupled with a requirement to replace the home sold, but not necessarily in the same area. The draft Deregulation Bill proposes reducing the qualifying period for right to buy from 5 years to 3.
3 Growing Places Fund – DCLG 2012
4 Renegotiation of Section 106 agreements, DCLG 2012
5 New Homes Bonus, DCLG 2011
6 Reinvigorating Right to Buy – DCLG 2012

Telford and Wrekin SHMA
10
Tenancy and welfare changes 1.19 Tenancy changes affect social housing tenants only. The major change is the
ability of social landlords to give fixed term, rather than on-going, tenancies, usually for a period of 5 years7. Another proposal, with details yet to be finalised, is to give the power to social landlords to charge a market rent to tenants with a household income of at least £60,000.
1.20 Welfare changes apply to tenants in both the social and private rented sector
already implemented are:
• Welfare benefit cap, limiting total welfare payments to £500 per week for couples and lone parents and £350 per week for single people.
• Local Housing Allowance8 for private tenants is now calculated on the 30th percentile instead of the median average of local market rents. And weekly rates in any area cannot exceed £250 for a one-bed property, £290 for a two-bed property, £340 for a three-bed property, and £400 for a four-bed property. This will not cover rents in high cost areas and any problems this causes are further compounded by the fact that councils can discharge homelessness duties with an offer of private rented accommodation.
• LHA is generally paid direct to the tenant instead of the landlord, which has made some landlords even less inclined to take tenants on benefit.
• “Bedroom tax” for social rented tenants, who suffer housing benefit reductions if they are deemed to have one or more spare rooms 9
1.21 Still to come is the roll-out of Universal Credit, whereby all welfare claimants
receive a single monthly payment. This will probably not happen until the new financial year.
The national planning policy context 1.22 With the demise of the regional planning bodies and the Regional Spatial
Strategy, planning experienced a brief period of limbo until the government introduced its National Planning Policy Framework (NPPF) in March 201210. The local authority Local Plan is now the sole development plan and councils are charged to prepare new Local Plans with reference to the NPPF. The development plan remains the starting point for determining planning applications; proposed development which accords with an up-to-date Local Plan should normally be approved and, conversely, proposed development that conflicts should normally be refused. The key phrase here is “up-to-date Local Plan”.
7 Localism Act 2011
8 Housing Benefit: Changes to the Local Housing Allowance arrangements – DCLG 2011
9 Housing Benefit: under-occupation of social housing – DCLG 2012
10 National Planning Policy Framework – DCLG 2012

Telford and Wrekin SHMA
11
1.23 At the heart of the NPPF is the concept of a presumption in favour of “sustainable development”. With this in mind, the local authority, when preparing or updating its Local Plan, should objectively assess and indicate how it will meet the need for housing and other types of development. This should normally be within its own area or by collaborative working with its neighbours. Also, if the Local Plan is still in preparation or its policies on a particular development application are out of date, permission should normally be granted unless adverse impacts significantly and demonstrably outweigh any benefits and/or the proposal conflicts with the NPPF.
1.24 The Strategic Housing Market Assessment is key to assessing the
requirements for housing development in an area; without it, the Local Plan is unlikely to be approved. It should assess the need for both market and sub-market housing. Allied to the SHMA is a Strategic Housing Land Availability Assessment and a requirement that a local council maintain a 5 year supply of specific development sites for housing.
1.25 Other relevant planning changes include:
• The possibility of building on green belt sites; local authorities are expected to consider the consequences for sustainable development of directing development to urban areas within their Green Belt boundaries and not to include as Green Belt land that does not need to be kept as open land permanently. The government has been adamant that it will protect the Green Belt and would only expect to see development on sites in the Green Belt which were previously developed, such as former quarries.
• The NPPF has dropped the national targets for development on brownfield sites.
• The possibility of local councils who fail to decide 30% of applications within 13 weeks being placed in “special measures”; this means having their planning applications decided by the Planning Inspectorate at the applicant’s request.
• Change of use from commercial to residential should normally be approved where there is a demonstrable need for housing and there are no strong economic reasons for retaining it as commercial.
• Allowing some open market sales on rural exception sites, if the local council considers doing so would significantly facilitate the provision of affordable housing.
The local policy context
1.26 Telford and Wrekin cover an area of 118 km 2 and include the former New
Town of Telford (designated in 1963), the market towns of Newport and Wellington; a number of smaller towns including Dawley, Madeley, and Oakengates, and other smaller communities whose history relates to the east Shropshire coalfield. To the south, and on the northern bank of the River

Telford and Wrekin SHMA
12
Severn, Ironbridge was the birthplace of the Industrial Revolution and is a UNESCO World Heritage Site.
1.27 Telford is a designated Growth Point and a focus for additional housing,
employment, office, retail and leisure. Much of the development land in Telford is owned by the Homes and Communities Agency and a considerable proportion of the new housing development arises from several large strategic sites at East Ketley, Lightmoor and especially at Lawley.
1.28 The National Planning Policy Framework (NPPF), Paragraph 159 establishes
that Local Planning Authorities should have a clear understanding of housing requirements in their area. This should be achieved by means of a Strategic Housing Market Assessment (SHMA) which should identify over the plan period the scale and mix of housing and the range of tenures the local population is likely to require. The Assessment should:
• meet household and population projections, taking into account migration and demographic change;
• address the need for all types of housing, including affordable housing and the needs of different groups in the community; and
• and cater for all types of housing demand. 1.29 With the removal of the regional tier of planning and the revocation of
Regional Spatial Strategies, and under the auspices of Localism, a key change has been the opportunity for local planning authorities to establish the appropriate level of future housing to be delivered in their area.
1.30 Additionally, the NPPF has reshaped the face of national planning policy. This
has consequently altered the scope of what might need to be covered in the development plan. Significantly, it has also altered the approach to development plan preparation, moving to the preparation of a Local Plan rather than a Local Development Framework. In doing so, it has changed the expectations of what should be contained within, and covered by, the development plan; in particular intimating that authorities prepare a more comprehensive initial Local Plan document.
1.31 The current Development Plan for Telford and Wrekin comprises of:
• the strategic policies of the Telford & Wrekin Core Strategy (2007);
• the policies for the town centre and surrounding areas contained in the Central Telford Area Action Plan (2011); and
• the saved policies of the Wrekin Local Plan (2000) for detailed development management decisions.

Telford and Wrekin SHMA
13
1.32 The preparation of the Development Plan needs to be supported by robust
and credible evidence to demonstrate that the policies and proposals within it are ‘sound’. To this end, the setting of any locally derived housing policies will need to be supported by up-to-date and proportionate evidence to demonstrate that the selected approach is sound. The Telford and Wrekin Strategic Housing Market Assessment forms a key piece of evidence to facilitate this.
1.33 The Assessment also constitutes a key evidence document to support the
preparation of future housing policies for the Local Plan and to feed into other housing, planning, regeneration and economic strategies and interventions. In the absence of strategic housing requirements imposed by a Structure Plan or a Regional Spatial Strategy, it will inform strategic housing requirements for the Telford and Wrekin area.
The approach to the SHMA 1.34 The National Policy Planning Framework places a clear obligation on local
planning authorities to assess the need for housing in their area. Under the title ‘Delivering a wide choice of high quality homes’, the Framework states that:
‘local planning authorities should use their evidence base to ensure that their Local Plan meets the full objectively assessed needs for market and affordable housing in the housing market area’ (paragraph 47;
and at paragraph 159 states that:
‘Local planning authorities should have a clear understanding of housing needs in their area’;
1.35 Paragraph 50 goes on to clarify the policy context informing the requirement
to assess the need for housing and provides further definition of housing need as follows:
‘To deliver a wide choice of high quality homes, widen opportunities for home ownership and create sustainable, inclusive and mixed communities, local planning authorities should:
• plan for a mix of housing based on current and future demographic trends, market trends and the needs of different groups in the community (such as, but not limited to, families with children, older people, people with disabilities, service families and people wishing to build their own homes); and
• identify the size, type, tenure and range of housing that is required in

Telford and Wrekin SHMA
14
particular locations, reflecting local demand’. 1.36 2013 Draft National Planning Practice Guidance concerning the ‘Assessment
of Housing and Economic Development Needs’ confirms the definition of housing need as follows:
‘Need for housing in the context of the guidance refers to the scale and mix of housing and the range of tenures that is likely to be needed in the housing market area over the plan period - and should cater for the housing demand of the area and identify the scale of housing supply necessary to meet that demand’.
1.37 It is clear from the NPPF and Draft Practice Guidance that ‘housing needs’
refers to the need for market and affordable housing, and to meet the needs of different groups in the community
1.38 The following table summarises the Core Outputs and the associated Key
Questions which inform the structure of the Assessment, extensive use has been made of GIS mapping throughout the report.
Table 1.1: key research questions and core outputs of the Assessment Chapter Key Research Questions Core Outputs
2 Who lives in the area, how might this change over the next 20 years? What other key influences and drivers are at work in relation to the housing market?
Estimates of current and future population and household size and profile by age and type. Description of key drivers underpinning the housing market.
3 What choices do consumers have in the housing market?
Analysis of past and current housing market trends, including the balance between supply and demand in different sectors.
4 What is the current pattern of housing need and demand for housing? How affordable is housing?
Estimates of current number of households in housing need.
6 What is the future need and demand for affordable and market housing by type and tenure, and for those with different requirements?
Estimates of future households that will require affordable housing and the size they will require. Estimates of household groups who have particular requirements, for example, families, young people, older people, key workers, black and minority ethnic groups, disabled people, etc.
1.39 Housing Market Assessments have typically provided static outputs which are incapable of being amended as circumstances change. Completion of the

Telford and Wrekin SHMA
15
Assessment has involved the development of a version of Housing Vision’s dynamic and interactive HMA and Housing Requirements Toolkit which is capable of assessing the requirement for housing arising from household growth. The application of the Toolkit is fully described in Chapter 5. This dynamic approach to the Housing Market Assessment also includes the opportunity for affordability modelling through the application of a related Housing Options Toolkit. This allows for bespoke affordability testing of any housing option by type, bed space and tenure.
Data sources
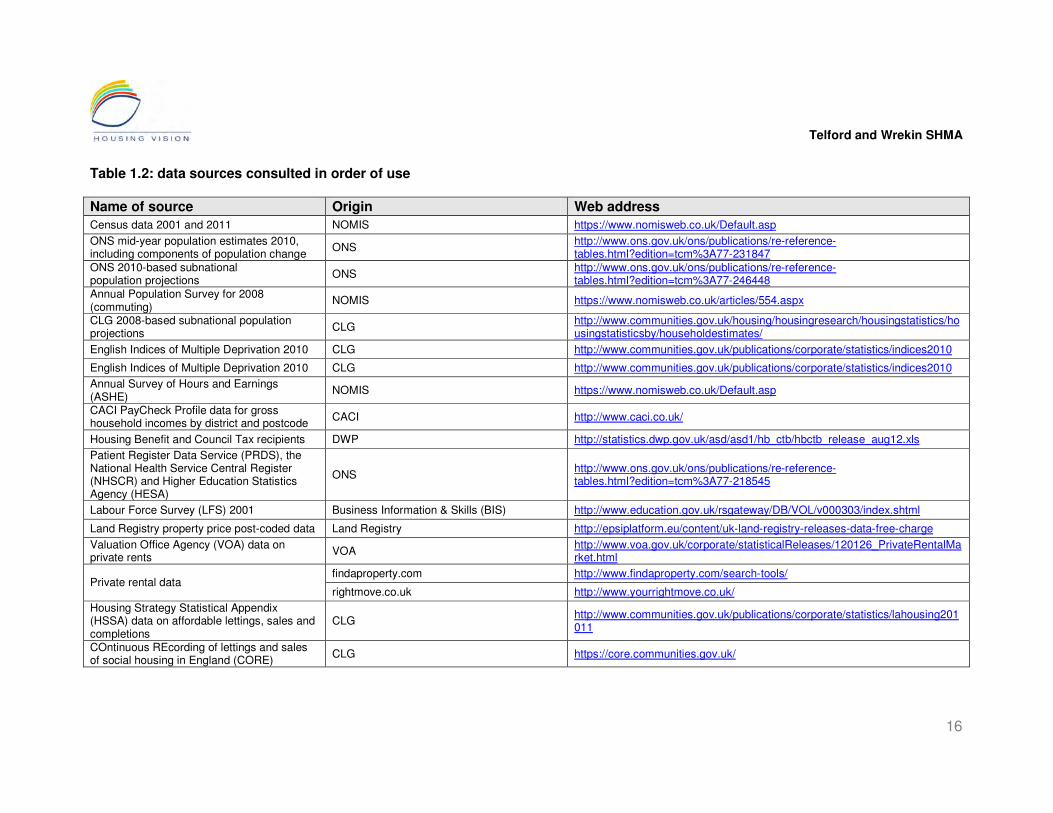
1.40 The approach adopted in undertaking this Assessment places a primary
reliance on secondary data. The benefit of such an approach is the opportunity it offers for continual updating, enabling the monitoring of housing markets directly in the future by housing and planning officers. The many data sources used are listed below accompanied by appropriate weblinks:
Telford and Wrekin SHMA
16
Table 1.2: data sources consulted in order of use
Name of source Origin Web address
Census data 2001 and 2011 NOMIS https://www.nomisweb.co.uk/Default.asp
ONS mid-year population estimates 2010, including components of population change
ONS http://www.ons.gov.uk/ons/publications/re-reference-tables.html?edition=tcm%3A77-231847
ONS 2010-based subnational population projections
ONS http://www.ons.gov.uk/ons/publications/re-reference-tables.html?edition=tcm%3A77-246448
Annual Population Survey for 2008 (commuting)
NOMIS https://www.nomisweb.co.uk/articles/554.aspx
CLG 2008-based subnational population projections
CLG http://www.communities.gov.uk/housing/housingresearch/housingstatistics/housingstatisticsby/householdestimates/
English Indices of Multiple Deprivation 2010 CLG http://www.communities.gov.uk/publications/corporate/statistics/indices2010
English Indices of Multiple Deprivation 2010 CLG http://www.communities.gov.uk/publications/corporate/statistics/indices2010
Annual Survey of Hours and Earnings (ASHE)
NOMIS https://www.nomisweb.co.uk/Default.asp
CACI PayCheck Profile data for gross household incomes by district and postcode
CACI http://www.caci.co.uk/
Housing Benefit and Council Tax recipients DWP http://statistics.dwp.gov.uk/asd/asd1/hb_ctb/hbctb_release_aug12.xls
Patient Register Data Service (PRDS), the National Health Service Central Register (NHSCR) and Higher Education Statistics Agency (HESA)
ONS http://www.ons.gov.uk/ons/publications/re-reference-tables.html?edition=tcm%3A77-218545
Labour Force Survey (LFS) 2001 Business Information & Skills (BIS) http://www.education.gov.uk/rsgateway/DB/VOL/v000303/index.shtml
Land Registry property price post-coded data Land Registry http://epsiplatform.eu/content/uk-land-registry-releases-data-free-charge
Valuation Office Agency (VOA) data on private rents
VOA http://www.voa.gov.uk/corporate/statisticalReleases/120126_PrivateRentalMarket.html
findaproperty.com http://www.findaproperty.com/search-tools/ Private rental data
rightmove.co.uk http://www.yourrightmove.co.uk/
Housing Strategy Statistical Appendix (HSSA) data on affordable lettings, sales and completions
CLG http://www.communities.gov.uk/publications/corporate/statistics/lahousing201011
COntinuous REcording of lettings and sales of social housing in England (CORE)
CLG https://core.communities.gov.uk/

Telford and Wrekin SHMA
17
Name of source Origin Web address
Rough Sleeping Statistics CLG http://www.communities.gov.uk/publications/corporate/statistics/roughsleepingautumn2011
Affordable housing stock, applications and lettings data
Choose Your Home, Wrekin Housing Trust http://www.chooseyourhome.org.uk/
Housing completions and empty and second homes data
Telford and Wrekin Council
Telford and Wrekin SHMA
18
Accuracy and rounding 1.41 Please note that where percentages have been rounded this is indicated in
the text, and where applied, cumulative totals may slightly exceed or fall below 100%. Only one decimal place has been used other than in circumstances where a greater level of detail is required.
Boundaries
1.42 Data is collected and collated according to a range of boundaries which
seldom conform to each other. The requirement is to achieve the best fit possible. Three sub areas, Telford, Newport and Rural, have been created from the closest fit of 2011 Census Output Areas to the boundaries previously created for Strategic Housing Market Assessment purposes. A list of 2011 Census Output Areas for each Sub Area was supplied for this purpose. The sub areas are shown in Map 1.1.
1.43 The 2011 Census data has been presented for the sub areas using the
closest fit of 2011 Census Output Areas to obtain these datasets from NOMIS. These areas have been made public on the NOMIS website, therefore other users of NOMIS may obtain additional 2011 Census data for these areas should they wish to. These can be found in the Advanced Query Area under User Defined Geography Rachel Wright (28492).
1.44 The DWP data and the 2010 English Indices of Deprivation use the 2004
ONS Lower Super Output Area boundaries. These do not fit with the boundaries of the three sub areas and therefore it is not possible to present tables for the sub areas. However, the sub area boundaries are overlaid on the maps. The Output Area Classification uses 2001 Census Output Areas which also do not fit with the boundaries of the three sub areas; however, the sub area boundaries have been overlaid on these maps.
1.45 The boundaries applied in this Assessment are summarised in the table below
by data used.

Telford and Wrekin SHMA
19
Table 1.3: boundaries used by data in the SHMA Boundary Data Source
Telford and Wrekin Sub Areas
Age structure Ethnic origin Household composition Occupation Economic Activity Qualifications Year of arrival UK Accommodation type Tenure type Number of rooms Rooms, average household size and Occupancy Rating (Overcrowding) Number of bedrooms Under-occupation (Occupancy Rating) Vacant homes Method of Travel to Work Car ownership
ONS Census 2011
Second Homes ONS Census 2011
Internal migration, international migration and travel to work
ONS
Incomes data CACI Property price data Land Registry
Private rental data VOA, rightmove.co.uk and zoopla.co.uk
Household deprivation Affordable lettings, sales and completions data
CLG
Telford and Wrekin Council area
Affordable housing stock, applications and lettings data
Choose Your Home, Wrekin Housing Trust
1.46 Map 1.1 below locates Telford and Wrekin in relation to adjoining local authority areas. and Map 1.2 identifies the Telford and Wrekin Council and the Telford, Newport and Rural Sub Areas.

Telford and Wrekin SHMA
20
Map 1.1

Telford and Wrekin SHMA
21
Map 1.2

Telford and Wrekin SHMA
22
Defining the Telford and Wrekin Housing Market Area and Sub Areas 1.47 Housing markets can be understood in two ways, either geographically by
identifying the characteristics of the market within a defined area, or socially by identifying the behaviour of housing consumers across a defined area. From the first perspective, Telford is a relatively self-contained housing market area but from the second, Wellington may for example, be one of several locations attractive to people wanting to move to a more market town environment.
1.48 The principle underlying the definition of housing market areas is that of ‘self-
containment’, that within a defined area, a majority of people will either live and work and/or move home. Based on previous work on travel to work areas, the degree of self-containment ‘defining’ a housing market area is usually set at 70 to 75%, but there is no hard and fast rule on what figure to use.
1.49 A further approach to defining housing market areas is to map property
values. This offers a useful way forward in relation to the market in Telford and Wrekin as there are quite differing areas of varying market values.
. 1.50 Finally interviews with estate and lettings agents across the area have been
used to answer the question: “How would you define the local housing market in this area?”
1.51 In summary, the Telford and Wrekin housing market area has been defined according to the following indicators:
1. the degree of self-containment using home move patterns at the 70% level. This data is only available for unitary or second tier local authorities and therefore, identification of self-containment can only be achieved at this geographic level.
2. the degree of self-containment using live: work patterns at the 70% level. This data is only available for unitary or second tier local authorities and therefore, identification of self-containment can only be achieved at this geographic level.
3. patterns of property values; and 4. interviews with estate and letting agents.
1.52 The following table identifies the indicators applied to define the Telford and
Wrekin Housing Market Area and Sub Areas.

Telford and Wrekin SHMA
23
Table 1.4: definition of the Telford and Wrekin Housing Market Area and Sub Areas
Definition Including Home moves @ 70% self-containment
Travel to work @ 70% self-containment
Property prices
Property agents
Telford Core Housing Market Sub Area
Yes Yes Yes Yes
Telford Rural Housing Market Sub Areas - Outer Rural North and Outer Rural West
Yes - Yes Yes
Telford and Wrekin Housing Market Area
Birmingham Sandwell Shropshire UA Stafford Wolverhampton
Yes Yes - -
Telford and Wrekin Peripheral Housing Market Area
Dudley Manchester South Staffordshire Stoke-on-Trent Walsall
Yes - - -
1.53 The following maps identify a hierarchy of housing markets in relation to
Telford and Wrekin as follows:
• based on home move and travel to work self-containment; property price patterns and the views of property agents, a Telford Core Housing Market Sub Area which conforms with the previously identified Telford Sub Area;
• based on property price patterns and the views of property agents, a Telford Outer Rural Housing Market Sub Area - Outer Rural North which includes Newport and Outer Rural South. Property price patterns suggest that these Outer Rural Sub Market Areas extend slightly beyond Telford and Wrekin’s boundaries to the east, north west and south west;
• based on home move and travel to work self-containment a Telford and Wrekin have a clear relationship to a Housing Market Area which is not geographically contiguous and which consist of Birmingham, Sandwell, Shropshire, Stafford and Wolverhampton; and
• based on home move self-containment only, Telford and Wrekin has a limited relationship with a Peripheral Housing Market Area which is not geographically contiguous and which consists of Dudley, Manchester, South Staffordshire, Stoke-on-Trent and Walsall.

Telford and Wrekin SHMA
24
Map 1.3

Telford and Wrekin SHMA
25
Map 1.4

Telford and Wrekin SHMA
26
2. Key Influences and Drivers
Executive summary
Population and household profile
2.1 Unsurprisingly in view of its history as a New Town, Telford has a younger age profile than regionally or nationally. As a result, Telford and Wrekin has a slightly lower 65 plus population than regionally or nationally and a slightly higher proportion of children aged up to 15 year old. It has a mean age of 38.1 ranking 274th out of 348 local authorities thereby showing it has a younger age profile than 273 other local authorities. The Telford sub area has a younger age profile with a mean age of 37.4 than in Newport with a mean age of 41.4 and the Rural sub area with a mean age of 43.5.
2.2 There are more family households in Telford and Wrekin than regionally or
nationally and this will be reflected in the requirement for housing, one third of households had dependent children in 2011. Almost one fifth were couples with no children, a higher percentage than regionally or in England; a quarter were one person households, lower than regionally or nationally, and just over one fifth were 65 plus years, lower than regionally or nationally. Patterns in the sub areas were different with the Telford sub area having more families with dependent children and the Rural sub area having with more 65 plus households.
2.3 Reflecting the higher proportion of families, the average household size in
Telford and Wrekin was 2.5, slightly higher than 2.4 in the region and in England. The average household size in the Telford sub area was 2.5, slightly higher than 2.4 in the Newport and Rural sub areas. Ethnic composition
2.4 Telford and Wrekin had a much smaller non white population (7.4%) than in
the region (17.3%) and nationally (14.3%). The largest ethnic group is Other White (2.7%) or 4,424 people followed by Indian (1.8% or 3,076 people), Pakistani (1.3% or 2,243 people), White and Black Caribbean (0.9% or 1,423 people) and African (0.6% or 1,023 people). Further Census data will provide more detail concerning the make up of the Other White category but, in view of the high levels of migration from Poland in particular, it is likely that most of this group will be accounted for by recent migrants from central and eastern Europe. The remaining ethnic groups had less than 1,000 people in each of them. There were 166 Gypsies or Irish Travellers (0.1%) of the population.
2.5 The Telford sub area had a non-white population of 8.1% compared to 2.5%
in Rural and 2.2% in Newport. 88% of the Gypsies or Irish Traveller residents were located in the Telford sub area. The largest ethnic group in the Telford

Telford and Wrekin SHMA
27
sub area is ‘Other White’ (2.9%) which is likely to include recent migrants from EU ‘accession countries’.
2.6 There were 9,020 NINO Registrations between 1st January 2002 and March
2012; migrants from 18 countries made up 86% of Registrations. 34% were people from Poland, with the next highest number being from Ghana (10%) and India (9%).
2.7 In relation to recent migrants from Poland in particular, it is likely from
experience elsewhere that their requirements have been met mainly by the private rented sector and from renting from family or friends. It is also likely that small communities have now been established accompanied by a shift in demand from single or shared accommodation towards family homes. Research is required to confirm such patterns and their impact on the housing market.
Occupational, income differences, geo-demographics and deprivation
2.8 There is clear and consistent evidence from a range of sources of income
polarisation across the area and of income differences between the sub areas.
2.9 Average incomes in the Newport sub area were 8% higher and in the Rural
sub area 15% higher than in Telford and this will clearly have an impact on affordability levels. Overall, there was a lower proportion of people employed in better paid Occupational Groups 1 to 3, and a higher proportion employed in the lower paid Groups 7 to 9 than in the West Midlands and England. However, there was a lower level of dependency on Out of Works benefits than in the Region or in England in August 2012. There was a higher percentage of JSA claimants in March 2013 than in Great Britain but a lower percentage than in the Region.
2.10 The 2011 Census findings on economic activity provide a similar picture with
a higher percentage of unemployed people than in England but a lower percentage than in the region. However, there was a higher percentage of 16 to 74 year olds in employment than in the region and a slightly lower percentage than in England (including self employment).
2.11 The patterns in the three sub areas were different with the Rural area having
less unemployed and, reflecting its older population, less in employment and more economically inactive than in the other two sub areas. Conversely, the Telford sub area had a higher percentage both unemployed and in employment. Newport was in between but with percentages closer to those in the Rural sub area. There was a higher percentage in the Rural sub area in the better paid Occupation Groups 1 to 3 than in the Newport and Telford sub area. Conversely, there was a higher percentage in the Telford sub area in Occupational Groups 7 to 9 than in the Newport and Rural sub areas.

Telford and Wrekin SHMA
28
2.12 30% of small areas in Telford and Wrekin had ‘Blue Collar Communities’ as their main OAC Super Group. These communities were mainly in the Telford sub area with some in Newport. They are characterised by lower income levels, social housing as a more likely tenure, with terraced housing and public renting being above average. Higher educational qualifications and living in flats were below average. 29% of small areas in Telford and Wrekin had ‘Prospering Suburbs’ as their main Super Group. These existed in all 3 sub areas. These communities are more likely to have higher income levels and owner occupation as a tenure, detached homes and 2+ cars. Living in flats, terraced housing, renting public housing and having no central heating was below average.
2.13 The Telford sub area, while dominated by the OAC groups within the two main Super Groups above, had a diverse range of OAC communities with 19 out of the 21 OAC Groups represented among its small areas. Newport sub area had 12 out of the 21 OAC Groups represented. The Rural sub area was much more homogeneous consisted mainly of the 3 OAC Groups that were part of the Super Group ‘Countryside’; however, it had 6 small areas with ‘Prospering Older Families’ and 1 small area with ‘Older Workers’ as its OAC main Group.
2.14 As a proxy for income, just over one fifth of households had no car or van in
their household which was lower than in both the region and in England, but in contrast, at over one quarter, there was a higher percentage of households with two cars than in England or regionally and a slightly higher percentage with three or more cars than in England or regionally. These patterns may well reflect the layout and infrastructure of such New Towns as Telford. There was a particularly high level of multi-car ownership in the Rural sub area where almost one fifth of households had 3 plus cars.
2.15 Located in the Telford sub area,13% of small areas have high levels of
relative and multiple deprivation, being in the 10% most nationally deprived for the Index of Multiple Deprivation 2010. This is caused mainly by high levels of income deprivation; income deprivation affecting children; education and employment deprivation. There is also some high deprivation in these areas associated with crime, health and affecting older people.
2.16 One positive indicator is that none of the small areas in Telford and Wrekin
were in the top quintile for national deprivation for the Housing Indicators from the Indoors Living sub-domain (stock condition and lack of central heating) and Wider Barriers sub-domain (Access to Owner Occupation for Under 35s, Homelessness and Overcrowding). 12% of small areas showed some relative deprivation for the Indoors Living Sub domain and almost one fifth of small areas showed some relative deprivation for the Wider Barriers sub domain.

Telford and Wrekin SHMA
29
Population and household change 2.17 The principal drivers at work across the area now and in the future are the
projected growth in the number of households overall and the very large projected increase in the size of the oldest populations and households.
2.18 Those aged 65+ are projected to increase by two thirds between 2001 and
2031 to reach 42,000. The increases are much greater for older age groups including 150% growth in those aged 85+ (from 3,000-7,500 people) when the need for housing with care is the greatest. The same pattern is being experienced throughout the country as ‘baby boomers’ born immediately after the Second World War reach retirement age and older. The scale of the projected growth in the older population is dramatic, and coincides with improvements in health and well being which extend life expectancy.
2.19 There are three main implications of this growth in the older population for the
Telford and Wrekin housing system:
1. older people are increasingly likely to be home owners, to own their home outright and to occupy family housing. The growth in the older population is associated with a growth in owner occupation amongst the retirement population. Such home owners have the potential either to release equity or to move to a smaller dwelling as appropriate.
2. older people are least likely to move home. The 2009-10 Survey of English
Housing recorded that only 1.7% of people aged 65+ moved home. Most older people continue to live in family housing and one of the central principles of social care is to support older people to live in their existing homes. The effect of low moving rates combined with support to live in existing homes is that many older people will be under-occupying homes which are too large to meet their requirements, and which may be difficult to manage. The end result will be a ‘log jam’ in the supply of family housing and a dramatic increase in the need for home-based care.
3. alternatives to conventional housing will be both desirable and necessary
and the supply of designated, sheltered and extra-care housing will need to increase. There is no benchmark for the proportion of older people willing and able to ‘downsize’ though work undertaken by Housing Vision identifies a minimum of 10% are willing to downsize, a figure which may well increase as the choice of aspirational options improves. However, the proportion of older people requiring designated, sheltered and extra-care housing is much clearer. The level of requirement is dealt with in Chapter 6 below.
2.20 The growth in the older population partly explains the projected growth in
households, and especially smaller households. However, there are a number of other factors at work which include:

Telford and Wrekin SHMA
30
• people living independently for longer;
• a major shift from marriage to co-habitation resulting in earlier but less stable relationships;
• women delaying childbirth; and
• relationship breakdown which results in the requirement for 2 homes. 2.21 As can be seen, many factors underpin the projected increase in households,
but other trends may have the reverse effect, including:
• the growth in multi-generational or other shared households through economic necessity or to provide care and support for those in need; and
• the growth in forms of communal or collaborative living among older people also to provide care and support.
2.22 It is too early to determine the scale of these trends but it is essential to
monitor evidence of lifestyle change and its impact on housing requirements. 2.23 Between 2011 and 2031, the number of households is projected to increase
by 9,702 or 14.2% in Telford and Wrekin with much larger increases for certain household types. Considered by household type, projected changes are as follows with the following caveats. Projections for family households are less certain than for single or couple households as they are dependent on the continuation of recent trends of relationship breakdown. Projections for couples with one or more adults are the most uncertain projection if more younger people live with parents for economic reasons.
• One person: growth of almost 46% most of whom will be older people;
• Couple households: 12.5% growth most of whom will be older people;
• Couple/lone parent and 1 child: 13.3% growth;
• Couple/lone parent and 2 children/couple and 1 or more adults no children: 16% decline;
• Couple/lone parent and 1 or more adults and 1 child: 37% decline;
• Couple/lone parent and 3+ children/ couple/lone parent and 1 or more adults and 2 children: 14% decline; and
• Couple/lone parent and 1 or more adults 3+ children: 7% decline. 2.24 Each of these trends has distinct implications for the housing system:
• for singles and couples: an increase in the requirement for smaller 2 bed properties; and
• for families: the small increase in the requirement for family housing is complicated by the projected large increase in lone parent households who have incomes typically around one third of the average. The implication of a substantial increase in the requirement for family housing affordable to lone parents is clear.

Telford and Wrekin SHMA
31
Internal migration and mobility 2.25 A key component of demographic change is internal migration which is
included in population projections using trend-based analysis, and is measurable through ONS ‘Components of Population Change’ tables. Internal migration is the most significant single component of projected population change for Telford and Wrekin identifying a net loss of 9,100 people in the period 2012-2031.
2.26 Over the 10 year period between 2001 and 2011 Telford and Wrekin lost
3,600 people through internal migration or an annual average of 360 per year. Telford and Wrekin lost population through internal migration in 2002/03 and over the period 2004/05 to 2010/11; there was no gain or loss in 2003/04.
2.27 Not surprisingly, the majority of internal and cross-regional migration takes
place within the West Midlands, but the largest net population losses have been to the North West and South West during the past 3 years for which data is available.
2.28 The net effect of internal migration is that Telford and Wrekin has lost
population to all regions other than the North East during the past 3 years for which data is available. The net effect for local authorities has been a net loss of population to Shropshire UA followed by the more distant local authority of Manchester. Net gains have been mainly from West Midlands Metropolitan areas (Wolverhampton and Sandwell followed by Dudley and Walsall) and other neighbouring local authorities such as Cannock Chase and South Staffordshire.
2.29 The limited data by age identifies that the main losses are of those aged
between 16 and 44 (amounting to 1,100 people in the past 3 years) which is likely to include families with younger children and those leaving for educational or employment opportunities. There was also a loss of 200 people aged between 45 and 64 years during this period, the reasons for which are less apparent. There was a gain of 100 people aged 65 plus and neither a loss nor gain for 0 to 15 year olds.
2.30 In terms of the implications for the housing market, these losses are likely to
reduce the demand for housing for newly forming households and for families with children. It is possible that the area is experiencing what has been characterised as an ‘escalator effect’ by which people are initially attracted to Telford’s ‘housing offer’ - by choice and/or cost - then move on to a leafier environment as their incomes increase. Further research is required to understand these dynamics more clearly.
Commuting
2.31 Understanding commuting patterns is constrained by the limited data
available and the non-availability, at the time of completion of this report, of

Telford and Wrekin SHMA
32
2011 Census data. In 2001, 5,675 more people travelled into work in Telford and Wrekin than those travelling outside the area to work according to the 2001 Census. The main local authority to which people travelled both in and out to work was Shropshire with considerably more people travelling in than out. This would partly support the ‘escalator effect’ theory described in the previous paragraph. Others travelled both in and out of West Midlands metropolitan local authorities such as Cannock Chase, Stafford and South Staffordshire.
2.32 According to the 2001 Census, 60% of commuters into the area came from
Shropshire and 40% went to Shropshire. The second largest numbers of commuters both in and out went to or came from Wolverhampton with 9% of commuters in and 14% of commuters out.
2.33 The Labour Force Survey 2001 and the APS 2008 Survey showed Bridgnorth and Shrewsbury and Atcham having higher percentages of commuters than Wolverhampton and Birmingham. According to these surveys, there were no significant changes between 2001 and 2008, although Wolverhampton had the highest percentage of Commuters In by 2008. Birmingham was not among the ten biggest travel flows for Commuters In.
Introduction 2.34 This major chapter reviews the key influences and drivers underpinning the
housing market. It progresses from a demographic and social profile to a review of population and household projections and the factors influencing them, including trends in international and internal migration and patterns of commuting.
Demographic profile
Population by age band 2.35 The 2011 Census identifies a population of 166,641 in Telford and Wrekin and
66,608 households at an average household size of 2.5.
• The population in the Telford sub area was 143,805 (86.3% of the Council total) with 57,638 households (86.5% of the total) with and an average household size of 2.5.
• The population in the Newport sub area was 12,339 (7.4% of the Council total) with 5,083 households (7.6% of the total) and an average household size of 2.4.
• The population in the Rural sub area was 10,497 (6.3% of the Council total) with 3,887 households (5.8% of the total) and an average household size of 2.4.

Telford and Wrekin SHMA
33
2.36 The area’s population by age will influence household formation which in turn
determines housing requirements. The following table summarises age structure by age band for the 2011 Census.

Telford and Wrekin SHMA
34
Table 2.1: Age Structure, Telford and Wrekin and Sub Areas, 2011
Telford Sub Area
Newport Sub Area
Rural Sub Area
Telford and Wrekin West Midlands England
Age Bands No % No % No % No % No % No %
Age 0 to 15 30,609 21.4 2,041 16.5 1,551 14.7 34,201 20.6 1,094,442 19.6 10,022,836 18.9
Age 16 to 17 4,096 2.8 320 2.6 259 2.5 4,675 2.8 146,021 2.6 1,314,124 2.5
Aged 18 to 24 12,545 8.8 1,531 12.4 1,352 12.9 15,428 9.2 532,377 9.5 4,970,636 9.4 Aged 25 to 44 40,660 28.2 2,696 21.8 1,861 17.8 45,217 27.1 1,472,931 26.3 14,595,152 27.5
Age 45 to 64 36,429 25.3 3,398 27.5 3,204 30.5 43,031 25.8 1,410,101 25.2 13,449,179 25.4
Age 65 plus 19,466 13.6 2,353 19.2 2,270 21.6 24,089 14.5 945,975 16.9 8,660,529 16.3
All Categories 143,805 100.1 12,339 100.0 10,497 100.0 166,641 100.0 5,601,847 100.1 53,012,456 100.0
Mean Age 37.4 41.4 43.5 38.1 39.3 39.3 Mean Age Rank 274
Median Age 37.0 42.0 46.0 38 39 39 Median Age Rank 255
Source: KS102EW 2011 Census data, Office for National Statistics website, http://www.ons.gov.uk and NOMIS website, http://www.nomisweb.co.uk Contains public sector information licensed under the Open Government Licence v1.0 http://www.nationalarchives.gov.uk/doc/open-government-licence/)
Telford and Wrekin SHMA
35
Key findings
• The 65 plus population in Telford and Wrekin was lower (14.5%) than in the Region (16.9%) and in England (16.3%); however, more than one fifth (21.6%) of the Rural sub area and almost one fifth (19.2%) of the Newport sub area were 65 plus compared to 13.6% in the Telford sub area.
• Just over one fifth (20.6%) of the population in Telford and Wrekin were 0 to 15 year olds, slightly higher than in the West Midlands (19.6%) and in England (18.9%). More than one fifth (21.4%) of the population in the Telford sub area were 0 to 15 year olds compared to 16.5% in Newport and 14.7% in Rural.
• 2.8% of the population in Telford and Wrekin were 16 to 17 year olds, just slightly higher than in the West Midlands (2.6%) and in England (2.5%). 2.8% of the population in the Telford sub area were 16 to 17 year olds, just slightly higher than in Newport (2.6%) and Rural (2.5%).
• 9.2% of Telford and Wrekin’s population were 18 to 24 year olds, just slightly higher than in the West Midlands (9.5%) and in England (9.4%). 8.8% of the Telford sub area’s population were 18 to 24 year olds compared to 12.4% in Newport and 12.9% in Rural.
• More than half (52.9%) of Telford and Wrekin’s population were aged between 25 and 64, the same as the national figure and slightly higher than in the West Midlands (51.5%). 53.5% of the Telford sub areas population were aged between 25 and 64 compared to 49.3% in Newport and 48.3% in Rural.
• The Mean Age in Telford and Wrekin was 38.1, just a little younger than the West Midlands and national Mean Age of 39.3. The Mean Age in the Telford sub area was 37.4, several years younger than the Mean Age of 41.4 in Newport and 43.5 in Rural. The Median ages showed a similar pattern.
• The Rank for the Mean Age is 274 and the Rank for the Median Age is 255 out of 348 local authorities in England and Wales. This means that 79% of local authorities have an older Mean Age and 73% have an older Median age than in Telford and Wrekin.
Household total, composition and size 2.37 The following table identifies the composition and size of households in Telford
and Wrekin and the sub areas in the context of the West Midlands and England.

Telford and Wrekin SHMA
36
Table 2.2: Household Total and Composition, Telford and Wrekin and Sub Areas, 2011
Household Composition Telford Sub Area Newport Sub Area Rural Sub Area Telford and Wrekin West Midlands England
One Person Household: No % No % No % No % Rank No % No %
Aged 65 and over 5,936 10.3 702 13.8 475 12.2 7,113 10.7 300 289,571 12.6 2,725,596 12.4
Other 8,672 15.0 631 12.4 377 9.7 9,680 14.5 259 388,677 16.9 3,940,897 17.9
One Family Only:
All aged 65 and over 4,020 7.0 516 10.2 499 12.8 5,035 7.6 259 196,969 8.6 1,789,465 8.1
Married or same-sex civil partnership couple: No children
7,743 13.4 731 14.4 747 19.2 9,221 13.8 156 277,113 12.1 2,719,210 12.3
Married or same-sex civil partnership couple: Dependent children
9,383 16.3 834 16.4 698 18.0 10,915 16.4 124 353,267 15.4 3,375,890 15.3
Married or same-sex civil partnership couple: All children non-dependent
3,439 6.0 310 6.1 326 8.4 4,075 6.1 128 143,155 6.2 1,234,355 5.6
Cohabiting couple: No children
3,406 5.9 239 4.7 148 3.8 3,793 5.7 97 109,972 4.8 1,173,172 5.3
Cohabiting couple: Dependent children
3,453 6.0 186 3.7 120 3.1 3,759 5.6 11 98,453 4.3 890,780 4.0
Cohabiting couple: All children non-dependent
350 0.6 30 0.6 19 0.5 399 0.6 61 11,684 0.5 108,486 0.5
Lone parent: Dependent children
5,002 8.7 281 5.5 111 2.9 5,394 8.1 67 172,682 7.5 1,573,255 7.1
Lone parent: All children non-dependent
2,126 3.7 184 3.6 106 2.7 2,416 3.6 95 86,064 3.8 766,569 3.5
Other household types:
With dependent children 1,750 3.0 99 1.9 79 2.0 1,928 2.9 61 67,693 2.9 584,016 2.6
All full-time students 31 0.1 131 2.6 20 0.5 182 0.3 100 11,397 0.5 124,285 0.6
All aged 65 and over 132 0.2 15 0.3 18 0.5 165 0.2 223 6,379 0.3 61,715 0.3

Telford and Wrekin SHMA
37
Other 2,195 3.8 194 3.8 144 3.7 2,533 3.8 111 81,833 3.6 995,677 4.5
All Categories 57,638 100.0 5,083 100.0 3,887 100.0 66,608 100.0 2,294,909 100.0 22,063,368 100.0
(Source: Table KS105EW 2011 Census data, Office for National Statistics website, http://www.ons.gov.uk and NOMIS website, http://www.nomisweb.co.uk Contains public sector information licensed under the Open Government Licence v1.0 http://www.nationalarchives.gov.uk/doc/open-government-licence/
Key findings
• There were 66,607 households in Telford and Wrekin in 2011, as the largest Sub Area, Telford had 57,638 or 86.53% of the total; the Newport Sub Area had 5,083 households or 7.63% of the total and the Rural Sub Area had 3,887 households or 5.84% of the total.
• Telford and Wrekin had a lower percentage (25.2%) of single person households than in the West Midlands (29.5%) and in England (30.3%). Newport sub area had 26.2%, Telford (25.3%) and Rural 21.9% single person households.
• 18.5% of households in Telford and Wrekin were 65 plus years, lower than in the West Midlands (21.5%) and just over one fifth in England (20.8%); however, more than one quarter of households in Rural (25.5%) were 65 plus years and nearly a quarter of households in Newport (24.3%) were 65 plus years, compared to 17.5% of households in the Telford sub area.
• Telford and Wrekin ranked 300th out of the 348 local authorities in England for Lone Persons over 65, 259th for One family only with all persons in the household over 65, and 223rd for Other household types with all persons in the household over 65.
• One third (33.0%) of households in Telford and Wrekin had dependent children, higher than in the West Midlands (30.1%) and in England (29.0%).
• More than one third (34.0%) of households in the Telford sub area had dependent children compared to 27.5% in Newport and just over one quarter (26.0%) in Rural.

Telford and Wrekin SHMA
38
• Telford and Wrekin ranked 11th out of the 348 local authorities in England and Wales for cohabiting couples with dependent children, 61st for Other household types with dependent children, 67th for Lone Parents with dependent children and 124th for married couples with dependent children. Ranks are based on percentages.
• 10.3% of households in Telford and Wrekin had non dependent children compared to 10.5% in the West Midlands and 9.6% in England. 10.3% of households in both the Telford and Newport sub areas had non dependent children compared to 11.6% in Rural.
• Almost one fifth (19.5%) of households in Telford and Wrekin were couples with no children. This was higher than in the West Midlands (16.9%) and in England (17.6%). 19.3% in the Telford sub area, 19.1% in Newport and 23.0% in Rural were couples with no children.
• The percent of Lone Person households Over 65 in Telford and Wrekin was 10.7%, lower than in the West Midlands (12.6%) and in England (12.4%). 13.8% of households in Newport were Lone persons Over 65 compared to 12.2% in Rural and 10.3% in the Telford sub area.
2.38 As one of the most vulnerable groups in society, particular attention has been given to lone person households over 65.
Although the overall percentage was lower than for Telford and Wrekin and for the other two sub areas, Map 2.1 below shows that the pockets with the highest concentrations were in the Telford sub area, in particular, four small areas where more than one fifth of households were Lone Persons Over 65.

Telford and Wrekin SHMA
39
Map 2.1

Telford and Wrekin SHMA
40
2.39 The following table profiles household size for Telford and sub areas. Table 2.3: Household Size, Telford and Wrekin and Sub Areas, 2011
Telford Sub Area
Newport Sub Area
Rural Sub Area
Telford and Wrekin West Midlands England
Household Size No % No % No % No % No % No % 1 person in household 14,608 25.3 1,333 26.2 852 21.9 16,793 25.2 678,248 29.6 6,666,493 30.2
2 people in household 20,223 35.1 1,894 37.3 1,574 40.5 23,691 35.6 776,691 33.8 7,544,404 34.2
3 people in household 10,081 17.5 833 16.4 665 17.1 11,579 17.4 363,132 15.8 3,437,917 15.6
4 people in household 8,150 14.1 675 13.3 547 14.1 9,372 14.1 298,605 13.0 2,866,800 13.0
5 people in household 3,194 5.5 278 5.5 194 5.0 3,666 5.5 112,956 4.9 1,028,477 4.7
6 people in household 1,007 1.7 54 1.1 36 0.9 1,097 1.6 44,613 1.9 369,186 1.7
7 people in household 249 0.4 14 0.3 10 0.3 273 0.4 11,747 0.5 88,823 0.4
8 or more people in household
126 0.2 2 0.0 9 0.2 137 0.2 8,917 0.4 61,268 0.3
All categories 57,638 100.0 5,083 100.0 3,887 100.0 66,608 100.0 2,294,909 100.0 22,063,368 100.0
Average Household Size
2.5 2.4 2.4 2.5 2.4 2.4
(Source: Table KS 105 EW and Table KS403EW 2011 Census data, Office for National Statistics website, http://www.ons.gov.uk and NOMIS website, http://www.nomisweb.co.uk Contains public sector information licensed under the Open Government Licence v1.0 http://www.nationalarchives.gov.uk/doc/open-government-licence/)
Telford and Wrekin SHMA
41
Key findings
• The average household size in Telford and Wrekin was 2.5, slightly higher than in the West Midlands (2.4) and in England (2.4). The average household size in the Telford sub area was 2.5, slightly higher than in Newport (2.4) and Rural (2.4).
• There were lower percentages of one person households in Telford and Wrekin than in the West Midlands and in England, higher percentages of two, three and four person combined households and the same percentage as the West Midlands for larger 5 plus person households and slightly higher than the national percentage for larger 5 plus person households.
• Just over one quarter (25.2%) of households in Telford and Wrekin were one person households. This was lower than in the West Midlands (29.6%) and in England (30.2%). More than one quarter in the Newport sub area (26.2%) and the Telford sub area (25.3%) and just over one fifth in the Rural sub area were one person households.
• More than one third of households in Telford and Wrekin (35.6%) were two person households. This was a little higher than in the West Midlands (33.8%) and in England (34.2%). Just over two fifths of households in the Rural sub area (40.5%) were two person households, over one third (37.3%) in Newport sub area and (35.1%) in Telford sub area.
• 31.5% of households in Telford and Wrekin were 3 and 4 persons combined households. This was higher than in the West Midlands (28.8%) and in England (28.6%). 31.6% in the Telford sub area were 4 and 4 persons combined households, 31.2% in Rural and 29.7% in Newport.
• 7.8% of households in both Telford and Wrekin and the West Midlands were 5 plus persons households. This was a little higher than the national percentage of larger 5 plus person households (7.0%). 7.9% of households in the Telford sub area were 5 persons plus compared to 6.8% in Newport and 6.4% in Rural.
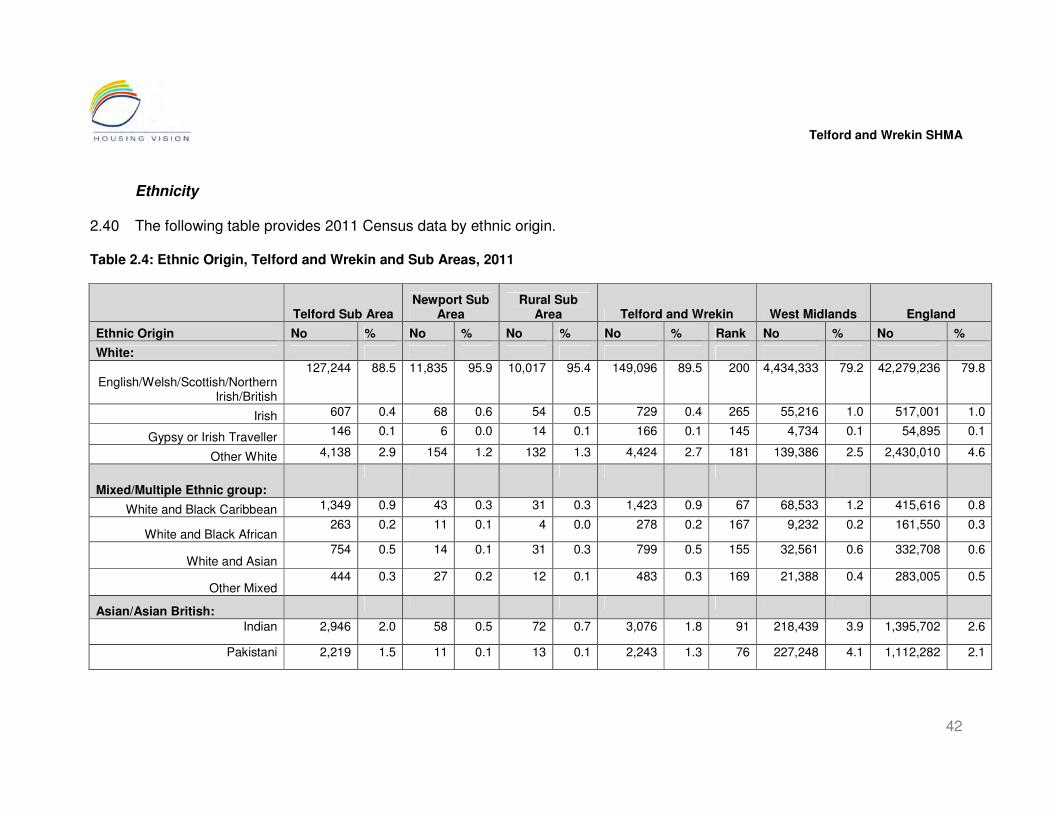
Telford and Wrekin SHMA
42
Ethnicity
2.40 The following table provides 2011 Census data by ethnic origin. Table 2.4: Ethnic Origin, Telford and Wrekin and Sub Areas, 2011
Telford Sub Area Newport Sub
Area Rural Sub
Area Telford and Wrekin West Midlands England
Ethnic Origin No % No % No % No % Rank No % No %
White:
English/Welsh/Scottish/Northern
Irish/British
127,244 88.5 11,835 95.9 10,017 95.4 149,096 89.5 200 4,434,333 79.2 42,279,236 79.8
Irish 607 0.4 68 0.6 54 0.5 729 0.4 265 55,216 1.0 517,001 1.0
Gypsy or Irish Traveller 146 0.1 6 0.0 14 0.1 166 0.1 145 4,734 0.1 54,895 0.1
Other White 4,138 2.9 154 1.2 132 1.3 4,424 2.7 181 139,386 2.5 2,430,010 4.6
Mixed/Multiple Ethnic group:
White and Black Caribbean 1,349 0.9 43 0.3 31 0.3 1,423 0.9 67 68,533 1.2 415,616 0.8
White and Black African 263 0.2 11 0.1 4 0.0 278 0.2 167 9,232 0.2 161,550 0.3
White and Asian 754 0.5 14 0.1 31 0.3 799 0.5 155 32,561 0.6 332,708 0.6
Other Mixed 444 0.3 27 0.2 12 0.1 483 0.3 169 21,388 0.4 283,005 0.5
Asian/Asian British:
Indian 2,946 2.0 58 0.5 72 0.7 3,076 1.8 91 218,439 3.9 1,395,702 2.6
Pakistani 2,219 1.5 11 0.1 13 0.1 2,243 1.3 76 227,248 4.1 1,112,282 2.1
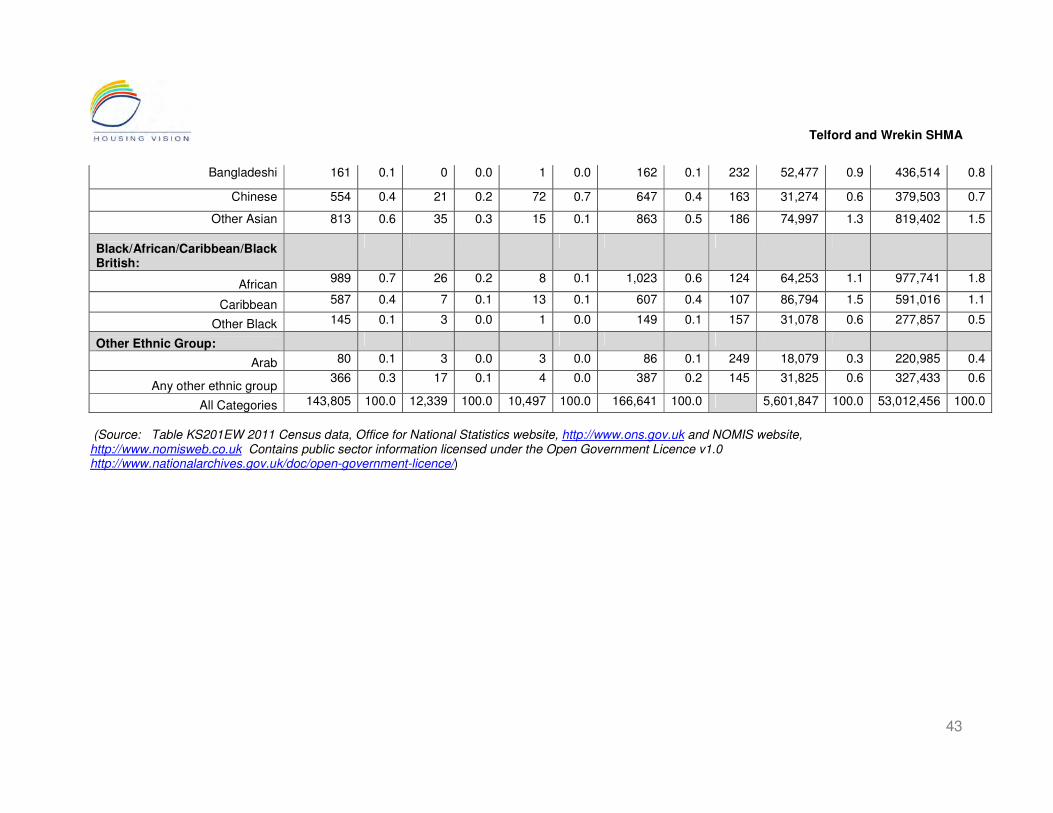
Telford and Wrekin SHMA
43
Bangladeshi 161 0.1 0 0.0 1 0.0 162 0.1 232 52,477 0.9 436,514 0.8
Chinese 554 0.4 21 0.2 72 0.7 647 0.4 163 31,274 0.6 379,503 0.7
Other Asian 813 0.6 35 0.3 15 0.1 863 0.5 186 74,997 1.3 819,402 1.5
Black/African/Caribbean/Black British:
African 989 0.7 26 0.2 8 0.1 1,023 0.6 124 64,253 1.1 977,741 1.8
Caribbean 587 0.4 7 0.1 13 0.1 607 0.4 107 86,794 1.5 591,016 1.1
Other Black 145 0.1 3 0.0 1 0.0 149 0.1 157 31,078 0.6 277,857 0.5
Other Ethnic Group:
Arab 80 0.1 3 0.0 3 0.0 86 0.1 249 18,079 0.3 220,985 0.4
Any other ethnic group 366 0.3 17 0.1 4 0.0 387 0.2 145 31,825 0.6 327,433 0.6
All Categories 143,805 100.0 12,339 100.0 10,497 100.0 166,641 100.0 5,601,847 100.0 53,012,456 100.0
(Source: Table KS201EW 2011 Census data, Office for National Statistics website, http://www.ons.gov.uk and NOMIS website, http://www.nomisweb.co.uk Contains public sector information licensed under the Open Government Licence v1.0 http://www.nationalarchives.gov.uk/doc/open-government-licence/)

Telford and Wrekin SHMA
44
Key findings
• Telford and Wrekin had a smaller non white population (7.4%) than the West Midlands (17.3%) or England (14.3%). 8.1% of the population in the Telford sub area was non white compared to very low non white populations in both Newport (2.2%) and in Rural (2.5%).
• 4.1% of the population in Telford and Wrekin were Asian compared to 10.8% in the West Midlands and 7.7% in England. 4.6% of the Telford sub areas population was Asian compared to very low percentages in Newport (1.1%) and Rural 3(1.6%).
• A very small percentage (1.1%) of Telford and Wrekin’s population were Black, lower than in the West Midlands (3.2%) and in England (3.4%) 1.2% of the population in the Telford sub area were Black compared to smaller percentages in the other two sub areas (0.3% in Newport and 0.2% in Rural).
• 0.3% of Telford and Wrekin’s population were from Other Ethnic groups, lower than for the West Midlands (0.9%) and in England(1.0%). 0.4% of the Telford sub areas population were from Other Ethnic groups compared to 0.1% in Newport and less than 0.1% in Rural.
• 2.7% of Telford and Wrekin’s population were White Other. This was higher than in the West Midlands (2.5%) and lower than in England (4.6%). 2.9% of the population in the Telford sub area were White Other compared to (1.2%) in Newport and (1.3%) in Rural.
• There were 166 Gypsies or Irish Travellers in Telford and Wrekin (0.1%) of the population. This was the same percentage as in both the West Midlands and in England. Telford ranked 145 out of 348 local authorities for Gypsies and Irish Travellers. The majority (88.0%) of the Gypsies or Irish Travellers in Telford and Wrekin were located in the Telford sub area.
• In circumstances of very low ethnic populations, their social, economic and housing circumstances can only be understood through detailed and localised analysis; it is not possible to generalise from studies undertaken with concentrated ethnic populations.
Economic activity 2.41 Economic Activity from the 2011 Census shows the economic situation of 16
to 74 year olds including employment, unemployment, students, retirement, looking after the home and family and long term sickness or disabilities. It breaks employment down into full time, part time and self employed. It breaks the population down into those that were economically active and those that were economically inactive. The following table shows economic activity in Telford and Wrekin and its sub areas in 2011.

Telford and Wrekin SHMA
45
Table 2.5: Economic Activity in Telford and Wrekin and Sub Areas, 2011
Economic Activity Telford Sub
Area Newport Sub Area
Rural Sub Area
Telford and Wrekin West Midlands England
Economically Active No % No % No % No % No % No %
Employee: Part-time 14,165 13.5 1,332 14.4 1,033 13.0 16,530 13.5 569,727 14.0 5,333,268 13.7
Employee: Full-time 44,454 42.3 3,500 37.9 2,613 32.9 50,567 41.4 1,521,871 37.4 15,016,564 38.6
Self-employed 6,881 6.5 666 7.2 1,041 13.1 8,588 7.0 345,928 8.5 3,793,632 9.8
Unemployed 5,385 5.1 251 2.7 170 2.1 5,806 4.7 207,415 5.1 1,702,847 4.4
Full-time student 2,772 2.6 367 4.0 317 4.0 3,456 2.8 133,918 3.3 1,336,823 3.4
Economically Inactive
Retired 13,849 13.2 1,567 17.0 1,382 17.4 16,798 13.7 586,305 14.4 5,320,691 13.7
Student (including full-time students)
4,398 4.2 930 10.1 885 11.1 6,213 5.1 241,856 5.9 2,255,831 5.8
Looking after home or family 5,442 5.2 243 2.6 238 3.0 5,923 4.8 185,328 4.6 1,695,134 4.4
Long-term sick or disabled 5,563 5.3 268 2.9 170 2.1 6,001 4.9 178,489 4.4 1,574,134 4.0
Other 2,188 2.1 111 1.2 98 1.2 2,397 2.0 96,282 2.4 852,450 2.2
All usual residents aged 16 to 74 105,097 100.0 9,235 100.0 7,947 100.0 122,279 100.0 4,067,119 100.0 38,881,374 100.0
(Source: KS601EW to KS603EW Economic Activity, 2011 Census, NOMIS website, http://www.nomisweb.co.uk. Contains public sector information licensed under the Open Government Licence v1.0 http://www.nationalarchives.gov.uk/doc/open-government-licence/)

Telford and Wrekin SHMA
46
Key findings
• 69.5% of 16 to 74 year olds in Telford and Wrekin were economically active at the time of the 2011 Census. This was slightly higher than in the West Midlands (68.3%) and slightly lower than in England (69.9%). 70.1% of 16 to 74 year olds in Telford sub area were economically active, compared to 66.2% in Newport and 65.1% in Rural.
• Correspondingly, 30.5% of 16 to 74 year olds in Telford and Wrekin were economically inactive, slightly lower than in the West Midlands (31.7%) and slightly higher than in England (30.1%). 34.9% in Rural were inactive compared to 33.8% in Newport and 29.9% in Telford sub area.
• Just over three fifths (61.9%) of 16 to 74 year olds were in employment in Telford and Wrekin. This was slightly higher than in the West Midlands (59.9%) and slightly lower than in England (62.1%). 62.3% of 16 to 74 year olds in Telford sub area were in employment, compared to (59.5%) in Newport and (59.0%) in Rural.
• 4.7% of 16 to 74 year olds were unemployed at the time of the 2011 Census. This was a little lower than in the West Midlands (5.1%) and a little higher than in England (4.4%).
• 2.8% of 16 to 74 year olds in Telford and Wrekin were full time students which was lower than in the West Midlands (3.3%) and in England(3.4%). 2.6% of 16 to 74 year olds in the Telford sub area were full time students compared to 4.0% in both Newport and Rural.
• 13.7% of 16 to 74 year olds in Telford and Wrekin were retired, the same as the national percentage and slightly lower than in the West Midlands (14.4%). 17.4% of 16 to 74 year olds in the Rural sub area were retired compared to 17.0% in Newport and 13.2% in the Telford sub area.
• 4.9% of 16 to 74 year olds in Telford and Wrekin were long term sick or disabled. This was a little higher than in the West Midlands (4.4%) and in England (4.0%). 5.3% of 16 to 74 year olds in the Telford sub area were long term sick or disabled compared to 2.9% in Newport and 2.1% in Rural.
• 4.8% of 16 to 74 year olds were looking after the home or family. This was slightly higher than in the West Midlands (4.6%) and in England (4.4%). 5.2% of 16 to 74 year olds in the Telford sub area were looking after the home or family compared to 3.0% in Rural and 2.6% in Newport.
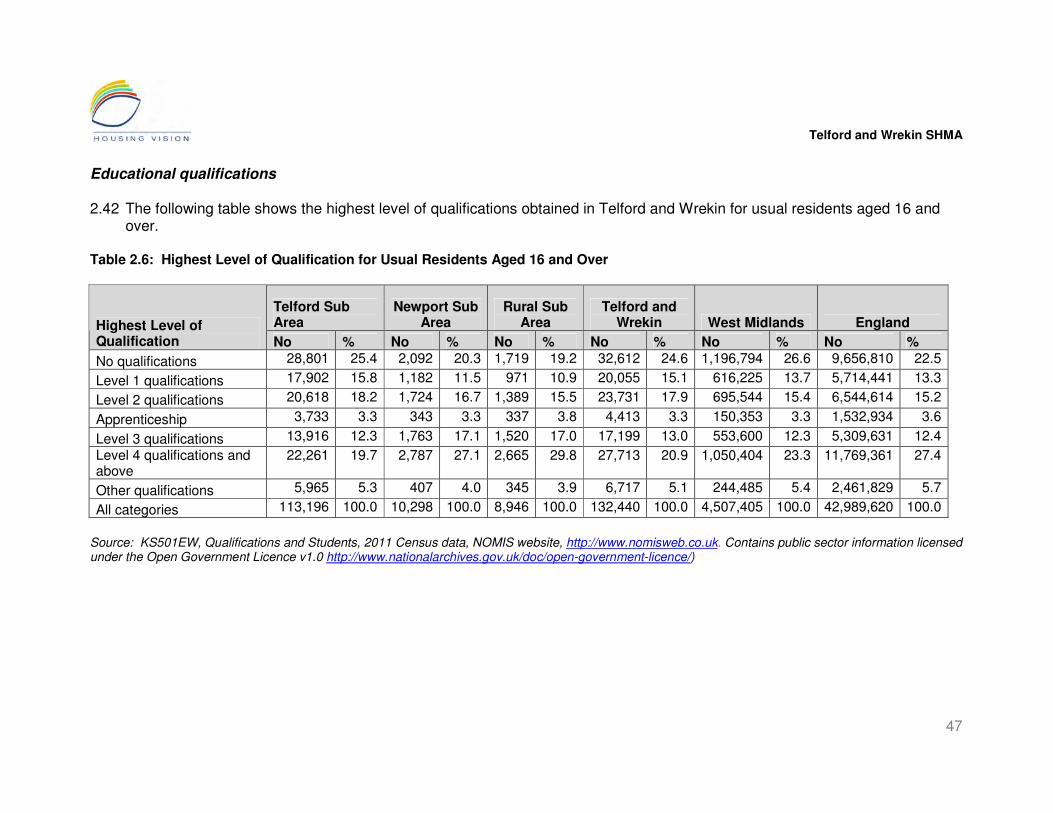
Telford and Wrekin SHMA
47
Educational qualifications 2.42 The following table shows the highest level of qualifications obtained in Telford and Wrekin for usual residents aged 16 and
over. Table 2.6: Highest Level of Qualification for Usual Residents Aged 16 and Over
Telford Sub Area
Newport Sub Area
Rural Sub Area
Telford and Wrekin West Midlands England Highest Level of
Qualification No % No % No % No % No % No %
No qualifications 28,801 25.4 2,092 20.3 1,719 19.2 32,612 24.6 1,196,794 26.6 9,656,810 22.5
Level 1 qualifications 17,902 15.8 1,182 11.5 971 10.9 20,055 15.1 616,225 13.7 5,714,441 13.3
Level 2 qualifications 20,618 18.2 1,724 16.7 1,389 15.5 23,731 17.9 695,544 15.4 6,544,614 15.2
Apprenticeship 3,733 3.3 343 3.3 337 3.8 4,413 3.3 150,353 3.3 1,532,934 3.6
Level 3 qualifications 13,916 12.3 1,763 17.1 1,520 17.0 17,199 13.0 553,600 12.3 5,309,631 12.4
Level 4 qualifications and above
22,261 19.7 2,787 27.1 2,665 29.8 27,713 20.9 1,050,404 23.3 11,769,361 27.4
Other qualifications 5,965 5.3 407 4.0 345 3.9 6,717 5.1 244,485 5.4 2,461,829 5.7
All categories 113,196 100.0 10,298 100.0 8,946 100.0 132,440 100.0 4,507,405 100.0 42,989,620 100.0
Source: KS501EW, Qualifications and Students, 2011 Census data, NOMIS website, http://www.nomisweb.co.uk. Contains public sector information licensed under the Open Government Licence v1.0 http://www.nationalarchives.gov.uk/doc/open-government-licence/)

Telford and Wrekin SHMA
48
Key findings
• Almost a quarter (24.6%) of usual residents aged 16 and over in Telford and Wrekin had no qualifications. This was lower than in the West Midlands (26.6%) and higher than in England (22.5%). More than one quarter (25.4%) in the Telford sub area had no qualifications compared to just over one fifth in Newport (20.3%) and just under one fifth in Rural (19.2%).
• One third (33.0%) of usual residents aged 16 and over in Telford and Wrekin had either a Level 1 or Level 2 qualification. This was higher than in the West Midlands (29.1%) and in England (28.5%). More than one third (34.0%) in the Telford sub area had either a Level 1 or Level 2 qualification compared to 28.2% in Newport and 26.4% in Rural.
• 3.3% of usual residents aged 16 and over in Telford and Wrekin had an apprenticeship. This was the same as in the West Midlands and slightly lower than in England (3.6%). 3.8% in the Rural sub area had an apprenticeship compared to 3.3% in both Newport and the Telford sub area.
• 13.0% of usual residents aged 16 or over in Telford and Wrekin had a Level 3 qualification. This was a little higher than in the West Midlands (12.3%) and in England (12.4%). 17.1% in Newport had a Level 3 qualification compared to 17.0% in Rural and 12.3% in the Telford sub area.
• Just over one fifth (20.9%) of usual residents aged 16 or over in Telford and Wrekin had a Level 4 or above qualification. This was lower than in the West Midlands (23.3%) and England (27.4%). 29.8% in the Rural sub area had Level 4 or above qualifications compared to 27.1% in Newport and 19.7% in the Telford sub area.
Occupational profile 2.43 Profiling Occupation Groups is useful as it indicates from a hierarchy of skills
and qualifications, the likely associated income levels of the employed population. Incomes are dealt with specifically in subsequent sections. The following tables use Census data profile the occupation of usual residents aged 16 to 74.
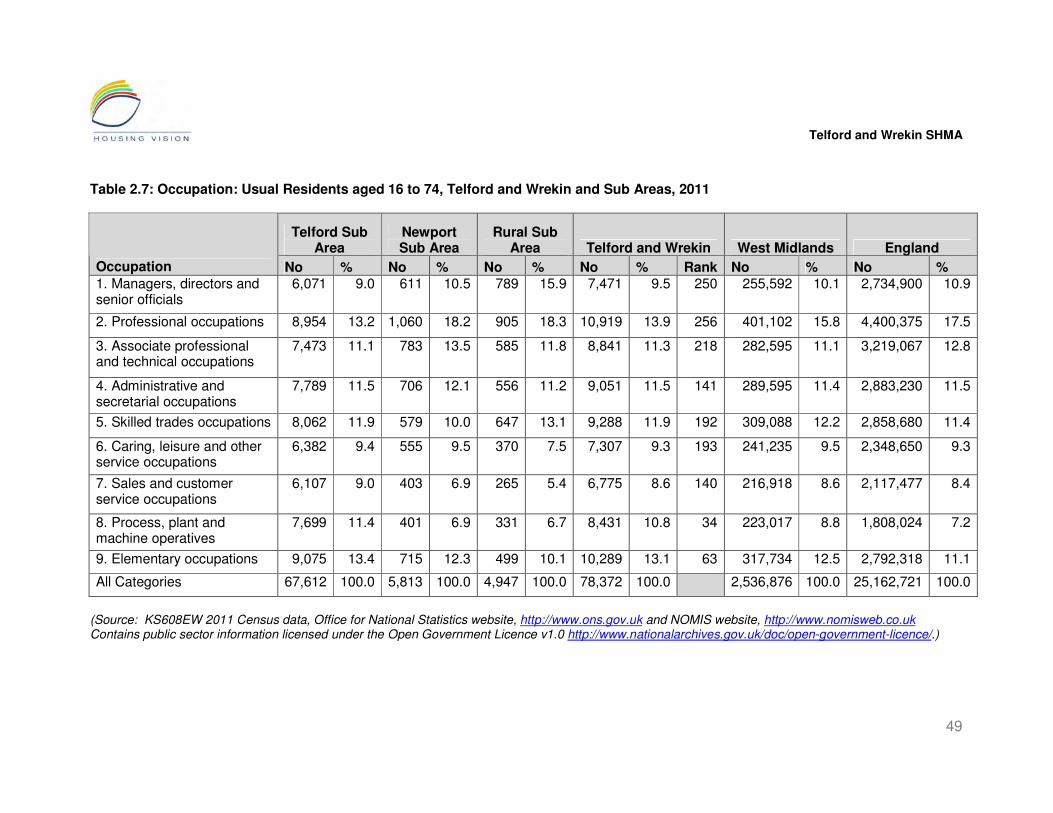
Telford and Wrekin SHMA
49
Table 2.7: Occupation: Usual Residents aged 16 to 74, Telford and Wrekin and Sub Areas, 2011
Telford Sub Area
Newport Sub Area
Rural Sub Area Telford and Wrekin West Midlands England
Occupation No % No % No % No % Rank No % No % 1. Managers, directors and senior officials
6,071 9.0 611 10.5 789 15.9 7,471 9.5 250 255,592 10.1 2,734,900 10.9
2. Professional occupations 8,954 13.2 1,060 18.2 905 18.3 10,919 13.9 256 401,102 15.8 4,400,375 17.5
3. Associate professional and technical occupations
7,473 11.1 783 13.5 585 11.8 8,841 11.3 218 282,595 11.1 3,219,067 12.8
4. Administrative and secretarial occupations
7,789 11.5 706 12.1 556 11.2 9,051 11.5 141 289,595 11.4 2,883,230 11.5
5. Skilled trades occupations 8,062 11.9 579 10.0 647 13.1 9,288 11.9 192 309,088 12.2 2,858,680 11.4
6. Caring, leisure and other service occupations
6,382 9.4 555 9.5 370 7.5 7,307 9.3 193 241,235 9.5 2,348,650 9.3
7. Sales and customer service occupations
6,107 9.0 403 6.9 265 5.4 6,775 8.6 140 216,918 8.6 2,117,477 8.4
8. Process, plant and machine operatives
7,699 11.4 401 6.9 331 6.7 8,431 10.8 34 223,017 8.8 1,808,024 7.2
9. Elementary occupations 9,075 13.4 715 12.3 499 10.1 10,289 13.1 63 317,734 12.5 2,792,318 11.1
All Categories 67,612 100.0 5,813 100.0 4,947 100.0 78,372 100.0 2,536,876 100.0 25,162,721 100.0
(Source: KS608EW 2011 Census data, Office for National Statistics website, http://www.ons.gov.uk and NOMIS website, http://www.nomisweb.co.uk Contains public sector information licensed under the Open Government Licence v1.0 http://www.nationalarchives.gov.uk/doc/open-government-licence/.)

Telford and Wrekin SHMA
50
Key findings
• The 2011 Census identifies that the highest percentage of usual residents aged 16 to 74 in employment the week prior to the 2011 Census were in professional occupations (13.9%) as their main job; however, Telford and Wrekin ranked only 256th out of 348 local authorities for percentages in this category, and percentages were lower in Telford and Wrekin than in the West Midlands (15.8%) and in England (17.5%). 18.3% in the Rural sub area were in professional occupations, 18.2% in Newport and 13.2% in the Telford sub area.
• Just over one third of 16 to 74 year olds in employment (34.7%) in Telford and Wrekin were in Categories 1, 2 and 3. This was lower than in the West Midlands (37.0%) and in England (41.2%). 46.0% in the Rural sub area were in Categories 1, 2 and 3 compared to 42.2% in Newport and one third (33.3%) in the Telford sub area.
• Almost one third (32.7%) of 16 to 74 year olds in employment were in Categories 4, 5 and 6. This was slightly less than in the West Midlands (33.1%) and slightly more than in England (32.2%). Almost one third of 16 to 74 year olds in employment(32.8%) in the Telford sub area were in Categories 4,5 and 6 compared to slightly lower percentages of (31.6%) in Newport and (31.8%) in Rural.
• Nearly one third (32.5%) of 16 to 74 year olds in employment were in Categories 7, 8 & 9. This was a higher percentage than in the West Midlands (29.9%) and in England where it was more than one quarter (26.7%). Just over one third (33.8%) of 16 to 74 year olds in employment in the Telford sub area were in Categories 7, 8 and 9 compared to 26.1% in Newport and 22.2% in Rural.
• No data is provided on incomes in these tables but, as the groups are presented as a hierarchy from higher to lower skills and qualifications, it can be assumed that income from earnings follows a similar pattern. The findings from the 2011 Census data implies that local people are likely to be at a disadvantage in terms of their incomes in a high value housing market, particularly those living in the Telford sub area.
Car and van availability 2.44 Car and van availability can provide a proxy indicator for income levels within
an area, the following table show the availability of cars or vans and the sum of all cars/vans in both areas.

Telford and Wrekin SHMA
51
Table 2.8: Car or Van availability, Telford and Wrekin and Sub Areas, 2011
Telford Sub Area
Newport Sub Area
Rural Sub Area
Telford and Wrekin West Midlands England
Cars or Vans Available
No % No % No % No % No % No % No cars or vans in household 12,704 22.0 763 15.0 281 7.2 13,748 20.6 566,621 24.7 5,691,251 25.8 1 car or van in household 25,232 43.8 2,180 42.9 1,288 33.1 28,700 43.1 952,798 41.5 9,301,776 42.2 2 cars or vans in household 15,421 26.8 1,592 31.3 1,563 40.2 18,576 27.9 591,210 25.8 5,441,593 24.7 3 cars or vans in household 3,296 5.7 368 7.2 514 13.2 4,178 6.3 136,201 5.9 1,203,865 5.5 4 or more cars or vans in household 985 1.7 180 3.5 241 6.2 1,406 2.1 48,079 2.1 424,883 1.9 All categories: Car or van availability 57,638 100.0 5,083 100.0 3,887 100.0 66,608 100.0 2,294,909 100.0 22,063,368 100.0 Sum of All cars or vans in the area
70,317 7,271 7,083 84,671 2,757,999 25,696,833
(Source: KS416EW 2011 Census data, Office for National Statistics website, http://www.ons.gov.uk and NOMIS website, http://www.nomisweb.co.uk Contains public sector information licensed under the Open Government Licence v1.0 http://www.nationalarchives.gov.uk/doc/open-government-licence/.)

Telford and Wrekin SHMA
52
Key findings
• Just over one fifth (20.6%) of households in Telford and Wrekin had no cars or vans in their household compared with nearly a quarter (24.7%) in the West Midlands and just over one quarter (25.8%) in England. Just over one fifth (22.0%) in the Telford sub area had no cars or vans compared to 15.0% in Newport and only 7.2% in the Rural sub area.
• There was an average of 1.3 cars or vans per household in Telford and Wrekin compared with 1.2 in the both the West Midlands and in England. There was an average of 1.8 cars in the Rural sub area compared to 1.4 cars in Newport and 1.2 in the Telford sub area.
• There was a slightly higher percentage of households with one car or van in Telford and Wrekin (43.1%) than in the West Midlands (41.5%) and in England (42.2%). 43.8% in the Telford sub area had one car or van in the Telford sub area compared to 42.9% in Newport and one third (33.1%) in Rural.
• There were a higher percentage of households with two cars in Telford and Wrekin (27.9%) than just over one quarter in the West Midlands (25.8%) and just under one quarter in England (24.7%). Just over two fifths (40.2%) in the Rural sub area, 31.3% in Newport and just over one quarter in the Telford sub area (26.8%) had two cars or vans in the household.
• 8.4% of households in Telford and Wrekin had 3 or more cars compared to 8.0% in the West Midlands and 7.4% in England. Almost one fifth (19.4%) in Rural had 3 or more cars compared to 10.7% in Newport and 7.4% in the Telford sub area.
• The 2011 Census data shows a higher level of car ownership in Telford and Wrekin than the national level. It showed a very high percentage of multi car ownership in the Rural sub area and fairly high in the Newport sub area compared to the Telford sub area, West Midlands and national levels.
Household incomes from all sources
2.45 Household income is the most important factor in determining access to
housing. The following table profiles the proportion of households receiving gross incomes across a range of income bands for Telford and Wrekin and the Telford, Newport and Rural sub areas. It is important to emphasise that this profile includes income from all sources, including social security benefits, and is for all household types. This data has been applied in the HMA and Housing Requirements Toolkit.

Telford and Wrekin SHMA
53
Table 2.9: gross household income, Telford and Wrekin and Sub Areas, percentages, May 2013
Income band Telford & Wrekin
Telford Sub Area
Newport Sub Area
Rural Sub Area
£0 - £5k 3.2% 3.4% 2.7% 1.8% £5 – 10k 12.8% 13.2% 11.7% 8.7% £10 – 15k 12.5% 12.7% 11.8% 10.3% £15 – 20k 10.3% 10.3% 9.9% 9.5% £20 – 25k 8.3% 8.3% 8.2% 8.3% £25 – 30k 7.4% 7.3% 7.3% 7.6% £30 – 35k 6.6% 6.5% 6.6% 7.1%
£35 – 40k 6.4% 6.3% 6.5% 7.1% £40 – 45k 5.6% 5.5% 5.7% 6.3% £45 – 50k 4.5% 4.4% 4.6% 5.0% £50 – 55k 4.1% 4.1% 4.3% 4.8% £55 – 60k 3.3% 3.2% 3.5% 4.0% £60 – 65k 2.7% 2.7% 2.9% 3.3% £65 – 70k 2.1% 2.0% 2.2% 2.5%
£70 – 75k 1.9% 1.9% 2.1% 2.4% £75 – 80k 1.5% 1.5% 1.7% 2.0% £80 – 85k 1.2% 1.1% 1.4% 1.6% £85 – 90k 0.8% 0.8% 1.0% 1.1% £90 – 95k 0.8% 0.8% 0.9% 1.1% £95 - £100k 0.7% 0.6% 0.7% 0.9% £100-120k 1.7% 1.7% 2.0% 2.3%
£120-140k 0.9% 0.8% 1.0% 1.2% £140-160k 0.4% 0.4% 0.6% 0.7% £160-180k 0.2% 0.2% 0.3% 0.3% £180-200k 0.1% 0.1% 0.1% 0.2% £200k + 0.0% 0.0% 0.1% 0.1% Mean income £34,504 £33,966 £36,563 £39,687 Median income £26,940 £26,372 £28,860 £32,704 Lower quartile £13,572 £13,302 £14,482 £17,248 (Source: PayCheck data, CACI, May 2013)
Key findings:
• Average incomes in the Rural sub area are 15% higher than in Telford and Wrekin and 8% higher in Newport.
• 30% of households have incomes of less than £20,000 in the Rural sub area and 40% in Telford. Income distribution is broadly similar in the £40-£60,000 range but begin to widen above this point. These patterns are most clearly seen in the following chart.

Telford and Wrekin SHMA
54
Figure 2.1: gross household income, Telford and Wrekin and sub areas, percentages, May 2013
0.00%
2.00%
4.00%
6.00%
8.00%
10.00%
12.00%
14.00%
£0 -
£5k
£5 -
10k
£10 - 1
5k
£15 – 2
0k
£20 – 2
5k
£25 - 3
0k
£30 – 3
5k
£35 - 4
0k
£40 - 4
5k
£45 - 5
0k
£50 - 5
5k
£55 – 6
0k
£60 - 6
5k
£65 - 7
0k
£70 - 7
5k
£75 - 8
0k
£80 - 8
5k
£85 - 9
0k
£90 - 9
5k
£95 - £
100k
£100
-120
k
£120
-140
k
£140
-160
k
£160
-180
k
£180
-200
k
£200
k +
Telford & Wrekin Telford Newport Rural
(Source: PayCheck Data, CACI, May 2013)
Personal incomes from employment
2.46 The Annual Survey of Hours and Earnings (ASHE) identifies the gross weekly
pay of full-time workers at mean and median levels and for each 10th percentile of the income range by local authority area and is produced annually. The following table summarises gross median weekly incomes for residents in Telford and Wrekin in 2012, the most recent year for which data is available.
Table 2.10: gross median weekly incomes for residents in Telford and Wrekin, 2012
Hours Telford and Wrekin West Midlands England
Full Time £455.00 £469.30 £512.70 (Source: ONS Annual Survey of Hours and Earnings – resident analysis, NOMIS website, http://www.nomisweb.co.uk/.Contains public sector information licensed under the Open Government Licence v1.0 http://www.nationalarchives.gov.uk/doc/open-government-licence/.)
Key findings
• Data on gross median incomes from employment show lower incomes in Telford and Wrekin than the regional averages and substantially lower incomes than the national averages.
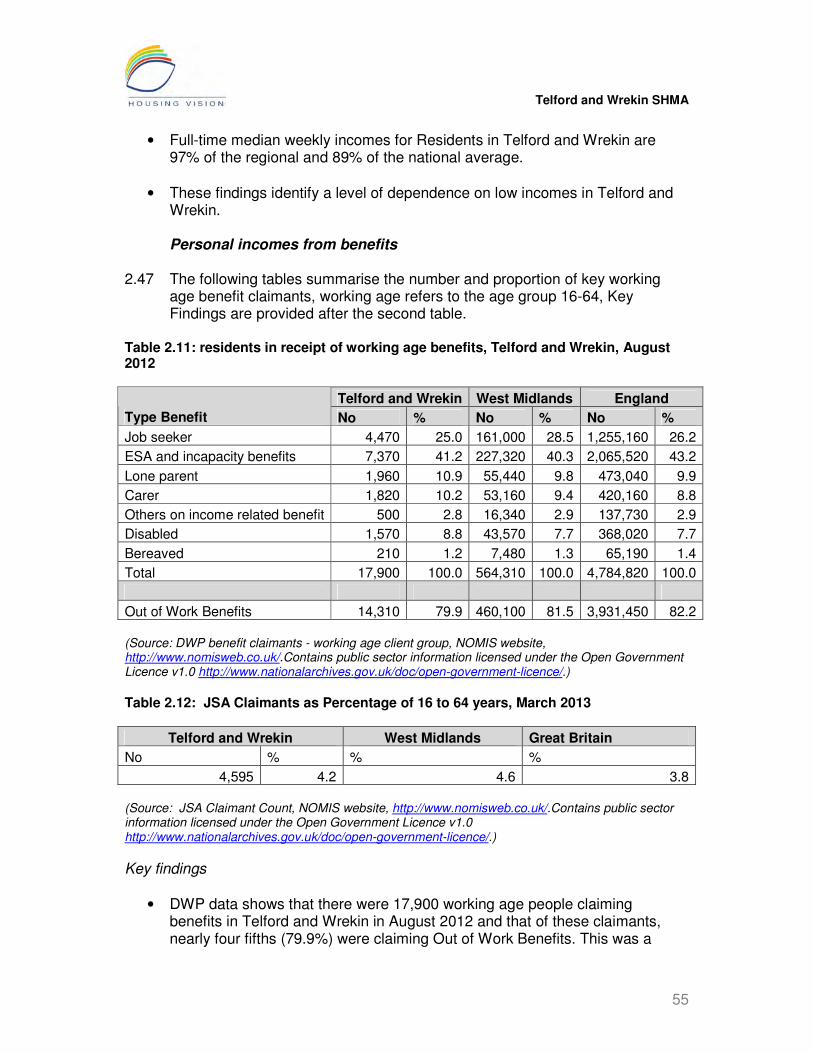
Telford and Wrekin SHMA
55
• Full-time median weekly incomes for Residents in Telford and Wrekin are 97% of the regional and 89% of the national average.
• These findings identify a level of dependence on low incomes in Telford and Wrekin. Personal incomes from benefits
2.47 The following tables summarise the number and proportion of key working
age benefit claimants, working age refers to the age group 16-64, Key Findings are provided after the second table.
Table 2.11: residents in receipt of working age benefits, Telford and Wrekin, August 2012
Telford and Wrekin West Midlands England
Type Benefit No % No % No %
Job seeker 4,470 25.0 161,000 28.5 1,255,160 26.2
ESA and incapacity benefits 7,370 41.2 227,320 40.3 2,065,520 43.2
Lone parent 1,960 10.9 55,440 9.8 473,040 9.9
Carer 1,820 10.2 53,160 9.4 420,160 8.8
Others on income related benefit 500 2.8 16,340 2.9 137,730 2.9
Disabled 1,570 8.8 43,570 7.7 368,020 7.7
Bereaved 210 1.2 7,480 1.3 65,190 1.4
Total 17,900 100.0 564,310 100.0 4,784,820 100.0
Out of Work Benefits 14,310 79.9 460,100 81.5 3,931,450 82.2 (Source: DWP benefit claimants - working age client group, NOMIS website, http://www.nomisweb.co.uk/.Contains public sector information licensed under the Open Government Licence v1.0 http://www.nationalarchives.gov.uk/doc/open-government-licence/.) Table 2.12: JSA Claimants as Percentage of 16 to 64 years, March 2013
Telford and Wrekin West Midlands Great Britain
No % % %
4,595 4.2 4.6 3.8 (Source: JSA Claimant Count, NOMIS website, http://www.nomisweb.co.uk/.Contains public sector information licensed under the Open Government Licence v1.0 http://www.nationalarchives.gov.uk/doc/open-government-licence/.)
Key findings
• DWP data shows that there were 17,900 working age people claiming benefits in Telford and Wrekin in August 2012 and that of these claimants, nearly four fifths (79.9%) were claiming Out of Work Benefits. This was a

Telford and Wrekin SHMA
56
lower percentage than in the West Midlands (81.5%) and in England (82.2%) for Out of Work Claimants.
• ONS Claimant counts for March 2013 show a lower percentage of JSA claimants as a percentage of 16 to 64 year olds in Telford and Wrekin (4.2%) than in the West Midlands (4.6%) and a higher percentage than in Great Britain overall (3.8%).
2.48 The following maps identify the numbers of working age claimants in small areas in Telford and Wrekin, and the number of Out of Work working age claimants in small areas in Telford and Wrekin. They provide a useful indication of where there are pockets with higher levels of benefit claimants.
2.49 The maps show that all of the 8 areas where there were more than 300
working age claimants were located within the Telford sub area. There were a further 27 areas with between 201 and 300 claimants all located within the Telford sub area. The numbers of Working Age Benefits claimants in the small areas within the Newport and Rural sub areas appear to be relatively low.
2.50 The map of working age Out of Work Benefits claimants identifies 2 areas
with more than 300 claimants; both within the Telford sub area. There were a further 22 areas with between 201 and 300 claimants all located within the Telford sub area. The numbers of Working Age Out of Work Benefits claimants in the small areas within the Newport and Rural sub areas appear to be relatively low.
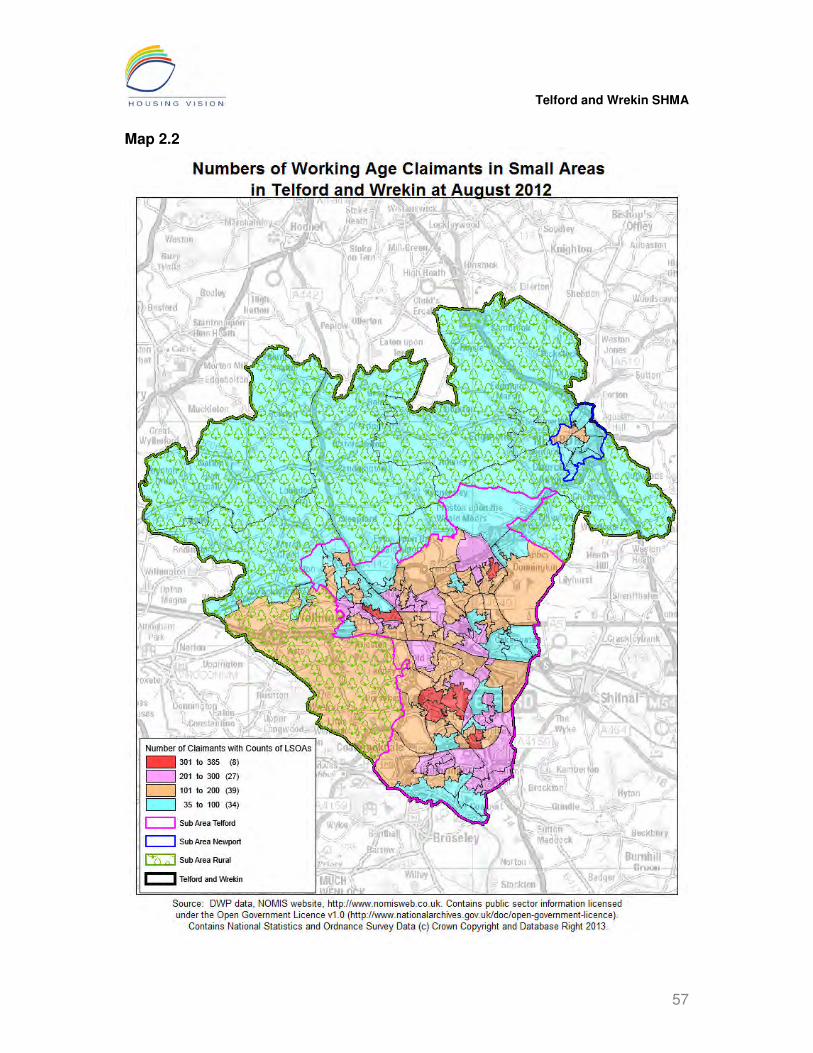
Telford and Wrekin SHMA
57
Map 2.2

Telford and Wrekin SHMA
58
Map 2.3

Telford and Wrekin SHMA
59
Relative levels of deprivation and the identification of small areas of deprivation 2.51 Based on ONS Lower Super Output Areas, the English Indices of Deprivation
2010 are a relative measure of deprivation identifying whether one small area is more or less deprived than another although not by how much. Such data can help identify distinct small or sub-areas such as neighbourhoods, housing estates or other housing areas experiencing deprivation.
2.52 A National Rank is used in the maps throughout this section and ranks all the
Domains of Deprivation from 1 (most deprived) to 32,482 (least deprived). The English Indices of Deprivation are able to show where there are pockets of high relative deprivation within a local authority compared to other small areas in England. The English Indices of Deprivation 2010 are made up as follows:
• Index of Multiple Deprivation (IMD)
Domains
• Income Domain
• Employment Domain
• Health & Disability Domain
• Education, Skills and Training Domain
• Crime Domain
• Living Environment Domain
• Housing and Barriers to Services Domain
Sub-Domains
• Indoors Living Sub Domain
• Outdoors Living Sub Domain
• Wider Barriers Sub Domain
• Geographical Barriers Sub Domain
• Skills Sub Domain
• Children and Young People Sub Domain
Supplementary Income Indexes
• Income Deprivation for Older People Index
• Income Deprivation for Children Index 2.53 Although there is no single measure which enables England’s 326 district
local authorities to be compared, local authority District Summaries provide an indication of comparative deprivation. The following table provides the rank and scores of the LSOAs for Telford and Wrekin.

Telford and Wrekin SHMA
60
Table 2.13: extract from local authority district summaries ID2010
District Rank of Average Rank Rank of Average Score
Telford and Wrekin 105 96
(Source: ID2010 District Summaries, CLG website, http://www.communities.gov.uk/corporate/. Contains public sector information licensed under the Open Government Licence v1.0 (http://www.nationalarchives.gov.uk/doc/open-government-licence/.)
Key findings
• Telford and Wrekin is in the top third (32.2%) most deprived local authorities for Rank of Average Rank and is the 29.4% most deprived for Rank of Average Score.
2.54 The Index of Multiple Deprivation is a measure of small area deprivation and
is based on the idea of distinct dimensions of deprivation which can be recognised and measured separately. People may be counted as deprived in one or more of the dimensions depending on the number of types of deprivation that they experience. The overall Index of Multiple Deprivation is a weighted area-level aggregation of these specific dimensions of deprivation (i.e. the seven Domains of Deprivation).
2.55 Patterns have been examined for those Domains and sub-Domains of most
relevance to understanding the need and demand for housing, and for identifying the existence of discreet and continuous small areas. Maps are provided below with accompanying tables included in the appendices.
• the overall Index of Multiple Deprivation, 2010;
• Income Domain and the supplementary Income Deprivation Affecting Older People Index (affecting affordability issues for housing) ;
• Employment Domain
• Health and Disability Domain
• Indoors Living Sub Domain which is concerned with measuring the quality of housing (stock condition and lack of central heating); and
• Wider Barriers Sub-Domain which includes housing indicators (overcrowding, homelessness and access to owner occupation)
Index of Multiple Deprivation 2010 2.56 The following map shows levels of relative deprivation for the Index of Multiple
Deprivation 2010 using national rank in small areas in Telford and Wrekin.

Telford and Wrekin SHMA
61
Map 2.4

Telford and Wrekin SHMA
62
Key findings
• 13% of small areas (14 LSOAs) in Telford and Wrekin were in the 10% most deprived nationally for the Index of Multiple Deprivation. These areas are all within the Telford sub area.
• A further 11% of small areas (12 LSOAs) were in the 11% to 20% most deprived nationally. Therefore almost one quarter (24.1%) of small areas in Telford and Wrekin were in the top quintile for the Index of Multiple Deprivation. All these areas were within the Telford sub area.
• The Newport and Rural sub areas show very little relative national deprivation for the Index of Multiple Deprivation 2010.
2.57 Income Domain measures the proportion of people within each LSOA that are
income deprived using the following measures:
• Adults and children in Income Support families;
• Adults and children in income-based Jobseeker’s Allowance families;
• Adults and children in Pension Credit (Guarantee) families;
• Adults and children in Child Tax Credit families (who are not claiming Income Support, income-based Jobseeker’s Allowance or Pension Credit) whose equivalised income (excluding housing benefits) is below 60% of the median before housing costs; and
• Asylum seekers in England in receipt of subsistence support, accommodation support, or both.
2.58 There are two supplementary indexes for income; these being Income
Deprivation Affecting Older People Index (IDAOP) and the Income Deprivation Affecting Children Index. The Income Deprivation Affecting Older People Index is included in this report due to the high percentage of older people in the population of Telford and Wrekin and its potential to identify housing affordability issues. This index represents income deprivation affecting older people as a proportion of living in income support or income based Job Seekers Allowance or Pension Credit Guarantee families.
2.59 The following maps show relative deprivation for national rank for Income
Deprivation and the Income Deprivation Affecting Older People Index.

Telford and Wrekin SHMA
63
Map 2.5

Telford and Wrekin SHMA
64
Map 2.6

Telford and Wrekin SHMA
65
Key findings
• 14% of small areas (15 LSOAs) in Telford and Wrekin were in the 10% most deprived in England for income deprivation. All these were located within the Telford sub area.
• A further 12% of small areas (13 LSOAs) in Telford and Wrekin were in the 11% to 20% most deprived in England. Therefore just over one quarter (26%) of small areas in Telford and Wrekin were in the top quintile for the income domain of deprivation. These areas were all located within the Telford sub area.
• There was only one small area in Newport in the 21% to 30% most deprived and three small areas in the 41% to 50% most deprived for the Income domain of deprivation.
• 7% of small areas (7 LSOAs) in Telford and Wrekin were in the 10% most deprived nationally for the Index of Deprivation Affecting Older People Index (IDAOP). These were all located in the Telford sub area.
• Just over one fifth of small areas (22 LSOAs) were in the 11% to 20% most deprived nationally for the IDAOP. Therefore more than one quarter (27%) of small areas in Telford and Wrekin were in the top quintile for the IDAOP. These were all located in the Telford sub area.
• There was only one small area in Newport in the 21% to 30% most deprived, two small areas in the 31% to 40% most deprived and one small area in the 41% to 50% most deprived for the IDAOP.
• There was only one small area in the 31% to 40% most deprived in the Rural sub area. This area was geographically spread over a larger area than many of the other small areas in Telford and Wrekin indicating a scattered population.
Employment Domain
2.60 This Domain measures employment deprivation conceptualised as ‘involuntary exclusion of the working age population from the world of work’. The employment-deprived are defined as ‘those who would like to work but are unable to do so through unemployment, sickness or disability’. A combined count of employment deprived individuals per LSOA is calculated by summing the following seven indicators:
• Claimants of Jobseeker’s Allowance (both contribution-based and income-based), women aged 18-59 and men aged 18-64;
• Claimants of Incapacity Benefit aged 18-59/64;
• Claimants of Severe Disablement Allowance aged 18-59/64;

Telford and Wrekin SHMA
66
• Claimants of Employment and Support Allowance aged 18-59/64 (those with a contribution-based element);
• Participants in New Deal for 18-24s who are not claiming Jobseeker’s Allowance;
• Participants in New Deal for 25+ who are not claiming Jobseeker’s Allowance; and
• Participants in New Deal for Lone Parents aged 18 and over (after initial interview).
2.61 The following map maps shows relative deprivation for national rank for the Employment Domain.

Telford and Wrekin SHMA
67
Map 2.7

Telford and Wrekin SHMA
68
Key findings
• 15% of small areas (16 LSOAs) in Telford and Wrekin were in the 10% most deprived nationally. These small areas were all in the Telford sub area.
• A further 17% of small areas (18 LSOAs) in Telford and Wrekin were in the 11% to 20% most deprived nationally. Therefore 32% of small areas in Telford and Wrekin were in the top quintile for the Employment Domain. These small areas were all in the Telford sub area.
• There were two small areas in the Newport sub area in the 31% to 40% most deprived and one small area in the 41% to 50% most deprived nationally for the Employment Domain.
• There was one small area in the Rural sub area in the 41% to 50% most deprived. This area was geographically larger than many of the small areas in Telford and Wrekin indicating a scattered population.
Health and Disability Deprivation Domain 2.62 This Domain measures premature death and the impairment of quality of life
by poor health. It considers both physical and mental health. The Domain measures morbidity, disability and premature mortality but not aspects of behaviour or environment that may be predictive of future health deprivation. Health deprivation and disability is included as one of the seven domains because ill health is an important aspect of deprivation that limits an individual’s ability to participate fully in society.
2.63 Because it is generally accepted that the risk of ill health and death becomes
greater as a person ages, this domain aims to capture unexpected deaths or levels of ill health by using age and sex standardised data. This means that the expected levels of health in a small areas, given their age and sex composition, are compared rather than the absolute levels of health. The indicators consist of:
• Years of Potential Life Lost: An age and sex standardised measure of
premature death.
• Comparative Illness and Disability Ratio: An age and sex standardised morbidity/disability ratio.
• Acute morbidity: An age and sex standardised rate of emergency admission to hospital.
• Mood and anxiety disorders: The rate of adults suffering from mood and anxiety disorders.
The following map shows national rank of Health and Disability Domain
Deprivation for small areas within Telford and Wrekin

Telford and Wrekin SHMA
69
Map 2.8

Telford and Wrekin SHMA
70
Key findings
• 4% of small areas (4 LSOAs) in Telford and Wrekin were in the 10% most deprived for the Health and Disability Deprivation Domain. These small areas were all in the Telford sub area.
• Just over one fifth of small areas (23 LSOAs) were in the 11% to 21% most deprived for the Health and Disability Deprivation Domain. Therefore one quarter (25.0%) were in the top quintile for this domain of deprivation. These small areas were all in the Telford sub area.
• Only one small area in Newport was in the 21% to 30% most deprived for the Health and Disability Deprivation Domain.
• Only one small area in the Rural sub area was in the 31% to 40% most deprived nationally for the Health and Disability Deprivation Domain. This small area covered a wider geographical area than many of the small areas in Telford and Wrekin indicating a scattered population.
Living Environment Domain 2.64 The Living Environment Domain combines the Indoors Living Sub Domain and
the Outdoors Living Sub Domain. The sub Domains are combined so that the Indoors Living Sub Domain has two thirds of the weighting and the Outdoors Living Sub Domain has one third of the weighting.
2.65 The Indoors Living Sub Domain has been included in this analysis to identify
whether there may be sub-standard housing and in how many areas. The data is based on the 2001 Census ‘lack of central heating’ and the 2005 English House Condition Survey for ‘poor condition of housing.’ The Sub Domain contains the following housing indicators:
• Housing in poor condition: The proportion of social and private homes that fail to meet the decent homes standard.
• Houses without central heating: The proportion of houses that do not have central heating.
2.66 The following map shows national rank of Indoors Living Sub Domain Deprivation for small areas within Telford and Wrekin.

Telford and Wrekin SHMA
71
Map 2.9

Telford and Wrekin SHMA
72
Key findings
• Telford and Wrekin had no small areas in the top quintile for the Indoors Living Sub Domain.
• There was one small area in the 21% to 30% most deprived nationally. This was located in the Newport sub area.
• The majority (88.0%) of small areas (95 LSOAs) were in the 49% least deprived for the Indoors Living Sub Domain, therefore there was not a high degree of relative deprivation for this housing indicator (poor stock condition and lack of central heating), although there were some areas with some degree of relative deprivation.
Housing and Services Domain: Wider Barriers Sub-Domain 2.67 The Housing and Services Domain is made up of two sub Domains. of which
the Wider Barriers Sub-Domain contains the following housing indicators:
• Household overcrowding: the proportion of all households in an LSOA which are judged to have insufficient space to meet the household’s needs.
• Homelessness: the rate of acceptances for housing assistance under the homelessness provisions of housing legislation.
• Housing affordability: the difficulty of access to owner-occupation, expressed as a proportion of households aged under 35 whose income means that they are unable to afford to enter owner occupation.
2.68 The following map shows relative deprivation for the Wider Barriers Sub-
Domain of Deprivation.

Telford and Wrekin SHMA
73
Map 2.10

Telford and Wrekin SHMA
74
Key findings
• There were no small areas in Telford and Wrekin in the top quintile for the Wider Barriers Sub Domain.
• Just over four fifths (80.6%) of the small areas (87 LSOAs) in Telford and Wrekin were in the 49% least deprived for the Wider Barriers sub domain. All of the Rural sub area was in the 49% least deprived nationally for this sub domain.
Key findings 2.69 Pulling together data and information that has been collated on deprivation, it
is possible to draw the following conclusions:
• Telford and Wrekin is in the 3% most deprived local authorities for Rank of Average Rank and the 29% most deprived for Rank of Average Score, therefore there is some degree of relative deprivation within small areas in the local authority.
• 13% of small areas in Telford and Wrekin were in the 10% most deprived nationally for the combined Index of Multiple Deprivation. These small areas showed some high levels of income deprivation including income deprivation affecting children, employment and education deprivation including both the child and skills Education sub domains. There was also some high crime and health deprivation in these areas and some high income deprivation affecting older people. There was some relative deprivation for Housing Indicators; however, none of the areas were in the 30% most deprived for either the Indoors Living sub domain nor the Wider Barriers sub domain.
• 14% of small areas in Telford and Wrekin were in the 10% most deprived for the Income Domain, 15% for the Employment Domain, 7% for the Income Deprivation Affecting Older People Index and 4% for the Health and Disability Deprivation Domain.
• 24% of small areas in Telford and Wrekin were in the top quintile for national deprivation for the combined Index of Multiple Deprivation, 26% for the Income Domain, 27% for the Income Deprivation Affecting Older People Index, 32% for the Employment Domain and 21% for the Health Domain.
• None of the small areas in Telford and Wrekin were in the top quintile for national deprivation for the Housing Indicators; these being, the Indoors Living sub domain (stock condition and lack of central heating) and Wider Barriers (Access to Owner Occupation for Under 35s, Homelessness and Overcrowding). 12% of small areas showed some relative deprivation for

Telford and Wrekin SHMA
75
the Indoors Living Sub domain and 19% of small areas showed some relative deprivation for the Wider Barriers sub domain.
Geo-demographic profiling and the identification of distinct small areas 2.70 Geo-demographic data identifies the likely characteristics of local areas within
Telford and Wrekin, for example tenure and income levels. By identifying the extent to which small areas reflect shared or contrasting composition, such data can help to identify distinct and continuous sub-areas or localities such as neighbourhoods, housing estates or other housing areas.
2.71 Data is not yet available from the 2011 Census Output and therefore this
analysis of Area Classification is drawn from 2001 Census. 2011-based outputs will be announced using the following link: http://areaclassification.org.uk/ The classification comprises 41 variables selected from the Key Statistics tables of the 2001 Census within five main ‘domains’ of Demographic Structure, Household Composition, Housing, Socio-Economic and Employment. The classification takes the form of a three tier hierarchy:
• the first - at the larger scale consists of 7 ‘Super-Groups’ - details of which are provided as appendices
• the second of 21 ‘Groups’ - details of which are provided as appendices; and
• the third tier, with the greatest level of detail, is labelled ‘Sub-Groups’ of which there are 52.
2.72 The Super Groups and Groups have variables with proportions that are
below, above or close to the national average. Some information is given below for the characteristics of the 7 Super Groups.
2.73 The OAC Users Group provides a Grand Index which combines the OAC with
the British Population Survey 2008. It uses an Index where 100 is the national average. For the purposes of this analysis, two tables have been included for the Super Groups, one on tenure and one on income. The precise income levels are at the 2008 level, therefore they will not be as up to date as CACI household income data but they give a flavour of the likely situation at a local level. The Grand Index includes information on other topics such as internet access, social class, work status, newspaper reading, car ownership and shopping.
Super Groups 2.74 The following map shows the location and characteristics of the 7 Super
Groups within Telford and Wrekin.

Telford and Wrekin SHMA
76
Map 2.11

Telford and Wrekin SHMA
77
Key findings
• Applying OAC has clearly confirmed the validity of the three main Telford and Wrekin sub-areas with Countryside defining the Rural sub area and boundaries to Telford and Newport. However, there is a patchwork of Super Groups at small area level. The two main Super Groups identified are:
• Blue Collar Communities as the main Super Group represented in 30% of small areas in Telford and Wrekin (155 LSOAs). The majority (152) of these small areas were in the Telford sub area and the remaining 3 were located in Newport. It can be seen from the Grand Index tables that these communities are more likely to have household incomes between £4,500 and £29,999 per annum, and that social housing is a more likely tenure. The Super Group characteristics show that public renting and terraced housing are above average, and that living in flats and having Higher Education qualifications is below average.
• Prospering Suburbs is the second main Super Group represented in 29% of the small areas in Telford and Wrekin (151 LSOAs). These areas are dispersed across mainly the Telford and Newport sub areas, with just a small number in parts of the Rural sub area. It can be seen from the Grand Index tables that these communities are more likely to have household incomes from £25,000 upwards including over £100,000, and that owner occupation is a more likely tenure. The Super Group characteristics show that Detached Housing and 2+ Car households are above average, and that living in flats or terraced housing, renting public or private housing, or having no central heating are below average.
Groups
2.75 The following map shows OAC Groups in Telford and Wrekin and is
followed by two ‘zoomed-in’ maps for the Telford and Newport Sub Areas. It was not possible to create maps for the sub areas only as the 2001 Census output areas do not fit with the boundaries of the sub areas, therefore the counts of Census Output Areas in the legends in the zoomed in maps apply to the whole of Telford and Wrekin. It is possible to see the Groups in the Rural sub area without a zoomed in map. It was possible to produce a table for Newport Groups as the Census output areas were a close fit to the boundary of Newport.

Telford and Wrekin SHMA
78
Map 2.12
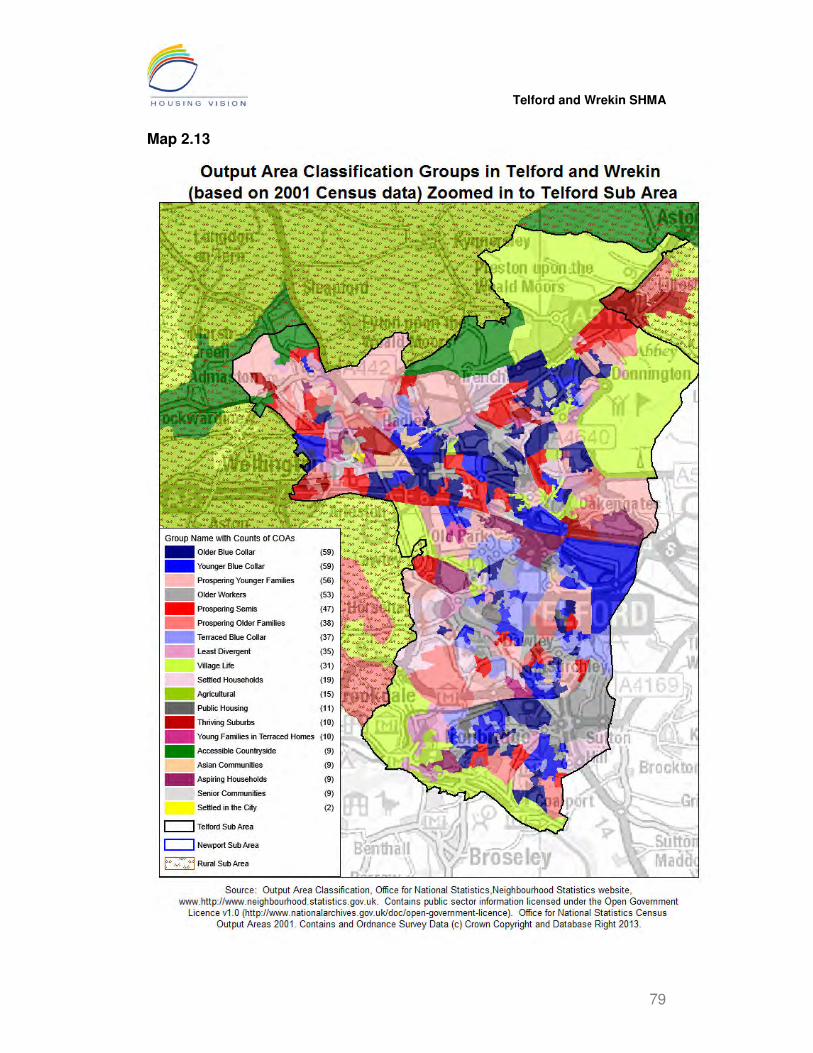
Telford and Wrekin SHMA
79
Map 2.13
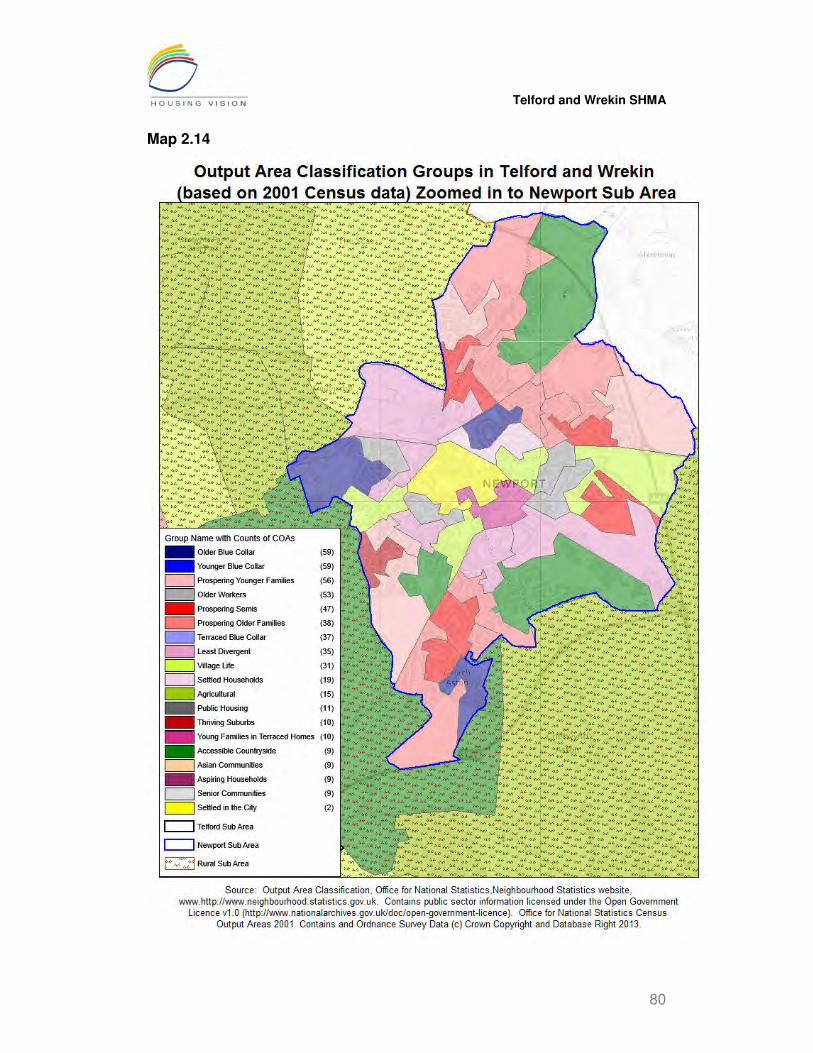
Telford and Wrekin SHMA
80
Map 2.14

Telford and Wrekin SHMA
81
Key findings
• There was a high level of internal differentiation in Telford and Wrekin and with the exception of Newport, no evidence of discreet and continuous sub-areas, for example:
• The Older Blue Collar, Younger Blue Collar, Prospering Young Families and Older Workers Groups were represented in more than 50 Census Output Areas.
• Prospering Semis was represented in 47 Census Output Areas.
• Prospering Older Families, Terraced Blue Collar, Least Divergent and Village Life were represented in between 30 and 39 Census Output Areas with these as their main Group; these being,
• Settled Households, Agricultural, Public Housing, Thriving Suburbs and Younger Families in Terraced homes were represented in between 10 and 19 Census Output Areas.
Population and household changes and projections
2.76 Telford and Wrekin Council has had a longstanding concern over the
accuracy of ONS and CLG-related population and household projections, considering these to be an underestimate. DCLG’s 2008-based projections have been applied in this SHMA for the following reasons:
1. 2008-based household projections are based on long term trends
identified between the 1971 and 2001 Censuses, also updated with reference to the 2008 Labour Force Survey.
2. 2011-based household projections have only a 10 year span to
2021 when 20 year projections are required. No clear guidance is available in relation to the subsequent 10-year period to 2031 and 10 years is too short a period to have confidence in any variations from long term trends.
3. The 2011 Census identified ‘out of trend’ population and household
changes, most significantly:
• Lower than anticipated increases in lone parent households;
• Lower than anticipated increases in one person households;
• Lower than anticipated increases in couple households;
• Large increases in couples with one or more adults compared with projected decline; and

Telford and Wrekin SHMA
82
• Large increases in other multi-person households compared with projected decline.
4. The question is, to what extent do these changes reflect short-term
shifts from longer term trends? And to what extent are they the result of the extreme economic conditions prevailing between 2001 and 2011, a period which might be characterised as progressing from economic ‘boom’ to ‘bust’?
5. In such circumstances, problems of affordability; constrained
access to housing finance then economic uncertainty have depressed household formation resulting in less single and couple households and more families with older children and adults sharing housing.
6. Whilst plausible, such explanations are currently little more than
conjecture and It may well be that, once economic conditions improve, patterns of household formation return to longer term trends.
7. However, until evidence confirms the persistence of such ‘out of
trend’ changes, it is our strongest recommendation to apply the long term trend-based 2008-based household projections.
Projected population by age 2.77 As the most recently available with a projection period of 20 years, this
section uses ONS 2010-based subnational population projections to identify possible trends from 2011-2031. It is important to emphasise that these population projections have not yet informed the construction of 20 year household projections and therefore, 2008-based household projections have been applied in this report. These population estimates are released by ONS every 2 years and reflect changes to birth and mortality rates and to net migration. ‘Interim 2011-based Subnational population projections for England’ were produced following completion of this SHMA but variations are minimal as the same assumptions were applied concerning birth and mortality rates. These population projections inform household projections which are the key factor influencing the future requirement for housing. 2010-based population projections estimated a total population of 165,500 in Telford and Wrekin at 2011 compared with a Census estimate of 166,641. Consequently the projections presented below should be considered a slight underestimate. Population projections data has been expressed as both a table and bar chart both of which clearly identify the changing profile of the area’s population by age, especially the real and proportionate increase in the oldest age groups.

Telford and Wrekin SHMA
83
Table 2.14: projected change in the population of the Telford and Wrekin Council area by age band, 2011-2031, 000s
Age Band 2011 2016 2021 2026 2031
Population Change
% Change 2011 to 2031
0-14 31,200 31,800 33,000 33,000 32,000 +800 +2.6
15-24 22,400 21,600 20,400 20,900 22,400 - -
25-34 19,100 21,800 22,800 21,900 21,100 +2,000 +10.5
35-44 23,600 20,200 20,200 22,600 23,600 - -
45-54 23,500 25,100 22,900 19,800 20,000 -3,500 -14.9
55-64 20,500 20,100 22,200 23,800 21,700 +1,200 +5.9
65-74 14,600 17,200 18,200 18,200 20,300 +6,600 +39.0
75-84 7,800 9,200 11,100 13,500 14,400 +6,600 +84.6
85+ 3,000 3,500 4,400 5,700 7,500 +4,500 +150.0
All ages 165,500 170,600 175,200 179,300 182,800 +17,300 10.5 (Source: Sub-National Population Projections ONS 2010, Office for National Statistics website, http://www.ons.gov.uk/ons/index.html.Contains public sector information licensed under the Open Government Licence v1.0 http://www.nationalarchives.gov.uk/doc/open-government-licence/.)
Key findings
• The population in Telford and Wrekin is projected to increase by 17,300 (almost 11%) between 2011 and 2031.
• The age profile of the population is expected to change in Telford and Wrekin;
• 3% growth is projected in those aged under 15;
• No change is projected in those aged 15-24
• 11% growth is projected in those aged 25-34;
• No change is projected for those aged 35 - 44;
• 15% decline is projected in those aged 45-54; and
• 6% growth is projected in those aged 55-64.
• Higher levels of growth are projected for all those aged 65 as follows:
• 39% growth in those aged 65-74;
• 85% growth in those aged 75-84; and

Telford and Wrekin SHMA
84
• 250% growth in those aged 85 and over. This latter group has the greatest need for housing with care.
• The high projected growth in the older population will result in:
• a proportionately higher level of the under-occupation of family housing unless options to downsize are available; and
• a proportionately greater requirement for housing which meets the requirements of older households, including housing with care.
2.78 The following chart demonstrates graphically the changing age profile
of the Council area’s population between 2011 and 2031 as detailed above.
Figure 2.2: the effect of change in the population of the Telford and Wrekin Council area by age band, 2011-2031, 000s
0 2 4 6 8 10 12 14 16 18 20
2011
2016
2021
2026
2031
0-14 15-24 25-34 35-44 45-54 55-64 65-74 75-84 85+
(Source: Sub-National Population Projections ONS 2010, Office for National Statistics website, http://www.ons.gov.uk/ons/index.html. Contains public sector information licensed under the Open Government Licence v1.0 http://www.nationalarchives.gov.uk/doc/open-government-licence/.)
2.79 Subsequent to the publication of 2011 Census data, ONS issued
revised and ‘interim’ population projections but only for the period 2011-2021. These can be accessed at: http://www.ons.gov.uk/ons/publications/re-reference-tables.html?edition=tcm%3A77-274527 When compared with the 2010-based projections above, the principal changes identifiable for the period 2011 and 2021 are:
• an overall increase of 1,400 people;

Telford and Wrekin SHMA
85
• 0-14: an increase in the region of 1,200;
• 15-24: an increase in the region of 200;
• 25-34: a reduction in the region of 300;
• 35-44: an increase in the region of 1,400;
• 45-54: no change
• 55-64: no change;
• 65-74: a reduction in the region of 500;
• 75-84: a reduction in the region of 300;
• 85+: a reduction in the region of 100. Understanding components of population change
2.80 Population projections form the basis of household projections which in
turn inform the requirement for housing and the following table summarises components of population change for the period 2011-2031, and the extent to which population change is driven by natural change and migration.
Table 2.15: 2010-based components of population change for Telford and Wrekin, 2011-2031, 000s
2011 2012-
16 2017-
21 2022-
26 2027-
31
Total 2012-
31 Natural Change 0.90 4.70 4.20 3.40 2.60 14.90
Births 2.20 11.50 11.10 10.70 10.50 43.80
Deaths 1.30 6.50 7.00 7.30 7.90 28.70
All Migration Net 0.00 0.50 0.50 0.70 1.00 2.70 Internal Migration In 5.20 26.20 26.50 26.70 27.50 106.90
Internal Migration Out 5.70 28.80 29.00 29.00 29.20 116.00
International Migration In 0.90 5.00 5.00 5.00 5.00 20.00
International Migration Out 0.30 2.00 2.00 2.00 2.00 8.00
Cross Border Migration In 0.60 2.70 2.50 2.50 2.50 10.20 Cross Border Migration Out 0.60 3.00 3.00 3.00 3.00 12.00 (Source: components of population change, 2010-based Sub-National population projections ONS, Office for National Statistics website, http://www.ons.gov.uk/ons/index.html. Contains public sector information licensed under the Open Government Licence v1.0 http://www.nationalarchives.gov.uk/doc/open-government-licence/.)

Telford and Wrekin SHMA
86
Key findings:
• Expressed as the net effect of Births in relation to Deaths, Natural Change is the single most significant component of projected population change for Telford and Wrekin between 2012 and 2031, resulting in a net increase of 14,900 people. However, this will have little effect on household projections as few of those born during this period will have reached the age of household formation.
• Internal migration identifies a projected net loss of 9,100 people between 2012 and 2031, the component of projected population change which has the most significance for household projections. International migration is projected to more than compensate for this loss resulting in an overall gain of 2,700 people through All Migration. However, international migration is the least predictable of all components of population change.
Household projections
2.81 As explained above, this section uses CLG 2008-based household
projections to identify trends for the Telford and Wrekin area from 2011-2031. Methodology
2.82 The following extracts explain the methodology underpinning
household projections.
“Household projections are based on the population projections produced by the Office for National Statistics (ONS). The number of people living in private households is estimated by taking the population projections for each year and subtracting the number of people living in communal establishments, such as student halls of residence, care homes or prisons.
Household representative rates are projected using logistics time series trends from Census data, by age, marital status and gender. Household representative rates combined with the private household population provides the basic household projections.
To estimate the number of households of each type, information on household type and age group is projected forward from the 1991 and 2001 Censuses, for each household type, age group and local authority area. This is constrained to the total number of households.

Telford and Wrekin SHMA
87
Because the overall projections for England are believed to be more accurate than those for individual local authorities, the local authority figures are constrained to the England total”.11.
Population projections
2.83 The first main input into the household projections is population
projections for England produced by the ONS. These are produced for England by local authority, sex and single year of age, using assumptions about births, deaths and migration. The relevant population for household formation is taken to be the adult population aged 16 or over.
2.84 The current methodology for producing the household projections has
remained largely unchanged since the 1996 based household projections released in October 1999. In the current method, projected household representative rates are applied to a projection of the private household population disaggregated by age, sex and marital/cohabitational status and summing the resulting projections of household representatives. The key data sources and methodological stages are:
• Population projections are taken from the latest release by the Office for National Statistics (ONS) at the national and subnational level.
• Marital status projections (de jure and de facto) at the national level are taken from the latest ONS release. Projections at subnational levels are assumed to follow the national pattern.
• The institutional population is deducted from the total population to give the private household population. The institutional population is assumed to stay at a constant level for younger age groups and at a constant share of the population for older age groups (as given in the 2001 Census).
• Household representative rates are extrapolated from Census data (1971, 1981, 1991, 2001), disaggregated by age, sex and marital status. Labour Force Survey (LFS) data are used to inform inter-Censual interpolations, post-Census estimates and future trends of household representative rates. The LFS and Census data are weighted together with the LFS data being given a lower weight than the Census.
11
Technical Report, Households Across the United Kingdom, 30/8/2011, Published by Statistical Directorate Welsh Government January 2011 and Updated August 2011, page 3

Telford and Wrekin SHMA
88
• The resultant household representative rates are applied to the projected private household population and summed across the age/sex/marital status groups to give total household numbers.
• Projections are initially undertaken independently at the national, regional and sub-regional levels with regional projections then being constrained to the national projections and sub-regional projections being constrained to regional projections’ 12.
2.85 A detailed description of the current methodology and data sources
used is available at
http://www.communities.gov.uk/housing/housingresearch/housingstatistics/housingstatisticsby/householdestimates
2.86 Resulting household projections data can be broken down into different
household types as follows:
• One person household
• Couple: no dependent children
• A couple and one or more other adults: no dependent children
• Couple + dependent child(ren)
• Lone parent + dependent child(ren)
• Couple + adult(s) +dependent child(ren)
• Lone parent + adult(s) +dependent child(ren)
• Other households: a multi person household that is neither a couple household nor a lone parent household. Examples include, lone parents with only non-dependent children, brothers and sisters and unrelated (and non-cohabiting) adults sharing a house or flat. This category does not include households with dependent children
2.87 As demonstrated in the following charts, between 2011 and 2031, the
number of households is projected to increase by 9,702 or 14.2% in Telford and Wrekin with dramatic growth in single person households and reduction in family households with the exception of lone parent families. Considered by household type, the projected changes are as follows with the following caveats. Projections for family households are less certain than for single or couple households as they are dependent on the continuation of recent trends of relationship breakdown. Projections for couples with one or more adults are the most uncertain projection as recent trends may reverse if more younger people live with parents for economic reasons.
12
Consultation on Proposed Changes to the National Statistics on Household Projections,
CLG 2010, page 6
Telford and Wrekin SHMA
89
• One person: growth of almost 46% most of whom will be older people;
• Couple households: 12.5% growth most of whom will be older people;
• Couple/lone parent and 1 child: 13.3% growth
• Couple/lone parent and 2 children/couple and 1 or more adults no children: 16% decline
• Couple/lone parent and 1 or more adults and 1 child: 37% decline
• Couple/lone parent and 3+ children/ couple/lone parent and 1 or more adults and 2 children: 14% decline
• Couple/lone parent and 1 or more adults 3+ children: 7% decline.

Telford and Wrekin SHMA
90
Figure 2.3

Telford and Wrekin SHMA
91
Figure 2.4

Telford and Wrekin SHMA
92
International migration 2.88 A potentially important component of population change is international
immigration for employment. The registration of UK non-nationals for National Insurance numbers (NINO) provides an invaluable source of data. Data identifies the local authority in which people first registered but they may have gone on to work anywhere in the country. Numbers are only recorded for ten or more migrant workers and therefore, the recorded total may be more than the sum of the entries. The following table summarises the extent of migration for the ten years since 2002.
Table 2.16: National Insurance Registration by Non-UK Nationals, 2002-2012, 000s (as at March 2012)
Year Telford and Wrekin West Midlands England
2002/03 0.39 23.42 309.97
2003/04 0.53 23.5 331.98
2004/05 0.89 28.01 388.03
2005/06 1.49 42.04 579.52
2006/07 1.34 47.23 607.95
2007/08 1.25 46.63 636.88
2008/09 0.89 43.9 607.88
2009/10 0.67 36.25 515.12
2010/11 0.83 47.68 636.45
2011/12 0.69 40.74 541.38
Total 8.97 339 5,155
Change 0.30 17.32 231.41
% Change 76.9 74.0 74.7 (Source: National Insurance Recording and Pay as You Earn System, Summary Tables, DWP website, http://www.dwp.gov.uk/. Contains public sector information licensed under the Open Government Licence v1.0 http://www.nationalarchives.gov.uk/doc/open-government-licence/.)
Key findings
• The total number of NINO Registrations between 2002 and 2011 was 8,970.
• NINO Registrations in Telford and Wrekin were 76.9% greater in the year 2011/12 than in the year 2002/03. This slightly more than in the West Midlands (74.0%) and in England (74.7%).
• Registrations peaked in 2005/06 before a decline in new registrations which may well reflect a fall from the surge in migration following the 2004 EU accession and the worsening economy.

Telford and Wrekin SHMA
93
• It is important to note that ‘returning home’ is not measured so net gain may be much lower.
2.89 The following graph demonstrates the patterns of registrations more clearly. Figure 2.5
(Source: National Insurance Recording and Pay as You Earn System, Summary Tables, DWP website, http://www.dwp.gov.uk/.Contains public sector information licensed under the Open Government Licence v1.0 http://www.nationalarchives.gov.uk/doc/open-government-licence/.)
2.90 The following table identifies the 18 main countries from which 100 or more
people have migrated.

Telford and Wrekin SHMA
94
Table 2.17: NINO Registrations by Nationality people in Telford and Wrekin from 1st January 2002 to March 2012
Nationality Number of People % of Total
Poland 3040 33.7
Ghana 930 10.3
India 800 8.9
Slovak Rep 360 4.0
Pakistan 330 3.7
Rep of Latvia 310 3.4
Netherlands 230 2.5
South Africa 230 2.5
Germany 180 2.0
Hungary 170 1.9
Rep of Lithuania 170 1.9
China Peoples 170 1.9
Czech Rep 150 1.7
Portugal 140 1.6
Nigeria 140 1.6
France 130 1.4
Philippines 110 1.2
Romania 100 1.1
Other Nationalities less than 100 people 1,270 14.1
Total Registrations 9,020 100.0 (Source: DWP Tabulation Tool, DWP website, http://www.dwp.gov.uk/. Contains public sector information licensed under the Open Government Licence v1.0 http://www.nationalarchives.gov.uk/doc/open-government-licence/.
Key findings
• According to the nationality data, there were 9,020 NINO Registrations between 1st January 2002 and March 2012. There were 18 countries with more than 100 NINO Registrations making up 85.9% of the total NINO Registrations for Telford and Wrekin.
• More than one third (33.7%) of the total NINO Registrations were people from Poland, with the next highest being from Ghana (10.3%) and India (8.9%). The remaining 15 countries ranged from 1.1% to 4.0% of the total NINO Registrations and were from a variety of countries.
2.91 The following table uses Census data to identify the proportion of the
population born in the UK and the year of arrival for those who were not born in the UK.
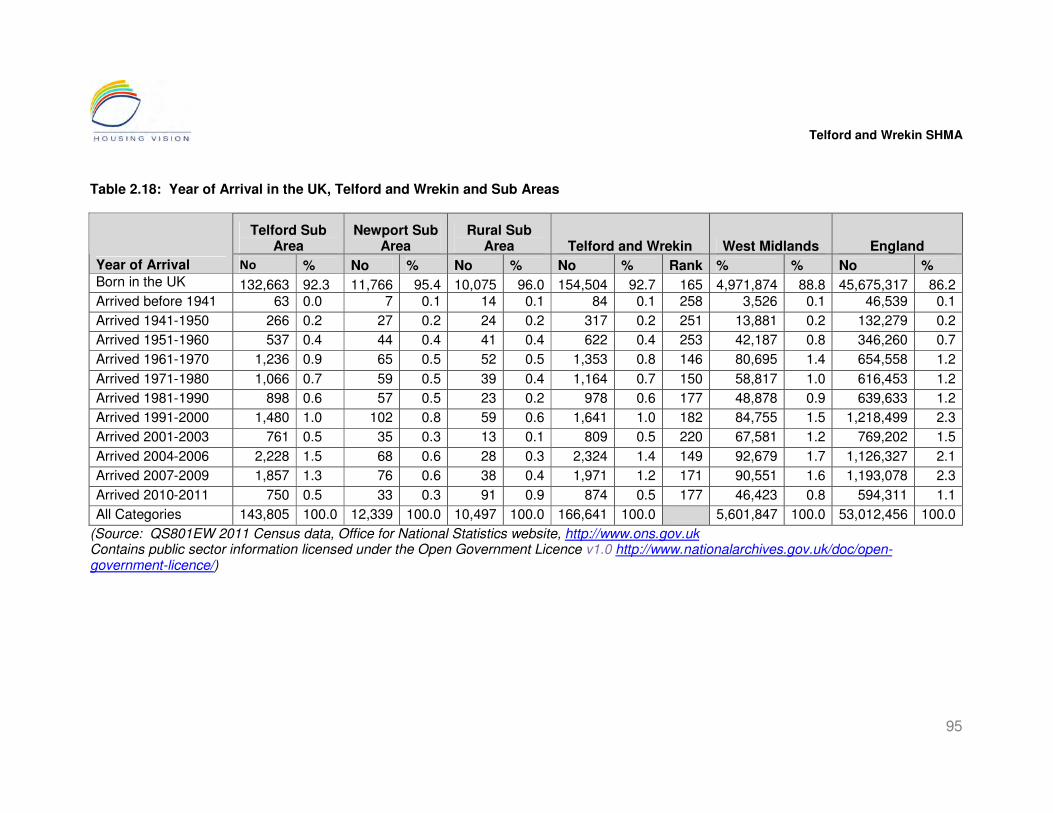
Telford and Wrekin SHMA
95
Table 2.18: Year of Arrival in the UK, Telford and Wrekin and Sub Areas
Telford Sub Area
Newport Sub Area
Rural Sub Area Telford and Wrekin West Midlands England
Year of Arrival No % No % No % No % Rank % % No % Born in the UK 132,663 92.3 11,766 95.4 10,075 96.0 154,504 92.7 165 4,971,874 88.8 45,675,317 86.2 Arrived before 1941 63 0.0 7 0.1 14 0.1 84 0.1 258 3,526 0.1 46,539 0.1
Arrived 1941-1950 266 0.2 27 0.2 24 0.2 317 0.2 251 13,881 0.2 132,279 0.2
Arrived 1951-1960 537 0.4 44 0.4 41 0.4 622 0.4 253 42,187 0.8 346,260 0.7
Arrived 1961-1970 1,236 0.9 65 0.5 52 0.5 1,353 0.8 146 80,695 1.4 654,558 1.2
Arrived 1971-1980 1,066 0.7 59 0.5 39 0.4 1,164 0.7 150 58,817 1.0 616,453 1.2
Arrived 1981-1990 898 0.6 57 0.5 23 0.2 978 0.6 177 48,878 0.9 639,633 1.2
Arrived 1991-2000 1,480 1.0 102 0.8 59 0.6 1,641 1.0 182 84,755 1.5 1,218,499 2.3
Arrived 2001-2003 761 0.5 35 0.3 13 0.1 809 0.5 220 67,581 1.2 769,202 1.5
Arrived 2004-2006 2,228 1.5 68 0.6 28 0.3 2,324 1.4 149 92,679 1.7 1,126,327 2.1
Arrived 2007-2009 1,857 1.3 76 0.6 38 0.4 1,971 1.2 171 90,551 1.6 1,193,078 2.3
Arrived 2010-2011 750 0.5 33 0.3 91 0.9 874 0.5 177 46,423 0.8 594,311 1.1
All Categories 143,805 100.0 12,339 100.0 10,497 100.0 166,641 100.0 5,601,847 100.0 53,012,456 100.0
(Source: QS801EW 2011 Census data, Office for National Statistics website, http://www.ons.gov.uk Contains public sector information licensed under the Open Government Licence v1.0 http://www.nationalarchives.gov.uk/doc/open-government-licence/)

Telford and Wrekin SHMA
96
Key findings
• The 2011 Census table Year of Arrival in the UK shows that majority of the population of Telford and Wrekin was born in the UK (92.7%). This is higher than in the West Midlands (88.8%) and in England (86.2%). 96.0% of the population in Rural were born in the UK compared to 95.4% in Newport and 92.3% in the Telford sub area.
• The remaining 7.3% arrived in the UK at different times with the highest percentage arriving between 2004 and 2009 (2.6%). The most recent year shows arrivals of 0.5%; however, this is only a one year period and if this were to be doubled during 2011 to 2012 then this would be 1.0% and would be a little lower than the previous two year period where it was 1.2%.
• The West Midlands and England also showed higher percentages of arrivals between 2004 and 2009 than in other periods (3.3% in the West Midlands and 4.4% in England. 2.8% of Arrivals in the Telford sub area occurred during this period compared to 1.2% in Newport and 0.7% in Rural.
2.92 The important question raised by such migration is the impact on the housing
market. It is historically the case that migrants to the UK, especially the first wave of single people or those arriving without their family have, through their household composition and short residence, found difficulty in accessing social housing and home ownership has been too expensive. As a result, their initial housing requirements have been met by a combination of the ‘informal market’ of renting through family or friends and most significantly by the private rented sector. It is anticipated that migrants from EU accession countries would have followed this pattern, but further research would be required to confirm it.
Internal migration
2.93 Internal migration refers to population movement within England and can be
an important factor in determining housing requirements. Trends can be monitored using estimates of internal migration prepared using a combination of three administrative data sources, the Patient Register Data Service (PRDS), the National Health Service Central Register (NHSCR) and Higher Education Statistics Agency (HESA) data. Referred to as NHSCR data, it is reliant on people registering with a GP and those groups who are recognised to register at lower rates include students, especially male students and young men. Conversely, families and older people are more likely to register. Please note that figures are rounded to the nearest 10 or 100 by ONS and therefore, totals may vary from the sum. The following tables show the 10 year trend in net migration.

Telford and Wrekin SHMA
97
Table 2.19: net effect of internal migration, Telford and Wrekin, years ending June 2001-11, 000s
2001/ 02
2002/ 03
2003/ 04
2004/ 05
2005/ 06
2006/ 07
2007 /08
2008/ 09
2009/ 10
2010/ 11 Total Ave.
0.5 -0.2 0.0 -0.2 -0.6 -1.0 -0.8 -0.4 -0.6 -0.3 -3.6 -0.36 (Source: Estimates from NHS Patient Registration with GPs data, Office for National Statistics website, http://www.ons.gov.uk/ons/index.html. Contains public sector information licensed under the Open Government Licence v1.0 http://www.nationalarchives.gov.uk/doc/open-government-licence/.)
Key findings
• A 10 year trend identifies a net migration annual average of minus 360 people. There has not been a gain in population through internal migration since 2001/02 and there has been a loss in every other year apart from 2003/04 when there was neither a gain nor a loss.
2.94 The remainder of this section focuses on detailed and recent patterns and trends. The following table and maps show internal migration in and out of Telford and Wrekin to/from Regions for each of the three years up to June 2011 and Net Migration for the three year period ending June 2011.
Table 2.20: Net migration into and out of Telford and Wrekin from/to regions for three years ending June 2011
In Migration Out Migration Net Migration
Regions 2009 2010 2011 2009 2010 2011 3 Years
North East 90 80 90 80 80 90 10
West Midlands 2,670 2,680 2,690 2,610 2,720 2,730 -20
Yorkshire and The Humber 250 240 250 290 240 290 -80
South East 450 370 420 390 510 450 -110
Wales 390 370 410 420 400 480 -130
East 250 210 250 290 270 300 -150
East Midlands 290 310 350 400 370 360 -180
London 200 200 230 270 290 260 -190
South West 340 320 350 460 450 380 -280
North West 440 420 410 560 540 490 -320 (Source: Estimates from NHS Patient Registration with GPs data, Office for National Statistics website, http://www.ons.gov.uk/ons/index.html. Contains public sector information licensed under the Open Government Licence v1.0 http://www.nationalarchives.gov.uk/doc/open-government-licence/.)

Telford and Wrekin SHMA
98
Map 2.15

Telford and Wrekin SHMA
99
Map 2.16

Telford and Wrekin SHMA
100
Map 2.17

Telford and Wrekin SHMA
101
Key findings
• Migration trends over the 3 year period ending June 2011 were remarkably consistent.
• During this period there were more out migrants than in migrants from all the regions except the North East (Net Migration Plus 10). The largest number of out migrants was to the North West (Net Migration Minus 320) followed by the South West (Net Migration Minus 280). These patterns can be most clearly seen in the Net Migration Regional
• The net effect of 3 years migration to June 2011 was a loss of 1,450 people.
• During the most recent year ending June 2011 the largest number of in migrants was from the West Midlands (Plus 2,690); however, there were an even larger number of Out Migrants to the West Midlands (Minus 2,730).
• All other Regions had much smaller numbers of both in and out migrants of than 500.
• It must be remembered that this is a measure of the movement of people and not households. Applying the most reliable average household size from the 2011 Census of 2.1 across the area implies a net loss of in the region of 580 households over the 3 year period ending June 2011, or 193 households per annum and an equivalent demand on the housing market.
2.95 The following table considers internal migration at the local authority level and
the net effect for Telford and Wrekin for the three years ending June 2011. Please note that any anomalies in the balancing figures are due to rounding.

Telford and Wrekin SHMA
102
Table: 2.21: Internal Migration, Telford and Wrekin, year ending June 2009 to year ending June 2011
2009 2010 2011
Local Authority Persons
(Thousands) Persons
(Thousands) Persons
(Thousands)
Inflow Outflow Balance Inflow Outflow Balance Inflow Outflow Balance Telford and Wrekin 5.5 5.9 -0.4 5.4 6.0 -0.6 5.6 6.0 -0.3
West Midlands 101.3 110.1 -8.8 101.4 109.5 -8.1 102.1 109.2 -7.2
(Source: Estimates from NHS Patient Registration with GPs data, Office for National Statistics website, http://www.ons.gov.uk/ons/index.html. Contains public sector information licensed under the Open Government Licence v1.0 http://www.nationalarchives.gov.uk/doc/open-government-licence/.)
Key findings
• Telford and Wrekin lost 400 people in 2008/09, 600 people in 2009/10 and 300 people in 2010/11 therefore the overall loss during the 3 years was 1,300 people (figures in the Regional tables may be different due to rounding). This may well reflect the impact of the economic recession.
2.96 Data on internal migration by age enables limited profiling of the types of people and households moving in and out of
Telford and Wrekin for example, those aged 0-15 can be associated with parents aged 25-44 to indicate families with children; those aged 16-24 will include students and those aged 65+ are pensioner households. The following table summarises patterns for the three years ending June 2011.

Telford and Wrekin SHMA
103
Table 2.22: internal migration by broad ages for three years ending June 2011
2009 2010 2011
Area Age Bands Persons Persons Persons
Inflow Outflow Balance Inflow Outflow Balance Inflow Outflow Balance
Telford and Wrekin All ages 5.5 5.9 -0.4 5.4 6.0 -0.6 5.6 6.0 -0.3
0-15 1.0 0.9 0.1 0.8 1.1 -0.2 1.0 0.9 0.1
16-24 1.7 1.9 -0.2 1.7 1.9 -0.2 1.9 2.1 -0.2
25-44 1.8 2.0 -0.2 1.7 2.0 -0.2 1.8 1.9 -0.1
45-64 0.7 0.8 -0.1 0.8 0.8 0.0 0.7 0.8 -0.1
65+ 0.3 0.2 0.0 0.3 0.2 0.1 0.3 0.3 0.0
West Midlands All ages 101.3 110.1 -8.8 101.4 109.5 -8.1 102.1 109.2 -7.2
0-15 13.8 13.8 0.0 13.8 14.0 -0.2 13.8 13.6 0.2
16-24 40.4 44.5 -4.1 40.4 43.8 -3.4 40.6 44.7 -4.1
25-44 33.5 37.1 -3.7 32.0 35.7 -3.7 32.6 35.0 -2.4
45-64 9.8 10.8 -1.0 10.5 11.2 -0.8 10.4 11.2 -0.8
65+ 3.8 3.9 -0.1 4.8 4.8 -0.1 4.7 4.7 -0.1 (Source: Estimates from NHS Patient Registration with GPs data, Office for National Statistics website, http://www.ons.gov.uk/ons/index.html. Contains public sector information licensed under the Open Government Licence v1.0 http://www.nationalarchives.gov.uk/doc/open-government-licence/.)

Telford and Wrekin SHMA
104
Key findings
• Over the 3 years, there was neither loss nor gain for dependent children aged 0 to 15 year olds; a gain of 100 people aged 65 plus; a loss of 600 people in the 16 to 24 year age group; a loss of 500 people in the 25 to 44 year age group, and a loss of 200 people in the 45 to 64 years age group during the 3 years ending June 2011. It appears that many of those who are leaving are younger people. This may well be for economic reasons in search of employment and/or also students.
• Over the 3 years, there was a gain of 100 people in the 0 to 15 year age group, a loss of 200 people in the 16 to 24 year age group, a loss of 100 people in the 25 to 44 year age group and a loss of 100 people in the 45 to 64 years age group, and neither a gain nor a loss in the 65 plus year age group in the year ending June 2011.
2.97 The following table takes the analysis further by identifying those local
authorities from which 50 or more people moved into the area in any year over the3 year period from 2009-2011.
Table 2.23: internal migration into Telford and Wrekin from local authorities where 50 or more moved, for the 3 years ending June 2011 with 70% level highlighted
In Migrants
Local Authority 2009 2010 2011 3 years
Shropshire UA 1,070 1,210 1,170 3450
Wolverhampton 260 230 270 760
Birmingham 290 250 200 740
Stafford 140 130 150 420
Sandwell 110 90 120 320
Dudley 80 80 110 270
Powys 80 60 110 250
South Staffordshire 120 120 100 340
Walsall 120 100 100 320
Ceredigion 60 60 60 180
Cheshire West and Chester UA 50 40 50 140
Liverpool 30 40 50 120
Stoke-on-Trent UA 60 50 50 160
Cannock Chase 40 60 50 150
Cornwall UA 50 40 50 140
Manchester 50 60 40 150
Leeds 60 50 40 150
Cheshire East UA 50 40 40 130
Totals 2,720 2,710 2,760 8,190

Telford and Wrekin SHMA
105
(Source: Estimates from NHS Patient Registration with GPs data, Office for National Statistics website, http://www.ons.gov.uk/ons/index.html. Contains public sector information licensed under the Open Government Licence v1.0 http://www.nationalarchives.gov.uk/doc/open-government-licence/.)
2.98 The following map shows internal migration from local authorities during the most recent 3 years ending June 2011.

Telford and Wrekin SHMA
106
Map 2.18

Telford and Wrekin SHMA
107
Key findings
• Shropshire UA provided the largest number of migrants into Telford and Wrekin, followed by Wolverhampton and Birmingham in the 3 years ending June 2011.
• This pattern was the same for the most recent year ending June 2011.
2.99 The following table identifies those local authorities from which 50 or more people moved out of the area in any one year over a 3 year period ending June 2011
Table 2.24: internal migration out of Telford and Wrekin to local authorities where 50 or more moved, for the 3 years ending June 2011 with 70% level highlighted
Local Authority Out Migrants
2009 2010 2011 3 years
Shropshire UA 1,200 1,320 1,380 3,900
Birmingham 250 230 220 700
Wolverhampton 210 220 180 610
Stafford 160 150 170 480
South Staffordshire 80 110 100 290
Walsall 70 80 90 240
Manchester 70 80 80 230
Stoke-on-Trent UA 50 80 70 200
Sandwell 70 60 70 200
Ceredigion 70 50 70 190
Powys 90 70 70 230
Dudley 80 50 60 190
Cornwall UA 80 60 60 200
Cheshire West and Chester UA 60 40 50 150
Cheshire East UA 50 60 50 160
Liverpool 60 50 50 160
Leeds 70 50 50 170
Nottingham UA 50 50 50 150
Herefordshire, County of UA 40 30 50 120
Cardiff 30 30 50 110
Wrexham 40 30 50 120
Newcastle-under-Lyme 50 50 40 140
Gwynedd 40 50 40 130
Coventry 50 40 30 120
Wiltshire UA 50 40 40 130
Totals 3,070 3,080 3,170 9,320

Telford and Wrekin SHMA
108
(Source: Estimates from NHS Patient Registration with GPs data, Office for National Statistics website, http://www.ons.gov.uk/ons/index.html. Contains public sector information licensed under the Open Government Licence v1.0 http://www.nationalarchives.gov.uk/doc/open-government-licence/.)

Telford and Wrekin SHMA
109
Map 2.19
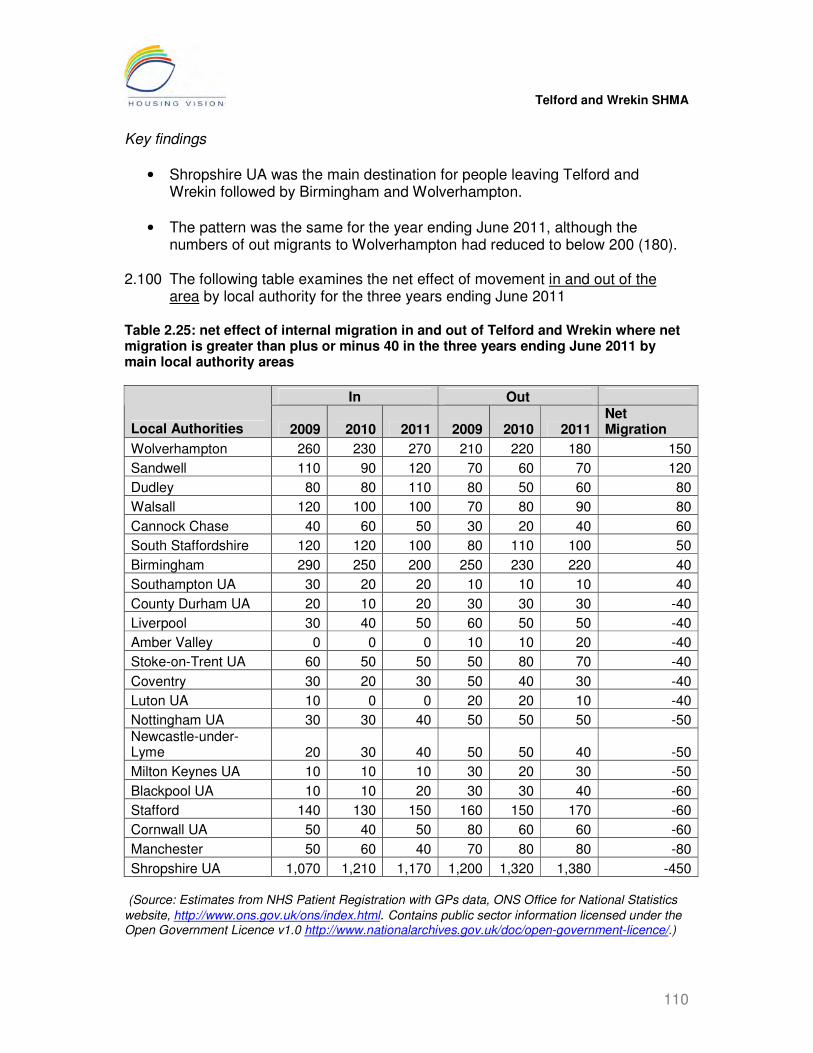
Telford and Wrekin SHMA
110
Key findings
• Shropshire UA was the main destination for people leaving Telford and Wrekin followed by Birmingham and Wolverhampton.
• The pattern was the same for the year ending June 2011, although the numbers of out migrants to Wolverhampton had reduced to below 200 (180).
2.100 The following table examines the net effect of movement in and out of the
area by local authority for the three years ending June 2011 Table 2.25: net effect of internal migration in and out of Telford and Wrekin where net migration is greater than plus or minus 40 in the three years ending June 2011 by main local authority areas
In Out
Local Authorities 2009 2010 2011 2009 2010 2011 Net Migration
Wolverhampton 260 230 270 210 220 180 150
Sandwell 110 90 120 70 60 70 120
Dudley 80 80 110 80 50 60 80
Walsall 120 100 100 70 80 90 80
Cannock Chase 40 60 50 30 20 40 60
South Staffordshire 120 120 100 80 110 100 50
Birmingham 290 250 200 250 230 220 40
Southampton UA 30 20 20 10 10 10 40
County Durham UA 20 10 20 30 30 30 -40
Liverpool 30 40 50 60 50 50 -40
Amber Valley 0 0 0 10 10 20 -40
Stoke-on-Trent UA 60 50 50 50 80 70 -40
Coventry 30 20 30 50 40 30 -40
Luton UA 10 0 0 20 20 10 -40
Nottingham UA 30 30 40 50 50 50 -50 Newcastle-under-Lyme 20 30 40 50 50 40 -50
Milton Keynes UA 10 10 10 30 20 30 -50
Blackpool UA 10 10 20 30 30 40 -60
Stafford 140 130 150 160 150 170 -60
Cornwall UA 50 40 50 80 60 60 -60
Manchester 50 60 40 70 80 80 -80
Shropshire UA 1,070 1,210 1,170 1,200 1,320 1,380 -450 (Source: Estimates from NHS Patient Registration with GPs data, ONS Office for National Statistics
website, http://www.ons.gov.uk/ons/index.html. Contains public sector information licensed under the Open Government Licence v1.0 http://www.nationalarchives.gov.uk/doc/open-government-licence/.)

Telford and Wrekin SHMA
111
2.101 The following map highlights net migration of 80 or more people for the 3 years to June 2011.
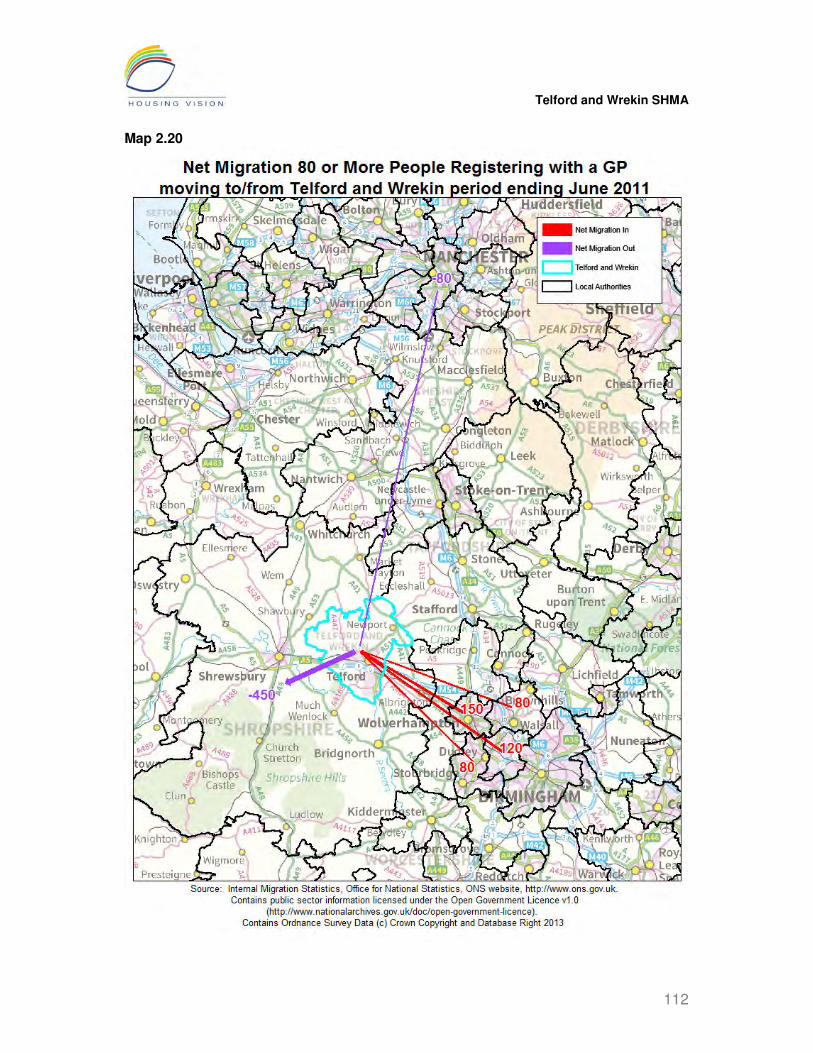
Telford and Wrekin SHMA
112
Map 2.20
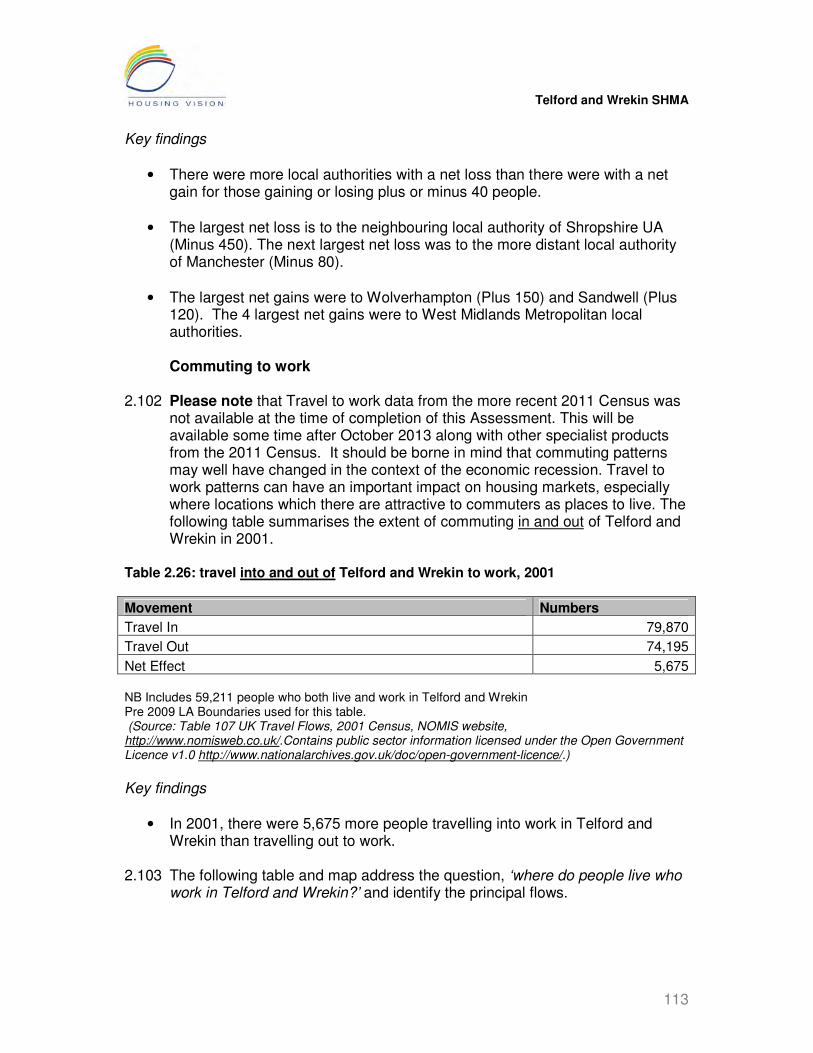
Telford and Wrekin SHMA
113
Key findings
• There were more local authorities with a net loss than there were with a net gain for those gaining or losing plus or minus 40 people.
• The largest net loss is to the neighbouring local authority of Shropshire UA (Minus 450). The next largest net loss was to the more distant local authority of Manchester (Minus 80).
• The largest net gains were to Wolverhampton (Plus 150) and Sandwell (Plus 120). The 4 largest net gains were to West Midlands Metropolitan local authorities. Commuting to work
2.102 Please note that Travel to work data from the more recent 2011 Census was
not available at the time of completion of this Assessment. This will be available some time after October 2013 along with other specialist products from the 2011 Census. It should be borne in mind that commuting patterns may well have changed in the context of the economic recession. Travel to work patterns can have an important impact on housing markets, especially where locations which there are attractive to commuters as places to live. The following table summarises the extent of commuting in and out of Telford and Wrekin in 2001.
Table 2.26: travel into and out of Telford and Wrekin to work, 2001
Movement Numbers
Travel In 79,870
Travel Out 74,195
Net Effect 5,675 NB Includes 59,211 people who both live and work in Telford and Wrekin Pre 2009 LA Boundaries used for this table. (Source: Table 107 UK Travel Flows, 2001 Census, NOMIS website, http://www.nomisweb.co.uk/.Contains public sector information licensed under the Open Government Licence v1.0 http://www.nationalarchives.gov.uk/doc/open-government-licence/.)
Key findings
• In 2001, there were 5,675 more people travelling into work in Telford and Wrekin than travelling out to work.
2.103 The following table and map address the question, ‘where do people live who
work in Telford and Wrekin?’ and identify the principal flows.
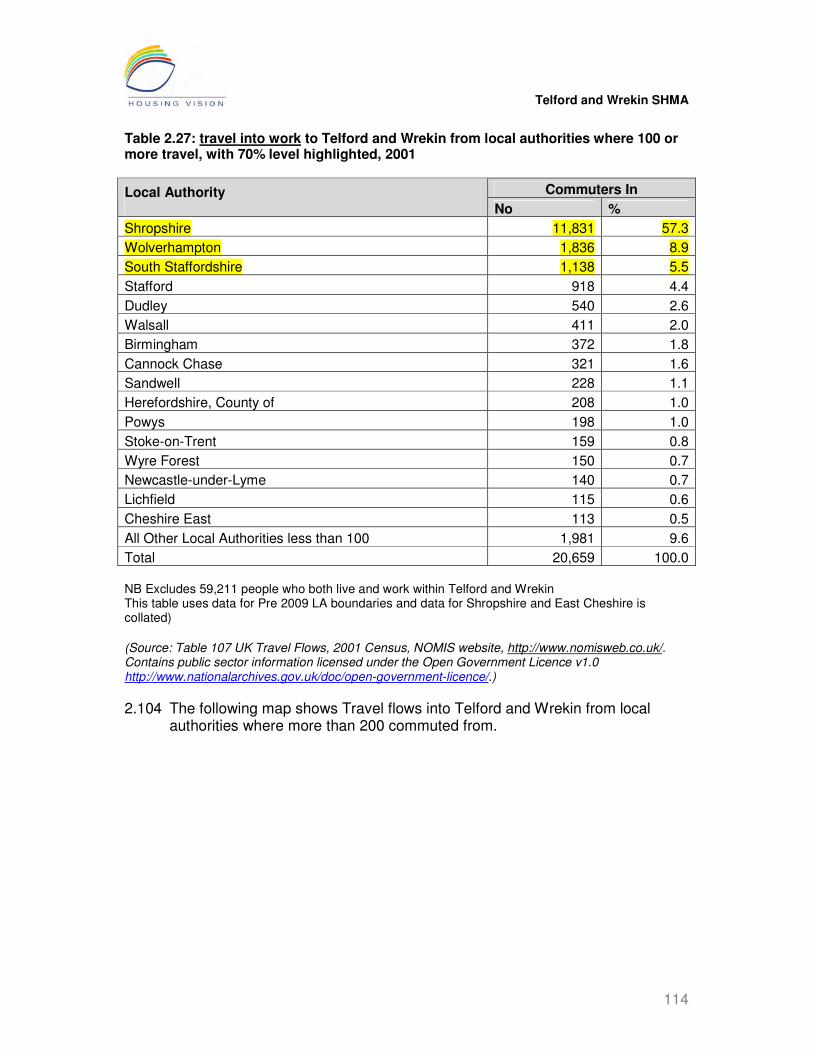
Telford and Wrekin SHMA
114
Table 2.27: travel into work to Telford and Wrekin from local authorities where 100 or more travel, with 70% level highlighted, 2001
Commuters In Local Authority No %
Shropshire 11,831 57.3
Wolverhampton 1,836 8.9
South Staffordshire 1,138 5.5
Stafford 918 4.4
Dudley 540 2.6
Walsall 411 2.0
Birmingham 372 1.8
Cannock Chase 321 1.6
Sandwell 228 1.1
Herefordshire, County of 208 1.0
Powys 198 1.0
Stoke-on-Trent 159 0.8
Wyre Forest 150 0.7
Newcastle-under-Lyme 140 0.7
Lichfield 115 0.6
Cheshire East 113 0.5
All Other Local Authorities less than 100 1,981 9.6
Total 20,659 100.0 NB Excludes 59,211 people who both live and work within Telford and Wrekin This table uses data for Pre 2009 LA boundaries and data for Shropshire and East Cheshire is collated)
(Source: Table 107 UK Travel Flows, 2001 Census, NOMIS website, http://www.nomisweb.co.uk/. Contains public sector information licensed under the Open Government Licence v1.0 http://www.nationalarchives.gov.uk/doc/open-government-licence/.)
2.104 The following map shows Travel flows into Telford and Wrekin from local authorities where more than 200 commuted from.
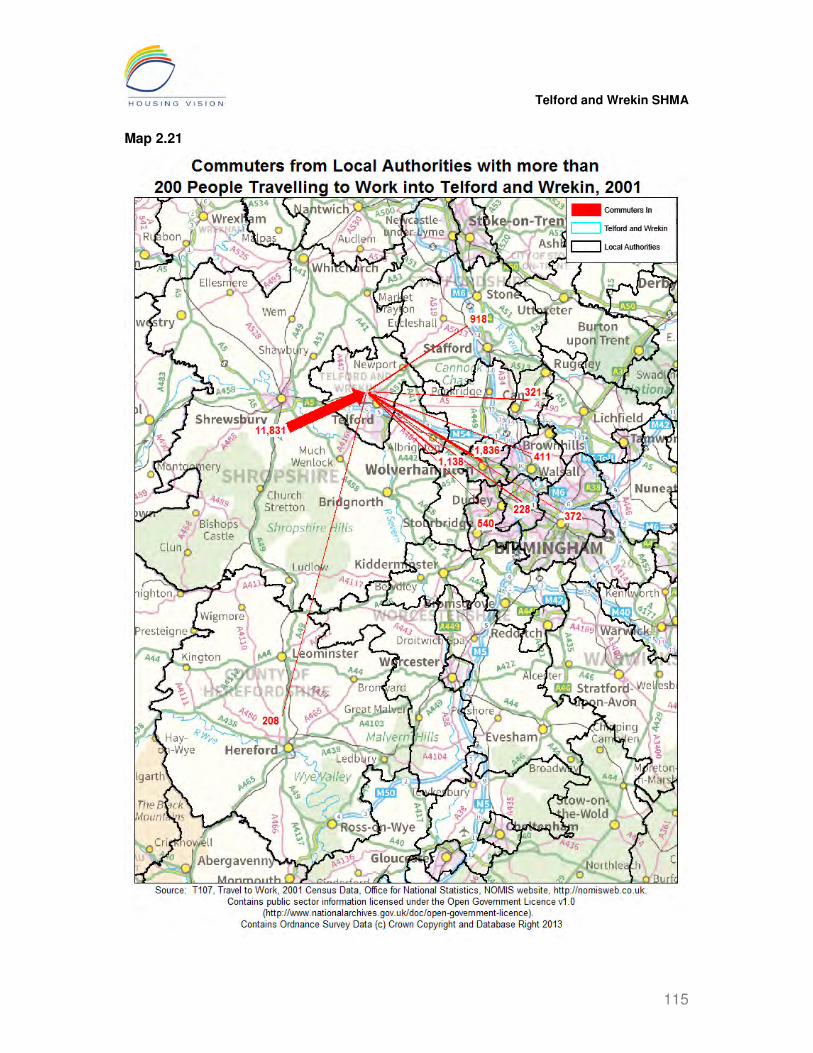
Telford and Wrekin SHMA
115
Map 2.21

Telford and Wrekin SHMA
116
Key findings
• 57% of Commuters in were from Shropshire, 9% from Wolverhampton and 6% from South Staffordshire. The remaining local authorities with more than 100 commuters made up less than 5% each. 10% of commuters in were from local authorities where less than 100 people commuted into Telford and Wrekin.
• The map shows that the majority of those commuting into Telford and Wrekin came from Shropshire, a small number came from Herefordshire and the remainder from the West Midlands Metropolitan local authorities and other nearby or adjacent local authorities such as Stafford, South Staffordshire and Cannock Chase.
2.105 The following table and map address the question, ‘where do people work
who live in Telford and Wrekin? and identify the principal flows. Table 2.28: travel to work from Telford and Wrekin to local authorities where 100 or more travelled out, with 70% level highlighted, 2001
Commuters Out
Local Authority No %
Shropshire 6,037 40.3
Wolverhampton 2,049 13.7
Birmingham 1,029 6.9
Stafford 629 4.2
Dudley 576 3.8
Walsall 560 3.7
South Staffordshire 536 3.6
Sandwell 493 3.3
Cannock Chase 263 1.8
Herefordshire, County of 162 1.1
Solihull 114 0.8
Stoke-on-Trent 111 0.7
All Other Local Authorities less than 100 2,425 16.2
Total 14,984 100.0 NB Excludes 59,211 people who both live and work within Telford and Wrekin This table uses data for Pre-2009 LA Boundaries with Shropshire collated.
(Source: Table 107 UK Travel Flows, 2001 Census, NOMIS website, http://www.nomisweb.co.uk/. Contains public sector information licensed under the Open Government Licence v1.0 http://www.nationalarchives.gov.uk/doc/open-government-licence/.)

Telford and Wrekin SHMA
117
Map 2.22

Telford and Wrekin SHMA
118
Key findings
• Just over 40% of Commuters Out from Telford and Wrekin went to Shropshire to work, 14% went to Wolverhampton and 7% went to Birmingham. The remainder of local authorities with over 100 Commuters Out made up less than 5% each. 16% of Commuters Out came from local authorities where less than 100 people travelled for work from Telford and Wrekin.
• The map shows that the largest percentage of Commuters Out from local authorities with more than 200 went to Shropshire. Others went to the West Midlands Mets and other adjacent or nearby local authorities such as Stafford, South Staffordshire and Cannock Chase.
2.106 The Neighbourhood Statistics website provides an Annual Population Survey
(APS) Commuting Tool which can sometimes provide more up to date information on commuting than is available from the 2001 Census. The tool incorporates a significance test to identify the extent of change in commuting patterns between the 2001 Labour Force Survey and 2008 APS. The final two tables consider this data but comparisons must be treated with caution as both rely on limited sample surveys. Whilst not statistically significant, Table 2.38 indicates slight increases in workers commuting into Telford and Wrekin from Shrewsbury and Atcham and North Shropshire, slight declines in commuting in from Bridgnorth, Wolverhampton and South Staffordshire, and a slight increase in the percentage of the workforce both living and working in Telford and Wrekin between 2001 and 2008. Table 2.39 indicates an increase in residents commuting out of Telford and Wrekin to Wolverhampton, Shrewsbury and Atcham and Birmingham between 2001 and 2008, and an increase in the percentage of working residents overall going out of Telford and Wrekin to work between 2001 and 2008.
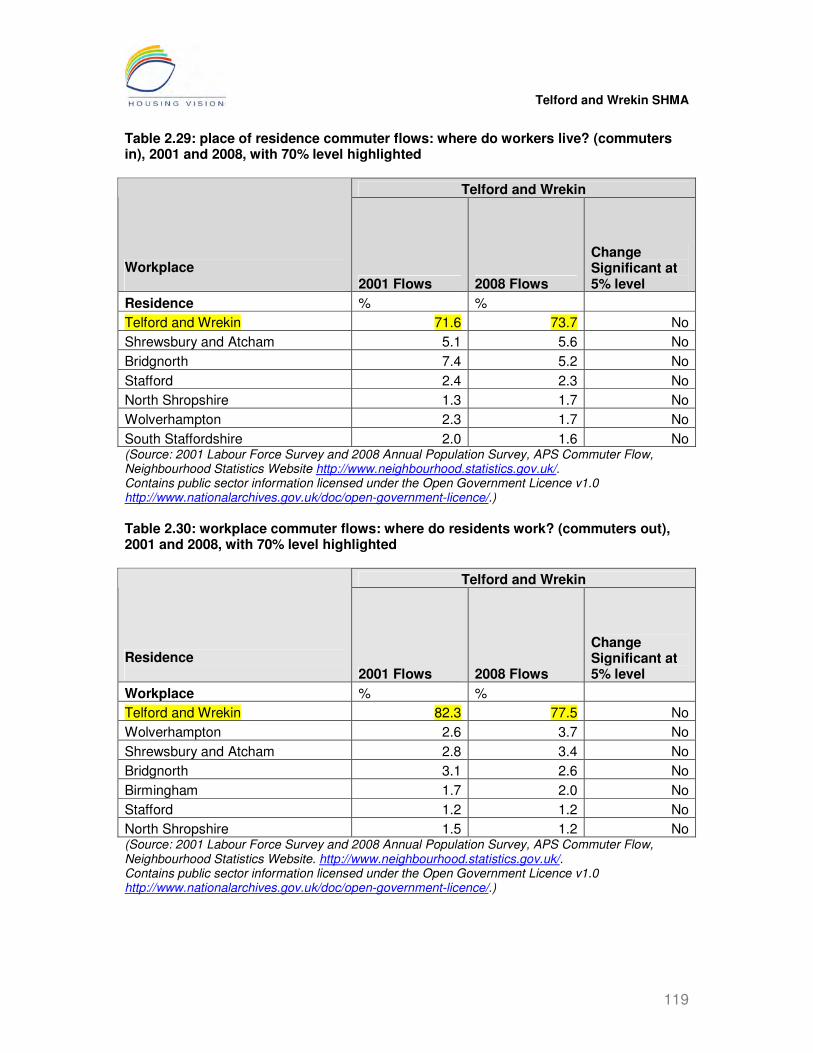
Telford and Wrekin SHMA
119
Table 2.29: place of residence commuter flows: where do workers live? (commuters in), 2001 and 2008, with 70% level highlighted
Telford and Wrekin
Workplace 2001 Flows 2008 Flows
Change Significant at 5% level
Residence % %
Telford and Wrekin 71.6 73.7 No
Shrewsbury and Atcham 5.1 5.6 No
Bridgnorth 7.4 5.2 No
Stafford 2.4 2.3 No
North Shropshire 1.3 1.7 No
Wolverhampton 2.3 1.7 No
South Staffordshire 2.0 1.6 No (Source: 2001 Labour Force Survey and 2008 Annual Population Survey, APS Commuter Flow, Neighbourhood Statistics Website http://www.neighbourhood.statistics.gov.uk/. Contains public sector information licensed under the Open Government Licence v1.0 http://www.nationalarchives.gov.uk/doc/open-government-licence/.)
Table 2.30: workplace commuter flows: where do residents work? (commuters out), 2001 and 2008, with 70% level highlighted
Telford and Wrekin
Residence 2001 Flows 2008 Flows
Change Significant at 5% level
Workplace % %
Telford and Wrekin 82.3 77.5 No
Wolverhampton 2.6 3.7 No
Shrewsbury and Atcham 2.8 3.4 No
Bridgnorth 3.1 2.6 No
Birmingham 1.7 2.0 No
Stafford 1.2 1.2 No
North Shropshire 1.5 1.2 No (Source: 2001 Labour Force Survey and 2008 Annual Population Survey, APS Commuter Flow, Neighbourhood Statistics Website. http://www.neighbourhood.statistics.gov.uk/. Contains public sector information licensed under the Open Government Licence v1.0 http://www.nationalarchives.gov.uk/doc/open-government-licence/.)

Telford and Wrekin SHMA
120
Key findings Commuters In
• The 2001 Labour Force Survey showed Shrewsbury and Atcham plus Bridgnorth as the two main local authorities from which people commuted to Telford and Wrekin. Other local authorities were Stafford, North Shropshire, Wolverhampton and South Staffordshire.
• The 2008 Annual Population Survey showed no significant changes between 2001 and 2008.
Commuters Out
• The 2001 Labour Force Survey showed Wolverhampton, Shrewsbury and Atcham, Bridgnorth, Birmingham, Stafford and North Shropshire as the main local authorities to which people commuted from Telford and Wrekin.
• The 2008 Annual Population Survey showed no significant changes between 2001 and 2008.
Method of Travel to Work
2.107 Extending understanding of commuting patterns, the following table shows methods of travel to work for usual residents aged 16 to 74 years.
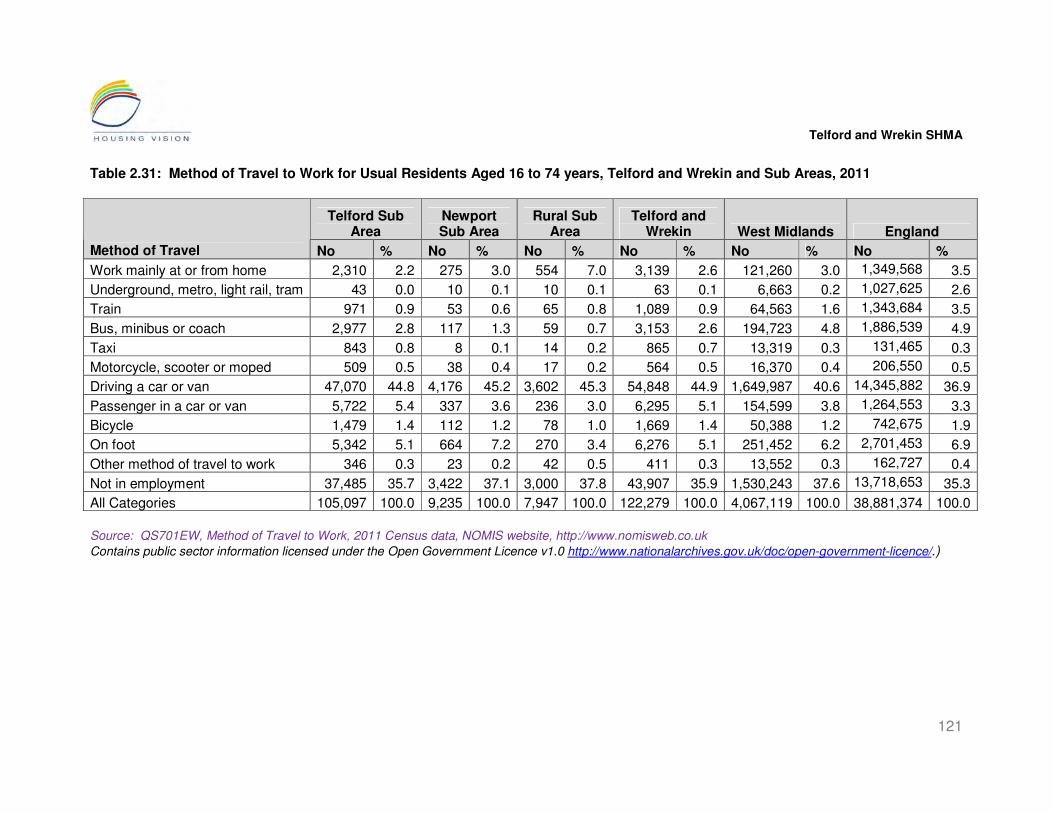
Telford and Wrekin SHMA
121
Table 2.31: Method of Travel to Work for Usual Residents Aged 16 to 74 years, Telford and Wrekin and Sub Areas, 2011
Telford Sub Area
Newport Sub Area
Rural Sub Area
Telford and Wrekin West Midlands England
Method of Travel No % No % No % No % No % No %
Work mainly at or from home 2,310 2.2 275 3.0 554 7.0 3,139 2.6 121,260 3.0 1,349,568 3.5
Underground, metro, light rail, tram 43 0.0 10 0.1 10 0.1 63 0.1 6,663 0.2 1,027,625 2.6
Train 971 0.9 53 0.6 65 0.8 1,089 0.9 64,563 1.6 1,343,684 3.5
Bus, minibus or coach 2,977 2.8 117 1.3 59 0.7 3,153 2.6 194,723 4.8 1,886,539 4.9
Taxi 843 0.8 8 0.1 14 0.2 865 0.7 13,319 0.3 131,465 0.3
Motorcycle, scooter or moped 509 0.5 38 0.4 17 0.2 564 0.5 16,370 0.4 206,550 0.5
Driving a car or van 47,070 44.8 4,176 45.2 3,602 45.3 54,848 44.9 1,649,987 40.6 14,345,882 36.9
Passenger in a car or van 5,722 5.4 337 3.6 236 3.0 6,295 5.1 154,599 3.8 1,264,553 3.3
Bicycle 1,479 1.4 112 1.2 78 1.0 1,669 1.4 50,388 1.2 742,675 1.9
On foot 5,342 5.1 664 7.2 270 3.4 6,276 5.1 251,452 6.2 2,701,453 6.9
Other method of travel to work 346 0.3 23 0.2 42 0.5 411 0.3 13,552 0.3 162,727 0.4
Not in employment 37,485 35.7 3,422 37.1 3,000 37.8 43,907 35.9 1,530,243 37.6 13,718,653 35.3
All Categories 105,097 100.0 9,235 100.0 7,947 100.0 122,279 100.0 4,067,119 100.0 38,881,374 100.0
Source: QS701EW, Method of Travel to Work, 2011 Census data, NOMIS website, http://www.nomisweb.co.uk
Contains public sector information licensed under the Open Government Licence v1.0 http://www.nationalarchives.gov.uk/doc/open-government-licence/.)

Telford and Wrekin SHMA
122
Key findings
• 45% of usual residents aged 16 to 74 in Telford and Wrekin travelled to work by car or van. This was a higher percentage than in the West Midlands (41%) and in England (37%). 45% of residents in the Rural Sub Area travelled to work by car or van compared to 45% in the Newport and Telford sub area.
• 5% of usual residents aged 16 to 74 in Telford and Wrekin travelled to work by being a passenger in a car or van. This was a higher percentage than in the West Midlands (4%) and in England (3%). 5% in the Telford sub area were passengers in cars or vans compared to 4% in the Newport and 3% in the Rural sub areas
• 5% of usual residents aged 16 to 74 years in Telford and Wrekin travelled to work by foot. This was a lower percentage than in the West Midlands (6%) and in England (7%). 7% in the Newport sub area travelled to work on foot compared to 5% in the Telford sub area and 3% in the Rural sub area.
• 3% of usual residents aged 16 to 74 years in Telford and Wrekin travelled to work by bus, minibus or coach. This was lower than in the West Midlands and England (5%). 3% in the Telford sub area travelled to work by bus, minibus or coach compared to in 1% in the Newport and Rural sub areas.
• Travel to work by methods that are mainly public transport was lower in Telford and Wrekin (4%) than in the West Midlands (7%) and in England (11%). 4% in the Telford sub area used these methods compared to 2% in the Newport and Rural sub areas.
• 1% of usual residents aged 16 to 74 years in Telford and Wrekin and each sub area travelled to work by bike which was lower than in England (2%).
• 3% of usual residents aged 16 to 74 years in Telford and Wrekin worked mainly at or from home. This was close to the proportions for the West Midlands (3%) and England (4%). 7% in the Rural sub area worked at or mainly from home compared to 3% in Newport and 2% in the Telford sub areas.
• 36%) of usual residents aged 16 to 74 years in Telford and Wrekin were not in employment. This was lower than in the West Midlands (38%) and a little higher than in England (35%). 38% in the Rural sub area were not in employment compared to 37% in Newport and 36% in the Telford sub area.
The local economy and employment trends, plans for growth 2.108 This SHMA has been completed at a time of great uncertainty in terms of the
country’s, the region’s and Telford’s economic trajectory. Whilst Telford and Wrekin has clearly expressed growth aspirations, there is an acknowledged

Telford and Wrekin SHMA
123
lack of precision in the ability to translate these into employment and associated housing requirements. The three main sources available identify some of the aspirations but the housing implications remain imprecise. These are:
• Telford and Wrekin Council’s Central Telford Area Action Plan (AAP) adopted in March 2011
• GHK with GVA Grimley’s Employment Land Review (ELR) for Telford First published in 2006
• Peter Brett Associates LLP’s Newport: Review of the Need for Employment Land published in Nov 2012; and
2.109 Policy CS4 of the Core Strategy identifies Central Telford as the main location
in the Borough where employment developments are to be located. The purpose of the AAP is to establish a long-term development vision and strategy to guide the development of Central Telford.
2.110 The AAP is intended to identify sufficient employment land and floor space to
strengthen Telford’s role as a centre for growth. Growth of knowledge-based and service sector industries will be supported, and Central Telford will become the primary focus for B1 developments in Telford and Wrekin.
2.111 The AAP also sets out that employment development will be integrated with
other uses to encourage increased economic diversity, and homes and jobs will be located close to one another to reduce the need to travel.
2.112 The Plan anticipates growth of 25,000 dwellings over the next 20 years and
the Spatial Development Strategy seeks to identify the broad locations for:
• 2,500 homes;
• 100,000 sq. m. of office floor space; and
• 65,000 sq. m. of retail floors pace. 2.113 The AAP divides Telford into five Character Areas:
• Telford town centre
• Central Park
• Old Park
• Hollinswood
• Malinslee 2.114 The following table summarises the vision for each area and associated development proposals related to housing.
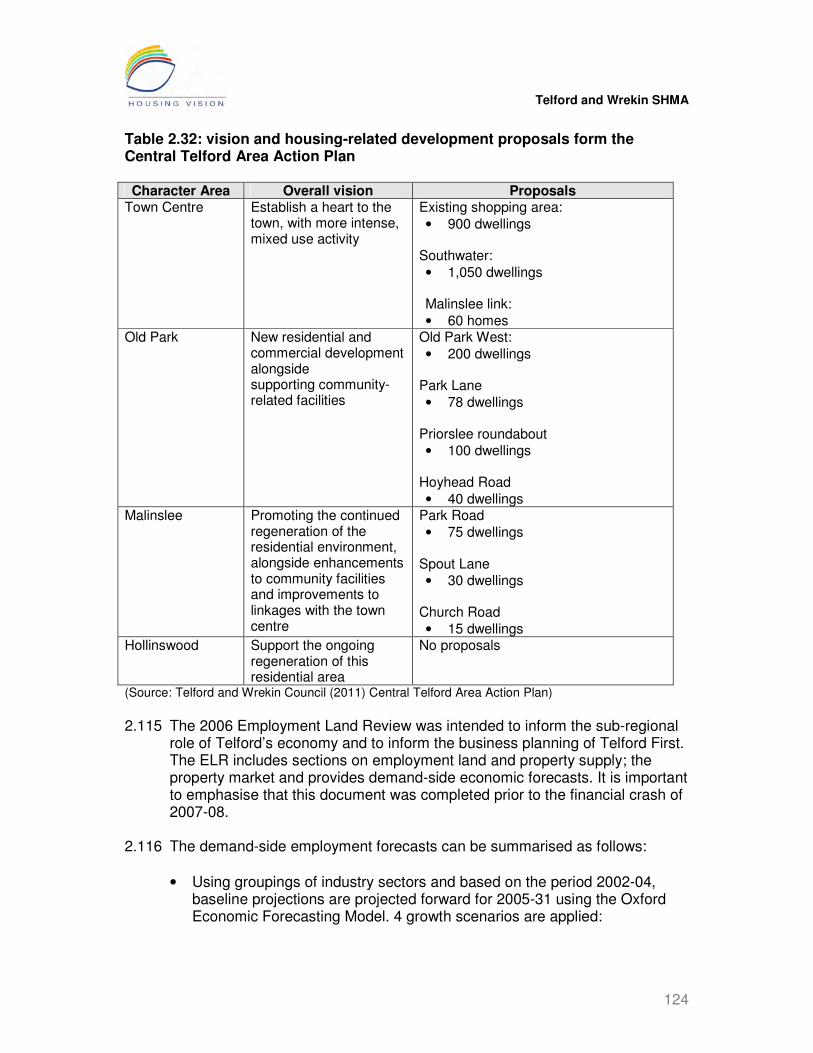
Telford and Wrekin SHMA
124
Table 2.32: vision and housing-related development proposals form the Central Telford Area Action Plan Character Area Overall vision Proposals
Town Centre Establish a heart to the town, with more intense, mixed use activity
Existing shopping area:
• 900 dwellings
Southwater:
• 1,050 dwellings Malinslee link:
• 60 homes Old Park New residential and
commercial development alongside supporting community-related facilities
Old Park West:
• 200 dwellings
Park Lane
• 78 dwellings
Priorslee roundabout
• 100 dwellings
Hoyhead Road
• 40 dwellings Malinslee Promoting the continued
regeneration of the residential environment, alongside enhancements to community facilities and improvements to linkages with the town centre
Park Road
• 75 dwellings
Spout Lane
• 30 dwellings
Church Road
• 15 dwellings Hollinswood Support the ongoing
regeneration of this residential area
No proposals
(Source: Telford and Wrekin Council (2011) Central Telford Area Action Plan)
2.115 The 2006 Employment Land Review was intended to inform the sub-regional
role of Telford’s economy and to inform the business planning of Telford First. The ELR includes sections on employment land and property supply; the property market and provides demand-side economic forecasts. It is important to emphasise that this document was completed prior to the financial crash of 2007-08.
2.116 The demand-side employment forecasts can be summarised as follows:
• Using groupings of industry sectors and based on the period 2002-04, baseline projections are projected forward for 2005-31 using the Oxford Economic Forecasting Model. 4 growth scenarios are applied:

Telford and Wrekin SHMA
125
• Scenario 1: the ‘baseline’ scenario (assumes population growth of 18,200 in the Borough from 2004-31;
• Scenario 2: ’24,000 extra houses’;
• Scenario 3: ’30,000 extra houses’; and
• Scenario 4: ’36,000 extra houses’.
• In addition to the ‘extra Houses’ scenarios described above, a fifth ‘Policy Support’ Scenario was also developed.
2.117 Applying the Oxford Economic Forecasting Model against each scenario
identified the following employment forecasts to 2031.
Table 2.33: growth scenarios from the Employment Land Review
Sector Scenario 1 Scenario 2 Scenario 3 Scenario 4 Scenario 5 Manufacturing 6,559 6,559 6,559 6,559 11,157 Service 72,255 84,716 90,783 96,850 95,687 Total 78,814 91,275 97,432 103,409 106,844 (Source: GHK with GVA Grimley (2006) Employment Land Review)
2.118 The report concludes that, as a result of the above, there may be some scope
to transfer some employment use land to non-employment use, including housing.
2.119 The 2012 Newport report reviews the requirement for employment space in
this market town and is designed to feed into Telford and Wrekin Council’s wider review of the needs of the Borough for employment space. Newport’s role is identified as serve its rural hinterland whilst providing a ‘reasonable balance’ between employment opportunities and the town’s other functions. Paragraphs 2.27 and 2.28 of the report state,
2.120 In terms of workforce and travel patterns, the report looks at the Newport
Study of 2006, which defined the town’s ‘functional economic area’ as comprising 17 LSOAs, giving a population of 25,921 being served by Newport. Using a combination of Census (2011) and Experian estimates, the key characteristics of this population are reported as:
• Lower overall growth (4.7%) between 2001 and 11 than for the Borough as a whole (5.3%);
• A higher than average elderly and ageing population; and
• A workforce skewed towards professional, managerial and intermediate skilled employment.
2.121 The number of jobs in the Newport area increased by 1.2% (+5,180) between
2008 and 2011 whilst the wider Borough and England saw decreases over the same period. However, prior to this (2003-08), Newport’s number of jobs contracted, whereas Telford and Wrekin experienced growth.

Telford and Wrekin SHMA
126
2.122 The report asks ‘how many additional jobs Newport needs just to maintain the (2001 Census) share of residents who are able to work locally’: Projecting to 2026, and considering what proportion might be expected to need ‘B class’ jobs, the report models the following:
• Telford and Wrekin’s population is forecast (2011) to increase by 15.3% by 2026
• The Borough’s register of dwellings with an extant planning permission or with a s106 agreement reveals 1,423 potential new dwellings in the Newport area. The report assumes that 80% of these will be built. If these are occupied by households comprising an average 2.5 persons, then this represents a population gain of 2,850
• It is assumed that 50% of this population increase will be economically active, and then calculates that 38% of these will require work locally (i.e. maintaining the 2001 position)
• Therefore, there is a requirement for an additional 540 jobs in the 2011-26 period, which is an increase of 10.4%
2.123 Employment forecasts for the Borough are considered, using Experian data
for the period 2010-26 as follows:
• There is an anticipated growth in jobs of 5,771, or 6.7%
• B class jobs are expected to increase in the sub sectors of warehousing (14%) and office jobs (10.4%), but contract in terms of industrial (-16.5%). This gives an overall forecast increase of 3.6% for B space jobs

Telford and Wrekin SHMA
127
3. Housing Stock and Supply
Executive summary
Overall patterns and trends 3.1 The area’s dwelling stock is skewed towards family housing, almost 90% is
detached, semi-detached or terraced housing compared with 83% in the region, and there is a much higher proportion of detached housing. As a result, only 10% of housing is in flats, considerably lower than in the region and in England. The Telford sub area has more semi-detached and terraced homes and less detached homes than in the other two sub areas. The Rural sub area has more than half of its homes detached and less semi detached, less terraced and less flats. Newport has more than two fifths of its homes detached.
3.2 More than 60% of homes in Telford and Wrekin are owner occupied, similar
proportions to the West Midland and England. Nearly 20% are social rented, similar to the West Midlands and slightly higher than for England. 15% of homes are private rented, slightly higher than in the West Midlands and slightly lower than in England. Patterns were very different in the 3 sub areas, with the Rural sub area having a much higher percentage of owner occupied housing and a lower percentage of both private and social rented housing. More than 20% of homes in the Telford sub area were social rented, much higher than the proportions in the other two sub areas.
3.3 The average number of bedrooms per household was 2.9 in Telford and
Wrekin, a little higher than in the West Midlands (2.8) and England (2.7). The average number of rooms was 5.7 in Telford and Wrekin, a little higher than in the West Midlands (5.5) and England (5.4). There was a smaller percentage of homes with 1 or 2 bedrooms or 1, 2 or 3 rooms than regionally or nationally which is of concern in housing smaller and/or lower income households. Nearly two thirds of homes in Telford and Wrekin had 3 to 4 bedrooms, more than regionally or nationally but there was a lower percentage of 5 plus bed homes in Telford and Wrekin than regionally or nationally.
3.4 The patterns in the 3 sub areas were different in that the Rural sub area had;
a much higher percentage of 5 plus bed homes and more than half of its homes had 7 or more rooms. The Telford sub area had an average of 2.9 bedrooms; 5.6 rooms; a small percentage of 5 plus bed homes and a higher percentage of 1 to 2 bed homes. Newport had an average of 2.9 bedrooms, 5.9 rooms, and a small percentage of 5 plus bed homes (closer to the Telford sub area than Rural).
3.5 Based on an ‘occupancy rating’ of 2 or more bedrooms more than are
'required' by households, Telford and Wrekin had slightly higher levels of under-occupancy than in the region or nationally. 38% were under-occupied

Telford and Wrekin SHMA
128
based bedrooms or 55% based on rooms. Under occupancy was much higher in the Rural sub area than in the Telford sub area with Newport in between.
3.6 3.5% of households were overcrowded based on bedrooms or 5.2% based on
the number of rooms per household. This was lower than in the region or in England. Overcrowding was much lower in the Rural sub area than in both the Telford and the Newport sub areas.
3.7 Currently, 3,473 people have second homes in the district, 2.1% of the total.
However, these were mainly used as working addresses or for ‘Other reasons’ than holiday homes.
3.8 The vacancy rate of 3.1% (2,122 household spaces) was lower than in the
Region or in England. There was a slightly higher percentage of vacancies in the Rural sub area followed by Telford and then by the Newport sub area.
3.9 3,934 new homes were completed between 2006 and 2013 at an average of
562 per annum, and a net gain taking account of losses through demolition of 3,638 homes. Additions to the affordable housing stock over this period amounted to 23% of new homes. The private rented sector
3.10 The private rented sector has doubled since 2001 to almost 15% of homes
and now makes a major contribution across the area. 2011 Census data confirms that this sector typically houses younger people in lower income employment, including families. It provides an estimated supply in the region of 3,000 lettings per year, more than double the contribution of either the social rented or owner occupied sectors.
3.11 Monitoring over a 3 month period identified an average of 375 properties
advertised at any one time, whose profile is very different from the overall stock. Over one third were flats or apartments which is much higher than a total stock of 10%; 11% were detached homes which is much lower than a stock of 31%; 30% were terraced, which is lower than a stock of 23% and 11% were semi-detached compared with a stock of 36%).
3.12 The growth of the private rented sector has good and bad points. It has been
important in extending flexibility and choice, and in maintaining a supply of housing when turnover has reduced in the home ownership and social rented sectors. However, homes purchased by investors are likely to be those accessible to first time buyers, which has the effect of further excluding them from the market and placing an upward pressure on lower value prices.
3.13 Valuation Office Agency data for 2012 identified that 2 bed properties or
smaller made up over one third properties; 29% were 3 bed and 11% were 4 bed. Such a breakdown mirrors the breakdown of rented homes advertised by property type. In the context of the application of the Local Housing Allowance

Telford and Wrekin SHMA
129
shared accommodation rate to all single people under 35 years old, only 125 of properties were shared or bedsit accommodation.
3.14 Overall, the private rented sector is proving effective in meeting the
requirements of both smaller single people and couple households - whose numbers will continue to increase - and family households. DWP data profiling those in receipt of Housing Benefit has identified a growth in supply to those in housing need of c.500 per year over the past 3 years.
The home ownership sector
3.15 The growth in private renting has resulted in the home ownership sector
falling in proportionate terms from 68% of all homes in 2001 to 64% in 2011. 3.16 The current average price at £155,420 represents a fall of 2% over the past 5
years. Detached houses make up more than one third of sales and semi-detached homes make up almost one third of sales. Terraced homes make up more than a quarter of sales which is over-representative of their proportion of the stock. Sales of flats made up a small percentage and were under representative of their stock levels. Towns are generally cheaper than rural areas and the house price hotspots are mainly in more rural locations.
3.17 Overall, as most sales are of houses, the home ownership sector is currently
more effective in meeting the requirements of families and less effective for singles and couples, demand from whom will continue to increase.
The intermediate housing sector
3.18 The intermediate housing sector makes a negligible contribution to the
housing stock and supply and, despite the emphasis placed on its development in recent years, numbers have declined to 292 properties since 2001 (0.5% of the total stock), Even if a full cost 5% turnover rate is applied, no more than 15 homes become available each year.
The social rented sector
3.19 The social rented sector has remained stable proportionately since 2001 with
over 13,000 social rented properties constituting just over 20% of all stock. 3.20 As a result of average turnover over the past 5 years of 11%, in the region of
1,200 properties are available each year, just over 80% for general needs use and the remainder supported housing. Most general needs lettings are of smaller properties, 26% are 1 bed; 46% are 2 bed; only 24% are 3 bed and 4% are 4 bed or larger.
3.21 In common with the private rented sector, the requirements of singles,
couples and smaller family households are more likely to be met by the social rented sector, household types whose numbers will continue to increase.

Telford and Wrekin SHMA
130
Introduction 3.22 Using a wide variety of authoritative secondary sources, this section reviews
patterns and trends in the housing market across the area since 2001 as the basis for understanding the balance between supply and demand and the future requirement for housing. A distinction is made between:
• housing stock - the number of dwellings; and
• housing supply - the number of dwellings available annually to rent or purchase due to turnover from the existing stock and from new supply resulting from construction, conversions and bringing empty homes back into use.
Setting the baseline: patterns and trends in the housing stock
Property type
3.23 The following table summarises the baseline position by accommodation type
in 2011 and the sub-section closes with a detailed estimate of stock by tenure.
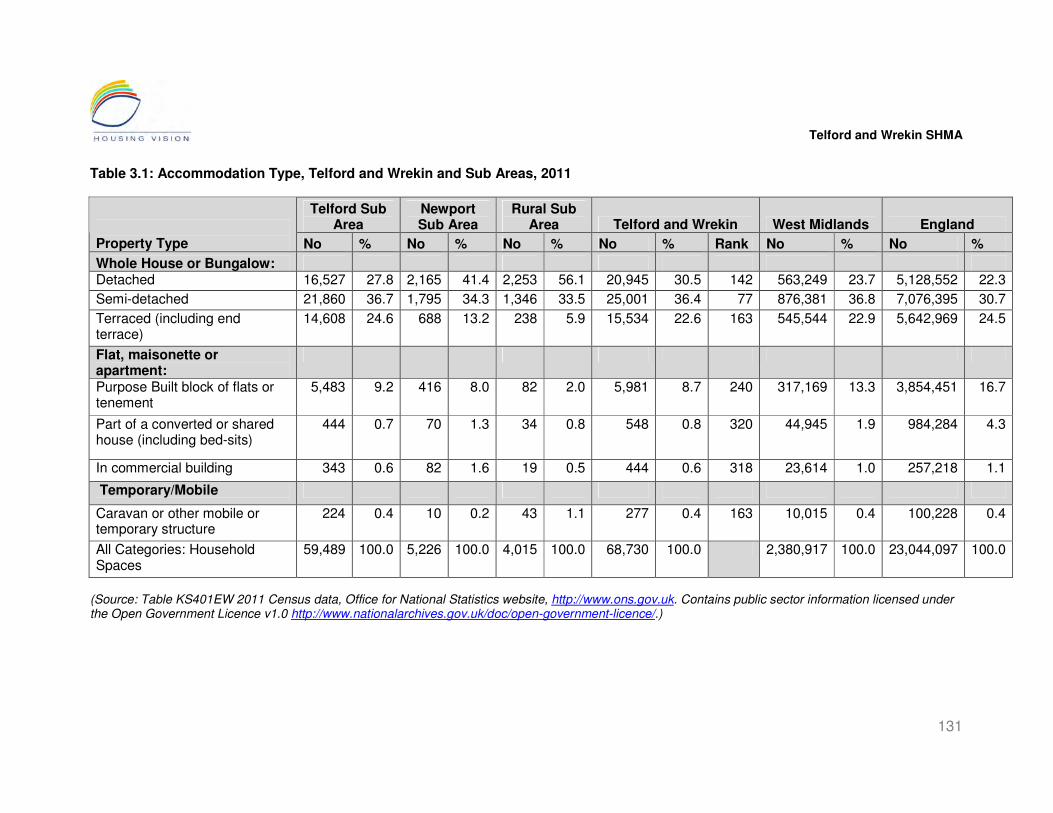
Telford and Wrekin SHMA
131
Table 3.1: Accommodation Type, Telford and Wrekin and Sub Areas, 2011
Telford Sub Area
Newport Sub Area
Rural Sub Area Telford and Wrekin West Midlands England
Property Type No % No % No % No % Rank No % No %
Whole House or Bungalow: Detached 16,527 27.8 2,165 41.4 2,253 56.1 20,945 30.5 142 563,249 23.7 5,128,552 22.3
Semi-detached 21,860 36.7 1,795 34.3 1,346 33.5 25,001 36.4 77 876,381 36.8 7,076,395 30.7
Terraced (including end terrace)
14,608 24.6 688 13.2 238 5.9 15,534 22.6 163 545,544 22.9 5,642,969 24.5
Flat, maisonette or apartment:
Purpose Built block of flats or tenement
5,483 9.2 416 8.0 82 2.0 5,981 8.7 240 317,169 13.3 3,854,451 16.7
Part of a converted or shared house (including bed-sits)
444 0.7 70 1.3 34 0.8 548 0.8 320 44,945 1.9 984,284 4.3
In commercial building 343 0.6 82 1.6 19 0.5 444 0.6 318 23,614 1.0 257,218 1.1
Temporary/Mobile
Caravan or other mobile or temporary structure
224 0.4 10 0.2 43 1.1 277 0.4 163 10,015 0.4 100,228 0.4
All Categories: Household Spaces
59,489 100.0 5,226 100.0 4,015 100.0 68,730 100.0 2,380,917 100.0 23,044,097 100.0
(Source: Table KS401EW 2011 Census data, Office for National Statistics website, http://www.ons.gov.uk. Contains public sector information licensed under the Open Government Licence v1.0 http://www.nationalarchives.gov.uk/doc/open-government-licence/.)
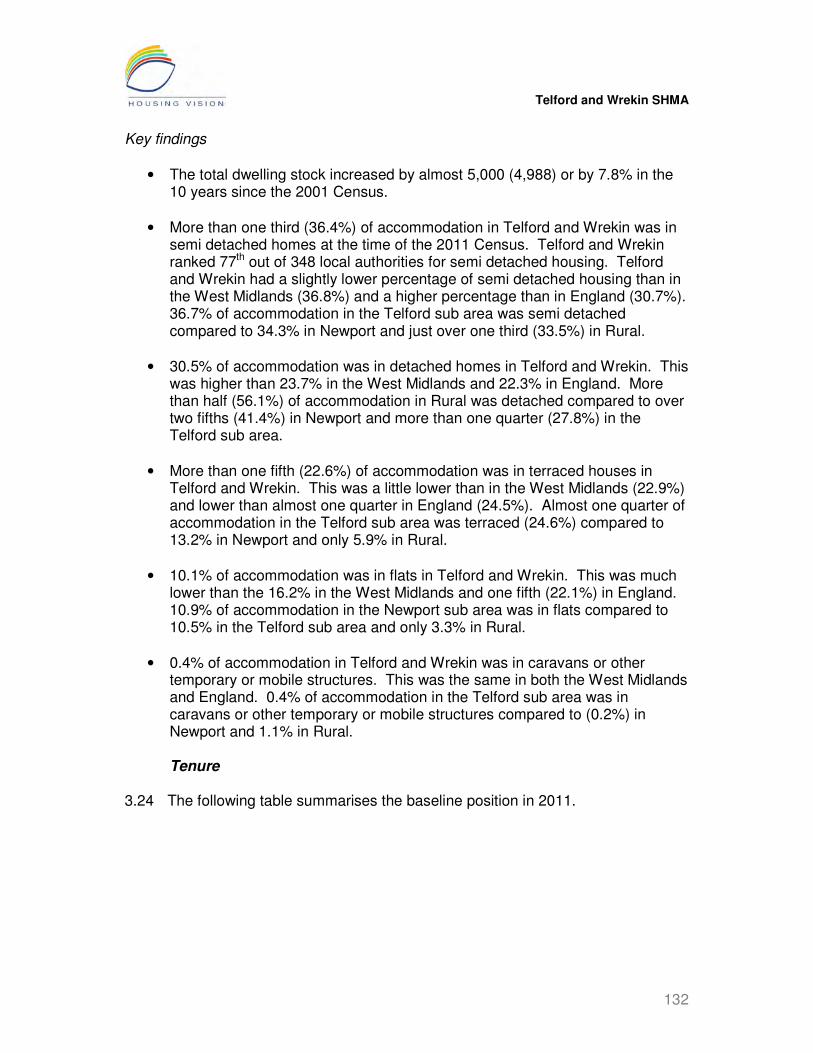
Telford and Wrekin SHMA
132
Key findings
• The total dwelling stock increased by almost 5,000 (4,988) or by 7.8% in the 10 years since the 2001 Census.
• More than one third (36.4%) of accommodation in Telford and Wrekin was in semi detached homes at the time of the 2011 Census. Telford and Wrekin ranked 77th out of 348 local authorities for semi detached housing. Telford and Wrekin had a slightly lower percentage of semi detached housing than in the West Midlands (36.8%) and a higher percentage than in England (30.7%). 36.7% of accommodation in the Telford sub area was semi detached compared to 34.3% in Newport and just over one third (33.5%) in Rural.
• 30.5% of accommodation was in detached homes in Telford and Wrekin. This was higher than 23.7% in the West Midlands and 22.3% in England. More than half (56.1%) of accommodation in Rural was detached compared to over two fifths (41.4%) in Newport and more than one quarter (27.8%) in the Telford sub area.
• More than one fifth (22.6%) of accommodation was in terraced houses in Telford and Wrekin. This was a little lower than in the West Midlands (22.9%) and lower than almost one quarter in England (24.5%). Almost one quarter of accommodation in the Telford sub area was terraced (24.6%) compared to 13.2% in Newport and only 5.9% in Rural.
• 10.1% of accommodation was in flats in Telford and Wrekin. This was much lower than the 16.2% in the West Midlands and one fifth (22.1%) in England. 10.9% of accommodation in the Newport sub area was in flats compared to 10.5% in the Telford sub area and only 3.3% in Rural.
• 0.4% of accommodation in Telford and Wrekin was in caravans or other temporary or mobile structures. This was the same in both the West Midlands and England. 0.4% of accommodation in the Telford sub area was in caravans or other temporary or mobile structures compared to (0.2%) in Newport and 1.1% in Rural. Tenure
3.24 The following table summarises the baseline position in 2011.

Telford and Wrekin SHMA
133
Table 3.2: Tenure Type, Telford and Wrekin and Sub Areas, 2011
Telford Sub Area
Newport Sub Area
Rural Sub Area Telford and Wrekin West Midlands England
Tenure No % No % No % No % Rank No % No %
Owned Owned Outright 14,551 25.2 1,887 37.1 1,668 42.9 18,106 27.2 280 740,899 32.3 6,745,584 30.6
Owned with a mortgage or loan 21,238 36.8 1,747 34.4 1,326 34.1 24,311 36.5 97 748,195 32.6 7,229,440 32.8
Shared Ownership
Shared ownership (part owned and part rented)
250 0.4 27 0.5 15 0.4 292 0.4 272 15,230 0.7 173,760 0.8
Social Rented
Council 5,093 8.8 210 4.1 106 2.7 5,409 8.1 160 249,835 10.9 2,079,778 9.4
Other 7,073 12.3 407 8.0 217 5.6 7,697 11.6 63 185,335 8.1 1,823,772 8.3
Private Rented
Rented from: Private landlord or letting agency
7,962 13.8 688 13.5 405 10.4 9,055 13.6 142 293,988 12.8 3,401,675 15.4
Private Rented Other 806 1.4 58 1.1 60 1.5 924 1.4 160 27,682 1.2 314,249 1.4
Rent Free
Living Rent Free 665 1.2 59 1.2 90 2.3 814 1.2 205 33,745 1.5 295,110 1.3
All Categories: Tenure 57,638 100.0 5,083 100.0 3,887 100.0 66,608 100.0 2,294,909 100.0 22,063,368 100.0
(Source: Table KS402EW 2011 Census data, Office for National Statistics website, http://www.ons.gov.uk and NOMIS website, http://www.nomisweb.co.uk. Contains public sector information licensed under the Open Government Licence v1.0 http://www.nationalarchives.gov.uk/doc/open-government-licence/.)

Telford and Wrekin SHMA
134
Key findings
• 63.7% of homes in Telford and Wrekin were owner occupied, and reflecting national and regional trends since 2001, this represented a reduction (from 68.2%). This was a little lower than in the West Midlands (64.9%) and a little higher than in England (63.3%). 77.0% of homes in the Rural sub area were owner occupied compared to (71.5%) in Newport and (62.1%) in the Telford sub area.
• Almost one fifth (19.7%) of homes in Telford and Wrekin were social rented. This was a little higher than in the West Midlands (19.0%) and higher than in England (17.7%). More than one fifth (21.1%) of homes in the Telford sub area were social rented compared to (12.1%) in Newport and (8.3%) in Rural.
• 11.6% of homes in Telford and Wrekin were Other Social rented. This was higher than in the West Midlands (8.1%) and in England (8.3%). 12.3% of homes in Telford were Other Social rented compared to (8.0%) in Newport and (5.6%) in Rural.
• 8.1% of homes in Telford and Wrekin were council social rented. This was lower than in the West Midlands (10.9%) and England (9.4%). 8.8% of homes in the Telford sub area were council social rented compared 4.1% to in Newport and 2.7% in Rural.
• 15.0% of homes in Telford and Wrekin were private rented. This was higher than in the West Midlands (14.0%) and lower than in England (16.8%). 15.2% of homes in the Telford sub area were private rented compared to (14.7%) in Newport and (12.0%) in Rural.
• 0.4% of homes were Shared Ownership in Telford and Wrekin. This was lower than in the West Midlands (0.7%) and in England (0.8%). 0.4% of homes in the Telford sub area were Shared ownership compared to 0.5% in Newport and 0.4% in Rural. Number of rooms and bedrooms
3.25 A key indicator when profiling the supply of housing is the number of
bedrooms. The 2011 Census data in the table below shows only the number of habitable rooms i.e. excluding bathrooms, toilets, halls or landings.

Telford and Wrekin SHMA
135
Table 3.3: Number of Rooms, Telford and Wrekin and Sub Areas, 2011
Telford Sub Area
Newport Sub Area
Rural Sub Area
Telford and Wrekin West Midlands England
Rooms No % No % No % No % No % No %
1 Room 119 0.2 8 0.2 3 0.1 130 0.2 10,657 0.5 172,008 0.8
2 Rooms 769 1.3 64 1.3 25 0.6 858 1.3 45,828 2.0 641,307 2.9
3 Rooms 3,890 6.7 337 6.6 137 3.5 4,364 6.6 200,121 8.7 2,264,602 10.3
4 Rooms 10,189 17.7 786 15.5 313 8.1 11,288 16.9 384,844 16.8 4,227,236 19.2
5 Rooms 16,478 28.6 1,051 20.7 686 17.6 18,215 27.3 611,838 26.7 5,446,830 24.7
6 Rooms 11,698 20.3 1,082 21.3 731 18.8 13,511 20.3 496,343 21.6 4,275,834 19.4
7 Rooms 6,047 10.5 790 15.5 591 15.2 7,428 11.2 245,735 10.7 2,223,733 10.1
8 Rooms 4,360 7.6 570 11.2 555 14.3 5,485 8.2 153,458 6.7 1,400,789 6.3
9 or more Rooms 4,088 7.1 395 7.8 846 21.8 5,329 8.0 146,085 6.4 1,411,029 6.4
All Household Spaces With At Least One Usual Resident
57,638 100.0 5,083 100.0 3,887 100.0 66,608 100.0 2,294,909 100.0 22,063,368 100.0
Average Number of Rooms Per Household
5.6 5.9 6.9 5.7 5.5 5.4
(Source: Table QS407EW 2011 Census data, Office for National Statistics website, http://www.ons.gov.uk and NOMIS website, http://www.nomisweb.co.uk. Contains public sector information licensed under the Open Government Licence v1.0 http://www.nationalarchives.gov.uk/doc/open-government-licence/.)

Telford and Wrekin SHMA
136
Key findings
• The average number of rooms per household in Telford and Wrekin was 5.7. This was higher than in the West Midlands (5.5) and in England (5.4). The average number of rooms per household in the Rural Sub area was 6.9, compared to 5.9 in Newport and 5.6 in the Telford sub area.
• There was a lower percentage of homes with 1, 2 or 3 rooms in Telford and Wrekin (8.0%) than in the West Midlands (11.2%) and in England (14.0%). 8.3% of homes had 1, 2 or 3 rooms in the Telford sub area compared to 8.0% in Newport and 4.2% in Rural.
• Almost two thirds (64.6%) of homes in Telford and Wrekin had 4, 5 or 6 rooms. This was a little lower than in the West Midlands (65.1%) and a little higher than in England (63.2%). Two thirds (66.6%) of homes in the Telford sub area had 4, 5 or 6 rooms compared to 57.4% in Newport and 44.5% in Rural.
• More than one quarter (27.4%) of homes in Telford had 7 plus rooms, more than in the West Midlands (23.8%) and in England (22.8%). More than half (51.2%) of homes in the Rural sub area had 7 plus rooms compared to more than one third (34.5%) in Newport and one quarter (25.1%) in the Telford sub area.
3.26 The following table shows the number of bedrooms according to the 2011
Census.
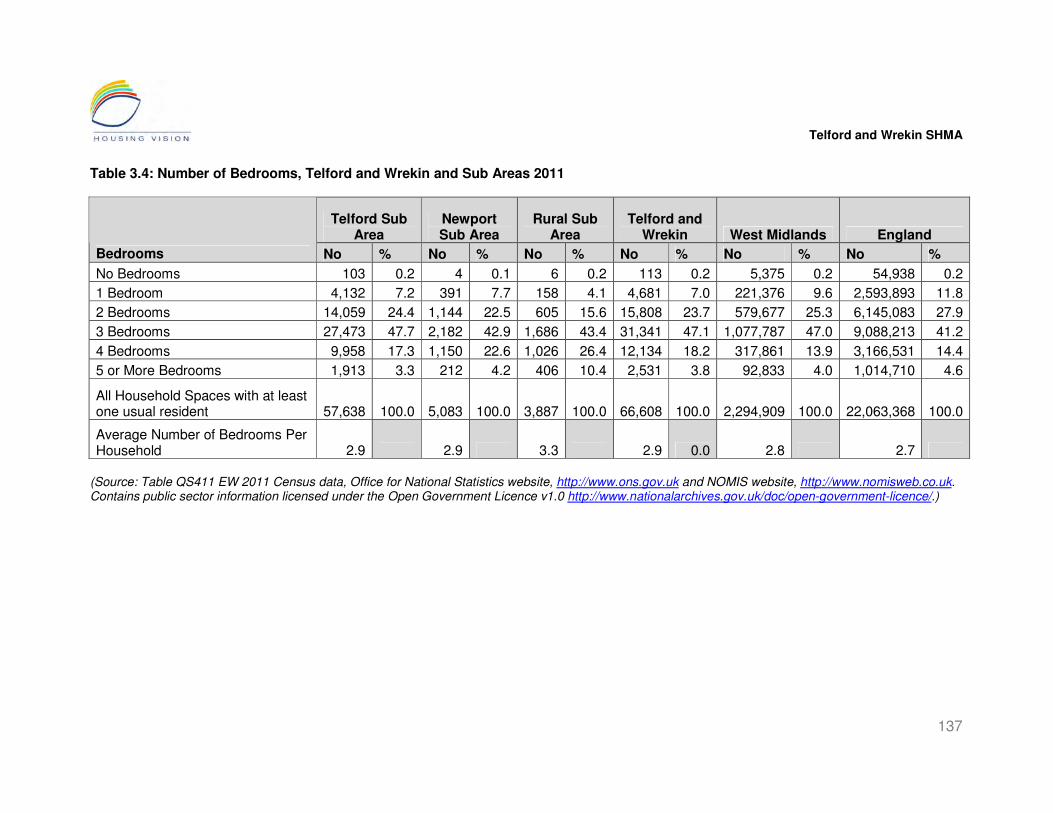
Telford and Wrekin SHMA
137
Table 3.4: Number of Bedrooms, Telford and Wrekin and Sub Areas 2011
Telford Sub Area
Newport Sub Area
Rural Sub Area
Telford and Wrekin West Midlands England
Bedrooms No % No % No % No % No % No %
No Bedrooms 103 0.2 4 0.1 6 0.2 113 0.2 5,375 0.2 54,938 0.2
1 Bedroom 4,132 7.2 391 7.7 158 4.1 4,681 7.0 221,376 9.6 2,593,893 11.8
2 Bedrooms 14,059 24.4 1,144 22.5 605 15.6 15,808 23.7 579,677 25.3 6,145,083 27.9
3 Bedrooms 27,473 47.7 2,182 42.9 1,686 43.4 31,341 47.1 1,077,787 47.0 9,088,213 41.2
4 Bedrooms 9,958 17.3 1,150 22.6 1,026 26.4 12,134 18.2 317,861 13.9 3,166,531 14.4
5 or More Bedrooms 1,913 3.3 212 4.2 406 10.4 2,531 3.8 92,833 4.0 1,014,710 4.6
All Household Spaces with at least one usual resident 57,638 100.0 5,083 100.0 3,887 100.0 66,608 100.0 2,294,909 100.0 22,063,368 100.0
Average Number of Bedrooms Per Household 2.9 2.9 3.3 2.9 0.0 2.8 2.7
(Source: Table QS411 EW 2011 Census data, Office for National Statistics website, http://www.ons.gov.uk and NOMIS website, http://www.nomisweb.co.uk. Contains public sector information licensed under the Open Government Licence v1.0 http://www.nationalarchives.gov.uk/doc/open-government-licence/.)

Telford and Wrekin SHMA
138
Key findings
• The average number of bedrooms per households was 2.9 in Telford and Wrekin, a little higher than in the West Midlands (2.8) and in England (2.7). The average number of bedrooms per household was 3.3 in Rural compared to 2.9 in both the Newport and Telford sub areas.
• 30.8% of homes in Telford and Wrekin were small with one or two bedrooms. This was lower than in the West Midlands (34.9%) and in England (39.6%). 31.6% of homes in the Telford sub area were small with one or two bedrooms compared to 30.2% in Newport and 19.6% in Rural.
• Nearly two thirds (65.3%) of homes in Telford and Wrekin had 3 or 4 bedrooms. This was more than in the West Midlands (60.8%) and in England (55.5%).
• 3.8% of homes in Telford and Wrekin were larger 5 plus bed homes. This was a little lower than in the West Midlands (4.0%) and in England (4.6%). 10.4% of homes in the Rural sub area were larger 5 plus bed homes compared to 4.2% in Newport and 3.3% in the Telford sub area.
• The lower proportion of 1 bed properties is a concern in terms of access to the housing market in a lower income area.
Dwellings by Council Tax band
3.27 The following table summarises dwellings by Council Tax band in 2011. Table 3.5: dwellings by Council Tax band in Telford and Wrekin, 2011
Telford and Wrekin West Midlands England
Council Tax Band No % No % No %
Band A 25,735 37.4 738,131 31.2 5,701,030 24.8
Band B 18,123 26.4 596,773 25.2 4,494,194 19.6
Band C 10,041 14.6 457,099 19.3 4,992,524 21.8
Band D 7,540 11.0 262,127 11.1 3,513,171 15.3
Band E 4,332 6.3 164,729 7.0 2,166,533 9.4
Band F 1,966 2.9 88,917 3.8 1,144,117 5.0
Band G 985 1.4 54,259 2.3 805,748 3.5
Band H 50 0.1 5,366 0.2 130,183 0.6
Total 68,772 100.0 2,367,401 100.0 22,947,500 100.0 (Source: Dwellings by Council Tax Band; Neighbourhood Statistics Website http://www.neighbourhood.statistics.gov.uk/.Contains public sector information licensed under the Open Government Licence v1.0 http://www.nationalarchives.gov.uk/doc/open-government-licence/.)

Telford and Wrekin SHMA
139
Key findings
• There were a higher percentage of low Council Tax Band (A and B) homes in Telford and Wrekin (63.8%) than in the West Midlands (56.4%) and in England (44.4%). This may well counteract the previously identified problems associated with the lower than average proportion of one bedroom properties.
• Conversely, there were a lower percentage of high Council Tax band (F to H) homes in Telford and Wrekin (4.4%) than in the West Midlands (6.3%) and England (9.1%).
• However, it must be remembered that as the property values on which these bandings have been based have not been updated since 1st April 1991, they may no longer be a valid indication of current market values.
Under-occupation and overcrowding
3.28 Under-occupation and overcrowding are likely to be experienced at different
stages of the life cycle. Under-occupation is more likely to affect older people living in family housing from which children have moved on. Overcrowding is more likely to affect younger people with dependent children who are in need of more bedrooms. Under-occupation and overcrowding can therefore, be two sides of the same coin, where a reduction in under-occupation by older people can increase the supply of family housing for younger households.
3.29 The Occupancy Rating provides a measure of whether a household's
accommodation is overcrowded or under-occupied. There are two measures of occupancy rating, one based on the number of rooms in a household's accommodation, and one based on the number of bedrooms. Based on a standard formula which assesses the relationship between household members according to their ages and gender, it relates the actual number of rooms or bedrooms in a property to the number of rooms or bedrooms ‘required’ by the members of that household. The number of rooms/bedrooms required is subtracted from the number of rooms/bedrooms in the household's accommodation to obtain the occupancy rating. An occupancy rating of -1 implies that a household has one fewer room/bedroom than required (overcrowded), whereas +1 implies that they have one more room/bedroom than the standard requirement (under-occupying).
3.30 A bedroom is defined as any room that was intended to be used as a
bedroom when the property was built, or any room that has been permanently converted for use as a bedroom. It also includes all rooms intended for use as a bedroom even if not being used as a bedroom at the time of the Census. Bedsits and studio flats are counted as having one bedroom. Set out below is a description of how the number of bedrooms/rooms required is calculated as follows:

Telford and Wrekin SHMA
140
• A one-person household requires three rooms and one bedroom.
3.31 The room requirements for a multi-person household are calculated as follows:
1. One room per couple or lone parent;
2. One room per person aged 16 and above who is not a lone parent or in a couple;
3. One room for every two males aged 10-15, rounded down;
4. One room for every pair of males of whom one is aged 10-15 and one is aged 0-9, if there are an odd number of males aged 10-15;
5. One room for a remaining unpaired male aged 10-15 if there are no males aged 0-9 to pair him with;
6. Repeat steps 3-5 for females;
7. One room for every two remaining children aged 0-9 (regardless of gender), rounded up;
8. Add two rooms to this total.
3.32 The bedroom requirements for a multi-person household are as follows:
1. One bedroom per couple;
2. One bedroom per person aged 21 or over not in a couple;
3. One bedroom for every two males aged 10-20, rounded down;
4. One bedroom for every pair of males of whom one is aged 10-20 and one is aged 0-9, if there are an odd number of males aged 10-20;
5. One bedroom for a remaining unpaired male aged 10-20 if there are no males aged 0-9 to pair him with;
6. Repeat steps 3-5 for females;
7. One bedroom for every two remaining children aged 0-9 (regardless of gender), rounded up.
3.33 Applying the Occupancy Rating:

Telford and Wrekin SHMA
141
• An occupancy rating of +2 or more suggests there are 2 or more rooms more than are 'required' according to the definition, i.e. there is more than one spare room and there is under-occupation; and
• An occupancy rating of -1 suggests there is one less room than is 'required' according to the definition, i.e. there are not enough rooms for the number of people and there is overcrowding.
3.34 Using the Occupancy Rating, the following table summarises the level of
under-occupation and overcrowding for all households at the time of the 2011 Census.
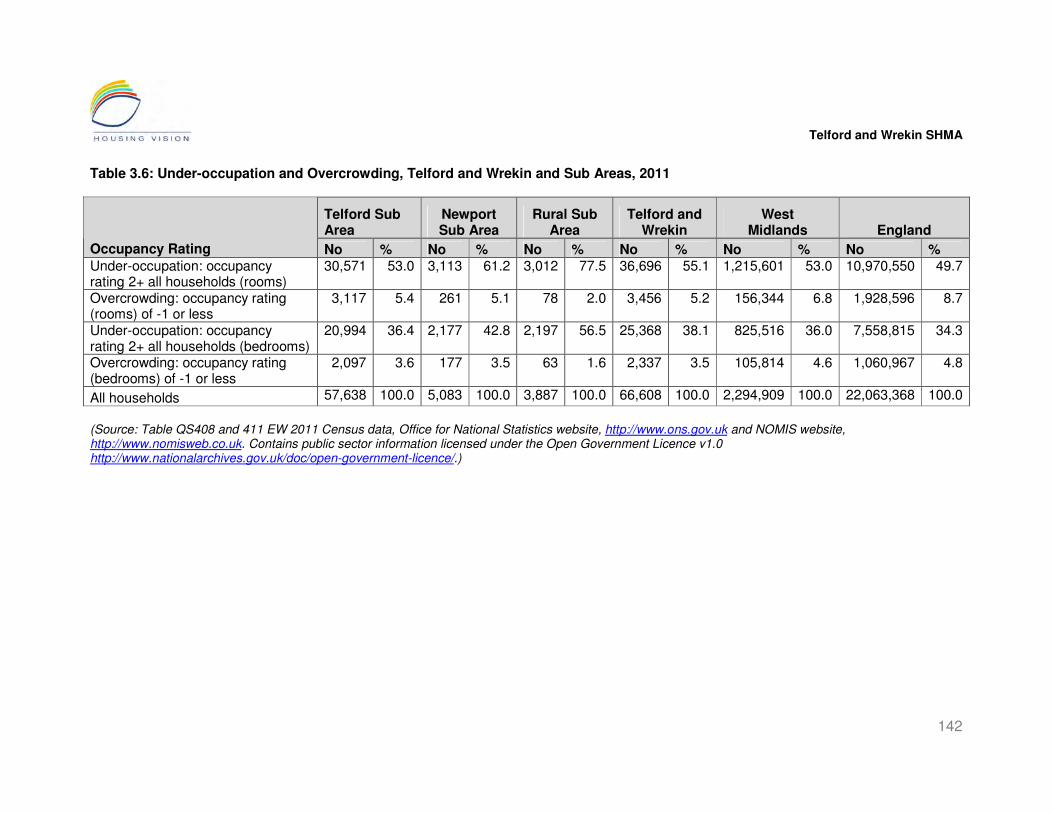
Telford and Wrekin SHMA
142
Table 3.6: Under-occupation and Overcrowding, Telford and Wrekin and Sub Areas, 2011
Telford Sub Area
Newport Sub Area
Rural Sub Area
Telford and Wrekin
West Midlands England
Occupancy Rating No % No % No % No % No % No % Under-occupation: occupancy rating 2+ all households (rooms)
30,571 53.0 3,113 61.2 3,012 77.5 36,696 55.1 1,215,601 53.0 10,970,550 49.7
Overcrowding: occupancy rating (rooms) of -1 or less
3,117 5.4 261 5.1 78 2.0 3,456 5.2 156,344 6.8 1,928,596 8.7
Under-occupation: occupancy rating 2+ all households (bedrooms)
20,994 36.4 2,177 42.8 2,197 56.5 25,368 38.1 825,516 36.0 7,558,815 34.3
Overcrowding: occupancy rating (bedrooms) of -1 or less
2,097 3.6 177 3.5 63 1.6 2,337 3.5 105,814 4.6 1,060,967 4.8
All households 57,638 100.0 5,083 100.0 3,887 100.0 66,608 100.0 2,294,909 100.0 22,063,368 100.0
(Source: Table QS408 and 411 EW 2011 Census data, Office for National Statistics website, http://www.ons.gov.uk and NOMIS website, http://www.nomisweb.co.uk. Contains public sector information licensed under the Open Government Licence v1.0 http://www.nationalarchives.gov.uk/doc/open-government-licence/.)

Telford and Wrekin SHMA
143
Key findings
• Overcrowding is less of a problem in Telford and Wrekin than in the region and in England.
• Using the bedroom occupancy rating, 3.5% of households in Telford and Wrekin were overcrowded in 2011. This was lower than in the West Midlands (4.6%) and in England (4.8%). 3.6% of households in the Telford sub area were overcrowded compared to 3.5% in Newport and 1.6% in Rural.
• Using the room occupancy rating, 5.2% of households in Telford and Wrekin were overcrowded. This was lower than in the West Midlands (6.8%) and in England (8.7%). 5.4% of households in the Telford sub area were overcrowded compared to 5.1% in Newport and 2.0% in Rural.
• There is a higher level of underoccupation in Telford and Wrekin than in the Region and in England:
• Using the bedroom occupancy rating, 38.1% of households in Telford and Wrekin were under-occupied. This was higher than in the West Midlands (36.0%) and in England (34.3%). 56.5% in the Rural sub area were under-occupied compared to 42.8% in Newport and 36.4% in the Telford sub area.
• Using the room occupancy rating, 55.1% of households were under-occupied. This was higher than in the West Midlands (53.0%) and in England (49.7%). More than three quarters (77.5%) in the Rural sub area were under-occupied compared to more than three fifths (61.2%) in Newport and more than half (53.0%) in the Telford sub area.
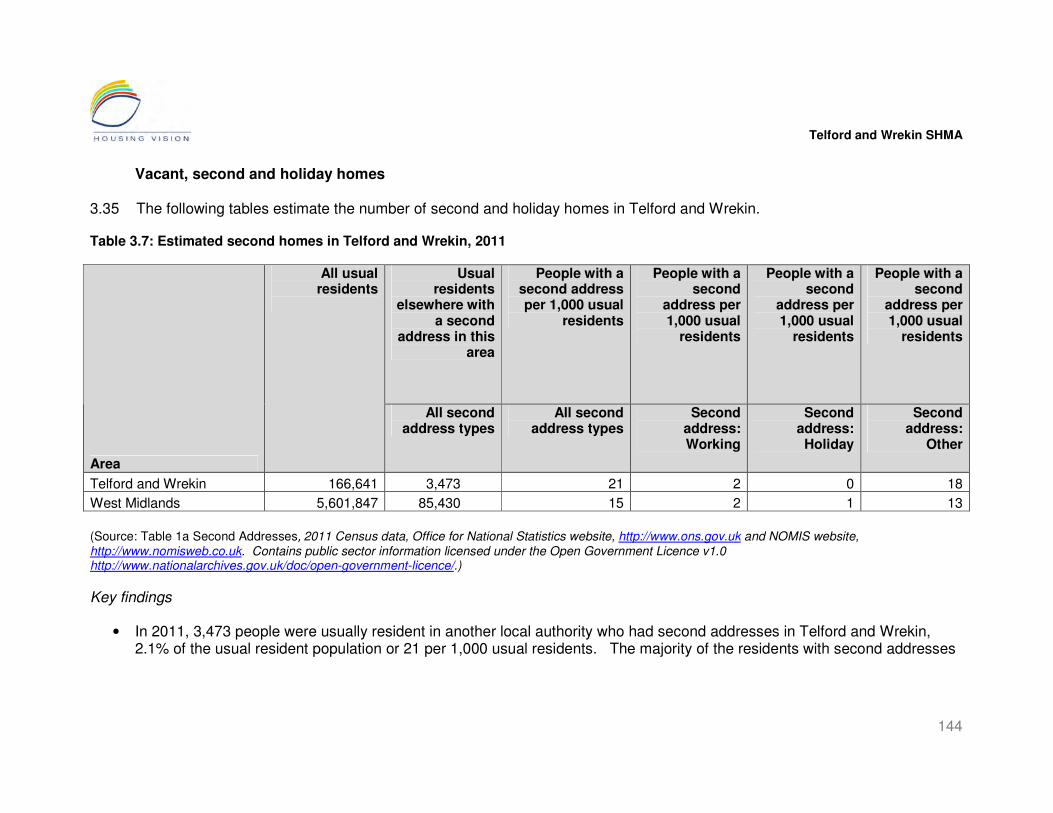
Telford and Wrekin SHMA
144
Vacant, second and holiday homes
3.35 The following tables estimate the number of second and holiday homes in Telford and Wrekin.
Table 3.7: Estimated second homes in Telford and Wrekin, 2011
Usual residents
elsewhere with a second
address in this area
People with a second address per 1,000 usual
residents
People with a second
address per 1,000 usual
residents
People with a second
address per 1,000 usual
residents
People with a second
address per 1,000 usual
residents
Area
All usual residents
All second address types
All second address types
Second address: Working
Second address: Holiday
Second address:
Other
Telford and Wrekin 166,641 3,473 21 2 0 18
West Midlands 5,601,847 85,430 15 2 1 13
(Source: Table 1a Second Addresses, 2011 Census data, Office for National Statistics website, http://www.ons.gov.uk and NOMIS website, http://www.nomisweb.co.uk. Contains public sector information licensed under the Open Government Licence v1.0 http://www.nationalarchives.gov.uk/doc/open-government-licence/.)
Key findings
• In 2011, 3,473 people were usually resident in another local authority who had second addresses in Telford and Wrekin, 2.1% of the usual resident population or 21 per 1,000 usual residents. The majority of the residents with second addresses

Telford and Wrekin SHMA
145
(85.7%) used them for Other reasons that were not holiday addresses or for work. 9.5% used their second addresses as work addresses.
3.36 The following table identifies the number of vacant home recorded by the 2011 Census. Table 3.8: Vacant Homes in Telford and Wrekin and Sub Areas 2011
Telford Sub Area Newport Sub
Area Rural Sub Area Telford and
Wrekin West Midlands England Household Spaces No % No % No % No % No % No %
Household spaces with at
least one usual resident
57,638 96.9 5,083 97.3 3,887 96.8 66,608 96.9 2,294,909 96.4 22,063,368 95.7
Household spaces with
no usual residents
1,851 3.1 143 2.7 128 3.2 2,122 3.1 86,008 3.6 980,729 4.3
All categories: Household
spaces
59,489 100.0 5,226 100.0 4,015 100.0 68,730 100.0 2,380,917 100.0 23,044,097 100.0
(Source: Table KS401EW 2011 Census data, Office for National Statistics website, http://www.ons.gov.uk and NOMIS website, http://www.nomisweb.co.uk. Contains public sector information licensed under the Open Government Licence v1.0 http://www.nationalarchives.gov.uk/doc/open-government-licence/.)
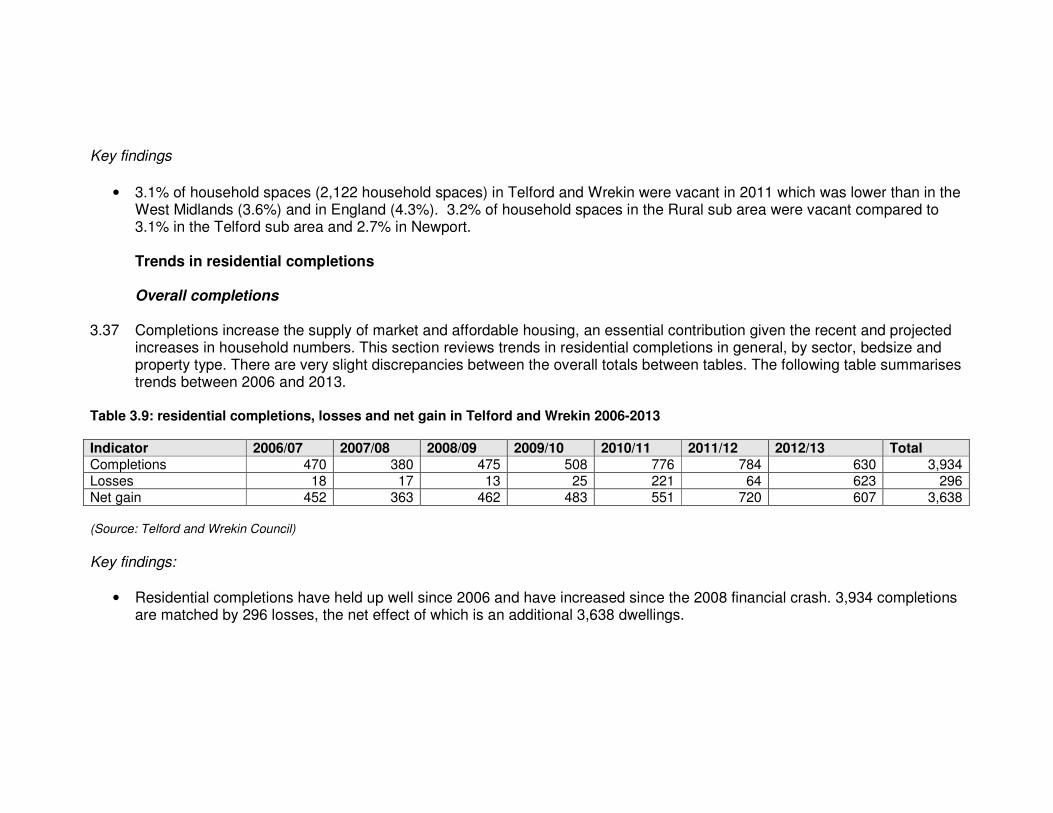
Key findings
• 3.1% of household spaces (2,122 household spaces) in Telford and Wrekin were vacant in 2011 which was lower than in the West Midlands (3.6%) and in England (4.3%). 3.2% of household spaces in the Rural sub area were vacant compared to 3.1% in the Telford sub area and 2.7% in Newport. Trends in residential completions
Overall completions
3.37 Completions increase the supply of market and affordable housing, an essential contribution given the recent and projected
increases in household numbers. This section reviews trends in residential completions in general, by sector, bedsize and property type. There are very slight discrepancies between the overall totals between tables. The following table summarises trends between 2006 and 2013.
Table 3.9: residential completions, losses and net gain in Telford and Wrekin 2006-2013 Indicator 2006/07 2007/08 2008/09 2009/10 2010/11 2011/12 2012/13 Total Completions 470 380 475 508 776 784 630 3,934 Losses 18 17 13 25 221 64 623 296 Net gain 452 363 462 483 551 720 607 3,638 (Source: Telford and Wrekin Council)
Key findings:
• Residential completions have held up well since 2006 and have increased since the 2008 financial crash. 3,934 completions are matched by 296 losses, the net effect of which is an additional 3,638 dwellings.

147
• Then net gain of 3,638 properties compares with a Core Strategy target of 8,050 homes between 2006 and 2013, an overall shortfall of 4,412 dwellings. Completions by tenure
3.38 The following table summarises trends in all and affordable (RSL) housing completions between 2007 and 2012. Table 3.10: all and affordable residential completions in Telford and Wrekin, 2007-2012
Area Type 2007/ 08
2008/ 09
2009/ 10
2010/ 11
2011/ 12
Total No.
Total %
All 380 475 508 776 784 2,923 100 Affordable 73 139 184 202 275 873 -
Telford and Wrekin % affordable 19.2 29.3 36.2 26.0 35.1
- 29.9 (Source: Telford and Wrekin Council Annual Monitoring reports and CLG Live Table 253 Housebuilding: permanent dwellings completed by tenure and district. CLG website http://www.communities.gov.uk/corporate/. Contains public sector information licensed under the Open Government Licence v1.0 http://www.nationalarchives.gov.uk/doc/open-government-licence/.)
Key findings:
• Of 2,923 dwelling completions between 2007 and 2012, 873 or 30% were affordable housing, or an average of 175 per annum.
• This average completion rate compares with a requirement from the 2010 SHMA Update for 1,240 affordable dwellings per annum.

148
Housing completions by bedsize 3.39 The following table uses local authority data to examine output by bedsize for the period 2007-2012. Data for 2010-12 is
incomplete and therefore, patterns have only been considered for the 3 previous years. Table 3.11: residential completions by bedsize in Telford and Wrekin, 2007-2012
Year 1 2 3 4 5+ Not known Total 2007/08 63 66 105 144 6 - 384 2008/09 28 170 136 90 41 - 465 2009/10 42 165 173 113 19 - 512 Total no. 133 401 414 347 66 - 1,361 Total % 9.8% 29.5% 30.4% 25.5% 4.9% 100% 2010/11 0 11 22 21 12 719 -
2011/12 10 81 20 - - 662 - (Source: Telford and Wrekin local authority housing completions data)
Key findings:
• Over the period 2007-10:
o 40% of new homes were 1 or 2 bed; o 30% were 3 bed; and o 30% were 4 bed or larger.
Housing completions by property type
3.40 The following table uses local authority data to examine output by property type for the period 2007-2012. Data for 2010-12
is incomplete and therefore, patterns have only been considered for the 3 previous years.

149
Table 3.12: residential completions by property type in Telford and Wrekin, 2007-2012
Year Detached Flat Mobile home Semi-detached Terraced Not known Total 2007/08 81 113 25 24 128 - 371 2008/09 102 124 3 36 211 - 476
2009/10 101 105 1 124 196 - 527 Total no. 284 342 29 184 535 - 1,374
Total % 20.7% 24.9% 2.1% 13.4% 38.9% 100% 2010/11 81 91 0 38 25 550 - 2011/12 62 158 0 15 22 525 - (Source: Telford and Wrekin local authority housing completions data)
Key findings:
• Over the period 2007-10, the main property types built were:
o terraced houses - 39%; o flats -25%; o detached properties - 21% - which seems a very high proportion; and o semi-detached homes - 13%.

The private rented sector
Introduction 3.41 Such is the significance of the private rented sector in Telford and
Wrekin, and the scale of its growth since 2011 that particular attention has been devoted to understanding its current role and future potential.
What is the size of the sector, how has it grown and where is it concentrated? 3.42 The following table demonstrates the growth of the sector across the
West Midlands since 2001 and provides a context for Telford and Wrekin.

Table 3.13: Private Rented Sector, Change between 2001 Census and 2011 Census in West Midlands Local Authorities
2001 2011 Change since 2001
Local Authority All Households Private Rented % All households Private Rented % No %
Birmingham 390,792 34,508 8.8 410,736 73,405 17.9 38,897 112.7
Bromsgrove 35,168 1,529 4.3 38,290 3,370 8.8 1,841 120.4
Cannock Chase 37,101 1,874 5.1 40,664 4,938 12.1 3,064 163.5
Coventry 122,355 12,429 10.2 128,592 26,503 20.6 14,074 113.2
Dudley 124,984 5,085 4.1 129,867 12,004 9.2 6,919 136.1
East Staffordshire 42,722 3,471 8.1 47,251 7,152 15.1 3,681 106.1
Herefordshire, County of 74,289 7,754 10.4 78,319 12,147 15.5 4,393 56.7
Lichfield 37,500 2,062 5.5 41,224 3,932 9.5 1,870 90.7
Malvern Hills 30,070 2,594 8.6 32,212 3,720 11.5 1,126 43.4
Newcastle-under-Lyme 50,734 2,847 5.6 52,574 5,511 10.5 2,664 93.6
North Warwickshire 25,180 1,778 7.1 25,812 2,913 11.3 1,135 63.8
Nuneaton and Bedworth 48,686 2,807 5.8 52,711 6,683 12.7 3,876 138.1
Redditch 31,648 1,369 4.3 34,722 4,059 11.7 2,690 196.5
Rugby 36,485 2,511 6.9 41,875 5,903 14.1 3,392 135.1
Sandwell 115,426 6,043 5.2 121,498 15,674 12.9 9,631 159.4
Shropshire 117,304 12,676 10.8 129,674 19,421 15.0 6,745 53.2
Solihull 80,920 3,400 4.2 86,056 8,502 9.9 5,102 150.1
South Staffordshire 41,973 1,990 4.7 44,458 3,772 8.5 1,782 89.5
Stafford 50,020 3,749 7.5 55,703 7,206 12.9 3,457 92.2
Staffordshire Moorlands 38,800 2,244 5.8 41,772 4,103 9.8 1,859 82.8
Stoke-on-Trent 103,199 7,710 7.5 107,575 15,440 14.4 7,730 100.3
Stratford-on-Avon 47,202 4,264 9.0 51,928 6,596 12.7 2,332 54.7

152
Tamworth 29,382 1,149 3.9 31,617 3,476 11.0 2,327 202.5
Telford and Wrekin 63,772 4,504 7.1 66,608 9,979 15.0 5,475 121.6
Walsall 101,331 4,950 4.9 107,822 12,569 11.7 7,619 153.9
Warwick 53,350 5,599 10.5 58,679 10,513 17.9 4,914 87.8
Wolverhampton 97,123 6,958 7.2 102,177 13,455 13.2 6,497 93.4
Worcester 39,059 3,637 9.3 42,042 7,645 18.2 4,008 110.2
Wychavon 46,821 3,029 6.5 49,466 5,419 11.0 2,390 78.9
Wyre Forest 40,286 2,749 6.8 42,985 5,660 13.2 2,911 105.9
West Midlands 2,153,682 157,269 7.3 2,294,909 321,670 14.0 164,401 104.5
NB Private Rented includes All Private Rented households (Source: Theme Table T08 Households, 2001 Census and Table KS402EW, Tenure, 2011 Census, http://nomisweb.co.uk))
Key findings
• The private rented sector more than doubled in size between 2001 and 2011
• The sector grew by 122%, the 10th largest growth rate in the region 3.43 The following table demonstrates the scale of the growth of the sector over the 10 years 2001-2011 and also the decline in
the owner occupied sector in Telford and Wrekin during the period.

153
Table 3.14: tenure profile in Telford and Wrekin, 2001 and 2011
2001 2011
Telford and Wrekin West Midlands England
Telford and Wrekin West Midlands England
Tenure No % No % No % No % No % No %
Owned 43,459 68.2 1,483,580 68.9 13,920,429 68.1 42,417 63.7 1,489,094 64.9 13,975,024 63.3
Shared Ownership 427 0.7 14,486 0.7 133,693 0.7 292 0.4 15,230 0.7 173,760 0.8
Social Rented 14,047 22.0 443,644 20.6 3,940,728 19.3 13,106 19.7 435,170 19.0 3,903,550 17.7
Private Rented 4,504 7.1 157,266 7.3 2,037,470 10.0 9,979 15.0 321,670 14.0 3,715,924 16.8
Living Rent Free 1,331 2.1 54,696 2.5 419,107 2.0 814 1.2 33,745 1.5 295,110 1.3
Total 63,768 100.0 2,153,672 100.0 20,451,427 100.0 66,608 100.0 2,294,909 100.0 22,063,368 100.0
NB Private Rented includes All Private Rented households
(Source: Theme Table T08 Households, 2001 Census http://nomisweb.co.uk)
Key findings
• The private rented sector has doubled as a proportion of the housing stock from 7% in 2001 to 15% in 2011. 3.44 Private rented housing is not equally distributed across the district. Using 2011 Census data at the Lower Super Output Area
level, the following maps identify the distribution of private rented housing across Telford and Wrekin including concentrations of all types of private rented properties in small areas within both the Telford and the Newport sub areas.

Map 3.1

155
Map 3.2
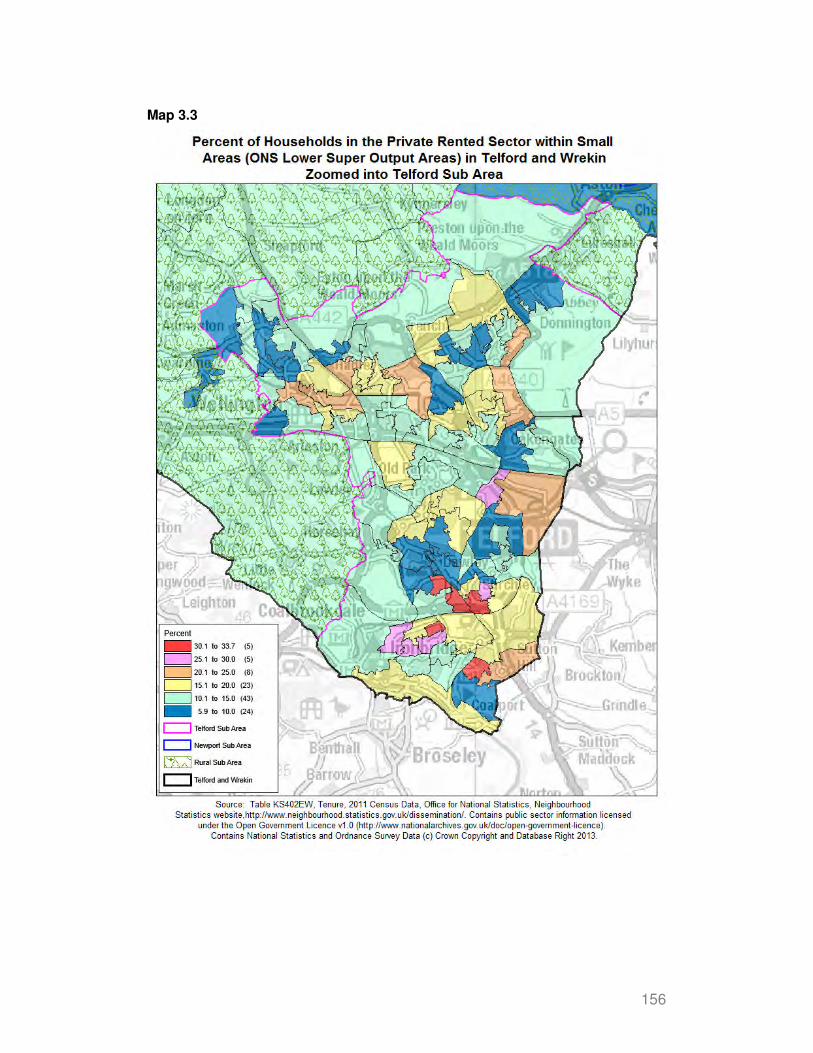
156
Map 3.3

157
Key findings
• There were 5 small areas with more than 30% of households renting privately in Telford and Wrekin, 4 of these being in the Telford sub area and 1 in the Newport sub area.
• There were a further 5 small areas where 25% to 30% of households were renting privately, all of these being in the Telford sub area.
• There were a further 8 small areas where 20% to 25% of households were renting privately, all of these being in the Telford sub area.
What is the profile of the sector by type of private renting? 3.45 The following table provide a profile of the private rented sector for
households providing a comparison with 2001 data.

158
Table 3.15: Types of Private Renting, 2001 and 2011
2001 2011
Telford and Wrekin West Midlands England
Telford and Wrekin West Midlands England
Type No.
% Type Private Rented No.
% Type Private Rented No.
% Type Private Rented No.
% Type Private Rented No.
% Type Private Rented No.
% Type Private Rented
Private landlord or letting agency 3,757 83.4 137,225 87.3 1,798,864 88.3 9,055 90.7 293,988 91.4 3,401,675 91.5
Employer of a household member 226 5.0 3,982 2.5 53,618 2.6 164 1.6 3,952 1.2 55,211 1.5
Relative or friend of household member 301 6.7 10,615 6.7 124,572 6.1 602 6.0 18,648 5.8 199,428 5.4
Other 219 4.9 5,443 3.5 60,416 3.0 158 1.6 5,082 1.6 59,610 1.6
Total Private Rented 4,503 100.0 157,265 100.0 2,037,470 100.0 9,979 100.0 321,670 100.0 3,715,924 100.0
Living rent free
Living rent free 1,335 54,696 419,107 814 33,745 295,110 NB S111 is for Household Reference Persons and QS405 is for households
(Source: S1112001 and QS405EW, 2011 Census, NOMIS, http://nomisweb.co.uk)

159
Key findings
• There has been an increase in the proportion of households renting from a landlord or agency (from 83% in 2001 to 91% in 2011).
• There has been a decline in the proportion renting privately from an Employer of a household member (from 5% in 2001 to 2% in 2011).
• There has been a slight decline in the proportion renting privately from a Relative or friend of household member an Employer of a household member (from 7% in 2001 to 6% in 2011).
• The number of households in Telford and Wrekin living rent free had decreased from 1,335 households to 814 households in 2011.
What type of housing is being provided by the private rented
sector? 3.46 The following table identifies the accommodation type of privately
renting households renting with a private landlord/lettings agency. Table 3.16: Accommodation Type Private Rented with Private Landlord or Letting Agency 2011
Telford and
Wrekin West Midlands England Type of Accommodation No % No % No %
Detached 1,253 13.8 32,451 11.0 307,017 9.0
Semi-detached 3,093 34.2 77,937 26.5 640,504 18.8
Terraced 2,969 32.8 84,156 28.6 876,820 25.8
Flat, Maisonette or Apartment in Purpose Built Block of Flats or Tenement
1,224 13.5 65,454 22.3 984,153 28.9
Flat, Maisonette or Apartment part of Converted or Shared House (including bedsits)
302 3.3 21,977 7.5 455,548 13.4
Flat, Maisonette or Apartment in Commercial Building or mobile, temporary accommodation
214 2.4 12,013 4.1 137,633 4.0
Totals 9,055 100.0 293,988 100.0 3,401,675 100.0
(Source: Table DC4406EW, 2011 Census NOMIS website, http://nomisweb.co.uk)
Key findings
• 81% of households renting privately with a landlord/lettings agency lived in houses and just under one fifth (19%) lived in other accommodation which was either flats, maisonettes, apartments or temporary/mobile accommodation in Telford and Wrekin in 2011. This

160
was a much higher percentage of houses than in the region (66%) and nationally (54%), and a much lower percentage of flats than in the region (34%) and nationally (46%).
• All house types had higher percentages than in the region and nationally and all other types had lower percentage than in the region and nationally in Telford and Wrekin in 2011.
3.47 The following table identifies the number of bedrooms in privately
renting households with a Private Landlord or Letting Agency in 2011. Table 3.17: Number of Bedrooms in Households Private Rented with Private Landlord or Letting Agency in 2011
Telford and Wrekin West Midlands England Bedrooms No % No % No %
1 bedroom 1,042 11.5 53,499 18.2 804,462 23.6
2 bedrooms 2,884 31.8 110,977 37.7 1,346,622 39.6
3 bedrooms 4,061 44.8 101,399 34.5 911,512 26.8
4 bedrooms 818 9.0 19,206 6.5 228,837 6.7
5 or more bedrooms 250 2.8 8,907 3.0 110,242 3.2
Total 9,055 100.0 293,988 100.0 3,401,675 100.0
NB '1 bedroom' includes households who indicated '0 bedrooms' and '1 bedroom'. This is because all households where someone usually lives must have at least one room used as a bedroom. (Source: Theme Table DC4405EW, 2011 Census, NOMIS, http://nomisweb.co.uk)
Key findings
• The findings show more medium size and slightly more larger homes than in the region or nationally indicating more homes suitability for families and less suitable accommodation for single person or two person households.
3.48 The following table shows the number of rooms in households renting privately with a landlord or lettings agency in 2011 in Telford and Wrekin.

161
Table 3.18: Number of Rooms in Households Private Rented with Private Landlord or Letting Agency in 2011
Telford and Wrekin West Midlands England Rooms No % No % No %
1 room 52 0.6 4,801 1.6 90,849 2.7
2 rooms 335 3.7 18,009 6.1 277,092 8.1
3 rooms 916 10.1 44,180 15.0 642,512 18.9
4 rooms 2,127 23.5 71,027 24.2 936,631 27.5
5 rooms 3,066 33.9 76,432 26.0 725,386 21.3
6 rooms 1,479 16.3 48,980 16.7 422,529 12.4
7 rooms 531 5.9 16,201 5.5 157,836 4.6
8 or more rooms 549 6.1 14,358 4.9 148,840 4.4
Total 9,055 100.0 293,988 100.0 3,401,675 100.0
(Source: Table DC4404EW, 2011 Census NOMIS website, http://nomisweb.co.uk)
Key findings
• Again the findings indicate more medium sized homes and slightly higher percentages of larger homes than in the region or nationally, therefore more suitability for families and less suitable accommodation available for single or two person households.
Who is renting privately? 3.49 The following table identifies the household size of privately renting
households renting with a private landlord/lettings agency in Telford and Wrekin in 2011.
Table 3.19: household size for Private Rented with Private Landlord or Letting Agency in 2011
Telford and Wrekin West Midlands England Household Size No % No % No %
1 person 1,690 18.7 92,287 31.4 1,068,227 31.4
2 people 2,895 32.0 92,527 31.5 1,096,632 32.2
3 people 1,973 21.8 51,413 17.5 574,392 16.9
4 people 1,386 15.3 33,374 11.4 390,424 11.5
5 people 736 8.1 14,634 5.0 166,002 4.9
6 or more people 375 4.1 9,753 3.3 105,998 3.1
Total 9,055 100.0 293,988 100.0 3,401,675 100.0
(Source: Theme Table DC4405EW, 2011 Census, NOMIS, http://nomisweb.co.uk)

162
Key findings
• The sector is playing an important role in housing singles and couples. 51% of privately renting households consist of only 1 or 2 people but below regional (63%) and national averages (64%);
• In contrast, 49% consist of 3 people or more compared to 37% in the region and 36% nationally.
3.50 The following table identifies the household size by bedsize for privately rented households renting with a private landlord/lettings agency.

163
Table 3.20: Household Size by Number of Beds Private Rented Private Landlord or Letting Agency in Telford and Wrekin
1 bedroom 2 bedrooms 3 bedrooms 4 bedrooms 5 or more bedrooms
Household Size No % No % No % No % No %
1 person 636 61.0 672 23.3 335 8.2 40 4.9 7 2.8
2 people 334 32.1 1,353 46.9 1,072 26.4 110 13.4 26 10.4
3 people 46 4.4 617 21.4 1,128 27.8 139 17.0 43 17.2
4 people 16 1.5 195 6.8 936 23.0 202 24.7 37 14.8
5 people 4 0.4 38 1.3 445 11.0 184 22.5 65 26.0
6 or more people 6 0.6 9 0.3 145 3.6 143 17.5 72 28.8
Total 1,042 100.0 2,884 100.0 4,061 100.0 818 100.0 250 100.0
(Source: Table DC4405EW, 2011 Census NOMIS website, http://nomisweb.co.uk)
Key findings
• 93% of 1 bedroom privately rented households consisted of 1 or 2 people in Telford and Wrekin in 2011.
• 70% of 2 beds privately rented households consisted of 1 or 2 people and 21% consisted of 3 people.
• 77% of 3 bed privately rented households consisted of either 2, 3 or 4 people, and 15% had 5 or more people. 8% were single person households.
• 18% of 4 bed homes consisted of 1 or 2 people, 17% of 3 people, 25% of 4 people and 40% of 5 or more people.
• 13% of 5 bed plus homes consisted of 1 or 2 persons; 17% of 3 people, 15% of 4 people and 55% of 5 or more people.
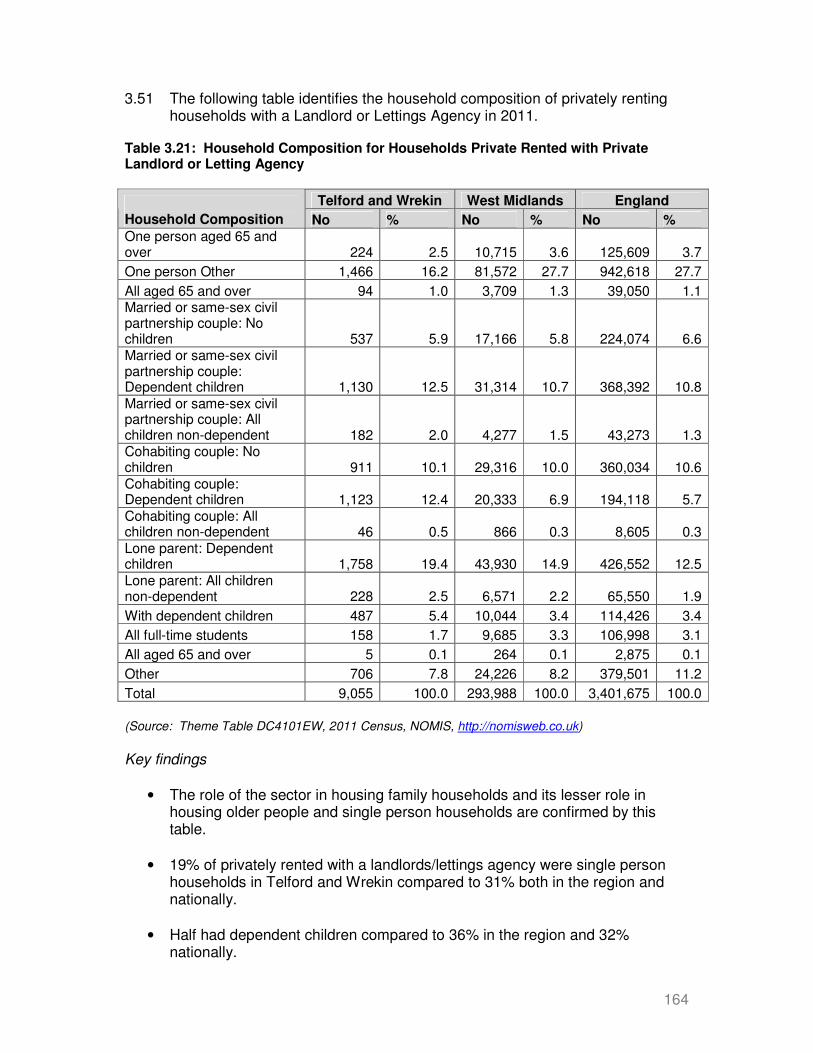
164
3.51 The following table identifies the household composition of privately renting households with a Landlord or Lettings Agency in 2011.
Table 3.21: Household Composition for Households Private Rented with Private Landlord or Letting Agency
Telford and Wrekin West Midlands England Household Composition No % No % No % One person aged 65 and over 224 2.5 10,715 3.6 125,609 3.7
One person Other 1,466 16.2 81,572 27.7 942,618 27.7
All aged 65 and over 94 1.0 3,709 1.3 39,050 1.1 Married or same-sex civil partnership couple: No children 537 5.9 17,166 5.8 224,074 6.6 Married or same-sex civil partnership couple: Dependent children 1,130 12.5 31,314 10.7 368,392 10.8
Married or same-sex civil partnership couple: All children non-dependent 182 2.0 4,277 1.5 43,273 1.3 Cohabiting couple: No children 911 10.1 29,316 10.0 360,034 10.6 Cohabiting couple: Dependent children 1,123 12.4 20,333 6.9 194,118 5.7 Cohabiting couple: All children non-dependent 46 0.5 866 0.3 8,605 0.3 Lone parent: Dependent children 1,758 19.4 43,930 14.9 426,552 12.5 Lone parent: All children non-dependent 228 2.5 6,571 2.2 65,550 1.9
With dependent children 487 5.4 10,044 3.4 114,426 3.4
All full-time students 158 1.7 9,685 3.3 106,998 3.1
All aged 65 and over 5 0.1 264 0.1 2,875 0.1
Other 706 7.8 24,226 8.2 379,501 11.2
Total 9,055 100.0 293,988 100.0 3,401,675 100.0
(Source: Theme Table DC4101EW, 2011 Census, NOMIS, http://nomisweb.co.uk)
Key findings
• The role of the sector in housing family households and its lesser role in housing older people and single person households are confirmed by this table.
• 19% of privately rented with a landlords/lettings agency were single person households in Telford and Wrekin compared to 31% both in the region and nationally.
• Half had dependent children compared to 36% in the region and 32% nationally.

165
• 4% were 65 plus households compared to 5% in the region and nationally. 3.52 The following table identifies privately renting households by age band. Table 3.22: Age Bands of Household Reference Person in Households Private Rented with Private Landlord or Lettings Agency in 2011
Telford and Wrekin West Midlands England Age Bands No % No % No %
Age 16 to 34 4,254 47.0 139,397 47.4 1,606,795 47.2
Age 35 to 49 3,050 33.7 94,290 32.1 1,111,673 32.7
Age 50 to 64 1,287 14.2 41,044 14.0 468,516 13.8
Age 65 and over 463 5.1 19,191 6.5 213,917 6.3
Total 9,054 100.0 293,922 100.0 3,400,901 100.0
(Source: Theme Table DC4601EW, 2011 Census, NOMIS, http://nomisweb.co.uk)
Key findings
• The largest age band housed in the private rented sector with a landlord or lettings Agency in Telford and Wrekin is young people under the age of 35 (47%), a similar rate to that in the Region and nationally.
3.53 The following table identifies privately rented households by main ethnic group in Telford and Wrekin in 2011.
Table 3.23: Ethnic Group of Household Reference Person in Households Private Rented with Private Landlord or Letting Agency in 2011
Telford and Wrekin West Midlands England Ethnic Group No % No % No %
White 8,382 92.6 237,781 80.9 2,794,124 82.1
Mixed/multiple ethnic group 125 1.4 7,083 2.4 81,290 2.4
Asian/Asian British 303 3.3 29,617 10.1 292,284 8.6 Black/African/Caribbean/ British 209 2.3 15,005 5.1 161,522 4.7
Other ethnic group 36 0.4 4,502 1.5 72,455 2.1
Total 9,055 100.0 293,988 100.0 3,401,675 100.0
(Source: Table DC4201EW, 2011 Census NOMIS website, http://nomisweb.co.uk)
Key findings
• The majority of tenants were white (93%) which was higher than in the region (81%) and nationally (82%) but which conforms with the proportion in the wider population.
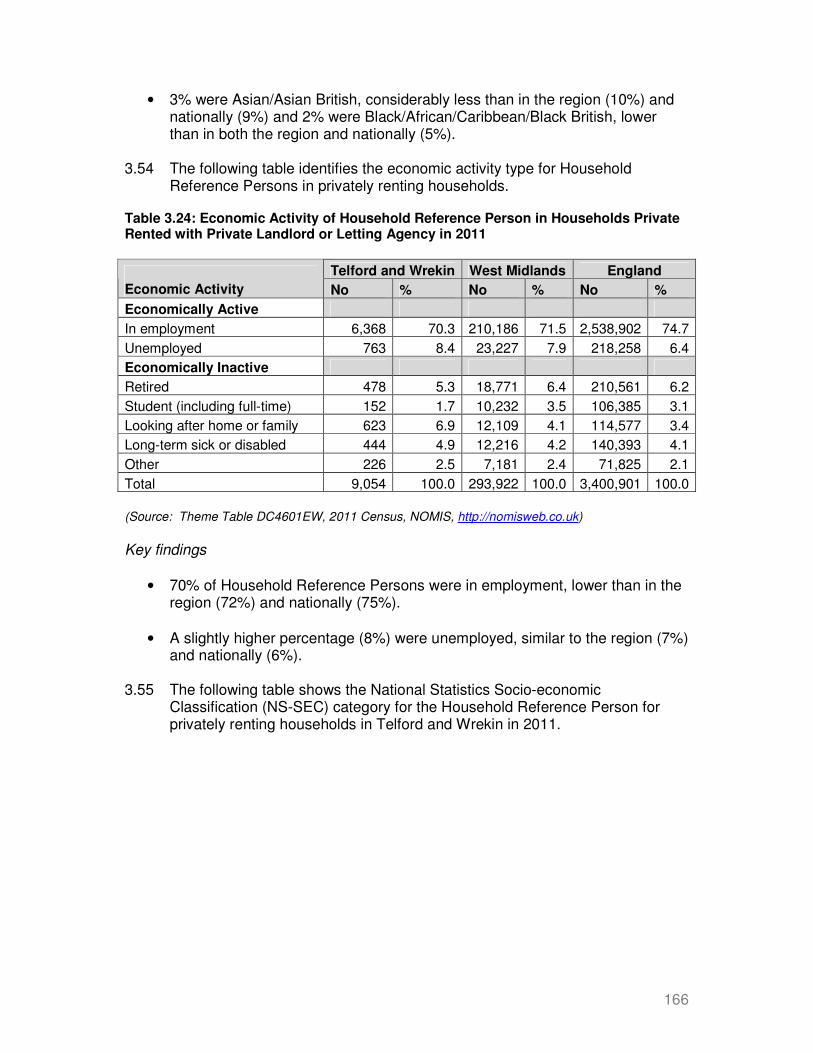
166
• 3% were Asian/Asian British, considerably less than in the region (10%) and nationally (9%) and 2% were Black/African/Caribbean/Black British, lower than in both the region and nationally (5%).
3.54 The following table identifies the economic activity type for Household
Reference Persons in privately renting households. Table 3.24: Economic Activity of Household Reference Person in Households Private Rented with Private Landlord or Letting Agency in 2011
Telford and Wrekin West Midlands England Economic Activity No % No % No %
Economically Active
In employment 6,368 70.3 210,186 71.5 2,538,902 74.7
Unemployed 763 8.4 23,227 7.9 218,258 6.4
Economically Inactive
Retired 478 5.3 18,771 6.4 210,561 6.2
Student (including full-time) 152 1.7 10,232 3.5 106,385 3.1
Looking after home or family 623 6.9 12,109 4.1 114,577 3.4
Long-term sick or disabled 444 4.9 12,216 4.2 140,393 4.1
Other 226 2.5 7,181 2.4 71,825 2.1
Total 9,054 100.0 293,922 100.0 3,400,901 100.0
(Source: Theme Table DC4601EW, 2011 Census, NOMIS, http://nomisweb.co.uk)
Key findings
• 70% of Household Reference Persons were in employment, lower than in the region (72%) and nationally (75%).
• A slightly higher percentage (8%) were unemployed, similar to the region (7%) and nationally (6%).
3.55 The following table shows the National Statistics Socio-economic Classification (NS-SEC) category for the Household Reference Person for privately renting households in Telford and Wrekin in 2011.

167
Table 3.25: NS-SEC Household Reference Person Private Rented Private Landlord or Letting Agency
Telford and Wrekin West Midlands England NS-SEC No % No % No % 1. Higher managerial, administrative and professional occupations 600 6.6 26,401 9.0 402,942 11.8 2. Lower managerial, administrative and professional occupations 1,419 15.7 53,681 18.3 721,992 21.2
3. Intermediate occupations 887 9.8 30,073 10.2 350,103 10.3
4. Small employers and own account workers 657 7.3 27,202 9.3 346,816 10.2
5. Lower supervisory and technical occupations 933 10.3 24,162 8.2 261,498 7.7
6. Semi-routine occupations 1,870 20.7 46,678 15.9 474,758 14.0
7. Routine occupations 1,627 18.0 42,273 14.4 405,369 11.9
8. Never worked and long-term unemployed 762 8.4 23,125 7.9 213,302 6.3 Not Classified L15 Full-time students 299 3.3 20,327 6.9 224,121 6.6
Total 9,054 100.0 293,922 100.0 3,400,901 100.0
(Source: Table DC4605EW, 2011 Census NOMIS website, http://nomisweb.co.uk)
Key findings
• The findings show a higher percentage of Household Reference Persons in the categories that are likely to have lower earnings than in the region or nationally, and lower percentages in the managerial categories that are likely to have higher earnings.
How suitable is privately rented housing? 3.56 This an extremely difficult question to answer from Census data but the
‘occupancy rating’ enables overcrowding and underoccupation to be assessed.

168
Table 3.26: Occupancy Rating Rooms Private Rented and Living Rent Free 2011
Telford and Wrekin West Midlands England Occupancy Rating Rooms No % No % No %
Plus 2 or More 3,366 31.2 111,739 31.4 1,004,570 25.0
Plus 1 3,300 30.6 100,175 28.2 1,046,728 26.1
Zero 2,852 26.4 90,398 25.4 1,150,776 28.7
Minus 1 or Less 1,275 11.8 53,103 14.9 808,960 20.2
Totals 10,793 100.0 355,415 100.0 4,011,034 100.0
(Source: Table DC4104EW, 2011 Census NOMIS website, http://nomisweb.co.uk)
Table 3.27: Occupancy Rating Bedrooms Private Rented and Living Rent Free
Telford and
Wrekin West Midlands England Occupancy Rating Bedrooms No % No % No %
Plus 2 or More 1,864 17.3 62,711 17.6 592,655 14.8
Plus 1 4,334 40.2 132,984 37.4 1,370,680 34.2
Zero 3,838 35.6 133,212 37.5 1,684,068 42.0
Minus 1 or Less 757 7.0 26,508 7.5 363,631 9.1
Totals 10,793 100.0 355,415 100.0 4,011,034 100.0
(Source: Table DC4105EW, 2011 Census NOMIS website, http://nomisweb.co.uk)
Key findings
• According to the bedroom definition 7% of privately rented households are overcrowded in Telford and Wrekin in 2011, slightly lower than in the region (8%) and lower than the national level of 9%.
• According to the room definition 12% are overcrowded, lower than in the region (15%) and nationally (20%).
• According to the bedroom definition, 17% of privately rented households are under-occupied (Plus Two or more) in Telford and Wrekin in 2011, a little lower than in the region (18%) and higher than nationally (15%).
• According to the room definition, 31% were under-occupied in Telford and Wrekin in 2011, similar to the region (31%) and higher than nationally (25%).
Current patterns and trends 3.57 This section profiles the sector by property type, bedsize and rental levels.
The following data sources have been consulted:
• the property websites ‘rightmove.co.uk’ and ‘Zoopla.co.uk’; and

169
• the Valuation Office Agency database. The Valuation Office Agency (VOA) database holds lettings information collected as part of the VOA’s responsibility to administer the rent officer functions related to Housing Benefit (Local Housing Allowance and Local Reference Rents) on behalf of the Department for Work and Pensions (DWP).
Turnover
Stock and supply profile
3.58 Property websites enable the supply of private rented housing to be profiles by bedsize and property type. Over the period March to May 2013, in the region of 375 properties were for rent at any one time, representing 4.1% of stock rented from a private landlord or letting agency. Full details are not available for all properties, but the following table uses available data to estimate the proportion of properties available by broad property type and bedsize.
Table 3.28: the private rented sector in Telford and Wrekin by bedsize and main property type, average number of properties advertised for the 3 months March to May 2013 (rounded to 5) Year 1 or less 2 3 4 5+ Total no. Total % House 25 40 100 25 5 185 66% Flat 40 50 5 0 0 95 34% Total no. 65 90 105 25 5 280 - Total % 23% 32% 38% 9% 2% - 100 (Source: zoopla.co.uk)
Key findings:
• The supply from private renting is skewed towards houses. Only one third of properties advertised were flats, which compares with a 2011 stock of 10%, and two thirds were houses, which compares with a 2011 stock of 90% (See Table 3.1);
• The supply from private renting is skewed towards smaller properties. 23% of properties advertised were 1 bed or less (compared with a total stock of 7%) and 38% were 2 bed (compared with a total stock of 24%). 38% were 3 bed compared with a 2011 stock of 47% and 11% were 4 bed or larger (compared with a total stock of 22%).
• The private rented sector appears able to meet the requirements of both smaller single/couple and family households.
• Interviews with letting agents reported below identified that properties took from 4 days to 6 weeks to let. If the longer time period is applied, this is equivalent to all currently available stock turning over within 6 weeks or 8.7 times per annum (365 days/42 days to let). This is equivalent to 3,263 properties (8.7 x 375 properties available). As a proportion of the 9,055

170
privately rented properties identified in the 2011 Census as rented from a private landlord or letting agency, this is equivalent to a turnover of 36% (9,055/3,263). This rate compares closely with the finding from the English Housing Survey 2011-12, that 32% of those renting privately had lived in their homes for 1 year or less.
3.59 The following table uses available data to estimate the proportion of
properties available by property type. Table 3.29: the private rented sector in Telford and Wrekin by property type, average number of properties advertised for the 3 months March to May 2013 (numbers rounded to 5)
Year Bungalow Detached house
Semi-detached house
Terraced house Flat
Total no.
Total %
Total no. 10 40 60 105 130 355 - Total % 3% 11% 17% 30% 37% - 100% (Source: zoopla.co.uk)
Key findings:
• In terms of property types, 37% were flats compared with a stock of 10%; only 11% were semi-detached houses compared with a 2011 stock of 36%; 30% were terraced houses compared with a 2011 stock of 23% and 11% were detached houses compared with a 2011 stock of 31%.
• This profile reinforces the pattern already identified that the private rented sector is able to meet the requirements of both smaller single/couple households and family households.
3.60 The following table uses available data to estimate the proportion of
properties available by detailed property type in the 3 main sub areas as follows

171
Table 3.30: the private rented sector in Telford and Wrekin by property type, average number of properties advertised for the 3 months March to May 2013 (numbers rounded to 5)
Sub-area Year Bungalow
Detached house
Semi-detached house
Terraced house Flat
Total no.
Total %
Telford Total no. 5 30 50 100 110 295 -
Total % 2% 10% 17% 34% 37% - 100%
Newport Total no. 5 5 10 5 15 40 -
Total % 12% 12% 25% 12% 38% - 100%
Rural Total no. 0 5 5 0 5 15 -
Total % 0% 33% 33% 0% 30% - 100%
(Source: zoopla.co.uk)
Key findings:
• The Telford sub area dominates supply, providing over 80% of private rented housing. Not surprisingly, the profile by property type is very similar to the Telford and Wrekin area but there is some variation in Newport and the Rural sub area - with higher proportions of semi-detached houses available.
3.61 Collected in the course of determining Local Housing Allowances, the
Valuation Office Agency provides useful data profiling the rental stock by bedsize and providing rent levels. Data is recorded by Broad Rental Market Areas (BRMA) and Telford and Wrekin fall within a wider Shropshire BRMA. Further detail including a map of the area is available at:
https://lha-
direct.voa.gov.uk/SearchResults.aspx?LocalAuthorityId=89&LHACategory=999&Month=5&Year=2013&SearchPageParameters=true
3.62 The following table provides more detailed information concerning the number
of properties and average rents by bedsize for properties for the period from 1st January to 31st December 2012. The table also include the relevant LHA rate to 31st March 2014 which identifies rents at the 30th percentile of the rental range.

172
Table 3.31: the number of market rents and rental levels by property type and bedsize, in Telford and Wrekin, VOA, 1st January-31st December 2012
Number of rents % of rents
Average Rent (£)
Lower Quartile Rent (£)
Median Rent (£)
Upper Quartile Rent (£)
Current LHA rate
Shared room 125 12.2 372 303 347 433
300
1 bed 125 12.2 421 395 400 450 375 2 bed 357 34.8 522 495 520 550 475 3 bed 301 29.4 596 550 585 650 550
4 bed 112 10.9 842 725 798 950 725 All 1,025 100% 547 450 525 600 -
(Source: VOA Residential Rental Market Statistics)
Key findings:
• The market is dominated by 2 and 3 bed properties, 35% were 2 bed and 29% were 3 bed. Such a profile suggests that the smallest households are at a disadvantage in accessing the private rented sector. This is of particular importance for single people under 35 who can only gain LHA support for shared housing
• Average rents ranged from £370 for a Room and £420 for a 1 bed property then increased by in the region of £100 for 2 bed property to almost £600 for a 3 bed and almost £850 for a 4 bed property.
• Current LHA rates are just below 2012 lower quartile rents for properties with 2 bedrooms or less, and at the lower quartile level for 3 and 4 bed properties.
3.63 The following table summarises average calendar month rents from net-based
sources for May 2013, includes VOA average data for 2012 and current LHA rate to 31st March 2014
Table 3.32: average per calendar month private rented sector rents for properties advertised in Telford and Wrekin, by bedsize and main property type, May 2013 and VOA 2012, £ rounded to £5 Year 1 2 3 4 5+ House 410 540 610 805 1,255 Flat 400 490 700 - - Average 405 515 610 805 1,255 VOA average 400 520 600 840 - LHA rate 375 475 550 725 - (Source: zoopla.co.uk and VOA)
Key findings:
• Average rents range from close to £400 for a 1 bed property then increased in steps in the region of £100 for 2 and 3 bed properties before increasing to

173
over £800 for 4 bed properties. These current market rents are broadly consistent with the VOA average for 2012. LHA rates are substantially below average market rents in all cases.
The home ownership sector
3.64 This section uses Land Registry data, net-based data and interviews with
estate agents to profile the supply of housing from the home ownership sector. The following table summarises the number of sales and average property prices between 2007 and 2012.
Table 3.33: the annual volume of sales and average property prices in Telford and Wrekin, 01.01.07 to 31.12.11
Telford and Wrekin Year No Sales Average Price
1/1/2007 to 31/12/2007 3,279 £155,556.95
1/1/2008 to 31/12/2008 1,662 £157,814.25
1/1/2009 to 31/12/2009 1,444 £154,086.51
1/1/2010 to 31/12/2010 1,490 £156,873.06
1/1/2011 to 31/12/2011 1,586 £152,468.35
Totals 9,461 £155,418.57
Annual Average Sales 2008-2011 1,546
(Source: Land Registry)
Key findings
• In 2008, sales fell to half the total of the previous year and have remained at that level;
• Average sales over the 4 previous years are just over 1,500, equivalent to a very low turnover rate of 3.65%.
3.65 The following table summarises the number of sales and average price by
property type between January 2011 and January 2012. Table 3.34: average property price by type of dwelling in Telford and Wrekin, 01.01.11 to 31.01.12
Telford and Wrekin Type No Sales % Sales Average Price £
Detached 569 33.5 £216,660.96
Semi Detached 550 32.4 £126,594.67
Terraced 463 27.2 £117,986.96
Flats and Apartments 118 6.9 £91,585.08
Overall 1,700 100.0 £151,965.98 (Source: Land Registry)

174
Key findings:
• One third of sales were of detached properties, and almost the same proportion were semi-detached. Terraced houses made up over one quarter and flats and apartments only 7%.
3.66 Using net-based sources, the following table summarises the number of
properties currently advertised in Telford and the average price by main property type and bedsize.
Table 3.35: the number and proportion of properties advertised by bedsize and main property type, and average prices for Telford and Wrekin, May 2013, number of sales rounded to 5
Year 1 2 3 4 5+ Totals Number of houses for sale 20 205 515 355 55
1,150
% of sales 1.74 17.83 44.78 30.87 4.78 100% House price £102k £124k £149k £230k £309k
Number of flats for sale 30 60 5 - - 95 % of sales 31.58 63.18 5.26 - - 100% Flat price £81k £101k £210k - -
Total for sale 50 265 520 355 55 1,245 % of sales 4.02 21.29 41.77 28.51 4.42 100% Average price £90k £119k £150k £230k £309k (Source: zoopla.co.uk)
Key findings:
• Average prices advertised range from £90k for a 1 bed property then increased in steps in the region of £30k for 2 and 3 bed properties before increasing to £230k for 4 bed properties.
• Only 8% of properties for sale were flats and only 4% were 1 bed properties. The market is dominated by family-sized 3 bed (42%) and 4 bed properties (29%). Such a profile indicates that smaller households have much less choice in accessing home ownership.
3.67 The following table uses available data to estimate the proportion of
properties available by detailed property type in the 3 main sub areas as follows

175
Table 3.36: the home ownership sector in Telford and Wrekin by property type, average number of properties advertised for the 3 months March to May 2013 (numbers rounded to 5)
Sub-area Year Bungalow
Detached house
Semi-detached house
Terraced house Flat
Total no.
Total %
Telford Total no. 90 425 290 245 95 1,145 -
Total % 8% 37% 25% 21% 8% - 100%
Newport Total no. 10 60 45 15 20 150 -
Total % 7% 40% 30% 10% 13% - 100%
Rural Total no. 25 95 25 5 5 155 -
Total % 16% 61% 16% 3% 3% - 100%
(Source: rightmove.co.uk)
Key findings:
• The Telford sub area dominates supply, providing almost 80% of housing for sale. There is some variation in profile by property type between sub areas especially a much higher proportion of detached houses and lower proportion of flats in the Rural sub area.
3.68 The following maps identify the spectrum of average sales prices in Telford
and Wrekin and adjacent local authority areas and enable lower and higher prices hot spots to be identified. The maps are constructed around price thresholds and shade colours are applied according to the averages between them; the white fringe areas are a product of the software. The maps have been created using the inverse distance weighting method of interpolation in MapInfo thematic mapping options. This method is used for data values that produce arbitrary values over the grid and is especially suited to sparse data.
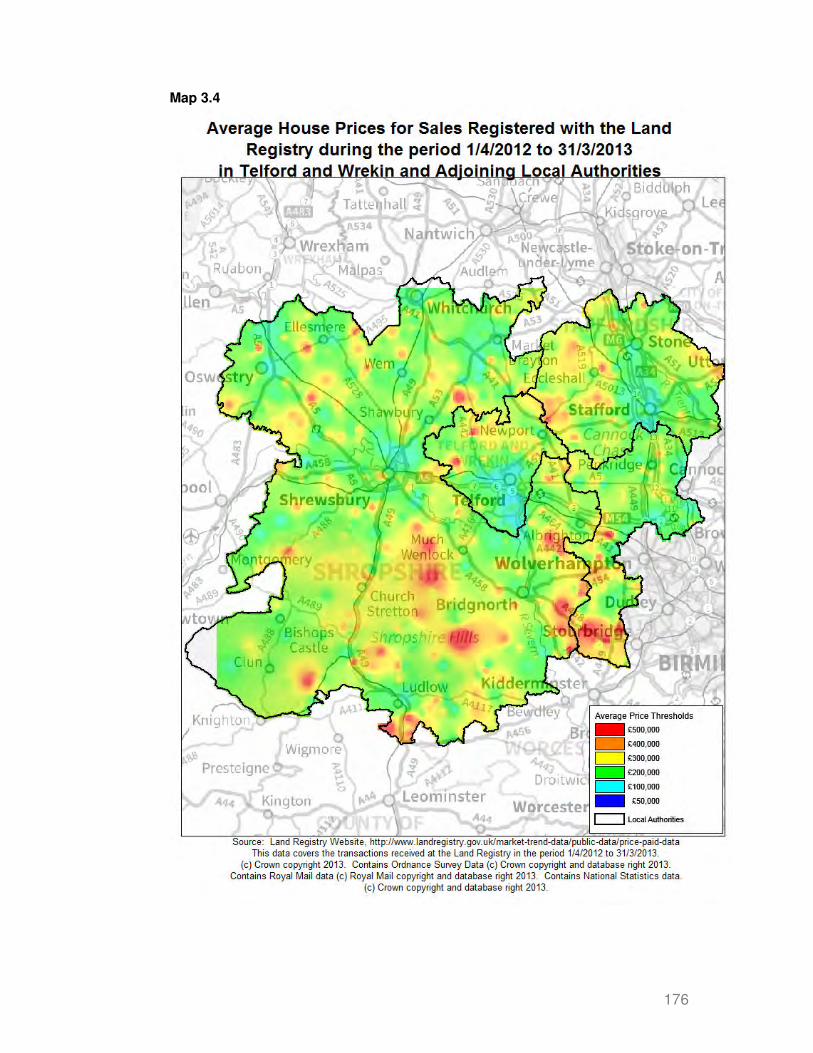
176
Map 3.4

177
Map 3.5

178
Key findings
• The average number of transactions per year over the 5 year period from 1/1/2007 to 31/12/2011 was 1,892. The highest number of sales was in the first year 2007 when there were 3,279. The lowest number of sales was in 2009 at 1,444. The sales then increased again and there were 1,586 sales in the most recent year 2011.
• As a proportion of the total stock of 42,417 owner occupied homes an average of 1,892 sales is equivalent to a turnover rate of 4.5% in Telford and Wrekin during the five year period from 2007 to 2011. The turnover rate was 3.7% for the most recent calendar year 2011.
• The average price at £155,418.57 for the five year period has fallen by 2.0% between 2007 and 2011.
• Sales of detached properties during the period 1/1/2011 to 31/1/2012 made up just over one third (33.5%) of sales compared with a 2011 stock of 30.5% of detached homes.
• Sales of semi-detached properties during the period 1/1/2011 to 31/1/2012 made up almost one third (32.4%) of sales compared with a 2011 stock of 36.4% of semi-detached homes.
• Sales of terraced properties during the period 1/1/2011 to 31/1/2012 made up more than one quarter (27.2%) of sales compared with a 2011 stock of more than one fifth (22.6%) of terraced homes.
• Sales of flats during the period 1/1/2011 to 31/1/2012 made up 6.9% of sales which was lower than the 2011 stock of 10.1% of flats.
• The map shows that two patterns are evident:
• Telford and Newport have generally lower property prices; and
• the house price hotspots are in more rural locations to the north, south and west.
The intermediate housing sector
3.69 The intermediate housing sector consists of market housing provided at a
discount to enable access to home ownership or market housing. Schemes have been mainly variants of shared ownership or have provided sub-market rental such as Intermediate Rental. Detail of current schemes to help home owners is available at:
https://www.gov.uk/affordable-home-ownership-schemes/overview

179
3.70 The 2011 Census recorded only 292 shared ownership properties, a negligible 0.4% of all stock, and which represents a decrease from the 427 properties recorded in 2001. If a 5% turnover rate is applied, which is close to the full cost sector, this implies a supply of no more than 15 properties per annum.
The social rented sector
3.71 This section uses recent and current data provided by the choice based
lettings scheme, Choose Your Home, to provide a profile of the supply of social rented homes.
Stock by bedsize 3.72 The following table identifies the total stock of social rented properties at June
2013. Table 3.37: total social rented properties by bed size in Telford and Wrekin, June 2013 Type & Bedsize Number Proportion Bedsit Sub-total 14 0.2% 1 bed
Flat -
Bungalow -
House - Sub-total 1,170 12.8%
2 bed
Flat -
Bungalow -
House - Sub-total 3,489 38.3%
3 bed
Flat -
Bungalow -
House - Sub-total 4,012 44.0% 4 bed
Bungalow -
House - Sub-total 394 4.3%
5/6/8 bed
House -
Sub-total 35 0.4%
Total no. 9,114 100% (Source: HCA SDR)
Key findings:
• The table identifies that of 9,114 properties:

180
o 13% were 1 bed or less; o 38% were 2 bed; o 44% were 3 bed, and o 5% were 4+ bed.
Supply by priority band 3.73 The following table reviews supply in terms of the number of lettings since
April 2008. Table 3.38: lettings by priority band, April 2008-March 2013
Telford and Wrekin Band No. % Urgent 3,090 51.8 Needing 2,593 43.5 Wanting 283 4.7
Total 5,966 100% Annual average 1,193 - (Source: Choose Your Home, Wrekin Housing Trust)
Key findings:
• There were almost 6,000 lettings over a 5 year period equivalent to almost 1,200 per annum. Over half (3,090) were classified as ‘Urgent’ of which an average of 33% were transfers, and 44% (2,593) as ‘Needing’ housing of which an average of 13% were transfers.
• On an annualised basis, the number of new Urgent Band lettings is in the region of 420 per annum and of new Needing Band lettings is in the region of 450 per annum, an overall total of 870 per annum.
Supply by property type and bedsize 3.74 The following table identifies the number of social rented properties advertised
by type and bed size between April 2008 and March 2013.

181
Table 3.39: number of social rented properties advertised by type and bed size in Telford and Wrekin, April 2008 - March 2013 Type & Bedsize Supply Proportion 1 bed
Flat 1,036 -
Bungalow 210 -
House 43 - Sub-total 1,289 25.8%
2 bed
Flat 1,201 -
Bungalow 338 -
House 775 - Sub-total 2,314 46.4%
3 bed
Flat 73 -
Bungalow 4 -
House 1,120 - Sub-total 1,197 24.0%
4 bed
Bungalow 1 -
House 171 - Sub-total 172 3.45% 5/6/8 bed
House 18 -
Sub-total 18 0.36% Total no. 4,990 81.6%
1 bed Supported 943 15.4
2 bed Supported 168 2.8
3 bed Supported 16 0.3 Total no. 1,127 18.4% Overall total 6,117 100% (Source: Choose Your Home, Wrekin Housing Trust)
Key findings:
• The table identifies that of 6,117 properties advertised:
o 82% were general needs; and o 18% were supported housing.
• Of 4,990 general needs properties advertised: o 21% were 1 bed or less; o 38% were 2 bed; o 20% were 3 bed, and o 3% were 4+ bed.
• Of 1,127 supported properties advertised:

182
o 15% were 1 bed or less; o 3% were 2 bed; and o less than 1% were 3 bed
• The average number of general needs properties advertised over 48 months was equivalent to 1,248 annually and 282 supported properties equivalent to 17% of stock.
Right to Buy 3.75 Introduced in 1980, the Right to Buy resulted in a contraction in the stock of
local authority social rented housing, especially of houses. The scheme was extended to housing association tenants under the Right to Acquire in 1997. However, limitations on eligibility and reductions in purchase discounts introduced in 2005 have reduced the number of sales dramatically. CORE sales data records 5 Right to Buy, 30 Preserved Right to Buy and 17 Right to Acquire sales in Telford and Wrekin between 2008 and 2012. However, the introduction of larger discounts on 2nd April 2012 may well have the effect of stimulating sales.
Rent levels 3.76 The following table identifies the average rents charged for social rented
properties in 2011-12. Table 3.40: average social rents for general needs properties by bed size in Telford and Wrekin, 2011-12 Bedsize Telford and Wrekin Bedsit £51.50
1 bed £63.94 2 bed £73.31
3 bed £82.03 4 bed £93.21 5 bed £96.85
6 bed £135.58 (Source: HCA SDR)
Key findings:
• Average rents for general needs properties in 2011-12 ranged from £51.50 for a bedsit to £135.58 for a 6 bed property.
Lettings by age
3.77 The following table profiles social housing lettings by the age of the lead
household member.
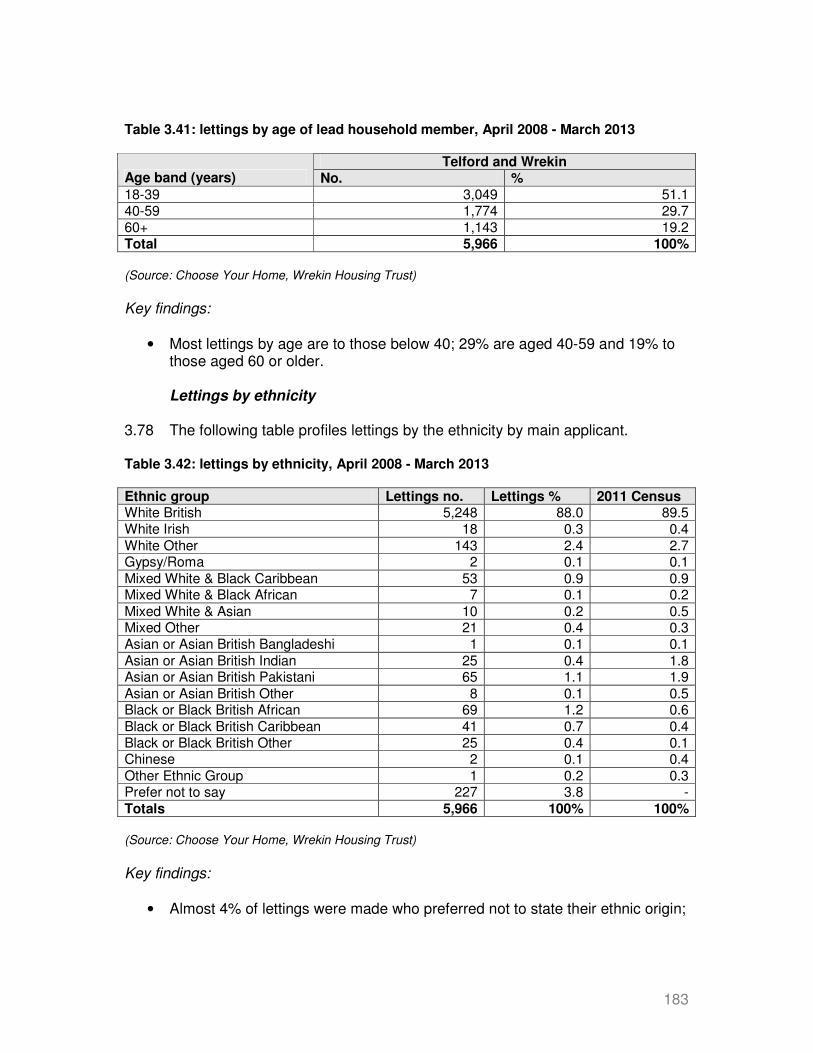
183
Table 3.41: lettings by age of lead household member, April 2008 - March 2013
Telford and Wrekin Age band (years) No. % 18-39 3,049 51.1 40-59 1,774 29.7 60+ 1,143 19.2 Total 5,966 100% (Source: Choose Your Home, Wrekin Housing Trust)
Key findings:
• Most lettings by age are to those below 40; 29% are aged 40-59 and 19% to those aged 60 or older.
Lettings by ethnicity
3.78 The following table profiles lettings by the ethnicity by main applicant. Table 3.42: lettings by ethnicity, April 2008 - March 2013 Ethnic group Lettings no. Lettings % 2011 Census White British 5,248 88.0 89.5 White Irish 18 0.3 0.4
White Other 143 2.4 2.7 Gypsy/Roma 2 0.1 0.1
Mixed White & Black Caribbean 53 0.9 0.9 Mixed White & Black African 7 0.1 0.2
Mixed White & Asian 10 0.2 0.5 Mixed Other 21 0.4 0.3 Asian or Asian British Bangladeshi 1 0.1 0.1
Asian or Asian British Indian 25 0.4 1.8 Asian or Asian British Pakistani 65 1.1 1.9
Asian or Asian British Other 8 0.1 0.5 Black or Black British African 69 1.2 0.6
Black or Black British Caribbean 41 0.7 0.4 Black or Black British Other 25 0.4 0.1 Chinese 2 0.1 0.4
Other Ethnic Group 1 0.2 0.3 Prefer not to say 227 3.8 -
Totals 5,966 100% 100% (Source: Choose Your Home, Wrekin Housing Trust)
Key findings:
• Almost 4% of lettings were made who preferred not to state their ethnic origin;

184
• 91% of lettings were to people from White ethnic groups which compares with a White population of 93% in 2011;
• Just under 2% of lettings were to people of Asian heritage which compares with a population of 3.7% in 2011;
• Just over 2% of lettings were to people of Black or Black British heritage which compares with a population of 1.1% in 2011; and
• Just over 1% of lettings were to people of mixed heritage which compares with a population of 1.9% in 2011.
Housing supply from all tenures
3.79 The following table summarises the current annual supply of housing through
turnover by sector as follows. Table 3.43: the current annual supply of housing through turnover in Telford and Wrekin, June 2013
Indicator Owner occupied
Private rent/rent free Social rent
Shared ownership Total
Total stock 42,417 10,793 13,106 292 66,608
% of stock 64.9% 15.5% 19.7% 0.% 100% Turnover: annual supply as % of stock by tenure 3.7% 36.0% 11.4% 4.0% 10.4%
Annual supply 1,546 3,886 1,494 12 6,938 % of all supply of housing 22.3% 56.0% 21.5% 0.2% 100% (Source: 2011 Census and Housing Vision estimates)
Key findings:
• The private rented sector is estimated to play the main role in the supply of housing, currently providing over half (56%) of available properties, although it constitutes only 16% of all housing stock;
• The home ownership sector provides 22% of housing supply although it represents 65% of total stock.
• The social sector provides 22% of available homes although it represents almost 20% of total stock; and
• The intermediate sector has a very marginal role providing 0.2% of available supply and 0.4% of total stock.

185
The views of estate and lettings agents Introduction 3.80 Consultation with property agents provides a ‘reality check’ against data-
based analysis. In the second and third week of May 2013, 12 interviews were undertaken with estate agents in Telford and Wrekin, including 4 in relation to the Telford sub area, 4 in Newport and 4 in relation to the Rural Area. All dealt in all residential property types and with both sales and rental. These interviews are intended to provide a practitioner perspective to understanding supply and demand. Views may be offered which contain factual inaccuracies, but as key actors in the housing market, it is essential to understand their perspective. The analysis presented below deals with all areas but identifies differences between locations.
How is the market performing? How has this changed recently?
3.81 9 agents were reasonably positive about the sales market. In Ironbridge, it
was described as “good” and “stronger than it has been”; whilst in Oakengates, it was “getting busier”. In Newport, the sales market was “good” or “strong”. 2 of the Telford agents were less positive, with one describing it as “tough” although the 3rd thought it was “getting stronger”. There are a number of new build sites in Telford being marketed directly by developers and it was clear from the interviews that agents in Telford thought that the government-assisted NewBuy scheme, which is limited to new build homes, was having a detrimental affect on the overall housing market there.
3.82 The general view was that the market had stabilised over the past 2-3 years; it
was still price sensitive with little change in prices; there was little expectation that it would change substantially. Ironbridge and Oakengates agents thought there was a greater demand from buyers but only one in each area reported more properties for sale. All Newport agents thought demand had increased and 3 of the 4 reported more properties for sale; the 4th had fewer. Telford was again the outlier, with 2 agents reporting fewer properties for sale and one of these citing a lesser demand and the other static demand. The 3rd Telford agent had more properties and a greater demand.
3.83 The rental market is performing well everywhere and has not changed
substantially during the past 2-3 years, although 1 Oakengates agent and 1 in Newport were short of stock. Rents were generally static.
3.84 Only one agent – in Telford – had found the housing benefit changes had any
impact; this had resulted in larger properties remaining empty.
What’s the typical cost of 1 bed flat, 2 bed flat, 2 bed house and 3 bed house to purchase and rent? Is this typical for the rural areas?
3.85 The table below covers the range of prices and rentals given by sub area.
Agents could not give definitive answers on whether theses prices were typical for the Rural area, as one pointed out, for some people, living in a

186
village was inconvenient for transport and services, whereas others sought this kind of lifestyle. However, the two Ironbridge agents did identify a price premium for rural property. Only one agent - in Newport - dealt with rooms in shared houses, quoting a rent of £75 per week
Table 3.44: the typical cost of properties to purchase and rent, the views of estate and lettings agents
Property Telford Sub Area
(Town) £
Telford Sub Area (Oakengates) £
Newport Sub Area £
Rural Sub Area (Ironbridge) £
Sales 1b flat 50-80k 50-70k 60-100k 125-150k
2b flat 80-120k - 90-110k - 2b house 90-110k 100-120k 100-130k 100-115k
3b house 90-160k 110-140k 135-200k 125-185k 4b house 160-350k 165-250k 180-250k 165-350k
Rentals pcm 1b flat 350-400 400-450 350-450 300-425 2b house 475-525 500-550 400-595 350-550
3b house 550-650 550-650 575-700 450-650 4b house 700-900 700-800 700-1000 500-1200
What options are available for first time buyers? What rental options are available?
3.86 Agents thought times were still difficult for first time buyers, although there
was some evidence that things were a bit easier on the mortgage front. However, in the second hand market, they were competing against investors. All Telford agents mentioned the NewBuy scheme as the primary option for first time buyers, perhaps unsurprisingly as there are a number of new build sites in Telford being actively marketed by developers under this scheme.
3.87 If potential first-time buyers could not afford to buy, most agents thought there
were good rental options available, although one agent in each of Telford, Newport and Ironbridge mentioned a shortage of property.
What are the gaps in the market - for sale or rent?
3.88 Gaps in the sales market were identified as three bedroom houses by two
Telford agents and 2 Newport agents; of the others, one Telford agent wanted more family homes, one Newport agent was short of stock generally, with the other identifying a shortage of bungalows. In Oakengates, one agent was short of stock and the other needed more homes under £100k. Village properties were cited by one Ironbridge agent with the other wanting homes between £150 and 250K.
3.89 In Telford, one agent needed more clients coming forward with properties for
the rental market, whilst the others wanted more 3 bedroom homes, with one adding 2 bedroom as well. In Newport, one agent one agent wanted more 3 bedroom homes, another more 2 bedroom houses and a third bungalows.

187
The other agent thought there was a general shortage of rental property. One agent in Oakenbridge and one in Ironbridge were short of all types of property to rent; the other Oakenbridge agent did not indicate any gaps in the market whilst the 2nd Ironbridge agent needed more property in the £500-600 pcm range.
Is there oversupply anywhere in the market - for sale or rent?
3.90 All the Telford agents identified a current or recent oversupply of 4 bedroom
homes in the sales market - which is interesting in the context of the finding that 21% of homes completed between 2007 and 2010 were of this size. 3 Newport agents had no oversupply; the 4th identified “overpriced property”. One Oakengates agent had too many 4 bedroom homes, whilst the other had no oversupply, which tallied with one of the Ironbridge agents. The other indicated there was too much stock in the Dawley area, where there was a lot of reselling. No one considered there was any oversupply in the rental market.
3.91 6 agents offered further comments.
“It's a world heritage site and interest is good but, on the other hand, there is subsidence from former coalmining, the river is subject to erosion and much of the area is on a flood plain .” (Ironbridge agent) “How the second hand market develops over the next 12 months will be interesting.” (Ironbridge agent) “We’re still surviving!” (Oakengates agent) “It’s buoyant at present, but we need more houses” (Newport agent) “I feel confident and positive” (Telford agent) “The government needs to help the resale market, not just new build. If re-sales start moving, it will have an effect throughout” (Telford agent)

188
4. The Need and Demand for Housing
Executive summary
What is the current pattern of need and demand for social rented housing?
4.1 ‘Choose Your Home’ choice-based lettings data enables patterns and trends
in the need for housing to be identified. At September 2013, there were 15,748 registered applicants and 12,567 excluding transfer applicants. 5% of the total were in the Urgent and 77% in the ‘Needing’ priority bands. Excluding transfer applicants, 10,594 were in the Urgent and Needing priority bands.
4.2 Demand was strongest for 3 bed properties (an average of 174 ‘choices’ for
each property advertised) and 168 for each 4 bed property advertised. Strong demand for 2 bed houses and bungalows was masked by much lower demand for other 2 bed properties (i.e. flats). The lowest demand was for 1 bed (58 choices) and supported housing (18 choices).
4.3 From a peak of 513 households in 2002-03, homeless acceptances have
fallen steadily to 137 in 2011-12 but have shown a recent increase. 4.4 Data on registered applicants identified that 61% were aged under 39 and
88% were White which compares with a White population of 93% in 2011.
What is the current pattern of need and demand for intermediate housing?
4.5 Based on limited sales data from 2008 to 2012, and almost certainly reflecting
the type of stock available, the intermediate sector was most successful in housing single people and couples. Very few lone parents or older people were housed in this sector. These trends are most likely a result of the product being developed in this sector, and also the marketing strategies employed to attract buyers.
4.6 Three quarters of purchasers earned £10-21,999 - which is below median
gross incomes from full-time work of £23,660. 4.7 This limited information available suggests that the intermediate housing
sector is more successful in housing people who were previously social or private renters - which is in contrast with may other areas - and consultation with estate agents suggests there is a demand for it.
What is the pattern of affordability? 4.8 Applying an affordability threshold of 25% of gross incomes, equivalent to
34% of net household income, and before any housing support is taken into account, most housing - other than larger houses - is affordable for those on average incomes. However, those on lower quartile incomes are very much

189
excluded from market options and, without housing support, only one bed social rented flats are affordable.
The impact of housing and welfare reforms
4.9 Whilst the precise impact is still to be assessed, the government’s housing
and welfare reforms are affecting access to housing in the affordable and private rented sectors, limiting choice and households to housing by bedroom requirement. Those most affected are of working age, especially young single people under 35, and in receipt of Council Tax or Housing Benefit. Some indication of the potential impact of the reforms can be gauged from the number of people claiming Housing Benefit. There are currently almost 16,000 claimants, almost 10,000 in the social sector and the remainder in the private rented sector; and over 14,000 claimants for Council Tax Benefit, almost one quarter of all households.
Introduction 4.10 This chapter reviews evidence of the need and demand for housing with the
emphasis on affordable housing. The primary data sources used in this section are:
• The local choice-based lettings scheme, Wrekin Housing Trust’s ‘Choose Your Home’ in relation to social housing applications, advertisements and lettings. Whilst it is recognised that ‘Choose Your Home’ data may underestimate the underlying level of housing need, it provides the only source of comprehensive and consistent data.
• Core in relation to intermediate housing sales. The need and demand for affordable housing 4.11 Most affordable housing providers in the district participate in ‘Choose Your
Home’ and the following Priority Bands are applied as follows: Urgent For those urgently needing to move whose current home is so unsuitable that they cannot continue to live there. Needing For those whose current home is not ideal, but don’t need to move immediately. Wanting For those who do not need to move, but want to. Further details of the scheme can be found at:

190
http://www.chooseyourhome.org.uk/Default.aspx The need for affordable housing 4.12 It is normal practice, and now a government requirement for eligibility for
Housing Benefit, to ‘fully occupy’ properties, i.e. to allocate properties by bedsize according to applicants’ household size and composition with no spare bedroom available. In general, this will mean that a 1 bed property will be allocated to a single person or a couple; a two bedroom property to a lone parent/couple and 1 or 2 children dependent on age and sex; a three bedroom property to a lone parent/couple and 2 or 3 children dependent on age and sex and a four bedroom property to a lone parent/couple and 3-5 children dependent on age and sex.
4.13 At 19th March 2013, there were 15,748 applicants registered in Telford and
Wrekin as follows Table 4.1: applicants for social housing by Priority Band, September 2013
Including transfer applicants Excluding transfer applicants
Band No. % No. %
Urgent 796 5.1 373 3.0
Needing 12,122 77.0 10,221 81.3
Wanting 2,830 17.9 1,973 15.7
Total 15,748 100% 12,567 100% (Source: Choose Your Home, Wrekin Housing Trust data)
Key findings:
• There were 3,181 transfer applicants at September 2013 and 12,567 new applicants for housing. Of the latter, 10,594 were in the priority Urgent and Needing Housing Bands 84% of the total, and almost one in 6 of households in Telford and Wrekin.
Homelessness and rough sleeping 4.14 The following table identifies the pattern of households accepted as homeless
and in Priority Need between 2002-03 and 2011-12. Table 4.2: homeless accepted and in Priority Need, 2002-2012 2002- 03
2003- 04
2004- 05
2005- 06
2006- 07
2007- 08
2008- 09
2009- 10
2010- 11
2011- 12
513 512 466 335 275 220 174 159 108 137 (Source: HSSA Returns, Table 784 and Table 627 Local Authorities Actions under Homeless
Provisions of the Housing Acts CLG website http://www.communities.gov.uk/corporate/. Contains

191
public sector information licensed under the Open Government Licence v1.0 http://www.nationalarchives.gov.uk/doc/open-government-licence/.)
Key findings:
• From a peak of 513 households in 2002-03, acceptances have fallen steadily to 2010-11 but have shown an increase from 108 in 2010-11 to 137 in 2010-11 which is likely to be associated with economic recession and associated increases in repossessions and redundancy, etc.
4.15 The most recent rough sleeping count undertaken in autumn 2012 identified
11 rough sleepers in Telford and Wrekin, an increase from 8 in autumn 2011 and 2 in autumn 2010.
The demand for affordable housing by property type and bedsize
4.16 This section considers the extent of demand for different types of housing by
bedsize. It is important to emphasise that an applicant can bid for multiple properties and certain conditions may be placed on certain properties, for example, a local connection. The following table identifies the number of bids by property type and bed size for each letting advertised and, in order to increase the averaging effect and reduce the impact of multiple bidding and application of certain conditions, all lettings undertaken between April 2008 and March 2013 have been considered.
Table 4.3: ratio of choices to social rented properties advertised by type and bed size, April 2008-March 2013
Type & bedsize Properties advertised Choices Ratio
1 bed
Flat 1,036 57,030 55
Bungalow 210 13,848 66
House 43 4,197 98
Sub-total/average 1,289 75,075 58
2 bed
Flat 1,201 79,527 66
Bungalow 338 58,943 174
House 775 153,910 199
Sub-total/average 2,314 292,380 126
3 bed
Flat 73 3,107 43
Bungalow 4 721 180
House 1,120 203,795 182
Sub-total/average 1,197 207,623 174
4 bed
Bungalow 1 133 133
House 171 28,804 168
Sub-total/average 172 28,937 168
5/6/8 bed

192
House 18 2,692 93
Sub-total/average 18 2,692 93
Total no. 4,990 606,707 122
1 bed Supported 943 10,932 12
2 bed Supported 168 8,544 51
3 bed Supported 16 400 25
Total no./average 1,127 19,876 18 (Source: Choose Your Home, Wrekin Housing Trust data)
Key findings:
• Assessed by the ratio of choices to vacancies, demand is strongest for 2, 3 and 4 bed general needs properties - especially houses and bungalows - and lowest for 1 bed properties and supported housing for houses then flats and for 2 bed then 3 bed properties.
• In terms of the number of choices by bedsize, 12% were for 1 bed properties; 48% for 2 bed; 34% for 3 bed and 5% for 4 bed or larger properties. Demand by age
4.17 The following table profiles social housing registrations by the age of the lead
household member. Table 4.4: registrations by age of lead household member, April 19th 2013
Telford and Wrekin Age band (years) No. % 17 and under 3 0.1 18-39 8,973 60.8 40-59 3,989 27.0 60+ 1,793 12.1 Total 14,758 100% (Source: Choose Your Home, Wrekin Housing Trust data)
Key findings:
• Registrations by age are almost dominated by younger households aged 18-39 (61%); 27% are aged 40-59 and 12% are aged 60 or over.
Demand by ethnicity
4.18 The following table profiles registrations by the ethnicity by main applicant.

193
Table 4.5: registrations by ethnicity of lead household member, April 19th 2013
Telford and Wrekin Ethnic group No. % White British 12,377 83.9 White Irish 53 0.4 White Other 581 3.9 Mixed White & Black Caribbean 183 1.2 Mixed White & Black African 27 0.2 Mixed White & Asian 40 0.3 Mixed Other 51 0.3
Asian or Asian British Bangladeshi
9 0.1 Asian or Asian British Other 38 0.3 Asian or Asian British Indian 55 0.4 Asian or Asian British Pakistani 104 0.7 Black or Black British Caribbean 141 1.0 Black or Black British African 176 1.2 Black or Black British Other 50 0.3 Chinese 12 0.1 Other Ethnic Group 8 0.2 Gypsy/Roma 847 5.7 Prefer not to say 2 0.1 Traveller of Irish heritage 4 0.1 Totals 14,758 100% (Source: Choose Your Home, Wrekin Housing Trust data)
Key findings:
• Data is not available for just under 6% of applicants;
• Almost 88% of applicants were from White ethnic groups compared with 91% of lettings and a wider population of 93%;
• Just under 2% of applicants and lettings were to people of Asian heritage;
• Just over 2% of applications lettings were to people of Black or Black British heritage; and
• 2% of applicants are people of mixed heritage compared with just over 1% of lettings.
The need and demand for specialised housing 4.19 The following table summarises the number of choices available to those
requiring specialised housing.

194
Table 4.6: number of choices in 2012 Type of accommodation Average number of choices Extra care 10
Supported 19 Wheelchair accessible 28 4 or more bedrooms 104 (Source: Choose Your Home, Wrekin Housing Trust data)
Key findings:
• The strength of demand for 4 bed or larger homes is clear from this table, with a ratio of 104 choices to each vacancy. However, the 2012 ‘snapshot’ figure of 104 bids is much lower than the average choices per dwelling for the whole 2008-12 period, which is 166. Either demand is being satisfied or the low level of supply is resulting in people stopping bidding.
Who is being housed in the intermediate housing sector?
4.20 This section considers who is being housed in the intermediate housing sector
in the area. Data is available for sales of typically of shared ownership or HomeBuy properties for 2008-12. The first dimension considered is the type of households being housed then their net weekly incomes.
Table 4.7: sales by type of household, April-March 2008-12 Household type Numbers Single adult 11 Multi-adult no children (typically couples) 11 Multi-adult + children (families) 5 Lone parents 1 Older people (not included above) 2 Total 30 (Source: Core)
Key findings:
• The data available is limited but identifies that shared ownership housing is working more effectively for (typically younger) single adults and couples. This almost certainly reflects the type of housing provided.
• Despite the potential for ‘downsizing’ and the existence of a designated scheme, only 2 older people were housed in this way.

195
Incomes of purchasers 4.21 Incomes data is recorded for single income purchasers (Person 1) or joint
purchasers (Person 1 and Person 2) as appropriate. The following table reviews average gross annual income by type of households, and includes joint income purchasers. This may be all or partly from benefits/pensions but not including child benefit, housing benefit, council tax benefit or interest from savings. The incomes distribution is compared with median gross annual incomes from full-time employment recorded for residents in 2012 by the Annual Survey of Hours and Employment.
Table 4.8: sales by average gross annual income of Person 1 and 2 combined, April-March 2008-12, and median gross annual incomes from full-time employment of residents, 2012 Income band Numbers Under £7.5k 2 £7.5-9,999 2 £10-13,999 5 £14-17,999 8 £18-21,999 6 £22-29,999 2 £30-39,999 0 £40k+ 0 Total 25 Median full-time gross earnings 2012 £23,660 (Source: Core and ASHE 2012)
Key findings:
• 76% of purchasers earned £10-21,999 which is below median gross annual incomes of residents in full-time work of £23,660.
4.22 The following table reviews sales by previous tenure, data is provided for
Person 1 only. Table 4.9: sales by previous tenure of Person 1, April-March 2008-12 Previous tenure Numbers Social rented 10 Private rented 13
Tied home/renting with job 0 Owning/buying 1
Family/friends 8 Temporary 0 Other 1
Total 32 (Source: Core)

196
Key findings:
• 41% of purchasers were previously renting privately and 25% living with family or friends. It can be assumed that such households were renting whilst saving money for their first purchase; and
• Almost one third were social renters which indicates that shared ownership is providing a route to home ownership.
The demand for market housing: the views of estate and lettings agents
Introduction 4.23 Consultation with property agents provides the opportunity to gain insights
into the demand for market housing. Where does most demand come from?
4.24 All but the Ironbridge agents identified a primarily local demand for housing
from a cross section of households; Ironbridge saw more incomers, mostly from the West Midlands and especially for the more expensive properties. 2 Telford agents identified a more diverse demand for rental properties, both from corporate lets and from Eastern European households.
What’s selling well/not so well? 4.25 In Telford, property at the cheaper end of the market up to £150k was cited by
two agents; the other indicated that country properties will sell. Modern 4 bedroom homes were difficult to sell as there were a lot of them. 2 agents pointed out that, in Telford, they were competing against developers selling new build with the help of the government’s NewBuy scheme. In addition to other incentives, developers were also offering part exchange and quick completions.
4.26 In Newport, one agent indicated that 3 and 4 bedroom homes – family
property – were selling well because of the reputation of Newport schools; two others cited 3 bedroom homes and/or properties up to £250k, which covers the same categories. Three agents found the higher end of the market – above the £250k stamp duty level – more difficult to sell; the fourth indicated their problem lay with overpriced 2 bedroom flats.
4.27 In Oakengates, the lower end of the market was selling well – one agent
indicated properties under £100k, which in better times would have gone to 1st time buyers, were now attracting investors. Both agents found 4 bedroom properties more difficult to sell, with one adding 3 bedroom homes as well.

197
4.28 In Ironbridge, one agent indicated “character” properties were selling well whilst the other said it was very mixed. As to what was not selling well, one agent quoted 1st time buyer properties and the other flats.
What’s renting well/not so well? 4.29 In Telford, 2 agents gave views on the rented market; one said 2 bedroom
homes were renting particularly well, with nothing difficult to let. The other indicated all town centre properties were popular, but ex-council properties on estates with a poor reputation were difficult. The time taken to rent a property ranged from 4 days to up to 6 weeks and the average length of a tenancy ranged from 12 months to 2 years.
4.30 In Newport, 3 agents said all property was renting well, with one indicating
that poorly maintained 1 bedroom flats were more difficult to let and another extending this to all property in poor condition. The 4th agent said 3 bedroom homes were renting well, and one bedrooms not so well. The time taken to rent a property ranged from 2 days (rural homes) to up to 2 weeks and the average length of a tenancy ranged from 12 months to 2 years.
4.31 In Oakengates, one agent said 2 and 3 bedroom homes were renting well,
with nothing difficult to let; the other indicated 1 bedroom properties were renting well, with 4 bedroom homes “a bit slower”. The time taken to rent a property ranged from 2 weeks to 4 weeks and the average length of a tenancy ranged from 2 to 3 years.
4.32 In Ironbridge, one agent said all property was renting well, with rural homes
particularly popular. More difficult to let was property without off-street parking in a noisy area. The other agent indicated 3 bedroom semis were renting well, with nothing renting badly. The time taken to rent a property ranged from 2 weeks to 4 weeks and the average length of a tenancy was 12 months upwards.
What’s the demand like for new homes?
4.33 Agents identified a good demand for new homes but could offer little personal
experience as developers are marketing these themselves. The NewBuy scheme is causing some resentment as it does nothing to stimulate the second hand market. Agents thought most purchasers were local – either investors or 1st time buyers – but found it difficult to be certain or to estimate the proportion of the asking price achieved.
4.34 Incentives offered, in addition to the government scheme, included carpets
and appliances, legal fees, part-exchange and quick completions.
Is there a market for shared ownership/equity in the area? 4.35 Telford, Oakengates and Ironbridge agents considered there was definitely a
market; 2 Newport agents thought there was not and one was unsure. Local people – couples, separated people and singles seeking to get a foot on the

198
housing ladder were seen as most likely to go for shared ownership/shared equity.
4.36 Most agents thought shared ownership/shared equity represented value for
money – 2 of the Newport agents did not (“rents are too high”) - but some of those who thought it was value for money had caveats, for example that it was difficult to sell second hand or that it was second best to just having a mortgage to pay.
What’s the extent of interest from investors and second home owners?
4.37 Only in Ironbridge and Newport was there any evidence of interest from
second home owners, comprising up to 5% of sales in Ironbridge. The one Newport agent who reported such interest estimated it might comprise 15% of sales; however, no other Newport agent reported interest from second home owners, nor did agents in Telford and Oakengates.
4.38 All agents reported an active investor market with purchasers buying cheaper
property which would formerly have gone to first-time buyers or doing deals with developers on new build estates. The Telford agents reported investor purchases accounted for between 10% and 75% of all sales; the Newport agents also estimated such purchases accounted for between 10% and 75% of sales; Oakengates’ estimate was between 20% and 30%; and Ironbridge’s 10%.
How do you expect the private rented sector to change over the next few years?
4.39 Of the agents who were prepared to speculate, 6 thought the private rented
sector would grow and 3 thought it would stabilise. Whilst most thought a demand for rented property would remain, they considered the sector’s future was heavily dependant on legislation and, specifically, how the expanded Help to Buy scheme would affect the sales market. It was possible that more people would consider renting as an attractive alternative to home ownership but this is not certain.
Determining the affordability of housing
4.40 There are three main approaches to determining the affordability of housing:
1. The residual income approach which calculates how much income is left over for housing after relevant living expenses have been taken into account for different household types. If there is insufficient income left for housing costs, a household has an affordability problem. This approach requires calculations to be made for a very wide variety of household types and income levels; it is more appropriate for middle to higher income groups and has not been applied here.
2. The second approach involves setting ‘affordability ratios’ of the
relationship between incomes and property prices, for example lower

199
quartile incomes from earnings as a ratio of lower quartile property prices or property prices as a multiple of average earning from employment. However, whilst such ratios are capable of identifying the relationship between incomes and prices, they are not capable of identifying affordability for households where deposit and interest rate levels are the key factors. Affordability ratios of incomes to house prices are set out in the following table applying CACI household incomes and Land Registry property price data.
Table 4.10: lower quartile sales prices for properties in Telford and Wrekin and Sub Areas, 1/1/2011 to 31/1/2012, compared with lower quartile gross household incomes Telford and
Wrekin Telford Sub Area
Newport Sub Area
Rural Sub Area
Lower Quartile prices
£105,000.00 £100,000.00 £140,000.00 £184,375.00
Lower quartile incomes
£13,577 £13,302 £14,482 £17,248
Price: income ratios
7.7:1 7.5:1 9.7:1 10.7:1
(Sources: Land Registry and CACI)
Key finding
• Telford is the most affordable area followed by Newport then the Rural sub area.
3. The third approach involves setting an affordability threshold or benchmark
which identifies the maximum proportion of a household’s gross or net income which should be spent on housing costs. This is a straightforward approach which is considered more appropriate for lower to middle income groups.
4.41 In both cases, particular mention should be made of the disadvantaged
position of families with children as their additional living expenses constrain what they can afford to spend on housing, including their ability to borrow to purchase market housing. An assessment of this can be obtained by consulting Equivalence Scales, see University of York, Social Policy Research Unit’s Minimum Income Standards output:
http://www.lboro.ac.uk/research/crsp/mis/reports/
4.42 In view of the complexity of developing a generic model capable of calculating residual incomes, an affordability threshold approach has been applied but there is no consensus over the affordability level to be adopted. For example:
• The National Housing Federation (NHF), the representative body for housing associations, had previously recommended rent levels were affordable when they were 25% or less of gross household income for new tenant households in work, equivalent to 34% of net income.

200
• The Homes and Communities Agency (HCA), the funding body for new affordable housing, recommended that 30 - 45% of net income is the acceptable range for housing costs. (Capital Funding Guide, HCA, 2011), please see: http://cfg.homesandcommunities.co.uk/
• The CLG whose assessment of affordability for intermediate housing is that a household should use a maximum of 25% of gross income to pay for their mortgage and rent (Strategic Housing Market Assessment Practice Guide, 2007), please see: http://www.communities.gov.uk/publications/planningandbuilding/strategichousingmarket
• The Mayor of London: the London Plan states that for products where a rent is paid, the annual housing costs, including rent and service charge, should be no greater than 40% of net household income (London Plan Annual Monitoring Report, February 2011), please see: http://www.london.gov.uk/priorities/planning/research-reports/annual-monitoring-reports
• Tenant referencing agencies provide affordability checks for private landlords. Based on historic levels of rent defaults the standard level of rent to gross income acceptable to private landlords is 40%.
• A major review of data sources undertaken in 2010 concluded that a household can be considered able to afford market renting where the rent payable is up to 25 per cent of their gross household income. The ‘rent payable’ figure is defined as the entire rent due, even if it is partially or entirely met by housing benefit. Other housing-related costs, such as council tax and utility bills should not be included (Measuring Housing Affordability: A Review of Data Sources, CCHPR, 2010), please see: http://www.communities.gov.uk/documents/507390/pdf/1098230.pdf
• Finally, ‘the 30/40 rule’ has been developed in Australia which takes 30% of gross income committed to housing costs as the benchmark and applies this either to all households or to the lower 40% of households by income.
4.43 Based on the above, and Housing Vision’s experience in housing market and
affordability assessment, a baseline affordability threshold has been applied that the percentage of household income that can sustainably be spent on housing costs should be no more than 25% of gross household income which is equivalent to 34% of net household income where net income is assumed to constitute 74% of gross.
4.44 The secondary incomes data available to enable affordability modelling is
extremely limited and consists of the following:
1. Data from the Annual Survey of Hours and Earnings (ASHE)

201
This data identifies the gross weekly pay of full-time workers at mean and median levels and for each 10th percentile of the income range by local authority area and is produced annually. ASHE is a limited source of incomes data as it only identifies income from employment and not from other sources such as pensions and benefits. As a result, ASHE data is not relevant to identifying the incomes of those applicants for affordable housing who are dependent on benefits. 2. Published data for social rentals from CORE This data identifies the net weekly income of tenants/purchasers or tenant/purchaser and partner, excluding child benefit, housing benefit, council tax benefit or interest from savings, for lettings/sales by bedsize and household type by local authority area, and is produced annually.
3. Published data for intermediate sales from CORE
This data identifies the net weekly income of tenants/purchasers or tenant/purchaser and partner, excluding child benefit, housing benefit, council tax benefit or interest from savings, for lettings/sales by bedsize and household type by local authority area, and is produced annually.
4. Data from CACI PayCheck Profiles This data source identifies gross household incomes from all sources across 21 income bands to £100k+ and the mean and median income band and is produced annually. The data needs to be commissioned commercially but is especially useful for bespoke sub-areas below local authority level.
4.45 The characteristics, possibilities and limitations of each secondary data
source are summarised in the following table.

202
Table 4.11: characteristics of secondary incomes data sources
Characteristics ASHE CORE rental CORE sales CACI PayCheck Application/limitation Only for those in paid
employment (by gender) Only for tenants and partners (if applicable)
Only for purchasers (persons 1 - and 2 if applicable)
For all households
Household type Individual earners only Single adult/multi-adult with/without children/ lone parent/older people
Single adult/multi-adult with/without children/ lone parent/older people
Yes
Geography Local authority Local authority Local authority Local authority/postcode sector/bespoke area
Sources of income Earned only All or partly from benefits/pensions for local authority and/or housing association tenants as appropriate *1
Earned and includes benefits, except housing and council tax, excludes income through investments
All
Gross/net Gross weekly Net weekly Gross annual Gross annual Incomes structure Mean, median and number
of workers for every 10th percentile
Mean Mean Mean, median, number and percentage of households for each of 21 income bands to £100k+
Full/part-time Full and part-time Not specified Not specified Not known Cost Free of charge Free of charge Free of charge Commercial rates Source (see below) NOMIS web-based CORE web-based CORE web-based By commission
Notes: *1 but not including child benefit, housing benefit, council tax benefit or interest from savings Relevant web links ASHE/NOMIS: Available through ‘Advanced Query’ at: https://www.nomisweb.co.uk/Default.asp CORE: Available through ‘Analyse CORE data/Interactive reports - Advanced analysis’ (see Appendix 1) at: https://core.tenantservicesauthority.org/AnalyseCOREdataMain.asp CACI: Further information available at: http://www.caci.co.uk/paycheck.aspx

203
4.46 The Telford and Wrekin ‘HMA and Housing Requirements’ Toolkit has been used to assess affordability using the following secondary data sources:
• gross household income levels determined by CACI PayCheck profiles;
• rents and sales prices by property type and bed size;
• for shared ownership/equity loan, the share purchased, deposit, interest rate and period, the rental element and service charge; and
• for home ownership, the deposit, loan interest rate and period. 4.47 The process applied is as follows.
1. The Toolkit applies a 25% gross/34% net affordability threshold to a profile of gross household incomes to identify the proportion of households that can afford the same entry level property for all tenures from social renting to new build home ownership, and including Affordable Rented properties.
2. The entry level property type applied is a 2 bed house which is suitable to meeting the typical requirements of new or additional households, the majority of which are small.
3. The cost of accessing this property for all tenures is compared against the maximum housing costs available to households using the affordability threshold. The output is a hierarchy of affordability from those who can only afford social rented housing to the additional percentages who can afford other options.
4. All tenures are included and Affordable Rent has been treated as a full cost market product though access to Housing Benefit may make it more accessible to lower income groups.
5. It is not possible to assess with any accuracy how many households on the incomes profile will be in receipt of sufficient Housing Benefit to be able to afford Affordable Rent but it does indicate the level of household income required to access an Affordable Rented product.
6. Private rent has been separately identified as it now constitutes a major element of housing supply, though in terms of new housing required, this is likely to be provided by the home ownership sector then transferred to the private rental sector.
4.48 The following charts are taken from the Toolkit and demonstrate the extent to
which housing options in Telford and Wrekin and each sub area are affordable to those in receipt of either average or lower quartile gross incomes applying an affordability threshold of 25% of gross or 34% of net household income. Only those properties below the maximum weekly affordable threshold shown (in pink) are affordable, no account has been taken of Housing Benefit support.

204
Figure 4.1: the affordability of housing in Telford and Wrekin for households in receipt of the average gross household income of £34,504
(Source: Telford and Wrekin Affordability and Housing Options Toolkit)

205
Figure 4.2: the affordability of housing in Telford and Wrekin for households in receipt of lower quartile gross household incomes of £13,572
(Source: Telford and Wrekin Affordability and Housing Options Toolkit)
206
Key findings:
• For those in receipt of average incomes without housing support, and applying a 25% gross/34% affordability threshold, the following properties are affordable:
• social rent: all flats and houses;
• Affordable Rent: all except 5 bed+ houses;
• market rent: all except 4 and 5 bed+ houses;
• shared ownership: all except 4 and 5 bed+ houses;
• re-sale home ownership: all except 3, 4 and 5 bed+ houses; and
• new-build home ownership: all except 3, 4 and 5 bed+ houses.
• For those in receipt of lower quartile incomes only 1 bed social rented flats properties are affordable without housing support.

207
Figure 4.3: the affordability of housing in Telford and Wrekin, Telford sub-area, for households in receipt of the average gross household income of £33,966
(Source: Telford and Wrekin Affordability and Housing Options Toolkit)

208
Figure 4.4: the affordability of housing in Telford and Wrekin, Telford sub-area, for households in receipt of lower quartile gross household incomes of £13,302
(Source: Telford and Wrekin Affordability and Housing Options Toolkit)

209
Key findings:
• For those in receipt of average incomes without housing support in the Telford sub area, the following properties are affordable:
• social rent: all flats and houses;
• Affordable Rent: all flats and houses;
• market rent: all except 4 bed houses;
• shared ownership: all except 4 bed houses;
• re-sale home ownership: all except 4 bed houses; and
• new-build home ownership: all except 3 bed flats and 3 and 4 houses.
• For those in receipt of lower quartile incomes only 1 bed social rented flats properties are affordable without housing support.

210
Figure 4.5: the affordability of housing in Telford and Wrekin, Newport sub-area, for households in receipt of the average gross household income of £36,563
(Source: Telford and Wrekin Affordability and Housing Options Toolkit)

211
Figure 4.6: the affordability of housing in Telford and Wrekin, Newport sub-area, for households in receipt of lower quartile gross household incomes of £14,482
(Source: Telford and Wrekin Affordability and Housing Options Toolkit)
212
Key findings:
• For those in receipt of average incomes without housing support in the Newport sub area, the following properties are affordable:
• social rent: all flats and houses;
• Affordable Rent: all flats and houses;
• market rent: all except 4 bed houses;
• shared ownership: all flats and houses;
• re-sale home ownership: all except 3 bed flats and 3 and 4 houses; and
• new-build home ownership: all except 3 bed flats and 3 and 4 houses.
• For those in receipt of lower quartile incomes only 1 bed social rented flats properties are affordable without housing support.
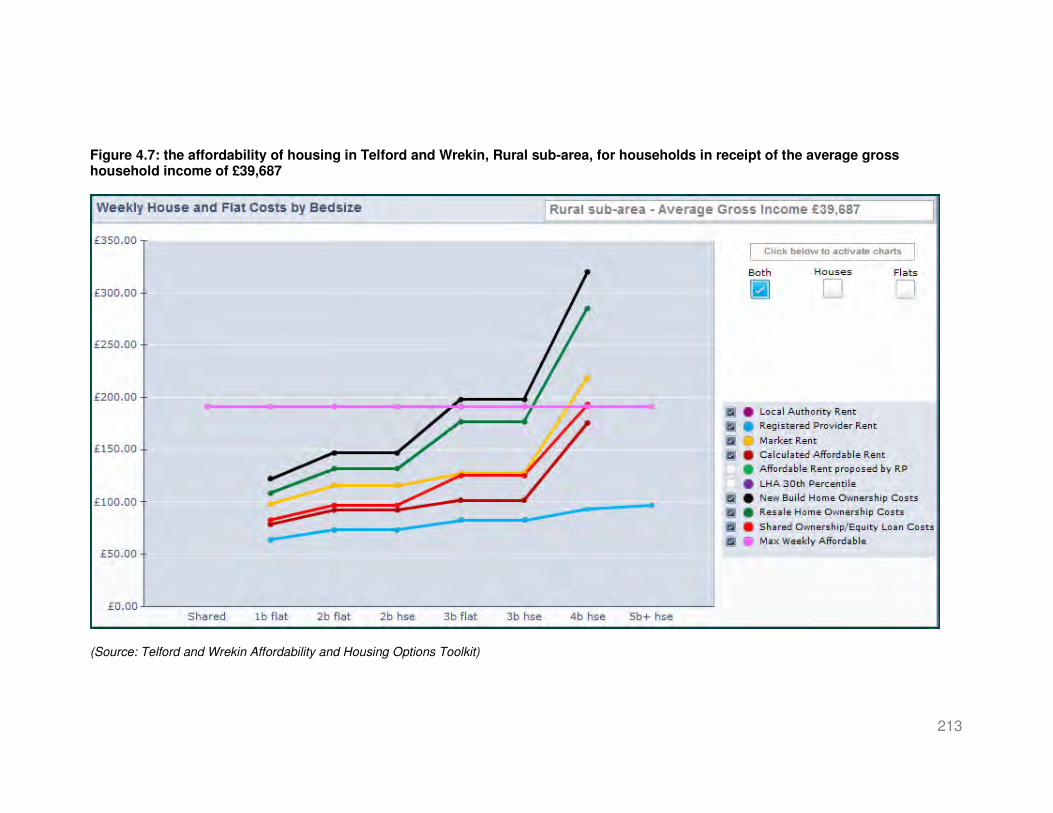
213
Figure 4.7: the affordability of housing in Telford and Wrekin, Rural sub-area, for households in receipt of the average gross household income of £39,687
(Source: Telford and Wrekin Affordability and Housing Options Toolkit)

214
Figure 4.8: the affordability of housing in Telford and Wrekin, Rural sub-area, for households in receipt of lower quartile gross household incomes of £17,248
(Source: Telford and Wrekin Affordability and Housing Options Toolkit)

215
Key findings:
• For those in receipt of average incomes without housing support in the Rural sub area, the following properties are affordable:
• social rent: all flats and houses;
• Affordable Rent: all flats and houses;
• market rent: all except 4 bed houses;
• shared ownership: all except 4 bed houses;
• re-sale home ownership: all except 4 bed houses; and
• new-build home ownership: all except 3 bed flats and 3 and 4 houses.
• For those in receipt of lower quartile incomes without housing support, the following properties are affordable:
• social rent: all except 4 and 5+ bed houses;
• Affordable Rent: 1 bed flats;
• market rent: none;
• shared ownership: 1 bed flats;
• re-sale home ownership: none; and
• new-build home ownership: none. The impact of housing and welfare reforms
4.49 The government’s housing and welfare reform will have a profound effect on
access to housing in the affordable and private rented sectors. Assessments have yet to be undertaken to assess their precise impact but their potential extent can be determined on the basis of the numbers of claimants in receipt of relevant benefits. The subsequent table summarises the main reforms of relevance and identifies the sector, the type of people affected and their likely impact.
4.50 At February 2013 DWP Statistics recorded that in relation to Housing Benefit:
• there were 15,913 claimants in Telford and Wrekin, 9,956 in the social rented sector and 5,955 in the private rented sector.
4.51 In relation to Council Tax Benefit:
• there were 18,520 claimants. 4.52 There were 14,600 claimants in receipt of both Housing Benefit and Council
Tax benefits.

216
Table 4.12: the potential impact of current and proposed housing and welfare reforms Date Change Housing sector People affected Impact 01.04.11 Reduction in Local Housing Allowance
(LHA) rates from 50th to the 30
th
percentile. Abolition of the higher rate for 5 bed or larger properties.
Private rented All in receipt of LHA Reduction in the number of eligible properties – increased demand for lower cost properties.
01.01.12 LHA shared room rate for under 25s extended to 25-34 year olds
Private rented Under 35s Reduction in the size of eligible properties – greater demand for shared housing.
01.04.13 Council Tax (CT) Benefit abolished and replaced with a localised scheme funded from a fixed non-ring fenced grant payment.
All Working age applicants Unknown. The replacement scheme will be at the discretion of local authorities. Overall, CT benefit expenditure is to be reduced by 10%.
01.04.13 LHA rates to be uplifted on the basis of Consumer Price Index (CPI) rather than by reference to local rents.
Private rented All in receipt of LHA If rents increase at a rate above CPI then there will be a reduction in the number of eligible properties.
2012-13 LHA rates will be frozen (rates will be based on March 2012 figures)
Private rented All in receipt of LHA If rents increase at all, then there will be a reduction in the number of eligible properties.
01.04.13 Housing Benefit (HB) restrictions – Social Housing - Working Age. Size restrictions will be introduced for working age tenants on HB in the social sector. Customers who have one spare bedroom will experience a 14% reduction in the rent allowed for HB. Those with two or more spare bedrooms will see a 25% reduction in the rent allowed for calculating HB.
Social rented Working age applicants Greater pressure is likely to be placed on the demand for smaller homes.

217
Date Change Housing sector People affected Impact 01.04.13 Household Benefit Cap. There will be a
total maximum amount that can be claimed in all benefits for working age non-working families. It is proposed that the threshold will be set at the median net earnings for working age households: £500 per week (£26,000 p.a.) for a couple and lone parent households A lower rate of £350 per week will apply for single adult households.
Social rented Working age applicants This is likely to have the greatest impact on larger families living in larger homes which attract the highest rentals.
01.04.13 Community Care Grants and Crisis Loans for living expenses (Part of the Discretionary Social Fund) will be abolished and replaced with a locally-based non-ring fenced provision. There will be no new duties on local authorities to provide the new assistance.
All All in receipt of emergency loans
Unknown, emergency provision will be at the discretion of local authorities.
2013 Introduction of Universal Credit (UC). The aim of UC is to simplify the benefits system by bringing together a range of working-age benefits into a single streamlined payment. Payments will go to one member of the household, although it will be the whole household that claims. Payments will be calendar monthly and paid in arrears. Payments to go direct to the tenant unless vulnerable.
All All in receipt of
• Income related Job Seeker’s Allowance
• Income related Employment & Support Allowance
• Income Support
• Child Tax Credits
• Working Tax Credits
• Housing Benefit
Unknown.

218
5. Determining Housing Requirements
Introduction 5.1 This chapter explains the approach adopted in determining current
housing need and future housing requirements in Telford and Wrekin. The operation of housing markets is like a complex version of ‘musical chairs’ as people move between homes and sectors within the limits of the supply available. This process can be likened to a ‘zero sum’ game whereby a home becoming available through a household dissolving or moving home is matched by a home taken elsewhere by a forming or moving household. However, it is rare for housing markets to be in perfect balance such that all moves are internal to the market and static supply meets fixed demand. In the real world, populations change, increase or decrease; people move in and out of areas - not always in balance; some areas may be more or less popular and the ‘fit’ between people’s requirements and the housing available may be poor, homes may be too large or too small, or just too expensive.
5.2 These are the dynamics against which meeting current and future
housing requirements are determined. All households have to fit around the housing available, but where projections indicate that numbers are set to grow, additional housing provision needs to be planned for on the basis of household type, size, age and income, all of which will shape their requirements.
5.3 The assessment of current housing needs and future housing
requirements consists of 4 stages:
1. Identification of the backlog of need for affordable housing using the housing register.
2. identification of the future need for affordable housing arising from
existing households over the 5 year policy period 2011-2016 using housing register and CORE data sources.
3. reconciliation of 1. and 2. against supply from turnover from the
affordable housing stock and affordable housing completions in the pipeline, and taking account of the potential contribution of the private rented sector towards meeting housing need.
4. Identification of the future requirement for housing by bedsize and
tenure arising from growth in household numbers between 2011 and 2031 and also including the need for affordable housing arising from existing households over the 5 year policy period 2011-2016.
1. The backlog of need for affordable housing 5.4 Before considering future housing requirements - for all tenures, it is
necessary to take stock of the extent to which current housing needs

219
are being met. The principal source of data and information is the Housing Register maintained by Choose Your Home. In view of the relative scarcity of social housing, this may well provide an underestimate but as a counter-balance, the system was made as easy as possible for applicants to register. In order to ensure that only applicants with an established need are identified, analysis has been undertaken of applicants in the ‘Urgent’ and ‘Needing’ categories only. Three indicators of housing need have been derived:
1. to provide an overall context, all applicants registered at September
2013 in the ‘Urgent’ and ‘Needing’ categories, excluding transfer applicants;
2. as a further live indicator of housing need, all applicants registered
in the ‘Urgent’ and ‘Needing’ categories who have been active by choosing a property in the 12 months to July 2013; and
3. all applicants registered in the ‘Urgent’ and ‘Needing’ categories
who have been currently identified as having no ‘settled’ or permanent home of their own, i.e.:
• statutorily homeless;
• lodging/sharing facilities; or
• of no fixed abode. 5.5 The following table summarises the outcome for Telford and Wrekin. Table 5.1: registered applicants in housing need, Telford and Wrekin, September 2013
No. Category Urgent Needing Total 1 Applicants registered (from T4.1) 796 12,122 12,918 2 Applicants registered (excluding transfers) 373 10,221 10,594 3 Applicants active within the 12 months to 07.13 687 5,082 5,769 4 Applicants with no settled or permanent home of
their own, consisting of: 277 5,389 5,666
• Statutorily homeless 74 - 74
• Lodging/sharing facilities 181 4,330 4,511
• No fixed abode 22 1,059 1,081
(Source: Choose Your Home data, Wrekin Housing Trust)
Key findings
• Excluding transfer applicants, 10,594 applicants in the Urgent and Needing Bands were registered with Choose Your Home at September 2013, at 16%. This total has been used in subsequent modelling of the backlog of housing need.

220
• 5,769 applicants have been active in the 12 months to July 2013, 47% of all those registered, just over 8% of all households in Telford and Wrekin.
• 5,666 applicants have been identified as having no settled or permanent home of their own, 46% of all those registered and just over 8% of all households in Telford and Wrekin.
• Whilst it has not been possible to identify the extent of overlap between the third and fourth categories of applicant, the numbers are remarkably close and suggest that an overlap is likely to exist.
2. The future need for affordable housing over the 5 year
policy period to 2016 Evidence from the housing register 5.6 Some existing households, including home owners, will either find
themselves in, or fall into, housing need over the 5 year policy period to 2016. The most useful trend-based source of information is the housing register. A total of 14,758 applicants in March 2013 had risen to 15,748 in September 2013 with those rehoused being replaced by new applicants. Trend-based analysis of lettings data has identified that, excluding transfers, an average of 420 Urgent Band applicants and 450 Needing Band applicants are rehoused annually. If those rehoused are being replaced by new applicants, this implies that in the region of 870 households will fall into need annually or 4,350 households over the 5 years to 2016.
The impact of newly forming households
5.7 The impact of newly forming households has been considered in detail
as follows:
1. Following CLG Practice Guidance, newly-forming households have been limited to households whose household reference person is aged either 15-25, 26-34 or 35-44.
2. Throughout the SHMA, CLG’s 17 household types have been
combined into 7 household archetypes which correspond with different requirements for housing by bedsize.
3. Using CLG 2008-based household projections, the number of new
households of different types projected to form each year has been calculated, and changes (growth or decline) identified for every 5 year period between 2012 and 2031.
4. By matching bedsize to household type, we have translated
changes in new household formation into changing requirements for housing, including for affordable housing.

221
5. The English Housing Survey has consistently established that the
incomes of newly-forming households are around 70% of the average for all households. This proportion has been applied to estimate the proportion of newly forming households requiring affordable housing.
6. Estimates of new household formation and associated housing
requirements have been calculated for Telford and Wrekin and the three Sub Areas.
5.8 The following table identifies changes in newly forming households by
type and age for the period 2012-2031.

222
Table 5.2: changes in newly forming households by age of household reference person, 2011-2031
2012-2016 2017-2021 2022-2026 2027-2031 Household type
15-24 25-34 35-44 Total 15-24 25-34 35-44 Total 15-24 25-34 35-44 Total 15-24 25-34 35-44 Total
One person 0 475 -303 172 -4 242 115 353 120 -11 487 596 146 62 273 481 Couple no children -96 144 -223 -175 -64 -23 28 -59 -35 -159 235 41 -25 -101 114 -12 Couple/lone parent and 1 child -47 303 -227 29 -28 155 211 338 16 -115 474 375 13 -102 176 87 Couple/lone parent and 2 children/couple and 1 or more adults no children -38 190 -566 -414 -30 52 29 51 -10 -170 326 146 -11 -141 10 -142 Couple/lone parent and 1 or more adults and 1 child -9 7 -134 -136 -6 2 -58 -62 -4 -6 -33 -43 -4 -5 -36 -45 Couple/lone parent and 3+ children/couple /lone parent and 1 or more adults and 2 children -11 62 -305 -254 -7 18 -10 1 -2 -70 133 61 -2 -49 -20 -71
Couple/lone parent and 1 or more adults 3+ children -1 0 -35 -36 -1 -3 -8 -12 0 -7 2 -5 -1 -6 -8 -15 Totals -202 1,181 -1,793 -814 -140 443 307 610 85 -538 1,624 1,171 116 -342 508 282 (Source: CLG 2008-based household projections)
The key findings are as follows:

223
• Taking account of the decline of 814 households in the period 2012-2016, a net total of only 1,249 newly forming households aged 15-44 between 2012 and 2031 and consisting of:
• Growth of 1,602 one person households
• Decline of 205 couples with no children
• Growth of 829 couples or lone parents with one child
• Decline of 359 Couples/lone parents with 2 children or couples and 1 or more adults with no children
• Decline of 286 Couples/lone parents with 1 or more adults and 1 child
• Decline of 263 Couples/lone parents with 3+ children or couples/lone parents with 1 or more adults and 2 children
• Decline of Couples/lone parents with 1 or more adults and 3+ children
• Growth is therefore, driven by one person households and couples/lone parents with one child. All other household types are projected to decline.
• New household formation is projected to decline in the period 2012-2016 then reverse in the following 5 years. Growth accelerates between 2022 and 2026 then declines rapidly in the final 5 year period.
• The net number of households aged 15-24 is projected to fall by 141 over the 20 year period, matched by increases of 744 for those aged 25-34 and 647 for those aged 35-44.
5.9 The following table translates projected changes in newly forming households into changing requirements by bedsize.
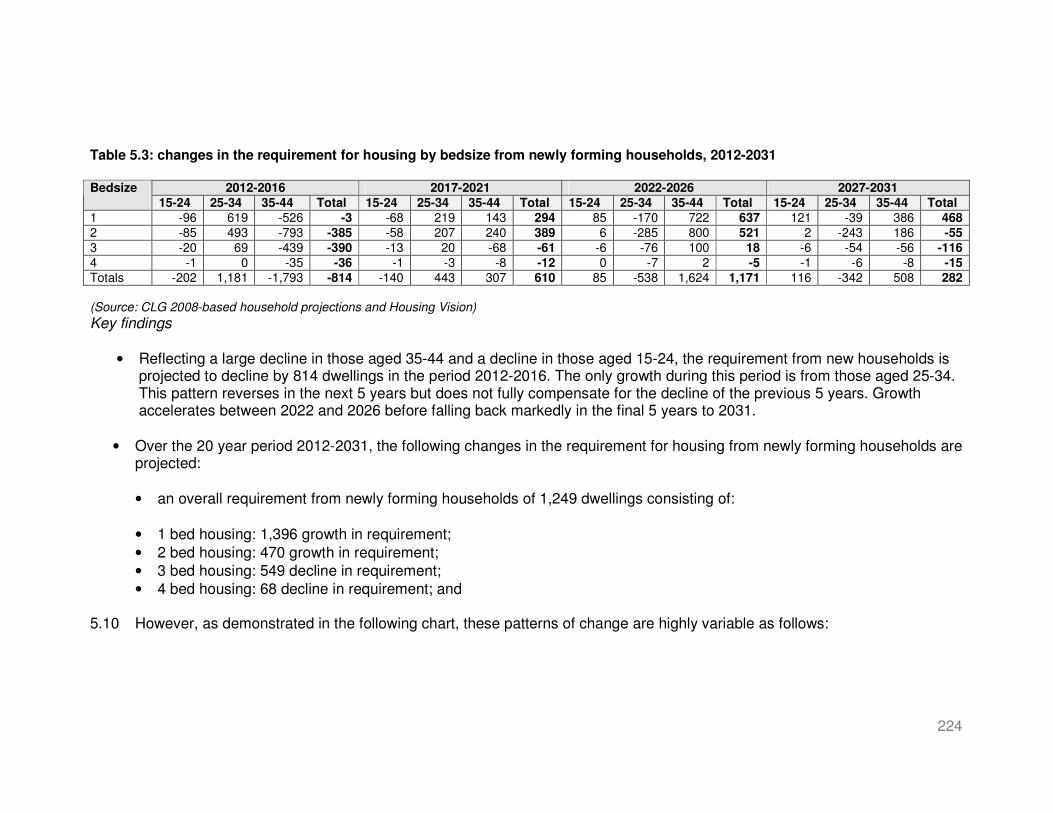
224
Table 5.3: changes in the requirement for housing by bedsize from newly forming households, 2012-2031
2012-2016 2017-2021 2022-2026 2027-2031 Bedsize
15-24 25-34 35-44 Total 15-24 25-34 35-44 Total 15-24 25-34 35-44 Total 15-24 25-34 35-44 Total 1 -96 619 -526 -3 -68 219 143 294 85 -170 722 637 121 -39 386 468 2 -85 493 -793 -385 -58 207 240 389 6 -285 800 521 2 -243 186 -55 3 -20 69 -439 -390 -13 20 -68 -61 -6 -76 100 18 -6 -54 -56 -116 4 -1 0 -35 -36 -1 -3 -8 -12 0 -7 2 -5 -1 -6 -8 -15 Totals -202 1,181 -1,793 -814 -140 443 307 610 85 -538 1,624 1,171 116 -342 508 282 (Source: CLG 2008-based household projections and Housing Vision)
Key findings
• Reflecting a large decline in those aged 35-44 and a decline in those aged 15-24, the requirement from new households is projected to decline by 814 dwellings in the period 2012-2016. The only growth during this period is from those aged 25-34. This pattern reverses in the next 5 years but does not fully compensate for the decline of the previous 5 years. Growth accelerates between 2022 and 2026 before falling back markedly in the final 5 years to 2031.
• Over the 20 year period 2012-2031, the following changes in the requirement for housing from newly forming households are projected:
• an overall requirement from newly forming households of 1,249 dwellings consisting of:
• 1 bed housing: 1,396 growth in requirement;
• 2 bed housing: 470 growth in requirement;
• 3 bed housing: 549 decline in requirement;
• 4 bed housing: 68 decline in requirement; and
5.10 However, as demonstrated in the following chart, these patterns of change are highly variable as follows:

225
• The requirement for 1 bed housing is almost stable between 2012 and 2016 - then grows, peaking between 2002 and 2026
• The requirement for 2 bed housing declines between 2012 and 2016 but this is reversed in the following 5 years. There is an increased requirement between 2022 and 2026 then a decline in the final 5 years.
• The requirement for 3 bed housing declines between 2012 and 2026 before growing rapidly between 2027 and 2031.
• The requirement for 4 bed housing declines constantly between 2012 and 2031 though the numbers concerned are small.

226
Figure 5.1: changes in the requirement for housing by bedsize from newly forming households, 2012-2031
-600
-400
-200
0
200
400
600
800
1 bed 2 bed 3 bed 4 bed
2012-16 2017-21 2022-26 2027-31

227
5.11 Household projections are not available at Sub Area level and therefore,
projections of newly forming households and their housing requirements, have been allocated to Sub Area as a proportion of the number of households in Telford and Wrekin at the 2011 Census. These were as follows:
• Newport: 7.6% of all households;
• Rural 5.8% of all households; and
• Telford: 86.5% of all households. Table 5.4: changes in the requirement for housing by bedsize from newly forming households by Sub Area, 2012-2031
Newport Rural Telford Beds
2012-2016
2017-2021
2022-2026
2027-2031
2012-2016
2017-2021
2022-2026
2027-2031
2012-2016
2017-2021
2022-2026
2027-2031
1 0 17 37 27 0 22 48 36 -3 254 551 405
2 -22 23 30 -3 -29 30 40 -4 -333 336 451 -48
3 -23 -4 1 -7 -30 -5 1 -9 -337 -53 16 -100
4 -2 -1 0 -1 -3 -1 0 -1 -31 -10 -4 -13
Totals -47 35 68 16 -62 46 89 21 -704 528 1,013 244
(Source: CLG 2008-based household projections and Housing Vision)
Key findings
• The above table reflects the patterns for Telford and Wrekin as a whole but provides a breakdown of housing requirements disaggregated by Sub Area.
5.12 As they have different patterns of incomes and property prices, the
implications of changes in newly forming households for the requirement for affordable housing needs to be considered by Sub Area. Based on affordability calculations in the HMA and Housing Requirements Toolkit, and assuming that newly forming households receive incomes at 70% of the average, their requirement for affordable housing would be as follows:
o Newport: 50% o Rural: 53% o Telford: 61%
5.13 The following tables summarise the outcome

228
Table 5.5: changes in the requirement for affordable housing by bedsize from newly forming households by Sub Area, 2012-2031
Newport Rural Telford Beds
2012-2016
2017-2021
2022-2026
2027-2031
2012-2016
2017-2021
2022-2026
2027-2031
2012-2016
2017-2021
2022-2026
2027-2031
1 0 9 19 14 0 12 25 19 -2 155 336 247
2 -11 12 15 -2 -15 16 21 -2 -203 205 275 -29
3 -12 -2 1 -4 -16 -3 1 -5 -206 -32 10 -61
4 -1 -1 0 -1 -2 -1 0 -1 -19 -6 -2 -8
Totals -24 18 34 8 -33 24 47 11 -429 322 618 149
(Source: CLG 2008-based household projections and Housing Vision)
Table 5.6: changes in the requirement for affordable housing by bedsize from newly forming households, net effect, 2012-2031
Telford and Wrekin Beds
2012-2016 2017-2021 2022-2026 2027-2031 Total 1 -2 175 380 280 833
2 -230 232 311 -33 281
3 -233 -37 11 -69 -328
4 -22 -7 -2 -9 -40
Totals -486 364 699 168 746
(Source: CLG 2008-based household projections and Housing Vision)
Key findings
• On the basis of these projections, there will be a reduction in the requirement for affordable housing of in the region of 500 households in the period to 2016 and this has been deducted from the estimate from housing register data that 4,350 households will fall into need to provide a net total of 3,850 households or 770 per annum. This represents an increase on the estimate of 671 households in annual housing need provided in the 2008 SHMA Update (paragraph 6.13), and indicates growing problems of affordability.
• Over the overall 20 year period 2012-2031, the following changes in the requirement for affordable housing from newly forming households are projected:
• 1 bed housing: 833 growth in requirement;
• 2 bed housing: 280 growth in requirement;
• 3 bed housing: 328 decline in requirement;
• 4 bed housing: 40 decline in requirement; and
• Reflecting variable patterns of household formation, the affordable housing requirement from new households is projected to decline by 486 dwellings in the period 2012-2016. This pattern reverses in the next 5 years but it does not fully compensate for the decline of the previous 5 years. Growth accelerates between 2022 and 2026 before falling back markedly in the final 5 years to 2031.

229
• Detail of the impact of these changes by Sub Area can be identified from Table 5.5.
Evidence from CORE 5.14 Two other sources of data relevant to the number of existing households
falling into need are:
1. A CORE live data table for ‘General Needs Lettings’ identifying ‘Previous tenure’ including ‘Owner occupation’; and
2. CORE New Lettings Reports listing the ‘Main reason the household left
their last settled home’ and including such unpredictable factors resulting in housing need as:
• Eviction or repossession;
• Domestic violence;
• (Non-violent) relationship breakdown with partner;
• Racial harassment; or
• Other problems with neighbours. 5.15 CORE live data for the 5 years to April 2013 identified 85 home owners
accessed general needs social housing, an average of 17 per annum or 2.63% of the total.
5.16 ‘General Needs Lettings Annual Report’ tables for Telford and Wrekin for the
5 years April 2007-March 2012 identified that between 605 households left their last settled home due to one or more of the factors listed at 5.7 above, an average of 121 per annum. Continuation of such trends would imply a minimum of 605 households falling into housing need over the next 5 years.
5.17 The proportion of existing applicant households unable to buy has been
determined in relation to the findings of the English Housing Survey Households Report for 2011-12 which established that:
‘The average gross annual income for households in 2011-12 was £34,700. This varied considerably by tenure type; owner occupiers had an average gross annual household income of £40,500 compared with £30,100 for private renters and £17,600 for social renters’ (page 20).
5.18 This implies that social renting households have incomes which are 51% of
the average. When this ratio is applied to the CACI gross household incomes used in the affordability modelling explained at Section 4 above, this reduces the percentage unable to buy to 83%, 77% require social housing and 6% can afford intermediate housing.
5.19 Affordable housing development in the pipeline identified at 12th April 2013 as
‘Firm commitments’ consist of 84 dwellings in 2013-14 and 98 dwellings in

230
2014-15, a total of 182 new dwellings. The following table summarises the backlog of need for affordable housing.
Table 5.7: backlog need 2013, and annual need over the 5 year period, 2011-2016
Stage Description Measure 1 Backlog priority need - existing ‘Urgent’ and ‘Needing’ households
(from T4.1/5.1) 10,594
2 Percentage unable to buy 83% 3 Backlog of affordable housing need 8,793 4 Committed affordable supply 182 5 Net backlog affordable housing need 8,611
6 Quota to reduce backlog affordable housing need 0.20 7 Annual backlog affordable housing need 1,722
Key findings:
• The annual backlog of affordable housing need over the 5 year period to 2016 is estimated to be 1,722 households per year.
3. Matching affordable housing need and supply 5.20 A review of ‘Choose Your Home’ data for the 5 years April 2008-March 2013
identified 5,966 social housing lettings at an average of 1,193 per annum, of which 870 were new lettings to applicants in the Urgent and Needing Bands, a sub-total which has been applied in modelling the need for affordable housing.
5.21 In relation to the intermediate housing sector, a 5% turnover rate would
generate a supply of 15 dwellings per annum, or 75 over the 5 year policy period.
5.22 Over the 5 year policy period, these three sources of affordable housing
consist of:
• 4,350 social housing lettings to applicants in the Urgent and Needing Bands (870 per annum);
• 75 intermediate housing sales (15 per annum);
• 182 new pipeline affordable dwellings provided; and
• an overall supply of 4,607 affordable dwellings.
5.23 The following table assesses the relationship between affordable housing need and affordable housing supply to identify the annual net requirement. Backlog need proportions requiring social and intermediate housing have been applied to new need on the basis that 100% of households in the Urgent and Needing Bands will require affordable housing.

231
Table 5.8: meeting annual affordable need - social and intermediate housing
No. Stage Backlog
need (from T5.7)
New need per annum (from para 5.13)
Total %
1 Percentages requiring social housing
77% 95% - -
2 Percentages can afford intermediate housing
6% 5% - -
3 Percentages can afford to buy 17% 0% - - 4 Percentage needs affordable
housing 83% 100% - -
5 Number of social rented units required (gross)
1,598 732 2,330 93.5
6 Average number of intermediate units required (gross)
125 38 163 6.5
7 Average number of affordable units required (gross)
*1,723 770 2,493 100%
8 Annual social rented re-lets 870 -
9 Annual net social rented requirement (5 less 8)
1,442 89.7
10 Intermediate re-sales 15 - 11 Annual net intermediate
requirement (6 less 10) 166 10.3
12 Annual net affordable requirement (9 plus 11)
1,608 100%
Notes: * Please note that at 1,723, the average number of affordable units required is one unit larger than the total of 1,722 in Table 5.7. This is as a result of rounding from applying the percentage of those needing affordable housing who require intermediate housing.
Key findings:
• The table identifies a net annual requirement for 1,608 affordable homes (8,040 over 5 years) which compares with an estimate of 1,240 per annum in the 2008 SHMA Update (6,200 over 5 years using 2007 data). This increase is unsurprising in the context of the financial crisis and continuing problems of affordability reflected in national increases waiting lists.
• Taking account of re-lets and re-sales, 90% of the net annual requirement is for social rented housing and 10% for intermediate housing.
5.24 The following table assesses the relationship between the requirement for
affordable housing by dwelling size over the 5 year policy period to 2016 and the level of supply. Requirements by bedsize for existing (housing register) and new households (from the existing population) have been determined according to the proportion of bids by bedsize over 5 years to 2013 and supply by bedsize by lettings for the same period. No data is available detailing the supply of intermediate units by bedsize and therefore, the annual supply of 15 units at Row 10 of the table above has been allocated equally between 1, 2 and 3 bed homes.

232
Table 5.9: annual affordable dwelling size requirements, 2011-2016
Gross affordable requirement Affordable supply Shortfall
Beds
Existing (from
housing register)
New (from
existing population) Total Percentage Number Percentage Number
Percentage of total shortfall
Shortfall as
percentage of supply
1 207 92 299 12 231 26 -68 4 29 2 844 377 1,221 49 405 46 -816 51 202 3 586 262 848 34 214 24 -634 39 296 4 86 39 125 5 35 4 -90 6 257 Totals 1,723 770 2,493 100% 885 100% -1,608 100% 182
Key findings
• The most acute shortfall over the next 5 years is estimated to be in 3 bedroomed housing where the shortfall is almost three times the projected supply, followed by 4 bedroomed housing with the shortfall at two and a half times the level of supply then 2 bed housing at twice the level of supply.
5.25 Table 5.10 applies to the previous table the finding from Table 5.7 that 89.7% of the annual affordable housing requirement
between 2011 and 2016 is for social rented housing and 10.7% for intermediate housing. Table 5.10: affordable dwelling size requirements by tenure, 2011-2016
Social rented (89.7%)
Intermediate (10.3%) Total
Bedsize Annual 2011-2016 Annual 2011-2016 Annual 2011-2016 1 (12%) 61 305 7 35 68 340
2 (49%) 732 3,660 84 420 816 4,080 3 (34%) 569 2,845 65 325 634 3,170
4 (5%) 81 405 9 45 90 450 Totals 1,443 7,215 165 825 1,608 8,040
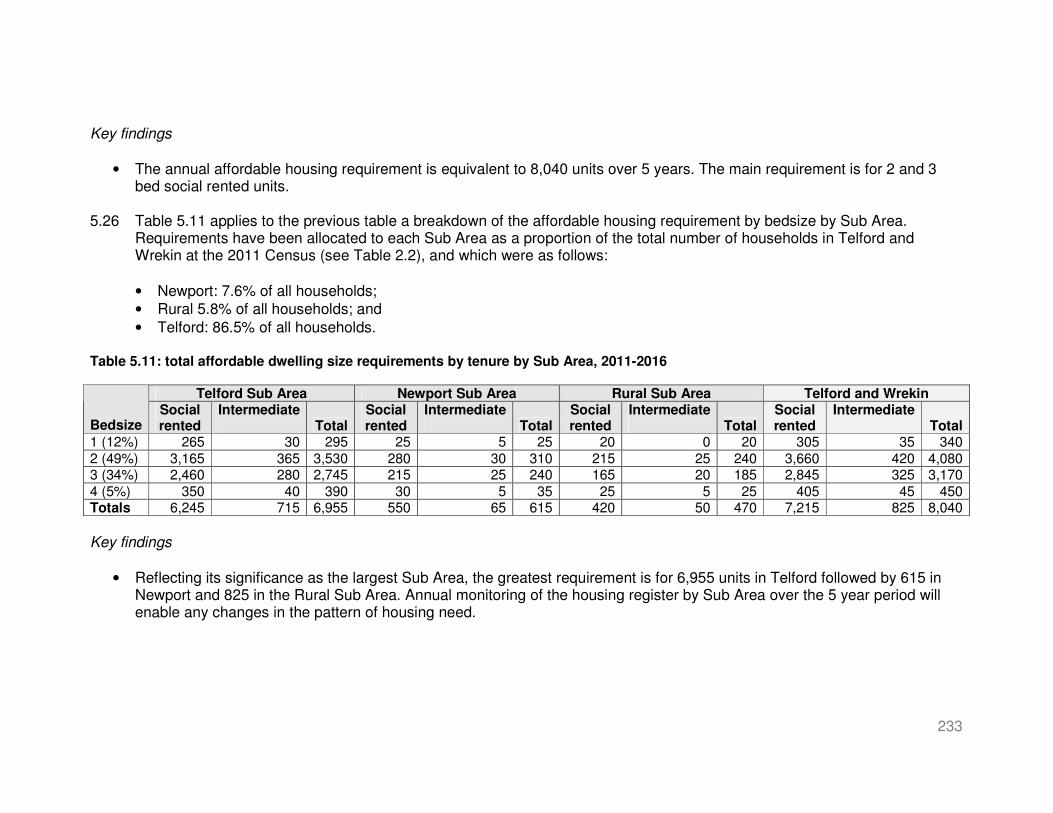
233
Key findings
• The annual affordable housing requirement is equivalent to 8,040 units over 5 years. The main requirement is for 2 and 3 bed social rented units.
5.26 Table 5.11 applies to the previous table a breakdown of the affordable housing requirement by bedsize by Sub Area.
Requirements have been allocated to each Sub Area as a proportion of the total number of households in Telford and Wrekin at the 2011 Census (see Table 2.2), and which were as follows:
• Newport: 7.6% of all households;
• Rural 5.8% of all households; and
• Telford: 86.5% of all households. Table 5.11: total affordable dwelling size requirements by tenure by Sub Area, 2011-2016
Telford Sub Area Newport Sub Area Rural Sub Area Telford and Wrekin
Bedsize Social rented
Intermediate Total
Social rented
Intermediate Total
Social rented
Intermediate Total
Social rented
Intermediate Total
1 (12%) 265 30 295 25 5 25 20 0 20 305 35 340
2 (49%) 3,165 365 3,530 280 30 310 215 25 240 3,660 420 4,080 3 (34%) 2,460 280 2,745 215 25 240 165 20 185 2,845 325 3,170
4 (5%) 350 40 390 30 5 35 25 5 25 405 45 450 Totals 6,245 715 6,955 550 65 615 420 50 470 7,215 825 8,040
Key findings
• Reflecting its significance as the largest Sub Area, the greatest requirement is for 6,955 units in Telford followed by 615 in Newport and 825 in the Rural Sub Area. Annual monitoring of the housing register by Sub Area over the 5 year period will enable any changes in the pattern of housing need.

234
The role of the private rented sector in meeting affordable housing need 5.27 Department of Work and Pensions (DWP) data identifies that there were
4,950 private rented sector tenants in receipt of Housing Benefit at February 2011 which increased to 5,450 in February 2012 and to 5,955 in February 2013. This implies that the private rented sector has housed an additional 500 households each year. If this trend continued over the 5 year policy period, the private rented sector may be able to house a further 2,500 households, which would contribute to the net requirement for 8,060 affordable homes.
5.28 Whilst the private rented sector will continue to have a role in housing those in
housing need, a number of provisos need to be made as follows:
1. reforms to LHA have had the effect of reducing both eligibility, especially for those under 35, and the amount which can be claimed;
2. the sector does not provide secure tenancies; standards can be variable
and may be below those in the social housing sector; and
3. there is no control over the level of supply, which may increase or decrease without warning.
4. Determining future housing requirements, 2011-2031 Confidence and certainty in determining future housing requirements 5.29 Whilst 2011 Census data was available at the time of completion of this
Assessment, 20 year household projections had yet to be revised to take account of its findings. More importantly, we are experiencing a unique coincidence of economic and financial problems, the outcome of which is unknown. Turnover and home moves have reduced dramatically, although property prices have not fallen as far as predicted, and there is growing evidence of the growth of two or even three generation households which would impact on housing requirements. The consequences of the economic and financial situation for households, housing markets and housing projections remain uncertain.
Applying the Telford and Wrekin HMA and Housing Requirements Toolkit 5.30 A Telford and Wrekin HMA and Housing Requirements Toolkit has been
developed to identify the requirements of new or additional households and enable them to be constantly modelled and monitored. The structure of the Toolkit is explained below, and guidance on its application is available through a separate User Manual. The key principles are as follows:
• The Toolkit applies local data for household projections, incomes and housing costs to identify the basic housing requirements of households, i.e., the bedrooms required by size and composition of household; it does not assume the provision of ‘spare’ bedrooms. This is not to advocate the
235
minimal provision of bedrooms and the provision of additional bedrooms can be modelled as preferred.
• The Toolkit allows any housing shortfall of supply from any sector to be included and its reduction to be modelled over any policy period;
• it estimates levels of under-occupation in older (65+) households and projects potential requirements for specialised housing for all older and projected additional older households.
The structure of the toolkit
5.31 The toolkit consists of 5 sections, each of which represents a stage in
assessing the housing required to meet household growth as follows:
• Household projections: for any two years, this identifies the number of households by type and age, and changes between the start and finish years chosen in terms of absolute and proportionate change. A final table on the Households page identifies whether there is growth (red) or decline (green) in any household type and the outcome in terms of projected growth in households by type and age over the selected period.
• Housing supply: this enables constant monitoring of the local housing stock and housing supply as the context for understanding future housing requirements.
• Housing costs and affordability: this determines the cost of housing of different types, bedsizes and tenures, the income required to afford housing of different types and applies an affordability threshold to determine the proportion of households who are able to afford housing by tenure. Further detail of the approach to determining affordability has been provided at para 4.40 above.
• Housing requirements: the future housing requirements arising from new or additional households by bed size and tenure are derived by combining household projections with cost and affordability data. There is also the facility to assess the impact of a shortfall in supply in any tenure.
• Housing requirements by age: separate consideration is given to the special housing requirements of all and additional older households in the context of the extent of under-occupation.
5.32 The toolkit is based on two types of data, fixed and variable.
• The fixed data will be constant until it is re-issued, for example, household projections and CACI incomes data although both the household projections and household incomes can be varied by +/- 100% using sliders within the Toolkit.

236
• The variable data can be input and changed by the user at any time and includes the start and finish years for projections, housing costs, housing supply; bedsize by household type, any affordable housing supply shortfall and estimated levels of under-occupation in 65+ households.
5.33 The following sections explain the stages in assessing the housing
requirements of new or additional households in Telford and Wrekin.
Components of household projections 5.34 Household projections take account of the effects of a number of factors:
• ‘natural change’: underpinned by the relationship between births and deaths, and which results in the formation of new households and the ending of existing ones;
• changes affecting existing households: for example relationship breakdown and movements through the life cycle; and finally
• in and out migration: and the relationship between them.
5.35 The CLG methodology for estimating household projections takes account of
these factors which are based on the following 17 household types:
1. One person male 2. One person female 3. Other households 4. Couple no children 5. Couple 1 child 6. Lone parent 1 child 7. Couple 2 children 8. Couple and 1 or more adults no children 9. Lone parent 2 children 10. Couple and 1 or more adults 1 child 11. Lone parent 1 or more adults 1 child 12. Couple 3+ children 13. Couple and 1 or more adults 2 children 14. Lone parent 3+ children 15. Lone parent 1 or more adults 2 children 16. Couple and 1 or more adults 3+ children 17. Lone parent 1 or more adults 3+ children
5.36 The differences in many of these household types are very minor, and to
make the process more manageable, these have been combined into 7 which match their bedsize/person requirements as set out in the following table. Where there are 2 or more children in a household, the bedroom requirement will be determined according to their age and sex. It is not possible to predict these with accuracy and therefore the minimum bedroom requirement has been assumed in all cases.

237
Table 5.12: derived household types and associated minimum bedsize Derived household types Household type Bedsize Persons Minimum
Bedsize One person male 0/1 1 1 One person female 0/1 1
One person
Other households 0/1 1 Couple no children Couple no children 1 2 1
Couple 1 child 2 3 2 Couple/lone parent and 1 child Lone parent 1 child 2 2 Couple 2 children 2/3 4 2 Couple and 1 or more adults no children
2/3 3/4 Couple/lone parent and 2 children/couple and 1 or more adults no children
Lone parent 2 children
2/3 3/4
Couple and 1 or more adults 1 child
3 4/5 3 Couple/lone parent and 1 or more adults and 1 child
Lone parent and 1 or more adults 1 child
3 3/4
Couple 3+ children ¾ 5/6 3 Couple and 1 or more adults and 2 children
¾ 5/6 3
Lone parent and 3+ children
¾ 4/5
Couple/lone parent and 3+ children/ couple/lone parent and 1 or more adults and 2 children
Lone parent 1 or more adults 2 children
¾ 4/5
Couple and 1 or more adults 3+ children
4/5 6/7 4 Couple/lone parent and 1 or more adults 3+ children
Lone parent 1 or more adults 3+ children
4/5 5/6
(Source: Housing Vision)
5.37 As a result of this exercise, the 7 derived household types applied in
projecting housing requirements are:
• One person
• Couple no children
• Couple/lone parent and 1 child
• Couple/lone parent and 2 children/couple and 1 or more adults no children
• Couple/lone parent and 1 or more adults and 1 child
• Couple/lone parent and 3+ children/ couple/lone parent and 1 or more adults and 2 children
• Couple/lone parent and 1 or more adults 3+ children

238
Housing supply
5.38 This is the second section of the Toolkit and deals with the housing stock and
housing supply. This page identifies the profile of the housing stock by bedsize and tenure and enables this to be continuously updated through stock gains and losses. Please note that shared accommodation can be an entire house, flat or converted building or any of the following:
• bedsits
• shared houses
• households with a lodger
• purpose-built HMOs
• hostels
• guesthouses - if rented out of season
• bed and breakfasts providing accommodation for homeless people
• some types of self-contained flats converted from houses 5.39 Supply information provides a context for understanding the type of housing
becoming available for all households, including additional households, they do not inform the modelling of future housing requirements. The annual supply of housing can be modelled by applying a turnover rate, which will vary over time according to supply: demand issues; financial and economic considerations. Due to uncertainty over these factors, it is not possible to project stock turnover with precision but set out below is a list of possible approaches for determining turnover rates:
• For the home ownership sector: turnover is based on the number of properties recorded as sold by the Land Registry in the previous 12 months as a proportion of all owner occupied homes.
• For the shared ownership/equity sector: the home ownership turnover rate has been applied, or recognising the relatively low levels of staircasing to full ownership, a slightly lower rate can be applied.
• For the private rented sector: the turnover rate is based on estimates in the English Housing Survey 2011-12 and data collected on the profile of the private rented sector.
• For the social rented sector: turnover is based on the number of properties advertised annualised as a proportion of all stock.
Housing costs and affordability
5.40 Using the approach described at para 4.40 above, the Toolkit assesses the
affordability of a typical entry level property, the default setting is a 2 bedroomed house which is especially relevant to meeting the typical requirements of additional households, the majority of which are small, and can be considered an ‘average’ housing type. The cost of accessing this

239
property for all tenures (local authority renting to new build home ownership and including Affordable Rent) is compared against the maximum housing costs available per household.
5.41 The maximum costs affordable are based on the affordability threshold
selected which is in turn determined in relation to the CACI PayCheck household incomes provided. The Toolkit calculates the household incomes required to access each tenure for an archetype 2 bed house and the absolute numbers and percentages of the households on the CACI profile that can afford each tenure. A column at the end of the housing costs inputs section of the Toolkit allows these costs to be changed so that they can reflect other bedsizes and property types as required, for example a 2 bed flat or a 5 bed house.
5.42 All tenures have been included in this Assessment in terms of a hierarchy of
affordability. Affordable Rent has been treated as a full cost market product though access to Housing Benefit may make it more accessible to lower income groups. It is not possible to assess with any accuracy how many households on the CACI PayCheck Profile will be in receipt of sufficient Housing Benefit to be able to afford Affordable Rent but it does indicate the level of household income required to access an Affordable Rented product. Private rent has been separately identified as it now constitutes a major element of housing supply, though in terms of new housing required, this is likely to be provided by the home ownership sector then transferred to the private rental sector.
5.43 The Toolkit identifies the household income levels required to access each
tenure at June 2013 and the proportion of households that can afford them across Telford and Wrekin or within each sub area. The following tables list the outcome and provide for the district as a whole and for each sub area a hierarchy of affordability from those who can only afford social rented housing to the additional percentages who can afford other options.
Table 5.13: affordability hierarchy, proportion of households who can afford each sector, Telford and Wrekin, June 2013 Sector Affordability hierarchy Social rent only 38.8%
Affordable Rent 1.7% Shared equity/ownership 5.9% Private rent 6.7% Owner occupier 47.0% (Source: Housing Vision, Telford and Wrekin HMA and Housing Requirements Toolkit)
Key findings:
• The implication of this assessment is that new developments for housing across Telford and Wrekin which do not take account of incomes and prices by sub area should, as part of the housing mix provide:

240
• 38.8% affordable housing requirement (social rent only);
• 7.6% intermediate housing requirement (shared equity/ownership and Affordable Rent); and
• 53.7% market sector (owner occupier and private rent). Table 5.14: affordability hierarchy, proportion of households who can afford each sector, Telford Sub Area, June 2013
Sector Affordability hierarchy Social rent only 37.6% Affordable Rent 0.0%
Shared equity/ownership 8.7% Private rent 3.1%
Owner occupier 50.5% (Source: Housing Vision, Telford and Wrekin HMA and Housing Requirements Toolkit)
Key findings:
• The implication of this assessment is that new developments for housing in the Telford Sub Area which take account of local incomes and prices should, as part of the housing mix provide:
• 37.6% affordable housing requirement (social rent only);
• 8.7% intermediate housing requirement (shared equity/ownership and Affordable Rent); and
• 53.6% market sector (owner occupier and private rent). Table 5.15: affordability hierarchy, proportion of households who can afford each sector, Newport Sub Area, June 2013 Sector Affordability hierarchy Social rent only 34.2% Affordable Rent 5.3% Shared equity/ownership 1.6% Private rent 10.6%
Owner occupier 48.3% (Source: Housing Vision, Telford and Wrekin HMA and Housing Requirements Toolkit)
Key findings:
• The implication of this assessment is that new developments for housing in the Newport Sub Area which take account of local incomes and prices should, as part of the housing mix provide:
• 34.2% affordable housing requirement (social rent only);
• 6.9% intermediate housing requirement (shared equity/ownership and Affordable Rent); and
• 58.9% market sector (owner occupier and private rent).

241
Table 5.16: affordability hierarchy, proportion of households who can afford each sector, Rural Sub Area, June 2013 Sector Affordability hierarchy Social rent only 36.8% Affordable Rent 1.7% Shared equity/ownership 9.0% Private rent 5.7% Owner occupier 46.8% (Source: Housing Vision, Telford and Wrekin HMA and Housing Requirements Toolkit)
Key findings:
• The implication of this assessment is that new developments for housing in the Rural Sub Area which take account of local incomes and prices should, as part of the housing mix provide:
• 36.8% affordable housing requirement (social rent only);
• 10.7% intermediate housing requirement (shared equity/ownership and Affordable Rent); and
• 52.5% market sector (owner occupier and private rent).
Modelling assumptions applied 5.44 Before identifying the housing required over the period 2011-2031, a number
of factors need to be considered and assumptions made concerning bedsize and matching surpluses against deficits of housing required.
Additional bedrooms 5.45 The Toolkit identifies the requirements of additional households by number of
bedrooms but it is not possible to determine this with precision for households with children as their requirements will be determined by the age and sex of the individual children. No assumptions have been applied in modelling concerning the provision of a spare bedroom which is additional to that required to meet a household’s minimum requirement. However, this is not to advocate building housing to the minimum requirement. It is more sustainable to build housing with a spare bedroom, for example to give young families the opportunity to expand or enable older people to have a carer to stay. This is likely to be decided by providers for market housing but, as Housing Benefit is now only available for the number of bedrooms required, the provision of extra bedrooms is not an option in the social sector.
Matching deficits and surpluses of housing required 5.46 The final stage is to identify whether there is a deficit or surplus of housing of
different bedsizes and tenures. Surpluses of shared units are the most problematic as they can be of very variable quality and can constitute large houses with several bedrooms. Unfortunately, no data is available to profile
242
this sector and therefore, such surpluses have not been offset against the future housing requirements. Where they occur for larger sized properties, surpluses of housing can be set against shortages of lower sized properties as follows:
• Surpluses of 1 bed units can be set against the requirement for shared units;
• Surpluses of 2 bed units can be set against the requirement for 1 bed units;
• Surpluses of 3 bed units can be set against the requirement for 2 bed units;
• Surpluses of 4 bed units can be set against the requirement for 3 bed units.
• Surpluses of shared units have not been set against any requirement as their variable pattern including purpose-built to sub-divided accommodation makes generalisation difficult.
The requirement for replacement family housing for older households not
downsizing 5.47 As is the case nationally and regionally, most of the additional requirement for
housing will arise from the growth in the number of older households and this has major implications for meeting future housing requirements in Telford and Wrekin. Although some growth in older households may be attributed to net migration, most is the result of more older people living longer who are already resident in the area. Most of these households will already be housed, typically in family-sized accommodation. However, Census data on under-occupation provides some indication of the extent to which older households live in family housing. In Telford and Wrekin, 62.9% of households aged 65+ were under-occupying in 2001. This implies that in the region of 63% of older people are currently living in family housing, a proportion which will apply to those for whom additional - and smaller - housing is projected to be required. More recent data determining the extent to which this is the case will be available when further 2011 Census data is released. If additional older households do not downsize to smaller homes, replacement family housing will be required to maintain existing levels of supply.
5.48 The number of older households able and/or willing to downsize is not known
with certainty, but on the basis of studies of under-occupation and housing need, it is estimated that this does not currently exceed 10%. Applying estimates of under-occupation, as much as 57% (90% of 63%) of the requirement for housing for older people may need to be provided as family or other housing to replace supply ‘blocked’ by older people who do not downsize. Whilst the proportion willing to downsize may change, the estimate that 90% of underoccupying older households will not downsize has been applied in modelling the area’s future housing requirement with the effect that replacement 3 bed housing will be required to compensate for the loss of supply. With regard to calculating replacement 3 bed housing, we have taken the 65+ 1 bedroom requirement and calculated the proportion of households

243
underoccupying and unwilling to downsize. We have added this figure proportionately to the 15-64 3 bed requirement in the net requirement tables.
Projected gross requirement for housing by tenure and bedsize, 2011-
2031 5.49 The following table identifies gross housing requirements by tenure and
bedsize for the period 2011-2031. Gross housing requirements do not take account of either the requirement for affordable housing from the existing population or for replacement family housing for older households not downsizing.
Table 5.17: projected gross housing requirements from household growth for Telford and Wrekin 2011-2031
Tenure Sector Shared 1
bed 2 bed
3 bed
4+ bed
Total No.
Total %
Social Rent -353 4,736 408 -912 -115 3,764 38.8 Affordable Affordable
Rent -15 203 17 -39 -5 161 1.7
Intermediate Shared Ownership
-60 812 70 -156 -20 645 6.7
Private Rent
-53 718 62 -138 -17 570 5.9 Market
Owner Occupier
-427 5,730 493 -1,104 -139 4,554 47.0
Total no. All sectors -908 12,198 1,050 -2,350 -295 9,695 100.00
Total % All sectors -9.4 125.8 10.8 -24.2 -3.0 100.0 (Source: Housing Vision, Telford and Wrekin HMA and Housing Requirements Toolkit)
Table 5.18: projected gross housing requirements from household growth for the Telford sub area 2011-2031
Tenure Sector Shared 1
bed 2 bed
3 bed
4+ bed
Total No.
Total %
Social Rent -295 3,968 342 -764 -96 3,154 37.6 Affordable Affordable
Rent 0 0 0 0 0 0 0.00
Intermediate Shared Ownership
-69 921 79 -178 -22 732 8.7
Private Rent
-25 331 28 -64 -8 263 3.1 Market
Owner Occupier
-397 5,335 459 -1,028 -129 4,240 50.5
Total no. All sectors -786 10,555 909 -2,033 -255 8,389 100.00 Total % All sectors -9.4 125.8 10.8 -24.2 -3.0 100.0 (Source: Housing Vision, Telford and Wrekin HMA and Housing Requirements Toolkit)
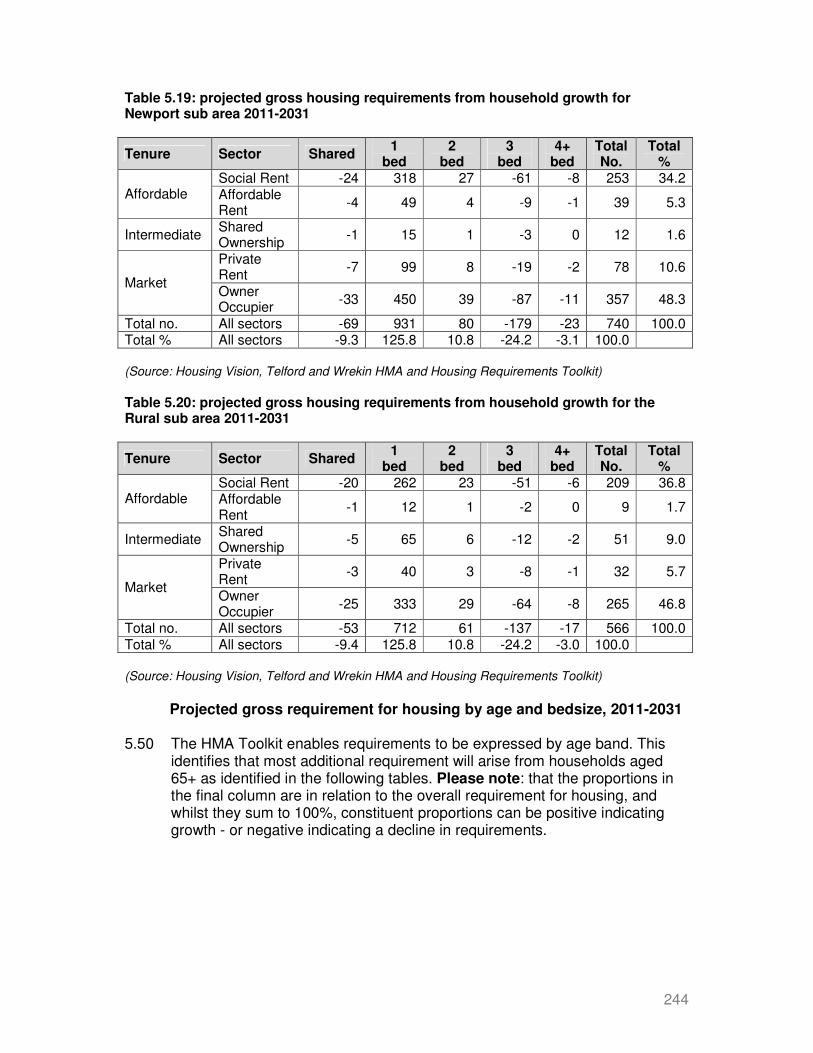
244
Table 5.19: projected gross housing requirements from household growth for Newport sub area 2011-2031
Tenure Sector Shared 1
bed 2
bed 3
bed 4+
bed Total No.
Total %
Social Rent -24 318 27 -61 -8 253 34.2 Affordable Affordable
Rent -4 49 4 -9 -1 39 5.3
Intermediate Shared Ownership
-1 15 1 -3 0 12 1.6
Private Rent
-7 99 8 -19 -2 78 10.6 Market
Owner Occupier
-33 450 39 -87 -11 357 48.3
Total no. All sectors -69 931 80 -179 -23 740 100.0 Total % All sectors -9.3 125.8 10.8 -24.2 -3.1 100.0 (Source: Housing Vision, Telford and Wrekin HMA and Housing Requirements Toolkit)
Table 5.20: projected gross housing requirements from household growth for the Rural sub area 2011-2031
Tenure Sector Shared 1
bed 2
bed 3
bed 4+
bed Total No.
Total %
Social Rent -20 262 23 -51 -6 209 36.8 Affordable Affordable
Rent -1 12 1 -2 0 9 1.7
Intermediate Shared Ownership
-5 65 6 -12 -2 51 9.0
Private Rent
-3 40 3 -8 -1 32 5.7 Market
Owner Occupier
-25 333 29 -64 -8 265 46.8
Total no. All sectors -53 712 61 -137 -17 566 100.0 Total % All sectors -9.4 125.8 10.8 -24.2 -3.0 100.0 (Source: Housing Vision, Telford and Wrekin HMA and Housing Requirements Toolkit)
Projected gross requirement for housing by age and bedsize, 2011-2031 5.50 The HMA Toolkit enables requirements to be expressed by age band. This
identifies that most additional requirement will arise from households aged 65+ as identified in the following tables. Please note: that the proportions in the final column are in relation to the overall requirement for housing, and whilst they sum to 100%, constituent proportions can be positive indicating growth - or negative indicating a decline in requirements.
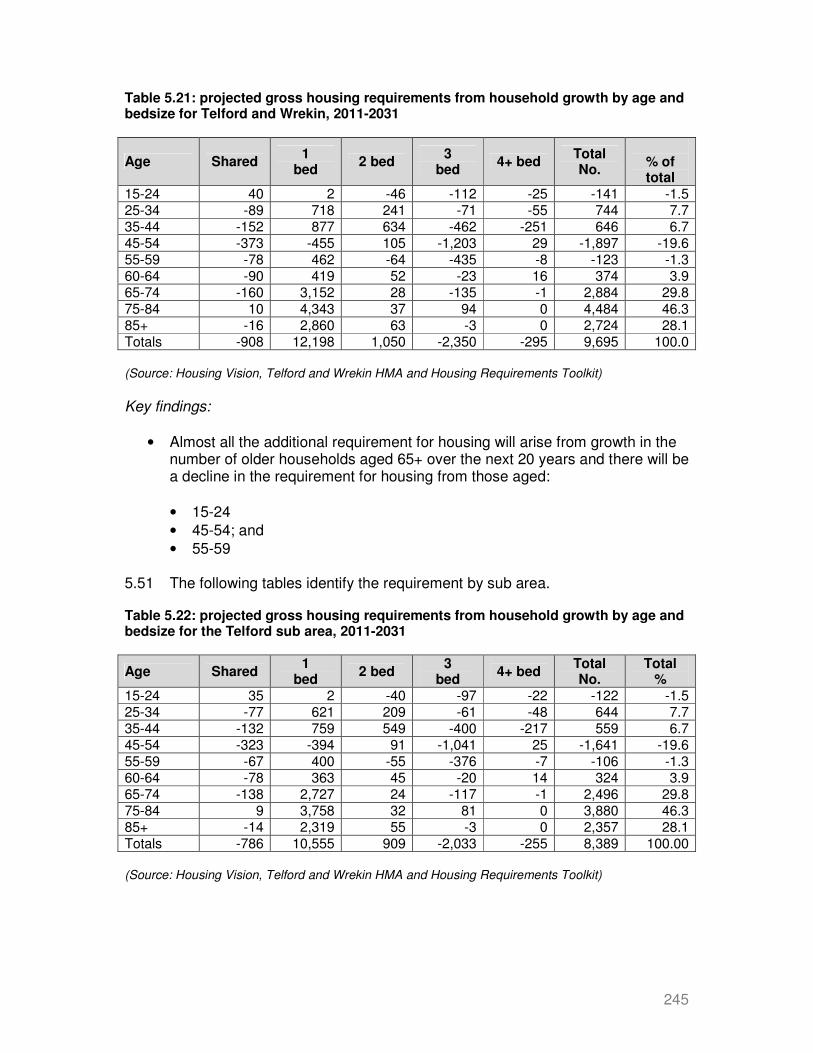
245
Table 5.21: projected gross housing requirements from household growth by age and bedsize for Telford and Wrekin, 2011-2031
Age Shared 1
bed 2 bed
3 bed
4+ bed Total No.
% of total
15-24 40 2 -46 -112 -25 -141 -1.5 25-34 -89 718 241 -71 -55 744 7.7 35-44 -152 877 634 -462 -251 646 6.7 45-54 -373 -455 105 -1,203 29 -1,897 -19.6 55-59 -78 462 -64 -435 -8 -123 -1.3 60-64 -90 419 52 -23 16 374 3.9 65-74 -160 3,152 28 -135 -1 2,884 29.8 75-84 10 4,343 37 94 0 4,484 46.3 85+ -16 2,860 63 -3 0 2,724 28.1 Totals -908 12,198 1,050 -2,350 -295 9,695 100.0 (Source: Housing Vision, Telford and Wrekin HMA and Housing Requirements Toolkit)
Key findings:
• Almost all the additional requirement for housing will arise from growth in the number of older households aged 65+ over the next 20 years and there will be a decline in the requirement for housing from those aged:
• 15-24
• 45-54; and
• 55-59 5.51 The following tables identify the requirement by sub area. Table 5.22: projected gross housing requirements from household growth by age and bedsize for the Telford sub area, 2011-2031
Age Shared 1
bed 2 bed
3 bed
4+ bed Total No.
Total %
15-24 35 2 -40 -97 -22 -122 -1.5 25-34 -77 621 209 -61 -48 644 7.7 35-44 -132 759 549 -400 -217 559 6.7 45-54 -323 -394 91 -1,041 25 -1,641 -19.6 55-59 -67 400 -55 -376 -7 -106 -1.3 60-64 -78 363 45 -20 14 324 3.9 65-74 -138 2,727 24 -117 -1 2,496 29.8 75-84 9 3,758 32 81 0 3,880 46.3 85+ -14 2,319 55 -3 0 2,357 28.1 Totals -786 10,555 909 -2,033 -255 8,389 100.00 (Source: Housing Vision, Telford and Wrekin HMA and Housing Requirements Toolkit)

246
Table 5.23: projected gross housing requirements from household growth by age and bedsize for the Newport sub area, 2011-2031
Age Shared 1
bed 2 bed
3 bed
4+ bed Total No.
Total %
15-24 3 0 -4 -9 -2 -11 -1.5 25-34 -7 55 18 -5 -4 57 7.7 35-44 -12 67 48 -35 -19 49 6.7 45-54 -28 -35 8 -92 2 -145 -19.6 55-59 -6 35 -5 -33 -1 -9 -1.3 60-64 -7 32 4 -2 1 29 3.9 65-74 -12 240 2 -10 0 220 29.8 75-84 1 331 3 7 0 342 46.3 85+ -1 204 5 0 0 208 28.1 Totals -69 931 80 -179 -23 740 100.0 (Source: Housing Vision, Telford and Wrekin HMA and Housing Requirements Toolkit)
Table 5.24: projected gross housing requirements from household growth by age and bedsize for the Rural sub area, 2011-2031
Age Shared 1
bed 2 bed
3 bed
4+ bed Total No.
Total %
15-24 2 0 -3 -7 -1 -8 -1.5 25-34 -5 42 14 -4 -3 43 7.7 35-44 -9 51 37 -27 -15 38 6.7
45-54 -22 -27 6 -70 2 -111 -19.6 55-59 -5 27 -4 -25 0 -7 -1.3
60-64 -5 24 3 -1 1 22 3.9 65-74 -9 184 2 -8 0 168 29.8
75-84 1 254 2 5 0 262 46.3 85+ -1 157 4 0 0 159 28.1 Totals -53 712 61 -137 -17 566 100.0 (Source: Housing Vision, Telford and Wrekin HMA and Housing Requirements Toolkit)
Projected net requirement for housing by tenure and bedsize, 2011-2031
5.52 This section takes into account both the requirement for replacement family
housing for older households not downsizing and the requirement for affordable housing from existing households over the period 2011-2016. The following tables provide the projected housing required by bedsize and tenure for the period 2011-2031.

247
Table 5.25: projected net housing requirements arising from household growth for Telford and Wrekin 2011-2031
Tenure Sector Affordability
Hierarchy Shared 1
bed 2 bed 3
bed 4+
bed Projected
requirement
Social Rent 38.8% 0 2,751 408 1,092 -115 4,136
Affordable Affordable Rent 1.67% 0 118 17 47 -5 177
Intermediate Shared Ownership 6.67% 0 471 70 187 -20 708
Private Rent 5.9% 0 417 62 165 -17 627
Market Owner Occupier 47.0% 0 3,328 493 1,321 -139 5,003
Total no. All sectors 100% 0 7,085 1050 2,812 -296 10,651
Total % All sectors 0.0 66.5 9.9 26.4 -2.8 100 (Source: Housing Vision, Telford and Wrekin HMA and Housing Requirements Toolkit)
Key findings:
• There is a net requirement for 10,651 additional dwellings in the Telford and Wrekin area between 2011 and 2031.
• In terms of the projected element to 2031, there is large growth (67%) in the requirement for 1 bed housing; 10% growth in the requirement for 2 bed; 26% growth in the requirement for 3 bed housing and a slight decline in the requirement for 4 bed housing. Please note that these projections are based on the application of a minimum bedsize requirement. In view of restrictions imposed on eligibility for Housing Benefit, it is likely that the requirement for 1 bed affordable housing will be limited to this bedsize but in the market sector, there is likely to be a preference by consumers and providers for an additional bedroom which, in terms of the greater flexibility achieved, should be encouraged. The 1 bed housing requirement also includes the designated, sheltered and extra-care housing for older people detailed at 6.13 below, some of which could also be offset against the 2 bed requirement.
5.53 The following table combines data from Table 5.10 detailing affordable
requirements by tenure from the existing population over the 5 year policy period to 2016 with data from Table 5.24 detailing requirements for all housing arising from projected household growth over the period 2011-2031.

248
Table 5.26: projected net housing requirements for Telford and Wrekin arising from the existing population, 2011-2016, and from household growth, 2011-2031
Tenure Sector 1
bed 2
bed 3
bed 4+
bed Total
requirement Affordability
Hierarchy
Social Rent 3,056 4,068 3,937 290 11,351 60.7 Affordable Affordable Rent 118 17 47 -5 177 0.9
Intermediate Shared Ownership 506 490 512 25 1,533 8.2
Private Rent 417 62 165 -17 627 3.4
Market Owner Occupier 3,328 493 1,321 -139 5,003 26.8
Total no. All sectors 7,425 5,130 5,982 154 18,691 100
Total % All sectors 39.7 27.4 32.0 0.8 100 (Source: Housing Vision, Telford and Wrekin HMA and Housing Requirements Toolkit)
Key findings:
• Taking account of both the requirement for affordable housing from the existing population between 2011 and 2016 and the requirements for all housing arising from projected household growth over the period 2011-2031, there is a net requirement for 18,691 additional dwellings in the Telford and Wrekin area between 2011 and 2031 (T 5.24: 10,651 + T5.8: 8,040).
• The largest requirement is for 1 and 3 bed properties (62%), and by tenure, the largest requirement is for affordable rented housing (62%).
5.54 The following table identifies the total annual requirement for affordable
housing over the 5 years 2011-2016, and combines data from Table 5.10 detailing affordable dwelling size requirements from the existing population with data from Table 5.24 identifying affordable dwelling size requirements arising from projected household growth.
Table 5.27: annual affordable housing net requirements arising from the existing population by dwelling size, 2011-2016
Backlog of affordable housing
need (from T5.9)
Projected affordable housing
need (T5.24)
Total annual affordable
housing need Beds Number Percentage Number Percentage Number Percentage 1 68 12 167 67 235 12.6 2 816 49 25 10 841 45.2
3 634 34 66 26 700 37.7 4 90 5 -7 -3 83 4.5 Totals 1,608 100% 251 100% 1,859 100%
Key findings
• Arising from a combination of the housing register backlog, need arising from the existing population and new need from household growth, the table demonstrates an annual requirement for 1,859 affordable dwellings between

249
2011 and 2016. The largest requirement over these 5 years is for 2 then 3 bedroomed housing (83%).
5.55 The following tables identify for each Sub Area the net requirement for
housing arising from household change and growth between 2011 and 2031 and then include the requirement for affordable housing from the existing population 2011-2016. Please note that due to rounding by tenure and bedsize, the sum of the Sub Area totals may differ slightly from the total for Telford and Wrekin.
Table 5.28: projected net housing requirements by tenure and bedsize arising from household growth for the Telford sub area, 2011-2031
Tenure Sector 1
bed 2
bed 3
bed 4+
bed Total No. Total
% Social Rent 2,305 342 915 -96 3,466 37.6
Affordable Affordable Rent 0 0 0 0 0 0.00
Intermediate Shared Ownership 535 79 212 -22 804 8.7 Private Rent 192 28 76 -8 288 3.1
Market Owner Occupier 3,099 459 1,230 -129 4,659 50.5
Total no. All sectors 6,131 908 2,433 -255 9,217 100.00 Total % All sectors 66.5 9.9 26.4 -2.8 100.00 (Source: Housing Vision, Telford and Wrekin HMA and Housing Requirements Toolkit)
Key findings:
• There is a projected requirement for 9,217 additional dwellings in the Telford sub area between 2011 and 2031.

250
Table 5.29: the projected net housing requirements by tenure and bedsize for the Telford sub area arising from the existing population, 2011-2016, and from household growth, 2011-2031
Tenure Sector 1
bed 2
bed 3
bed 4+
bed Total No. Total
% Social Rent 2,570 3,507 3,375 254 9,706 60.0
Affordable Affordable Rent 0 0 0 0 0 0.0
Intermediate Shared Ownership 565 444 492 18 1,519 9.4 Private Rent 192 28 76 -8 289 1.8
Market Owner Occupier 3,099 459 1,230 -129 4,659 28.8
Total no. All sectors 6,426 4,438 5,173 135 16,173 100.00 Total % All sectors 39.7 27.4 32.0 0.8 100.00 (Source: Housing Vision, Telford and Wrekin HMA and Housing Requirements Toolkit)
Key findings:
• There is a projected requirement for 16,173 additional dwellings in the Telford sub area between 2011 and 2031.
Table 5.30: projected net housing requirements by tenure and bedsize arising from household growth for the Newport sub area, 2011-2031
Tenure Sector 1
bed 2
bed 3
bed 4+
bed Total No.
Total %
Social Rent 182 27 76 -8 277 34.1 Affordable Affordable
Rent 28 4 12 -1 43 5.3
Intermediate Shared Ownership 9 1 4 0 14 1.7 Private Rent 56 8 23 -2 85 10.5
Market Owner Occupier 258 39 107 -11 393 48.4
Total no. All sectors 533 79 222 -22 812 Total % All sectors 65.6 9.7 27.3 -2.7 100.0 100.0 (Source: Housing Vision, Telford and Wrekin HMA and Housing Requirements Toolkit)
Key findings:
• There is a projected requirement for 812 additional dwellings in the Newport sub area between 2011 and 2031.

251
Table 5.31: the projected net housing requirements by tenure and bedsize for the Newport sub area arising from the existing population, 2011-2016, and from household growth, 2011-2031
Tenure Sector 1
bed 2
bed 3
bed 4+
bed Total No.
Total %
Social Rent 207 307 291 22 827 58.0
Affordable Affordable Rent 28 4 12 -1 43 3.0
Intermediate Shared Ownership 14 31 29 5 79 5.5 Private Rent 56 8 23 -2 85 6.0
Market Owner Occupier 258 39 107 -11 393 27.5
Total no. All sectors 563 389 462 13 1,427 Total % All sectors 39.5 27.3 32.4 0.9 100.0 100.0 (Source: Housing Vision, Telford and Wrekin HMA and Housing Requirements Toolkit)
Key findings:
• There is a projected requirement for 1,427 additional dwellings in the Newport sub area between 2011 and 2031.
Table 5.32: projected net housing requirements by tenure and bedsize from household growth for the Rural sub area, 2011-2031
Tenure Sector 1
bed 2
bed 3
bed 4+
bed Total No.
Total %
Social Rent 147 23 66 -6 230 37.5
Affordable Affordable Rent 7 1 3 0 11 1.8
Intermediate Shared Ownership 36 6 16 -2 56 9.1 Private Rent 23 3 10 -1 35 5.7
Market Owner Occupier 186 29 84 -18 281 45.8
Total no. All sectors 399 62 179 -27 613 Total % All sectors 65.1 10.1 29.2 -4.4 100.0 100.0 (Source: Housing Vision, Telford and Wrekin HMA and Housing Requirements Toolkit)
Key findings:
• There is a projected requirement for 613 additional dwellings in the Rural sub area between 2011 and 2031.

252
Table 5.33: the projected net housing requirements by tenure and bedsize for the Rural sub area arising from the existing population, 2011-2016, and from household growth, 2011-2031
Tenure Sector 1
bed 2
bed 3
bed 4+
bed Total No.
Total %
Social Rent 167 238 231 19 655 60.1
Affordable Affordable Rent 7 1 3 0 11 1.0
Intermediate Shared Ownership 36 31 36 4 107 9.8 Private Rent 23 3 10 -1 35 3.2
Market Owner Occupier 186 29 84 -18 281 25.8
Total no. All sectors 419 302 364 4 1,089 Total % All sectors 38.5 27.7 33.4 0.4 100.0 (Source: Housing Vision, Telford and Wrekin HMA and Housing Requirements Toolkit)
Key findings:
• There is a projected requirement for 1,089 additional dwellings in the Rural sub area between 2011 and 2031.
Projected net requirement for housing by age and bedsize, 2011-2031
5.56 The following tables identify the net housing requirement by age and bedsize from household change and growth over the next 20 years. It is not possible to provide this information for existing households requiring affordable housing over the 5 years 2011-2016. The pattern throughout is that the additional requirement for housing will arise from growth in the number of younger and especially households aged 65+
Table 5.34: projected net housing requirements from household growth by age and bedsize for Telford and Wrekin, 2011-2031
Age Shared 1
bed 2
bed 3
bed 4+
bed Total No.
% of total
15-24 0 42 -46 1,035 -25 1,006 9.4 25-34 0 718 241 1,119 -55 2,023 19.0
35-44 0 877 634 317 -251 1,577 14.8 45-54 0 -455 105 -1,203 29 -1,524 -14.3
55-59 0 462 -64 372 -8 762 7.2 60-64 0 419 52 1,217 16 1,704 16.3 65-74 0 1,553 28 -135 -1 1,445 13.6
75-84 0 2,150 37 94 0 2,281 21.4 85+ 0 1,320 63 -3 0 1,380 13.0
Totals -0 7,086 1,050 2,812 -295 10,653 100 (Source: Housing Vision, Telford and Wrekin HMA and Housing Requirements Toolkit)

253
Table 5.35: projected net housing requirements from household growth by age and bedsize for the Telford sub area, 2011-2031
Age Shared 1
bed 2
bed 3
bed 4+
bed Total No.
Total %
15-24 0 36 -40 895 -22 870 9.4 25-34 0 521 209 968 -48 1,750 19.0 35-44 0 759 549 274 -217 1,364 14.8 45-54 0 -394 91 -1,041 24 -1,319 -14.3 55-59 0 400 -55 322 -7 659 7.2 60-64 0 363 45 1,053 14 1,475 16.0 65-74 0 1,344 24 -117 -1 1,250 13.6 75-84 0 1,860 32 81 0 1,973 21.4 85+ 0 1,143 55 -3 0 1,194 13.0 Totals 0 6,131 909 2,433 -255 9,218 100.00 (Source: Housing Vision, Telford and Wrekin HMA and Housing Requirements Toolkit)
Table 5.36: projected net housing requirements from household growth by age and bedsize for the Newport sub area, 2011-2031
Age Shared 1
bed 2
bed 3
bed 4+
bed Total No.
Total %
15-24 0 3 -4 80 -2 78 9.6 25-34 0 55 18 87 -4 156 19.2 35-44 0 67 48 25 -19 121 14.9
45-54 0 -35 8 -92 2 -116 -14.3 55-59 0 35 -5 29 -1 59 7.3
60-64 0 32 4 95 1 132 16.2 65-74 0 116 2 -10 0 108 13.3
75-84 0 161 3 7 0 171 21.0 85+ 0 99 5 0 0 103 12.7 Totals 0 534 80 222 -23 813 100.0 (Source: Housing Vision, Telford and Wrekin HMA and Housing Requirements Toolkit)
Table 5.37: projected net housing requirements from household growth by age and bedsize for the Rural sub area, 2011-2031
Age Shared 1
bed 2
bed 3
bed 4+
bed Total No.
Total %
15-24 0 2 -3 64 -1 62 10.0 25-34 0 42 14 69 -3 122 19.6 35-44 0 51 37 22 -15 95 15.2 45-54 0 -27 6 -70 2 -89 -14.3 55-59 0 27 -4 24 0 47 7.6 60-64 0 24 3 75 1 103 16.6 65-74 0 86 2 -8 0 79 12.8 75-84 0 119 2 5 0 126 20.3 85+ 0 73 4 0 0 76 12.3 Totals 0 398 61 180 -17 622 100.0 (Source: Housing Vision, Telford and Wrekin HMA and Housing Requirements Toolkit)

254
Housing requirements identified by adjacent SHMAs 5.57 The following table takes account of the housing requirements identified by
neighbouring SHMAs and from output from the Marches LEP, records their date of completion; the broad approach adopted; the projected housing requirements identified and any references or implications for Telford and Wrekin. The C3 SHMA which included Telford and Wrekin recognised that the area had additional capacity to deliver targets for the wider C3 HMA area (pp 56-58). However, the only SHMA that makes any reference to having problems in its ability to deliver is South Staffordshire (p. 170) although there is no mention of looking across boundaries in order to achieve targets.

255
Table 5.38: housing requirements identified by adjacent SHMAs
Location Title Author/Date
of completion
Broad approach/
method
Projected housing requirements for the area
References to/implications for Telford
Marches Poised for Growth: Our High-level Housing and Planning Statement
Marches LEP (undated)
High level strategy document
Refers to Shropshire’s planning vision to build 27,500 dwellings by 2026 of which 9,000 are to be affordable. Refers to Herefordshire’s plans to deliver 16,500 new dwellings over a 20-year period with the objective of ensuring young and working age people are retained and attracted to the area. Reference to Telford’s plans does not include any housing figures/targets
None
Shropshire Shropshire Local Housing Market Assessment
Shropshire Council (July 2010)
Secondary data, produced in-house by the Council. Some estate agent interviews (2009)
Predicted population growth from 289,274 to 329,606 (2006-26). Migration is cited as the predominant factor in Shropshire’s population growth (but no further detail is given). 2006 projections show a forecast increase in the number of households as 24% (28,974 households from
The Shropshire LHMA is entirely focused on Shropshire and does not include any references to Telford including migration. Barring the housing needs calculations in section D, it is a descriptive rather than critical/analytical document.

256
Location Title Author/Date of
completion
Broad approach/
method
Projected housing requirements for the area
References to/implications for Telford
increased population, and 514 additional households arising from the decline in average size of household). It is estimated that 50% of newly arising households will require affordable (rented) housing, 25% can afford intermediate ownership, and a further 25% can afford open market housing.
South Staffordshire
South Staffordshire District Council Strategic Housing Market Assessment
DCA (2012)
Primary – postal survey of 9,447 households Secondary data analysis Stakeholder engagement
Predicted increase in population of 7,500, 7% 2010-35. Most significant increase is >65s, up 60.3% (13,800). Projected increase of 5,000 households by 2033 (from 2008), which is 10.4% Market housing requirements in ‘next 3 years’ = 2,058 existing and 1,291 concealed households. Preference is mainly for owner occupation; concealed households mainly seeking 2B
Telford is not a significant destination work for South Staffordshire residents.

257
Location Title Author/Date of
completion
Broad approach/
method
Projected housing requirements for the area
References to/implications for Telford
flats. For balancing housing markets, 60% 1/2B, 40% 3 and 4+ houses. Affordable housing requirements in ‘next 3 years’ = 926 existing and 644 concealed households. Equates to 338 units per year over 5 years. Need is mainly for bungalows (for existing households), and flats (concealed households). For balancing housing markets, 70% 1/2B, 30% larger family dwellings. For intermediate (50%):
• 25% 1 bed
• 70% 2 bed
• 5% 3 bed Stafford Stafford
Borough 2012 Strategic Housing Market Assessment
Arc4 (September 2012)
Almost entirely secondary data analysis. ‘Interviews with stakeholders’
CLG 2010-based population project of 146,000 by 2035 (11.6% increase) Number and proportion of older people will increase significantly:
A low 1.6% of Stafford residents travel to work in Telford and Wrekin Just under 300 households moved to Telford and Wrekin from Stafford Just over 300 couple households with
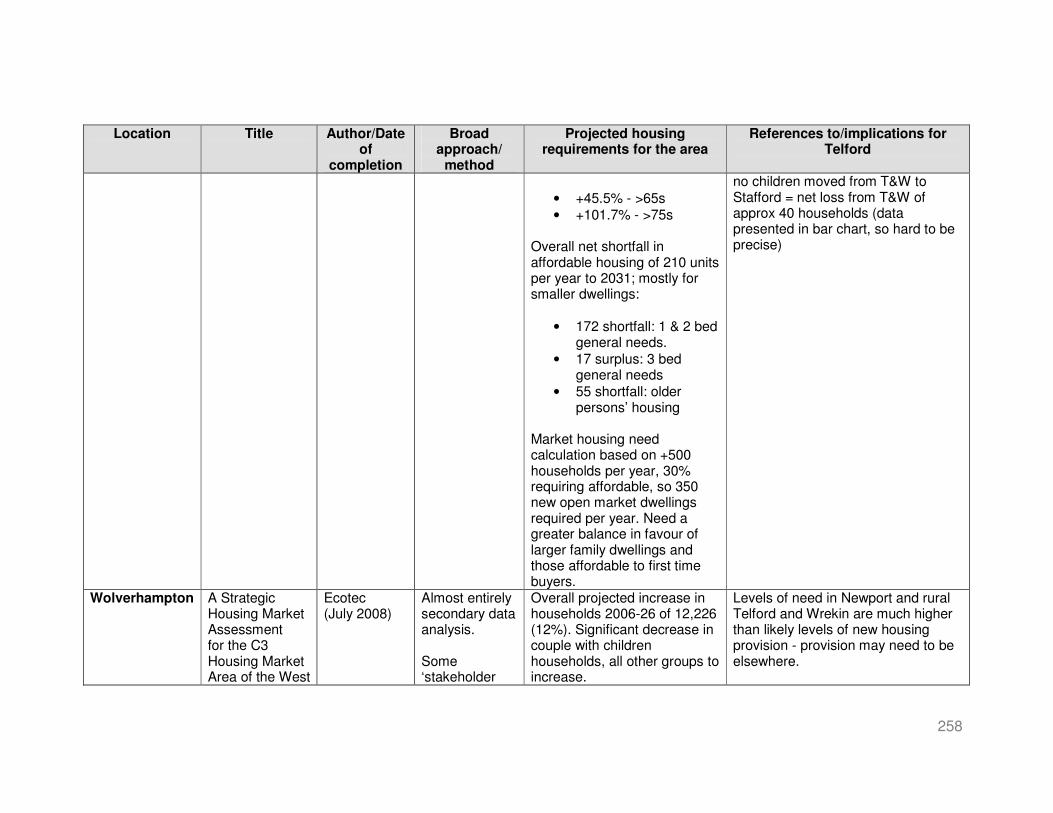
258
Location Title Author/Date of
completion
Broad approach/
method
Projected housing requirements for the area
References to/implications for Telford
• +45.5% - >65s
• +101.7% - >75s Overall net shortfall in affordable housing of 210 units per year to 2031; mostly for smaller dwellings:
• 172 shortfall: 1 & 2 bed general needs.
• 17 surplus: 3 bed general needs
• 55 shortfall: older persons’ housing
Market housing need calculation based on +500 households per year, 30% requiring affordable, so 350 new open market dwellings required per year. Need a greater balance in favour of larger family dwellings and those affordable to first time buyers.
no children moved from T&W to Stafford = net loss from T&W of approx 40 households (data presented in bar chart, so hard to be precise)
Wolverhampton A Strategic Housing Market Assessment for the C3 Housing Market Area of the West
Ecotec (July 2008)
Almost entirely secondary data analysis. Some ‘stakeholder
Overall projected increase in households 2006-26 of 12,226 (12%). Significant decrease in couple with children households, all other groups to increase.
Levels of need in Newport and rural Telford and Wrekin are much higher than likely levels of new housing provision - provision may need to be elsewhere.

259
Location Title Author/Date of
completion
Broad approach/
method
Projected housing requirements for the area
References to/implications for Telford
Midlands engagement’ with developers
Annual affordable net housing need = 621 units:
• 316 surplus 1-2 bed flats
• 89 shortfall 2 bed houses
• 606 shortfall 3 bed houses
• 242 shortfall 4+ bed houses
Market housing (PRS/OO) requirements = 709 units, i.e. newly forming households:
• 195 single person
• 230 couple with no children
• 268 couple with children
• 16 lone parent Undersupply of >£200k houses. Oversupply of <£150k houses
Telford and Wrekin has C3’s largest projected % increase in household numbers 2006-26, at 24% Land capacity for new builds is greatest in C3 in Telford and Wrekin (1,700 units). As at 2001, migration between Wolverhampton and Telford: 135 moved from Telford and Wrekin to Wolverhampton. 343 moved from Wolverhampton to Telford and Wrekin = net gain to Telford and Wrekin of 208 households. 2% of Wolverhampton’s residents travelled to Telford and Wrekin for work

260
5.58 Of the SHMAs and other relevant output reviewed, only Wolverhampton within
the C3 SHMA makes direct connections, appearing to regard Telford as a key employment centre for its residents and vice versa but no detail is provided on which types of employees and where they move to in Telford and Wrekin. Determining special housing requirements
5.59 This section reviews special housing requirements for a range of needs
groups. However, it has been constrained by the lack of detailed evidence and by relevant research and strategies being completed several years ago (typically between 2005 and 2010. Furthermore, most of the information available is descriptive and/or backward-looking rather than analytical and forward-looking. The housing requirements of older households
5.60 In view of the significance of the projected growth in older households, the
Toolkit enables projections to be made of the numbers of pensioner households requiring designated, sheltered or extra-care housing. Following extensive research undertaken by Housing Vision, these have been calculated using the following methodology:
• Stage 1: Needs Groups established within the wider older person’s population;
• Stage 2: Need adjusted according to local conditions;
• Stage 3: housing options linked to Needs Groups;
• Stage 4: estimate of the proportion within each Needs Group that in any one year is likely to want to make use of these different options; and
• Stage 5: the need for housing translated into the number of units of service required.
5.61 The requirement for 3 types of specialised housing has been determined:
• Designated: housing, such as private sector retirement apartments, which includes the following features:
• fully adapted accommodation;
• integrated alarm with staff response when required;
• facilitation of mutual support; and
• opportunities for social activities.
• Sheltered or Supported: as Designated Housing above but providing personal support to residents as required;

261
• Extra Care: housing which crosses the boundary between high-level support needs and high-level care needs, with a larger proportion in the latter category.
5.62 The following table summarises the specialised housing required for older
people between 2011 and 2031 and the number of under-occupying pensioner households. Please note that this table is a sub-set of the overall housing requirements above. Whilst providers may decide to provide larger accommodation, all of this housing meets a minimum 1 bed requirement.
Table 5.39: projected specialised housing requirements of older households for Telford and Wrekin, 2011-2031
65+ Households
65+ totals Designated Sheltered
Extra Care (75+)
Specialised Total
Under-occupying (56.37%)
2011 16,928 1,065 508 416 1,989 9,542 2031 27,020 1,700 811 813 3,324 15,231
Increase 10,092 635 303 396 1,334 5,689 (Source: Housing Vision, Telford and Wrekin HMA and Housing Requirements Toolkit)
• Based on an estimated current requirement for 1,989 specialised units of accommodation Telford and Wrekin, there is a projected requirement for 1,334 additional units to be provided between 2011 and 2031 including 396 Extra Care housing units for 75+ households from a current requirement of 416.
Table 5.40: projected specialised housing requirements of older households for the Telford sub area, 2011-2031
65+ Households
65+ totals Designated Sheltered
Extra Care (75+)
Specialised Total
Under-occupying (56.37%)
2011 14,648 921 439 360 1,720 8,257 2031 23,380 1,471 701 703 2,875 13,180 Increase 8,733 549 262 343 1,154 4,923 (Source: Housing Vision, Telford and Wrekin HMA and Housing Requirements Toolkit)
• Based on an estimated current requirement for 1,720 specialised units of accommodation in the Telford sub area, there is a projected requirement for 1,154 additional units to be provided between 2011 and 2031 including 343 Extra Care housing units for 75+ households from a current requirement of 360.

262
Table 5.41: projected specialised housing requirements of older households for the Newport sub area, 2011-2031
65+ Households
65+ totals Designated Sheltered
Extra Care (75+)
Specialised Total
Under-occupying (57.37%)
2011 1,292 81 39 32 152 741 2031 2,062 130 62 62 254 1,183 Increase 770 49 23 30 102 442 (Source: Housing Vision, Telford and Wrekin HMA and Housing Requirements Toolkit)
• Based on an estimated current requirement for 152 specialised units of accommodation the Newport sub area, there is a projected requirement for 102 additional units to be provided between 2011 and 2031 including 30 Extra Care housing units for 75+ households from a current requirement of 39.
Table 5.42: projected specialised housing requirements of older households for the Rural sub area, 2011-2031
65+ Households
65+ totals Designated Sheltered
Extra Care (75+)
Specialised Total
Under-occupying (59.37%)
2011 989 62 30 24 116 587
2031 1,578 99 47 47 193 937 Increase 589 37 18 23 78 350 (Source: Housing Vision, Telford and Wrekin HMA and Housing Requirements Toolkit)
• Based on an estimated current requirement for 116 specialised units of accommodation the Rural sub area, there is a projected requirement for 78 additional units to be provided between 2011 and 2031 including 23 Extra Care housing units for 75+ households from a current requirement of 24.
Black and minority ethnic groups
5.63 The report, ‘Telford and Wrekin Population Estimates and Projections 2011’,
shows that the local black and minority ethnic (BME) population is projected to have grown by some 6,700 people from 15,200 to 21,800 by 2026, an increase of around 43%. In overall terms BME groups will account for 11.1% of the total population by 2026, which is an increase from 8.9% in 2010. Within this, the Bangladeshi community is projected to grow the fastest with an increase of 130% between 2010 and 2026, growing from a small base of 300 to 700. The Indian community will remain the largest single BME group growing from 2.1% to 2.7% of the Borough’s population, an increase of 1,700 people.
Gypsies and travellers 5.64 The Gypsy and Traveller Accommodation Assessment (Centre for Urban and
Regional Studies [CURS], 2007) covers Shropshire, Telford and Wrekin,

263
Herefordshire and Powys. The study estimated that Telford and Wrekin would require 24 residential pitches and 5 transit site plots in the period 2007-12, and a further 10 residential pitches in the period 2012-17. Across the study area, it was reported that future site provision should include as much variety as possible in terms of types of location, site design and facilities, tenure and management, and that a range of options should be developed including small family sites and socially rented sites. It has not been possible to determine the number of pitches and plots completed.
5.65 The age profile of the Gypsy and Traveller population was found to be
relatively youthful: 44% of all survey household members were aged up to 16; and, only 6% were 60 or over. Average household size was 3.5 people. About a fifth of respondents to the survey expected to move within the next 5 years, with most wanting to stay in the area. Almost two-thirds of respondents travel at some point within a year with a caravan or trailer. Travelling seems to be decreasing, but a fifth thought that they might travel more in future.
People with learning disabilities 5.66 None of the sources consulted quantify the need for housing for people with
learning disabilities. In ‘Getting a better life for adults with a learning disability’, Telford and Wrekin’s Adults with Learning Disabilities (ALD) Strategy for 2008-11 (published in 2009), there is stated to be no single source of robust information. However, the Chartered Institute of Public Finance and Accountancy (CIPFA) and Department of Health returns for 2005/06 indicate that 7,000 adults with learning disabilities are living in Telford and Wrekin. The strategy regards this as an high/over-estimate. Care First data from Telford and Wrekin Council identified 443 adults allocated to the Joint Community learning disabilities team, which includes some who are in out of area placements. The Primary Care Trust’s (PCT) estimates were that around 1,600-3,300 people with mild learning disabilities and 500-650 with severe learning disabilities live in the area.
5.67 The Telford and Wrekin 2007 State of the Borough Report states that, as at
February 2005, 1% of Telford and Wrekin’s working age population received Disability Living Allowance (DLA), representing an increase of 0.32% over five years. It also reports that the number of people with learning disabilities accessing services could increased by up to circa 100 people in the period 2008-12, comprising 67 young people, 32 older people, and 5 returners from out of area. The 67 young people are likely to need accommodation not at home (18 people), a residential placement (5 people), out of area specialist college/residential (10 people), and respite (42 people). The 32 older people are currently living with elderly family carers, and are sometimes themselves a care provider to these relatives. The State of the Borough Report identifies that there is a low take-up of housing tenancies from adults with learning disabilities, and a lack of robust information to inform planning for future services including housing and accommodation.
5.68 The 2009 Shropshire Joint Strategic Needs Assessment (JSNA) reports that
local Quality and Outcomes Framework (QoF) data for 2007-08 shows that

264
0.3% of the Shropshire population have a learning disability according to GP practice registers, but this is likely to only include those with moderate to profound learning disabilities. The JSNA also outlines how the number of adults with learning disabilities using social services increased by 15% from 2001 to 2004, and this was larger than the 11% increase in all people over 18 using social services. Within this, the number of people with learning disabilities aged over 65 increased by 31%.
5.69 Between 1997 and 2004, there was an increase of 35% in adults with learning
disabilities living in residential and nursing homes and an increase of 172% in adults with learning disabilities living in residential and nursing care. Care First information in the JSNA shows that, in 2008-09, 1,282 people recorded as receiving services for LD, and that the 35-44 age group has the highest proportion of people in it. In 2007-08, just under 4 in every 1,000 people are people with a learning disability who the Council (Shropshire) helps to live at home.
People with mental health problems 5.70 The Telford and Wrekin Strategy for Adult Mental Health Services (2005)
reports that there is a need for new or remodelled services, which includes some that are housing-related: supported housing; crisis accommodation; and, respite accommodation. At the time of the report, there was an identified need for an additional 3 crisis flats, 14 flats for housing with medium support, 1 respite unit, and 30 independent dwellings with low support. It has not been possible to identify whether or not this provision has been made.
5.71 The Telford and Wrekin ‘facts and figures’ web pages (a part of the JSNA
process – there is no single JSNA document for the Borough) does not contain any information on the demographic projections or housing requirements of people with mental health problems.

265
6. Conclusions and Recommendations
Introduction 6.1 This section identifies the key issues facing the housing market in Telford and
Wrekin and the responses appropriate to meeting them.
Issues and problems The housing ‘offer’ 6.2 All housing systems and housing markets are the product of their history and
as a result, each is distinct in its own right. In the case of Telford and Wrekin, the development of the new town might be expected to have created a legacy of large proportions of public and family housing. Whilst this is the case in relation to the disproportionate size of the family housing sector, the impact of right to buy and the development of other sectors has, with some exceptions, evened out the tenure balance. Whilst the area has a good housing offer overall, choice within each tenure is less balanced, the social and private sectors providing more choice for smaller households with families having greater choice in the home ownership sector. Whilst the requirement for smaller housing is very likely to increase, families with children are clearly at a disadvantage in the affordable sector, and consideration needs to be given to encouraging family supply in the private and social rented sectors and encouraging more smaller homes in the home ownership sector. The weakness of this strategy however, is that smaller homes have clearly proved attractive to private landlords and, unless access to home ownership improves, there is nothing to stop new smaller homes going the same way.
6.3 The analysis would suggest that new build completions over recent years
have favoured larger family houses for sale, in particular 4 bedroom houses, whilst the findings from data analysis conducted as part of this SHMA reveals relatively low demand for this type and size of property. In the current economic climate, with developers struggling to achieve viability on new housing sites, it is essential that the findings from this SHMA are shared across relevant Council services and also with developers and landowners, to ensure that new housing developments provide an appropriate mix of housing to meet demand.
6.4 However, the need and demand for family housing is acute in the affordable
rented sector and this priority should be reflected in new supply and by encouraging provision by private landlords.
The impact of recent international migration on the housing market 6.5 In common with locations throughout the country, Telford and Wrekin have
experienced significant levels of migration from EU Accession countries in central and eastern Europe, and especially from Poland. The impact on the housing market is unclear, as is the profile of recent migrant communities. It is likely that the strongest demand, from predominantly single people and
266
couples, would be on smaller homes in the private rented sector, a requirement which it is well equipped to meet. But as migrants settle, form stable relationships and build or re-build families, the profile of demand is likely to change towards family housing, which is likely to increase demand for housing which is limited in the social and private rented sectors.
A polarised housing market 6.6 It is common to find problems of affordability in almost all locations but this is
much less the case in Telford and Wrekin for those in receipt of average incomes or above. This can be seen in the analysis of deprivation, which shows that no small areas within Telford and Wrekin are within the top quintile most deprived in terms of access to owner occupation for those aged under 35. However, for those in receipt of lower quartile earnings, the picture is very different and affordability problems are acute. There is a great deal of evidence, from direct and proxy sources, of a polarisation of incomes in Telford and Wrekin, and in the context of limited supply in the social and private rented sectors, problems of access to affordable housing are especially like to impact on families with children. It is noticeable that demand for 3 bed social rented housing is especially strong. Population loss through internal migration
6.7 Telford and Wrekin has lost population through internal migration over most of
the period 2001 and 2011, amounting to 3,600 people, an annual average of 360 people or the equivalent of c.190 households per year. The majority of internal and cross-regional migration has taken place within the West Midlands, but there have been net losses to the North West and South West in recent years. The limited data by age identifies that the main losses are likely to include families with younger children and those leaving for educational or employment opportunities. On one level, this can be beneficial if it reduces pressure on the housing market, but on another, such migrants may represent a loss to the area. More research needs to be undertaken to understand the social and economic impact of such a trend. The growth in the older population
6.8 The greatest challenge facing the housing market arises from the dramatic
increase in the size of the older population and in the number of older households which have a number of related implications:
1. Most older households already live in the area in family housing but, as
health and mobility are impaired with age, many older people will find that their homes and/or their location are increasingly unsuitable. This creates the dilemma for many older people of either staying put and being supported in their existing homes - which is the principle informing heath and social care - or moving to a more suitable or suitably located home including downsizing.

267
2. The decision to stay or move will be determined by a combination of personal choice and the viability and practicality of providing home-based care and support, especially in dispersed rural areas. However, if older households do not move and downsize, a growing number of older households will under-occupy existing housing and this will have the effect of ‘home blocking’ family housing. In such a situation, replacement family housing will be required to ensure that the current supply of this type is maintained.
3. If housing more suitable to meeting the requirements of older
households is provided, it will have to be of the right type and quality in the right locations, for example providing 2 bedroomed bungalows in villages. This may create a dilemma in terms of acceptability to communities and there is also a need to market test the acceptability of such options in Telford and Wrekin by consultation with elected members, town and parish councils, representative and lobbying bodies for older people and with affordable and market sector providers.
4. There will also be a requirement for an expansion in housing which
provides support and/or care including designated, sheltered and extra-care housing, the detail of which has been provided in the previous chapter.
Interventions
Increasing supply
Providing family housing
6.9 Families are at a disadvantage in the market for affordable housing and it is
essential that supply to them is increased. Wrekin Housing Trust’s ‘Choose Your Home’ choice based lettings data, which is likely to be an underestimate, indicates a demand ratio of 199 for every 2 bed house; 182 for each 3 bed and 166 for every 4 bed house advertised.
Providing housing suitable for older households
6.10 Housing will need to be provided to meet the changing requirements of older
households; to meet their growing support and care needs and to encourage downsizing. This is a priority for the area and will require the construction of substantial numbers of suitable homes. New housing should ideally be mixed tenure so that all older people have more opportunities to meet their housing requirements and aspirations. Mixing the tenures on a site also enables cross-subsidy to provide social rented homes. Consideration should therefore be given to mixed tenure retirement communities providing housing capable of meeting the widest range of support and care need.
6.11 Good standard, accessible two bedroom accommodation offers a sustainable
housing solution as it provides housing options for people across a broad age

268
range and demand will not be an issue as the older population decreases in the long term. Working with the private rented sector
6.12 There are positive and negative sides to the expansion of the private rented
sector. It has increased the supply of affordable rented housing but it may also have had the impact of reducing the supply of financially accessible homes for first time buyers. Consultation with local agents supports the view that it is likely that the private rented sector will continue to grow. However, the private rented sector has and will continue to have a major role in the supply of housing, and especially affordable housing. Close co-operation with landlords is essential in securing and steering the pattern of supply and existing landlord liaison could form the basis for developing a more strategic approach to investment by client group and location. This is particularly necessary for families with children and younger single people where there is a need to develop suitable shared accommodation options, to monitor supply and to reassess attitudes towards tenants in receipt of Housing Benefit. The alternative might be an increase in poorly managed, poor condition, houses in multiple occupation.
Measures to increase supply from the existing stock
6.13 Under-occupation and overcrowding are 2 sides of the same coin, a reduction
in under-occupation may have the effect of tackling overcrowding by increasing the supply of family homes. The district is currently included in three initiatives to increase supply from the existing stock:
The requirement for further research and intelligence
6.14 The following priorities have been identified:
1. Understanding the relationship between economic growth and housing requirements
6.15 Telford and Wrekin is a Growth Area but lacks evidence of the
interrelationship between economic and residential development. Consequently, there is a need to explore and quantify the relationship between economic growth, employment implications and housing requirements.
2. Monitoring population loss arising from internal migration and
assessing its impact
6.16 Related to the previous priority, further analysis is required of patterns of internal migration in relation to Telford and Wrekin; of the social and economic impact of population loss; the reasons behind it; its impact on the housing market and measures which might be taken to counter this trend.

269
3. Understanding the extent to which Telford’s sub-markets might be internally differentiated
6.18 The SHMA has confirmed the validity of the existing Telford, Newport and
Rural Sub Areas but there is no evidence supporting further internal differentiation. Area-based analysis of ‘Choose Your Home’ choice-based lettings data might identify whether further differentiation is meaningful. Analysis of 2011 Census OAC data might contribute to this analysis and help to identify housing consumer groups in the area’s housing market.
4. Monitoring the performance of the private rented sector
6.17 Further analysis is required of the performance of this sector, in particular:
• the stability of the sector in terms of size and range of properties, and the associated security it can offer to tenants; and
• the extent to which the sector is self-contained in terms of sales to landlords or whether homes are moving in and out of the sector.
5. Assessing the impact of housing and welfare reforms
6.18 It is essential that detailed analysis and continual monitoring is undertaken of
the current and proposed changes. 6. Monitoring and review
6.19 Whilst housing strategy and planning policy officers will already be monitoring
a number of indicators, it is essential to:
• begin to monitor changes in the number of households using, for example, Council Tax data and/or housing completions;
• monitor the changing need for affordable housing reflected through housing register data by priority band and lettings (both including and excluding internal transfers) for the districts a whole and by Sub Area;
• research the extent of downsizing, the types of housing which older people are buying - both existing and new residents - and the housing which will encourage downsizing;
• research the current and future housing requirements of minority ethnic communities, include recent migrants from central and eastern Europe, and their impact on the housing market; and
• research the requirements of key special needs groups especially those with disabilities, learning difficulties and mental health problems.
6.20 Appendix 3 provides a review of sources enabling the Assessment to be updated.
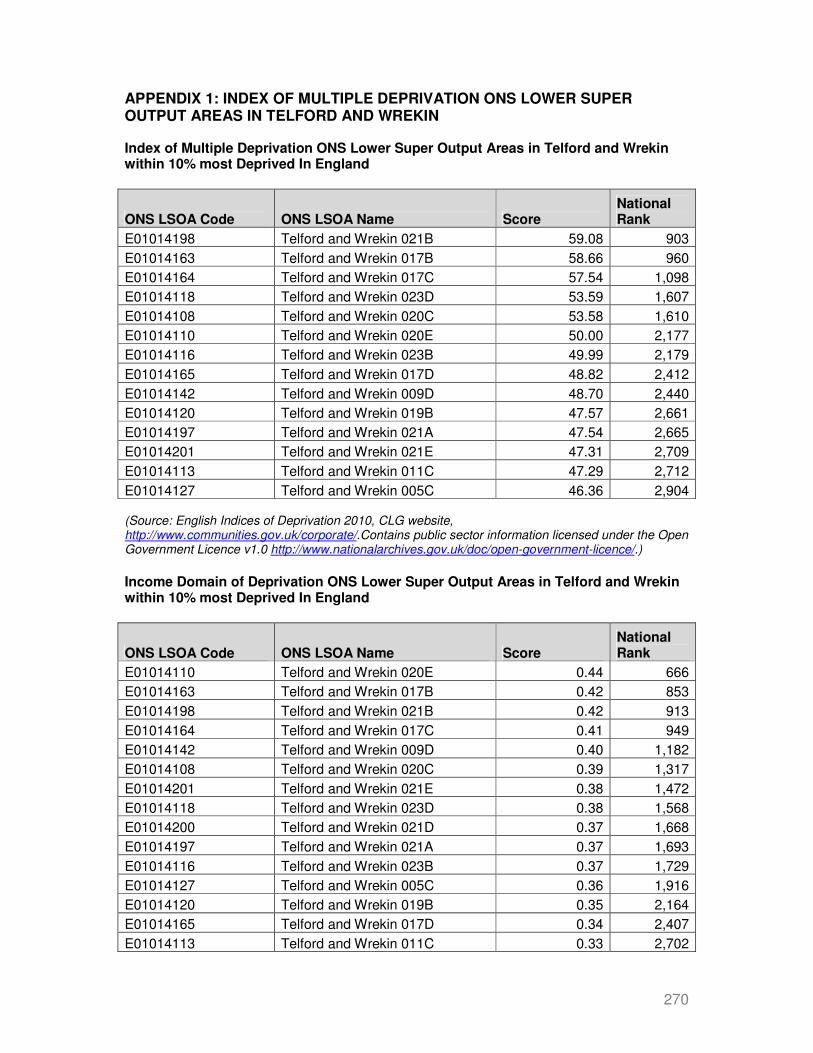
270
APPENDIX 1: INDEX OF MULTIPLE DEPRIVATION ONS LOWER SUPER OUTPUT AREAS IN TELFORD AND WREKIN Index of Multiple Deprivation ONS Lower Super Output Areas in Telford and Wrekin within 10% most Deprived In England
ONS LSOA Code ONS LSOA Name Score National Rank
E01014198 Telford and Wrekin 021B 59.08 903
E01014163 Telford and Wrekin 017B 58.66 960
E01014164 Telford and Wrekin 017C 57.54 1,098
E01014118 Telford and Wrekin 023D 53.59 1,607
E01014108 Telford and Wrekin 020C 53.58 1,610
E01014110 Telford and Wrekin 020E 50.00 2,177
E01014116 Telford and Wrekin 023B 49.99 2,179
E01014165 Telford and Wrekin 017D 48.82 2,412
E01014142 Telford and Wrekin 009D 48.70 2,440
E01014120 Telford and Wrekin 019B 47.57 2,661
E01014197 Telford and Wrekin 021A 47.54 2,665
E01014201 Telford and Wrekin 021E 47.31 2,709
E01014113 Telford and Wrekin 011C 47.29 2,712
E01014127 Telford and Wrekin 005C 46.36 2,904 (Source: English Indices of Deprivation 2010, CLG website, http://www.communities.gov.uk/corporate/.Contains public sector information licensed under the Open Government Licence v1.0 http://www.nationalarchives.gov.uk/doc/open-government-licence/.)
Income Domain of Deprivation ONS Lower Super Output Areas in Telford and Wrekin within 10% most Deprived In England
ONS LSOA Code ONS LSOA Name Score National Rank
E01014110 Telford and Wrekin 020E 0.44 666
E01014163 Telford and Wrekin 017B 0.42 853
E01014198 Telford and Wrekin 021B 0.42 913
E01014164 Telford and Wrekin 017C 0.41 949
E01014142 Telford and Wrekin 009D 0.40 1,182
E01014108 Telford and Wrekin 020C 0.39 1,317
E01014201 Telford and Wrekin 021E 0.38 1,472
E01014118 Telford and Wrekin 023D 0.38 1,568
E01014200 Telford and Wrekin 021D 0.37 1,668
E01014197 Telford and Wrekin 021A 0.37 1,693
E01014116 Telford and Wrekin 023B 0.37 1,729
E01014127 Telford and Wrekin 005C 0.36 1,916
E01014120 Telford and Wrekin 019B 0.35 2,164
E01014165 Telford and Wrekin 017D 0.34 2,407
E01014113 Telford and Wrekin 011C 0.33 2,702
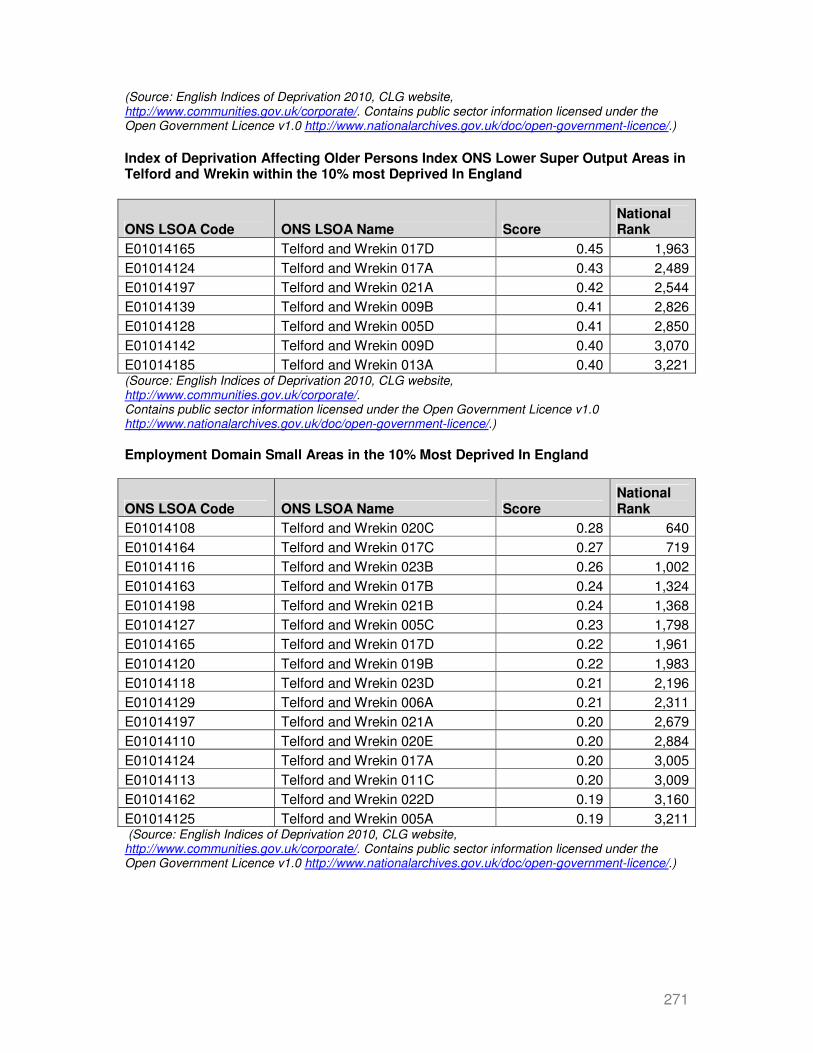
271
(Source: English Indices of Deprivation 2010, CLG website, http://www.communities.gov.uk/corporate/. Contains public sector information licensed under the Open Government Licence v1.0 http://www.nationalarchives.gov.uk/doc/open-government-licence/.)
Index of Deprivation Affecting Older Persons Index ONS Lower Super Output Areas in Telford and Wrekin within the 10% most Deprived In England
ONS LSOA Code ONS LSOA Name Score National Rank
E01014165 Telford and Wrekin 017D 0.45 1,963
E01014124 Telford and Wrekin 017A 0.43 2,489
E01014197 Telford and Wrekin 021A 0.42 2,544
E01014139 Telford and Wrekin 009B 0.41 2,826
E01014128 Telford and Wrekin 005D 0.41 2,850
E01014142 Telford and Wrekin 009D 0.40 3,070
E01014185 Telford and Wrekin 013A 0.40 3,221 (Source: English Indices of Deprivation 2010, CLG website, http://www.communities.gov.uk/corporate/. Contains public sector information licensed under the Open Government Licence v1.0 http://www.nationalarchives.gov.uk/doc/open-government-licence/.)
Employment Domain Small Areas in the 10% Most Deprived In England
ONS LSOA Code ONS LSOA Name Score National Rank
E01014108 Telford and Wrekin 020C 0.28 640
E01014164 Telford and Wrekin 017C 0.27 719
E01014116 Telford and Wrekin 023B 0.26 1,002
E01014163 Telford and Wrekin 017B 0.24 1,324
E01014198 Telford and Wrekin 021B 0.24 1,368
E01014127 Telford and Wrekin 005C 0.23 1,798
E01014165 Telford and Wrekin 017D 0.22 1,961
E01014120 Telford and Wrekin 019B 0.22 1,983
E01014118 Telford and Wrekin 023D 0.21 2,196
E01014129 Telford and Wrekin 006A 0.21 2,311
E01014197 Telford and Wrekin 021A 0.20 2,679
E01014110 Telford and Wrekin 020E 0.20 2,884
E01014124 Telford and Wrekin 017A 0.20 3,005
E01014113 Telford and Wrekin 011C 0.20 3,009
E01014162 Telford and Wrekin 022D 0.19 3,160
E01014125 Telford and Wrekin 005A 0.19 3,211 (Source: English Indices of Deprivation 2010, CLG website, http://www.communities.gov.uk/corporate/. Contains public sector information licensed under the Open Government Licence v1.0 http://www.nationalarchives.gov.uk/doc/open-government-licence/.)

272
Health and Disability Deprivation Domain
ONS LSOA Code ONS LSOA Name Score National Rank
E01014163 Telford and Wrekin 017B 1.38 1,866
E01014129 Telford and Wrekin 006A 1.30 2,230
E01014116 Telford and Wrekin 023B 1.16 3,060
E01014164 Telford and Wrekin 017C 1.14 3,158
(Source: English Indices of Deprivation 2010, CLG website, http://www.communities.gov.uk/corporate/. Contains public sector information licensed under the Open Government Licence v1.0 http://www.nationalarchives.gov.uk/doc/open-government-licence/.)
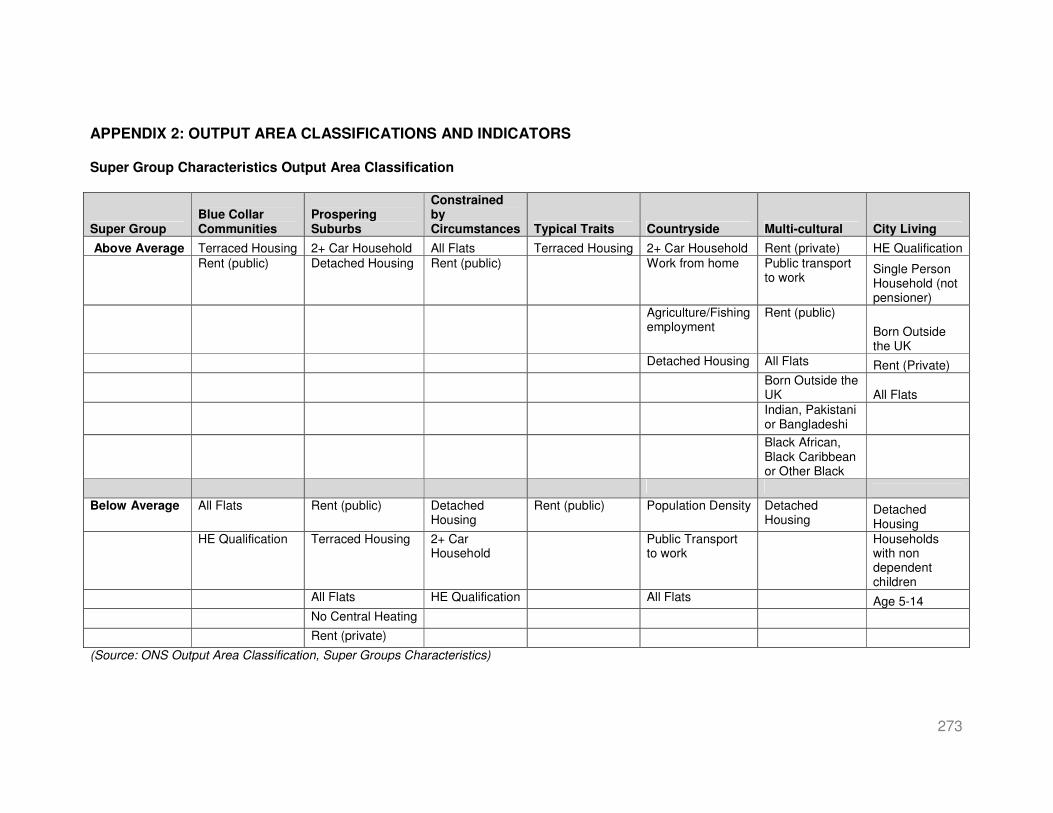
273
APPENDIX 2: OUTPUT AREA CLASSIFICATIONS AND INDICATORS Super Group Characteristics Output Area Classification
Super Group Blue Collar Communities
Prospering Suburbs
Constrained by Circumstances Typical Traits Countryside Multi-cultural City Living
Above Average Terraced Housing 2+ Car Household All Flats Terraced Housing 2+ Car Household Rent (private) HE Qualification
Rent (public) Detached Housing Rent (public) Work from home Public transport to work
Single Person Household (not pensioner)
Agriculture/Fishing employment
Rent (public)
Born Outside the UK
Detached Housing All Flats Rent (Private)
Born Outside the UK All Flats
Indian, Pakistani or Bangladeshi
Black African, Black Caribbean or Other Black
Below Average All Flats Rent (public) Detached Housing
Rent (public) Population Density Detached Housing
Detached Housing
HE Qualification Terraced Housing 2+ Car Household
Public Transport to work
Households with non dependent children
All Flats HE Qualification All Flats Age 5-14
No Central Heating
Rent (private)
(Source: ONS Output Area Classification, Super Groups Characteristics)

274
Tenure for OAC Geo-demographic Super Groups
Tenure Blue Collar Communities
Prospering Suburbs
Constrained by Circumstances
Typical Traits Countryside Multicultural City Living
Owner Occupied Mortgage 98 107 88 110 101 92 88
Owner Occupied Owned 91 118 89 101 113 87 95
Rent Local Authority 151 63 181 65 75 106 70
Private Rent 89 73 87 103 87 142 162
Housing Association 125 68 168 73 89 110 97
Other 80 117 88 102 128 91 100
(Source: Grand Index, ONS Output Area Classification, http://areaclassification.org.uk/ and the 2008 British Population Survey, Data Talk Research Limited, http://www.thebps.co.uk/index.php)
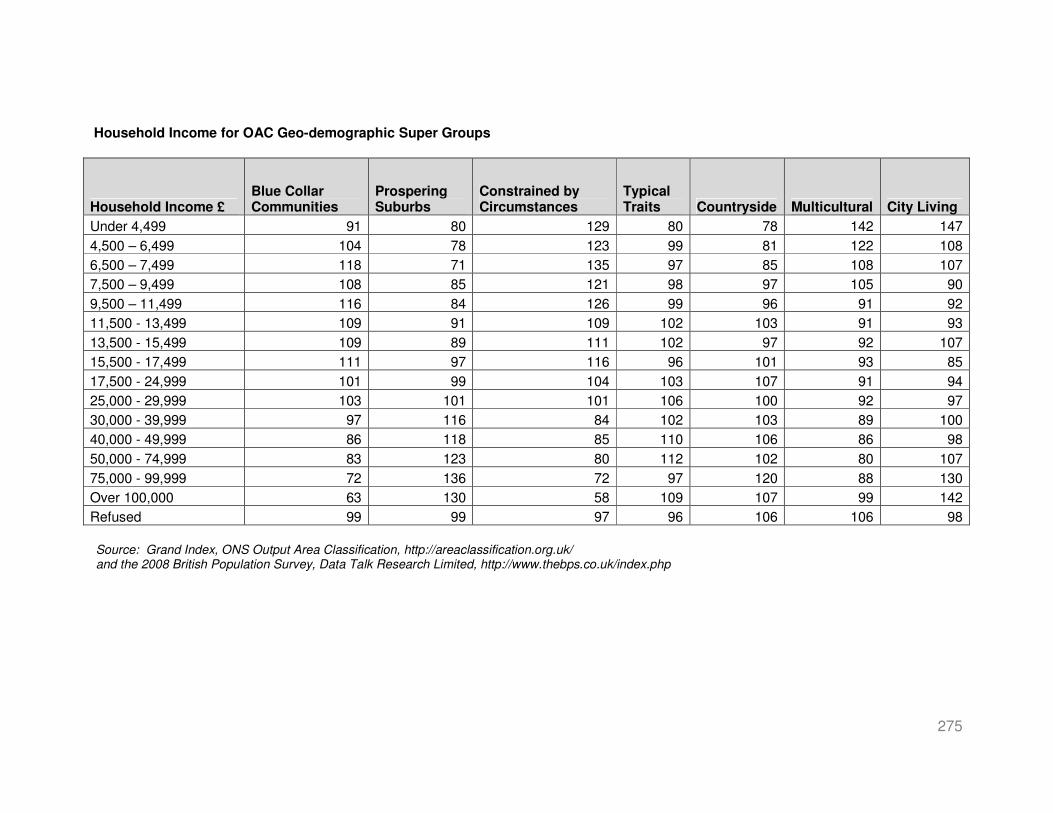
275
Household Income for OAC Geo-demographic Super Groups
Household Income £ Blue Collar Communities
Prospering Suburbs
Constrained by Circumstances
Typical Traits Countryside Multicultural City Living
Under 4,499 91 80 129 80 78 142 147
4,500 – 6,499 104 78 123 99 81 122 108
6,500 – 7,499 118 71 135 97 85 108 107
7,500 – 9,499 108 85 121 98 97 105 90
9,500 – 11,499 116 84 126 99 96 91 92
11,500 - 13,499 109 91 109 102 103 91 93
13,500 - 15,499 109 89 111 102 97 92 107
15,500 - 17,499 111 97 116 96 101 93 85
17,500 - 24,999 101 99 104 103 107 91 94
25,000 - 29,999 103 101 101 106 100 92 97
30,000 - 39,999 97 116 84 102 103 89 100
40,000 - 49,999 86 118 85 110 106 86 98
50,000 - 74,999 83 123 80 112 102 80 107
75,000 - 99,999 72 136 72 97 120 88 130
Over 100,000 63 130 58 109 107 99 142
Refused 99 99 97 96 106 106 98
Source: Grand Index, ONS Output Area Classification, http://areaclassification.org.uk/ and the 2008 British Population Survey, Data Talk Research Limited, http://www.thebps.co.uk/index.php

276
APPENDIX 3: DATA SOURCES FOR MONITORING AND UPDATING Key Influences and Drivers: social and demographic patterns and trends Nomis is an invaluable source of population and labour market data using the Wizard or Advanced queries at: https://www.nomisweb.co.uk/ Household projections (Update when re-issued) The most recent projections are 2011-based but for only 10 years and are available at: https://www.gov.uk/government/statistical-data-sets/detailed-data-for-modelling-and-analytical-purposes Population projections by age group (Update when re-issued) The most recent projections are 2011-based and are available at: http://www.ons.gov.uk/ons/rel/snpp/sub-national-population-projections/Interim-2011-based/stb-2011-based-snpp.html Components of population change (Update when re-issued) The most recent were issued in February 2013 and are available at: http://www.ons.gov.uk/ons/rel/pop-estimate/population-estimates-for-england-and-wales/mid-2002-to-mid-2010-revised--national-/sty-components-of-population-change.html Internal migration (Update annually) The National Health Service Central Register (NHSCR) compiles and maintains a computerised record of NHS patients registered with an NHS general practitioner (GP) in England, Wales or the Isle of Man. Analysis of this data enables identification of annual moves between local authority areas by age group. Data is available at: http://www.ons.gov.uk/ons/taxonomy/index.html?nscl=Migration+within+the+UK International migration (Update annually) The collation of National Insurance Number Allocations to Adult Overseas Nationals entering the UK (NiNO) provides an invaluable source of data on international migration. Numbers are only recorded for individual countries for 10 or more migrant workers, and therefore the total is more than the sum of the entries. Data can be accessed at:

277
https://www.gov.uk/government/publications/national-insurance-number-allocations-to-adult-overseas-nationals-entering-the-uk Household income (Update annually) CACI provides PayCheck Profiles of gross total household incomes by £5k income bands (CACI stands for Californian Analysis Centre Incorporated, an international company which trades as the Data Depot in Britain) This costs around £400 per commission, a breakdown for almost any defined area. See: http://www.caci.co.uk/ The DWP’s Annual Survey of Hours and Earnings (ASHE – the successor to the New Earnings Survey) is an invaluable source of data on income from earnings at local authority and higher levels, it is available through Nomis or at: http://www.ons.gov.uk/ons/rel/ashe/annual-survey-of-hours-and-earnings/2012-provisional-results/index.html The Supply of Housing The supply of new housing (Update annually) The first relevant source is internal monitoring data and typically presented in Annual Monitoring Reports. Data by property type or other criteria will need to be provided by the Planning team. Please note: whilst this is not a requirement for the purposes of annual monitoring, it is essential that the property type and bed size of new homes is recorded to enable more detailed monitoring of trends in the housing market. The affordable housing sector (Update annually) The annual Statistical Data Return (SDR) compiled by the Homes and Communities Agency provides property breakdowns for all housing associations and is available annually through the RSR webpage at: http://www.homesandcommunities.co.uk/news/statistical-data-return The CORE (COntinuous REcording of Lettings and Sales) provides annual reports by local authority area of new lettings, re-lets, affordable sales and costs under ‘Analyse CORE data/Housing provider reports/Annual data submission’. More detailed and bespoke tables can be created at ‘Analyse CORE data/Interactive reports/Advanced analysis’ https://core.communities.gov.uk/ The Demand for Housing The affordable housing sector (Update annually)

278
Social housing demand data can be updated from CORE and Choose Your Home commissioned data. Recommended indicators of social housing demand are:
• total lettings and annual turnover;
• total applicants (waiting list and transfer): by household type and size
• applicant: stock and applicant: lettings ratios
• property type and bed size requested: by household type;
• location requested: by household type, property type and bed size;
• total offers: by household type; property type and bed size;
• total lettings: by household type; property type and bed size;
• refusal rate: by household type; property type and bed size, and,
• difficult to let and void rates.
The market sector (Update annually) The most reliable source of prices achieved has been the Land Registry which records all residential sales (new build and re-sale) by price, date of sale, type of property, new-build/re-sale, free or leasehold, address, postcode, location, local authority and county. As data is constructed from the notification of completed sales, there is an inevitable time lag of at least one month until their appearance in Land Registry data sets. These are summarised at: http://www.landregistry.gov.uk/market-trend-data/public-data/price-paid-data One criticism of published Land Registry data is that it is not seasonally nor mix adjusted, but its monthly Property Price Index of average prices at national, regional, county and London borough level claims to meet both these criticisms. The next most obvious sources are advertisements on the internet and interviews with estate agents. However, care must be taken not to assume that the asking price is the price achieved at sale. Useful sites for both sales and private rental data are: http://www.zoopla.co.uk/ and: http://www.rightmove.co.uk/