strategic experienced disciplined - NASDAQ OMX...
150
strategic experienced disciplined 2007 annual report m.d.c. holdings, inc.
Transcript of strategic experienced disciplined - NASDAQ OMX...
strategic experienced disciplined
2007 annual reportm.d.c. holdings, inc.

mission statement
m.d.c. holdings, inc.
The mission of MDC is to build and finance
the highest quality homes at affordable
prices, designed to meet our customers’
needs. Our objectives are to create
homeowner satisfaction and lasting value
for our customers, increase returns for
our shareowners and provide a rewarding
work environment for our employees
that encourages the pursuit of excellence,
personal growth, teamwork and support of
the communities in which we live.

1

Larry a. MizeL
strategic
STraTeGiC. eXPerieNCeD. DiSCiPLiNeD.
These words reflect what it means to be part of MDC. They define our company’s past, guide our present and will direct our future—they are the core attributes that have played a significant part in our company’s development over the past 36 years. They have sustained us and will continue to pave the way for our future success.
THE FOUNDATION OF OUR STRENGTH
Throughout our history, we have recognized the need to identify our strengths and build upon them.
And we have done just that. We remain committed to our time-tested approach to the homebuilding business that is at our very foundation. This strategy has helped us balance our desire to grow our business with our responsibility to manage risk. And, it is this approach that has led to our solid financial position—one that we believe is among the strongest in the industry.

3
message from your management team
“Our vision and strategy
are the keys to our success.
They keep us focused
during challenging times
and position us to be
even stronger when the
industry improves.”
Larry A. Mizel Chairman & CEO
POISED FOR OPPORTUNITY
Over a period spanning four decades, we have developed the flexibility to adjust to changing market conditions. We have prospered by turning challenges into opportunities. At the heart of our business model is the strategic objective to hold our land supply to a conservative level, while limiting our investment in unsold homes. This direction has enabled us to achieve and maintain a strong balance sheet with significant levels of cash, low debt and substantial equity, which provides us the ability to seek out opportunities in the current economic environment.
CLEAR VISION, SOLID RESULTS
We know that a strong balance sheet is critical to our long-term success in operating within homebuilding’s cyclical nature. At the start of the year, we already considered our financial standing to be among the best in the industry, as evidenced by our “investment-grade” rating—a distinction we have held from all three major rating agencies for more than four years. And yet we continued to make improvements to our financial position in 2007 by many measures, including the following:
· reducing our inventories by $1.3 billion;
· decreasing the number of lots we own by 40% and the number of lots we have under option by 55%;
· generating more than $590 million in cash flow from operations and ending the year with $1 billion in cash; and
· increasing our total cash and available borrowing capacity by 30% to more than $2.2 billion.
experienced
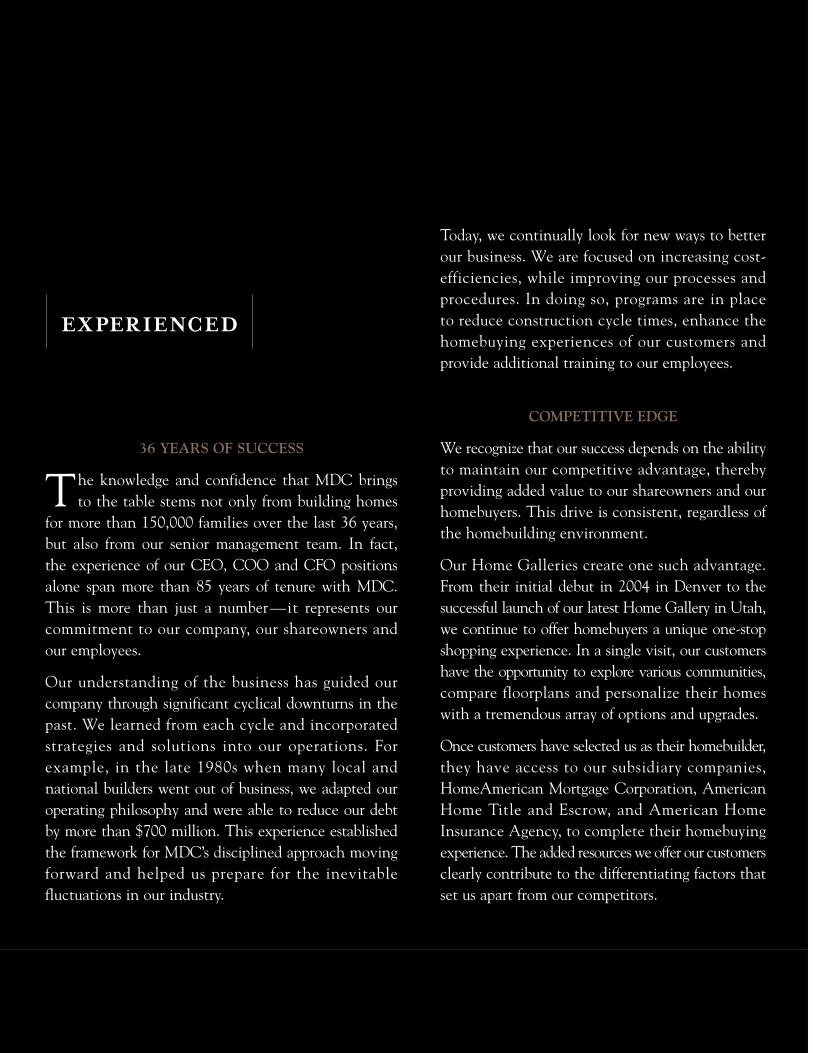
36 YEARS OF SUCCESS
The knowledge and confidence that MDC brings to the table stems not only from building homes
for more than 150,000 families over the last 36 years, but also from our senior management team. In fact, the experience of our CEO, COO and CFO positions alone span more than 85 years of tenure with MDC. This is more than just a number—it represents our commitment to our company, our shareowners and our employees.
Our understanding of the business has guided our company through significant cyclical downturns in the past. We learned from each cycle and incorporated strategies and solutions into our operations. For example, in the late 1980s when many local and national builders went out of business, we adapted our operating philosophy and were able to reduce our debt by more than $700 million. This experience established the framework for MDC’s disciplined approach moving forward and helped us prepare for the inevitable fluctuations in our industry.
Today, we continually look for new ways to better our business. We are focused on increasing cost-efficiencies, while improving our processes and procedures. In doing so, programs are in place to reduce construction cycle times, enhance the homebuying experiences of our customers and provide additional training to our employees.
COMPETITIVE EDGE
We recognize that our success depends on the ability to maintain our competitive advantage, thereby providing added value to our shareowners and our homebuyers. This drive is consistent, regardless of the homebuilding environment.
Our Home Galleries create one such advantage. From their initial debut in 2004 in Denver to the successful launch of our latest Home Gallery in Utah, we continue to offer homebuyers a unique one-stop shopping experience. In a single visit, our customers have the opportunity to explore various communities, compare floorplans and personalize their homes with a tremendous array of options and upgrades.
Once customers have selected us as their homebuilder, they have access to our subsidiary companies, HomeAmerican Mortgage Corporation, American Home Title and Escrow, and American Home Insurance Agency, to complete their homebuying experience. The added resources we offer our customers clearly contribute to the differentiating factors that set us apart from our competitors.

5
DaviD D. MaNDariCh
“The experience of our
leadership, combined with
the dedication and hard
work of our employees, has
been the underlying strength
of our company. ”
David D. Mandarich President & COO

PariS G. reeCe iii
disciplined
THE CORNERSTONE OF OUR OPERATIONS
Rather than changing our business philosophies in response to fluctuating market cycles, our
disciplined approach to homebuilding has remained consistent and steadfast over the past decade. We have taken great pride in the fact that our company has always met its financial commitments—even during the homebuilding industry’s most challenging times. We remain focused on strengthening our financial position and enhancing our operating processes in preparation for the industry’s recovery.
PRESERVING VALUE
While many of our publicly held peers have eliminated cash dividends due to cash flow and debt covenant concerns, we have continued to pay a dividend to our shareowners that ranks among the highest in our industry. Our 2007 dividend payments of $1.00 per share, or nearly $50 million in total, exhibit our confidence in MDC’s potential to generate income and cash flow in the future.

7
“Our disciplined business
approach has enabled us to
maintain our investment-
grade balance sheet
in the face of difficult
industry conditions.”
Paris G. Reece III Executive VP & CFO
Throughout 2007, we closely evaluated our operating structure and made adjustments to match current levels of demand. Our general and administrative costs declined by more than $110 million last year, and we anticipate further savings in 2008. We have continued our efforts to right-size our overhead, unbundle our construction costs and examine our construction processes in order to streamline our materials supply chain, reduce cycle times and improve our inventory turns. These are key examples of our proactive efforts to return our business to profitability.
We have carried the same philosophy to the homebuilding and customer-facing elements of our business as we have to managing our balance sheet. In 2007, we launched a nationwide initiative that focuses on enhancing our customers’ homebuying experience. This initiative reinforces our commitment to product and service quality across all our divisions. With a 20% improvement in our customer satisfaction scores in 2007, we believe this initiative will lead to more new and repeat buyers and will reinforce the overall value of our business long-term.
BALANCED FOR SUCCESS
The strength of our balance sheet, coupled with our efforts to streamline our operations and increase efficiencies, will help us capitalize on opportunities that are created in today’s difficult environment. All the components are in place. Our success over the past 36 years is far from coincidental. A carefully planned strategy, decades of experience and a disciplined approach to business are the key attributes behind the financial strength and flexibility we enjoy today. We look forward to meeting the future with seasoned confidence.

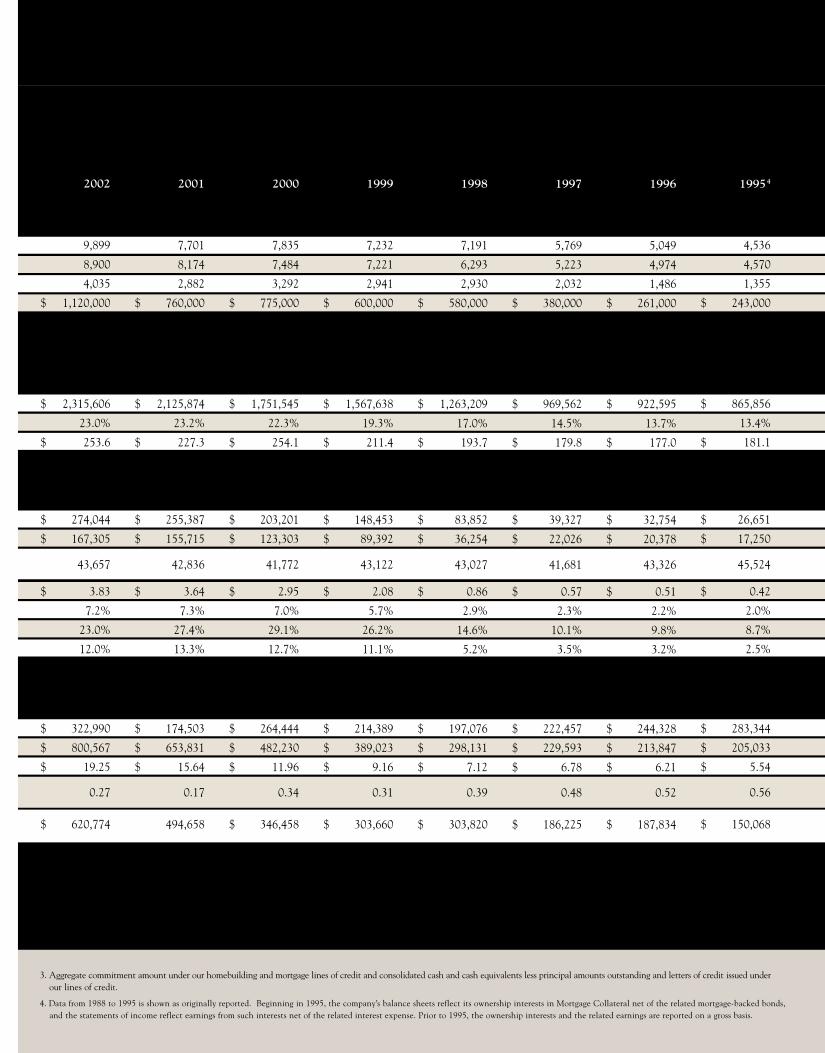
Dollars in thousands, except per share amounts
ORDERS FOR HOMES, CLOSINGS, BACkLOG AND ACTIVE SUBDIVISIONSOrders for Homes, Net
Home Closings
Homes in Backlog at Year-End
Backlog Estimated Sales Value at Year-End
TOTAL REVENUES, MARGINS AND SELLING PRICESTotal Revenue
Home Gross Margins1
Average Selling Price per Home Closed
INCOME AND RETURNSPre-Tax Income (Loss)
Net Income (Loss)
Weighted Average Diluted Shares Outstanding (Thousands)
Diluted Earnings (Loss) per Share
After-Tax Return on Revenues
After-Tax Return on Average Equity
After-Tax Return on Average Assets
YEAR-END DEBT AND EqUITYTotal Homebuilding and Corporate Debt
Stockholders’ Equity
Stockholders’ Equity per Outstanding Share
Homebuilding/Corporate Debt-to-Capital, Net of Cash2
Cash and Available Borrowing Capacity Under Lines of Credit3
2007
6,504
8,195
1,947
$ 650,000
$ 2,933,249
13.9%
$ 337.5
$ (756,464)
$ (636,940)
45,687
$ (13.94)
¯21.7%
¯33.6%
¯18.2%
$ 997,091
$ 1,476,013
$ 32.05
(0.01)
$ 2,246,696
2006
10,229
13,123
3,638
$ 1,300,000
$ 4,801,742
22.2%
$ 354.4
$ 333,137
$ 214,253
45,971
$ 4.66
4.5%
10.2%
5.5%
$ 996,682
$ 2,161,882
$ 47.87
0.18
$ 1,736,054
2005
15,334
15,307
6,532
$ 2,440,000
$ 4,892,589
28.3%
$ 313.1
$ 808,763
$ 505,723
46,036
$ 10.99
10.3%
30.6%
15.8%
$ 996,297
$ 1,952,109
$ 43.74
0.28
$ 1,245,540
2004
13,876
14,248
13,876
6,505
$ 1,920,000
$ 4,012,894
27.8%
$ 282.7
$ 636,914
$ 391,165
44,498
$ 8.79
9.7%
33.0%
17.0%
$ 746,310
$ 1,418,821
$ 32.80
0.19
$ 1,057,909
2003
12,630
11,211
5,593
$ 1,600,000
$ 2,922,595
24.1%
$ 253.9
$ 348,223
$ 212,229
43,333
$ 4.90
7.3%
24.0%
12.1%
$ 500,179
$ 1,015,920
$ 24.06
0.24
$ 782,994
1. We define “Home Gross Margins” to mean home sales revenue less home cost of sales (which primarily includes land and construction costs, capitalized interest, closing costs, and reserves for warranty expenses, and excludes commissions, amortization of deferred marketing costs and impairment charges) as a percent of home sales revenue.
2. Corporate debt and homebuilding debt less consolidated cash and cash equivalents (including restricted cash) divided by the sum of corporate debt, homebuilding debt and consolidated equity less consolidated cash and cash equivalents (including restricted cash). Please see our “Investment Highlights and Profile Book,” located on the investor relations portion of our website, for a reconciliation of corporate and homebuilding debt to the closest GAAP measure.
building on a solid foundation
2002
9,899
8,900
4,035
$ 1,120,000
$ 2,315,606
23.0%
$ 253.6
$ 274,044
$ 167,305
43,657
$ 3.83
7.2%
23.0%
12.0%
$ 322,990
$ 800,567
$ 19.25
0.27
$ 620,774
2001
7,701
8,174
2,882
$ 760,000
$ 2,125,874
23.2%
$ 227.3
$ 255,387
$ 155,715
42,836
$ 3.64
7.3%
27.4%
13.3%
$ 174,503
$ 653,831
$ 15.64
0.17
$ 494,658
2000
7,835
7,484
3,292
$ 775,000
$ 1,751,545
22.3%
$ 254.1
$ 203,201
$ 123,303
41,772
$ 2.95
7.0%
29.1%
12.7%
$ 264,444
$ 482,230
$ 11.96
0.34
$ 346,458
1999
7,232
7,221
2,941
$ 600,000
$ 1,567,638
19.3%
$ 211.4
$ 148,453
$ 89,392
43,122
$ 2.08
5.7%
26.2%
11.1%
$ 214,389
$ 389,023
$ 9.16
0.31
$ 303,660
1998
7,191
6,293
2,930
$ 580,000
$ 1,263,209
17.0%
$ 193.7
$ 83,852
$ 36,254
43,027
$ 0.86
2.9%
14.6%
5.2%
$ 197,076
$ 298,131
$ 7.12
0.39
$ 303,820
1997
5,769
5,223
2,032
$ 380,000
$ 969,562
14.5%
$ 179.8
$ 39,327
$ 22,026
41,681
$ 0.57
2.3%
10.1%
3.5%
$ 222,457
$ 229,593
$ 6.78
0.48
$ 186,225
1996
5,049
4,974
1,486
$ 261,000
$ 922,595
13.7%
$ 177.0
$ 32,754
$ 20,378
43,326
$ 0.51
2.2%
9.8%
3.2%
$ 244,328
$ 213,847
$ 6.21
0.52
$ 187,834
19954
4,536
4,570
1,355
$ 243,000
$ 865,856
13.4%
$ 181.1
$ 26,651
$ 17,250
45,524
$ 0.42
2.0%
8.7%
2.5%
$ 283,344
$ 205,033
$ 5.54
0.56
$ 150,068
10
3. Aggregate commitment amount under our homebuilding and mortgage lines of credit and consolidated cash and cash equivalents less principal amounts outstanding and letters of credit issued under our lines of credit.
4. Data from 1988 to 1995 is shown as originally reported. Beginning in 1995, the company’s balance sheets reflect its ownership interests in Mortgage Collateral net of the related mortgage-backed bonds, and the statements of income reflect earnings from such interests net of the related interest expense. Prior to 1995, the ownership interests and the related earnings are reported on a gross basis.
19944
4,177
4,200
1,334
$ 242,000
$ 824,869
15.4%
$ 186.8
$ 30,982
$ 19,255
45,720
$ 0.46
2.3%
10.5%
2.6%
$ 325,069
$ 192,295
$ 5.35
0.59
$ 113,751
19934
3,875
3,344
1,357
$ 251,000
$ 652,076
14.2%
$ 175.8
$ 15,032
$ 25,879
42,520
$ 0.61
4.0%
15.3%
3.1%
$ 316,176
$ 175,854
$ 5.06
0.59
$ 120,052
19924
2,703
2,414
826
$ 143,000
$ 513,326
14.9%
$ 172.8
$ 6,520
$ 3,852
41,588
$ 0.09
0.8%
2.2%
0.3%
$ 287,401
$ 164,182
$ 4.24
0.57
$ 85,545
19914
1,933
1,782
537
$ 97,000
$ 433,320
15.6%
$ 177.5
$ (14,119)
$ 1,906
39,941
$ 0.05
0.4%
1.2%
0.1%
$ 239,882
$ 160,488
$ 4.20
0.48
$ 85,331
19904
1,601
2,031
386
$ 70,000
$ 519,069
19.0%
$ 185.9
$ (12,565)
$ 6,845
36,287
$ 0.19
1.3%
4.4%
0.4%
$ 289,543
$ 157,261
$ 4.33
0.57
$ 58,348
19894
2,663
3,004
816
$ 151,000
$ 728,136
16.0%
$ 169.6
$ (116,039)
$ (31,635)
30,309
$ (1.05)
¯4.3%
¯18.3%
¯1.7%
$ 340,150
$ 150,474
$ 4.15
0.62
$ 67,559
19884
5,137
4,703
1,157
$ 189,000
$ 840,597
13.0%
$ 136.2
$ (144,747)
$ (31,370)
32,909
$ (0.95)
¯3.7%
¯15.2%
¯1.4%
$ 243,074
$ 179,532
$ 5.89
0.51
$ 115,315

corporate information
12
of strength
a portr ait
M.D.C. HOLDINGS, INC. BOARD OF DIRECTORSLArry A. MizeLChairman of the Board and Chief executive Officer
DAviD D. MAnDAriChPresident, Chief Operating Officer and a Director
MiChAeL A. BerMAnDirector and a Member of the Audit, Compensation and Corporate Governance/nominating Committees
DAviD e. BLACKFOrDDirector, Chairman of the Corporate Governance/nominating Committee and a Member of the Audit Committee
STeven J. BOriCKDirector and a Member of the Legal Committee
herBerT T. BUChWALDLead Director, Chairman of the Audit Committee and a Member of the Compensation, Legal and Corporate Governance/nominating Committees
WiLLiAM B. KeMPerDirector, Chairman of the Compensation Committee and a Member of the Corporate Governance/nominating and Audit Committees
OTHER CORpORATE OFFICERSPAriS G. reeCe iiiexecutive vice President, Chief Financial Officer and Principal Accounting Officer
MiChAeL TOUFFSenior vice President and General Counsel
JOhn J. heAneySenior vice President and Treasurer
KAren GArDvice President – human resources
eDWArD GWynnvice President – Tax
JOSePh h. FreTzSecretary and Corporate Counsel
HOMEBuILDING OpERATIONSDenver4350 S. Monaco Street, Suite 200 Denver, CO 80237 303.773.1100
SOUThern COLOrADO2060 Briargate Parkway, Suite 100 Colorado Springs, CO 80920 719.260.0684
CALiFOrniA 5171 California Avenue, Suite 120 irvine, CA 92617 949.467.2600
PhOenix3200 east Camelback road, Suite 300 Phoenix, Az 85018 602.956.4100
TUCSOn3067 West ina road Tucson, Az 85741 520.544.2700
nevADA 2490 Paseo verde Parkway, Suite 120 henderson, nv 89074 702.617.8400
UTAh849 West Levoy Drive, Suite 100 Salt Lake City, UT 84123 801.743.7440
iLLinOiS500 Park Boulevard, Suite 140 itasca, iL 60143 630.227.6240
nOrThern virGiniA12220 Sunrise valley Drive, Suite 400 reston, vA 20191 703.390.1800
MAryLAnD6200 Old Dobbin Lane, Suite 190 Columbia, MD 21045 410.872.0267
DeLAWAre vALLey2 Braxton Way, Suite 100 Glen Mills, PA 19342 610.361.6400
FLOriDA 330 Crossing Boulevard, Suite 200 Orange Park, FL 32073 904.541.2300
CORpORATE OFFICEM.D.C. hOLDinGS, inC.4350 South Monaco Street, Suite 500 Denver, CO 80237 303.773.1100
COMMuNICATIONS/INvESTOR RELATIONS CONTACTS JOeLLe LiPSKi-rOCKWOODnational Communications Manager 720.977.3204
rOBerT n. MArTinDirector of Corporate Finance and investor relations 720.977.3431
HOMEAMERICAN MORTGAGE CORpORATION6550 Greenwood Plaza Boulevard Centennial, CO 80111 303.773.1155
AMERICAN HOME INSuRANCE AGENCy, INC.6550 Greenwood Plaza Centennial, CO 80111 720.528.2236
AMERICAN HOME TITLE AND ESCROw COMpANy8774 yates Drive, Suite 140 Westminster, CO 80031 303.426.0990
TRANSFER AGENTCOnTinenTAL STOCK TrAnSFer & TrUST COMPAny17 Battery Place, 8th Floor new york, ny 10004 212.509.4000
Success in this difficult and challenging economic
environment requires strategy, experience and
discipline. MDC is proud of its financial record.
in the late 1980s, the homebuilding industry faced
some difficult times. The subsequent recession of the
early 1990s added to the challenge. yet, MDC
rebounded favorably following losses in 1988 and
1989. in fact, we recorded 17 straight years of profit
from 1990 through 2006.
Today, we are in an even stronger financial position
than we were in previous downturns, and the
strength of our balance sheet is virtually unmatched
among our peers. MDC is well-prepared and
motivated to take advantage of opportunities
presented by the turbulent conditions prevailing
in the homebuilding industry.

c l o s i ng t h oug h t s
m.d.c. holdings, inc.
We want to extend our appreciation
to our employees, subcontractors,
financial partners and shareowners
for their support during 2007. Also,
special recognition goes to our Board
of Directors for their hard work and
commitment to our company as we
strive to achieve our long-term goals.

arizona | california | colorado | delaware | florida | illinois | maryland nevada | new jersey | pennsylvania | utah | virginia | west virginia
richmondamerican.com

UNITED STATESSECURITIES AND EXCHANGE COMMISSION
Washington, D.C. 20549
FORM 10-KÈ ANNUAL REPORT PURSUANT TO SECTION 13 OR 15(d) OF THE SECURITIES
EXCHANGE ACT OF 1934For the fiscal year ended December 31, 2007
OR‘ TRANSITION REPORT PURSUANT TO SECTION 13 OR 15(d) OF THE SECURITIES
EXCHANGE ACT OF 1934For the Transition period from to
Commission file number 1-08951
M.D.C. HOLDINGS, INC.(Exact name of Registrant as specified in its charter)
Delaware 84-0622967(State or other jurisdiction
of incorporation or organization)(I.R.S. Employer
Identification No.)
4350 South Monaco Street, Suite 500Denver, Colorado 80237
(Address of principal executive offices) (Zip code)(303) 773-1100
(Registrant’s telephone number, including area code)Securities registered pursuant to Section 12(b) of the Act:
Title of each class Name of each exchange on which registered
Common Stock, $.01 par value New York Stock Exchange7% Senior Notes due December 2012 New York Stock Exchange5 1⁄2% Senior Notes due May 2013 New York Stock Exchange5 3⁄8% Senior Notes due December 2014 New York Stock Exchange5 3⁄8% Senior Notes due July 2015 New York Stock Exchange
Securities registered pursuant to Section 12(g) of the Act: NoneIndicate by check mark if the Registrant is a well-known seasoned issuer, as defined in Rule 405 of the SecuritiesAct. Yes È No ‘
Indicate by check mark if the Registrant is not required to file reports pursuant to Section 13 or Section 15(d) of the ExchangeAct. Yes ‘ No È
Indicate by check mark whether the Registrant (1) has filed all reports required to be filed by Section 13 or 15(d) of the SecuritiesExchange Act of 1934 during the preceding 12 months (or for such shorter period that the Registrant was required to file suchreports) and (2) has been subject to such filing requirements for the past 90 days. Yes È No ‘
Indicate by check mark if disclosure of delinquent filers pursuant to Item 405 of Regulation S-K is not contained herein, and willnot be contained, to the best of Registrant’s knowledge, in definitive proxy or information statements incorporated by reference inPart III of this Form 10-K or any amendment to this Form 10-K. È
Indicate by check mark whether the Registrant is a large accelerated filer, an accelerated filer, or a non-accelerated filer. Seedefinition of “accelerated filer and large accelerated filer” in Rule 12b-2 of the Exchange Act.Large accelerated filer È Accelerated filer ‘ Non-accelerated filer ‘
Indicated by check mark whether the Registrant is a shell company (as defined in Rule 12b-2 of the Exchange Act).Yes ‘ No È
As of June 30, 2007, the aggregate market value of the Registrants’ common stock held by non-affiliates of the Registrants was$1.7 billion based on the closing sales price of $48.36 per share as reported on the New York Stock Exchange.As of December 31, 2007, the number of shares outstanding of Registrant’s common stock was 46,084,000.
DOCUMENTS INCORPORATED BY REFERENCEPortions of part III of this Form 10-K are incorporated by reference from the Registrant’s 2008 definitive proxy statement to befiled with the Securities and Exchange Commission no later than 120 days after the end of the Registrant’s fiscal year.

M.D.C. HOLDINGS, INC.FORM 10-K
FOR THE YEAR ENDED DECEMBER 31, 2007
TABLE OF CONTENTS
PageNo.
PART I
Item 1. Business . . . . . . . . . . . . . . . . . . . . . . . . . . . . . . . . . . . . . . . . . . . . . . . . . . . . . . . . . . . . . . . . . . . . 1
(a) General Development of Business . . . . . . . . . . . . . . . . . . . . . . . . . . . . . . . . . . . . . . . . . . . . . 1
(b) Available Information . . . . . . . . . . . . . . . . . . . . . . . . . . . . . . . . . . . . . . . . . . . . . . . . . . . . . . 2
(c) Financial Information About Industry Segments . . . . . . . . . . . . . . . . . . . . . . . . . . . . . . . . . . 3
(d) Narrative Description of Business . . . . . . . . . . . . . . . . . . . . . . . . . . . . . . . . . . . . . . . . . . . . . 3
Item 1A. Risk Factors Relating to our Business . . . . . . . . . . . . . . . . . . . . . . . . . . . . . . . . . . . . . . . . . . . . . 13
Item 1B. Unresolved Staff Comments . . . . . . . . . . . . . . . . . . . . . . . . . . . . . . . . . . . . . . . . . . . . . . . . . . . . 19
Item 2. Properties . . . . . . . . . . . . . . . . . . . . . . . . . . . . . . . . . . . . . . . . . . . . . . . . . . . . . . . . . . . . . . . . . . . 20
Item 3. Legal Proceedings . . . . . . . . . . . . . . . . . . . . . . . . . . . . . . . . . . . . . . . . . . . . . . . . . . . . . . . . . . . . 20
Item 4. Submission of Matters to a Vote of Security Holders . . . . . . . . . . . . . . . . . . . . . . . . . . . . . . . . . 21
PART II
Item 5. Market for Registrant’s Common Equity, Related StockholderMatters and Issuer Purchases of Equity Securities . . . . . . . . . . . . . . . . . . . . . . . . . . . . . . . . . 21
Item 6. Selected Financial Data . . . . . . . . . . . . . . . . . . . . . . . . . . . . . . . . . . . . . . . . . . . . . . . . . . . . . . . . 22
Item 7. Management’s Discussion and Analysis of Financial Conditionand Results of Operations . . . . . . . . . . . . . . . . . . . . . . . . . . . . . . . . . . . . . . . . . . . . . . . . . . . . 25
Item 7A. Quantitative and Qualitative Disclosures About Market Risk . . . . . . . . . . . . . . . . . . . . . . . . . . 69
Item 8. Consolidated Financial Statements . . . . . . . . . . . . . . . . . . . . . . . . . . . . . . . . . . . . . . . . . . . . . . . F-1
Item 9. Changes in and Disagreements With Accountants on Accountingand Financial Disclosure . . . . . . . . . . . . . . . . . . . . . . . . . . . . . . . . . . . . . . . . . . . . . . . . . . . . . 71
Item 9A. Controls and Procedures . . . . . . . . . . . . . . . . . . . . . . . . . . . . . . . . . . . . . . . . . . . . . . . . . . . . . . . 71
Item 9B. Other Information . . . . . . . . . . . . . . . . . . . . . . . . . . . . . . . . . . . . . . . . . . . . . . . . . . . . . . . . . . . . 73
PART III
Item 10. Directors and Executive Officers of the Registrant . . . . . . . . . . . . . . . . . . . . . . . . . . . . . . . . . . 73
Item 11. Executive Compensation . . . . . . . . . . . . . . . . . . . . . . . . . . . . . . . . . . . . . . . . . . . . . . . . . . . . . . . 73
Item 12. Security Ownership of Certain Beneficial Owners and Management . . . . . . . . . . . . . . . . . . . . 74
Item 13. Certain Relationships and Related Transactions . . . . . . . . . . . . . . . . . . . . . . . . . . . . . . . . . . . . . 74
Item 14. Principal Accountant Fees and Services . . . . . . . . . . . . . . . . . . . . . . . . . . . . . . . . . . . . . . . . . . . 74
PART IV
Item 15. Exhibits and Financial Statement Schedules . . . . . . . . . . . . . . . . . . . . . . . . . . . . . . . . . . . . . . . 75
Signatures . . . . . . . . . . . . . . . . . . . . . . . . . . . . . . . . . . . . . . . . . . . . . . . . . . . . . . . . . . . . . . . . . . . . . . . . . . . . 82
(i)

M.D.C. HOLDINGS, INC.FORM 10-K
PART I
Forward-Looking Statements.
Certain statements in this Annual Report on Form 10-K, the Company’s Annual Report to Shareowners, as wellas statements made by us in periodic press releases, oral statements made by our officials in the course ofpresentations about the Company and conference calls in connection with quarterly earnings releases, constitute“forward-looking statements” within the meaning of the Private Securities Litigation Reform Act of 1995. Theseforward-looking statements include statements regarding our business, financial condition, results of operation, cashflows, strategies and prospects. Although we believe that the expectations reflected in the forward-looking statementscontained in this Annual Report on Form 10-K are reasonable, we cannot guarantee future results. These statementsinvolve known and unknown risks, uncertainties and other factors that may cause the actual results, performance orachievements of the Company to be materially different from those expressed or implied by the forward-lookingstatements. These factors include those described under the caption “Risk Factors Relating to our Business” inItem 1A of this Annual Report on Form 10-K. We undertake no obligation to publicly update any forward-lookingstatements, whether as a result of new information, future events or otherwise. However, any further disclosures madeon related subjects in subsequent reports on Forms 10-K, 10-Q and 8-K should be consulted.
Item 1. Business.
(a) General Development of Business
M.D.C. Holdings, Inc. is a Delaware corporation. We refer to M.D.C. Holdings, Inc. as the “Company,” “MDC,”“we” or “our” in this Annual Report on Form 10-K, and these designations include our subsidiaries unless we stateotherwise. We have two primary operations, homebuilding and financial services. Our homebuilding operationsconsist of wholly-owned subsidiary companies that generally purchase finished lots for the construction and sale ofsingle family detached homes to first-time and first-time move-up homebuyers under the name “Richmond AmericanHomes.” Our homebuilding operations are comprised of many homebuilding subdivisions that we consider to be ouroperating segments. Homebuilding subdivisions in a given market are aggregated into reportable segments as follows:(1) West (Arizona, California and Nevada); (2) Mountain (Colorado and Utah); (3) East (Maryland and Virginia,which includes Virginia and West Virginia); and (4) Other Homebuilding (Florida, Illinois, Delaware Valley, whichincludes Pennsylvania, Delaware and New Jersey, and Texas, although during 2007 we completed our exit of theTexas market).
Our financial services operations primarily consist of our mortgage lending, title agency and insurancecompanies. These companies are aggregated together to form our Financial Services and Other reportable segment.Our Financial Services and Other segment consists of HomeAmerican Mortgage Corporation (“HomeAmerican”),which originates mortgage loans primarily for our homebuyers, American Home Insurance Agency, Inc. (“AmericanHome Insurance”), which offers third-party insurance products to our homebuyers, and American Home Title andEscrow Company (“American Home Title”), which provides title agency services to the Company and ourhomebuyers in Colorado, Delaware, Florida, Illinois, Nevada, Maryland, Virginia and West Virginia. This segmentalso includes Allegiant Insurance Company, Inc., A Risk Retention Group (“Allegiant”), which provides to itscustomers, primarily certain subcontractors of MDC’s homebuilding subsidiaries, general liability coverage during theconstruction of the Company’s homes and for work performed in completed subdivisions, and StarAmericanInsurance Ltd. (“StarAmerican”), a Hawaii corporation and a wholly owned subsidiary of MDC. StarAmerican has
- 1 -

agreed to re-insure (1) all claims pursuant to two policies issued to the Company by a third-party; and (2) pursuant toagreements beginning in June 2004, all Allegiant claims in excess of $50,000 per occurrence, up to $3.0 million peroccurrence, subject to various aggregate limits, not to exceed $18.0 million per year.
The following summarizes several significant business developments during the five most recently completedfiscal years:
• Beginning in 2006 and continuing throughout 2007, we reduced our overall operations through Company-wide headcount reductions and reorganized our homebuilding operations through consolidation ofhomebuilding divisions and elimination of most of our regional offices. This right-sizing of ourhomebuilding operations included the consolidation of:
• six California divisions into one;• two Nevada divisions into one;• three Phoenix divisions into one;• three Virginia divisions into one;• two Florida divisions into one; and• three Colorado divisions into two.
• During 2007, we began reducing our homebuilding operations in Tampa through the disposition of amajority of the remaining assets as we initiated the exit of this sub-market.
• During 2006 and 2007, we implemented a new customer service initiative, which is focused on makingimprovements in our customers’ home buying experience.
• During 2006, we began exiting the Texas market, which we completed during 2007.
• During 2004 and 2005, we initiated our Home Gallery concept, which improved sales support and offeredmore options and upgrades for homebuyers to personalize their new homes.
• During 2004, we expanded our Florida operations through the purchase of the assets of Watson HomeBuilders, Inc. in Jacksonville.
• During 2003, we entered the Delaware Valley and Illinois homebuilding markets, and re-entered the Floridahomebuilding market through the purchase of assets of Crawford Homes, Inc. in Jacksonville.
(b) Available Information
We file annual, quarterly and current reports, proxy statements and other information with the Securities andExchange Commission (“SEC”). Anyone seeking information about our business can receive copies of our 2007 AnnualReport on Form 10-K, Annual Report to Shareholders, Quarterly Reports on Form 10-Q, Current Reports on Form 8-K,all amendments to those reports and other documents filed with the SEC at the public reference section of the SEC at100 F Street, NE, Room 1580, Washington, D.C. 20549. These documents also may be obtained, free of charge, by:contacting our Investor Relations office at (720) 773-1100; writing to M.D.C. Holdings, Inc., Investor Relations, 4350South Monaco Street, Suite 400, Denver, Colorado 80237; or accessing our website at www.richmondamerican.com.We make our Annual Report on Form 10-K, Quarterly Reports on Form 10-Q, Current Reports on Form 8-K andamendments to those reports filed or furnished pursuant to Section 13(a) or 15(d) of the Securities Exchange Act of1934, available on our website as soon as reasonably practicable after we file or furnish the materials electronically withthe SEC. To obtain any of this information, go to www.richmondamerican.com, select “Investors,” “Financial Reports”and “SEC Filings.” Our website also includes our: (1) Corporate Governance Guidelines; (2) Corporate Code ofConduct; (3) Rules for Senior Financial Officers; (4) Audit Committee Procedures for Handling ConfidentialComplaints; and (5) charters for the Audit, Compensation and Nominating and Corporate Governance Committees.These materials may be obtained, free of charge, at our website, http://ir.richmondamerican.com (select “CorporateGovernance”).
- 2 -

(c) Financial Information About Industry Segments
Note 3 to the Consolidated Financial Statements contains information regarding our reportable segments for eachof the years ended December 31, 2007, 2006 and 2005.
(d) Narrative Description of Business
Our business consists of two primary operations, homebuilding and financial services. We build and sellprimarily single-family detached homes, that are designed and built to meet local customer preferences. We are thegeneral contractor for all of our projects and retain subcontractors for site development and home construction. Thebase selling prices for our homes closed during 2007 ranged primarily from approximately $200,000 to 500,000. Wemaintain a variety of home styles in each of our markets, targeting generally first-time and first-time move-uphomebuyers. Also, we build a limited number of homes for the second-time move-up and luxury homebuyers.
When opening a new homebuilding subdivision, we seek to limit our supply of lots with the goal of avoidingoverexposure to any single sub-market. When we acquire finished lots, we prefer using option contracts or paying inphases with cash. Also, we acquire entitled land for development into finished lots when we determine that the risk isjustified. Additional information about our land acquisition practices may be found in the Homebuilding Operations,Land Acquisition and Development section.
Homebuilding Operations.
At December 31, 2007, our homebuilding operations had subdivisions in multiple sub-markets in ten marketswithin four reportable segments as follows.
Reportable Segment Market Sub-market Reportable Segment Market Sub-market
West . . . . . . . . . . . Arizona Phoenix East Valley Mountain . . . . . . . . . . . Colorado Denver Metro AreaPhoenix West Valley Colorado SpringsTucson Northern Colorado
California Bay Area Utah Salt Lake City Metro AreaCentral ValleyInland Empire Other Homebuilding . . Delaware Valley Delaware - Dover AreaLos Angeles New Jersey - BurlingtonOrange County Southeastern PennsylvaniaSan Diego Southern Pennsylvania
Nevada Las Vegas Florida JacksonvilleTampa
East . . . . . . . . . . . . Virginia Northern VirginiaShenandoah Valley Illinois Chicago SuburbsWest Virginia
Maryland Southern MarylandSuburban Maryland
- 3 -

Our home sales revenue for the years ended December 31, 2007, 2006 and 2005 is set forth in the table below foreach market within our homebuilding segments (dollars in thousands).
Total Homes Sales Revenue Percent of Total
2007 2006 2005 2007 2006 2005
Arizona . . . . . . . . . . . . . . . . . . . $ 702,418 $ 980,409 $ 831,796 26% 21% 17%California . . . . . . . . . . . . . . . . . . 588,562 998,471 1,075,900 21% 21% 23%Nevada . . . . . . . . . . . . . . . . . . . . 385,751 872,970 920,728 14% 19% 19%
West . . . . . . . . . . . . . . . . . . 1,676,731 2,851,850 2,828,424 61% 61% 59%
Colorado . . . . . . . . . . . . . . . . . . 284,419 450,392 627,042 10% 10% 13%Utah . . . . . . . . . . . . . . . . . . . . . . 255,273 277,743 204,496 9% 6% 4%
Mountain . . . . . . . . . . . . . . 539,692 728,135 831,538 19% 16% 17%
Maryland . . . . . . . . . . . . . . . . . . 149,917 246,492 191,365 6% 5% 4%Virginia . . . . . . . . . . . . . . . . . . . 167,194 378,373 539,519 6% 8% 11%
East . . . . . . . . . . . . . . . . . . 317,111 624,865 730,884 12% 13% 15%
Delaware Valley . . . . . . . . . . . . 80,057 80,966 12,196 3% 2% 0%Florida . . . . . . . . . . . . . . . . . . . . 129,880 262,209 238,054 5% 6% 5%Illinois . . . . . . . . . . . . . . . . . . . . 39,126 63,925 33,490 1% 1% 1%Texas . . . . . . . . . . . . . . . . . . . . . 3,369 65,560 128,289 0% 1% 3%
Other Homebuilding . . . . . 252,432 472,660 412,029 9% 10% 9%
Intercompany adjustments . . . . . (19,985) (26,954) (10,175) -1% 0% 0%
Total . . . . . . . . . . . . . . $2,765,981 $4,650,556 $4,792,700 100% 100% 100%
Economies of Scale. We believe that our scale of operations has afforded us benefits such as:
• the ability to negotiate favorable contract terms associated with lot option contracts;
• the ability to sustain operations in our markets despite limiting or altogether eliminating the acquisition ofnew land until such time as land becomes available at reasonable prices;
• the ability to negotiate volume contracts with material suppliers and subcontractors;
• access to affordable insurance coverage; and
• access to lower cost capital.
Operating Divisions. In our homebuilding segments, our primary functions include land acquisition anddevelopment, home construction, purchasing, sales and marketing, merchandising and customer service. Operatingdecisions are made on a subdivision-by-subdivision basis under the oversight of our Chief Operating Decision Makers(“CODMs”), defined as our Chief Executive Officer, Chief Operating Officer and Chief Financial Officer. Generally,each operating division consists of a division president; land procurement, sales, construction, customer service,finance and purchasing personnel; and office staff. The Company’s underlying organizational structure – i.e. thegrouping and reporting of subdivisions and divisions – changes based upon the current needs of the Company. AtDecember 31, 2007 and 2006, we had 12 and 23 separate homebuilding operating divisions, respectively. Officers ofour divisions generally receive performance-related bonuses based upon achieving targeted financial and operationalresults in their respective operating divisions.
Corporate Management. We manage our homebuilding business primarily through members of seniormanagement in our Corporate segment and our Asset Management Committees (each an “AMC”). Each AMC iscomprised of the COO and one of the Company’s corporate officers or employees. The AMCs review and approve all
- 4 -

subdivision acquisition transactions in accordance with land resource allocation decisions made by the CODMs. Landacquisition transactions may not proceed without the approval by AMC and/or our CODMs. Generally, the role of oursenior management team and/or AMCs includes:
• review and approval of division business plans and budgets;• oversight of land and home inventory levels; and• review of major personnel decisions.
Additionally, our corporate executives and corporate and national departments generally are responsible forestablishing and monitoring compliance with our policies and procedures. Among other things, the corporate officealso has primary responsibility for:
• asset management and capital allocation;• accounting and internal audit functions;• legal matters;• information technology;• merchandising and marketing;• training and development;• human resources and payroll;• risk management; and• treasury.
Housing. Generally, we build single family detached homes in a number of standardized series, designed toprovide variety in the size and style of homes for our potential homebuyers. Within each series, we build severalmodels, each with a different floor plan and standard and optional features. Differences in sales prices of similarmodels in any series depend primarily upon homebuyer demand, home prices offered by our competitors, location,optional features and design specifications. The series of homes offered at a particular location is based on perceivedcustomer preferences, lot size, the area’s demographics and, in certain cases, the requirements of major land sellersand local municipalities.
We seek to maintain limited levels of inventories of unsold homes in our markets. Unsold homes in variousstages of completion allow us to meet the immediate and near-term demands of prospective homebuyers. In order tomitigate the risk of carrying excess inventory, we have procedures and limits on the number of our unsold homesunder construction and speculative homes resulting from home order cancellations. The table below shows the stageof construction for our homes completed or under construction, number of sold homes under construction and modelhomes (in units).
December 31,2007
December 31,2006
December 31,2005
Unsold Homes Under Construction - Final . . . . . . . . . . . . . . . . . . . . . . . . . . . . . . . 515 476 258Unsold Homes Under Construction - Frame . . . . . . . . . . . . . . . . . . . . . . . . . . . . . . 656 573 520Unsold Homes Under Construction - Foundation . . . . . . . . . . . . . . . . . . . . . . . . . . 229 400 353
Total Unsold Homes Under Construction . . . . . . . . . . . . . . . . . . . . . . . . . . . . . . 1,400 1,449 1,131Sold Homes Under Construction . . . . . . . . . . . . . . . . . . . . . . . . . . . . . . . . . . . . . . . 1,350 2,430 5,093Model Homes . . . . . . . . . . . . . . . . . . . . . . . . . . . . . . . . . . . . . . . . . . . . . . . . . . . . . . 730 757 667
Homes Completed or Under Construction . . . . . . . . . . . . . . . . . . . . . . . . . . . . . 3,480 4,636 6,891
Land Acquisition and Development. We acquire our lots with the intention of constructing and selling homes onthe acquired land. Generally, we purchase finished lots using option contracts, in phases or in bulk for cash. On alimited basis, we acquire entitled land for development into finished lots when we believe that the risk is justified. In
- 5 -

making land purchases, we consider a number of factors, including projected rates of return, estimated Home GrossMargins (defined as home sales revenue less home cost of sales as a percent of home sales revenue), sales prices ofthe homes to be built, population and employment growth patterns, proximity to developed areas, estimated costs ofdevelopment, estimated levels of competition and demographic trends. Generally, we acquire finished lots and landfor development only in areas that will have, among other things, available building permits, utilities and suitablezoning. We attempt to maintain a supply of finished lots sufficient to enable us to start homes promptly after acontract for a home sale is executed. This approach is intended to minimize our investment in inventories. See“Forward-Looking Statements” above.
In our option contracts, we generally obtain the right to purchase lots in consideration for an option deposit in theform of cash or letters of credit. In the event we elect not to purchase the lots within a specified period of time, weforfeit the option deposit. Our option contracts generally do not contain provisions requiring our specific performance.During the years ended December 31, 2007, 2006 and 2005, we wrote-off lot option deposits and pre-acquisition costsof $23.4 million, $29.7 million and $10.4 million, respectively. At December 31, 2007, we had the right to acquire3,615 lots under option contracts, with approximately $6.3 million and $6.5 million in non-refundable cash and lettersof credit option deposits at risk, respectively. At December 31, 2007, the total purchase price for lots under option andtotal capitalized pre-acquisition costs were $419 million and $1.4 million, respectively.
We own or have the right under option contracts to acquire undeveloped parcels of real estate that we intend todevelop into finished lots. We develop our land in phases (generally fewer than 100 lots at a time) in order to limit ourrisk in a particular subdivision and to efficiently employ available resources. Building permits and utilities areavailable and zoning is suitable for the current intended use of substantially all of our undeveloped land. Whendeveloped, these lots generally will be used in our homebuilding activities. See “Forward-Looking Statements”above.
The table below shows the carrying value of land and land under development, by homebuilding segment, atDecember 31, 2007, 2006 and 2005 (in thousands).
December 31,
2007 2006 2005
West . . . . . . . . . . . . . . . . . . . . . . . . . . . . . . . . . . . . . . . . . . $ 226,621 $ 980,666 $ 1,108,777Mountain . . . . . . . . . . . . . . . . . . . . . . . . . . . . . . . . . . . . . . 205,983 282,063 216,729East . . . . . . . . . . . . . . . . . . . . . . . . . . . . . . . . . . . . . . . . . . 87,118 185,627 187,999Other Homebuilding . . . . . . . . . . . . . . . . . . . . . . . . . . . . . 34,614 126,802 164,443
Total . . . . . . . . . . . . . . . . . . . . . . . . . . . . . . . . . . . . . . . . $ 554,336 $ 1,575,158 $ 1,677,948
- 6 -

The table below shows the number of lots owned and controlled under option (excluding lots in housingcompleted or under construction), by homebuilding segment, at December 31, 2007, 2006 and 2005 (in units).
December 31,
2007 2006 2005
Lots OwnedWest . . . . . . . . . . . . . . . . . . . . . . . . . . . . . . . . . . . . . . . . 6,009 11,917 14,807Mountain . . . . . . . . . . . . . . . . . . . . . . . . . . . . . . . . . . . . 3,855 4,664 4,603East . . . . . . . . . . . . . . . . . . . . . . . . . . . . . . . . . . . . . . . . 671 1,171 1,462Other Homebuilding . . . . . . . . . . . . . . . . . . . . . . . . . . . 980 1,658 2,573
Total . . . . . . . . . . . . . . . . . . . . . . . . . . . . . . . . . . . . . . 11,515 19,410 23,445
Lots Controlled Under OptionWest . . . . . . . . . . . . . . . . . . . . . . . . . . . . . . . . . . . . . . . . 673 1,381 7,055Mountain . . . . . . . . . . . . . . . . . . . . . . . . . . . . . . . . . . . . 262 892 2,616East . . . . . . . . . . . . . . . . . . . . . . . . . . . . . . . . . . . . . . . . 1,869 3,341 4,397Other Homebuilding . . . . . . . . . . . . . . . . . . . . . . . . . . . 811 2,483 4,751
Total . . . . . . . . . . . . . . . . . . . . . . . . . . . . . . . . . . . . . . 3,615 8,097 18,819
Total Lots Owned and Controlled . . . . . . . . . . . . . . . 15,130 27,507 42,264
The table below shows the amount of non-refundable option deposits (in thousands).
December 31,
2007 2006 2005
Cash . . . . . . . . . . . . . . . . . . . . . . . . . . . . . . . . . . . . . . . . . . $ 6,292 $ 20,228 $ 48,157Letters of Credit . . . . . . . . . . . . . . . . . . . . . . . . . . . . . . . . . 6,547 14,224 23,142
Total Non-refundable Option Deposits . . . . . . . . . . . . . $ 12,839 $ 34,452 $ 71,299
Labor and Raw Materials. For the most part, materials used in our homebuilding operations are standard itemscarried by major suppliers. We generally contract for our materials and labor at a fixed price for the anticipatedconstruction period of our homes. This allows us to mitigate the risks associated with increases in building materialsand labor costs between the time construction begins on a home and the time it is closed. Increases in the cost ofbuilding materials and subcontracted labor may reduce Home Gross Margins to the extent that market conditionsprevent the recovery of increased costs through higher home sales prices. From time to time and to varying degrees,we may experience shortages in the availability of building materials and/or labor in each of our markets. Theseshortages and delays may result in delays in the delivery of homes under construction, reduced Home Gross Margins,or both. See “Forward-Looking Statements” above.
Warranty. Our homes are sold with limited third-party warranties that generally provide for ten years ofstructural coverage (“structural warranty”), two years of coverage for plumbing, electrical, heating, ventilation and airconditioning systems, and one year of coverage for workmanship and materials. Under our agreement with the issuerof the third-party warranties, we are responsible for performing all of the work for the first two years of the warrantycoverage, and substantially all of the work required to be performed during years three through ten of the warranties.As a result, warranty reserves are established as homes close on a house-by-house basis in an amount estimated to beadequate to cover expected costs of materials and outside labor during warranty periods. Reserves are determinedbased upon historical experience with respect to similar home styles and geographical areas. Certain factors areconsidered in determining the per-house reserve amount, including: (1) the historical range of amounts paid per
- 7 -

house; (2) the historical amount paid as a percent of home construction costs; (3) any warranty expenditures includedin (1) and (2) not considered to be normal and recurring; (4) improvements in quality control and constructiontechniques expected to impact future warranty expenditures; and (5) conditions that may affect certain subdivisionsand require higher per-house reserves for those specific subdivisions.
Seasonal Nature of Business. Prior to 2006, the Company experienced seasonality and quarter-to-quartervariability in homebuilding activity levels. The seasonal nature of our business is described in more detail in Item 6Selected Financial and Other Data.
Backlog. At December 31, 2007 and 2006, homes under contract but not yet delivered (“Backlog”) totaled 1,947and 3,638, respectively, with an estimated sales value of $650 million and $1.3 billion, respectively. Our CancellationRates (as defined below) were 48% and 43% for the years ended December 31, 2007 and 2006, respectively. Wedefine “Cancellation Rate” as the approximate number of cancelled home order contracts during a reporting period asa percent of total home orders received during such reporting period. We anticipate the estimated Backlog sales valueat December 31, 2007 will be realized during 2008 through closing homes in Backlog either under their existing homeorder contracts or through the replacement of an existing contract with a new home order contract. See “Forward-Looking Statements” above.
The table below discloses our Backlog for the years ended December 31, 2007 and 2006 for each market withinour homebuilding segments (dollars in thousands).
December 31, 2007 Increase (Decrease)
2007 2006 Amount %
Backlog (Units)Arizona . . . . . . . . . . . . . . . . . . . . . . . . . . . . . . . . . . . . . . . . . . . 592 1,504 (912) -61%California . . . . . . . . . . . . . . . . . . . . . . . . . . . . . . . . . . . . . . . . . . 203 427 (224) -52%Nevada . . . . . . . . . . . . . . . . . . . . . . . . . . . . . . . . . . . . . . . . . . . . 307 315 (8) -3%
West . . . . . . . . . . . . . . . . . . . . . . . . . . . . . . . . . . . . . . . . . . 1,102 2,246 (1,144) -51%
Colorado . . . . . . . . . . . . . . . . . . . . . . . . . . . . . . . . . . . . . . . . . . 213 253 (40) -16%Utah . . . . . . . . . . . . . . . . . . . . . . . . . . . . . . . . . . . . . . . . . . . . . . 178 465 (287) -62%
Mountain . . . . . . . . . . . . . . . . . . . . . . . . . . . . . . . . . . . . . . 391 718 (327) -46%
Maryland . . . . . . . . . . . . . . . . . . . . . . . . . . . . . . . . . . . . . . . . . . 126 187 (61) -33%Virginia . . . . . . . . . . . . . . . . . . . . . . . . . . . . . . . . . . . . . . . . . . . 100 136 (36) -26%
East . . . . . . . . . . . . . . . . . . . . . . . . . . . . . . . . . . . . . . . . . . 226 323 (97) -30%
Delaware Valley . . . . . . . . . . . . . . . . . . . . . . . . . . . . . . . . . . . . 57 119 (62) -52%Florida . . . . . . . . . . . . . . . . . . . . . . . . . . . . . . . . . . . . . . . . . . . . 125 197 (72) -37%Illinois . . . . . . . . . . . . . . . . . . . . . . . . . . . . . . . . . . . . . . . . . . . . 46 23 23 100%Texas . . . . . . . . . . . . . . . . . . . . . . . . . . . . . . . . . . . . . . . . . . . . . - 12 (12) -100%
Other Homebuilding . . . . . . . . . . . . . . . . . . . . . . . . . . . . . 228 351 (123) -35%
Total . . . . . . . . . . . . . . . . . . . . . . . . . . . . . . . . . . . . . . 1,947 3,638 (1,691) -46%
Estimated Backlog Sales Value . . . . . . . . . . . . . . . . . . . . . . . . . . . $ 650,000 $ 1,300,000 $ (650,000) -50%
Estimated Average Sales Price in Backlog . . . . . . . . . . . . . . . . . . $ 333.8 $ 357.3 $ (23.5) -7%
- 8 -

Our Backlog at December 31, 2007 decreased from levels at December 31, 2006 in each of our homebuildingsegments and in nearly all markets in these segments. Contributing to the decrease in Backlog at December 31, 2007,were declines in net home orders during the last six months of 2007, compared with the last six months of 2006, inmost markets within each homebuilding segment. Additionally, the decrease in Backlog at December 31, 2007 wasmost notable in our West segment, where Backlog declined by a combined 1,136 units from December 31, 2006 inArizona and California. Backlog for Nevada at December 31, 2007 remained flat, compared with December 31, 2006,primarily due to sales incentives which were introduced in late November and December of 2007 that resulted in asignificant number of new home orders received.
Estimated Backlog sales value at December 31, 2007 decreased from December 31, 2006, primarily due to a46% decrease in the number of homes in Backlog and a 7% decrease in the estimated average sales price of homes inBacklog. The decline in the estimated average sales price of homes in Backlog is consistent with the decrease in theaverage selling prices of homes closed during 2007, which were impacted by factors contributing to the downturn inthe homebuilding industry, as described in Item 7, “Management’s Discussion and Analysis of Financial Conditionand Results of Operations.”
Customer Service and Quality Control. Our homebuilding divisions are responsible for pre-closing qualitycontrol inspections and responding to customers’ post-closing needs. During 2006, we created a product service andquality control task force, which designed and began implementation of a revised customer experience initiative. Thisis a multi-year initiative that is focused on making improvements in our customers’ complete home buying andhomeownership experience. The initial phase of this initiative was rolled out to our Nevada market in the fourthquarter of 2006 and to all of our other markets during 2007.
Marketing and Sales. We evaluate our marketing and sales programs and initiatives in order to targethomebuyers in a cost effective manner. To communicate our Richmond American brand and sales promotions, wehave a centralized in-house advertising and marketing department that controls and monitors the communication ofthe Company’s brand and promotion efforts. The main objective of this department is to direct potential homebuyersto our sales offices, Home Galleries, Homebuyer Resource Centers and website. We work towards these objectivesthrough various advertising outlets, including, newspapers, magazines, signage, direct mailings and radio. In addition,our in-house corporate communications team manages our public relations and employee communications, and ourinteractive marketing team maintains our richmondamerican.com website.
To complement our marketing efforts, our in-house merchandising team furnishes our model homes and salesoffices with the objective of providing a consistent presentation in furtherance of developing our Richmond Americanbrand.
Home Gallery and Design Center. Another important part of our marketing presentation takes place in ourdesign centers, which are located in most of our homebuilding markets. Homebuyers are able to customize certainfeatures of their homes by selecting from a variety of options and upgrades. In 2004, we launched our new HomeGallery concept, which provides improved sales support and customized options for prospective homebuyers topersonalize their new homes. These retail locations also serve as a resource to homebuyers who are interested inpurchasing a new Richmond American home. Prospective homebuyers can receive individualized attention from atrained team of new home specialists, resulting in a more focused, efficient home search.
Competition. The homebuilding industry is fragmented and highly competitive. The competitive nature of ourbusiness is described in more detail in Item 1A, Risk Factors Relating to our Business.
Regulation. Our homebuilding operations are subject to compliance with applicable laws and regulations, whichare described in more detail in Item 1A, Risk Factors Relating to our Business.
- 9 -

Bonds and Letters of Credit. In many cases, we are required to obtain bonds and/or letters of credit in support ofobligations primarily related to subdivision improvements, homeowners association dues and start-up expenses,warranty work, contractors’ license fees and earnest money deposits. At December 31, 2007 and 2006, we hadoutstanding performance bonds totaling $281.6 million and $388.6 million, respectively, and letters of credit totaling$51.2 million and $83.8 million, respectively, including $16.4 million and $26.8 million, respectively, issued byHomeAmerican.
In certain states, unless we take measures to release state regulatory imposed restrictions on earnest moneydeposits (“Deposits”) received from a homebuyer in conjunction with a home sale, which may include posting blanketsecurity bonds, we are restricted from using these Deposits for general purposes. In this regard, at December 31, 2007and 2006, we had $8.5 million and $10.5 million outstanding in blanket security bonds used to release restrictions oncertain Deposits. Additionally, we had $1.9 million and $2.6 million in restricted cash related to Deposits atDecember 31, 2007 and 2006, respectively. We monitor, on a regular basis, the amount of Deposits we hold in certainstates to confirm that our blanket security bonds exceed the amount of the Deposits.
In the event performance bonds or letters of credit issued by third-parties are called, our indemnity obligationscould require us to reimburse the issuer of the performance bond or letter of credit. See “Forward-LookingStatements” above.
Financial Services and Other Segment.
Mortgage Lending Operations.
General. HomeAmerican is a full-service mortgage lender and the principal originator of mortgage loans for ourhomebuyers. HomeAmerican has a centralized loan processing center where it originates mortgage loans primarily forour homebuyers. HomeAmerican also brokers mortgage loans for origination by outside lending institutions for ourhomebuyers.
HomeAmerican is authorized to originate Federal Housing Administration-insured (“FHA”), VeteransAdministration-guaranteed (“VA”), Federal National Mortgage Association (“FNMA”), Federal Home LoanMortgage Corporation (“FHLMC”) (together “the government sponsored entities”) and other private investormortgage loans. HomeAmerican also is an authorized loan servicer for FNMA and FHLMC and, as such, is subject tothe rules and regulations of these organizations. Additionally, during 2006, HomeAmerican originated a significantnumber of second mortgage loans and Alternative A (“Alt-A”) loans (as defined below). However, during 2007, inresponse to the reduced liquidity in the mortgage lending industry, we tightened our mortgage loan underwritingcriteria by: (1) discontinuing Alt-A mortgage loans, second mortgage loans, “sub-prime mortgage loans” (as definedbelow) and Non-Agency (defined as not being FNMA and FHLMC eligible) mortgage loans with combined-loan-to-values in excess of 95%; and (2) requiring larger down payments from homebuyers in communities where themarket values of homes have been declining. We define Alt-A loans as loans that would otherwise qualify as primeloans except that they do not comply in all ways with the documentation standards of the government sponsoredenterprise guidelines. We define sub-prime mortgage loans as mortgage loans that have Fair, Isaac & Company scoresless than or equal to 620.
We use HomeAmerican’s secured warehouse line of credit, other borrowings and Company generated funds tofinance the origination of mortgage loans until they are sold. HomeAmerican generally sells originated mortgageloans to third-party purchasers on either a bulk or flow basis. Mortgage loans sold on a bulk basis generally includethe sale of a package of substantially similar originated mortgage loans, while sales of mortgage loans on a flow basisgenerally are completed as HomeAmerican originates each loan. Mortgage loans sold to third-party purchasers
- 10 -
generally include HomeAmerican’s representations and warranties with respect to certain borrower payment defaults,credit quality issues and/or misrepresentations on the part of the Company or our homebuyers. Substantially all of themortgage loans originated by HomeAmerican are sold to third-party purchasers within 45 days of origination.Additionally, mortgage loans may be sold pursuant to an early purchase program, whereby we sell certain mortgageloans originated by HomeAmerican to a third-party purchaser shortly after the close of a home. This programimproves our overall available funds by enabling us to sell mortgage loans originated by HomeAmerican morequickly. Accordingly, for mortgage loans sold pursuant to this program the number of days a loan is held in inventoryis reduced from the historical 45 days to less than five days.
Concurrent with the sale of mortgage loans to third-party purchasers, HomeAmerican generally sells the rights toservice those loans. HomeAmerican’s portfolio of mortgage loan servicing for others at December 31, 2007 consistedof 597 loans with an unpaid principal balance of approximately $67.4 million, and did not contribute significantly tothe results of operations of the Company.
Historically, a substantial portion of mortgage loans originated by HomeAmerican have been sold to one third-party purchaser. During the years ended December 31, 2007, 2006 and 2005, HomeAmerican sold approximately51%, 54% and 68%, respectively, of the mortgage loans it originated to this third-party purchaser. Additionally,during 2007, HomeAmerican increased the volume of loans sold to a second third-party purchaser to approximately23% of mortgage loans sold during 2007.
Pipeline. HomeAmerican’s mortgage loans in process that had not closed (the “Pipeline”) at December 31, 2007had an aggregate principal balance of approximately $387.6 million, of which $37.6 million were under interest ratelock commitments (“IRLC”) at an average interest rate of 6.0%. In addition, HomeAmerican had $100.1 million ofmortgage loans in inventory available for sale at December 31, 2007. HomeAmerican uses forward sales of mortgage-backed securities and commitments to sell whole loans to hedge the interest rate risk inherent in the IRLC and its loaninventory available for sale. See “Forward-Looking Statements” above.
Forward Sales Commitments. HomeAmerican is exposed to market risks related to fluctuations in interest ratesdue to its mortgage loan inventory. Derivative instruments utilized in the normal course of business byHomeAmerican include forward sales of mortgage-backed securities, commitments to sell whole loans andcommitments to originate mortgage loans. HomeAmerican utilizes forward mortgage securities contracts to managethe price risk due to fluctuations in interest rates on our mortgage loans owned and the IRLC. Such contracts are theonly significant financial derivative instruments utilized by us and generally are settled within 60 days of origination.Due to this hedging philosophy, we believe the market risk associated with HomeAmerican’s mortgages is limited.Reported gains on sales of mortgage loans may vary significantly from period to period depending on the volatility inthe interest rate market. See “Forward-Looking Statements” above.
Competition. The mortgage industry is fragmented and highly competitive. The competitive nature of ourbusiness is described in more detail in Item 1A, Risk Factors Relating to our Business.
Regulation. Our mortgage lending operations are subject to compliance with applicable laws and regulations,which are described in more detail in Item 1A, Risk Factors Relating to our Business.
Insurance Operations.
Our insurance operations consist of three business divisions: (1) Allegiant; (2) StarAmerican; and (3) AmericanHome Insurance.
Allegiant and StarAmerican were formed to provide insurance coverage for homebuilding risks as to which webelieved insurance coverage was either too difficult or too expensive to obtain. Allegiant was organized as a risk
- 11 -

retention group under the Federal Liability Risk Retention Act of 1981. Allegiant, which began operations in June of2004, is licensed as a Class 3 Stock Insurance Company by the Division of Insurance of the State of Hawaii and issubject primarily to the regulations of its state of incorporation. Allegiant generates revenue by providing to itscustomers, primarily certain subcontractors of MDC’s homebuilding subsidiaries, general liability coverage during theconstruction of the Company’s homes and for work performed in completed subdivisions. Allegiant seeks to provideto its customers coverage and insurance rates that are competitive with other insurers.
StarAmerican is a single parent captive insurance company licensed by the Division of Insurance of the State ofHawaii and is a wholly owned subsidiary of MDC. Pursuant to agreements beginning in June 2004, StarAmericanre-insures Allegiant for all claims in excess of $50,000 per occurrence up to $3,000,000 per occurrence, subject tovarious aggregate limits, which do not exceed $18,000,000 per year.
Allegiant and StarAmerican incur expenses for losses and loss adjustments based on actuarial studies that includeknown facts and interpretations of circumstances, including the Company’s experience with similar insurance casesand historical trends involving insurance claim payment patterns, pending levels of unpaid insurance claims, mix orconcentration of home styles, claim severity, claim frequency patterns such as those caused by natural disasters, fires,or accidents, depending on the business conducted, and changing regulatory and legal environments.
Regulations. Allegiant and StarAmerican are licensed in the State of Hawaii and, therefore, are subject to theregulation of the Hawaii Insurance Division. This regulation includes restrictions and oversight regarding: types ofinsurance provided; investment options; required capital and surplus; financial and information reporting; use ofauditors, actuaries and other service providers; periodic examinations; and other operational items. As insurancecompanies organized under Hawaii’s captive insurance laws, Allegiant and StarAmerican are subject to fewerregulations than non-captive insurance companies. As a risk retention group, Allegiant also is registered in otherstates where certain MDC subsidiaries do business. Allegiant must pay premium taxes and comply with financial andinformation reporting requirements of the insurance departments in these additional states.
American Home Insurance is an insurance agency, which provides homebuyers with personal lines property andcasualty insurance products in the same markets as our homebuilding subsidiaries.
Title Operations.
American Home Title provides title agency services to the Company and our homebuyers in Colorado,Delaware, Florida, Illinois, Maryland, Nevada, Virginia and West Virginia.
Employees.
The table below summarizes the approximate number of employees for our homebuilding, Financial Servicesand Other and Corporate segments at December 31, 2007.
Homebuilding segments . . . . . . . . . . . . . . . . . . . . . . . . . . . . . . . . . . . . . . . . . . . . . . . . . . . . . . 1,700Financial Services and Other . . . . . . . . . . . . . . . . . . . . . . . . . . . . . . . . . . . . . . . . . . . . . . . . . . . 180Corporate . . . . . . . . . . . . . . . . . . . . . . . . . . . . . . . . . . . . . . . . . . . . . . . . . . . . . . . . . . . . . . . . . . 290
Consolidated . . . . . . . . . . . . . . . . . . . . . . . . . . . . . . . . . . . . . . . . . . . . . . . . . . . . . . . . . . . . . 2,170
- 12 -
Item 1A. Risk Factors Relating to our Business.
Adverse changes in general economic conditions could reduce the demand for homes and, as a result, couldnegatively impact our results of operations.
The homebuilding and mortgage lending industries continued to experience uncertainty and reduced demand fornew homes, which negatively impacted our financial and operating results during the year ended December 31, 2007.Widespread national and international concern over instability in the credit markets has exacerbated the decline indemand for new homes. The conditions experienced during 2007 included, among other things: reduced consumerconfidence; on-going homebuyer concerns about the housing market and the lack of home selling price stabilization;concerns over higher-risk mortgage loan products, such as Alt-A and sub-prime mortgage loans; and reducedavailability of mortgage loan financing.
If the downturn in the homebuilding and mortgage lending industries continues, intensifies, or if the nationaleconomy weakens further and slips into a recession, we could continue to experience declines in the market value anddemand for our homes, which could have a significant negative impact on our Home Gross Margins and financial andoperational results.
Increased competition levels in the homebuilding and mortgage lending industries could result in lower net homeorders, closings and decreases in the average selling prices of sold and closed homes, which could have a negativeimpact on our home sales revenue and results of operations.
The real estate industry is fragmented and highly competitive. Our homebuilding subsidiaries compete withnumerous public and private homebuilders, including a number that are substantially larger and have greater financialresources than us. Our homebuilding subsidiaries also compete with subdivision developers and land developmentcompanies, some of which are themselves homebuilders or affiliates of homebuilders. Homebuilders compete forcustomers, land, building materials, subcontractor labor and desirable financing. Competition for home ordersprimarily is based upon price, home style, financing available to prospective homebuyers, location of property, qualityof homes built, customer service and general reputation in the community, and may vary market-by-market and/orsubmarket-by-submarket. Additionally, competition within the homebuilding industry can be impacted through anexcess supply of new and existing homes available for sale resulting from a number of factors including, among otherthings, increases in speculative homes available for sale and increases in home foreclosures. Increased competition,including lower home sales prices offered by our competitors as experienced during 2007, can result in decreases inour home sales prices and/or increases in home sales incentives in an effort to generate new home sales and maintainhomes in Backlog until they close. These competitive pressures are likely to continue for some time and could affectour ability to maintain existing home sales prices and require that we provide additional incentives, which wouldnegatively impact our future financial and operating results.
We, through our mortgage lending subsidiary, HomeAmerican, also compete with numerous banks, thrifts andother mortgage bankers and brokers, many of which are larger and may have greater financial resources than we do.Competitive factors include pricing, mortgage loan terms, underwriting criteria and customer service. To the extentthat we are unable to adequately compete with other companies that originate mortgage loans, total revenue and theresults of operations from our Financial Services and Other segment may be negatively impacted.
Further decline in the market value of our homes or carrying value of our land would have a negative impact onour results of operations and financial position.
Our homebuilding subsidiaries acquire land for the replacement of land inventory and/or expansion within ourcurrent markets and may, from time to time, purchase land for expansion into new markets. The fair value of our land
- 13 -

and land under development and housing completed or under construction inventory depends on market conditions.Factors that can impact our determination of the fair value of our inventory primarily include homes sales prices,levels of home sales incentives and home construction costs. Our home sales prices and/or levels of home salesincentives can be impacted by, among other things, decreased demand for new homes, decreased home prices offeredby our competitors, decreased ability of our homebuyers to obtain suitable mortgage loan financing and continuedhigh levels of home order cancellations. Additionally, our home construction costs can be impacted by, among otherthings, shortages of subcontractor labor and changes in costs associated with subcontracted labor, building materialsand other resources. If we are required to decrease home sales prices and/or increase incentives in an effort togenerate new home sales, maintain homes in Backlog until they close or remain competitive with the home salesprices offered by our competitors, or if our home construction costs increase, we may not be able to recover thecarrying costs of our inventory when our homebuilding subsidiaries build and sell homes. In such circumstances, wewould be required to record additional impairments of our inventory. Additionally, due to the uncertainty in thehomebuilding and mortgage lending industries, it is reasonably possible for us to experience further declines in themarket value of our homes and, as a result, additional inventory impairments could be recorded in future reportingperiods. Any such additional inventory impairments would have a negative impact on our financial position andresults of operations in the future reporting period in which they were recorded.
Increases in our Cancellation Rate could have a negative impact on our Home Gross Margins and home salesrevenue.
Our Cancellation Rate increased significantly during 2007 and 2006, compared with 2005 and 2004, which hasnegatively impacted the number of closed homes, net home orders, home sales revenue and our results of operationsduring 2007 and 2006, as well as the number of homes in Backlog at the end of each reporting period. Home ordercancellations can result from a number of factors, including, declines in the market value of homes and/or slowappreciation in the market value of homes, increases in the supply of homes available to be purchased, increasedcompetition, higher mortgage interest rates, homebuyers’ inability to sell their existing homes, homebuyers’ inabilityto obtain suitable financing, including providing sufficient down payments, and adverse changes in economicconditions. Continued high levels of home order cancellations would have a negative impact on our home salesrevenue and financial and operating results in future reporting periods.
If land is not available at reasonable prices, our homes sales revenue and results of operations could be negativelyimpacted and/or we could be required to scale back our operations in a given market.
Our operations depend on our homebuilding subsidiaries’ ability to obtain land for the development of ourresidential communities at reasonable prices and with terms that meet our underwriting criteria. Our ability to obtainland for new residential communities may be adversely affected by changes in the general availability of land, thewillingness of land sellers to sell land at reasonable prices given the deterioration in market conditions, competitionfor available land, availability of financing to acquire land, zoning, regulations that limit housing density and othermarket conditions. If the supply of land appropriate for development of residential communities becomes morelimited because of these factors, or for any other reason, the number of homes that our homebuilding subsidiariesbuild and sell could be reduced. Additionally, the ability of our homebuilding subsidiaries to open new subdivisionscould be impacted if we elect not to purchase lots under option contracts. To the extent that we are unable to timelypurchase land or enter into new contracts for the purchase of land at reasonable prices, due to the lag time between thetime we acquire land and the time we begin selling homes, our homes sales revenue and results of operations could benegatively impacted and/or we could be required to scale back our operations in a given market.
- 14 -

If our potential homebuyers are not able to obtain suitable financing, our results of operations or cash flows maybe impacted adversely.
Our business depends on the ability of our homebuyers to obtain affordable mortgages for the purchase of ourhomes, which includes being able to provide sufficient initial down payments for mortgage loan products currentlyavailable. Increases in the cost of mortgage financing and/or reductions in mortgage loan product offerings couldprevent potential homebuyers from being able to obtain or qualify for mortgage loans. In addition, if our homebuyersmust sell existing homes in order to buy homes from us, increases in mortgage costs or decreases in the market valueof homes could interfere with such sales and result in our homebuyers’ inability to buy from us. Additionally,homebuyers’ ability to obtain suitable financing could be adversely impacted by tightening of our mortgage loanunderwriting criteria in response to the decreased liquidity in the mortgage lending market. We are unable to predictfuture changes in home mortgage interest rates or the impact such changes may have on our operating activities andresults of operations. However, these conditions can negatively impact our home sales revenue and results ofoperations through closing fewer homes and/or closing homes with lower average selling prices.
We have financial needs that we meet through the capital markets, including the debt and secondary mortgagemarkets, and continued disruptions in these markets could have an adverse impact on the Company’s results ofoperations, financial position and/or cash flows.
We have financial needs that we meet through the capital markets, including the debt and secondary mortgagemarkets. The secondary markets currently are experiencing disruptions from reduced investor demand for mortgageloans and mortgage-backed securities, increased investor yield requirements for those loans and securities and the exitof third-party purchasers from the secondary market. In addition, the sources and terms and conditions of warehousefinancing arrangements and other lending arrangements for the mortgage lending industry are changing. Thesechanges can impact, among other things, availability of capital, terms and structures for debt and line of creditagreements, collateral requirements and collateral advance rates. Additionally, while certain governmentalorganizations and other mortgage industry participants have taken steps recently to ease the downturn in the credit andcapital markets, the impact of their efforts, if any, on the homebuilding and mortgage lending industries is unknown.The foregoing disruptions and changes may have an adverse impact on the Company’s results of operations, financialposition and/or cash flows.
As is customary in the homebuilding industry, we often are required to provide surety bonds to secure ourperformance under construction contracts, development agreements and other arrangements. Our ability to obtainsurety bonds primarily depends upon our credit rating, capitalization, working capital, past performance, managementexpertise and certain external factors, including the overall capacity of the surety market. While our credit ratings andliquidity position currently are strong, if we were unable to obtain surety bonds when required, our results ofoperations and/or cash flows could be impacted adversely.
In addition, the pricing matrix and the availability of advances and letters of credit under our homebuilding lineof credit are dependent upon our credit ratings. While we currently have an investment grade credit rating from allthree major ratings agencies, the lowering of any or all of these credit ratings could have an adverse impact on thecost of advances, letters of credit and unused commitment fees under our homebuilding line of credit. Lower creditratings for MDC also could subject this line of credit to a borrowing base structure, which could limit our ability toobtain additional advances and issuances of letters of credit under this line. Under certain circumstances, theselimitations could have an adverse impact on the Company’s results of operations, financial position and/or cash flows.
- 15 -

Further uncertainty in the mortgage lending industry regarding the origination of mortgage loans could negativelyimpact our results of operations.
The Company is subject to risks associated with mortgage loans, including, among others, previously originatedand sold Alt-A and sub-prime mortgage loans, second mortgage loans, high loan-to-value mortgage loans and jumbomortgage loans (defined as a mortgage loan with a principal balance in excess of $417,000). These risks may include,among other things, compliance with mortgage loan underwriting criteria and the associated homebuyers’performance, which could require HomeAmerican to repurchase certain of those mortgage loans or provideindemnification. Repurchased mortgage loans may impact HomeAmerican’s results of operations, liquidity and cashflow as the existence of a defect that necessitated repurchase may require additional effort and expense incurred byHomeAmerican to cure the defect, the passage of time in order to cure or reduce the impact of an identified defect, adiscounted sale of the repurchased loan due to the existence of a defect or, in the event that the loan has a defect and isnon-performing, foreclosure and re-sale of the subject property.
Interest rate increases or changes in lending programs could lower demand for our homes and our mortgagelending services.
Our homebuilding and mortgage lending operations are impacted by the availability and cost of mortgagefinancing. Nearly all of our customers finance the purchase of their homes, and a significant number of thesecustomers arrange their financing through HomeAmerican. Increases in home mortgage interest rates may reduce thedemand for homes and home mortgages. We are unable to predict the extent to which recent or future changes inhome mortgage interest rates will affect our operating activities and results of operations. Additionally, furthertightening of mortgage loan underwriting criteria could have an adverse impact on our operating and financial resultsin future reporting periods.
In addition, we believe that the availability of FNMA, FHLMC, FHA and VA mortgage loans are an importantfactor in our marketing strategy. Any changes, limitations or restrictions on the availability of these types of financingcould reduce our subsidiaries’ home sales and mortgage lending volume.
We depend on certain markets, and reduced home sales orders and closings for homes in these markets could havea negative impact on our revenue and results of operations. Additionally, we are reliant on a limited number ofthird-party purchasers of mortgage loans originated by HomeAmerican, which could impact our results ofoperations.
We conduct a significant portion of our business in the Arizona, California, Colorado, Nevada and Virginiamarkets and generate a disproportionate amount of our revenue in these markets. Demand for new homes and themarket value of homes declined during 2007 and 2006 in each of these markets. If we continue to experience aslowdown in our operations within these markets, our results of operations and financial position in future reportingperiods will continue to be negatively impacted.
Additionally, there are a limited number of third-party purchasers of mortgage loans and, at any given point intime, our business may be impacted adversely if one of them was no longer able or willing to purchase mortgageloans originated by HomeAmerican. Our operations could be impacted adversely due to reduced competition andhaving fewer bidders for originated mortgage loans we sell, which could result in us receiving a lower price for suchoriginated mortgage loans.
- 16 -

Our business is subject to numerous federal, local, state laws and regulations concerning land development,construction of homes, sales, mortgage lending, environmental and other aspects of our business. These laws andregulations could give rise to additional liabilities or expenditures, or restrictions on our business.
Our operations are subject to continuing compliance requirements mandated by applicable federal, state and localstatutes, ordinances, rules and regulations, including zoning and land use ordinances, building, plumbing andelectrical codes, contractors’ licensing laws, state insurance laws, federal and state human resources laws andregulations and health and safety laws and regulations (including, but not limited to, those of the OccupationalSafety & Health Administration). Various localities in which we operate have imposed (or may impose in the future)fees on developers to fund schools, road improvements and low and moderate-income housing.
From time to time, various municipalities in which our homebuilding subsidiaries operate restrict or placemoratoria on the availability of utilities, including water and sewer taps. Additionally, certain jurisdictions in whichour homebuilding subsidiaries operate have proposed or enacted “slow growth” or “no growth” initiatives and othermeasures that may restrict the number of building permits available in any given year. These initiatives or other slowor no growth measures could reduce our ability to open new subdivisions and build and sell homes in the affectedmarkets and may create additional costs and administration requirements, which in turn could negatively impact ourfuture home sales and results of operations. Although future conditions or governmental actions may impact ourability to obtain necessary permits or water and sewer taps, we currently believe that we have, or can obtain, waterand sewer taps and building permits for our homebuilding subsidiaries’ land inventory and land held for development.
Our homebuilding operations also are affected by environmental laws and regulations pertaining to availabilityof water, municipal sewage treatment capacity, stormwater discharges, land use, hazardous waste disposal, dustcontrols, building materials, population density and preservation of endangered species, natural terrain and vegetation.Due to these considerations, our homebuilding subsidiaries generally obtain an environmental site assessment forparcels of land that they acquire. The particular environmental laws and regulations that apply to any givenhomebuilding project vary greatly according to a particular site’s location, the site’s environmental conditions and thepresent and former uses. These environmental laws may result in project delays, cause us to incur substantialcompliance and other costs and/or prohibit or severely restrict homebuilding activity in certain environmentallysensitive locations.
The Company also is subject to rules and regulations with respect to originating, processing, selling andservicing mortgage loans, which, among other things: prohibit discrimination and establish underwriting guidelines;provide for audits and inspections; require appraisals, credit reports on prospective borrowers and disclosure of certaininformation concerning credit and settlement costs; establish maximum loan amounts; prohibit predatory lendingpractices; and regulate the referral of business to affiliated entities. Over time, the level of complexity in the mortgagelending business has increased significantly due to several factors, including: (1) an increase in the number ofmortgage loan products as a result of the evolution of the secondary mortgage market and demand by borrowers; and(2) greater regulation of the industry. New rules and regulations, or revised interpretations of existing rules andregulations applicable to our mortgage lending operations could result in more stringent compliance standards, whichmay substantially increase costs of compliance.
Product liability litigation and warranty claims that arise in the ordinary course of business may be costly.
As a homebuilder, we are subject to construction defect and home warranty claims, including moisture intrusionand related mold claims, arising in the ordinary course of business. These claims are common to the homebuildingindustry and can be costly. In addition, the costs of insuring against construction defect and product liability claimsare high and the amount of coverage offered by insurance companies is currently limited. This coverage may be
- 17 -

further restricted and become more costly. If we are not able to obtain adequate insurance against these claims, wemay incur additional expenses that would have a negative impact on our results of operations in future reportingperiods.
Our income tax provision and other tax liabilities may be insufficient if taxing authorities are successful inasserting tax positions that are contrary to our position. Additionally, continued loss from operations in futurereporting periods may require us to adjust the valuation allowance against our deferred tax assets.
From time to time, we are audited by various federal, state and local authorities regarding income tax matters.Significant judgment is required to determine our provision for income taxes and our liabilities for federal, state, localand other taxes. Our audits are in various stages of completion; however, no outcome for a particular audit can bedetermined with certainty prior to the conclusion of the audit, appeal and, in some cases, litigation process. Althoughwe believe our approach to determining the appropriate tax treatment is supportable and in accordance with Statementof Financial Accounting Standards No. 109, “Accounting for Income Taxes,” and FASB Interpretation No. 48,“Accounting for Uncertainty in Income Taxes,” it is possible that the final tax authority will take a tax position that ismaterially different than that which is reflected in our income tax provision and other tax reserves. As each audit isconducted, adjustments, if any, are appropriately recorded in our Consolidated Financial Statements in the perioddetermined. Such differences could have a material adverse effect on our income tax provision or benefit, or other taxreserves, in the reporting period in which such determination is made and, consequently, on our results of operations,financial position and/or cash flows for such period.
Our deferred tax assets should be reduced by a valuation allowance, if, based on the weight of availableevidence, it is more-likely-than-not that some portion or all of the deferred tax assets will not be realized. Indetermining the more-likely-than-not criterion, we evaluate all positive and negative evidence as of the end of eachreporting period. Future adjustments, either increases or decreases, to our deferred tax asset valuation allowance willbe determined based upon changes in the expected realization of our net deferred tax assets. The realization of ourdeferred tax assets ultimately depends on the existence of sufficient taxable income in either the carryback orcarryforward periods under the tax law. Due to significant estimates utilized in establishing the valuation allowanceand the potential for changes in facts and circumstances, it is reasonably possible that we will be required to recordadjustments to the valuation allowance in future reporting periods. Our results of operations would be impactednegatively if we determine that increases to our deferred tax asset valuation allowance are required in a futurereporting period.
Because of the seasonal nature of our business, our quarterly operating results can fluctuate.
Prior to 2006, we experienced seasonality and quarter-to-quarter variability in homebuilding activity levels. Ingeneral, the number of homes closed and associated home sales revenue increased during the third and fourthquarters, compared with the first and second quarters. We believe that this seasonality reflected the historicaltendency of homebuyers to purchase new homes in the spring with closings scheduled in the fall or winter, as well asthe scheduling of construction to accommodate seasonal weather conditions in certain markets. During 2007 and2006, this seasonality pattern in the homebuilding industry was not apparent. The extent to which our historicalseasonality pattern contributed to actual 2007 home sales and closing levels is unknown, and there can be noassurances that this seasonality pattern will be present in future reporting periods.
Labor and material shortages could cause delays in, and increase the costs of, the construction of our homes.
The residential construction industry experiences labor and material shortages from time to time, including: workstoppages; labor disputes and shortages in qualified trades people, insulation, drywall, concrete, steel and lumber; lackof availability of adequate utility infrastructure and services; our need to rely on local subcontractors who may not be
- 18 -

adequately capitalized or insured; and shortages, or delays in availability, or fluctuations in prices, of buildingmaterials. These labor and material shortages can be more severe during periods of strong demand for housing orduring periods in which the markets where we operate experience natural disasters that have a significant impact onexisting residential and commercial structures. Any of these circumstances could give rise to delays in the start orcompletion of our residential communities, increase the cost of developing one or more of our residentialcommunities and increase the construction cost of our homes. To the extent that market conditions prevent therecovery of increased costs, including among other things, subcontracted labor, finished lots, building materials, andother resources, through higher selling prices, our Home Gross Margins and results of operations could be affectednegatively.
Natural disasters could cause an increase in home construction costs, as well as delays, and could negativelyimpact our results of operations.
The climates and geology of many of the markets in which we operate, including California and Florida, presentincreased risks of natural disasters. To the extent that hurricanes, severe storms, earthquakes, droughts, floods, heavyor prolonged precipitation, wildfires or other natural disasters or similar events occur, the financial and operatingresults of our business, in particular, may be negatively impacted. These, among other natural disasters, can affect anarea in which we build, or one nearby, and result in a diversion of labor and materials in the area from new homeconstruction to the rebuilding of the existing homes damaged or destroyed in the natural disaster. This can causedelays in construction and delivery of new homes and/or increase our construction costs.
We are dependent on the services of certain key employees, and the loss of their services could hurt our business.
Our future success depends, in part, on our ability to attract, train and retain skilled personnel. If we are unable toretain our key employees or attract, train and retain other skilled personnel in the future, it could have an adverseimpact on our financial and operating results.
Increased domestic and international instability could have an adverse effect on our operations.
Adverse developments in the war on terrorism, future terrorist attacks against the United States, or increaseddomestic and international instability could adversely affect our business.
The interests of certain controlling shareholders may be adverse to investors.
Larry A. Mizel, David D. Mandarich and other of our affiliates own, directly or indirectly, in the aggregate,almost 25% of our outstanding common stock. To the extent they and their affiliates vote their shares in the samemanner, their combined stock ownership may effectively give them the power to elect our entire board of directorsand control our management, operations and affairs. Circumstances may occur in which the interest of theseshareholders could be in conflict with the interests of other shareholders. The large percentage of stock held by thesepersons could also delay or prevent a change in control of the Company.
Item 1B. Unresolved Staff Comments.
None
- 19 -

Item 2. Properties.
Our corporate headquarters is located at 4350 South Monaco Street, Denver, Colorado 80237, where we leaseoffice space in a 144,000 square foot office building. Our homebuilding divisions and, in some markets, other MDCsubsidiaries, including HomeAmerican, American Home Insurance and American Home Title, lease additional officespace. The table below outlines the number of office facilities that are leased and the approximate square footageleased in each market at December 31, 2007. We are satisfied with the suitability and capacity of our office locations.
Number ofLeased Facilities
Total SquareFootage Leased
Arizona . . . . . . . . . . . . . . . . . . . . . . . . . . . . . . . . . . . . . . . . . . . . . . . . . . . . . 6 124,000California . . . . . . . . . . . . . . . . . . . . . . . . . . . . . . . . . . . . . . . . . . . . . . . . . . . . 8 141,000Colorado . . . . . . . . . . . . . . . . . . . . . . . . . . . . . . . . . . . . . . . . . . . . . . . . . . . . 9 305,000Delaware Valley . . . . . . . . . . . . . . . . . . . . . . . . . . . . . . . . . . . . . . . . . . . . . . 3 16,000Florida . . . . . . . . . . . . . . . . . . . . . . . . . . . . . . . . . . . . . . . . . . . . . . . . . . . . . . 4 43,000Illinois . . . . . . . . . . . . . . . . . . . . . . . . . . . . . . . . . . . . . . . . . . . . . . . . . . . . . . 1 10,000Maryland . . . . . . . . . . . . . . . . . . . . . . . . . . . . . . . . . . . . . . . . . . . . . . . . . . . . 2 16,000Nevada . . . . . . . . . . . . . . . . . . . . . . . . . . . . . . . . . . . . . . . . . . . . . . . . . . . . . . 4 63,000Texas . . . . . . . . . . . . . . . . . . . . . . . . . . . . . . . . . . . . . . . . . . . . . . . . . . . . . . . 1 1,000Utah . . . . . . . . . . . . . . . . . . . . . . . . . . . . . . . . . . . . . . . . . . . . . . . . . . . . . . . . 4 28,000Virginia . . . . . . . . . . . . . . . . . . . . . . . . . . . . . . . . . . . . . . . . . . . . . . . . . . . . . 5 81,000
Totals . . . . . . . . . . . . . . . . . . . . . . . . . . . . . . . . . . . . . . . . . . . . . . . . . . . . . 47 828,000
Item 3. Legal Proceedings.
The Company and certain of its subsidiaries and affiliates have been named as defendants in various claims,complaints and other legal actions arising in the ordinary course of business, including moisture intrusion and relatedmold claims. In the opinion of management, the outcome of these matters will not have a material adverse effect uponthe financial condition, results of operations or cash flows of the Company. See “Forward-Looking Statements”above.
The U.S. Environmental Protection Agency (“EPA”) filed an administrative action against Richmond AmericanHomes of Colorado, Inc. (“RAH Colorado”), alleging that RAH Colorado violated the terms of RAH Colorado’sgeneral permit for discharges of stormwater from construction activities at two of RAH Colorado’s development sites.In its complaint, the EPA sought civil penalties against RAH Colorado in the amount of $0.1 million. OnNovember 11, 2003, the EPA filed a motion to withdraw the administrative action so that it could refile the matter inUnited States District Court as part of a consolidated action against RAH Colorado for alleged stormwater violationsat not only the original two sites, but also two additional sites. The EPA’s motion to withdraw was granted by theAdministrative Law Judge on February 9, 2004. The EPA has not yet refiled the matter. The EPA has inspected 21sites under development in Colorado and by RAH Colorado affiliates in Virginia, Maryland, Arizona and California,and claims to have found additional stormwater permit violations. RAH Colorado has substantial defenses to theallegations made by the EPA and the Company is exploring methods of resolving this matter with the EPA.
The EPA issued two Notices of Violation against Richmond American Homes of Arizona, Inc. (“RAH Arizona”)alleging violations of the Clean Air Act. The EPA asserted that RAH Arizona had not controlled dust generated atconstruction sites in Maricopa County in that it had not operated a water application system or other approved controlmeasures, installed suitable track-out control devices and/or cleaned-up materials tracked-out from project sites. The EPAfiled an action in the United States District Court, District of Arizona, against RAH Arizona based on these allegations. OnSeptember 17, 2007, RAH Arizona, without admitting any wrongdoing, reached a settlement with a release of civil liability
- 20 -
for all alleged violations. After opportunity for public comment, the settlement agreement was approved by the Court, wepaid a civil penalty of $155,000 and commenced implementation of various procedures to abate fugitive dust emissions.
Because of the nature of the homebuilding business, and in the ordinary course of its operations, the Companyfrom time to time may be subject to product liability claims.
Item 4. Submission of Matters to a Vote of Security Holders.
No meetings of the Company’s stockholders were held during the fourth quarter of 2007.
PART II
Item 5. Market for Registrant’s Common Equity, Related Stockholder Matters and Issuer Purchases ofEquity Securities.
At December 31, 2007, MDC had 773 shareowners of record. The shares of MDC common stock are traded onthe New York Stock Exchange. The following table sets forth, for the periods indicated, the price ranges of MDC’scommon stock.
Three Months Ended
March 31 June 30 September 30 December 31
2007High . . . . . . . . . . . . . . . . . . . . . . . . . . . . . . . . . . . . . . . . . . . . . . $ 60.00 $ 54.73 $ 50.33 $ 43.10Low . . . . . . . . . . . . . . . . . . . . . . . . . . . . . . . . . . . . . . . . . . . . . . $ 47.75 $ 47.54 $ 40.31 $ 32.34
2006High . . . . . . . . . . . . . . . . . . . . . . . . . . . . . . . . . . . . . . . . . . . . . . $ 66.88 $ 68.10 $ 52.07 $ 57.31Low . . . . . . . . . . . . . . . . . . . . . . . . . . . . . . . . . . . . . . . . . . . . . . $ 58.72 $ 50.07 $ 40.43 $ 47.26
The following table sets forth the cash dividends declared and paid in 2007 and 2006 (dollars in thousands,except per share amounts).
Date of Declaration Date of PaymentDividend per
ShareTotal Dividends
Paid
2007First quarter . . . . . . . . . . . . . . . . . . . . . . . . . . . . January 22, 2007 February 21, 2007 $ 0.25 $ 11,414Second quarter . . . . . . . . . . . . . . . . . . . . . . . . . April 27, 2007 May 23, 2007 0.25 11,438Third quarter . . . . . . . . . . . . . . . . . . . . . . . . . . . July 23, 2007 August 22, 2007 0.25 11,459Fourth quarter . . . . . . . . . . . . . . . . . . . . . . . . . . October 22, 2007 November 20, 2007 0.25 11,462
$ 1.00 $ 45,773
2006First quarter . . . . . . . . . . . . . . . . . . . . . . . . . . . . January 23, 2006 February 23, 2006 $ 0.25 $ 11,217Second quarter . . . . . . . . . . . . . . . . . . . . . . . . . April 24, 2006 May 24, 2006 0.25 11,239Third quarter . . . . . . . . . . . . . . . . . . . . . . . . . . . July 24, 2006 August 23, 2006 0.25 11,247Fourth quarter . . . . . . . . . . . . . . . . . . . . . . . . . . October 23, 2006 November 21, 2006 0.25 11,260
$ 1.00 $ 44,963
- 21 -

In connection with the declaration and payment of dividends, we are required to comply with certain covenantscontained in our unsecured revolving line of credit agreement (as amended on January 24, 2008), which has a totalcommitment of $1.25 billion. Pursuant to the terms of this amended agreement, dividends may be declared or paid byus if we are in compliance with certain stockholders’ equity and debt coverage tests. As a result, effectiveJanuary 24, 2008, we had a permitted dividend capacity of approximately $370 million pursuant to the mostrestrictive of these covenants.
On January 29, 2008, MDC’s board of directors declared a quarterly cash dividend of twenty five cents ($0.25)per share. The dividend will be paid on February 26, 2008 to shareowners of record on February 12, 2008.
There were no shares of MDC common stock repurchased during the year ended December 31, 2007. AtDecember 31, 2007, we were authorized to repurchase up to 4,000,000 shares of our common stock.
Performance Graph
Set forth below is a graph comparing the yearly change in the cumulative total return of the MDC’s commonstock with the cumulative total return of the Standard & Poor’s 500 Stock Index and with that of a peer group of otherhomebuilders over the five-year period ending on December 31, 2007.
It is assumed in the graph that $100 was invested (1) in the Company’s common stock; (2) in the stocks of thecompanies in the Standard & Poor’s 500 Stock Index; and (3) in the stocks of the peer group companies, just prior tothe commencement of the period and that all dividends received within a quarter were reinvested in that quarter. Thepeer group index is composed of the following companies: Beazer Homes USA, Inc., Centex Corporation, D.R.Horton, Inc., Hovnanian Enterprises, Inc., KB Home, Lennar Corporation, M/I Homes, Inc., Meritage HomesCorporation, NVR, Inc., Pulte Homes, Inc., The Ryland Group, Inc., Standard Pacific Corp. and Toll Brothers, Inc.
The stock price performance shown on the following graph is not indicative of future price performance.
COMPARISON OF CUMULATIVE TOTAL RETURNOF MDC COMMON STOCK, THE S&P 500 STOCK INDEX
AND A SELECTED PEER GROUP
$0
$100
$200
$300
$400
2002 2003 2004 2005 2006 2007
M.D.C. Holdings, Inc. Weighted Avg. Peer Group S&P 500
Item 6. Selected Financial and Other Data.
The data in these tables and related footnotes should be read in conjunction with “Management’s Discussion andAnalysis of Financial Condition and Results of Operations” and the Company’s Consolidated Financial Statements (inthousands, except per share and unit amounts).
- 22 -
SELECTED FINANCIAL DATA
Year Ended December 31,
2007 2006 2005 2004 2003
INCOME STATEMENT DATAHome sales revenue . . . . . . . . . . . . . . . . . . . . . . . . . . . . . . . . . . . . . $2,765,981 $4,650,556 $4,792,700 $3,922,837 $2,846,220Total revenue . . . . . . . . . . . . . . . . . . . . . . . . . . . . . . . . . . . . . . . . . . $2,933,249 $4,801,742 $4,892,589 $4,012,894 $2,922,595Home cost of sales . . . . . . . . . . . . . . . . . . . . . . . . . . . . . . . . . . . . . . $2,380,427 $3,619,656 $3,436,035 $2,834,092 $2,159,979Asset impairments . . . . . . . . . . . . . . . . . . . . . . . . . . . . . . . . . . . . . . $ 726,621 $ 112,027 $ - $ - $ -General and administrative expenses . . . . . . . . . . . . . . . . . . . . . . . $ 306,715 $ 418,879 $ 401,184 $ 327,812 $ 237,648(Loss) income before income taxes . . . . . . . . . . . . . . . . . . . . . . . . . $ (756,464) $ 333,137 $ 808,763 $ 636,914 $ 348,223Net (loss) income(1) . . . . . . . . . . . . . . . . . . . . . . . . . . . . . . . . . . . . . $ (636,940) $ 214,253 $ 505,723 $ 391,165 $ 212,229Basic (loss) earnings per common share . . . . . . . . . . . . . . . . . . . . . $ (13.94) $ 4.77 $ 11.48 $ 9.19 $ 5.11Diluted (loss) earnings per common share . . . . . . . . . . . . . . . . . . . $ (13.94) $ 4.66 $ 10.99 $ 8.79 $ 4.90
Weighted-average shares outstandingBasic . . . . . . . . . . . . . . . . . . . . . . . . . . . . . . . . . . . . . . . . . . . . 45,687 44,952 44,046 42,560 41,521Diluted(2) . . . . . . . . . . . . . . . . . . . . . . . . . . . . . . . . . . . . . . . . . 45,687 45,971 46,036 44,498 43,333
Dividends declared per share . . . . . . . . . . . . . . . . . . . . . . . . . . . . . . $ 1.00 $ 1.00 $ 0.76 $ 0.43 $ 0.28
(1) Net loss for the year ended December 31, 2007 includes the impact of recording a valuation allowance of $160.0 millionagainst our deferred tax assets.
(2) 758,899 shares of common stock equivalents have been excluded from the diluted weighted-average shares outstanding forthe year ended December 31, 2007 because the effect of their inclusion would be anti-dilutive, or would decrease thereported diluted loss per share.
December 31,
2007 2006 2005 2004 2003
BALANCE SHEET DATAAssets
Cash and cash equivalents . . . . . . . . . . . . . . . . . . . . . . . . . . . . . . $1,004,763 $ 507,947 $ 214,531 $ 400,959 $ 170,289Housing completed or under construction . . . . . . . . . . . . . . . . . . $ 902,221 $1,178,671 $1,320,106 $ 887,002 $ 769,762Land and land under development . . . . . . . . . . . . . . . . . . . . . . . . $ 554,336 $1,575,158 $1,677,948 $1,129,266 $ 785,541Total assets . . . . . . . . . . . . . . . . . . . . . . . . . . . . . . . . . . . . . . . . . $2,956,237 $3,909,875 $3,859,850 $2,844,731 $2,028,790
Debt and Lines of CreditSenior notes . . . . . . . . . . . . . . . . . . . . . . . . . . . . . . . . . . . . . . . . . $ 997,091 $ 996,682 $ 996,297 $ 746,310 $ 497,700Notes payable . . . . . . . . . . . . . . . . . . . . . . . . . . . . . . . . . . . . . . . . - - - - 2,479Homebuilding line of credit . . . . . . . . . . . . . . . . . . . . . . . . . . . . . - - - - -Mortgage line of credit . . . . . . . . . . . . . . . . . . . . . . . . . . . . . . . . 70,147 130,467 156,532 135,478 79,240
Total debt and lines of credit . . . . . . . . . . . . . . . . . . . . . . . . . . . . $1,067,238 $1,127,149 $1,152,829 $ 881,788 $ 579,419
Stockholders’ Equity . . . . . . . . . . . . . . . . . . . . . . . . . . . . . . . . . . . $1,476,013 $2,161,882 $1,952,109 $1,418,821 $1,015,920Stockholders’ Equity per Outstanding Share . . . . . . . . . . . . . . . $ 32.05 $ 47.87 $ 43.74 $ 32.80 $ 24.06
- 23 -

Year Ended December 31,
2007 2006 2005 2004 2003
OPERATING DATAHomes closed (units) . . . . . . . . . . . . . . . . . . . . . . . . . . . . . . . . . . . . . . . . . . . 8,195 13,123 15,307 13,876 11,211Average selling price per home closed . . . . . . . . . . . . . . . . . . . . . . . . . . . . . $ 337.5 $ 354.4 $ 313.1 $ 282.7 $ 253.9Orders for homes, net (units) . . . . . . . . . . . . . . . . . . . . . . . . . . . . . . . . . . . . 6,504 10,229 15,334 14,248 12,630Homes in Backlog at period end (units) . . . . . . . . . . . . . . . . . . . . . . . . . . . . 1,947 3,638 6,532 6,505 5,593Estimated Backlog sales value at period end . . . . . . . . . . . . . . . . . . . . . . . . $650,000 $1,300,000 $2,440,000 $1,920,000 $1,600,000Estimated average selling price of homes in Backlog . . . . . . . . . . . . . . . . . $ 333.8 $ 357.3 $ 373.5 $ 295.2 $ 286.1Active subdivisions at year-end . . . . . . . . . . . . . . . . . . . . . . . . . . . . . . . . . . 278 306 292 242 198Average active subdivisions . . . . . . . . . . . . . . . . . . . . . . . . . . . . . . . . . . . . . 302 298 273 222 195
Cash Flows FromOperating activities . . . . . . . . . . . . . . . . . . . . . . . . . . . . . . . . . . . . . . . . . . . . $592,583 $ 363,048 $ (424,929)$ (27,779)$ 82,322Investing activities . . . . . . . . . . . . . . . . . . . . . . . . . . . . . . . . . . . . . . . . . . . . $ (1,447)$ (10,221)$ (22,889)$ (29,917)$ (6,785)Financing activities . . . . . . . . . . . . . . . . . . . . . . . . . . . . . . . . . . . . . . . . . . . . $ (94,320)$ (59,411)$ 261,390 $ 288,366 $ 67,481
Seasonality and Variability in Quarterly Results
Prior to 2006, the Company experienced seasonality and quarter-to-quarter variability in homebuilding activitylevels. During 2007, this seasonal pattern in the homebuilding industry was not apparent. The seasonal nature of ourhomebuilding and mortgage lending business are described in more detail in Item 1A, Risk Factors Relating to OurBusiness. The following table reflects our unaudited summarized quarterly consolidated financial and operationalinformation for the two years ended December 31, 2007 (in thousands, except per share and unit amounts). See“Forward-Looking Statements” above.
Quarter
Fourth Third Second First
2007Home sales revenue . . . . . . . . . . . . . . . . . . . . . . . . . . . . . . . . . . . . . . . . . . . . $ 715,244 $ 651,124 $ 687,813 $ 711,800Total revenue . . . . . . . . . . . . . . . . . . . . . . . . . . . . . . . . . . . . . . . . . . . . . . . . . $ 784,756 $ 686,661 $ 716,708 $ 745,124Asset impairments . . . . . . . . . . . . . . . . . . . . . . . . . . . . . . . . . . . . . . . . . . . . . $ 175,199 $ 248,950 $ 161,050 $ 141,422General and administrative expenses(1) . . . . . . . . . . . . . . . . . . . . . . . . . . . . . $ 59,486 $ 76,482 $ 80,090 $ 90,657Net loss(2) . . . . . . . . . . . . . . . . . . . . . . . . . . . . . . . . . . . . . . . . . . . . . . . . . . . . $ (281,092) $ (155,378) $ (106,072) $ (94,398)Orders for homes, net (units) . . . . . . . . . . . . . . . . . . . . . . . . . . . . . . . . . . . . . 748 1,228 1,970 2,558Homes closed (units) . . . . . . . . . . . . . . . . . . . . . . . . . . . . . . . . . . . . . . . . . . . 2,200 1,963 2,031 2,001Homes in Backlog at period end (units) . . . . . . . . . . . . . . . . . . . . . . . . . . . . 1,947 3,399 4,134 4,195Estimated Backlog sales value at period end . . . . . . . . . . . . . . . . . . . . . . . . . $ 650,000 $1,210,000 $1,480,000 $1,500,000Loss per share
Basic . . . . . . . . . . . . . . . . . . . . . . . . . . . . . . . . . . . . . . . . . . . . . . . . . . . . . $ (6.14) $ (3.40) $ (2.32) $ (2.07)Diluted . . . . . . . . . . . . . . . . . . . . . . . . . . . . . . . . . . . . . . . . . . . . . . . . . . . . $ (6.14) $ (3.40) $ (2.32) $ (2.07)
Weighted-Average Shares OutstandingBasic . . . . . . . . . . . . . . . . . . . . . . . . . . . . . . . . . . . . . . . . . . . . . . . . . . . . . 45,772 45,751 45,722 45,501Diluted . . . . . . . . . . . . . . . . . . . . . . . . . . . . . . . . . . . . . . . . . . . . . . . . . . . . 45,772 45,751 45,722 45,501
(1) General and administrative expenses for the 2007 fourth quarter include the impact of approximately $10 million of accrualsfrom prior quarters which were reversed in the fourth quarter due to changes in the estimated and actual 2007 bonuspayments.
(2) Net loss in the 2007 fourth quarter includes the impact of recording a valuation allowance of $160.0 million against ourdeferred tax assets.
- 24 -

Quarter
Fourth Third Second First
2006Home sales revenue . . . . . . . . . . . . . . . . . . . . . . . . . . . . . . . . . . . . . . . . . . . . $1,294,140 $1,050,700 $1,188,561 $1,117,155Total revenue . . . . . . . . . . . . . . . . . . . . . . . . . . . . . . . . . . . . . . . . . . . . . . . . . $1,343,413 $1,080,923 $1,231,981 $1,145,425Asset impairments . . . . . . . . . . . . . . . . . . . . . . . . . . . . . . . . . . . . . . . . . . . . . $ 91,252 $ 19,915 $ 260 $ 600General and administrative expenses . . . . . . . . . . . . . . . . . . . . . . . . . . . . . . $ 92,284 $ 99,779 $ 115,551 $ 111,265Net (loss) income . . . . . . . . . . . . . . . . . . . . . . . . . . . . . . . . . . . . . . . . . . . . . . $ (6,365) $ 48,706 $ 76,491 $ 95,421Orders for homes, net (units) . . . . . . . . . . . . . . . . . . . . . . . . . . . . . . . . . . . . . 1,571 2,120 2,738 3,800Homes closed (units) . . . . . . . . . . . . . . . . . . . . . . . . . . . . . . . . . . . . . . . . . . . 3,594 2,955 3,376 3,198Homes in Backlog at period end (units) . . . . . . . . . . . . . . . . . . . . . . . . . . . . 3,638 5,661 6,496 7,134Estimated Backlog sales value at period end . . . . . . . . . . . . . . . . . . . . . . . . . $1,300,000 $2,100,000 $2,440,000 $2,700,000(Loss) earnings per share
Basic . . . . . . . . . . . . . . . . . . . . . . . . . . . . . . . . . . . . . . . . . . . . . . . . . . . . . $ (0.14) $ 1.08 $ 1.70 $ 2.13Diluted . . . . . . . . . . . . . . . . . . . . . . . . . . . . . . . . . . . . . . . . . . . . . . . . . . . . $ (0.14) $ 1.06 $ 1.66 $ 2.08
Weighted-Average Shares OutstandingBasic . . . . . . . . . . . . . . . . . . . . . . . . . . . . . . . . . . . . . . . . . . . . . . . . . . . . . 45,073 44,972 44,939 44,820Diluted . . . . . . . . . . . . . . . . . . . . . . . . . . . . . . . . . . . . . . . . . . . . . . . . . . . . 45,073 45,868 45,972 45,970
Item 7. Management’s Discussion and Analysis of Financial Condition and Results of Operations.
The following discussion should be read in conjunction with, and is qualified in its entirety by, the ConsolidatedFinancial Statements and Notes thereto included elsewhere in this Annual Report on Form 10-K. This item containsforward-looking statements that involve risks and uncertainties. Actual results may differ materially from thoseindicated in such forward-looking statements. Factors that may cause such a difference include, but are not limitedto, those discussed in “Item 1A: Risk Factors Relating to our Business.”
EXECUTIVE SUMMARY
The 2006 calendar year reflected the acceleration of a dramatic downturn in the homebuilding industry. Thechallenges we encountered intensified significantly during 2007 and expanded beyond homebuilding into themortgage lending industry and the credit and capital markets. As a result, during 2007, the homebuilding sectorexperienced what appeared to be an extraordinary absence of consumer demand for new homes. We responded tothese conditions in a number of ways. However, we were not immune to the uncertainties in the wider credit andcapital markets. We believe that the stability of these markets will play a major role in the timing, strength andsustainability of a turnaround in the homebuilding and mortgage lending industries. Additionally, while certaingovernmental agencies and other mortgage industry participants have taken steps recently to ease the downturn in thecredit, capital and homebuilding markets, we cannot provide any assurance as to the impact their efforts will have onour Company or the homebuilding industry as a whole, as the on-going severity and duration of this downturncontinues to be unknown. See “Forward-Looking Statements” below.
Each of our homebuilding segments and our Financial Services and Other segment continued to be impacted bythe downturn in the homebuilding and mortgage lending industries, which we believe included, among other things,on-going homebuyer concerns about declines in the market value of homes, as well as reduced availability of creditfor homebuyers caused by tightening mortgage loan underwriting criteria and an overall reduction in liquidity in themortgage industry. We believe these and other factors contributed to, among other things: (1) significant increases incompetition for new home orders driven by builders that significantly cut new home sales prices; (2) continued highlevels of home sales incentives and, in many cases, increased home sales incentives offered to stimulate new homeorders and maintain previous home orders in Backlog (as defined below) until they close; (3) high levels offoreclosures, which contributed to an excess supply of homes available to be purchased; (4) prospective homebuyers
- 25 -

having a more difficult time selling their existing homes in this increasingly competitive environment; and (5) reducedaffordability of homes, partially due to the increased difficulty confronted by homebuyers in trying to qualify formortgage loans or provide sufficient down payments for mortgage loans for which they qualify.
For MDC, these conditions resulted in an increased Cancellation Rate (as defined below), fewer closed homes,decreased new home orders, reduced year-over-year Backlog and lower Home Gross Margins (as defined below) in2007, resulting in asset impairments of $726.6 million recorded during the year ended December 31, 2007. As aconsequence, we incurred a pre-tax loss of $756.5 million during 2007, compared with pre-tax income of$333.1 million during 2006. Additionally, we incurred a net loss of $636.9 million during 2007, which includes theimpact of a $160.0 million valuation allowance recorded against our deferred tax assets, compared with net income of$214.3 million during 2006. Because of the uncertainty surrounding the severity and duration of the downturn in thehomebuilding and mortgage lending industries, we are unable to determine the potential for net losses in futurereporting periods. See “Forward-Looking Statements” below.
Recognizing the challenges presented by the downturn in the homebuilding and mortgage lending businesses,our management focused on the following throughout 2007:
• We continued our efforts to right-size our operations in an attempt to reduce our general and administrativeexpenses in response to significant decreases in the number of homes sold and closed by:
• consolidating homebuilding divisions in several of our markets;
• eliminating most of our regional homebuilding offices;
• consolidating office space and vacating a number of office facilities in many of our markets; and
• reducing Company-wide headcount across all departments.
• We increased our efforts to control costs through continued renegotiations of material and labor costs withour suppliers and subcontractors.
• We lowered our portfolio of lots owned and controlled in each market by:
• limiting the purchase of lots;
• selling land that no longer met our strategic objectives;
• terminating option contracts to purchase lots that no longer satisfied our underwriting criteria; and
• constructing, selling and closing homes in the ordinary course of business;
• We limited our cash outflows through tighter controls over:
• land acquisition expenditures;
• land development and home construction costs; and
• construction of speculative inventories and new home starts.
- 26 -
• We strengthened our management of risks associated with the origination and subsequent sales of mortgageloan products by:
• tightening our mortgage loan underwriting criteria;
• originating mortgage loan products for which our customers might qualify, such as government loans,that conform to HomeAmerican’s tightened mortgage underwriting criteria;
• limiting representations and warranties, including certain borrower payment default provisions onmortgage loans HomeAmerican sold to third-party purchasers; and
• reducing and/or eliminating the origination of higher risk mortgage loans, including Alt-A (as definedbelow), second mortgages and sub-prime (as defined below) loans.
• We focused more closely on sales initiatives intended to generate traffic, new home orders and maintainhome orders in Backlog until they close, including targeted sales and marketing programs and increasedhome sales incentives.
• We expanded the scope of our national customer experience initiative, which is intended to improve thehome buying and home ownership experience.
CRITICAL ACCOUNTING ESTIMATES AND POLICIES
The preparation of financial statements in conformity with accounting policies generally accepted in the UnitedStates of America requires management to make estimates and assumptions that affect the reported amounts of assetsand liabilities at the date of the consolidated financial statements and the reported amounts of revenue and expensesduring the reporting period. Management bases its estimates and judgments on historical experience and on variousother factors that are believed to be reasonable under the circumstances, the results of which form the basis formaking judgments about the carrying value of assets and liabilities that are not readily apparent from other sources.Management evaluates such estimates and judgments on an on-going basis and makes adjustments as deemednecessary. Actual results could differ from these estimates using different estimates and assumptions, or if conditionsare significantly different in the future. See “Forward-Looking Statements” above.
Listed below are those estimates and policies that we believe are critical and require the use of complexjudgment in their application. Our critical accounting estimates and policies are as follows and should be read inconjunction with the Notes to our Consolidated Financial Statements.
Homebuilding Inventory Valuation (Held-for-Development). Our homebuilding inventories accounted for on aheld-for-development basis include assets associated with subdivisions in which we intend to construct and sell homeson the land. Each such subdivision represents the lowest level of identifiable cash flows. The inventory in ourheld-for-development subdivisions also includes assets associated with model and speculative homes. Homebuildinginventories that are accounted for as held-for-development are carried at cost unless events and circumstances indicatethat the carrying value of the underlying subdivision may not be recoverable. In making this determination, wereview, among other things, the following for each subdivision:
• actual and trending “Operating Profit” (which is defined as home sales revenue less home cost of sales andall direct incremental costs associated with the home closing) for homes closed in the (1) prior twocompleted fiscal quarters on an individual basis; (2) current fiscal quarter; (3) last six months; and (4) lasttwelve months;
• estimated future undiscounted cash flows and Operating Profit;• forecasted Operating Profit for homes in Backlog;• actual and trending net and gross home orders;
- 27 -

• base sales price and home sales incentive information for homes that (1) closed in the prior two completedfiscal quarters; (2) closed in the current fiscal quarter; (3) are in Backlog as of the end of the current fiscalquarter; and (4) are forecasted to close over the remaining life of the subdivision;
• market information for each sub-market, including competition levels and the size and style of homescurrently being offered for sale; and
• known or probable events indicating that the carrying value may not be recoverable.
On a quarterly basis, if events or circumstances indicate that the carrying value of our held-for-developmentinventory may not be recoverable, such assets are reviewed for impairment by comparing the undiscounted estimatedfuture cash flows from an individual subdivision to its carrying value in accordance with Statement of FinancialAccounting Standards (“SFAS”) No. 144, “Accounting for the Impairment or Disposal of Long-Lived Assets”(“SFAS 144”). The evaluation for the recoverability of the carrying value of the assets for each individual subdivisioncan be impacted significantly by the following:
• estimates of future base selling prices;• estimates of future home sales incentives; and• estimates of future home construction and land development costs.
These estimates are dependent on specific market or sub-market conditions for each subdivision. While weconsider available information to determine what we believe to be our best estimates as of the end of a reportingperiod, these estimates are subject to change in future reporting periods as facts and circumstances change. Localmarket-specific conditions that may impact these estimates for a subdivision include:
• historical subdivision results, and actual and trending Operating Profit, base selling prices and home salesincentives;
• forecasted Operating Profit for homes in Backlog;
• the intensity of competition within a market or sub-market, including publicly available home sales pricesand home sales incentives offered by our competitors;
• the current sales pace for active subdivisions;
• subdivision specific attributes, such as location, availability of lots in the sub-market, desirability anduniqueness of subdivision location and the size and style of homes currently being offered;
• potential for alternative home styles to respond to local market conditions;
• changes by management in the sales strategy of a given subdivision; and
• current local market economic and demographic conditions and related trends and forecasts.
These and other local market-specific conditions that may be present are considered by personnel in ourhomebuilding divisions as they prepare or update the forecasted assumptions for each subdivision. Quantitative andqualitative factors other than home sales prices could significantly impact the potential for future impairments. Thesales objectives can differ between subdivisions, even within a given sub-market. For example, facts andcircumstances in a given subdivision may lead us to price our homes with the objective of yielding a higher salesabsorption pace, while facts and circumstances in another subdivision may lead us to price our homes to minimizedeterioration in our Home Gross Margins, although, it may result in a slower sales absorption pace. Furthermore, thekey assumptions included in our estimated future undiscounted cash flows may be interrelated. For example, adecrease in estimated base sales price or an increase in home sales incentives may result in a corresponding increasein sales absorption pace. Additionally, a decrease in the average sales price of homes to be sold and closed in futurereporting periods for one subdivision that has not been generating what management believes to be an adequate sales
- 28 -

absorption pace may impact the estimated cash flow assumptions of a nearby subdivision. Changes in our keyassumptions, including estimated construction and development costs, absorption pace, selling strategies or discountrates could materially impact future cash flow and fair value estimates. Due to the number of possible scenarios thatwould result from various changes in these factors, we do not believe it is possible to develop a sensitivity analysiswith a level of precision that would be meaningful to an investor.
If the undiscounted future cash flows of a subdivision are less than its carrying value, the carrying value of thesubdivision is written down to its then estimated fair value. For subdivisions that continue to be held-for-development,the carrying value is not written up for increases in the estimated fair value of such subdivisions in subsequentreporting periods.
Management determines the estimated fair value of each held-for-development subdivision by determining thepresent value of the estimated future cash flows at discount rates that are commensurate with the risk of thesubdivision under evaluation. The estimated future cash flows are the same for both our recoverability and fair valueassessments. Factors we consider when determining the discount rate to be used for each subdivision include, amongothers:
• the number of lots in a given subdivision;
• the amount of future land development costs to be incurred;
• risks associated with the home construction process, including the stage of completion for the entiresubdivision and the number of owned lots under construction;
• market risks, including volatility in home prices and risks associated with markets with high average sellingprices of homes; and
• the estimated remaining lifespan of the subdivision.
For the year ended December 31, 2007, discount rates used in our estimated discounted cash flow assessmentsranged from 10% to 18%. For our held-for-development inventory, we recorded $169.9 million and $515.6 million,respectively, of impairments to our housing completed or under construction and land and land under developmentduring the year ended December 31, 2007. The Company allocates the impairments recorded between housingcompleted or under construction and land and land under development for each impaired subdivision based upon thestatus of construction of a home on each lot (i.e. if the lot is in housing completed or under construction, theimpairment for that lot is recorded against housing completed or under construction). The allocation of impairment isthe same to each lot in a given subdivision. These impairments, together with impairments of our held-for-saleinventory and intangible assets, are presented as a separate line in the Consolidated Statements of Operations.Changes in management’s estimates, particularly the timing and amount of the estimated future cash inflows andoutflows, forecasted average selling prices of homes to be sold and closed and the present value discount rate used inthe fair value calculation, can materially affect any impairment calculation. Because our forecasted cash flows areimpacted significantly by changes in market conditions, it is reasonably possible that actual results could differ fromthose estimates.
Homebuilding Inventory Valuation (Held-for-Sale). We record land held-for-sale at the lower of its carryingvalue or fair value less costs to sell. In accordance with SFAS 144, the classification of land as held-for-sale is basedon the following criteria:
• management, having the authority to approve the action, commits to a plan to sell the asset;
• the asset is available for immediate sale in its present condition, subject only to terms that are usual andcustomary for sales of such assets;
- 29 -

• an active program to locate a buyer and other actions required to complete the plan to sell the asset havebeen initiated;
• the sale of the asset is probable, and transfer of the asset is expected to qualify for recognition as acompleted sale, within one year;
• the asset is being actively marketed for sale at a price that is reasonable in relation to its current fair value;and
• actions required to complete the plan indicate that it is unlikely that significant changes to the plan will bemade or that the plan will be withdrawn.
Additionally, in certain circumstances, management will re-evaluate the best use of an asset that is currentlybeing accounted for as held-for-development. In such situations, management will review, among other things:(1) average sales prices for homes that have closed, are in Backlog and forecasted for future sales; (2) currentcompetition levels and estimated levels of competition in future reporting periods; (3) estimated development coststhat have yet to be incurred; and (4) the total number of lots owned in each subdivision and surrounding areas. If,based upon this evaluation, management believes that the best use of the asset is the sale of the asset in its currentcondition, all or portions of the subdivision will be accounted for as held-for-sale, assuming all of the foregoingheld-for-sale criteria have been met at the end of the applicable reporting period.
In performing the impairment evaluation for land accounted for on a held-for-sale basis, management considers,among other things, prices for land in recent comparable sale transactions, market analysis studies, which include theestimated price a willing buyer would pay for the land (other than in a forced liquidation) and recent bona fide offersreceived from outside third-parties. If the estimated fair value less cost to sell an asset is less than the current carryingvalue, the asset is written down to its estimated fair value less cost to sell. We monitor the fair value of held-for-saleassets on a periodic basis through the disposition date. Subsequent increases in the fair value less cost to sell of aheld-for-sale asset, if any, is recognized as a decrease to impairments in our Consolidated Statements of Operationsduring such subsequent period, but not in excess of the cumulative impairment that was recorded previously while itwas a held-for-sale asset. During the years ended December 31, 2007 and 2006, we recorded impairments on ourheld-for-sale inventories of $40.7 million and $2.5 million, respectively.
Income Taxes—Valuation Allowance. In accordance with SFAS No. 109, “Accounting for Income Taxes,” avaluation allowance is recorded against a deferred tax asset if, based on the weight of available evidence, it is more-likely-than-not (a likelihood of more than 50%) that some portion, or all, of the deferred tax asset will not be realized.The realization of a deferred tax asset ultimately depends on the existence of sufficient taxable income in either thecarryback or carryforward periods under tax law. The four sources of taxable income to be considered in determiningwhether a valuation allowance is required include:
• future reversals of existing taxable temporary differences (i.e., offset gross deferred tax assets against grossdeferred tax liabilities);
• taxable income in prior carryback years;• tax planning strategies; and• future taxable income exclusive of reversing temporary differences and carryforwards.
Determining whether a valuation allowance for deferred tax assets is necessary requires an analysis of bothpositive and negative evidence regarding realization of the deferred tax assets. Examples of positive evidence mayinclude:
• a strong earnings history exclusive of the loss that created the deductible temporary differences, coupledwith evidence indicating that the loss is the result of an aberration rather than a continuing condition;
• an excess of appreciated asset value over the tax basis of a company’s net assets in an amount sufficient torealize the deferred tax asset; and
- 30 -

• existing Backlog that will produce more than enough taxable income to realize the deferred tax asset basedon existing sales prices and cost structures.
Examples of negative evidence may include:
• the existence of “cumulative losses” (defined as a pre-tax cumulative loss for the current and previous twoyears);
• an expectation of being in a cumulative loss position in a future reporting period;• a carryback or carryforward period that is so brief that it would limit the realization of tax benefits;• a history of operating loss or tax credit carryforwards expiring unused; and• unsettled circumstances that, if unfavorably resolved, would adversely affect future operations and profit
levels on a continuing basis.
The weight given to the potential effect of negative and positive evidence should be commensurate with theextent to which it can be objectively verified. A company must use judgment in considering the relative impact ofpositive and negative evidence. At December 31, 2007, after considering a number of factors, most notably ourexpectation of being in a three-year cumulative operating loss position during 2008, we established a valuationallowance of $160.0 million against our deferred tax assets.
Future adjustments, either increases or decreases, to our deferred tax asset valuation allowance will bedetermined based upon changes in the expected realization of our net deferred tax assets. For example, the valuationallowance could change significantly if the $160.6 million of net deferred tax assets still remaining atDecember 31, 2007 is not realized during fiscal 2008 through federal or state carryback or reversals of existingtaxable temporary differences. This could occur if actual levels of home closings and/or land sales during 2008 areless than currently projected. Additionally, our December 31, 2007 valuation allowance may be further impacted by,among other things:
• additional inventory impairments;• additional pre-tax operating losses; or• the utilization of tax planning strategies that could accelerate the realization of certain deferred tax assets
(for example, funding certain accrued liabilities such as employee vacation accruals or pension liabilities).
Because our valuation allowance can be impacted by any one or a combination of the foregoing factors, we donot believe it is possible to develop a sensitivity analysis associated with potential adjustments to the valuationallowance on our deferred tax assets. Additionally, due to the considerable estimates utilized in establishing thevaluation allowance and the potential for changes in facts and circumstances in future reporting periods, it isreasonably possible that we will be required to either increase or decrease our valuation allowance in future reportingperiods.
Income Taxes—FIN 48 (as defined below). We apply the interpretations prescribed by FASB InterpretationNo. (“FIN”) 48, “Accounting for Uncertainty in Income Taxes” (“FIN 48”) in accounting for the uncertainty inincome taxes recognized in our Consolidated Financial Statements. FIN 48 provides guidance for the recognition andmeasurement in financial statements for uncertain tax positions taken or expected to be taken in a tax return.
- 31 -

The evaluation of a tax position in accordance with FIN 48 is a two-step process, the first step being recognition.We determine whether it is more-likely-than-not that a tax position will be sustained upon tax examination, includingresolution of any related appeals or litigation, based on only the technical merits of the position. The technical meritsof a tax position derive from both statutory and judicial authority (legislation and statutes, legislative intent,regulations, rulings, and case law) and their applicability to the facts and circumstances of the tax position. If a taxposition does not meet the more-likely-than-not recognition threshold, the benefit of that position is not recognized inthe financial statements.
The second step is measurement. A tax position that meets the more-likely-than-not recognition threshold ismeasured to determine the amount of benefit to recognize in the financial statements. The tax position is measured asthe largest amount of benefit that is greater than 50 percent likely of being realized upon ultimate resolution with ataxing authority.
Revenue Recognition. We recognize revenue from home closings and land sales in accordance withSFAS No. 66, “Accounting for Sales of Real Estate” (“SFAS 66”). Accordingly, revenue is recognized when: (1) theclosing has occurred; (2) title has passed to the buyer; (3) possession and other attributes of ownership have beentransferred to the buyer; (4) we are not obligated to perform significant additional activities after closing and delivery;and (5) the buyer demonstrates a commitment to pay for the property through an adequate initial and continuinginvestment. In accordance with SFAS 66, the buyer’s initial investment shall include: (1) cash paid as a downpayment; (2) the buyer’s notes supported by irrevocable letters of credit; (3) payments made by the buyer to third-parties to reduce existing indebtedness on the property; and (4) other amounts paid by the buyer that are part of thesales value of the property. For home closings, we evaluate the initial investment for home purchase financingprovided under Federal Housing Administration (“FHA”)-insured and Veterans Administration (“VA”)-guaranteedloans in accordance with Emerging Issues Task Force (“EITF”) No. 87-9, “Profit Recognition on Sales of Real Estatewith Insured Mortgages or Surety Bonds,” and for all other home purchase financing in accordance with SFAS 66 andEITF No. 88-24, “Effect of Various Forms of Financing under FASB Statement No. 66.”
For home closings, if the homebuyer has sufficient initial and continuing investment, and all other revenuerecognition criteria have been met, revenue is recognized using the full accrual method as provided in SFAS 66 on thedate of closing. For a home closing in which HomeAmerican originates the mortgage loan and the homebuyer doesnot provide a sufficient initial and continuing investment, we utilize the installment method of accounting inaccordance with SFAS 66. Accordingly, the corresponding Operating Profit is deferred and subsequently recognizedon the date that HomeAmerican sells the homebuyer’s loan, or loans, to a third-party purchaser. We had $1.4 millionand $23.1 million in deferred Operating Profits associated with homes that closed for which the initial or continuinginvestment criteria were not met as of December 31, 2007 and December 31, 2006, respectively. The deferral ofOperating Profits is recorded as a reduction to home sales revenue in the Consolidated Statements of Operations.
In accordance with SFAS No. 140, “Accounting for Transfers and Servicing of Financial Assets andExtinguishments of Liabilities” (“SFAS 140”), a sale of a homebuyer loan has occurred when the following criteriahave been met: (1) the payment from the third-party purchaser is not subject to future subordination; (2) we havetransferred all the usual risks and rewards of ownership that is in substance a sale; and (3) we do not have asubstantial continuing involvement with the loan. Factors that we consider in assessing whether a sale of a mortgageloan has occurred in accordance with SFAS 140 include, among other things: (1) the recourse, if any, toHomeAmerican for credit and interest rate risk; (2) the right or obligation, if any, of HomeAmerican to repurchase theloan; and (3) the control HomeAmerican retains, or is perceived to retain, over the administration of the loan post-closing.
Income with respect to loan origination fees, net of certain direct loan origination costs incurred, and loancommitment fees are deferred and amortized over the life of the loan. Revenue from the sale of mortgage loan
- 32 -

servicing is recognized upon the exchange of consideration for the mortgage loans and related servicing rightsbetween us and the third-party purchaser in accordance with the provisions of SFAS 140. Based upon the currentterms of HomeAmerican’s contracts, exchange of consideration is deemed effective when we receive the proceedsfrom the third-party purchaser and when the specified records are delivered, either electronically or manually, to thethird-party purchaser.
Segment Reporting. The application of SFAS No. 131, “Disclosures about Segments of an Enterprise andRelated Information” (“SFAS 131”), requires significant judgment in determining our operating segments. SFAS 131defines operating segments as a component of an enterprise for which discrete financial information is available and isreviewed regularly by the chief operating decision-maker, or decision-making group, to evaluate performance andmake operating decisions. We have identified our chief operating decision-makers (“CODMs”) as three keyexecutives—the Chief Executive Officer, Chief Operating Officer and Chief Financial Officer.
We have identified each homebuilding subdivision as an operating segment in accordance with SFAS 131. Eachhomebuilding subdivision engages in business activities from which it earns revenue primarily from the sale of single-family detached homes, generally to first-time and first-time move-up homebuyers. Subdivisions in the reportablesegments noted below have been aggregated because they are similar in the following regards: (1) economiccharacteristics; (2) housing products; (3) class of homebuyer; (4) regulatory environments; and (5) methods used toconstruct and sell homes. In making the determination of whether or not our markets demonstrate similar economiccharacteristics, we review, among other things, actual and trending Home Gross Margins for homes closed within eachmarket and forecasted Home Gross Margins. Accordingly, we may be required to reclassify our reportable segments ifmarkets that currently are being aggregated do not continue to demonstrate similar economic characteristics.
Our homebuilding reportable segments are as follows:
• West (Arizona, California and Nevada);• Mountain (Colorado and Utah);• East (Virginia and Maryland); and• Other Homebuilding (Delaware Valley, Florida and Illinois)
Stock-Based Compensation. We account for share-based payment awards, generally grants of stock options andrestricted stock, in accordance with the provisions of SFAS No. 123 (revised 2004), “Share-Based Payment” (“SFAS123(R)”), which can require significant judgment in estimating the fair value of the share-based payment awards andrelated compensation. Stock-based compensation expense was $12.5 million and $16.6 million for the years endedDecember 31, 2007 and 2006, respectively, and was recorded to general and administrative expenses in theConsolidated Statements of Operations. See Note 14 to the Consolidated Financial Statements for a further discussionon share-based payment awards.
Determining the appropriate fair value model and calculating the fair value of share-based payment awardsrequires judgment, including estimating stock price volatility, annual forfeiture rates and the expected life of anaward. We estimated the fair value for stock options granted during the twelve months ended December 31, 2007 and2006 using the Black-Scholes option pricing model. The Black-Scholes option pricing model calculates the estimatedfair value of stock options based upon the following inputs: (1) closing price of the Company’s common stock on themeasurement date (generally the date of grant); (2) exercise price; (3) expected stock option life; (4) expectedvolatility; (5) risk-free interest rate; and (6) dividend yield rate. The expected volatility is based on the historicalvolatility in the price of our common stock over the most recent period commensurate with the estimated expected lifeof our employee stock options, adjusted for the impact of unusual fluctuations not reasonably expected to recur andother relevant factors. The risk-free interest rate assumption is determined based upon observed interest ratesappropriate for the expected term of our employee stock options. The dividend yield assumption is based on our
- 33 -

historical and expected dividend payouts. The expected life of employee stock options represents the weighted-average period for which the stock options are expected to remain outstanding and is derived primarily from historicalexercise patterns. We determine the estimated fair value of the share-based payment awards in accordance with theprovisions of SFAS 123(R) on the date they were granted. The fair values of previously granted share-based paymentawards are not adjusted as subsequent changes in the foregoing assumptions occur, for example, an increase ordecrease in the price of the Company’s common stock. However, changes in the foregoing inputs, particularly theprice of the Company’s common stock, expected stock option life and expected volatility, significantly change theestimated fair value of future grants of stock options.
SFAS 123(R) requires an annual forfeiture rate to be estimated at the time of grant for all awards grantedsubsequent to January 1, 2006, and revised, if necessary, in subsequent periods if the actual forfeiture rate differs fromour estimate. In accordance with SFAS 123(R), we have estimated an annual forfeiture rate to be applied to all share-based payment awards that were unvested at December 31, 2005 in determining the number of awards expected tovest in the future. We estimated the annual forfeiture rate generally to be 25% for share-based payment awardsgranted to Non-Executives (as defined in Note 14 to our Consolidated Financial Statements) and 0% for share-basedpayment awards granted to Executives and Directors (as defined in Note 14 to our Consolidated FinancialStatements), based on the terms of their awards, as well as historical forfeiture experience.
Home Cost of Sales. Home cost of sales includes the specific construction costs of each home and all applicableland acquisition, land development and related costs, both incurred and estimated to be incurred, warranty costs andfinance and closing costs. We use the specific identification method for the purpose of accumulating homeconstruction costs and an average cost method to allocate land acquisition and development costs to each home. Werecord all home cost of sales when a home is closed on a house-by-house basis.
When a home is closed, we generally have not yet paid and recorded all costs necessary to complete theconstruction of the home and certain land development costs. At the time of a home closing, we compare our homeconstruction budgets to actual recorded costs to determine the additional costs remaining to be paid on each closedhome. For amounts not incurred or paid as of the time of closing a home, we record an estimated accrual associated withcertain land development and home construction costs. Generally, these accruals are established based upon contractedwork for which payment has yet to be made, open work orders not paid at the time of home closing, punch list itemsidentified during the course of the homebuyer’s final walkthrough of the home, as well as land completion costs. Theseaccruals represent estimates believed to be adequate to cover the expected remaining home construction and landdevelopment costs. We monitor the adequacy of these accruals on a house-by-house basis and in the aggregate on both amarket-by-market and consolidated basis. At December 31, 2007 and 2006, we had $42.3 million and $64.2 million,respectively, of land development and home construction accruals for closed homes. Actual results could differ fromsuch estimates.
Warranty Costs. Our homes are sold with limited third-party warranties. Warranty reserves are established ashomes close on a house-by-house basis in an amount estimated to be adequate to cover expected costs of materialsand outside labor during warranty periods. Reserves are determined based upon historical experience with respect tosimilar home designs and geographical areas. Certain factors are considered in determining the per-house reserveamount, including (1) the historical range of amounts paid per house; (2) the historical amount paid as a percent ofhome construction costs; (3) any warranty expenditures included in (1) and (2) not considered to be normal andrecurring; (4) improvements in quality control and construction techniques expected to impact future warrantyexpenditures; and (5) conditions that may affect certain subdivisions and require higher per-house reserves for thosespecific subdivisions. Accordingly, the process of determining our warranty reserves balance necessarily requiresestimates associated with various assumptions, each of which can positively or negatively impact the warrantyreserves balance.
- 34 -

Warranty payments are tracked on a house-by-house basis and are charged against the warranty reserveestablished for the house. Payments incurred after the close of a home are monitored to determine their nature and, tothe extent they are warranty-related payments, they are recorded against the warranty reserve. To the extent thisevaluation determines the payments made are related to completion of a home or land development, the payments arethen recorded against our land development and home construction accruals. Additional reserves are established forknown, unusual warranty-related expenditures not covered by the general warranty reserves. General warrantyreserves not utilized for a particular house are evaluated on a monthly basis for reasonableness in the aggregate onboth a market-by-market and consolidated basis. Warranty payments for an individual house may exceed the relatedreserve. Payments in excess of the reserve are evaluated on a monthly basis in the aggregate to determine if anadjustment to the warranty reserve should be recorded, which could result in a corresponding adjustment to home costof sales.
Generally, warranty reserves are reviewed monthly, using historical data and other relevant information, todetermine the reasonableness and adequacy of both the aggregate reserve and the per unit reserve amount originallyincluded in home cost of sales, as well as the timing of any reversals of the original reserve. We continue to evaluatethe adequacy of the warranty reserves and, based on historical results, believe that our existing estimation process ismaterially accurate and do not anticipate the process to change materially in the future. Because our warranty reservescan be impacted by a significant number of factors, we do not believe it is possible to develop a sensitivity analysiswith a level of precision that would be meaningful to an investor. However, it is at least reasonably possible thatchanges to our assumptions could have a material impact on our warranty reserves balance.
Insurance Reserves. We record expenses and liabilities for losses and loss adjustment expenses for claimsassociated with: (1) insurance policies issued by StarAmerican and Allegiant; (2) self-insurance; and (3) deductibleamounts under the Company’s insurance policies. The establishment of the provisions for outstanding losses and lossadjustment expenses is based on actuarial studies that include known facts and interpretation of circumstances,including our experience with similar cases and historical trends involving claim payment patterns, pending levels ofunpaid claims, product mix or concentration, claim severity, frequency patterns (such as those caused by naturaldisasters), fires or accidents, depending on the business conducted and changing regulatory and legal environments.The process of determining our insurance reserve balances necessarily requires estimates associated with variousassumptions, each of which can positively or negatively impact our insurance reserve balances. Accordingly, we donot believe it is possible to develop a sensitivity analysis with a level of precision that would be meaningful to aninvestor. However, it is at least reasonably possible that changes in the claim rate or the average cost per claim used toestimate the self-insured reserves could have a material impact on our insurance reserve balances.
Land Option Contracts. In the normal course of business, we enter into lot option purchase contracts, generallythrough a deposit of cash or letter of credit, for the right to purchase land or lots at a future point in time withpredetermined terms. Option deposits and pre-acquisition costs we incur related to our lot option purchase contractsare capitalized in accordance with SFAS No. 67, “Accounting for Costs and Initial Rental Operations of Real EstateProjects,” if all of the of the following conditions have been met: (1) the costs are directly identifiable with thespecific property; (2) the costs would be capitalized if the property were already acquired; and (3) acquisition of theproperty is probable meaning we are actively seeking and have the ability to acquire the property and there is noindication that the property is not available for sale. We also consider the following when determining if theacquisition of the property is probable: (1) changes in market conditions subsequent to contracting for the purchase ofthe land; (2) current contract terms, including, per lot price and required purchase dates; and (3) our current landposition in the given market or sub-market. Option deposits and capitalized pre-acquisition costs are expensed togeneral and administrative expense in the Consolidated Statements of Operations when we believe it is no longerprobable that we will acquire the lots under option. We expensed $23.4 million, $29.7 million and $10.4 million forthe years ended December 31, 2007, 2006 and 2005, respectively, related to the write-off of option deposits and
- 35 -

capitalized pre-acquisition costs. At December 31, 2007, we had the right to acquire 3,615 lots under option contracts,with approximately $6.3 million and $6.5 million in non-refundable cash and letters of credit option deposits at risk,respectively, and $1.4 million in capitalized pre-acquisition costs.
We also evaluate these transactions in accordance with revised FIN 46, “Consolidation of Variable InterestEntities,” as amended (“FIN 46R”). Our obligation with respect to option contracts generally is limited to forfeiture ofthe related non-refundable cash deposits and/or letters of credit. At December 31, 2007, the total purchase price forlots under option was $419 million. Pursuant to FIN 46R, certain of these contracts could create a variable interest,with the land seller being the variable interest entity (“VIE”) and, as such, could require us to consolidate the assetsand liabilities of the VIE. We have evaluated all lot option purchase contracts that were executed or had significantmodifications during 2007 pursuant to FIN 46R, and considered (1) what investments were at risk; (2) contractualobligations to perform; (3) expected changes in market prices of land over a given period; and (4) annual risk freeinterest rates. Based on these evaluations, we determined that our interests in these VIEs did not result in significantvariable interests or require us to consolidate the VIEs. Due to the nature of the assumptions used in our evaluationprocess, it is possible that our evaluation of lot option contracts in the future could result in MDC being identified asthe primary beneficiary, which could result in our consolidation of a VIE.
Since we own no equity interest in any of the unaffiliated VIEs that we must evaluate pursuant to FIN 46R,certain assumptions about the assets and liabilities of such entities are required. In most cases, the fair values of theassets of the evaluated VIEs have been assumed to be the remaining contractual purchase price of the land or lots weare purchasing.
We periodically enter into lot option arrangements with third-parties that will purchase or have purchasedproperty at our direction which we may later acquire. We evaluate these transactions in accordance with FIN 46R, aswell as under SFAS No. 49, “Accounting for Product Financing Arrangements” (“SFAS 49”), to determine if weshould record an asset and liability at the time we enter into the lot option contract. Factors considered include(1) amount of deposit at risk; (2) loss of anticipated future operating income associated with selling homes;(3) unreimbursed commitments to incur costs associated with lots; and (4) the uniqueness or location of the lots.Based upon these evaluations of lot option purchase contracts executed during 2007, we determined that no asset orliability was required to be recorded prior to the date of purchase.
- 36 -
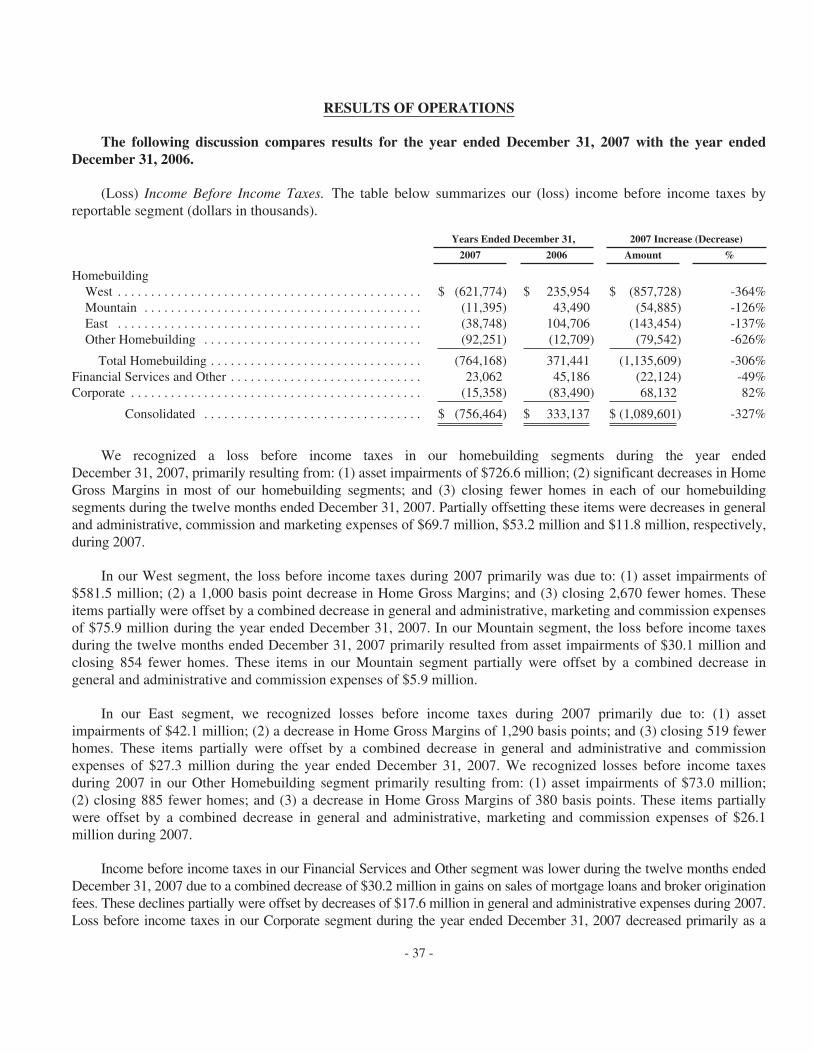
RESULTS OF OPERATIONS
The following discussion compares results for the year ended December 31, 2007 with the year endedDecember 31, 2006.
(Loss) Income Before Income Taxes. The table below summarizes our (loss) income before income taxes byreportable segment (dollars in thousands).
Years Ended December 31, 2007 Increase (Decrease)
2007 2006 Amount %
HomebuildingWest . . . . . . . . . . . . . . . . . . . . . . . . . . . . . . . . . . . . . . . . . . . . . . $ (621,774) $ 235,954 $ (857,728) -364%Mountain . . . . . . . . . . . . . . . . . . . . . . . . . . . . . . . . . . . . . . . . . . (11,395) 43,490 (54,885) -126%East . . . . . . . . . . . . . . . . . . . . . . . . . . . . . . . . . . . . . . . . . . . . . . (38,748) 104,706 (143,454) -137%Other Homebuilding . . . . . . . . . . . . . . . . . . . . . . . . . . . . . . . . . (92,251) (12,709) (79,542) -626%
Total Homebuilding . . . . . . . . . . . . . . . . . . . . . . . . . . . . . . . . (764,168) 371,441 (1,135,609) -306%Financial Services and Other . . . . . . . . . . . . . . . . . . . . . . . . . . . . . 23,062 45,186 (22,124) -49%Corporate . . . . . . . . . . . . . . . . . . . . . . . . . . . . . . . . . . . . . . . . . . . . (15,358) (83,490) 68,132 82%
Consolidated . . . . . . . . . . . . . . . . . . . . . . . . . . . . . . . . . $ (756,464) $ 333,137 $ (1,089,601) -327%
We recognized a loss before income taxes in our homebuilding segments during the year endedDecember 31, 2007, primarily resulting from: (1) asset impairments of $726.6 million; (2) significant decreases in HomeGross Margins in most of our homebuilding segments; and (3) closing fewer homes in each of our homebuildingsegments during the twelve months ended December 31, 2007. Partially offsetting these items were decreases in generaland administrative, commission and marketing expenses of $69.7 million, $53.2 million and $11.8 million, respectively,during 2007.
In our West segment, the loss before income taxes during 2007 primarily was due to: (1) asset impairments of$581.5 million; (2) a 1,000 basis point decrease in Home Gross Margins; and (3) closing 2,670 fewer homes. Theseitems partially were offset by a combined decrease in general and administrative, marketing and commission expensesof $75.9 million during the year ended December 31, 2007. In our Mountain segment, the loss before income taxesduring the twelve months ended December 31, 2007 primarily resulted from asset impairments of $30.1 million andclosing 854 fewer homes. These items in our Mountain segment partially were offset by a combined decrease ingeneral and administrative and commission expenses of $5.9 million.
In our East segment, we recognized losses before income taxes during 2007 primarily due to: (1) assetimpairments of $42.1 million; (2) a decrease in Home Gross Margins of 1,290 basis points; and (3) closing 519 fewerhomes. These items partially were offset by a combined decrease in general and administrative and commissionexpenses of $27.3 million during the year ended December 31, 2007. We recognized losses before income taxesduring 2007 in our Other Homebuilding segment primarily resulting from: (1) asset impairments of $73.0 million;(2) closing 885 fewer homes; and (3) a decrease in Home Gross Margins of 380 basis points. These items partiallywere offset by a combined decrease in general and administrative, marketing and commission expenses of $26.1million during 2007.
Income before income taxes in our Financial Services and Other segment was lower during the twelve months endedDecember 31, 2007 due to a combined decrease of $30.2 million in gains on sales of mortgage loans and broker originationfees. These declines partially were offset by decreases of $17.6 million in general and administrative expenses during 2007.Loss before income taxes in our Corporate segment during the year ended December 31, 2007 decreased primarily as a
- 37 -

result of: (1) a $29.0 million increase in interest income, net; (2) $10.3 million in gains recognized on the sale of twoaircraft; and (3) decreases of $24.9 million in general and administrative expense.
Total Revenue. The table below summarizes total revenue by reportable segment (dollars in thousands).
Years Ended December 31, 2007 Increase (Decrease)
2007 2006 Amount %
HomebuildingWest . . . . . . . . . . . . . . . . . . . . . . . . . . . . . . . . . . . . . . . . . . . . . . $ 1,725,766 $ 2,871,040 $ (1,145,274) -40%Mountain . . . . . . . . . . . . . . . . . . . . . . . . . . . . . . . . . . . . . . . . . . 549,771 730,489 (180,718) -25%East . . . . . . . . . . . . . . . . . . . . . . . . . . . . . . . . . . . . . . . . . . . . . . 318,723 628,508 (309,785) -49%Other Homebuilding . . . . . . . . . . . . . . . . . . . . . . . . . . . . . . . . . 253,627 493,628 (240,001) -49%
Total Homebuilding . . . . . . . . . . . . . . . . . . . . . . . . . . . . . . . . 2,847,887 4,723,665 (1,875,778) -40%Financial Services and Other . . . . . . . . . . . . . . . . . . . . . . . . . . . . . 63,508 103,243 (39,735) -38%Corporate . . . . . . . . . . . . . . . . . . . . . . . . . . . . . . . . . . . . . . . . . . . . 41,839 1,788 40,051 N/AIntercompany adjustments . . . . . . . . . . . . . . . . . . . . . . . . . . . . . . . (19,985) (26,954) 6,969 26%
Consolidated . . . . . . . . . . . . . . . . . . . . . . . . . . . . . . . . . . . . . $ 2,933,249 $ 4,801,742 $ (1,868,493) -39%
The decrease in total revenue for our homebuilding segments during the year ended December 31, 2007 resulted froma significant decline in home sales revenue primarily due to: (1) closing a combined 4,928 fewer homes in ourhomebuilding segments, most notably in our West segment; and (2) decreases in the average sales price of homes closed inmost of our markets. Total revenue during 2007 for our Financial Services and Other segment decreased primarily fromlower gains on sales of mortgage loans, which were driven by: (1) originating significantly fewer mortgage loans as a resultof the declines in our home closing levels; (2) lower Capture Rates (as defined below) during 2007; and (3) a shift to a lessprofitable, but risk-mitigating, strategy of selling mortgage loan products faster after origination. Total revenue in ourCorporate segment improved during the twelve months ended December 31, 2007 due to an increase in interest incomegenerated from significantly higher cash balances throughout 2007, as well as the recognized gains on sale of two aircraft.
Inter-company adjustments relate to mortgage loan origination fees paid at the time of home closings by ourhomebuilding subsidiaries to HomeAmerican on behalf of our homebuyers. The 2007 decrease primarily resulted fromlower levels of home closings in each of our reportable segments.
Home Sales Revenue. The table below summarizes home sales revenue by reportable segment (dollars inthousands).
Years Ended December 31, 2007 Increase (Decrease)
2007 2006 Amount %
HomebuildingWest . . . . . . . . . . . . . . . . . . . . . . . . . . . . . . . . . . . . . . . . . . . . . . $ 1,676,731 $ 2,851,850 $ (1,175,119) -41%Mountain . . . . . . . . . . . . . . . . . . . . . . . . . . . . . . . . . . . . . . . . . . 539,692 728,135 (188,443) -26%East . . . . . . . . . . . . . . . . . . . . . . . . . . . . . . . . . . . . . . . . . . . . . . 317,111 624,865 (307,754) -49%Other Homebuilding . . . . . . . . . . . . . . . . . . . . . . . . . . . . . . . . . 252,432 472,660 (220,228) -47%
Total Homebuilding . . . . . . . . . . . . . . . . . . . . . . . . . . . . . . . . 2,785,966 4,677,510 (1,891,544) -40%Intercompany adjustments . . . . . . . . . . . . . . . . . . . . . . . . . . . . . . . (19,985) (26,954) 6,969 26%
Consolidated . . . . . . . . . . . . . . . . . . . . . . . . . . . . . . . . . . . . . $ 2,765,981 $ 4,650,556 $ (1,884,575) -41%
In our West segment, the 2007 decrease in home sales revenue primarily resulted from closing 2,670 fewerhomes, as well as lower average selling prices for homes closed in each market within this segment. Home sales
- 38 -

revenue in our Mountain segment decreased during the year ended December 31, 2007 due to closing 854 fewerhomes. This decrease partially was offset by higher average selling prices for homes closed in this segment during2007.
The decline in home sales revenue for the year ended December 31, 2007 in our East segment primarily was dueto lower average selling prices of closed homes in each market within this segment and the impact of closing 519fewer homes. Home sales revenue in our Other Homebuilding segment decreased during 2007 primarily due toclosing 885 fewer homes and lower average selling prices for homes closed in our Florida market. These itemspartially were offset by higher average selling prices of homes closed in our Delaware Valley market.
Land Sales Revenue. Land sales revenue was $50.1 million and $34.6 million during the years endedDecember 31, 2007 and 2006, respectively. Land sales revenue during 2007 primarily related to the sale of nearly2,000 lots in more than 20 subdivisions located primarily in California, Arizona, Nevada and Utah. The increaseduring 2007 primarily resulted from the continued deterioration in new home sales market that led us to theconclusion that the best use of these assets was to sell them in their current condition.
Other Revenue. The table below sets forth the components of other revenue (dollars in thousands).
Years Ended December 31, 2007 Increase (Decrease)
2007 2006 Amount %
Gains on sales of mortgage loans, net . . . . . . . . . . . . . . . . . . . . . . . . . . . . . $ 30,682 $ 58,262 $ (27,580) -47%Broker origination fees . . . . . . . . . . . . . . . . . . . . . . . . . . . . . . . . . . . . . . . . 7,014 9,632 (2,618) -27%Insurance revenue . . . . . . . . . . . . . . . . . . . . . . . . . . . . . . . . . . . . . . . . . . . . 17,241 25,367 (8,126) -32%Interest income, net . . . . . . . . . . . . . . . . . . . . . . . . . . . . . . . . . . . . . . . . . . . 37,322 8,303 29,019 350%Title and other . . . . . . . . . . . . . . . . . . . . . . . . . . . . . . . . . . . . . . . . . . . . . . . 24,879 15,011 9,868 66%
Total other revenue . . . . . . . . . . . . . . . . . . . . . . . . . . . . . . . . . . . . . . . . . $ 117,138 $ 116,575 $ 563 0%
Other revenue remained relatively constant during the year ended December 31, 2007 and primarily resultedfrom increases in interest income, net and title and other revenue. Interest income, net increased due to our cashbalances being significantly higher throughout 2007, resulting from our on-going efforts to limit inventoryacquisitions during the current homebuilding down cycle. Our cash and cash equivalents consisted of funds in highlyliquid, cash equivalents. Title and other revenue increased during 2007 primarily due to the sale of two aircraft, whichresulted in $10.3 million in gains. These increases to other revenue partially were offset by lower gains on sales ofmortgage loans as we originated fewer mortgage loans during 2007, due to MDC closing 38% fewer homes and adecline in our Capture Rate (as defined below).
- 39 -
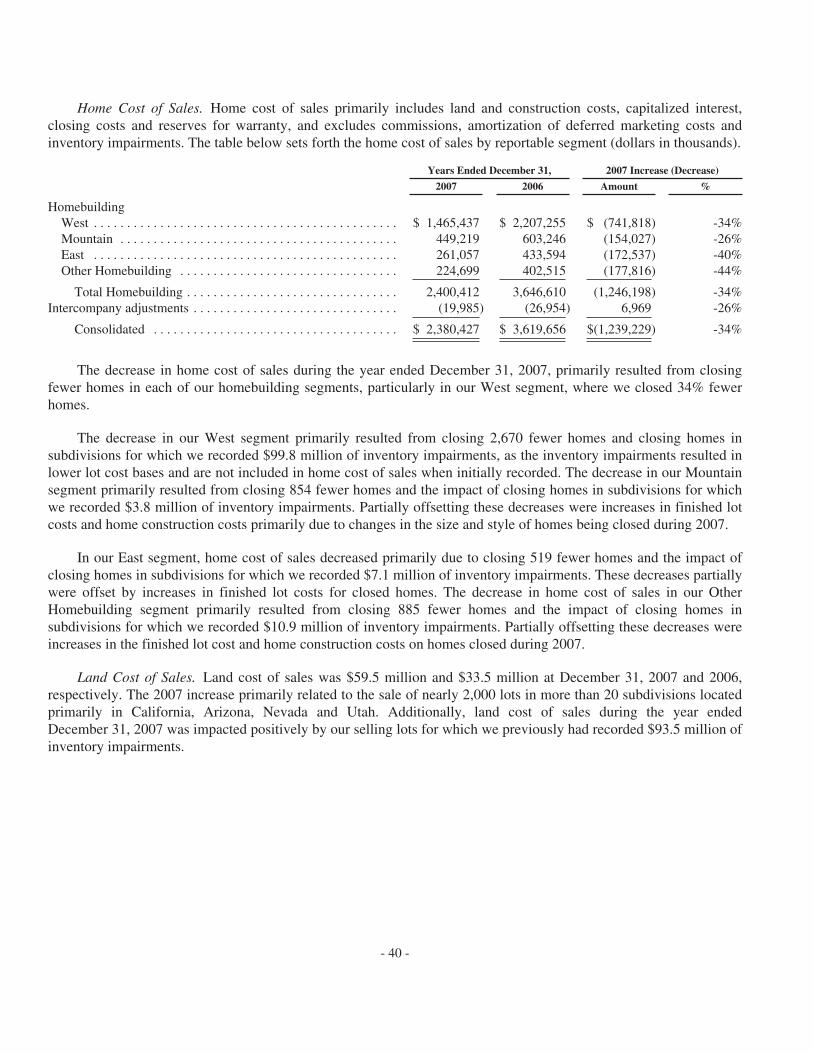
Home Cost of Sales. Home cost of sales primarily includes land and construction costs, capitalized interest,closing costs and reserves for warranty, and excludes commissions, amortization of deferred marketing costs andinventory impairments. The table below sets forth the home cost of sales by reportable segment (dollars in thousands).
Years Ended December 31, 2007 Increase (Decrease)
2007 2006 Amount %
HomebuildingWest . . . . . . . . . . . . . . . . . . . . . . . . . . . . . . . . . . . . . . . . . . . . . . $ 1,465,437 $ 2,207,255 $ (741,818) -34%Mountain . . . . . . . . . . . . . . . . . . . . . . . . . . . . . . . . . . . . . . . . . . 449,219 603,246 (154,027) -26%East . . . . . . . . . . . . . . . . . . . . . . . . . . . . . . . . . . . . . . . . . . . . . . 261,057 433,594 (172,537) -40%Other Homebuilding . . . . . . . . . . . . . . . . . . . . . . . . . . . . . . . . . 224,699 402,515 (177,816) -44%
Total Homebuilding . . . . . . . . . . . . . . . . . . . . . . . . . . . . . . . . 2,400,412 3,646,610 (1,246,198) -34%Intercompany adjustments . . . . . . . . . . . . . . . . . . . . . . . . . . . . . . . (19,985) (26,954) 6,969 -26%
Consolidated . . . . . . . . . . . . . . . . . . . . . . . . . . . . . . . . . . . . . $ 2,380,427 $ 3,619,656 $(1,239,229) -34%
The decrease in home cost of sales during the year ended December 31, 2007, primarily resulted from closingfewer homes in each of our homebuilding segments, particularly in our West segment, where we closed 34% fewerhomes.
The decrease in our West segment primarily resulted from closing 2,670 fewer homes and closing homes insubdivisions for which we recorded $99.8 million of inventory impairments, as the inventory impairments resulted inlower lot cost bases and are not included in home cost of sales when initially recorded. The decrease in our Mountainsegment primarily resulted from closing 854 fewer homes and the impact of closing homes in subdivisions for whichwe recorded $3.8 million of inventory impairments. Partially offsetting these decreases were increases in finished lotcosts and home construction costs primarily due to changes in the size and style of homes being closed during 2007.
In our East segment, home cost of sales decreased primarily due to closing 519 fewer homes and the impact ofclosing homes in subdivisions for which we recorded $7.1 million of inventory impairments. These decreases partiallywere offset by increases in finished lot costs for closed homes. The decrease in home cost of sales in our OtherHomebuilding segment primarily resulted from closing 885 fewer homes and the impact of closing homes insubdivisions for which we recorded $10.9 million of inventory impairments. Partially offsetting these decreases wereincreases in the finished lot cost and home construction costs on homes closed during 2007.
Land Cost of Sales. Land cost of sales was $59.5 million and $33.5 million at December 31, 2007 and 2006,respectively. The 2007 increase primarily related to the sale of nearly 2,000 lots in more than 20 subdivisions locatedprimarily in California, Arizona, Nevada and Utah. Additionally, land cost of sales during the year endedDecember 31, 2007 was impacted positively by our selling lots for which we previously had recorded $93.5 million ofinventory impairments.
- 40 -

Asset Impairments. The following tables set forth, by reportable segment, the asset impairments recorded for thetwelve months ended December 31, 2007 and 2006 (in thousands).
Year Ended December 31,2007 Increase
(Decrease)Land and Land Under Development (Held-for-Development) 2007 2006
West . . . . . . . . . . . . . . . . . . . . . . . . . . . . . . . . . . . . . . . . . . . . . . . . . . . . . . . $ 419,471 $ 69,231 $ 350,240Mountain . . . . . . . . . . . . . . . . . . . . . . . . . . . . . . . . . . . . . . . . . . . . . . . . . . . . 24,194 1,010 23,184East . . . . . . . . . . . . . . . . . . . . . . . . . . . . . . . . . . . . . . . . . . . . . . . . . . . . . . . . 29,057 6,331 22,726Other Homebuilding . . . . . . . . . . . . . . . . . . . . . . . . . . . . . . . . . . . . . . . . . . . 42,832 5,265 37,567
Subtotal . . . . . . . . . . . . . . . . . . . . . . . . . . . . . . . . . . . . . . . . . . . . . . . . . 515,554 81,837 433,717
Housing Completed or Under Construction (Held-for-Development)West . . . . . . . . . . . . . . . . . . . . . . . . . . . . . . . . . . . . . . . . . . . . . . . . . . . . . . . 135,081 20,636 114,445Mountain . . . . . . . . . . . . . . . . . . . . . . . . . . . . . . . . . . . . . . . . . . . . . . . . . . . . 5,912 882 5,030East . . . . . . . . . . . . . . . . . . . . . . . . . . . . . . . . . . . . . . . . . . . . . . . . . . . . . . . . 12,998 1,905 11,093Other Homebuilding . . . . . . . . . . . . . . . . . . . . . . . . . . . . . . . . . . . . . . . . . . . 15,901 1,618 14,283
Subtotal . . . . . . . . . . . . . . . . . . . . . . . . . . . . . . . . . . . . . . . . . . . . . . . . . 169,892 25,041 144,851
Land and Land Under Development (Held-for-Sale)West . . . . . . . . . . . . . . . . . . . . . . . . . . . . . . . . . . . . . . . . . . . . . . . . . . . . . . . 26,942 937 26,005Mountain . . . . . . . . . . . . . . . . . . . . . . . . . . . . . . . . . . . . . . . . . . . . . . . . . . . . — — —East . . . . . . . . . . . . . . . . . . . . . . . . . . . . . . . . . . . . . . . . . . . . . . . . . . . . . . . . — — —Other Homebuilding . . . . . . . . . . . . . . . . . . . . . . . . . . . . . . . . . . . . . . . . . . . 13,765 1,600 12,165
Subtotal . . . . . . . . . . . . . . . . . . . . . . . . . . . . . . . . . . . . . . . . . . . . . . . . . 40,707 2,537 38,170
Intangible Assets . . . . . . . . . . . . . . . . . . . . . . . . . . . . . . . . . . . . . . . . . . . . . . 468 2,612 (2,144)
Consolidated Asset Impairments . . . . . . . . . . . . . . . . . . . . . . . . . . . . . . . . . $ 726,621 $ 112,027 $ 614,594
The impairments recorded during 2007 increased significantly for each of our reportable segments, and mostnotably in our West segment. For each of our segments, the impairments on our held-for-development inventoryprimarily resulted from decreases in home sales prices and/or increases in home sales incentives offered in an effortto: (1) remain competitive with home sales prices currently being offered by the Company’s competitors; (2) stimulatenew home orders; (3) maintain homes in Backlog until they close; and (4) address affordability issues for new homesas homebuyers have been experiencing difficulty in qualifying for mortgage loans. The impairments on ourheld-for-development inventory in the West segment were significantly higher than impairments recorded in our otherhomebuilding segments. This primarily resulted from the following: (1) the fact that our owned lots and activesubdivisions in our West segment comprised nearly 53% of our consolidated owned lots and active subdivisions atDecember 31, 2007, and 61% and 50%, respectively, at December 31, 2006, resulting in approximately 48% and 62%of our total inventory being concentrated in our West segment at December 31, 2007 and 2006, respectively;(2) competition within the sub-markets of our West segment appeared to be more pronounced than in our otherhomebuilding segments and, as a result, we saw significant home price reductions offered by our competitors; (3) thehomebuyers in our West segment are comprised largely of entry level homebuyers, compared with a wider range ofhomebuyers in our other homebuilding segments, and their ability to obtain suitable mortgage loan financing has beenimpacted more adversely from the decreased availability of mortgage loan products; and (4) the market value ofhomes in Arizona, California and Nevada increased more significantly than in other segments during 2004 and 2005,in large part due to a greater number of investors purchasing homes on a speculative basis, resulting in the values ofhomes in these markets being susceptible to greater declines, due to, among other factors, the exit of investors fromthe new home sales market. Consequently, a majority of the active subdivisions within each market of our Westsegment were impaired during 2007.
- 41 -

During 2007, we recorded impairments of $40.7 million on our held-for-sale inventory. These impairmentsprimarily relate to inventory in the California market of our West segment and the Florida market of our OtherHomebuilding segment. The impairments in our West segment relate to approximately 400 lots in 6 subdivisions andprimarily resulted from a deterioration in related market conditions that led us to the conclusion that the best use ofthese assets is to sell them in their current condition. The impairments recorded in our Other Homebuilding segmentprimarily relate to assets in our Tampa sub-market, which we are in the process of exiting.
The following table sets forth the inventory impairments that were recorded on a quarterly basis during 2007 and2006, as well as the fair value of those inventories and the number of lots and subdivisions at the period end to whichthe impairments relate (dollars in thousands). The inventory impairments that we recorded during 2007 and 2006related primarily to inventories that were contracted for in 2004 and 2005.
Inventory Impairments for theThree Months Ended Fair Value of
ImpairedInventory atQuarter End
Number ofLots Impaired
During theQuarter
Number ofSubdivisions
ImpairedDuring the
QuarterHeld-for-
Development Held-for-Sale
TotalInventory
Impairments
March 31, 2007 . . . . . . . . . . . . . . . . . . . . . . . . . $ 136,422 $ 5,000 $ 141,422 $ 381,117 3,284 52June 30, 2007 . . . . . . . . . . . . . . . . . . . . . . . . . . . 158,642 2,408 161,050 448,372 4,427 83September 30, 2007 . . . . . . . . . . . . . . . . . . . . . . 242,782 6,168 248,950 873,038 7,074 132December 31, 2007 . . . . . . . . . . . . . . . . . . . . . . 147,600 27,131 174,731 397,045 4,891 153
Consolidated . . . . . . . . . . . . . . . . . . . . . . . $ 685,446 $ 40,707 $ 726,153
March 31, 2006 . . . . . . . . . . . . . . . . . . . . . . . . . $ — $ 600 $ 600 $ 16,394 301 6June 30, 2006 . . . . . . . . . . . . . . . . . . . . . . . . . . . — 260 260 2,457 11 1September 30, 2006 . . . . . . . . . . . . . . . . . . . . . . 19,175 740 19,915 86,125 399 13December 31, 2006 . . . . . . . . . . . . . . . . . . . . . . 87,703 937 88,640 353,758 2,287 52
Consolidated . . . . . . . . . . . . . . . . . . . . . . . $ 106,878 $ 2,537 $ 109,415
Marketing Expenses. The following table summarizes our marketing expenses by reportable segment (inthousands).
Year Ended December 31, 2007 Increase (Decrease)
2007 2006 Amount %
HomebuildingWest . . . . . . . . . . . . . . . . . . . . . . . . . . . . . . . . . . . . . . . . . . . . . . $ 70,539 $ 77,572 $ (7,033) -9%Mountain . . . . . . . . . . . . . . . . . . . . . . . . . . . . . . . . . . . . . . . . . . 21,019 20,739 280 1%East . . . . . . . . . . . . . . . . . . . . . . . . . . . . . . . . . . . . . . . . . . . . . . 13,395 13,045 350 3%Other Homebuilding . . . . . . . . . . . . . . . . . . . . . . . . . . . . . . . . . 12,135 17,500 (5,365) -31%
Consolidated . . . . . . . . . . . . . . . . . . . . . . . . . . . . . . . . . . . . . $ 117,088 $ 128,856 $ (11,768) -9%
Marketing expenses primarily include advertising, amortization of deferred marketing costs, model home expenses,compensation related expenses and other selling costs. Marketing expenses were lower in both our West and OtherHomebuilding segments during 2007, primarily resulting from decreases of $3.3 million and $2.5 million, respectively, inadvertising costs as we modified our marketing approach by shifting to lower cost advertising methods, and decreases of$5.2 million and $1.3 million, respectively, in amortization of deferred marketing costs resulting from closing fewer homesin each of these segments.
- 42 -

Commission Expenses. The following table summarizes our commission expenses by reportable segment (inthousands).
Year Ended December 31, 2007 Increase (Decrease)
2007 2006 Amount %
HomebuildingWest . . . . . . . . . . . . . . . . . . . . . . . . . . . . . . . . . . . . . . . . . . . . . . $ 59,890 $ 90,457 $ (30,567) -34%Mountain . . . . . . . . . . . . . . . . . . . . . . . . . . . . . . . . . . . . . . . . . . 18,925 23,784 (4,859) -20%East . . . . . . . . . . . . . . . . . . . . . . . . . . . . . . . . . . . . . . . . . . . . . . 10,358 19,646 (9,288) -47%Other Homebuilding . . . . . . . . . . . . . . . . . . . . . . . . . . . . . . . . . 8,778 17,221 (8,443) -49%
Consolidated . . . . . . . . . . . . . . . . . . . . . . . . . . . . . . . . . . . . . $ 97,951 $ 151,108 $ (53,157) -35%
Commission expenses primarily include direct incremental commissions paid for closed homes. Commissionexpenses within each of our homebuilding segments decreased during 2007, primarily resulting from declines incommission fees paid to both in-house and outside brokers for each segment. These decreases primarily were due to acorresponding decline of 41% in home sales revenue and were slightly offset by increases in the commission ratespaid to outside brokers.
General and Administrative Expenses. The following table summarizes our general and administrative expensesby reportable segment (in thousands).
Year Ended December 31, 2007 Increase (Decrease)
2007 2006 Amount %
HomebuildingWest . . . . . . . . . . . . . . . . . . . . . . . . . . . . . . . . . . . . . . . . . . . . . . $ 117,743 $ 156,062 $ (38,319) -25%Mountain . . . . . . . . . . . . . . . . . . . . . . . . . . . . . . . . . . . . . . . . . . 35,855 36,862 (1,007) -3%East . . . . . . . . . . . . . . . . . . . . . . . . . . . . . . . . . . . . . . . . . . . . . . 29,781 47,819 (18,038) -38%Other Homebuilding . . . . . . . . . . . . . . . . . . . . . . . . . . . . . . . . . 27,076 39,386 (12,310) -31%
Total Homebuilding . . . . . . . . . . . . . . . . . . . . . . . . . . . . . . . . 210,455 280,129 (69,674) -25%Financial Services and Other . . . . . . . . . . . . . . . . . . . . . . . . . . . . . 40,445 58,059 (17,614) -30%Corporate . . . . . . . . . . . . . . . . . . . . . . . . . . . . . . . . . . . . . . . . . . . . 55,815 80,691 (24,876) -31%
Consolidated . . . . . . . . . . . . . . . . . . . . . . . . . . . . . . . . . . . . . $ 306,715 $ 418,879 $ (112,164) -27%
General and administrative expenses for each of our homebuilding segments decreased during the year endedDecember 31, 2007. These reduced expenses resulted from various initiatives associated with right-sizing ouroperations in response to the reduced levels of homebuilding activity in each of our markets, including consolidating anumber of our homebuilding divisions and reducing employee headcount. Through these efforts, we have reduced ourhomebuilding divisions to 12 as of December 31, 2007 from 27 and 23 at December 31, 2005 and 2006, respectively,allowing us to consolidate office space in many of our markets. Additionally, our employee headcount has decreasedthroughout 2007 to approximately 2,200 at December 31, 2007, from a peak of approximately 4,200 atDecember 31, 2005 and approximately 3,200 at December 31, 2006.
The 2007 decrease in general and administrative expenses for the homebuilding segments was most notablewithin the West segment, which primarily resulted from the following decreases: (1) $28.2 million in employeecompensation and other employee-related benefit costs; (2) $9.8 million of inter-company supervisory fees(“Supervisory Fees”); and (3) $7.8 million in write-offs of pre-acquisition costs and deposits on lot option contractsthat we elected not to exercise. These items partially were offset by approximately $5.8 million in restructuringexpenses incurred in 2007 in connection with consolidating 12 divisions to four at December 31, 2006 and 2007,respectively. General and administrative expenses decreased during 2007 in our East segment primarily due to:
- 43 -

(1) decreases of $12.6 million in employee compensation and other employee-related benefit costs, as we lowered ourheadcount throughout 2007 by 33% from December 31, 2006 in this segment; and (2) a combined decrease of $2.6million in depreciation and amortization and write-offs of pre-acquisition costs and deposits on lot option contractsthat we elected not to exercise.
General and administrative expenses in our Other Homebuilding segment was lower during 2007, resultingprimarily from decreases of: (1) $7.5 million in employee compensation and other employee-related benefit costs, aswe lowered our headcount throughout 2007 by 39% from December 31, 2006 in this segment; (2) $3.0 million indepreciation and amortization of our long-lived and intangible assets; and (3) $2.1 million in Supervisory Fees. In ourMountain segment, general and administrative expenses decreased slightly due to lower employee compensation andother employee-related benefit costs, as we decreased our headcount throughout 2007 by 25% from December 31,2006 in this segment, partially offset by a $2.3 million increase in write-offs of pre-acquisition costs and deposits onlot option contracts that we elected not to exercise.
In our Financial Services and Other segment, general and administrative expenses declined during the year endedDecember 31, 2007, primarily due to decreases in: (1) compensation-related costs of approximately $9.4 million, aswe reduced our employee headcount for this segment during 2007 by 33% from December 31, 2006; and(2) insurance premium expenses of $9.3 million.
In our Corporate segment, general and administrative expenses decreased during the twelve months endedDecember 31, 2007, primarily resulting from decreases of: (1) $15.1 million in executive bonuses; (2) $15.0 millionin employee compensation and other employee benefit-related costs, as we reduced the headcount of our Corporatesegment throughout 2007 by approximately 31% during 2007; and (3) $3.6 million associated with stock-basedcompensation expense, also due in part to fewer Corporate employees and a decrease in the fair market value ofstock-options granted during 2007, compared with 2006. These items partially were offset by a $12.0 million decreasein Supervisory Fees. See Note 3 to our Consolidated Financial Statements regarding Supervisory Fees.
Related Party Expenses. Related party expenses were $1.4 million and $4.6 million for the years endedDecember 31, 2007 and 2006, respectively, and primarily relate to contributions we made or pledged to the MDC/Richmond American Homes Foundation (the “Foundation”). We committed to contributing $1.0 million and $3.3million in the form of MDC common stock for 2007 and 2006, respectively, to the Foundation.
The Foundation is a nonprofit organization operated exclusively for charitable, educational and other purposesbeneficial to social welfare within the meaning of section 501(c)(3) of the Internal Revenue Code (“I.R.C.”). Certaindirectors and officers of the Company are the trustees and officers of the Foundation. The Foundation takes actionwith respect to shares held by it, including the voting of such shares, by majority vote of at least three members of theboard of trustees and, accordingly, none of the trustees should be deemed to beneficially own such shares.
Income Taxes. Our overall effective income tax rates were 15.8% and 35.7% for the years endedDecember 31, 2007 and 2006, respectively. The decrease in our effective tax rate during 2007 resulted primarily fromrecording a $160.0 million valuation allowance against our deferred tax assets, as well as the impact of reductions inthe benefits from I.R.C. Section 199, “Income Attributable to Domestic Production Activities,” (“Section 199”)deduction and an increase in permanent differences primarily related to accruals for non-deductible excesscompensation under I.R.C. Section 162(m), “Certain Excessive Employee Remuneration.”
- 44 -

The following discussion compares results for the year ended December 31, 2006 with the year endedDecember 31, 2005.
Income Before Income Taxes. The table below summarizes our income before income taxes by segment (dollarsin thousands).
Year Ended December 31, 2006 Increase (Decrease)
2006 2005 Amount %
HomebuildingWest . . . . . . . . . . . . . . . . . . . . . . . . . . . . . . . . . . . . . . . . . . . . . . $ 235,954 $ 611,603 $ (375,649) -61%Mountain . . . . . . . . . . . . . . . . . . . . . . . . . . . . . . . . . . . . . . . . . . 43,490 70,348 (26,858) -38%East . . . . . . . . . . . . . . . . . . . . . . . . . . . . . . . . . . . . . . . . . . . . . . 104,706 203,853 (99,147) -49%Other Homebuilding . . . . . . . . . . . . . . . . . . . . . . . . . . . . . . . . . (12,709) 6,538 (19,247) -294%
Total Homebuilding . . . . . . . . . . . . . . . . . . . . . . . . . . . . . . . . 371,441 892,342 (520,901) -58%Financial Services and Other . . . . . . . . . . . . . . . . . . . . . . . . . . . . . 45,186 34,964 10,222 29%Corporate . . . . . . . . . . . . . . . . . . . . . . . . . . . . . . . . . . . . . . . . . . . . (83,490) (118,543) 35,053 -30%
Consolidated . . . . . . . . . . . . . . . . . . . . . . . . . . . . . . . . . . . . . $ 333,137 $ 808,763 $ (475,626) -59%
Income before income taxes in our homebuilding segments decreased during 2006, primarily resulting from:(1) significant decreases in Home Gross Margins in each homebuilding segment; (2) closing fewer homes during2006 in each homebuilding segment; and (3) increases in marketing, commissions and general and administrativeexpenses in each homebuilding segment except for our Mountain segment. Additionally, during 2006 we incurredasset impairments in our West, Mountain, East and Other Homebuilding segments of $90.8 million, $1.9 million, $8.2million and $11.1 million, respectively. We did not have any asset impairments during 2005. These decreasespartially were offset by higher average selling prices for homes closed in each of our homebuilding segments.
Income before income taxes in our Financial Services and Other segment was $10.2 million higher during 2006,compared with 2005, primarily due to higher gains on sales of mortgage loans. Additionally, the loss before incometaxes in our Corporate segment decreased $35.1 million during the year ended December 31, 2006, compared with2005, primarily resulting from lower general and administrative expenses.
Total Revenue. The table below summarizes total revenue by segment (dollars in thousands).
Year Ended December 31, 2006 Increase (Decrease)
2006 2005 Amount %
HomebuildingWest . . . . . . . . . . . . . . . . . . . . . . . . . . . . . . . . . . . . . . . . . . . . . . $ 2,871,040 $ 2,833,398 $ 37,642 1%Mountain . . . . . . . . . . . . . . . . . . . . . . . . . . . . . . . . . . . . . . . . . . 730,489 834,270 (103,781) -12%East . . . . . . . . . . . . . . . . . . . . . . . . . . . . . . . . . . . . . . . . . . . . . . 628,508 732,132 (103,624) -14%Other Homebuilding . . . . . . . . . . . . . . . . . . . . . . . . . . . . . . . . . 493,628 413,628 80,000 19%
Total Homebuilding . . . . . . . . . . . . . . . . . . . . . . . . . . . . . . . . 4,723,665 4,813,428 (89,763) -2%Financial Services and Other . . . . . . . . . . . . . . . . . . . . . . . . . . . . . 103,243 87,849 15,394 18%Corporate . . . . . . . . . . . . . . . . . . . . . . . . . . . . . . . . . . . . . . . . . . . . 1,788 1,487 301 20%Intercompany adjustments . . . . . . . . . . . . . . . . . . . . . . . . . . . . . . . (26,954) (10,175) (16,779) 165%
Consolidated . . . . . . . . . . . . . . . . . . . . . . . . . . . . . . . . . . . . . $ 4,801,742 $ 4,892,589 $ (90,847) -2%
The increase in total revenue for our West and Other Homebuilding segments, resulted from increases in homesales revenue primarily due to increases in the average selling prices of closed homes in each market within the West
- 45 -

segment and most markets within the Other Homebuilding segment, partially offset by closing 892 and 311 fewerhomes, respectively, during 2006. Additionally, we sold certain land in Texas, as we continued to exit this marketduring 2006, and in Arizona, which resulted in increased land sales revenue in these two segments. Total revenue inour Mountain and East segments decreased primarily due to lower home sales revenue, primarily resulting fromclosing fewer homes and was partially offset by increases in the average selling prices of closed homes in each marketwithin these segments.
Total revenue in our Financial Services and Other segment increased $15.4 million during 2006, resulting froman increase in the dollar volume of mortgage loan originations and mortgage loans sold during 2006.
During 2006, our homebuilding subsidiaries paid more mortgage loan origination fees on behalf of ourhomebuyers as a means of increasing incentives, resulting in the higher intercompany adjustments.
Home Sales Revenue. The table below summarizes home sales revenue by segment (dollars in thousands).
Years Ended December 31, 2006 Increase (Decrease)
2006 2005 Amount %
HomebuildingWest . . . . . . . . . . . . . . . . . . . . . . . . . . . . . . . . . . . . . . . . . . . . . . $ 2,851,850 $ 2,828,424 $ 23,426 1%Mountain . . . . . . . . . . . . . . . . . . . . . . . . . . . . . . . . . . . . . . . . . . 728,135 831,538 (103,403) -12%East . . . . . . . . . . . . . . . . . . . . . . . . . . . . . . . . . . . . . . . . . . . . . . 624,865 730,884 (106,019) -15%Other Homebuilding . . . . . . . . . . . . . . . . . . . . . . . . . . . . . . . . . 472,660 412,029 60,631 15%
Total Homebuilding . . . . . . . . . . . . . . . . . . . . . . . . . . . . . . . . 4,677,510 4,802,875 (125,365) -3%Intercompany adjustments . . . . . . . . . . . . . . . . . . . . . . . . . . . . . . . (26,954) (10,175) (16,779) 165%
Consolidated . . . . . . . . . . . . . . . . . . . . . . . . . . . . . . . . . . . . . $ 4,650,556 $ 4,792,700 $ (142,144) -3%
Home sales revenue in our West segment increased slightly during 2006, primarily resulting from a $67,400increase in the average selling price of closed homes in Arizona. Also contributing to the increase were moderatelyhigher average selling prices of closed homes in California and Nevada. These improvements partially were offset byclosing 10% fewer homes in this segment during 2006. Home sales revenue decreased in our Mountain segmentduring 2006 as a result of closing 727 fewer homes in Colorado. This decrease partially was offset by increases in theaverage selling prices of closed homes in each market within the Mountain segment and a slight increase in thenumber of homes we closed in our Utah market.
Home sales revenue in our East segment decreased $106.0 million during the year ended December 31, 2006,primarily as a result of closing 319 fewer homes in Virginia during 2006. This decrease partially was offset byincreases in the average selling price of closed homes and the number of homes we closed in Maryland of 16% and12%, respectively. The increase in our Other Homebuilding segment primarily was due to an increase in the averageselling price of closed homes in each market within the segment except for Illinois, which more than offset closing311 fewer homes within this segment during 2006.
Land Sales Revenue. Land sales revenue was $34.6 million and $3.0 million for the years endedDecember 31, 2006 and 2005, respectively. The increase in 2006 primarily resulted from the sale of land in our Texasmarket, as we continued to exit this market during 2006, and the sale of certain land in Arizona.
- 46 -

Other Revenue. The table below sets forth the components of other revenue (dollars in thousands).
Years Ended December 31, 2006 Increase (Decrease)
2006 2005 Amount %
Gains on sales of mortgage loans, net . . . . . . . . . . . . . . . . . . . . . . $ 58,262 $ 42,919 $ 15,343 36%Broker origination fees . . . . . . . . . . . . . . . . . . . . . . . . . . . . . . . . . 9,632 12,478 (2,846) -23%Insurance revenue . . . . . . . . . . . . . . . . . . . . . . . . . . . . . . . . . . . . . 25,367 21,956 3,411 16%Interest income, net . . . . . . . . . . . . . . . . . . . . . . . . . . . . . . . . . . . . 8,303 4,650 3,653 79%Title and other . . . . . . . . . . . . . . . . . . . . . . . . . . . . . . . . . . . . . . . . 15,011 14,891 120 1%
Total other revenue . . . . . . . . . . . . . . . . . . . . . . . . . . . . . . . . . . $ 116,575 $ 96,894 $ 19,681 20%
Other revenue increased $19.7 million during the year ended December 31, 2006, primarily due to a $15.3million increase in gains on the sales of mortgage loans, net. Increased dollar volumes of mortgage loan originationsand mortgage loans sold during 2006 drove the higher gains. We achieved these increased volumes by improving ourmortgage Capture Rate, largely as a result of expanding the mortgage loan products that HomeAmerican couldoriginate during 2006 directly for our homebuyers, increases in the average loan amounts in connection with ourhigher 2006 average selling prices of closed homes and incentives offered to more of our homebuyers during 2006,for using HomeAmerican mortgage products.
Insurance revenue consists primarily of insurance policy premiums Allegiant receives from its policyholders andcommission revenue received by American Home Insurance. The 2006 increase primarily resulted from premium rateincreases.
Title and other revenue primarily consist of revenue from American Home Title and the forfeiture of homebuyerdeposits upon the cancellation of home sales contracts. The increase during 2006 primarily was due to an increase inforfeited deposits resulting from our higher Cancellation Rate during 2006, partially offset by a decrease in revenuefrom American Home Title.
Home Cost of Sales. The table below sets forth the home cost of sales by reportable segment (dollars inthousands).
Years Ended December 31, 2006 Increase (Decrease)
2006 2005 Amount %
HomebuildingWest . . . . . . . . . . . . . . . . . . . . . . . . . . . . . . . . . . . . . . . . . . . . . . $ 2,207,255 $ 1,969,608 $ 237,647 12%Mountain . . . . . . . . . . . . . . . . . . . . . . . . . . . . . . . . . . . . . . . . . . 603,246 676,392 (73,146) -11%East . . . . . . . . . . . . . . . . . . . . . . . . . . . . . . . . . . . . . . . . . . . . . . 433,594 458,601 (25,007) -5%Other Homebuilding . . . . . . . . . . . . . . . . . . . . . . . . . . . . . . . . . 402,515 341,609 60,906 18%
Total Homebuilding . . . . . . . . . . . . . . . . . . . . . . . . . . . . . . . . 3,646,610 3,446,210 200,400 6%Intercompany adjustments . . . . . . . . . . . . . . . . . . . . . . . . . . . . . . . (26,954) (10,175) (16,779) 165%
Consolidated . . . . . . . . . . . . . . . . . . . . . . . . . . . . . . . . . . . . . $ 3,619,656 $ 3,436,035 $ 183,621 5%
Home cost of sales increased $183.6 million, or 5%, during 2006, compared with 2005. This increase primarilywas due to (1) higher land costs per home closed, as more of the lots we closed homes on during 2006 were purchasedin the higher priced 2005 period; (2) building larger homes; and (3) more options and upgrades provided as incentivesto our homebuyers. These increases more than offset the impact of closing 14% fewer homes during 2006, comparedwith 2005, and lower commodity costs and subcontractors fees incurred when building our homes.
- 47 -

Asset Impairments. The following table sets forth by homebuilding segment the 2006 asset impairments (dollarsin thousands). We did not have any impairments during 2005.
West . . . . . . . . . . . . . . . . . . . . . . . . . . . . . . . . . . . . . . . . . . . . . . . . . . . . . . . . . . . . . . . . . . . . . . $ 90,802Mountain . . . . . . . . . . . . . . . . . . . . . . . . . . . . . . . . . . . . . . . . . . . . . . . . . . . . . . . . . . . . . . . . . . 1,891East . . . . . . . . . . . . . . . . . . . . . . . . . . . . . . . . . . . . . . . . . . . . . . . . . . . . . . . . . . . . . . . . . . . . . . 8,236Other Homebuilding . . . . . . . . . . . . . . . . . . . . . . . . . . . . . . . . . . . . . . . . . . . . . . . . . . . . . . . . . 11,098
Consolidated . . . . . . . . . . . . . . . . . . . . . . . . . . . . . . . . . . . . . . . . . . . . . . . . . . . . . . . . . . . . . $ 112,027
These impairments primarily were associated with nearly 2,500 owned lots in 57 subdivisions, which wereaccounted for on a held-for-development basis, across all homebuilding segments. The impairments recorded in theWest segment related to subdivisions in each market within the segment, most notably in California, which accountedfor $60.3 million of the total impairment in the West segment. Impairments recorded in our Mountain and Eastsegments primarily related to subdivisions in our Colorado and Virginia markets, respectively. Additionally, theimpairments we recorded in our Other Homebuilding segment primarily related to subdivisions in our Florida andDelaware Valley markets. These impairments, which relate to assets primarily contracted for during 2004 and 2005,were the result of continued slow sales paces and significant increases in the level of incentives offered to generate nethome orders and maintain homes in Backlog until closing.
Marketing Expenses. The following table summarizes our marketing expenses by reportable segment (inthousands).
Year Ended December 31, 2006 Increase (Decrease)
2006 2005 Amount %
HomebuildingWest . . . . . . . . . . . . . . . . . . . . . . . . . . . . . . . . . . . . . . . . . . . . . . $ 77,572 $ 58,578 $ 18,994 32%Mountain . . . . . . . . . . . . . . . . . . . . . . . . . . . . . . . . . . . . . . . . . . 20,739 22,745 (2,006) -9%East . . . . . . . . . . . . . . . . . . . . . . . . . . . . . . . . . . . . . . . . . . . . . . 13,045 10,222 2,823 28%Other Homebuilding . . . . . . . . . . . . . . . . . . . . . . . . . . . . . . . . . 17,500 14,470 3,030 21%
Consolidated . . . . . . . . . . . . . . . . . . . . . . . . . . . . . . . . . . . . . $ 128,856 $ 106,015 $ 22,841 22%
The increase in marketing expenses during 2006 for our West segment primarily was attributable to increases of:(1) $10.1 million in advertising expenses incurred in an effort to generate homebuyer traffic in our subdivisions;(2) $3.6 million in sales office expenses associated with the increase in our active subdivisions and model homes from2005; and (3) $2.5 million in salaries and benefits as this segment implemented an initiative that required two full-time sales personnel for each subdivision, compared with one full-time sales personnel and one who is assigned tomultiple subdivisions Marketing expenses were higher during 2006 in our East and Other Homebuilding segments,primarily resulting from increases in advertising expenses of $1.6 million and $2.0 million, respectively, in an effortto generate homebuyer traffic. In our Mountain segment, marketing expenses decreased, primarily due to a decline of$1.4 million in amortization of deferred marketing costs, as we closed 709 fewer home during 2006, and $1.0 milliondecreases in salaries and benefits as a result of consolidating three Denver metro divisions into two Denver metrodivisions and an overall reduction in sales personnel in response to fewer new home orders.
- 48 -

Commission Expenses. The following table summarizes our commission expenses by reportable segment (inthousands).
Year Ended December 31, 2006 Increase (Decrease)
2006 2005 Amount %
HomebuildingWest . . . . . . . . . . . . . . . . . . . . . . . . . . . . . . . . . . . . . . . . . . . . . . $ 90,457 $ 68,491 $ 21,966 32%Mountain . . . . . . . . . . . . . . . . . . . . . . . . . . . . . . . . . . . . . . . . . . 23,784 25,114 (1,330) -5%East . . . . . . . . . . . . . . . . . . . . . . . . . . . . . . . . . . . . . . . . . . . . . . 19,646 21,070 (1,424) -7%Other Homebuilding . . . . . . . . . . . . . . . . . . . . . . . . . . . . . . . . . 17,221 15,632 1,589 10%
Consolidated . . . . . . . . . . . . . . . . . . . . . . . . . . . . . . . . . . . . . $ 151,108 $ 130,307 $ 20,801 16%
Commission expenses was higher during 2006 in our West segment, primarily resulting from a practice initiatedduring 2006 of paying outside brokers a significantly higher commission rate, generally 6% during 2006, comparedwith 3% during 2005, in response to more competitive markets, as well as higher outside and in-house commissionsresulting from increases in the average selling prices of homes closed during 2006. These increases partially wereoffset as a result of closing 892 fewer homes during 2006. Commission expenses decreased in both our Mountain andEast segment due to closing 709 and 272 fewer homes, respectively, during 2006, partially offset by increases tooutside and in-house commissions resulting from increases in the average selling prices of homes closed during 2006and higher commission rates. In our Other Homebuilding segment, commission expenses increased due to higher ratespaid to outside brokers and increased outside and in-house commissions resulting from higher average selling pricesof closed homes in our Delaware Valley and Florida markets. These increases partially were offset by the impact ofclosing 311 fewer homes during 2006.
General and Administrative Expenses. The following table summarizes our general and administrative expenses(in thousands).
Year Ended December 31, 2007 Increase (Decrease)
2006 2005 Amount %
HomebuildingWest . . . . . . . . . . . . . . . . . . . . . . . . . . . . . . . . . . . . . . . . . . . . . . $ 156,062 $ 125,119 $ 30,943 25%Mountain . . . . . . . . . . . . . . . . . . . . . . . . . . . . . . . . . . . . . . . . . . 36,862 38,583 (1,721) -4%East . . . . . . . . . . . . . . . . . . . . . . . . . . . . . . . . . . . . . . . . . . . . . . 47,819 38,382 9,437 25%Other Homebuilding . . . . . . . . . . . . . . . . . . . . . . . . . . . . . . . . . 39,386 34,611 4,775 14%
Total Homebuilding . . . . . . . . . . . . . . . . . . . . . . . . . . . . . . . . 280,129 236,695 43,434 18%Financial Services and Other . . . . . . . . . . . . . . . . . . . . . . . . . . . . . 58,059 52,883 5,176 10%Corporate . . . . . . . . . . . . . . . . . . . . . . . . . . . . . . . . . . . . . . . . . . . . 80,691 111,606 (30,915) -28%
Consolidated . . . . . . . . . . . . . . . . . . . . . . . . . . . . . . . . . . . . . $ 418,879 $ 401,184 $ 17,695 4%
General and administrative expenses for our West segment rose in 2006, primarily resulting from increases of(1) $12.0 million in write-offs of pre-acquisition costs and deposits on lot option contracts that we elected not toexercise; (2) $6.8 million in Supervisory Fees; (3) $3.1 million in facility lease payments, as we expanded our HomeGallery locations and incurred a full year’s rent expense associated with our Inland Empire division, which wasformed during 2005; (4) $2.1 million in depreciation and stock-based compensation; and (5) $4.4 million in legalrelated expenses. The increase in general and administrative expenses in our East segment primarily is attributable toincreases of $5.1 million in write-offs of pre-acquisition costs and deposits on lot option contracts that we elected notto exercise, $2.1 million in facility lease payments, and $1.4 million in deprecation and stock-based compensation
- 49 -

expense. In our Other Homebuilding segment, general and administrative expenses increased during 2006, primarilydue to a $4.6 million increase in other general and administrative expenses and a $1.4 million increase in depreciationand stock-based compensation expense. Theses increases partially were offset by a decrease of $1.1 million in write-offs of pre-acquisition costs and deposits on lot option contracts that we elected not to exercise.
The increases in general and administrative expenses for these segments partially were offset by a decrease inour Mountain segment. This decline, primarily resulted from a decrease of $2.9 million in compensation and benefit-related costs, as we consolidated three Denver metro divisions into two divisions and reduced employee headcount inresponse to fewer home orders and closings in Colorado, partially offset by a $0.9 million increase in SupervisoryFees.
General and administrative expenses in our Financial Services and Other segment increased $5.2 million duringthe year ended December 31, 2006, primarily due to a $4.7 million increase in insurance claim expenses resultingfrom actuarial adjustments in our insurance reserves.
Corporate general and administrative expenses decreased by $30.9 million, primarily attributable to: (1) a $21.8million decrease in executive bonuses, including amounts paid pursuant to the Company’s executive bonus plan anddiscretionary bonuses; (2) a $7.0 million decrease in salaries and non-executive bonuses, as we reduced our employeeheadcount in response to the downturn in the homebuilding industry; and (3) an increase of $8.7 million inSupervisory Fees charged to the homebuilding segments and the Financial Services and Other segment. The costreductions more than offset the impact of the adoption of SFAS 123(R) in January 2006, which resulted in $14.8 instock-based compensation expense associated with stock options during 2006.
Related Party Expenses. Related party expenses were $4.6 million and $8.4 million for the years endedDecember 31, 2006 and 2005, respectively, and primarily relate to contributions we made to the Foundation. Wecontributed $3.3 million and $8.1 million in the form of MDC common stock for 2006 and 2005, respectively, to theFoundation.
Income Taxes. Our overall effective income tax rates were 35.7% and 37.5% for the years endedDecember 31, 2006 and 2005, respectively. The decrease in our effective tax rate during 2006 primarily was due tothe reversal of previously accrued taxes and the increased benefit resulting from the Section 199 deduction. Thesedecreases to our effective tax rate reduced our income tax expense for 2006 by approximately $6.0 million.
- 50 -

Homebuilding Operating Activities—2007 Compared With 2006 (dollars in thousands).
The table below sets forth information relating to orders for homes.
Year Ended December 31, 2007 Increase (Decrease)
2007 2006 Amount %
Orders For Homes, net (Units)Arizona . . . . . . . . . . . . . . . . . . . . . . . . . . . . . 1,889 2,758 (869) -32%California . . . . . . . . . . . . . . . . . . . . . . . . . . . 912 1,450 (538) -37%Nevada . . . . . . . . . . . . . . . . . . . . . . . . . . . . . 1,282 2,048 (766) -37%
West . . . . . . . . . . . . . . . . . . . . . . . . . . . . . 4,083 6,256 (2,173) -35%
Colorado . . . . . . . . . . . . . . . . . . . . . . . . . . . . 778 1,139 (361) -32%Utah . . . . . . . . . . . . . . . . . . . . . . . . . . . . . . . . 426 1,049 (623) -59%
Mountain . . . . . . . . . . . . . . . . . . . . . . . . . . 1,204 2,188 (984) -45%
Maryland . . . . . . . . . . . . . . . . . . . . . . . . . . . . 227 380 (153) -40%Virginia . . . . . . . . . . . . . . . . . . . . . . . . . . . . . 308 462 (154) -33%
East . . . . . . . . . . . . . . . . . . . . . . . . . . . . . . 535 842 (307) -36%
Delaware Valley . . . . . . . . . . . . . . . . . . . . . . 116 138 (22) -16%Florida . . . . . . . . . . . . . . . . . . . . . . . . . . . . . . 424 519 (95) -18%Illinois . . . . . . . . . . . . . . . . . . . . . . . . . . . . . . 128 117 11 9%Texas . . . . . . . . . . . . . . . . . . . . . . . . . . . . . . . 14 169 (155) -92%
Other Homebuilding . . . . . . . . . . . . . . . 682 943 (261) -28%
Total . . . . . . . . . . . . . . . . . . . . . . . . . . . . . . . 6,504 10,229 (3,725) -36%
Estimated Value of Orders for Homes, net . . . . $ 2,107,000 $ 3,467,000 $ (1,360,000) -39%
Estimated Average Selling Price of Orders forHomes, net . . . . . . . . . . . . . . . . . . . . . . . . . . $ 324.0 $ 338.9 $ (14.9) -4%
Cancellation Rate . . . . . . . . . . . . . . . . . . . . . . . 48% 43% 5%
Orders for Homes. Most of our homebuilding segments experienced declines in net home orders during the yearended December 31, 2007. Net home orders in each of our markets were impacted adversely by the overalldeterioration in the homebuilding market. Factors which contributed to this market decline in each of ourhomebuilding segments have been outlined in the Executive Summary section of this Item 7, “Management’sDiscussion and Analysis of Financial Condition and Results of Operations” (“Item 7”) The 2007 decrease in our totalnew home orders was driven in large part by fewer net home orders in our West segment, as this market experiencedthe highest decrease in units sold, primarily resulting from our concentration within the markets of this segment.Additionally, our Utah market experienced a higher percentage decrease in 2007 than in our other markets as thedemand for new home orders in Utah reached its peak during 2006.
Cancellation Rate. We define our home order “Cancellation Rate” as the approximate number of cancelledhome order contracts during a reporting period as a percent of total home order contracts received during suchreporting period. The Cancellation Rate was 48% on a consolidated basis, as well as for each of ourhomebuilding segments. The Cancellation Rate increased during the year ended December 31, 2007 for theCompany as a whole and in each of our reportable segments, primarily resulting from: (1) certain mortgage loanproducts no longer being available; (2) homebuyers having difficulty in qualifying for available mortgage loanproducts; (3) home orders that were contingent on our homebuyers being able to sell their existing homes; and(4) a decline in homebuyer confidence in the market value of homes and the lack of stabilization in home salesprices.
- 51 -
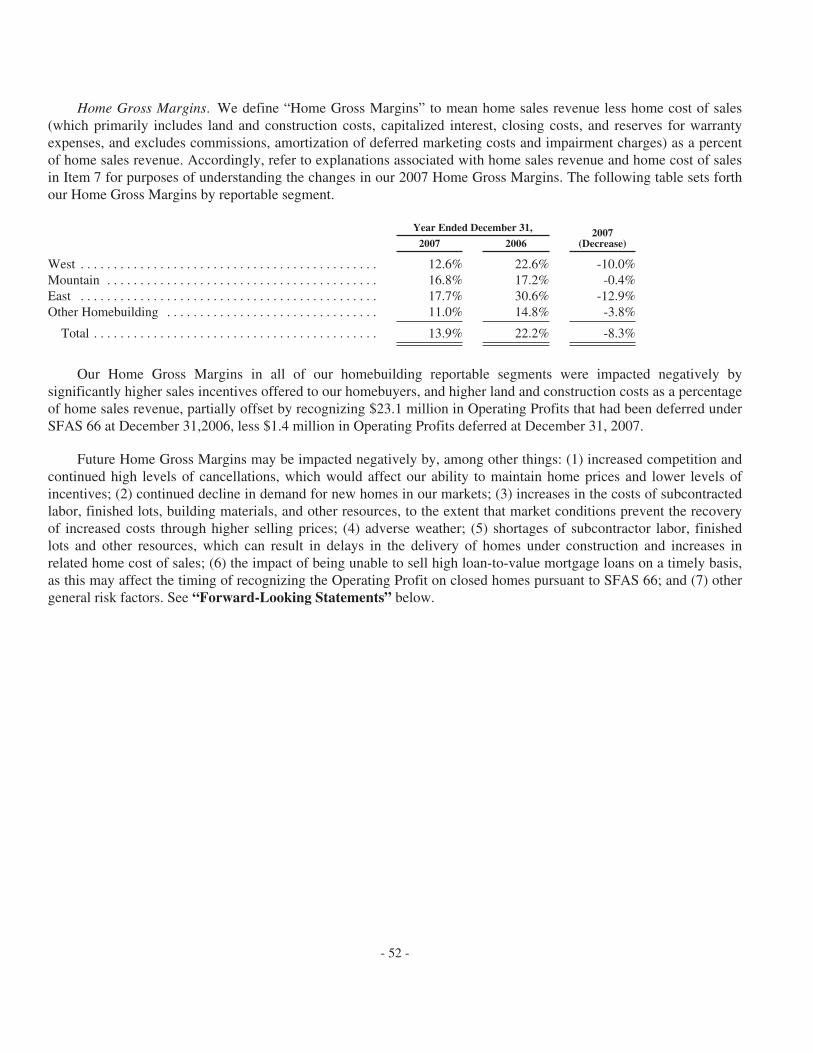
Home Gross Margins. We define “Home Gross Margins” to mean home sales revenue less home cost of sales(which primarily includes land and construction costs, capitalized interest, closing costs, and reserves for warrantyexpenses, and excludes commissions, amortization of deferred marketing costs and impairment charges) as a percentof home sales revenue. Accordingly, refer to explanations associated with home sales revenue and home cost of salesin Item 7 for purposes of understanding the changes in our 2007 Home Gross Margins. The following table sets forthour Home Gross Margins by reportable segment.
Year Ended December 31, 2007(Decrease)2007 2006
West . . . . . . . . . . . . . . . . . . . . . . . . . . . . . . . . . . . . . . . . . . . . . 12.6% 22.6% -10.0%Mountain . . . . . . . . . . . . . . . . . . . . . . . . . . . . . . . . . . . . . . . . . 16.8% 17.2% -0.4%East . . . . . . . . . . . . . . . . . . . . . . . . . . . . . . . . . . . . . . . . . . . . . 17.7% 30.6% -12.9%Other Homebuilding . . . . . . . . . . . . . . . . . . . . . . . . . . . . . . . . 11.0% 14.8% -3.8%
Total . . . . . . . . . . . . . . . . . . . . . . . . . . . . . . . . . . . . . . . . . . . 13.9% 22.2% -8.3%
Our Home Gross Margins in all of our homebuilding reportable segments were impacted negatively bysignificantly higher sales incentives offered to our homebuyers, and higher land and construction costs as a percentageof home sales revenue, partially offset by recognizing $23.1 million in Operating Profits that had been deferred underSFAS 66 at December 31,2006, less $1.4 million in Operating Profits deferred at December 31, 2007.
Future Home Gross Margins may be impacted negatively by, among other things: (1) increased competition andcontinued high levels of cancellations, which would affect our ability to maintain home prices and lower levels ofincentives; (2) continued decline in demand for new homes in our markets; (3) increases in the costs of subcontractedlabor, finished lots, building materials, and other resources, to the extent that market conditions prevent the recoveryof increased costs through higher selling prices; (4) adverse weather; (5) shortages of subcontractor labor, finishedlots and other resources, which can result in delays in the delivery of homes under construction and increases inrelated home cost of sales; (6) the impact of being unable to sell high loan-to-value mortgage loans on a timely basis,as this may affect the timing of recognizing the Operating Profit on closed homes pursuant to SFAS 66; and (7) othergeneral risk factors. See “Forward-Looking Statements” below.
- 52 -

Homes Closed. The following table sets forth homes closed for each market within our homebuilding segments(in units).
Year Ended December 31, 2007 Increase (Decrease)
2007 2006 Amount %
Arizona . . . . . . . . . . . . . . . . . . . . . . . . . . . . . . . 2,801 3,353 (552) -16%California . . . . . . . . . . . . . . . . . . . . . . . . . . . . . 1,136 1,788 (652) -36%Nevada . . . . . . . . . . . . . . . . . . . . . . . . . . . . . . . 1,290 2,756 (1,466) -53%
West . . . . . . . . . . . . . . . . . . . . . . . . . . . . . . . 5,227 7,897 (2,670) -34%
Colorado . . . . . . . . . . . . . . . . . . . . . . . . . . . . . . 818 1,463 (645) -44%Utah . . . . . . . . . . . . . . . . . . . . . . . . . . . . . . . . . . 713 922 (209) -23%
Mountain . . . . . . . . . . . . . . . . . . . . . . . . . . . . 1,531 2,385 (854) -36%
Maryland . . . . . . . . . . . . . . . . . . . . . . . . . . . . . . 288 444 (156) -35%Virginia . . . . . . . . . . . . . . . . . . . . . . . . . . . . . . . 344 707 (363) -51%
East . . . . . . . . . . . . . . . . . . . . . . . . . . . . . . . . 632 1,151 (519) -45%
Delaware Valley . . . . . . . . . . . . . . . . . . . . . . . . 178 200 (22) -11%Florida . . . . . . . . . . . . . . . . . . . . . . . . . . . . . . . . 496 921 (425) -46%Illinois . . . . . . . . . . . . . . . . . . . . . . . . . . . . . . . . 105 174 (69) -40%Texas . . . . . . . . . . . . . . . . . . . . . . . . . . . . . . . . . 26 395 (369) -93%
Other Homebuilding . . . . . . . . . . . . . . . . . . . 805 1,690 (885) -52%
Total . . . . . . . . . . . . . . . . . . . . . . . . . . . . . . . . . 8,195 13,123 (4,928) -38%
Our home closings were down during the year ended December 31, 2007 in each market of our homebuildingsegments, primarily due to significantly lower Backlogs at the beginning of 2007, compared with the beginning of2006. These declines in Backlogs primarily resulted from decreases in new home orders during the second half of2007, compared with the second half of 2006, partially as a result of homebuyer concerns about declines in the marketvalue of homes and the lack of stabilization in home sales prices, as well as increases in the number of home ordercancellations.
- 53 -
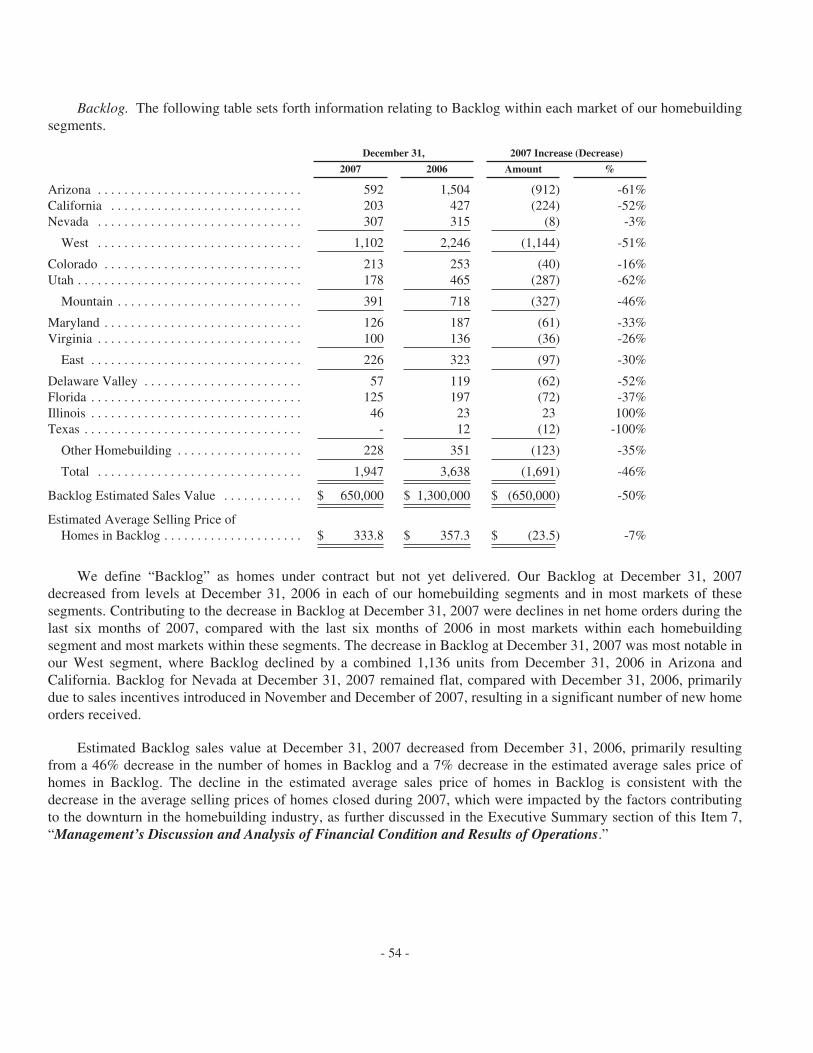
Backlog. The following table sets forth information relating to Backlog within each market of our homebuildingsegments.
December 31, 2007 Increase (Decrease)
2007 2006 Amount %
Arizona . . . . . . . . . . . . . . . . . . . . . . . . . . . . . . . 592 1,504 (912) -61%California . . . . . . . . . . . . . . . . . . . . . . . . . . . . . 203 427 (224) -52%Nevada . . . . . . . . . . . . . . . . . . . . . . . . . . . . . . . 307 315 (8) -3%
West . . . . . . . . . . . . . . . . . . . . . . . . . . . . . . . 1,102 2,246 (1,144) -51%
Colorado . . . . . . . . . . . . . . . . . . . . . . . . . . . . . . 213 253 (40) -16%Utah . . . . . . . . . . . . . . . . . . . . . . . . . . . . . . . . . . 178 465 (287) -62%
Mountain . . . . . . . . . . . . . . . . . . . . . . . . . . . . 391 718 (327) -46%
Maryland . . . . . . . . . . . . . . . . . . . . . . . . . . . . . . 126 187 (61) -33%Virginia . . . . . . . . . . . . . . . . . . . . . . . . . . . . . . . 100 136 (36) -26%
East . . . . . . . . . . . . . . . . . . . . . . . . . . . . . . . . 226 323 (97) -30%
Delaware Valley . . . . . . . . . . . . . . . . . . . . . . . . 57 119 (62) -52%Florida . . . . . . . . . . . . . . . . . . . . . . . . . . . . . . . . 125 197 (72) -37%Illinois . . . . . . . . . . . . . . . . . . . . . . . . . . . . . . . . 46 23 23 100%Texas . . . . . . . . . . . . . . . . . . . . . . . . . . . . . . . . . - 12 (12) -100%
Other Homebuilding . . . . . . . . . . . . . . . . . . . 228 351 (123) -35%
Total . . . . . . . . . . . . . . . . . . . . . . . . . . . . . . . 1,947 3,638 (1,691) -46%
Backlog Estimated Sales Value . . . . . . . . . . . . $ 650,000 $ 1,300,000 $ (650,000) -50%
Estimated Average Selling Price ofHomes in Backlog . . . . . . . . . . . . . . . . . . . . . $ 333.8 $ 357.3 $ (23.5) -7%
We define “Backlog” as homes under contract but not yet delivered. Our Backlog at December 31, 2007decreased from levels at December 31, 2006 in each of our homebuilding segments and in most markets of thesesegments. Contributing to the decrease in Backlog at December 31, 2007 were declines in net home orders during thelast six months of 2007, compared with the last six months of 2006 in most markets within each homebuildingsegment and most markets within these segments. The decrease in Backlog at December 31, 2007 was most notable inour West segment, where Backlog declined by a combined 1,136 units from December 31, 2006 in Arizona andCalifornia. Backlog for Nevada at December 31, 2007 remained flat, compared with December 31, 2006, primarilydue to sales incentives introduced in November and December of 2007, resulting in a significant number of new homeorders received.
Estimated Backlog sales value at December 31, 2007 decreased from December 31, 2006, primarily resultingfrom a 46% decrease in the number of homes in Backlog and a 7% decrease in the estimated average sales price ofhomes in Backlog. The decline in the estimated average sales price of homes in Backlog is consistent with thedecrease in the average selling prices of homes closed during 2007, which were impacted by the factors contributingto the downturn in the homebuilding industry, as further discussed in the Executive Summary section of this Item 7,“Management’s Discussion and Analysis of Financial Condition and Results of Operations.”
- 54 -

Average Selling Prices Per Home Closed. The following table displays our average selling prices per home closed,by market (dollars in thousands).
Year Ended December 31, 2007 Increase (Decrease)
2007 2006 Amount %
Arizona . . . . . . . . . . . . . . . . . . . . . . . . . . . . . . . $ 247.4 $ 294.6 $ (47.2) -16%California . . . . . . . . . . . . . . . . . . . . . . . . . . . . . 516.5 558.7 (42.2) -8%Colorado . . . . . . . . . . . . . . . . . . . . . . . . . . . . . . 346.3 308.7 37.6 12%Delaware Valley . . . . . . . . . . . . . . . . . . . . . . . . 448.8 405.7 43.1 11%Florida . . . . . . . . . . . . . . . . . . . . . . . . . . . . . . . . 261.5 284.8 (23.3) -8%Illinois . . . . . . . . . . . . . . . . . . . . . . . . . . . . . . . . 372.4 367.5 4.9 1%Maryland . . . . . . . . . . . . . . . . . . . . . . . . . . . . . . 515.2 558.0 (42.8) -8%Nevada . . . . . . . . . . . . . . . . . . . . . . . . . . . . . . . 296.2 317.5 (21.3) -7%Texas . . . . . . . . . . . . . . . . . . . . . . . . . . . . . . . . . 129.6 165.9 (36.3) -22%Utah . . . . . . . . . . . . . . . . . . . . . . . . . . . . . . . . . . 355.5 303.3 52.2 17%Virginia . . . . . . . . . . . . . . . . . . . . . . . . . . . . . . . 480.4 536.3 (55.9) -10%
Total . . . . . . . . . . . . . . . . . . . . . . . . . . . . . . . $ 337.5 $ 354.4 $ (16.9) -5%
The average selling price of homes closed for the Company decreased during the year ended December 31, 2007, withthe declines being most notable for each market within our West and East segments. These decreases resulted in part fromincreased levels of incentives and reductions in sales prices required to close homes in response to lower demand for newhomes and increased levels of competition in these markets. Additionally, during the year ended December 31, 2007, weexperienced increases in the number of home order cancellations, which resulted in these homes being resold and closed asspeculative homes, generally with lower prices or higher incentives. We experienced increases in average selling prices inour Delaware Valley, Colorado, Utah and Illinois markets during the year ended December 31, 2007, primarily related tochanges in the style and size of our single-family detached homes that were closed during these periods. Also contributingto the higher average selling prices of homes closed in Utah was our ability to raise home sales prices due to the higherdemand for new homes in the second half of 2006, compared with the same period during 2005.
Active Subdivisions. The following table displays the number of our active subdivisions within each market of ourhomebuilding segments. We define an active subdivision as a subdivision that has more than five homes available to besold and closed and has sold at least five homes.
Year Ended December 31, 2007 Increase (Decrease)
2007 2006 Amount %
Arizona . . . . . . . . . . . . . . . . . . . . . . . . . . . . . . . 66 67 (1) -1%California . . . . . . . . . . . . . . . . . . . . . . . . . . . . . 41 45 (4) -9%Nevada . . . . . . . . . . . . . . . . . . . . . . . . . . . . . . . 39 41 (2) -5%
West . . . . . . . . . . . . . . . . . . . . . . . . . . . . . 146 153 (7) -5%
Colorado . . . . . . . . . . . . . . . . . . . . . . . . . . . . . . 47 47 - 0%Utah . . . . . . . . . . . . . . . . . . . . . . . . . . . . . . . . . . 23 22 1 5%
Mountain . . . . . . . . . . . . . . . . . . . . . . . . . . 70 69 1 1%
Maryland . . . . . . . . . . . . . . . . . . . . . . . . . . . . . . 15 19 (4) -21%Virginia . . . . . . . . . . . . . . . . . . . . . . . . . . . . . . . 18 19 (1) -5%
East . . . . . . . . . . . . . . . . . . . . . . . . . . . . . . 33 38 (5) -13%
Delaware Valley . . . . . . . . . . . . . . . . . . . . . . . . 4 8 (4) -50%Florida . . . . . . . . . . . . . . . . . . . . . . . . . . . . . . . . 20 30 (10) -33%Illinois . . . . . . . . . . . . . . . . . . . . . . . . . . . . . . . . 5 6 (1) -17%Texas . . . . . . . . . . . . . . . . . . . . . . . . . . . . . . . . . - 2 (2) -100%
Other Homebuilding . . . . . . . . . . . . . . . . . 29 46 (17) -37%
Total . . . . . . . . . . . . . . . . . . . . . . . . . . . . . . . 278 306 (28) -9%
- 55 -
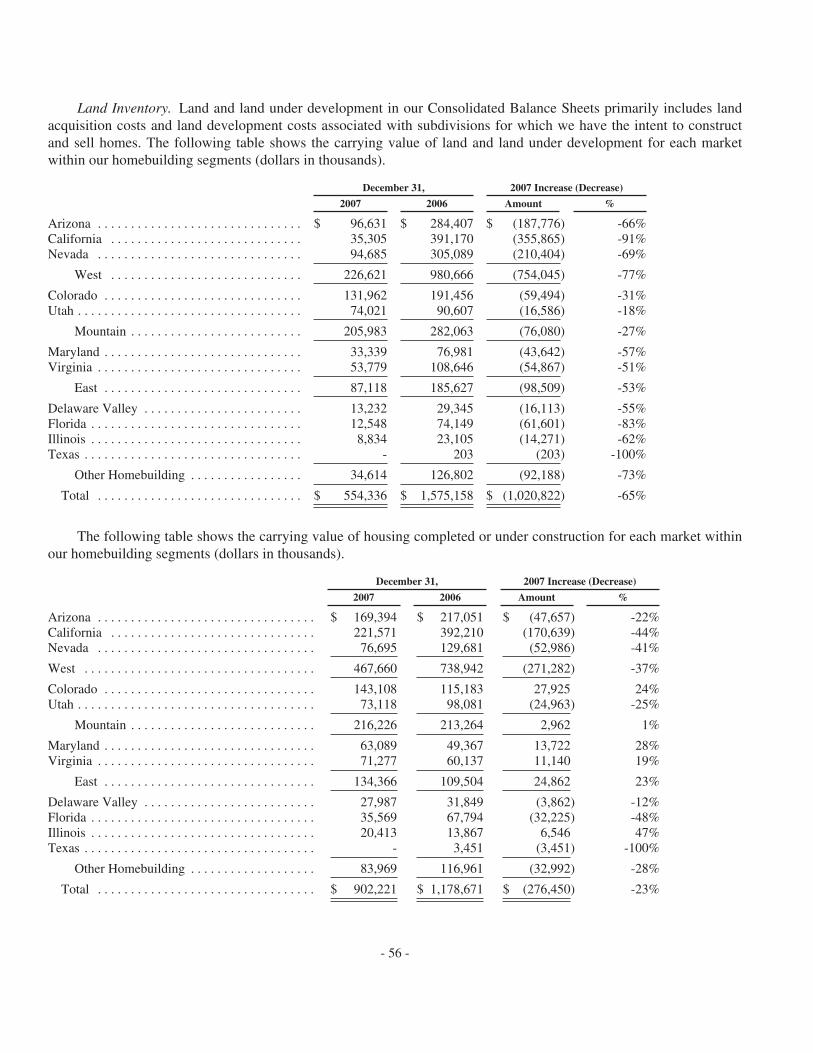
Land Inventory. Land and land under development in our Consolidated Balance Sheets primarily includes landacquisition costs and land development costs associated with subdivisions for which we have the intent to constructand sell homes. The following table shows the carrying value of land and land under development for each marketwithin our homebuilding segments (dollars in thousands).
December 31, 2007 Increase (Decrease)
2007 2006 Amount %
Arizona . . . . . . . . . . . . . . . . . . . . . . . . . . . . . . . $ 96,631 $ 284,407 $ (187,776) -66%California . . . . . . . . . . . . . . . . . . . . . . . . . . . . . 35,305 391,170 (355,865) -91%Nevada . . . . . . . . . . . . . . . . . . . . . . . . . . . . . . . 94,685 305,089 (210,404) -69%
West . . . . . . . . . . . . . . . . . . . . . . . . . . . . . 226,621 980,666 (754,045) -77%
Colorado . . . . . . . . . . . . . . . . . . . . . . . . . . . . . . 131,962 191,456 (59,494) -31%Utah . . . . . . . . . . . . . . . . . . . . . . . . . . . . . . . . . . 74,021 90,607 (16,586) -18%
Mountain . . . . . . . . . . . . . . . . . . . . . . . . . . 205,983 282,063 (76,080) -27%
Maryland . . . . . . . . . . . . . . . . . . . . . . . . . . . . . . 33,339 76,981 (43,642) -57%Virginia . . . . . . . . . . . . . . . . . . . . . . . . . . . . . . . 53,779 108,646 (54,867) -51%
East . . . . . . . . . . . . . . . . . . . . . . . . . . . . . . 87,118 185,627 (98,509) -53%
Delaware Valley . . . . . . . . . . . . . . . . . . . . . . . . 13,232 29,345 (16,113) -55%Florida . . . . . . . . . . . . . . . . . . . . . . . . . . . . . . . . 12,548 74,149 (61,601) -83%Illinois . . . . . . . . . . . . . . . . . . . . . . . . . . . . . . . . 8,834 23,105 (14,271) -62%Texas . . . . . . . . . . . . . . . . . . . . . . . . . . . . . . . . . - 203 (203) -100%
Other Homebuilding . . . . . . . . . . . . . . . . . 34,614 126,802 (92,188) -73%
Total . . . . . . . . . . . . . . . . . . . . . . . . . . . . . . . $ 554,336 $ 1,575,158 $ (1,020,822) -65%
The following table shows the carrying value of housing completed or under construction for each market withinour homebuilding segments (dollars in thousands).
December 31, 2007 Increase (Decrease)
2007 2006 Amount %
Arizona . . . . . . . . . . . . . . . . . . . . . . . . . . . . . . . . . $ 169,394 $ 217,051 $ (47,657) -22%California . . . . . . . . . . . . . . . . . . . . . . . . . . . . . . . 221,571 392,210 (170,639) -44%Nevada . . . . . . . . . . . . . . . . . . . . . . . . . . . . . . . . . 76,695 129,681 (52,986) -41%
West . . . . . . . . . . . . . . . . . . . . . . . . . . . . . . . . . . . 467,660 738,942 (271,282) -37%
Colorado . . . . . . . . . . . . . . . . . . . . . . . . . . . . . . . . 143,108 115,183 27,925 24%Utah . . . . . . . . . . . . . . . . . . . . . . . . . . . . . . . . . . . . 73,118 98,081 (24,963) -25%
Mountain . . . . . . . . . . . . . . . . . . . . . . . . . . . . 216,226 213,264 2,962 1%
Maryland . . . . . . . . . . . . . . . . . . . . . . . . . . . . . . . . 63,089 49,367 13,722 28%Virginia . . . . . . . . . . . . . . . . . . . . . . . . . . . . . . . . . 71,277 60,137 11,140 19%
East . . . . . . . . . . . . . . . . . . . . . . . . . . . . . . . . 134,366 109,504 24,862 23%
Delaware Valley . . . . . . . . . . . . . . . . . . . . . . . . . . 27,987 31,849 (3,862) -12%Florida . . . . . . . . . . . . . . . . . . . . . . . . . . . . . . . . . . 35,569 67,794 (32,225) -48%Illinois . . . . . . . . . . . . . . . . . . . . . . . . . . . . . . . . . . 20,413 13,867 6,546 47%Texas . . . . . . . . . . . . . . . . . . . . . . . . . . . . . . . . . . . - 3,451 (3,451) -100%
Other Homebuilding . . . . . . . . . . . . . . . . . . . 83,969 116,961 (32,992) -28%
Total . . . . . . . . . . . . . . . . . . . . . . . . . . . . . . . . . $ 902,221 $ 1,178,671 $ (276,450) -23%
- 56 -

The tables below show the total number of lots owned (excluding homes completed or under construction) andlots controlled under option agreements for each market within our homebuilding segments (in units).
December 31, 2007 Increase (Decrease)
2007 2006 Amount %
Lots OwnedArizona . . . . . . . . . . . . . . . . . . . . . . . . . . . . . . . 2,969 6,368 (3,399) -53%California . . . . . . . . . . . . . . . . . . . . . . . . . . . . . 1,491 2,802 (1,311) -47%Nevada . . . . . . . . . . . . . . . . . . . . . . . . . . . . . . . 1,549 2,747 (1,198) -44%
West . . . . . . . . . . . . . . . . . . . . . . . . . . . . . 6,009 11,917 (5,908) -50%
Colorado . . . . . . . . . . . . . . . . . . . . . . . . . . . . . . 2,992 3,479 (487) -14%Utah . . . . . . . . . . . . . . . . . . . . . . . . . . . . . . . . . . 863 1,185 (322) -27%
Mountain . . . . . . . . . . . . . . . . . . . . . . . . . . 3,855 4,664 (809) -17%
Maryland . . . . . . . . . . . . . . . . . . . . . . . . . . . . . . 302 528 (226) -43%Virginia . . . . . . . . . . . . . . . . . . . . . . . . . . . . . . . 369 643 (274) -43%
East . . . . . . . . . . . . . . . . . . . . . . . . . . . . . . 671 1,171 (500) -43%
Delaware Valley . . . . . . . . . . . . . . . . . . . . . . . . 151 265 (114) -43%Florida . . . . . . . . . . . . . . . . . . . . . . . . . . . . . . . . 638 1,093 (455) -42%Illinois . . . . . . . . . . . . . . . . . . . . . . . . . . . . . . . . 191 287 (96) -33%Texas . . . . . . . . . . . . . . . . . . . . . . . . . . . . . . . . . - 13 (13) -100%
Other Homebuilding . . . . . . . . . . . . . . . . . 980 1,658 (678) -41%
Total . . . . . . . . . . . . . . . . . . . . . . . . . . . . . . . 11,515 19,410 (7,895) -41%
Lots Controlled Under OptionArizona . . . . . . . . . . . . . . . . . . . . . . . . . . . . . . . 512 744 (232) -31%California . . . . . . . . . . . . . . . . . . . . . . . . . . . . . 157 387 (230) -59%Nevada . . . . . . . . . . . . . . . . . . . . . . . . . . . . . . . 4 250 (246) -98%
West . . . . . . . . . . . . . . . . . . . . . . . . . . . . . 673 1,381 (708) -51%
Colorado . . . . . . . . . . . . . . . . . . . . . . . . . . . . . . 262 801 (539) -67%Utah . . . . . . . . . . . . . . . . . . . . . . . . . . . . . . . . . . - 91 (91) -100%
Mountain . . . . . . . . . . . . . . . . . . . . . . . . . . 262 892 (630) -71%
Maryland . . . . . . . . . . . . . . . . . . . . . . . . . . . . . . 558 960 (402) -42%Virginia . . . . . . . . . . . . . . . . . . . . . . . . . . . . . . . 1,311 2,381 (1,070) -45%
East . . . . . . . . . . . . . . . . . . . . . . . . . . . . . . 1,869 3,341 (1,472) -44%
Delaware Valley . . . . . . . . . . . . . . . . . . . . . . . . 327 683 (356) -52%Florida . . . . . . . . . . . . . . . . . . . . . . . . . . . . . . . . 484 1,800 (1,316) -73%Illinois . . . . . . . . . . . . . . . . . . . . . . . . . . . . . . . . - - - 0%Texas . . . . . . . . . . . . . . . . . . . . . . . . . . . . . . . . . - - - 0%
Other Homebuilding . . . . . . . . . . . . . . . . . 811 2,483 (1,672) -67%
Total . . . . . . . . . . . . . . . . . . . . . . . . . . . . . . . 3,615 8,097 (4,482) -55%
Total Lots Owned and Controlled . . . . . . . . . . . . 15,130 27,507 (12,377) -45%
- 57 -

During the twelve months ended December 31, 2007, in view of the reduced pace of new home ordersexperienced in our markets, we focused on reducing the total number of lots owned and controlled under option.Accordingly, the total number of lots owned (excluding homes completed or under construction) atDecember 31, 2007 declined 41%, including decreases in each of our homebuilding segments. The 2007 decrease inlots owned and land and land under development resulted from: (1) the transfer of lots from land to homes completedor under construction; (2) minimizing the number of land acquisitions; and (3) the sale of nearly 2,000 lots,particularly in our West segment where we sold more than 1,700 lots, resulting from a deterioration in the new homesales market that led us to the conclusion that the best use of these assets was to sell them in their current condition.As a result of these efforts, and the impact of recording $556.3 million of impairments on our land inventory during2007, we reduced our land and land under development by $1.0 billion since December 31, 2006.
Our total lots controlled under option at December 31, 2007 decreased by 55% from December 31, 2006,including declines within each of our homebuilding segments. These decreases primarily related to: (1) thetermination of lot option contracts with terms that no longer met our underwriting criteria, resulting in approximately$23.4 million in write-offs of lot option deposits and pre-acquisition costs during the year ended December 31, 2007;(2) limiting the number of new contracts for the purchase of lots under option; and (3) the termination of lot optionpurchase contracts in Tampa as we initiated the process of exiting this sub-market.
Homebuilding Operating Activities—2006 Compared With 2005 (dollars in thousands).
The table below sets forth information relating to Home Gross Margins and orders for homes.
Year Ended December 31, 2006 Increase (Decrease)
2006 2005 Amount %
Home Gross Margin . . . . . . . . . . . . . . . . . . . . . 22.2% 28.3% -6.1%Orders For Homes, net (Units)
Arizona . . . . . . . . . . . . . . . . . . . . . . . . . . . . . 2,758 3,627 (869) -24%California . . . . . . . . . . . . . . . . . . . . . . . . . . . 1,450 2,060 (610) -30%Nevada . . . . . . . . . . . . . . . . . . . . . . . . . . . . . 2,048 3,293 (1,245) -38%
West . . . . . . . . . . . . . . . . . . . . . . . . . . . 6,256 8,980 (2,724) -30%
Colorado . . . . . . . . . . . . . . . . . . . . . . . . . . . . 1,139 2,075 (936) -45%Utah . . . . . . . . . . . . . . . . . . . . . . . . . . . . . . . . 1,049 953 96 10%
Mountain . . . . . . . . . . . . . . . . . . . . . . . . 2,188 3,028 (840) -28%
Maryland . . . . . . . . . . . . . . . . . . . . . . . . . . . . 380 423 (43) -10%Virginia . . . . . . . . . . . . . . . . . . . . . . . . . . . . . 462 739 (277) -37%
East . . . . . . . . . . . . . . . . . . . . . . . . . . . . 842 1,162 (320) -28%
Delaware Valley . . . . . . . . . . . . . . . . . . . . . . 138 191 (53) -28%Florida . . . . . . . . . . . . . . . . . . . . . . . . . . . . . . 519 1,044 (525) -50%Illinois . . . . . . . . . . . . . . . . . . . . . . . . . . . . . . 117 148 (31) -21%Texas . . . . . . . . . . . . . . . . . . . . . . . . . . . . . . . 169 781 (612) -78%
Other Homebuilding . . . . . . . . . . . . . . . 943 2,164 (1,221) -56%
Total . . . . . . . . . . . . . . . . . . . . . . . . . . . . . 10,229 15,334 (5,105) -33%
Estimated Value of Orders for Homes, net . . . . $ 3,467,000 $ 5,233,000 $ (1,766,000) -34%
Estimated Average Selling Price of Orders forHomes, net . . . . . . . . . . . . . . . . . . . . . . . . . . $ 338.9 $ 341.3 $ (2.4) -1%
Cancellation Rate . . . . . . . . . . . . . . . . . . . . . . . 43% 24% 19%
- 58 -

Orders for Homes. During the year ended December 31, 2006 and 2005, we received 10,299 and 15,334 nethome orders, respectively. Each of our homebuilding segments experienced year-over-year declines in net homeorders, driven in part by significant increases in our Cancellation Rate, fewer gross orders taken in each market withinour homebuilding segments except Utah, Arizona, Maryland and Delaware Valley, and increases in competitionresulting from higher inventory levels of new and existing homes. Prospective homebuyers began delaying homepurchases during this period of uncertainty. We continued to respond to the increases in our Cancellation Rate and theuncertainty in the homebuilding market by increasing incentives and offering limited time sales promotions, with theobjective of improving our sales velocity.
Home Gross Margins. Home Gross Margins decreased during 2006 primarily due to offering higher salesincentives in order to generate net home orders and subsequent home closings, increases in the cost of land and higherhome construction costs incurred in building larger homes which we were unable to recover through increases in theaverage selling prices for our closed homes. These factors contributed to significant reductions in 2006 to HomeGross Margins in California, Nevada and Virginia.
Cancellation Rate. Our Cancellation Rates were 43% and 24% for the years ended December 31, 2006 and2005, respectively. The 2006 Cancellation Rate increased significantly in nearly all markets, most notably Arizona,California, Florida and Virginia. The increases in these markets resulted primarily from: (1) the exit of speculatorsfrom the new home market; (2) an increased supply of new and previously owned homes available to be purchased,which made it more difficult for homebuyers to sell their existing homes; (3) increased uncertainty regarding thehousing market and the lack of home price appreciation; and (4) increased incentives being offered by competitors.
Homes Closed. The following table sets forth homes closed for each market within our homebuilding segments(in units).
Year Ended December 31, 2006 Increase (Decrease)
2006 2005 Amount %
Arizona . . . . . . . . . . . . . . . . . . . . . . . . . . . . . . . 3,353 3,671 (318) -9%California . . . . . . . . . . . . . . . . . . . . . . . . . . . . . 1,788 2,102 (314) -15%Nevada . . . . . . . . . . . . . . . . . . . . . . . . . . . . . . . 2,756 3,016 (260) -9%
West . . . . . . . . . . . . . . . . . . . . . . . . . . . . . 7,897 8,789 (892) -10%
Colorado . . . . . . . . . . . . . . . . . . . . . . . . . . . . . . 1,463 2,190 (727) -33%Utah . . . . . . . . . . . . . . . . . . . . . . . . . . . . . . . . . . 922 904 18 2%
Mountain . . . . . . . . . . . . . . . . . . . . . . . . . . 2,385 3,094 (709) -23%
Maryland . . . . . . . . . . . . . . . . . . . . . . . . . . . . . . 444 397 47 12%Virginia . . . . . . . . . . . . . . . . . . . . . . . . . . . . . . . 707 1,026 (319) -31%
East . . . . . . . . . . . . . . . . . . . . . . . . . . . . . . 1,151 1,423 (272) -19%
Delaware Valley . . . . . . . . . . . . . . . . . . . . . . . . 200 33 167 N/AFlorida . . . . . . . . . . . . . . . . . . . . . . . . . . . . . . . . 921 1,083 (162) -15%Illinois . . . . . . . . . . . . . . . . . . . . . . . . . . . . . . . . 174 86 88 102%Texas . . . . . . . . . . . . . . . . . . . . . . . . . . . . . . . . . 395 799 (404) -51%
Other Homebuilding . . . . . . . . . . . . . . . . . 1,690 2,001 (311) -16%
Total . . . . . . . . . . . . . . . . . . . . . . . . . . . . . . . 13,123 15,307 (2,184) -14%
- 59 -

Our home closings were down in each homebuilding segment during 2006. In our West segment, we closed 892fewer homes primarily due to decreases in net home orders received during the 2006 spring selling season andsignificant increases in the Cancellation Rates within each market of the segment. Also contributing to the decrease inWest segment home closings was a lower Backlog in our Arizona and California markets at the beginning of the 2006year, compared with 2005. The decreases in closed homes during 2006 in our Mountain and East segments primarilywere driven by fewer home closings in the Colorado and Virginia markets, respectively, resulting from lowerBacklogs at the beginning of the 2006 period, compared with 2005. The decrease in home closings in our OtherHomebuilding segment resulted from closing fewer homes in our Florida and Texas markets, offset in part byincreased home closings in our Delaware Valley and Illinois markets. We closed fewer homes during 2006 in Floridaprimarily due to a lower Backlog at the beginning of the 2006 period, compared with 2005. Additionally, we closedfewer homes in Texas, as we continued to close down our operations in this market. Our closed homes increased inDelaware Valley and Illinois primarily due to these start-up markets becoming more established during 2006.
Backlog. The following table sets forth information relating to Backlog within each market of our homebuildingsegments.
December 31, 2006 Increase (Decrease)
2006 2005 Amount %
Arizona . . . . . . . . . . . . . . . . . . . . . . . . . . . . . . . 1,504 2,099 (595) -28%California . . . . . . . . . . . . . . . . . . . . . . . . . . . . . 427 765 (338) -44%Nevada . . . . . . . . . . . . . . . . . . . . . . . . . . . . . . . 315 1,023 (708) -69%
West . . . . . . . . . . . . . . . . . . . . . . . . . . . . . 2,246 3,887 (1,641) -42%
Colorado . . . . . . . . . . . . . . . . . . . . . . . . . . . . . . 253 577 (324) -56%Utah . . . . . . . . . . . . . . . . . . . . . . . . . . . . . . . . . . 465 338 127 38%
Mountain . . . . . . . . . . . . . . . . . . . . . . . . . . 718 915 (197) -22%
Maryland . . . . . . . . . . . . . . . . . . . . . . . . . . . . . . 187 251 (64) -25%Virginia . . . . . . . . . . . . . . . . . . . . . . . . . . . . . . . 136 381 (245) -64%
East . . . . . . . . . . . . . . . . . . . . . . . . . . . . . . 323 632 (309) -49%
Delaware Valley . . . . . . . . . . . . . . . . . . . . . . . . 119 181 (62) -34%Florida . . . . . . . . . . . . . . . . . . . . . . . . . . . . . . . . 197 599 (402) -67%Illinois . . . . . . . . . . . . . . . . . . . . . . . . . . . . . . . . 23 80 (57) -71%Texas . . . . . . . . . . . . . . . . . . . . . . . . . . . . . . . . . 12 238 (226) -95%
Other Homebuilding . . . . . . . . . . . . . . . . . 351 1,098 (747) -68%
Total . . . . . . . . . . . . . . . . . . . . . . . . . . . . . . . 3,638 6,532 (2,894) -44%
Backlog Estimated Sales Value . . . . . . . . . . . . $ 1,300,000 $ 2,440,000 $ (1,140,000) -47%
Estimated Average Selling Price of Homes inBacklog . . . . . . . . . . . . . . . . . . . . . . . . . . . . . $ 357.3 $ 373.5 $ (16.2) -4%
At December 31, 2006 and 2005, we had 3,638 and 6,532 homes in Backlog, respectively. Because our changein Backlog during the 2006 period equals total net home orders received during 2006 less homes closed during 2006,refer to the previous discussion on “Homes Closed” and “Orders for Homes” for an explanation of the change in thenumber of homes in Backlog.
The estimated Backlog sales value decreased from $2.4 billion at December 31, 2005 to $1.3 billion atDecember 31, 2006, primarily due to the 44% decrease in homes in Backlog and a 4% decrease in the estimatedaverage selling price of homes in Backlog. This decrease was most notable in our West segment, where the estimated
- 60 -

Backlog sales value decreased by more than $200 million in each market of this segment. Estimated Backlog salesvalue also declined during 2006 in each market of our East and Other Homebuilding segments. Our Mountainsegment remained relatively flat at December 31, 2006, compared with December 31, 2005, where we experienced ahigher estimated Backlog sales value in Utah, offset by a decrease in Colorado. The increase in Utah primarilyresulted from a higher Backlog at December 31, 2006, compared with December 31, 2005, and an increase in theestimated average selling price of homes in Backlog.
Average Selling Prices Per Home Closed. The following table displays our average selling prices per homeclosed, by market.
Year Ended December 31, 2006 Increase (Decrease)
2006 2005 Amount %
Arizona . . . . . . . . . . . . . . . . . . . . . . . . . . . . . . . $ 294.6 $ 227.2 $ 67.4 30%California . . . . . . . . . . . . . . . . . . . . . . . . . . . . . 558.7 512.6 46.1 9%Colorado . . . . . . . . . . . . . . . . . . . . . . . . . . . . . . 308.7 286.3 22.4 8%Delaware Valley . . . . . . . . . . . . . . . . . . . . . . . . 405.7 369.6 36.1 10%Florida . . . . . . . . . . . . . . . . . . . . . . . . . . . . . . . . 284.8 219.9 64.9 30%Illinois . . . . . . . . . . . . . . . . . . . . . . . . . . . . . . . . 367.5 389.4 (21.9) -6%Maryland . . . . . . . . . . . . . . . . . . . . . . . . . . . . . . 558.0 482.8 75.2 16%Nevada . . . . . . . . . . . . . . . . . . . . . . . . . . . . . . . 317.5 305.8 11.7 4%Texas . . . . . . . . . . . . . . . . . . . . . . . . . . . . . . . . . 165.9 160.6 5.3 3%Utah . . . . . . . . . . . . . . . . . . . . . . . . . . . . . . . . . . 303.3 226.4 76.9 34%Virginia . . . . . . . . . . . . . . . . . . . . . . . . . . . . . . . 536.3 527.1 9.2 2%
Total . . . . . . . . . . . . . . . . . . . . . . . . . . . . . . . $ 354.4 $ 313.1 $ 41.3 13%
During 2006, we experienced a 13% increase in the average selling price of homes closed, as the average sellingprices of homes closed increased in most of our markets. Increases during 2006 were most notable in Arizona,Florida, Maryland and Utah, where the average selling prices for homes closed increased in excess of $60,000,primarily due to changes in the style and size of our single-family detached homes being closed in these markets. Theaverage selling prices for homes in most of our markets were, however, negatively impacted by increased levels ofincentives in response to the lower demand for new homes during this down cycle. The average selling price of homesclosed in 2006 was impacted favorably by closing fewer homes in Texas during 2006, where the average selling pricewas more than $185,000 below the Company average.
- 61 -
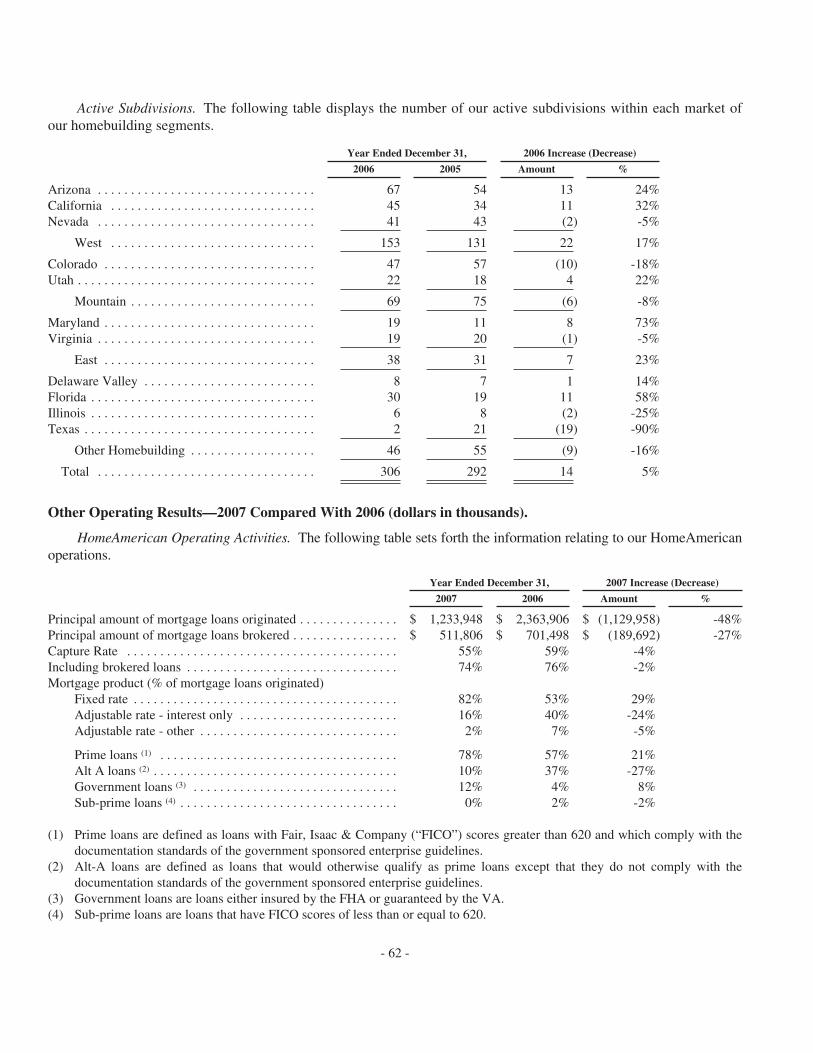
Active Subdivisions. The following table displays the number of our active subdivisions within each market ofour homebuilding segments.
Year Ended December 31, 2006 Increase (Decrease)
2006 2005 Amount %
Arizona . . . . . . . . . . . . . . . . . . . . . . . . . . . . . . . . . 67 54 13 24%California . . . . . . . . . . . . . . . . . . . . . . . . . . . . . . . 45 34 11 32%Nevada . . . . . . . . . . . . . . . . . . . . . . . . . . . . . . . . . 41 43 (2) -5%
West . . . . . . . . . . . . . . . . . . . . . . . . . . . . . . . 153 131 22 17%
Colorado . . . . . . . . . . . . . . . . . . . . . . . . . . . . . . . . 47 57 (10) -18%Utah . . . . . . . . . . . . . . . . . . . . . . . . . . . . . . . . . . . . 22 18 4 22%
Mountain . . . . . . . . . . . . . . . . . . . . . . . . . . . . 69 75 (6) -8%
Maryland . . . . . . . . . . . . . . . . . . . . . . . . . . . . . . . . 19 11 8 73%Virginia . . . . . . . . . . . . . . . . . . . . . . . . . . . . . . . . . 19 20 (1) -5%
East . . . . . . . . . . . . . . . . . . . . . . . . . . . . . . . . 38 31 7 23%
Delaware Valley . . . . . . . . . . . . . . . . . . . . . . . . . . 8 7 1 14%Florida . . . . . . . . . . . . . . . . . . . . . . . . . . . . . . . . . . 30 19 11 58%Illinois . . . . . . . . . . . . . . . . . . . . . . . . . . . . . . . . . . 6 8 (2) -25%Texas . . . . . . . . . . . . . . . . . . . . . . . . . . . . . . . . . . . 2 21 (19) -90%
Other Homebuilding . . . . . . . . . . . . . . . . . . . 46 55 (9) -16%
Total . . . . . . . . . . . . . . . . . . . . . . . . . . . . . . . . . 306 292 14 5%
Other Operating Results—2007 Compared With 2006 (dollars in thousands).
HomeAmerican Operating Activities. The following table sets forth the information relating to our HomeAmericanoperations.
Year Ended December 31, 2007 Increase (Decrease)
2007 2006 Amount %
Principal amount of mortgage loans originated . . . . . . . . . . . . . . . $ 1,233,948 $ 2,363,906 $ (1,129,958) -48%Principal amount of mortgage loans brokered . . . . . . . . . . . . . . . . $ 511,806 $ 701,498 $ (189,692) -27%Capture Rate . . . . . . . . . . . . . . . . . . . . . . . . . . . . . . . . . . . . . . . . . 55% 59% -4%Including brokered loans . . . . . . . . . . . . . . . . . . . . . . . . . . . . . . . . 74% 76% -2%Mortgage product (% of mortgage loans originated)
Fixed rate . . . . . . . . . . . . . . . . . . . . . . . . . . . . . . . . . . . . . . . . 82% 53% 29%Adjustable rate - interest only . . . . . . . . . . . . . . . . . . . . . . . . 16% 40% -24%Adjustable rate - other . . . . . . . . . . . . . . . . . . . . . . . . . . . . . . 2% 7% -5%
Prime loans (1) . . . . . . . . . . . . . . . . . . . . . . . . . . . . . . . . . . . . 78% 57% 21%Alt A loans (2) . . . . . . . . . . . . . . . . . . . . . . . . . . . . . . . . . . . . . 10% 37% -27%Government loans (3) . . . . . . . . . . . . . . . . . . . . . . . . . . . . . . . 12% 4% 8%Sub-prime loans (4) . . . . . . . . . . . . . . . . . . . . . . . . . . . . . . . . . 0% 2% -2%
(1) Prime loans are defined as loans with Fair, Isaac & Company (“FICO”) scores greater than 620 and which comply with thedocumentation standards of the government sponsored enterprise guidelines.
(2) Alt-A loans are defined as loans that would otherwise qualify as prime loans except that they do not comply with thedocumentation standards of the government sponsored enterprise guidelines.
(3) Government loans are loans either insured by the FHA or guaranteed by the VA.(4) Sub-prime loans are loans that have FICO scores of less than or equal to 620.
- 62 -

The principal amount of mortgage loans originated and brokered decreased during the year ended December 31,2007, primarily due to MDC closing 38% fewer homes and declines in the 2007 Capture Rate. The “Capture Rate” isdefined as the number of mortgage loans originated by HomeAmerican for our homebuyers as a percent of total MDChome closings.
Fixed rate mortgage loans as a percentage of the total mortgage loans HomeAmerican originated increasedsignificantly during the twelve months ended December 31, 2007, due in part to a decrease in the difference in interestrates for adjustable rate mortgage loans and fixed rate mortgage loans, making fixed rate loans more attractive for ourhomebuyers. Also contributing to this increase was a reduced demand by third-party purchasers for non-conformingmortgage loans. In response to the reduced liquidity in the mortgage lending industry, we tightened our mortgage loanunderwriting criteria during 2007 by: (1) discontinuing Alt-A second mortgage loans and Non-Agency (defined as notbeing FNMA and FHLMC eligible) mortgage loans with combined-loan-to-values in excess of 95%; and (2) requiringlarger down payments from homebuyers in communities where the market value of homes have been declining. As aresult, during the year ended December 31, 2007, HomeAmerican originated fewer: (1) high loan-to-value mortgageloans; (2) sub-prime and Alt-A mortgage loan products; and (3) loans with related second mortgages.
During 2007, we started selling more of our originated mortgage loans on a flow basis rather than a bulk basisand, beginning in the 2007 third quarter, selling substantially all originated Non-Agency products faster after theclosing of the home. These strategies were undertaken to mitigate some of the risks associated with holding thesemortgage loans.
Interest Activity. We capitalize interest on our homebuilding inventories during the period of active developmentand through the completion of construction. All interest incurred by our Corporate and homebuilding segments during2007 and 2006 was capitalized. Interest incurred by our Corporate and homebuilding segments was $57.8 million and$58.1 million during the years ended December 31, 2007 and 2006, respectively. For a reconciliation of interestincurred, capitalized and expensed, see Note 15 to our Consolidated Financial Statements.
Other Operating Results—2006 Compared With 2005 (dollars in thousands).
HomeAmerican Operating Activities. The following table sets forth the information relating to ourHomeAmerican operations.
Year Ended December 31, 2006 Increase (Decrease)
2006 2005 Amount %
Principal amount of mortgage loans originated . . . . . . . . . . . . . . . $ 2,363,906 $ 1,949,863 $ 414,043 21%Principal amount of mortgage loans brokered . . . . . . . . . . . . . . . . $ 701,498 $ 964,977 $ (263,479) -27%Capture Rate . . . . . . . . . . . . . . . . . . . . . . . . . . . . . . . . . . . . . . . . . 59% 49% 10%Including brokered loans . . . . . . . . . . . . . . . . . . . . . . . . . . . . . . . . 76% 72% 4%Mortgage product (% of mortgage loans originated)
Fixed rate . . . . . . . . . . . . . . . . . . . . . . . . . . . . . . . . . . . . . . . . . . 53% 53% 0%Adjustable rate - interest only . . . . . . . . . . . . . . . . . . . . . . . . . . 40% 37% 3%Adjustable rate - other . . . . . . . . . . . . . . . . . . . . . . . . . . . . . . . . 7% 10% -3%
Prime loans . . . . . . . . . . . . . . . . . . . . . . . . . . . . . . . . . . . . . . . . 57% 85% -28%Alt A loans . . . . . . . . . . . . . . . . . . . . . . . . . . . . . . . . . . . . . . . . . 37% 6% 31%Government loans . . . . . . . . . . . . . . . . . . . . . . . . . . . . . . . . . . . 4% 6% -2%Sub-prime loans . . . . . . . . . . . . . . . . . . . . . . . . . . . . . . . . . . . . . 2% 3% -1%
During 2006, the principal amount of mortgage loans originated increased, primarily due to an increase in ourCapture Rate, as well as an increase in the average principal amount of mortgage loans originated by HomeAmerican.
- 63 -

The increase in our Capture Rate primarily resulted from: (1) having more mortgage loan products offered to ourhomebuyers through HomeAmerican, which include, among other things, interest only mortgage loans and mortgageprograms with low or no down payments; (2) increased management focus on providing competitive mortgage loanproducts rather than brokering these loans to third-parties; and (3) incentives offered to more of our homebuyersduring 2006 for using HomeAmerican mortgage products. Brokered loans, for which HomeAmerican received a fee,have been excluded from the computation of the Capture Rate.
Interest Activity. All interest incurred by our Corporate and homebuilding segments during 2006 and 2005 wascapitalized. Interest incurred by our Corporate and homebuilding segments increased to $58.1 million in 2006,compared with $51.9 million in 2005. The increase in 2006 primarily was due to an increase in the average debtbalance in 2006 as we issued senior notes in the second half of 2005.
LIQUIDITY AND CAPITAL RESOURCES
We use our liquidity and capital resources to (1) support our operations, including the purchase of land, landdevelopment and construction of homes; (2) provide working capital; and (3) provide mortgage loans for ourhomebuyers. Liquidity and capital resources are generated internally from operations and from external sources,primarily our senior notes and lines of credit. Additionally, we have an effective shelf registration statement, whichallows us to issue equity, debt or hybrid securities up to $1.0 billion, with $500 million earmarked for our medium-term senior notes program.
Capital Resources.
Our capital structure is a combination of (1) permanent financing, represented by stockholders’ equity; (2) long-term financing, represented by our publicly traded 7% senior notes due 2012, 5 1⁄2% senior notes due 2013, 5 3⁄8%medium-term senior notes due 2014 and 2015 and our homebuilding line of credit (the “Homebuilding Line”); and(3) current financing, primarily our mortgage lending line of credit (the “Mortgage Line”). Based upon our currentcapital resources and additional capacity available under existing credit agreements, we believe that our currentfinancial condition is both balanced to fit our current operating structure and adequate to satisfy our current and near-term capital requirements. We continue to monitor and evaluate the adequacy of our Homebuilding Line andMortgage Line. However, we believe that we can meet our long-term capital needs (including meeting future debtpayments and refinancing or paying off other long-term debt as it becomes due) from operations and externalfinancing sources, assuming that no significant adverse changes in our business or capital and credit markets occur asa result of the various risk factors described in Item 1A “Risk Factors Relating to our Business.” See “Forward-Looking Statements” above.
Lines of Credit and Notes Payable.
Homebuilding. Our Homebuilding Line is an unsecured revolving line of credit with a group of lenders forsupport of our homebuilding segments. Our Homebuilding Line has an aggregate commitment amount of $1.25billion (the “Commitment”) and a maturity date of March 21, 2011. The facility’s provision for letters of credit isavailable in the aggregate amount of $500 million. The facility permits an increase in the maximum commitmentamount to $1.75 billion upon our request, subject to receipt of additional commitments from existing or additionalparticipant lenders. Interest rates on outstanding borrowings are determined by reference to a chosen LondonInterbank Offered Rate (“LIBOR”), with a spread from LIBOR which is determined based on changes in our creditratings and leverage ratio, or to an alternate base rate. At December 31, 2007, we did not have any borrowings on ourHomebuilding Line and had $31.7 million in letters of credit issued, which reduced the amount available to beborrowed under the Homebuilding Line.
- 64 -

Mortgage Lending. Our Mortgage Line has a borrowing limit of $225 million with terms that allow for increasesof up to $175 million in the borrowing limit to a maximum of $400 million, subject to concurrence by theparticipating banks. Additionally, during 2007, the Company completed the First Amendment to Fourth Amended andRestated Warehousing Credit Agreement, which was entered into primarily to set a liquidity measure at $7.5 million,adjust certain mortgage loan sublimits and provide for the withdrawal of one participating bank while maintaining thefacility at the same aggregate commitment level. Available borrowings under the Mortgage Line are collateralized bymortgage loans and mortgage-backed securities and are limited to the value of eligible collateral, as defined. AtDecember 31, 2007, $70.1 million was borrowed and an additional $23.7 million was collateralized and available tobe borrowed. The Mortgage Line is cancelable upon 120 days notice.
General. The agreements for our bank lines of credit and the indentures for our senior notes require compliancewith certain representations, warranties and covenants. We believe that we are in compliance with these requirements,and we are not aware of any covenant violations. The agreements containing these representations, warranties andcovenants for the bank lines of credit and the indentures for our senior notes are on file with the Securities andExchange Commission (the “SEC”) and are listed as Exhibits in Part IV of this Annual Report on Form 10-K.
The financial covenants contained in the Homebuilding Line agreement (as amended on January 24, 2008)include a leverage test and a consolidated tangible net worth test. Under the leverage test, generally, our consolidatedindebtedness is not permitted to exceed 55% (subject to adjustment in certain circumstances) of the sum ofconsolidated indebtedness and our “adjusted consolidated tangible net worth,” as defined. Effective January 24, 2008,our “consolidated tangible net worth” (as defined) under the Homebuilding Line consolidated tangible net worth testmust not be less than (1) $1.055 billion; plus (2) 50% of consolidated net income, as defined, earned by the Companyand the guarantor subsidiaries after December 31, 2007; plus (3) 50% of the net proceeds or other considerationreceived by the Company for the issuance of capital stock after December 31, 2007; minus (4) the lesser of (A) theaggregate amount paid by the Company after December 31, 2007 to repurchase its common stock and (B) $300million. Failure to satisfy the foregoing financial covenant tests would not result in a default, but would result in ascheduled reduction in the amount of the Commitment. In addition, “consolidated tangible net worth,” as defined,must not be less than the sum of (1) $850 million; (2) 50% of the “quarterly consolidated net income” of “borrower”and the “guarantors” earned after December 31, 2007; and (3) 50% of the net proceeds or other consideration receivedfor the issuance of capital stock after December 31, 2005. Failure to satisfy this covenant could result in a terminationof the facility. We believe that we are in full compliance with these covenants, and we are not aware of any covenantviolations.
Our senior notes are not secured and, while the senior notes indentures contain some restrictions on secured debtand other transactions, they do not contain financial covenants. Our senior notes are fully and unconditionallyguaranteed on an unsecured basis, jointly and severally, by most of our homebuilding segment subsidiaries.
Effective January 24, 2008, the maximum amount of additional homebuilding and corporate indebtedness thatwe could have incurred under the most restrictive of the debt limitations described above was approximately$1.24 billion.
MDC Common Stock Repurchase Program.
At December 31, 2007, we were authorized to repurchase up to 4,000,000 shares of our common stock. We didnot repurchase any shares of our common stock during the year ended December 31, 2007.
- 65 -
Consolidated Cash Flow.
Year Ended December 31, 2007. We generated $592.6 million in cash from operating activities for the yearended December 31, 2007. We generated $533.1 million from a reduction in homebuilding inventories through: theconstruction, sale and closing of homes in the ordinary course of business; the sale of land resulting from adeterioration in the new home sales market that led us to the conclusion that the best use of certain assets was to sellthem in their current condition; and the implementation of additional operating procedures intended to more closelycontrol cash outflows associated with land purchases, land development and home construction costs, and tighterprocesses for approving new home starts. Additionally, we generated $206.3 million in cash from a reduction in ourmortgage loans held in inventory and home sales and other receivables from December 31, 2006. The decline inmortgage loans held in inventory primarily was due to originating a higher volume of mortgage loans during the 2006fourth quarter, compared with the 2007 fourth quarter, and the strategy of selling a majority of all Non-Agencymortgage loans faster after the closing of the home in 2007. Offsetting these cash proceeds was the use of$175.3 million to reduce accounts payable and accrued liabilities, primarily related to the payment of employeebonuses and homebuilding construction payables. Additionally, we used $97.7 million in cash to reduce income taxespayable, primarily to establish an income taxes receivable balance as a result of our 2007 net operating loss carrybackand in connection with paying our 2006 tax obligations.
During the year ended December 31, 2007, we used $1.4 million in cash from investing activities. This cashusage primarily resulted from the purchase of a new aircraft during 2007. This cash usage was offset by proceedsfrom the sale of two aircraft.
During the twelve months ended December 31, 2007, we used $94.3 million in cash from financing activities.This cash usage primarily resulted from $60.3 million in net payments on our Mortgage Line and $45.8 million individend payments, partially offset by cash proceeds of $11.2 million from the exercise of stock options.
Year Ended December 31, 2006. We generated $363.0 million in cash from operating activities for the yearended December 31, 2006. The increase in our cash primarily resulted from our net income, including non-cashactivities, of $361.1 million and $134.8 million from decreases in our homebuilding inventories, as we focused onmanaging our balance sheet during this down cycle in the homebuilding industry. To that end, we reduced the totalnumber of lots owned by 4,035 units, or 17%, from December 31, 2005. The decrease in total lots owned was led bythe markets in our West segment, where we owned 2,890 fewer lots at December 31, 2006. This decline resulted fromthe deterioration in home demand conditions within each market of this segment. Also contributing to our cashprovided by operating activities was $39.3 million from decreases in our home sales and other receivables andmortgage loans held in inventory, net. These decreases resulted from closing more homes during the 2005 fourthquarter, compared with the 2006 fourth quarter, and selling the high volume of mortgage loans that were originatedfor these closed homes during 2006. Partially offsetting these cash proceeds, we used $69.8 million to reduce ourincome tax payables, primarily relating to payments made during 2006 associated with our 2005 income taxobligations. Additionally, we used $55.2 million in cash associated with prepaid and other assets, net, primarily inrelation to deferred marketing-related costs incurred in an effort to increase traffic in our home sales offices.
We used $10.2 million in investing activities during 2006, due to the purchase of property and equipment.
Financing activities used cash of $59.4 million during the year ended December 31, 2006, primarily for dividendpayments of $45.0 million and net payments on our lines of credit of $26.1 million. These cash usages partially were offsetby proceeds and tax benefits from the exercise of stock options of $11.6 million.
Year Ended December 31, 2005. We used cash of $424.9 million in our operating activities for the year endedDecember 31, 2005. The cash used in operations primarily was the result of the $981.8 million increase in our housing
- 66 -

completed or under construction and land and land under development. During 2005, we continued to expand ourhomebuilding operations in most of our existing markets through increased active subdivisions and controlled lotinventory, thereby expending cash to acquire additional homebuilding assets. As a result of those expansion efforts,we increased our carrying value of land and land under development position by 49% from $1.1 billion atDecember 31, 2004 to $1.7 billion at December 31, 2005. The increases in our land positions were most notable ineach market of our West segment and in our Other Homebuilding segment, particularly, the Florida market, where wecontinued to allocate additional resources for growth. In addition, we increased our average number of activesubdivisions by 23%, which contributed to a 49% increase in the value of housing completed or under construction.Additionally, our home sales and other receivables increased $119.1 million during 2005. This primarily was due to asignificant number of homes being closed in the last week of 2005, compared with the volume of homes closed in thesame period of 2004. Partially offsetting the aforementioned cash used from operations, were proceeds from netincome of $505.7 million and increases in accounts payable, accrued liabilities and income taxes payable of $232.3million.
We used $22.9 million in investing activities during 2005. These cash outlays resulted from the continuedexpansion of our homebuilding operations and primarily related to purchases of information technology equipment,office furniture and leasehold improvements associated primarily with the expansion of our Design Centers.
Financing activities provided cash of $261.4 million during the year ended December 31, 2005, primarily fromnet proceeds of $247.6 million from our issuance of medium-term senior notes in July 2005, cash proceeds of $26.3million from the exercise of stock options, and $21.1 million in net borrowings on our lines of credit, partially offsetby dividends paid of $33.5 million. The proceeds received upon the issuance of the medium-term senior notes in Julywere used primarily for the purchase of homebuilding inventories as noted above.
Off-Balance Sheet Arrangements.
In the ordinary course of business, we enter into lot option purchase contracts in order to procure lots for theconstruction of homes. Lot option contracts enable us to control lot positions with a minimal capital investment,which substantially reduces the risks associated with land ownership and development. At December 31, 2007, wehad non-refundable deposits of $6.3 million in the form of cash and $6.5 million in the form of letters of credit tosecure option contracts to purchase lots. In limited circumstances, in the event that we exercise our right to purchasethe lots or land under option, in addition to our purchase price, our obligation also includes certain costs we arerequired to reimburse the seller. At December 31, 2007, the total purchase price for lots under option and totalcapitalized pre-acquisition costs were $419 million and $1.4 million, respectively. Refer to Critical AccountingEstimates and Policies for additional information with respect to accounting for lot option purchase contracts whichhave been evaluated in accordance with FIN 46R and SFAS 49.
At December 31, 2007, we had outstanding performance bonds and letters of credit totaling approximately$281.6 million and $51.2 million, respectively, including $16.4 million in letters of credit issued by HomeAmerican,with the remaining issued by third-parties to secure our performance under various contracts. We expect that theobligations secured by these performance bonds and letters of credit generally will be performed in the ordinarycourse of business and in accordance with the applicable contractual terms. To the extent that the obligations areperformed, the related performance bonds and letters of credit should be released and we should not have anycontinuing obligations. However, in the event any such performance bonds or letters of credit issued by third-partiesare called, our indemnity obligations could require us to reimburse the issuer of the performance bond or letter ofcredit.
- 67 -

We have made no material guarantees with respect to third-party obligations.
Contractual Obligations.
The table below summarizes our known contractual obligations at December 31, 2007.
Payments due by Period (in thousands)
TotalLess than
1 Year 1 - 3 Years 4 - 5 Years After 5 Years
Long-term debt . . . . . . . . . . . . . . . . . . . . . . . . . . $ 997,091 $ - $ - $ 149,117 $ 847,974Interest on long-term debt . . . . . . . . . . . . . . . . . . 365,445 56,626 113,252 113,252 82,315Operating leases . . . . . . . . . . . . . . . . . . . . . . . . . . 55,595 14,721 19,212 9,922 11,740Retirement plans (1) . . . . . . . . . . . . . . . . . . . . . . . 950 950 - - -
Total (2) . . . . . . . . . . . . . . . . . . . . . . . . . . . . . . . $ 1,419,081 $ 72,297 $ 132,464 $ 272,291 $ 942,029
(1) Amounts represent our obligations under the Company’s 401(k) plan. Additionally, pursuant to a defined benefitretirement plan for two named executive officers of the Company, we are obligated to pay an estimated $13.5million upon their retirement. This estimated liability has been excluded from the table above as the paymentdate is variable based upon the date of the retirement of the named executives.
(2) The table above excludes $70.1 million of short-term indebtedness related to the Company’s Mortgage Line.Additionally, there were outstanding performance bonds and letters of credit totaling approximately $281.6million and $51.2 million, respectively, at December 31, 2007, which have been excluded from the table above.
IMPACT OF INFLATION AND CHANGING PRICES
Real estate and residential housing prices are affected by a number of factors, including but not limited toinflation, interest rate changes, competition and the supply of new and existing homes to be purchased. Inflation cancause increases in the price of land, raw materials and subcontracted labor. Unless these increased costs are recoveredthrough higher sales prices, Home Gross Margins would decrease. If interest rates increase, construction andfinancing costs, as well as the cost of borrowings, could also increase, which can result in lower Home GrossMargins. Increases in home mortgage interest rates make it more difficult for our customers to qualify for homemortgage loans, potentially decreasing home sales revenue. Increases in interest rates also may affect adversely thevolume of mortgage loan originations. Increases in competition and the supply of unsold new and existing homeshave had an adverse effect on our ability to generate new home orders and maintain home orders in Backlog, and havehad a significant negative impact on our Home Gross Margins and results from operations.
The volatility of interest rates could have an adverse effect on our future operations and liquidity. Reported gainson sales of mortgage loans may vary significantly from period to period depending on the volatility in the interest ratemarket. Derivative instruments utilized in the normal course of business by HomeAmerican include forward salessecurities commitments, private investor sales commitments and commitments to originate mortgage loans. We utilizethese commitments to manage the price risk on fluctuations in interest rates on our mortgage loans held in inventoryand commitments to originate mortgage loans. Such contracts are the only significant financial derivative instrumentswe utilize.
ISSUANCE OF STATEMENTS OF FINANCIAL ACCOUNTING STANDARDS
In September 2006, the FASB issued SFAS No. 157, “Fair Value Measurements” (“SFAS 157”), which definesfair value, establishes guidelines for measuring fair value and expands disclosures regarding fair value measurements.
- 68 -
SFAS 157 does not require any new fair value measurements but rather eliminates inconsistencies in guidance foundin various prior accounting pronouncements. SFAS 157 is effective for fiscal years beginning after November 15,2007. However, on December 14, 2007, the FASB issued proposed FASB Staff Position (“FSP”) SFAS 157-b (“FSP157-b”), which would delay the effective date of SFAS 157 for all non-financial assets and non-financial liabilities,except those that are recognized or disclosed at fair value in the financial statements on a recurring basis (at leastannually). FSP 157-b partially defers the effective date of SFAS 157 to fiscal years beginning after November 15,2008, and interim periods within those fiscal years for items within the scope of FSP 157-b. Effective for fiscal 2008,we will adopt SFAS 157 except as it applies to those non-financial assets and non-financial liabilities as noted inproposed FSP 157-b. The partial adoption of SFAS 157 is not expected to have a material impact on our financialposition, results of operations or cash flows.
In July 2006, the FASB issued FIN 48, “Accounting for Uncertainty in Income Taxes” (“FIN 48”). FIN 48 is aninterpretation of SFAS No. 109, “Accounting for Income Taxes” (“SFAS 109”). FIN 48 provides interpretiveguidance for the financial statement recognition and measurement of a tax position taken, or expected to be taken, in atax return. FIN 48 requires the affirmative evaluation that it is more-likely-than-not, based on the technical merits of atax position, that an enterprise is entitled to economic benefits resulting from positions taken in income tax returns. Ifa tax position does not meet the “more-likely-than-not” recognition threshold, the benefit of that position is notrecognized in the financial statements. FIN 48 also requires companies to disclose additional quantitative andqualitative information in their financial statements about uncertain tax positions. FIN 48 was effective for fiscal yearbeginning January 1, 2007, and the $0.3 million cumulative effect of applying FIN 48 was reported as an adjustmentto the opening balance of retained earnings for this fiscal year.
In February 2007, the FASB issued SFAS No. 159, “The Fair Value Option for Financial Assets and FinancialLiabilities, Including an amendment of FASB Statement No. 115” (“SFAS 159”). SFAS 159 permits entities tochoose to measure many financial instruments and certain other items at fair value that are not currently required to bemeasured at fair value and establishes presentation and disclosure requirements designed to facilitate comparisonsbetween entities that choose different measurement attributes for similar types of assets and liabilities. SFAS 159 iseffective for financial statements issued for fiscal years beginning after November 15, 2007. We do not expect SFAS159 to have a material impact on our financial position, results of operations or cash flows upon adoption.
In November 2007, the SEC issued Staff Accounting Bulletin (“SAB”) No. 109, “Written Loan CommitmentsRecorded at Fair Value Through Earnings” (“SAB 109”). SAB 109 supersedes guidance provided by SAB No. 105,“Loan Commitments Accounted for as Derivative Instruments” (“SAB 105”) and provides guidance on written loancommitments accounted for at fair value through earnings. Specifically, SAB 109 addresses the inclusion of expectednet future cash flows related to the associated servicing of a loan in the measurement of all written loan commitmentsaccounted for at fair value through earnings. In addition, SAB 109 retains the SEC’s position on the exclusion ofinternally-developed intangible assets as part of the fair value of a derivative loan commitment originally establishedin SAB 105. SAB 109 is effective for fiscal years ending after December 15, 2007. We currently are evaluating theimpact, if any, that SAB 109 may have on our financial position, results of operations or cash flows.
Item 7A. Quantitative and Qualitative Disclosures About Market Risk.
We are exposed to market risks related to fluctuations in interest rates on mortgage loans held in inventory anddebt. Derivative instruments utilized in the normal course of business by HomeAmerican include forward salessecurities commitments, private investor sales commitments and commitments to originate mortgage loans. We utilizethese commitments to manage the price risk on fluctuations in interest rates on our mortgage loans owned andcommitments to originate mortgage loans. Such contracts are the only significant financial derivative instrumentsutilized by MDC. HomeAmerican’s mortgage loans in process that had not closed at December 31, 2007 had anaggregate principal balance of approximately $387.6 million, of which $37.6 million were under interest rate lock
- 69 -
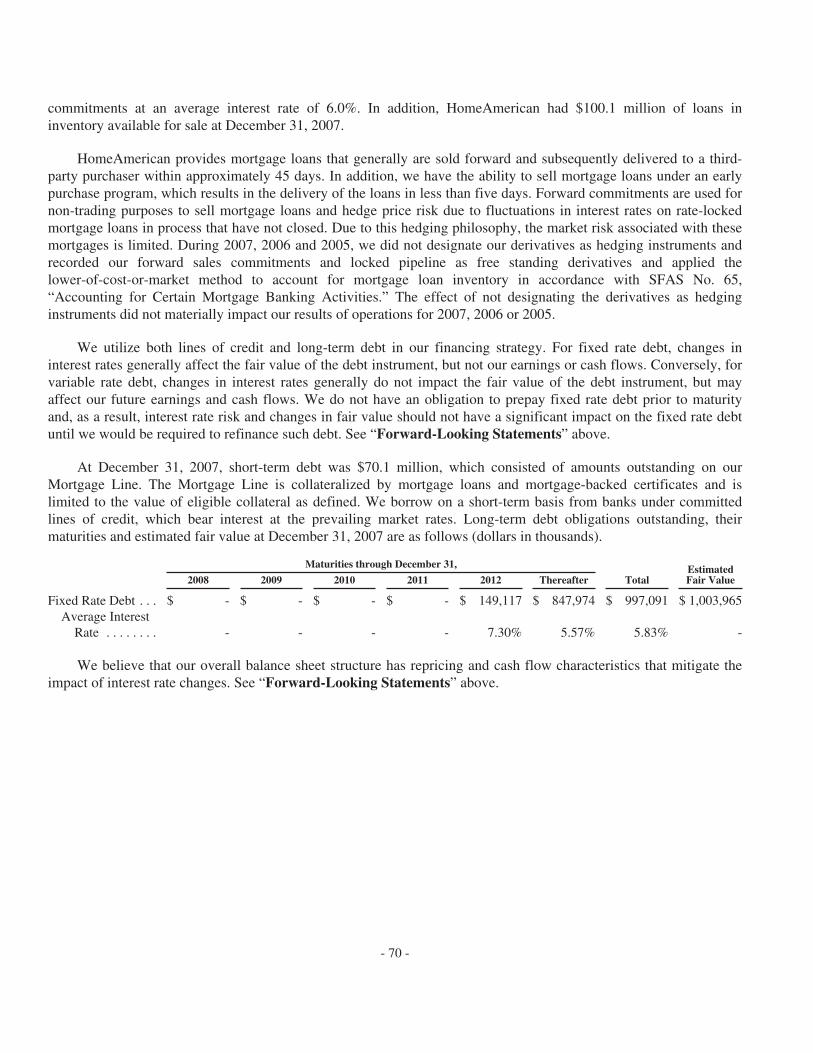
commitments at an average interest rate of 6.0%. In addition, HomeAmerican had $100.1 million of loans ininventory available for sale at December 31, 2007.
HomeAmerican provides mortgage loans that generally are sold forward and subsequently delivered to a third-party purchaser within approximately 45 days. In addition, we have the ability to sell mortgage loans under an earlypurchase program, which results in the delivery of the loans in less than five days. Forward commitments are used fornon-trading purposes to sell mortgage loans and hedge price risk due to fluctuations in interest rates on rate-lockedmortgage loans in process that have not closed. Due to this hedging philosophy, the market risk associated with thesemortgages is limited. During 2007, 2006 and 2005, we did not designate our derivatives as hedging instruments andrecorded our forward sales commitments and locked pipeline as free standing derivatives and applied thelower-of-cost-or-market method to account for mortgage loan inventory in accordance with SFAS No. 65,“Accounting for Certain Mortgage Banking Activities.” The effect of not designating the derivatives as hedginginstruments did not materially impact our results of operations for 2007, 2006 or 2005.
We utilize both lines of credit and long-term debt in our financing strategy. For fixed rate debt, changes ininterest rates generally affect the fair value of the debt instrument, but not our earnings or cash flows. Conversely, forvariable rate debt, changes in interest rates generally do not impact the fair value of the debt instrument, but mayaffect our future earnings and cash flows. We do not have an obligation to prepay fixed rate debt prior to maturityand, as a result, interest rate risk and changes in fair value should not have a significant impact on the fixed rate debtuntil we would be required to refinance such debt. See “Forward-Looking Statements” above.
At December 31, 2007, short-term debt was $70.1 million, which consisted of amounts outstanding on ourMortgage Line. The Mortgage Line is collateralized by mortgage loans and mortgage-backed certificates and islimited to the value of eligible collateral as defined. We borrow on a short-term basis from banks under committedlines of credit, which bear interest at the prevailing market rates. Long-term debt obligations outstanding, theirmaturities and estimated fair value at December 31, 2007 are as follows (dollars in thousands).
Maturities through December 31, EstimatedFair Value2008 2009 2010 2011 2012 Thereafter Total
Fixed Rate Debt . . . $ - $ - $ - $ - $ 149,117 $ 847,974 $ 997,091 $ 1,003,965Average Interest
Rate . . . . . . . . - - - - 7.30% 5.57% 5.83% -
We believe that our overall balance sheet structure has repricing and cash flow characteristics that mitigate theimpact of interest rate changes. See “Forward-Looking Statements” above.
- 70 -

Item 8. Consolidated Financial Statements.
M.D.C. HOLDINGS, INC.INDEX TO CONSOLIDATED FINANCIAL STATEMENTS
Page
Consolidated Financial Statements
Report of Independent Registered Public Accounting Firm . . . . . . . . . . . . . . . . . . . . . . . . . . . . . . . . . . F-2
Consolidated Balance Sheets at December 31, 2007 and December 31, 2006 . . . . . . . . . . . . . . . . . . . . F-3
Consolidated Statements of Operations for each of the Three Years in the Period EndedDecember 31, 2007 . . . . . . . . . . . . . . . . . . . . . . . . . . . . . . . . . . . . . . . . . . . . . . . . . . . . . . . . . . . . . . . F-4
Consolidated Statements of Stockholders’ Equity for each of the Three Years in the Period EndedDecember 31, 2007 . . . . . . . . . . . . . . . . . . . . . . . . . . . . . . . . . . . . . . . . . . . . . . . . . . . . . . . . . . . . . . . F-5
Consolidated Statements of Cash Flows for each of the Three Years in the Period EndedDecember 31, 2007 . . . . . . . . . . . . . . . . . . . . . . . . . . . . . . . . . . . . . . . . . . . . . . . . . . . . . . . . . . . . . . . F-8
Notes to Consolidated Financial Statements . . . . . . . . . . . . . . . . . . . . . . . . . . . . . . . . . . . . . . . . . . . . . . F-9
F-1

Report of Independent Registered Public Accounting Firm
The Board of Directors and Shareholders ofM.D.C Holdings, Inc.
We have audited the accompanying consolidated balance sheets of M.D.C. Holdings, Inc. (the “Company”) as ofDecember 31, 2007 and 2006, and the related consolidated statements of operations, shareholders’ equity, and cashflows for each of the three years in the period ended December 31, 2007. These financial statements are theresponsibility of the Company’s management. Our responsibility is to express an opinion on these financialstatements based on our audits.
We conducted our audits in accordance with the standards of the Public Company Accounting Oversight Board(United States). Those standards require that we plan and perform the audit to obtain reasonable assurance aboutwhether the financial statements are free of material misstatement. An audit includes examining, on a test basis,evidence supporting the amounts and disclosures in the financial statements. An audit also includes assessing theaccounting principles used and significant estimates made by management, as well as evaluating the overall financialstatement presentation. We believe that our audits provide a reasonable basis for our opinion.
In our opinion, the financial statements referred to above present fairly, in all material respects, the consolidatedfinancial position of M.D.C. Holdings, Inc. at December 31, 2007 and 2006, and the consolidated results of itsoperations and its cash flows for each of the three years in the period ended December 31, 2007, in conformity withU.S. generally accepted accounting principles.
As discussed in Note 1 to the financial statements, M.D.C. Holdings, Inc. changed its method of accounting forShare-Based Payments in accordance with Statement of Financial Accounting Standard No. 123 (revised 2004) onJanuary 1, 2006.
We also have audited, in accordance with the standards of the Public Company Accounting Oversight Board(United States), M.D.C. Holdings, Inc.’s internal control over financial reporting as of December 31, 2007, based oncriteria established in Internal Control-Integrated Framework issued by the Committee of Sponsoring Organizationsof the Treadway Commission and our report dated February 5, 2008 expressed an unqualified opinion thereon.
/s/ Ernst & Young LLP
Denver, Colorado
February 5, 2008
F-2

M.D.C. HOLDINGS, INC.Consolidated Balance Sheets
(In thousands, except share and per share amounts)
December 31,
2007 2006
ASSETSCash and cash equivalents . . . . . . . . . . . . . . . . . . . . . . . . . . . . . . . . . . . . . . . . . . . . . . . . $ 1,004,763 $ 507,947Restricted cash . . . . . . . . . . . . . . . . . . . . . . . . . . . . . . . . . . . . . . . . . . . . . . . . . . . . . . . . . 1,898 2,641Receivables
Home sales receivables . . . . . . . . . . . . . . . . . . . . . . . . . . . . . . . . . . . . . . . . . . . . . . . . 33,647 128,614Income taxes receivable, net . . . . . . . . . . . . . . . . . . . . . . . . . . . . . . . . . . . . . . . . . . . . 36,988 -Other receivables . . . . . . . . . . . . . . . . . . . . . . . . . . . . . . . . . . . . . . . . . . . . . . . . . . . . . 16,796 15,322
Mortgage loans held in inventory, net . . . . . . . . . . . . . . . . . . . . . . . . . . . . . . . . . . . . . . . 100,144 212,903Inventories, net
Housing completed or under construction . . . . . . . . . . . . . . . . . . . . . . . . . . . . . . . . . . 902,221 1,178,671Land and land under development . . . . . . . . . . . . . . . . . . . . . . . . . . . . . . . . . . . . . . . 554,336 1,575,158
Property and equipment, net . . . . . . . . . . . . . . . . . . . . . . . . . . . . . . . . . . . . . . . . . . . . . . 44,368 44,606Deferred income taxes, net . . . . . . . . . . . . . . . . . . . . . . . . . . . . . . . . . . . . . . . . . . . . . . . 160,565 124,880Related party assets . . . . . . . . . . . . . . . . . . . . . . . . . . . . . . . . . . . . . . . . . . . . . . . . . . . . . 28,627 -Prepaid expenses and other assets, net . . . . . . . . . . . . . . . . . . . . . . . . . . . . . . . . . . . . . . 71,884 119,133
Total Assets . . . . . . . . . . . . . . . . . . . . . . . . . . . . . . . . . . . . . . . . . . . . . . . . . . . . . . . $ 2,956,237 $ 3,909,875
LIABILITIESAccounts payable . . . . . . . . . . . . . . . . . . . . . . . . . . . . . . . . . . . . . . . . . . . . . . . . . . . . . . $ 71,932 $ 171,005Accrued liabilities . . . . . . . . . . . . . . . . . . . . . . . . . . . . . . . . . . . . . . . . . . . . . . . . . . . . . . 339,353 418,953Income taxes payable . . . . . . . . . . . . . . . . . . . . . . . . . . . . . . . . . . . . . . . . . . . . . . . . . . . - 28,485Related party liabilities . . . . . . . . . . . . . . . . . . . . . . . . . . . . . . . . . . . . . . . . . . . . . . . . . . 1,701 2,401Homebuilding line of credit . . . . . . . . . . . . . . . . . . . . . . . . . . . . . . . . . . . . . . . . . . . . . . . - -Mortgage line of credit . . . . . . . . . . . . . . . . . . . . . . . . . . . . . . . . . . . . . . . . . . . . . . . . . . 70,147 130,467Senior notes, net . . . . . . . . . . . . . . . . . . . . . . . . . . . . . . . . . . . . . . . . . . . . . . . . . . . . . . . 997,091 996,682
Total Liabilities . . . . . . . . . . . . . . . . . . . . . . . . . . . . . . . . . . . . . . . . . . . . . . . . . . . . 1,480,224 1,747,993
COMMITMENTS AND CONTINGENCIES . . . . . . . . . . . . . . . . . . . . . . . . . . . . . . . . - -
STOCKHOLDERS’ EQUITYPreferred stock, $0.01 par value; 25,000,000 shares authorized; none issued or
outstanding . . . . . . . . . . . . . . . . . . . . . . . . . . . . . . . . . . . . . . . . . . . . . . . . . . . . . . . . . - -Common stock, $0.01 par value; 250,000,000 shares authorized; 46,084,000 and
46,053,000 issued and outstanding, respectively, at December 31, 2007 and45,179,000 and 45,165,000 issued and outstanding, respectively, at December 31,2006 . . . . . . . . . . . . . . . . . . . . . . . . . . . . . . . . . . . . . . . . . . . . . . . . . . . . . . . . . . . . . . . 461 452
Additional paid-in-capital . . . . . . . . . . . . . . . . . . . . . . . . . . . . . . . . . . . . . . . . . . . . . . . . 757,039 760,831Retained earnings . . . . . . . . . . . . . . . . . . . . . . . . . . . . . . . . . . . . . . . . . . . . . . . . . . . . . . 719,841 1,402,261Accumulated other comprehensive loss . . . . . . . . . . . . . . . . . . . . . . . . . . . . . . . . . . . . . (669) (1,003)Treasury stock, at cost; 31,000 and 14,000 shares at December 31, 2007 and
December 31, 2006, respectively . . . . . . . . . . . . . . . . . . . . . . . . . . . . . . . . . . . . . . . . (659) (659)
Total Stockholders’ Equity . . . . . . . . . . . . . . . . . . . . . . . . . . . . . . . . . . . . . . . . . . . 1,476,013 2,161,882
Total Liabilities and Stockholders’ Equity . . . . . . . . . . . . . . . . . . . . . . . . . . . . . . . $ 2,956,237 $ 3,909,875
The accompanying Notes are an integral part of the Consolidated Financial Statements.
F-3

M.D.C. HOLDINGS, INC.Consolidated Statements of Operations
(In thousands, except per share amounts)
Year Ended December 31,
2007 2006 2005
REVENUE
Home sales revenue . . . . . . . . . . . . . . . . . . . . . . . . . . . . . . . . . . . . . . . . . $ 2,765,981 $ 4,650,556 $ 4,792,700Land sales revenue . . . . . . . . . . . . . . . . . . . . . . . . . . . . . . . . . . . . . . . . . . 50,130 34,611 2,995Other revenue . . . . . . . . . . . . . . . . . . . . . . . . . . . . . . . . . . . . . . . . . . . . . . 117,138 116,575 96,894
Total Revenue . . . . . . . . . . . . . . . . . . . . . . . . . . . . . . . . . . . . . . . . . 2,933,249 4,801,742 4,892,589
COSTS AND EXPENSES
Home cost of sales . . . . . . . . . . . . . . . . . . . . . . . . . . . . . . . . . . . . . . . . . . 2,380,427 3,619,656 3,436,035Land cost of sales . . . . . . . . . . . . . . . . . . . . . . . . . . . . . . . . . . . . . . . . . . . 59,529 33,491 1,861Asset impairments . . . . . . . . . . . . . . . . . . . . . . . . . . . . . . . . . . . . . . . . . . 726,621 112,027 -Marketing expenses . . . . . . . . . . . . . . . . . . . . . . . . . . . . . . . . . . . . . . . . . 117,088 128,856 106,015Commission expenses . . . . . . . . . . . . . . . . . . . . . . . . . . . . . . . . . . . . . . . 97,951 151,108 130,307General and administrative expenses . . . . . . . . . . . . . . . . . . . . . . . . . . . . 306,715 418,879 401,184Related party expenses . . . . . . . . . . . . . . . . . . . . . . . . . . . . . . . . . . . . . . 1,382 4,588 8,424
Total Costs and Expenses . . . . . . . . . . . . . . . . . . . . . . . . . . . . . . . . 3,689,713 4,468,605 4,083,826
(Loss) income before income taxes . . . . . . . . . . . . . . . . . . . . . . . . . . . . . . . (756,464) 333,137 808,763Benefit from (provision for) income taxes, net . . . . . . . . . . . . . . . . . . . . . . 119,524 (118,884) (303,040)
NET (LOSS) INCOME . . . . . . . . . . . . . . . . . . . . . . . . . . . . . . . . . . . . . . $ (636,940) $ 214,253 $ 505,723
(LOSS) EARNINGS PER SHARE
Basic . . . . . . . . . . . . . . . . . . . . . . . . . . . . . . . . . . . . . . . . . . . . . . . . . . . $ (13.94) $ 4.77 $ 11.48
Diluted . . . . . . . . . . . . . . . . . . . . . . . . . . . . . . . . . . . . . . . . . . . . . . . . . $ (13.94) $ 4.66 $ 10.99
WEIGHTED-AVERAGE SHARES OUTSTANDING
Basic . . . . . . . . . . . . . . . . . . . . . . . . . . . . . . . . . . . . . . . . . . . . . . . . . . . 45,687 44,952 44,046
Diluted . . . . . . . . . . . . . . . . . . . . . . . . . . . . . . . . . . . . . . . . . . . . . . . . . 45,687 45,971 46,036
DIVIDENDS DECLARED PER SHARE . . . . . . . . . . . . . . . . . . . . . . . . $ 1.00 $ 1.00 $ 0.76
The accompanying Notes are an integral part of the Consolidated Financial Statements.
F-4

M.D.C. HOLDINGS, INC.Consolidated Statements of Stockholders’ Equity
(In thousands, except share amounts)
Common Stock AdditionalPaid-in-Capital
RetainedEarnings
AccumulatedOther
ComprehensiveLoss
Treasury Stock
Shares Amount Shares Amount Total
BALANCES AT DECEMBER 31, 2004 . . . . . . . 43,286,000 $ 433 $659,281 $ 760,780 $ (290) (31,000) $(1,383) $1,418,821Comprehensive income
Net income . . . . . . . . . . . . . . . . . . . . . . . . - - - 505,723 - - - 505,723Minimum pension liability adjustment,
net of income taxes of $(202) . . . . . . . . - - - - (328) - - (328)Change in unrealized gains on securities
available for sale, net of income taxesof $4 . . . . . . . . . . . . . . . . . . . . . . . . . . . - - - - (4) - - (4)
Total comprehensive income . . . . . . . . . . 505,391
Shares issued . . . . . . . . . . . . . . . . . . . . . . . . . . 1,346,000 14 30,400 - - 9,000 312 30,726Tax benefit of non-qualified stock options
exercised . . . . . . . . . . . . . . . . . . . . . . . . . . . . - - 30,002 - - - - 30,002Cash dividends paid . . . . . . . . . . . . . . . . . . . . . - - - (33,532) - - - (33,532)Issuance of restricted stock . . . . . . . . . . . . . . . 10,000 - (742) - - 20,000 742 -Forfeitures of restricted stock . . . . . . . . . . . . . . - - 171 - - (10,000) (171) -Restricted stock vesting . . . . . . . . . . . . . . . . . . - - 701 - - - - 701
BALANCES AT DECEMBER 31, 2005 . . . . . . . 44,642,000 447 719,813 1,232,971 (622) (12,000) (500) 1,952,109
The accompanying Notes are an integral part of the Consolidated Financial Statements.
F-5

M.D.C. HOLDINGS, INC.Consolidated Statements of Stockholders’ Equity
(In thousands, except share amounts)
Common Stock AdditionalPaid-in-Capital
RetainedEarnings
AccumulatedOther
ComprehensiveLoss
Treasury Stock
Shares Amount Shares Amount Total
BALANCES AT DECEMBER 31, 2005 . . . . . . . . . . . 44,642,000 447 719,813 1,232,971 (622) (12,000) (500) 1,952,109Comprehensive income
Net income . . . . . . . . . . . . . . . . . . . . . . . . . . . . - - - 214,253 - - - 214,253Minimum pension liability adjustment, net of
income taxes of $(432) . . . . . . . . . . . . . . . . . - - - - (381) - - (381)
Total comprehensive income . . . . . . . . . . . . . . 213,872
Shares issued . . . . . . . . . . . . . . . . . . . . . . . . . . . . . . 526,000 5 19,863 - - - - 19,868Tax benefit of non-qualified stock options
exercised . . . . . . . . . . . . . . . . . . . . . . . . . . . . . . . . - - 4,391 - - - - 4,391Cash dividends paid . . . . . . . . . . . . . . . . . . . . . . . . . - - - (44,963) - - - (44,963)Unrestricted stock issuance and stock-based
compensation expense . . . . . . . . . . . . . . . . . . . . . 11,000 - 16,605 - - - - 16,605Forfeitures of restricted stock . . . . . . . . . . . . . . . . . . - - 159 - - (2,000) (159) -
BALANCES AT DECEMBER 31, 2006 . . . . . . . . . . . 45,179,000 452 760,831 1,402,261 (1,003) (14,000) (659) 2,161,882
The accompanying Notes are an integral part of the Consolidated Financial Statements.
F-6

M.D.C. HOLDINGS, INC.Consolidated Statements of Stockholders’ Equity
(In thousands, except share amounts)
Common Stock AdditionalPaid-in-Capital
RetainedEarnings
AccumulatedOther
ComprehensiveLoss
Treasury Stock
TotalShares Amount Shares Amount
BALANCES AT DECEMBER 31, 2006 . . . . . . . . 45,179,000 452 760,831 1,402,261 (1,003) (14,000) (659) 2,161,882Comprehensive loss
Net loss . . . . . . . . . . . . . . . . . . . . . . . . . . . . - - - (636,940) - - - (636,940)Minimum pension liability adjustment, net
of income taxes of $(413) . . . . . . . . . . . . - - - - 334 - - 334
Total comprehensive loss . . . . . . . . . . . . . . (636,606)
Adoption of FIN 48 . . . . . . . . . . . . . . . . . . . . . . - - - 293 - - - 293Shares issued . . . . . . . . . . . . . . . . . . . . . . . . . . . 905,000 9 16,308 - - - - 16,317Tax benefit of non-qualified stock options
exercised . . . . . . . . . . . . . . . . . . . . . . . . . . . . . - - 567 - - - - 567Cash dividends paid . . . . . . . . . . . . . . . . . . . . . . - - - (45,773) - - - (45,773)Stock-based compensation expense . . . . . . . . . . - - 12,466 - - - - 12,466Forfeitures of restricted stock . . . . . . . . . . . . . . . - - - - - (17,000) - -Reversal of tax benefits on non-qualified stock
options exercised in previous years . . . . . . . . - - (33,133) - - - - (33,133)
BALANCES AT DECEMBER 31, 2007 . . . . . . . . 46,084,000 $ 461 $757,039 $ 719,841 $ (669) (31,000) $ (659) $1,476,013
The accompanying Notes are an integral part of the Consolidated Financial Statements.
F-7

M.D.C. HOLDINGS, INC.Consolidated Statements of Cash Flows
(In thousands)
Year Ended December 31,
2007 2006 2005
OPERATING ACTIVITIESNet (loss) income . . . . . . . . . . . . . . . . . . . . . . . . . . . . . . . . . . . . . . . . . . . . . . . . $ (636,940) $ 214,253 $ 505,723Adjustments to reconcile net (loss) income to net cash provided by (used in)
operating activitiesAsset impairments . . . . . . . . . . . . . . . . . . . . . . . . . . . . . . . . . . . . . . . . . . . . . 726,621 112,027 -Deferred tax asset valuation expense . . . . . . . . . . . . . . . . . . . . . . . . . . . . . . 160,000 - -Deferred income taxes . . . . . . . . . . . . . . . . . . . . . . . . . . . . . . . . . . . . . . . . . . (195,685) (70,561) (13,356)Amortization of deferred marketing costs . . . . . . . . . . . . . . . . . . . . . . . . . . . 33,075 40,130 39,111Write-offs of land option deposits and pre-acquisition costs . . . . . . . . . . . . 22,872 29,708 10,439Depreciation and amortization of long-lived assets . . . . . . . . . . . . . . . . . . . 14,267 18,900 15,314Stock-based compensation expense . . . . . . . . . . . . . . . . . . . . . . . . . . . . . . . 12,466 16,605 1,239Excess tax benefits from stock-based compensation . . . . . . . . . . . . . . . . . . . (567) (4,311) -Non-cash related party expenses . . . . . . . . . . . . . . . . . . . . . . . . . . . . . . . . . . 1,000 4,001 8,100Gain on sale of assets, net . . . . . . . . . . . . . . . . . . . . . . . . . . . . . . . . . . . . . . . (869) - -Other non-cash expenses . . . . . . . . . . . . . . . . . . . . . . . . . . . . . . . . . . . . . . . . 2,406 385 4,661Net changes in assets and liabilities
Restricted cash . . . . . . . . . . . . . . . . . . . . . . . . . . . . . . . . . . . . . . . . . . . . . . 743 4,101 449Home sales and other receivables . . . . . . . . . . . . . . . . . . . . . . . . . . . . . . . 93,492 14,872 (119,096)Income taxes receivable/payable . . . . . . . . . . . . . . . . . . . . . . . . . . . . . . . . (97,747) (69,780) 81,679Mortgage loans held in inventory, net . . . . . . . . . . . . . . . . . . . . . . . . . . . . 112,759 24,473 (58,451)Housing completed or under construction . . . . . . . . . . . . . . . . . . . . . . . . . 106,558 116,396 (433,104)Land and land under development . . . . . . . . . . . . . . . . . . . . . . . . . . . . . . 426,535 18,415 (548,682)Prepaid expenses and other assets, net . . . . . . . . . . . . . . . . . . . . . . . . . . . (13,142) (55,230) (69,599)Accounts payable . . . . . . . . . . . . . . . . . . . . . . . . . . . . . . . . . . . . . . . . . . . . (99,073) (30,742) 44,464Accrued liabilities . . . . . . . . . . . . . . . . . . . . . . . . . . . . . . . . . . . . . . . . . . . (76,188) (20,594) 106,180
Net cash provided by (used in) operating activities . . . . . . . . . . . . . . . . . . . . . 592,583 363,048 (424,929)
INVESTING ACTIVITIESSale of property and equipment . . . . . . . . . . . . . . . . . . . . . . . . . . . . . . . . . . . . . 25,577 - -Purchase of property and equipment . . . . . . . . . . . . . . . . . . . . . . . . . . . . . . . . . (27,024) (10,221) (22,889)
Net cash used in investing activities . . . . . . . . . . . . . . . . . . . . . . . . . . . . . . . . . (1,447) (10,221) (22,889)
FINANCING ACTIVITIESLines of credit
Advances . . . . . . . . . . . . . . . . . . . . . . . . . . . . . . . . . . . . . . . . . . . . . . . . . . 698,174 450,900 1,462,154Principal payments . . . . . . . . . . . . . . . . . . . . . . . . . . . . . . . . . . . . . . . . . . (758,494) (476,965) (1,441,100)
Senior notesProceeds from issuance, net . . . . . . . . . . . . . . . . . . . . . . . . . . . . . . . . . . . - - 247,605
Dividend payments . . . . . . . . . . . . . . . . . . . . . . . . . . . . . . . . . . . . . . . . . . . . . . (45,773) (44,963) (33,532)Proceeds from exercise of stock options . . . . . . . . . . . . . . . . . . . . . . . . . . . . . . 11,206 7,306 26,263Excess tax benefits from stock-based compensation . . . . . . . . . . . . . . . . . . . . . 567 4,311 -
Net cash (used in) provided by financing activities . . . . . . . . . . . . . . . . . . . . . (94,320) (59,411) 261,390
Net increase (decrease) in cash and cash equivalents . . . . . . . . . . . . . . . . . . . . 496,816 293,416 (186,428)Cash and cash equivalents
Beginning of year . . . . . . . . . . . . . . . . . . . . . . . . . . . . . . . . . . . . . . . . . . . 507,947 214,531 400,959
End of year . . . . . . . . . . . . . . . . . . . . . . . . . . . . . . . . . . . . . . . . . . . . . . . . $ 1,004,763 $ 507,947 $ 214,531
The accompanying Notes are an integral part of the Consolidated Financial Statements.
F-8

M.D.C. HOLDINGS, INC.Notes to Consolidated Financial Statements
1. Summary of Significant Accounting Policies
Principles of Consolidation. The Consolidated Financial Statements of M.D.C. Holdings, Inc. (“MDC” or the“Company”, which, unless otherwise indicated, refers to M.D.C. Holdings, Inc. and its subsidiaries) include theaccounts of MDC and its wholly owned subsidiaries. All intercompany balances and transactions have beeneliminated in consolidation.
Description of Business. The Company’s homebuilding segments, through separate subsidiaries, have operationsin Arizona, California, Colorado, Delaware Valley (which includes Pennsylvania, Delaware and New Jersey), Florida,Illinois, Maryland, Nevada, Utah and Virginia (which includes Virginia and West Virginia). The primary functions ofthe Company’s homebuilding segments include land acquisition and development, home construction, purchasing,marketing, merchandising, sales and customer service. The Company builds and sells primarily single-familydetached homes which are designed and built to meet local customer preferences. The Company is the generalcontractor for all of its projects and retains subcontractors for site development and home construction.
The Company’s Financial Services and Other segment consists of HomeAmerican Mortgage Corporation(“HomeAmerican”), which originates mortgage loans primarily for the Company’s homebuyers, American HomeInsurance Agency, Inc. (“American Home Insurance”), which offers third-party insurance products to the Company’shomebuyers, and American Home Title and Escrow Company (“American Home Title”), which provides title agencyservices to the Company’s homebuyers in Colorado, Delaware, Florida, Illinois, Nevada, Maryland, Virginia andWest Virginia. This segment also includes Allegiant Insurance Company, Inc., A Risk Retention Group (“Allegiant”),which provides general liability coverage for products and completed operations to the Company and, in most of theCompany’s markets, to subcontractors of MDC’s homebuilding subsidiaries, and StarAmerican Insurance Ltd.(“StarAmerican”), a Hawaii corporation. StarAmerican, a wholly owned subsidiary of MDC formed in 2003, hasagreed to re-insure all claims pursuant to two policies issued to the Company by a third-party. Pursuant to agreementsbeginning in June 2004, StarAmerican has agreed to re-insure all Allegiant claims in excess of $50,000 peroccurrence, up to $3.0 million per occurrence, subject to various aggregate limits, not to exceed $18.0 million peryear.
Presentation. The Company’s balance sheet presentation is unclassified due to the fact that certain assets andliabilities have both short and long-term characteristics. Certain prior year balances have been reclassified to conformto the current year’s presentation.
Use of Accounting Estimates. The preparation of financial statements in conformity with accounting principlesgenerally accepted in the United States requires management to make estimates and assumptions that affect thereported amounts of assets and liabilities and disclosure of contingent assets and liabilities at the date of the financialstatements and the reported amounts of revenues and expenses during the reporting period. Actual results could differfrom those estimates.
Concentration of Credit Risk. To date, the Company’s home sales revenue has been generated largely from homeclosings in its Arizona, California, Colorado, Nevada and Virginia markets. The Company conducts a significant portion ofits business in these markets and generates a disproportionate amount of home sales revenue in these markets. New homesales and home price appreciation has significantly declined during 2007 and 2006 in each of these markets. Continuedslowdown within these markets could have a material adverse impact on the Company’s financial position and results ofoperations.
F-9

M.D.C. HOLDINGS, INC.Notes to Consolidated Financial Statements (Continued)
The following table discloses the percent of home sales revenue generated by each of these markets during theyears ended December 31, 2007, 2006 and 2005.
Year Ended December 31,
2007 2006 2005
Arizona . . . . . . . . . . . . . . . . . . . . . . . . . . . . . . . . . . . 26% 21% 17%California . . . . . . . . . . . . . . . . . . . . . . . . . . . . . . . . . . 21% 21% 23%Nevada . . . . . . . . . . . . . . . . . . . . . . . . . . . . . . . . . . . . 14% 19% 19%Colorado . . . . . . . . . . . . . . . . . . . . . . . . . . . . . . . . . . 10% 10% 13%Virginia . . . . . . . . . . . . . . . . . . . . . . . . . . . . . . . . . . . 6% 8% 11%
Total . . . . . . . . . . . . . . . . . . . . . . . . . . . . . . . . . 77% 79% 83%
Historically, a substantial portion of mortgage loans originated by the Company have been sold to one third-partypurchaser. During the years ended December 31, 2007, 2006 and 2005, the Company sold approximately 51%, 54%and 68%, respectively, of the mortgage loans it originated to this third-party purchaser. Additionally, during 2007, theCompany increased the volume of loans sold to a second third-party purchaser to approximately 23% of mortgageloans sold during 2007.
Cash and Cash Equivalents. The Company periodically invests funds in highly liquid, short-term investmentswith an original maturity of three months or less, such as commercial paper, money market funds and time deposits,which are included in cash and cash equivalents in the Consolidated Balance Sheets and Consolidated Statements ofCash Flows. At December 31, 2007 and 2006, the Company had $456.4 million and $50.0 million, respectively, oftime deposits included in cash and cash equivalents.
Restricted Cash. The Company receives cash earnest money deposits (“Deposits”) from customers for the saleof a home. In certain states, unless the Company takes measures to release any state regulatory imposed restrictionson Deposits received from a homebuyer in conjunction with a home sale, which may include posting blanket securitybonds, the Company is restricted from using these Deposits for general purposes. Accordingly, at December 31, 2007and 2006, the Company had $8.5 million and $10.5 million, respectively, in blanket security bonds issued in twomarkets to release restrictions on certain Deposits.
Restricted cash consists primarily of Deposits that are restricted from being used by the Company for generalpurposes due to regulatory requirements in one of the markets the Company operates in. The Company had $1.9million and $2.6 million in restricted cash related to Deposits at December 31, 2007 and 2006, respectively.
Home Sales Receivables. Home sales receivables primarily consist of cash to be received from title companiesor outside brokers associated with closed homes. Generally, the Company will receive cash from title companies andoutside brokers within a few days of the home being closed.
Mortgage Loans Held in Inventory, Net. Mortgage loans held in inventory are stated at the lower of cost, asadjusted for fair value changes in exercised interest rate locks and deferred fees and costs, or market value on anaggregate basis. Gains or losses on mortgage loans held in inventory are realized when the loans are sold. Gains onsales of mortgage loans, net were $30.7 million, $58.3 million and $42.9 million for the years ended December 31,2007, 2006 and 2005, respectively.
F-10

M.D.C. HOLDINGS, INC.Notes to Consolidated Financial Statements (Continued)
Held-for-Development Inventories. The Company’s held-for-development inventories are included as acomponent of housing completed or under construction and land and land under development in the ConsolidatedBalance Sheets. The Company’s inventories accounted for on a held-for-development basis include inventoryassociated with subdivisions in which the Company intends to construct and sell homes on the land. Each suchsubdivision represents the lowest level of identifiable cash flows. The Company’s held-for-development subdivisionsalso include inventories associated with model and speculative homes. The Company capitalizes certain costs ofinventory in accordance with the provisions of the Financial Accounting Standards Board (“FASB”) Statement ofFinancial Standards (“SFAS”) No. 67, “Accounting for Costs and Initial Rental Operation of Real Estate Projects”(“SFAS 67”). Accordingly, components of housing completed or under construction primarily include (1) land coststransferred from land and land under development; (2) hard costs associated with the construction of a house;(3) overhead costs, which include real property taxes, engineering fees and permits and fees; (4) capitalized interest;and (5) indirect fees as permitted by SFAS 67. Land costs are transferred from land and land under development tohousing completed or under construction at the point in time that the Company begins construction of a home on anowned lot. Costs capitalized to land and land under development primarily include: (1) land costs; (2) developmentcosts for the land (3) entitlement costs; and (4) title insurance, taxes and closing costs directly related to the purchaseof the land parcel.
Homebuilding inventories that are accounted for as held-for-development are carried at cost unless events andcircumstances indicate that the carrying value of the underlying subdivision may not be recoverable. In making thisdetermination, the Company reviews, among other things, the following for each subdivision:
• actual and trending “Operating Profit” (defined as home sales revenue less home cost of sales and all directincremental costs associated with the home closing) for homes closed in the (1) prior two completed fiscalquarters on an individual basis; (2) current fiscal quarter; (3) last six months; and (4) last twelve months;
• estimated future undiscounted cash flows and Operating Profit;
• forecasted Operating Profit for homes in “Backlog” (defined as homes under contract but not yet delivered);
• actual and trending net and gross home orders;
• base sales price and home sales incentive information for homes that (1) closed in the prior two completedfiscal quarters; (2) closed in the current fiscal quarter; (3) are in Backlog as of the end of the current fiscalquarter; and (4) are forecasted to close over the remaining life of the subdivision;
• market information for each sub-market, including competition levels and the size and style of homescurrently being offered for sale; and
• known or probable events indicating that the carrying value may not be recoverable.
If events or circumstances indicate that the carrying value of the Company’s held-for-development inventory maynot be recoverable, assets are reviewed for impairment by comparing the undiscounted estimated future cash flows froman individual subdivision to its carrying value in accordance with SFAS No. 144, “Accounting for the Impairment orDisposal of Long-Lived Assets” (“SFAS 144”). If the undiscounted future cash flows are less than the subdivision’scarrying value, the carrying value of the subdivision is written down to its then estimated fair value. For subdivisionsthat continue to be held-for-development, the carrying value is not written up for increases in the estimated fair value ofsuch subdivision in subsequent reporting periods. The Company determines the estimated fair value of eachheld-for-development subdivision by determining the present value of the estimated future cash flows at discount rates
F-11

M.D.C. HOLDINGS, INC.Notes to Consolidated Financial Statements (Continued)
that are commensurate with the risk of the subdivision under evaluation. For the years ended December 31, 2007 and2006, discount rates used in the Company’s estimated discounted cash flow assessments ranged from 10% to 18%.Impairments on held-for-development inventory, together with impairments of the Company’s held-for-sale inventoryand intangible assets, are presented as a separate line in the Consolidated Statements of Operations.
Held-for-Sale Inventories. The Company’s held-for-sale inventories are included as a component of land andland under development in the Consolidated Balance Sheets, and include inventory associated with subdivisions forwhich the Company intends to sell the land in its current condition. In accordance with SFAS 144, the classificationof land as held-for-sale is based on the following criteria: (1) management, having the authority to approve the action,commits to a plan to sell the asset; (2) the asset is available for immediate sale in its present condition, subject only toterms that are usual and customary for sales of such assets; (3) an active program to locate a buyer and other actionsrequired to complete the plan to sell the asset have been initiated; (4) the sale of the asset is probable, and transfer ofthe asset is expected to qualify for recognition as a completed sale, within one year; (5) the asset is being activelymarketed for sale at a price that is reasonable in relation to its current fair value; and (6) actions required to completethe plan indicate that it is unlikely that significant changes to the plan will be made or that the plan will be withdrawn.
In certain circumstances, the Company will re-evaluate the best use of an asset that is currently being accountedfor as held-for-development. In such situations, the Company will review, among other things: (1) average salesprices for homes that have closed, are in Backlog and forecasted for future sales; (2) current competition levels andestimated levels of competition in future reporting periods; (3) estimated development costs that have yet to beincurred; and (4) the total number of lots owned in each subdivision and surrounding areas. If, based upon thisevaluation, the Company believes that the best use of the asset is the sale of the inventory in its current condition, allor portions of the subdivision will be accounted for as held-for-sale, assuming all of the foregoing held-for-salecriteria have been met at the end of the applicable reporting period.
The Company records land held-for-sale at the lower of its carrying value or fair value less costs to sell. Inperforming the impairment evaluation for land accounted for on a held-for-sale basis, the Company considers, amongother things, prices for land in recent comparable sale transactions, market analysis studies, which include theestimated price a willing buyer would pay for the land (other than in a forced liquidation) and recent bona fide offersreceived from outside third-parties. If the estimated fair value less cost to sell held-for-sale inventory is less than thecurrent carrying value, the inventory is written down to its estimated fair value less cost to sell. The Companymonitors the fair value of held-for-sale inventories on a periodic basis through the disposition date. A subsequentincrease in the fair value less cost to sell of held-for-sale inventories, if any, is recognized as a decrease toimpairments in the Consolidated Statements of Operations during such subsequent period, but not in excess of thecumulative impairment that was previously recorded while it was inventory accounted for on a held-for-sale basis.During the years ended December 31, 2007 and 2006, the Company recorded impairments on its held-for-saleinventories of $40.7 million and $2.5 million, respectively. Additionally, the Company had held-for-sale inventory of$31.1 million at December 31, 2007.
F-12

M.D.C. HOLDINGS, INC.Notes to Consolidated Financial Statements (Continued)
Asset Impairments. The following tables set forth, by reportable segment, the asset impairments recorded duringthe twelve months ended December 31, 2007 and 2006 (in thousands). The Company did not record any assetimpairments during the year ended December 31, 2005.
Year Ended December 31,
2007 2006
Land and Land Under Development (Held-for-Development)West . . . . . . . . . . . . . . . . . . . . . . . . . . . . . . . . . . . . . . . . . . . . . . . . $ 419,471 $ 69,231Mountain . . . . . . . . . . . . . . . . . . . . . . . . . . . . . . . . . . . . . . . . . . . . . 24,194 1,010East . . . . . . . . . . . . . . . . . . . . . . . . . . . . . . . . . . . . . . . . . . . . . . . . . 29,057 6,331Other Homebuilding . . . . . . . . . . . . . . . . . . . . . . . . . . . . . . . . . . . . 42,832 5,265
Subtotal . . . . . . . . . . . . . . . . . . . . . . . . . . . . . . . . . . . . . . . . . . . . 515,554 81,837
Land and Land Under Development (Held-for-Sale)West . . . . . . . . . . . . . . . . . . . . . . . . . . . . . . . . . . . . . . . . . . . . . . . . 26,942 937Mountain . . . . . . . . . . . . . . . . . . . . . . . . . . . . . . . . . . . . . . . . . . . . . - -East . . . . . . . . . . . . . . . . . . . . . . . . . . . . . . . . . . . . . . . . . . . . . . . . . - -Other Homebuilding . . . . . . . . . . . . . . . . . . . . . . . . . . . . . . . . . . . . 13,765 1,600
Subtotal . . . . . . . . . . . . . . . . . . . . . . . . . . . . . . . . . . . . . . . . . . . . 40,707 2,537
Housing Completed or Under Construction (Held-for-Development)West . . . . . . . . . . . . . . . . . . . . . . . . . . . . . . . . . . . . . . . . . . . . . . . . 135,081 20,636Mountain . . . . . . . . . . . . . . . . . . . . . . . . . . . . . . . . . . . . . . . . . . . . . 5,912 882East . . . . . . . . . . . . . . . . . . . . . . . . . . . . . . . . . . . . . . . . . . . . . . . . . 12,998 1,905Other Homebuilding . . . . . . . . . . . . . . . . . . . . . . . . . . . . . . . . . . . . 15,901 1,618
Subtotal . . . . . . . . . . . . . . . . . . . . . . . . . . . . . . . . . . . . . . . . . . . . 169,892 25,041
Intangible Assets . . . . . . . . . . . . . . . . . . . . . . . . . . . . . . . . . . . . . . . . . 468 2,612
Consolidated Asset Impairments . . . . . . . . . . . . . . . . . . . . . . . . $ 726,621 $ 112,027
The impairments recorded during 2007 increased significantly for each of the Company’s reportable segments,and most notably in the West segment. For each reportable segment, the impairments of held-for-developmentinventory primarily resulted from decreases in home sales prices and/or increases in home sales incentives offered inan effort to: (1) remain competitive with home sales prices currently being offered by the Company’s competitors;(2) stimulate new home orders; (3) maintain homes in Backlog until they close; and (4) address affordability issues fornew homes as homebuyers have been experiencing difficulty in qualifying for mortgage loans. The impairment ofheld-for-development inventories in the West segment were significantly higher than impairments recorded in otherhomebuilding segments. This primarily resulted from the following: (1) the fact that the Company’s owned lots andactive subdivisions in the West segment comprised nearly 53% of the consolidated owned lots and active subdivisionsat December 31, 2007, and 61% and 50%, respectively, at December 31, 2006, resulting in approximately 48% and62% of the Company’s total inventory being concentrated in the West segment at December 31, 2007 and 2006,respectively; (2) competition within the sub-markets of the West segment appeared to be more pronounced than in theother homebuilding segments and, as a result, the Company saw significant home price reductions offered by itscompetitors; (3) the homebuyers in the West segment are comprised largely of entry level homebuyers, comparedwith a wider range of homebuyers in the other homebuilding segments, and their ability to obtain suitable mortgageloan financing has been impacted more adversely from the decreased availability of mortgage loan products; and
F-13

M.D.C. HOLDINGS, INC.Notes to Consolidated Financial Statements (Continued)
(4) the market value of homes in Arizona, California and Nevada, were impacted positively more significantly than inother segments during 2004 and 2005, from a larger number of investors purchasing homes on a speculative basis,resulting in values of homes in these markets being susceptible to greater declines, due in part from the exit ofinvestors. Consequently, a majority of the active subdivisions within each market of our West segment were impairedduring 2007. Additionally, the inventory impairments that we recorded during 2007 and 2006 related to assets whichwere contracted for mainly in 2004 and 2005.
During 2007, the Company recorded impairments of $40.7 million on our held-for-sale inventory. Theseimpairments primarily relate to assets in the California market of the West segment, and the Florida market of theOther Homebuilding segment. The impairments in the West segment relate to approximately 400 lots in 6subdivisions and primarily resulted from deterioration in market conditions such that the Company believes the bestuse of these assets is to sell them in their current condition. The impairments recorded in our Other Homebuildingsegment primarily relate to inventory in the Tampa sub-market as the Company initiated the exit of this sub-market.
The following table sets forth the current carrying value of the Company’s inventory that was impaired duringthe three months ended December 31, 2007. Accordingly, these carrying values represent the fair value of suchinventory at December 31, 2007.
Land and LandUnder
Development(Held-for-
Development)
HousingCompleted or
UnderConstruction
(Held- for-Development)
Land and LandUnder
Development(Held-for-Sale)
Total Fair Valueof ImpairedInventory
West . . . . . . . . . . . . . . . . . . . . . . . . . . . . . . . . . . . . . . . $ 74,049 $ 198,399 $ 22,179 $ 294,627Mountain . . . . . . . . . . . . . . . . . . . . . . . . . . . . . . . . . . . . 9,504 15,880 - 25,384East . . . . . . . . . . . . . . . . . . . . . . . . . . . . . . . . . . . . . . . . 16,683 36,315 - 52,998Other Homebuilding . . . . . . . . . . . . . . . . . . . . . . . . . . . 121 19,938 3,977 24,036
Consolidated . . . . . . . . . . . . . . . . . . . . . . . . . . . . . $ 100,357 $ 270,532 $ 26,156 $ 397,045
Property and Equipment, Net. Property and equipment is carried at cost less accumulated depreciation andamortization. Depreciation and amortization are computed using the straight-line method over the estimated usefullives of the related assets, which range from two to 20 years. Depreciation and amortization expense for property andequipment was $12.5 million, $14.7 million and $11.6 million for the years ended December 31, 2007, 2006 and2005, respectively. Accumulated depreciation and amortization at December 31, 2007 and 2006 was $28.5 millionand $34.9 million, respectively. Additionally, during 2007, the Company sold two aircraft, which resulted in gains of$10.3 million. These gains are presented as a component of other revenue in the Consolidated Statements ofOperations.
Deferred Income Taxes, net. Deferred tax assets and liabilities are calculated in accordance with SFAS No. 109,“Accounting for Income Taxes” (“SFAS 109”), and are recognized based on the difference between the carryingamounts of assets and liabilities in the financial statements and their respective tax bases. Deferred tax assets andliabilities are measured using current enacted tax rates in effect in the years in which those temporary differences areexpected to reverse. In accordance with SFAS 109, deferred tax assets should be reduced by a valuation allowance if,based on the weight of available evidence, it is more likely than not that some portion or all of the deferred tax assetswill not be realized. At December 31, 2007, based upon current facts and circumstances, the Company recorded avaluation allowance against its deferred tax assets of $160.0 million.
F-14
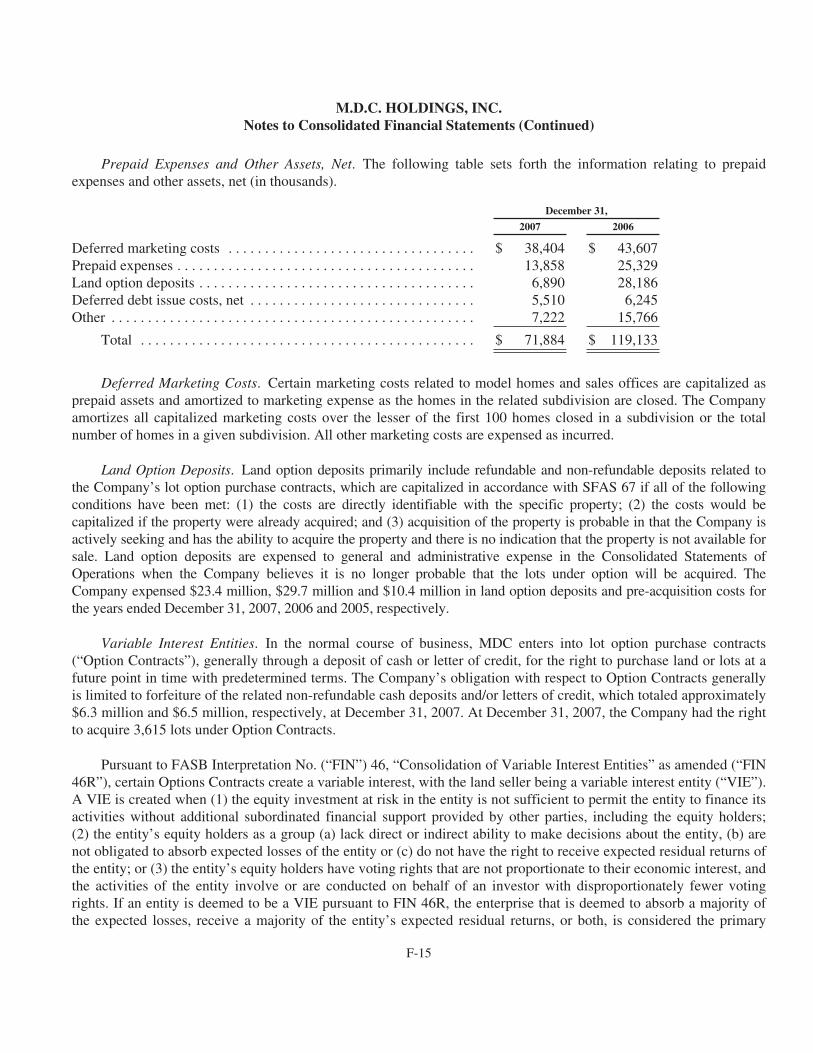
M.D.C. HOLDINGS, INC.Notes to Consolidated Financial Statements (Continued)
Prepaid Expenses and Other Assets, Net. The following table sets forth the information relating to prepaidexpenses and other assets, net (in thousands).
December 31,
2007 2006
Deferred marketing costs . . . . . . . . . . . . . . . . . . . . . . . . . . . . . . . . . . $ 38,404 $ 43,607Prepaid expenses . . . . . . . . . . . . . . . . . . . . . . . . . . . . . . . . . . . . . . . . . 13,858 25,329Land option deposits . . . . . . . . . . . . . . . . . . . . . . . . . . . . . . . . . . . . . . 6,890 28,186Deferred debt issue costs, net . . . . . . . . . . . . . . . . . . . . . . . . . . . . . . . 5,510 6,245Other . . . . . . . . . . . . . . . . . . . . . . . . . . . . . . . . . . . . . . . . . . . . . . . . . . 7,222 15,766
Total . . . . . . . . . . . . . . . . . . . . . . . . . . . . . . . . . . . . . . . . . . . . . . $ 71,884 $ 119,133
Deferred Marketing Costs. Certain marketing costs related to model homes and sales offices are capitalized asprepaid assets and amortized to marketing expense as the homes in the related subdivision are closed. The Companyamortizes all capitalized marketing costs over the lesser of the first 100 homes closed in a subdivision or the totalnumber of homes in a given subdivision. All other marketing costs are expensed as incurred.
Land Option Deposits. Land option deposits primarily include refundable and non-refundable deposits related tothe Company’s lot option purchase contracts, which are capitalized in accordance with SFAS 67 if all of the followingconditions have been met: (1) the costs are directly identifiable with the specific property; (2) the costs would becapitalized if the property were already acquired; and (3) acquisition of the property is probable in that the Company isactively seeking and has the ability to acquire the property and there is no indication that the property is not available forsale. Land option deposits are expensed to general and administrative expense in the Consolidated Statements ofOperations when the Company believes it is no longer probable that the lots under option will be acquired. TheCompany expensed $23.4 million, $29.7 million and $10.4 million in land option deposits and pre-acquisition costs forthe years ended December 31, 2007, 2006 and 2005, respectively.
Variable Interest Entities. In the normal course of business, MDC enters into lot option purchase contracts(“Option Contracts”), generally through a deposit of cash or letter of credit, for the right to purchase land or lots at afuture point in time with predetermined terms. The Company’s obligation with respect to Option Contracts generallyis limited to forfeiture of the related non-refundable cash deposits and/or letters of credit, which totaled approximately$6.3 million and $6.5 million, respectively, at December 31, 2007. At December 31, 2007, the Company had the rightto acquire 3,615 lots under Option Contracts.
Pursuant to FASB Interpretation No. (“FIN”) 46, “Consolidation of Variable Interest Entities” as amended (“FIN46R”), certain Options Contracts create a variable interest, with the land seller being a variable interest entity (“VIE”).A VIE is created when (1) the equity investment at risk in the entity is not sufficient to permit the entity to finance itsactivities without additional subordinated financial support provided by other parties, including the equity holders;(2) the entity’s equity holders as a group (a) lack direct or indirect ability to make decisions about the entity, (b) arenot obligated to absorb expected losses of the entity or (c) do not have the right to receive expected residual returns ofthe entity; or (3) the entity’s equity holders have voting rights that are not proportionate to their economic interest, andthe activities of the entity involve or are conducted on behalf of an investor with disproportionately fewer votingrights. If an entity is deemed to be a VIE pursuant to FIN 46R, the enterprise that is deemed to absorb a majority ofthe expected losses, receive a majority of the entity’s expected residual returns, or both, is considered the primary
F-15

M.D.C. HOLDINGS, INC.Notes to Consolidated Financial Statements (Continued)
beneficiary and must consolidate the VIE. Expected losses and residual returns for VIEs are calculated based on theprobability of estimated future cash flow, as defined in FIN 46R.
The Company has evaluated, based on the provisions of FIN 46R, all Option Contracts that were executed or hadsignificant modifications during 2007. Based on these evaluations, the Company’s interests in these VIEs did notresult in significant variable interests or require MDC to consolidate the VIEs as MDC’s interests did not qualify it asthe primary beneficiary of the expected residual returns or losses.
The Company periodically enters into Option Contracts with third-parties that will purchase or have purchasedproperty at the direction of the Company. The Company evaluates these transactions in accordance with FIN 46R, aswell as SFAS No. 49, “Accounting for Product Financing Arrangements” (“SFAS 49”). SFAS 49 provides guidanceon identifying and accounting for product financing arrangements, which include: (1) land that is contracted to bepurchased by a third-party that simultaneously contracts to sell to the Company; (2) requirements to purchase land atspecified prices; and (3) additional purchase price payments to be made that are adjusted, as necessary, to coversubstantially all fluctuation in costs incurred by the third-party. The Company has evaluated all Option Contractsexecuted during 2007 subject to the provisions of SFAS 49 and, based on these evaluations, the Company determinedthat no asset or liability was required to be recorded prior to the date of purchase of the land.
Intangible Assets, Net. The Company’s finite-lived intangible assets primarily consisted of architectural plansand third-party developer, subcontractor and customer relationships which became fully impaired as ofDecember 31, 2007. Intangible amortization expense was $1.8 million, $4.2 million and $3.7 million in 2007, 2006and 2005, respectively.
Warranty Reserves. The Company’s homes are sold with limited third-party warranties that generally providefor ten years of structural coverage (“structural warranty”), two years of coverage for plumbing, electrical, heating,ventilation and air conditioning systems, and one year of coverage for workmanship and materials. Under MDC’sagreement with the issuer of the third-party warranties, the Company is responsible for performing all of the work forthe first two years of the warranty coverage and substantially all of the cost of the work required to be performedduring years three through ten of the warranties. As a result, warranty reserves are established as homes close on ahouse-by-house basis in an amount estimated to be adequate to cover expected costs of materials and outside laborduring warranty periods. Reserves are determined based upon historical experience with respect to similar homestyles and geographical areas. Certain factors are considered in determining the per-house reserve amount, including(1) the historical range of amounts paid per house; (2) the historical amount paid as a percent of home constructioncosts; (3) any warranty expenditures included in (1) and (2) not considered to be normal and recurring;(4) improvements in quality control and construction techniques expected to impact future warranty expenditures; and(5) conditions that may affect certain subdivisions and require higher per-house reserves for those specificsubdivisions.
Warranty payments are tracked on a house-by-house basis and are recorded against the warranty reserveestablished for the house. Payments incurred after the close of a home are monitored to determine their nature and, tothe extent they are warranty-related payments, they are recorded against the warranty reserve. To the extent thisevaluation determines that the payments made are related to completion of a home or land development, the paymentsare then recorded against the land development and home construction accruals. Additional reserves are establishedfor known, unusual warranty-related expenditures not covered by the general and structural warranty reserves.General warranty reserves not utilized for a particular house are evaluated on a monthly basis for reasonableness in
F-16

M.D.C. HOLDINGS, INC.Notes to Consolidated Financial Statements (Continued)
the aggregate on both a market-by-market and consolidated basis. Warranty payments for an individual house mayexceed the related reserve. Payments in excess of the reserve are evaluated on a monthly basis in the aggregate todetermine if an adjustment to the warranty reserve should be recorded, which could result in a correspondingadjustment to home cost of sales.
Generally, warranty reserves are reviewed monthly, using historical data and other relevant information, todetermine the reasonableness and adequacy of both the reserve and the per-unit reserve amount originally included inhome cost of sales, as well as the timing of the reversal of any excess reserve. Warranty reserves are included inaccrued liabilities in the Consolidated Balance Sheets.
The following table summarizes the warranty reserve activity for the years ended December 31, 2007, 2006 and2005 (in thousands).
Year Ended December 31,
2007 2006 2005
Warranty reserve balance at beginning of year . . . . . $ 102,033 $ 82,238 $ 64,424Warranty expense provisions . . . . . . . . . . . . . . . . . . 27,118 47,085 43,630Warranty cash payments . . . . . . . . . . . . . . . . . . . . . . (26,166) (31,736) (38,351)Warranty reserve adjustments . . . . . . . . . . . . . . . . . . 6,133 4,446 12,535
Warranty reserve balance at end of year . . . . . . . . . . $ 109,118 $ 102,033 $ 82,238
Insurance Reserves. The Company records expenses and liabilities for losses and loss adjustment expenses forclaims associated with: (1) insurance policies and re-insurance agreements issued by StarAmerican and Allegiant;(2) self-insurance, including workers compensation; and (3) deductible amounts under the Company’s insurancepolicies. The establishment of the provisions for outstanding losses and loss adjustment expenses is based on actuarialstudies that include known facts and interpretations of circumstances, including the Company’s experience withsimilar cases and historical trends involving claim payment patterns, pending levels of unpaid claims, product mix orconcentration, claim severity, frequency patterns such as those caused by natural disasters, fires, or accidents,depending on the business conducted, and changing regulatory and legal environments. Insurance reserve adjustmentsduring 2006 noted in the table below, primarily relate to incurred but not realized adjustments received in conjunctionwith the Company’s annual actuarial estimates.
The following table summarizes the insurance reserve activity for the years ended December 31, 2007, 2006 and2005 (in thousands).
Year Ended December 31,
2007 2006 2005
Insurance reserve balance at beginning of year . . . . $ 50,854 $ 35,570 $ 23,795Insurance expense provisions . . . . . . . . . . . . . . . . . . 10,729 15,501 14,348Insurance cash payments . . . . . . . . . . . . . . . . . . . . . . (4,080) (5,524) (1,599)Insurance reserve adjustments . . . . . . . . . . . . . . . . . . (28) 5,307 (974)
Insurance reserve balance at end of year . . . . . . . . . . $ 57,475 $ 50,854 $ 35,570
F-17

M.D.C. HOLDINGS, INC.Notes to Consolidated Financial Statements (Continued)
Mortgage Loan Loss Reserves. In the normal course of business, the Company establishes a liability foranticipated losses under the representation and warranty provisions in its loan sale agreements associated withmortgage loans originated and sold to third parties. These reserves are based upon, among other things: (1) pendingclaims the Company has received from third-party purchasers associated with previously sold mortgage loans;(2) historical loss experience; and (3) current trending loss experience. The Company’s mortgage loan reserves arereflected as a component of accrued liabilities in the Consolidated Balance Sheets, and the associated expenses areincluded as a component of general and administrative expenses in the Consolidated Statements of Operations. Thereserves were immaterial during the years ended December 31, 2007, 2006 and 2005.
Revenue Recognition for Homebuilding Segments. The Company recognizes revenue from home closings and landsales in accordance with the provisions of SFAS No. 66, “Accounting for Sales of Real Estate” (“SFAS 66”). Accordingly,revenue is recognized when the closing has occurred, title has passed, adequate initial and continuing investment by thebuyer is received, possession and other attributes of ownership have been transferred to the buyer and the Company is notobligated to perform significant additional activities after closing and delivery. If the buyer has provided sufficient initialand continuing investment, and all other revenue recognition criteria have been met, revenue is recognized using the fullaccrual method as provided in SFAS 66 on the date of closing. For home closings, the Company evaluates the initialinvestment for home purchase financing provided under Federal Housing Administration-insured and VeteransAdministration-guaranteed loans in accordance with Emerging Issues Task Force (“EITF”) No. 87-9, “Profit Recognitionon Sales of Real Estate with Insured Mortgages or Surety Bonds” and for all other home purchase financing in accordancewith SFAS 66 and EITF No. 88-24, “Effect of Various Forms of Financing under FASB Statement No. 66.”
For a home closing in which HomeAmerican originates the mortgage loan and the homebuyer does not provide asufficient initial and continuing investment, the Company utilizes the installment method of accounting in accordancewith SFAS 66. Accordingly, the corresponding Operating Profit is deferred, through a reduction to home salesrevenue in the Consolidated Statements of Operations, and subsequently recognized on the date that HomeAmericansells the homebuyer’s mortgage loan, or loans, to a third-party purchaser. The Company had $1.4 million and $23.1million in deferred Operating Profit associated with homes that closed for which the initial or continuing investmentcriteria were not met as of December 31, 2007 and 2006, respectively.
Revenue Recognition for HomeAmerican. The Company’s mortgage loans generally are sold to third-partypurchasers with anti-fraud, warranty and limited early payment default provisions. In accordance with SFAS No. 140,“Accounting for Transfers and Servicing of Financial Assets and Extinguishments of Liabilities” (“SFAS 140”), saleof a mortgage loan has occurred when the following criteria have been met: (1) the payment from the third-partypurchaser is not subject to future subordination; (2) the Company has transferred all the usual risks and rewards ofownership that is in substance a sale; and (3) the Company does not have a substantial continuing involvement withthe mortgage loan. Revenue from the sale of mortgage loan servicing is recognized upon the exchange ofconsideration for the mortgage loans and related servicing rights between the Company and the third-party purchaserin accordance with the provisions of SFAS 140. We defer the application and origination fees, net of costs, andrecognize them as revenue, along with the associated gains or losses on the sale of the mortgage loans and relatedservicing rights, when the mortgage loans are sold to third-party purchasers in accordance with SFAS No. 91,“Accounting for Nonrefundable Fees and Costs Associated with Originating or Acquiring Loans.” The revenuerecognized is reduced by the estimated fair value of any related guarantee provisions provided to the third-partypurchaser, which is determined by the amount at which the liability could be bought in a current transaction betweenwilling parties. The fair value of the guarantee provisions are recognized in revenue when the Company is releasedfrom its obligation under the terms of the loan sale agreements.
F-18

M.D.C. HOLDINGS, INC.Notes to Consolidated Financial Statements (Continued)
Home Cost of Sales. Home cost of sales includes the specific construction costs of each home and all applicableland acquisition, land development and related costs, both incurred and estimated to be incurred, warranty costs andfinance and closing costs. The Company uses the specific identification method for the purpose of accumulating homeconstruction costs and uses an average cost method to allocate land acquisition and development costs to each home.The Company records all home cost of sales when a home is closed on a house-by-house basis.
When a home is closed, the Company generally has not yet paid and recorded all costs necessary to complete theconstruction of the home and certain land development costs. At the time of a home closing, the Company comparesthe home construction budgets to actual recorded costs to determine the additional costs remaining to be paid on eachclosed home. For amounts not incurred or paid as of the time of closing a home, the Company records an estimatedaccrual associated with certain land development and home construction costs. Generally, these accruals areestablished based upon contracted work which has yet to be paid, open work orders not paid at the time of homeclosing, punch list items identified during the course of the homebuyer’s final walkthrough of the home, as well asland completion costs more likely than not to be incurred, and represent estimates believed to be adequate to cover theexpected remaining home construction and land development costs. The Company monitors the adequacy of theseaccruals on a house-by-house basis and in the aggregate on both a market-by-market and consolidated basis. AtDecember 31, 2007 and 2006, the Company had $42.3 million and $64.2 million, respectively, of land developmentand home construction accruals for closed homes. Actual results could differ from such estimates.
Stock-Based Compensation Expense. The Company applies the provisions of SFAS No. 123 (revised 2004),“Share-Based Payment” (“SFAS 123(R)”), and the Securities and Exchange Commission (the “SEC”), StaffAccounting Bulletin (“SAB”) No. 107, “Share-Based Payment” (“SAB 107”) for share-based payment awards.Accordingly, stock-based compensation expense for all share-based payment awards granted after December 31, 2005is based on the grant date fair value. The grant date fair value for stock option awards is estimated using the Black-Scholes option pricing model in accordance with the provisions of SFAS 123(R) and the grant date fair value forrestricted stock awards is based upon the closing prices of the Company’s common stock on the date of grant. TheCompany recognizes these compensation costs net of estimated forfeitures and recognizes stock-based compensationexpense for only those awards expected to vest on a straight-line basis over the requisite service period of the award,which is currently the vesting term of up to seven years.
Pro Forma Disclosures Pursuant to SFAS 123. As of December 31, 2005, the Company had only granted stockoptions with exercise prices that were equal to or greater than the fair market value of the Company’s common stockon the date of grant. Accordingly, prior to January 1, 2006, stock-based compensation expense was recorded only inassociation with the vesting of restricted stock and unrestricted stock awards and was recorded to expense ratably overthe associated service period, which was generally the vesting term. Additionally, prior to January 1, 2006, theCompany provided pro forma disclosure amounts in accordance with SFAS No. 148, “Accounting for Stock-BasedCompensation—Transition and Disclosure” (“SFAS 148”), as if the fair value method defined by SFAS 123 had beenapplied to all share-based payment awards.
F-19

M.D.C. HOLDINGS, INC.Notes to Consolidated Financial Statements (Continued)
The following table illustrates the effect on net income and earnings per share for the year endedDecember 31, 2005 if the fair value method prescribed by SFAS 123, as amended by SFAS 148, had been applied toall outstanding and unvested share-based payment awards during the year ended December 31, 2005 (in thousands,except per share amounts).
Net income, as reported . . . . . . . . . . . . . . . . . . . . . . . . . . . . . . . . . . . . . . . . . . . . . . . . . $ 505,723Deduct stock-based compensation expense determined using the fair value method,
net of related tax effects . . . . . . . . . . . . . . . . . . . . . . . . . . . . . . . . . . . . . . . . . . . . . . . (12,026)
Pro forma net income . . . . . . . . . . . . . . . . . . . . . . . . . . . . . . . . . . . . . . . . . . . . . . . . . . . $ 493,697
Earnings per shareBasic as reported . . . . . . . . . . . . . . . . . . . . . . . . . . . . . . . . . . . . . . . . . . . . . . . . . . $ 11.48
Basic pro forma . . . . . . . . . . . . . . . . . . . . . . . . . . . . . . . . . . . . . . . . . . . . . . . . . . . $ 11.21
Diluted as reported . . . . . . . . . . . . . . . . . . . . . . . . . . . . . . . . . . . . . . . . . . . . . . . . . $ 10.99
Diluted pro forma . . . . . . . . . . . . . . . . . . . . . . . . . . . . . . . . . . . . . . . . . . . . . . . . . . $ 10.72
Derivative Financial Instruments. SFAS No. 133, “Accounting for Derivative Instruments and Hedging Activities,”as amended by SFAS No. 138, “Accounting for Certain Derivative Instruments and Certain Hedging Activities” and SFASNo. 149, “Amendment of Statement 133 on Derivative Instruments and Hedging Activities” (“SFAS 133”), requirescompanies to recognize all of their derivative instruments as either assets or liabilities in the balance sheet at fair value. Theaccounting for changes in the fair value (i.e., gains or losses) of a derivative instrument depends on whether it has beenproperly designated by a company as a “hedging relationship” and is determined to qualify for hedge accounting. Toqualify for hedge accounting under SFAS 133, at the inception of a hedge, a company must formally document therelationship between the derivative instrument and the hedged item, as well as the risk management objective, the strategyfor undertaking the hedge transactions, and the method a company will use to assess the hedge’s effectiveness in achievingoffsetting changes in fair value. In addition, a company must document the results of the method used to assess hedgeeffectiveness on an on-going basis.
If a company either does not properly designate the “hedging relationship” or subsequently determines that thederivative instruments do not qualify for hedge accounting, the derivative instruments are considered “free standingderivatives.” Free standing derivatives are marked-to-market and included in the Consolidated Balance Sheets aseither derivative assets or liabilities with corresponding changes in fair value recorded to general and administrativeexpenses in the Consolidated Statements of Operations as they occur.
The Company utilizes certain derivative instruments in the normal course of business. These instruments includeforward sales of mortgage-backed securities commitments, private investor sales commitments and commitments tooriginate mortgage loans (interest rate lock commitments or locked pipeline), all of which typically are short-term innature. Forward sales securities commitments and private investor sales commitments are utilized to hedge changes infair value of mortgage loan inventory and commitments to originate mortgage loans. The Company had $37.6 millionin mortgage loans under interest rate lock commitments at an average interest rate of 6.0%. In addition, the Companyhad $100.1 million of mortgage loans in inventory available for sale at December 31, 2007.
During 2007, 2006 and 2005, the Company did not designate its derivatives as hedging instruments and recorded itsforward sales commitments and its locked pipeline as free standing derivatives and applied the lower-of-cost-or-market
F-20

M.D.C. HOLDINGS, INC.Notes to Consolidated Financial Statements (Continued)
method to account for mortgage loan inventory in accordance with SFAS No. 65, “Accounting for Certain MortgageBanking Activities.” The effect of not designating the derivatives as hedging instruments did not materially impact theCompany’s results of operations for 2007, 2006 or 2005.
Advertising Expenses. The Company expenses advertising costs as incurred. Advertising expenses were$36.6 million, $43.9 million and $28.8 million for the years ended December 31, 2007, 2006 and 2005, respectively.
Net (Loss) Income Per Share. The Company calculates (loss) earnings per share (“EPS”) in accordance with SFASNo. 128, “Earnings per Share” (“SFAS 128”). Pursuant to SFAS 128, basic EPS excludes the dilutive effect of commonstock equivalents and is computed by dividing net income or loss by the weighted-average number of common sharesoutstanding during the reporting period. Diluted EPS includes the dilutive effect of common stock equivalents and iscomputed using the weighted-average number of common stock and common stock equivalents outstanding during thereporting period. Common stock equivalents include stock options and unvested restricted stock awards. Diluted EPS forthe year ended December 31, 2007 excluded common stock equivalents because the effect of their inclusion would beanti-dilutive, or would decrease the reported loss per share. Using the treasury stock method pursuant to SFAS 128, theweighted-average common stock equivalents excluded from diluted EPS were 0.8 million shares during the year endedDecember 31, 2007.
Year Ended December 31,
2007 2006 2005
Basic (Loss) Earnings Per ShareNet (loss) income . . . . . . . . . . . . . . . . . . . . . . . . . $ (636,940) $ 214,253 $ 505,723
Basic weighted-average shares outstanding . . . . . 45,687 44,952 44,046
Per share amounts . . . . . . . . . . . . . . . . . . . . . . . . . $ (13.94) $ 4.77 $ 11.48
Diluted (Loss) Earnings Per ShareNet (loss) income . . . . . . . . . . . . . . . . . . . . . . . . . $ (636,940) $ 214,253 $ 505,723
Basic weighted-average shares outstanding . . . . . 45,687 44,952 44,046Stock options, net . . . . . . . . . . . . . . . . . . . . . . . . . - 1,019 1,990
Diluted weighted-average shares outstanding 45,687 45,971 46,036
Per share amounts . . . . . . . . . . . . . . . . . . . . . . . . . $ (13.94) $ 4.66 $ 10.99
Accumulated Other Comprehensive Loss. Accumulated other comprehensive loss, which includes unrealizedgains or losses on securities available for sale and minimum pension liability adjustments, has been reflected as acomponent of stockholders’ equity.
Recent Statements of Financial Accounting Standards. In September 2006, the FASB issued SFAS No. 157,“Fair Value Measurements” (“SFAS 157”) which defines fair value, establishes guidelines for measuring fair valueand expands disclosures regarding fair value measurements. SFAS 157 does not require any new fair valuemeasurements but rather eliminates inconsistencies in guidance found in various prior accounting pronouncements.SFAS 157 is effective for fiscal years beginning after November 15, 2007. However, on December 14, 2007, theFASB issued proposed FASB Staff Position (“FSP”) SFAS 157-b (“FSP 157-b”), which would delay the effective
F-21

M.D.C. HOLDINGS, INC.Notes to Consolidated Financial Statements (Continued)
date of SFAS 157 for all non-financial assets and non-financial liabilities, except those that are recognized ordisclosed at fair value in the financial statements on a recurring basis (at least annually). FSP 157-b partially defersthe effective date of SFAS 157 to fiscal years beginning after November 15, 2008, and interim periods within thosefiscal years for items within the scope of FSP 157-b. The Company will adopt SFAS 157 during 2008, except as itapplies to those non-financial assets and non-financial liabilities as noted in proposed FSP 157-b. The partial adoptionof SFAS 157 is not expected to have a material impact on the Company’s financial position, results of operations orcash flows.
In July 2006, the FASB issued FIN 48, “Accounting for Uncertainty in Income Taxes” (“FIN 48”). FIN 48 is aninterpretation of SFAS No. 109, “Accounting for Income Taxes” (“SFAS 109”). FIN 48 provides interpretiveguidance for the financial statement recognition and measurement of a tax position taken, or expected to be taken, in atax return. FIN 48 requires the affirmative evaluation that it is more likely than not, based on the technical merits of atax position, that an enterprise is entitled to economic benefits resulting from positions taken in income tax returns. Ifa tax position does not meet the “more-likely-than-not” recognition threshold, the benefit of that position is notrecognized in the financial statements. FIN 48 also requires companies to disclose additional quantitative andqualitative information in their financial statements about uncertain tax positions. FIN 48 was effective for fiscal yearbeginning January 1, 2007, and the $0.3 million cumulative effect of applying FIN 48 was reported as an adjustmentto the opening balance of retained earnings for this fiscal year.
In February 2007, the FASB issued SFAS No. 159, “The Fair Value Option for Financial Assets and FinancialLiabilities, Including and amendment of FASB Statement No. 115” (“SFAS 159”). SFAS 159 permits entities tochoose to measure many financial instruments and certain other items at fair value that are not currently required to bemeasured at fair value and establishes presentation and disclosure requirements designed to facilitate comparisonsbetween entities that choose different measurement attributes for similar types of assets and liabilities. SFAS 159 iseffective for financial statements issued for fiscal years beginning after November 15, 2007. The Company does notexpect SFAS 159 to have a material impact on its financial position, results of operations or cash flows uponadoption.
In November 2007, the SEC issued SAB No. 109, “Written Loan Commitments Recorded at Fair Value ThroughEarnings” (“SAB 109”). SAB 109 supersedes guidance provided by SAB No. 105, “Loan Commitments Accountedfor as Derivative Instruments” (“SAB 105”) and provides guidance on written loan commitments accounted for at fairvalue through earnings. Specifically, SAB 109 addresses the inclusion of expected net future cash flows related to theassociated servicing of a loan in the measurement of all written loan commitments accounted for at fair value throughearnings. In addition, SAB 109 retains the SEC’s position on the exclusion of internally-developed intangible assetsas part of the fair value of a derivative loan commitment originally established in SAB 105. SAB 109 is effective forfiscal years ending after December 15, 2007. The Company currently is evaluating the impact, if any, that SAB 109may have on its financial position, results of operations or cash flows.
F-22

M.D.C. HOLDINGS, INC.Notes to Consolidated Financial Statements (Continued)
2. Supplemental Disclosure of Cash Flow Information
The table below sets forth supplemental disclosures of cash and non-cash financing activities (in thousands).
Year Ended December 31,
2007 2006 2005
Cash paid during the year forInterest paid, net of interest capitalized . . . . . . . . . . . . . . . . . . . . . . . . . . $ 2,042 $ 9,036 $ 3,288Income taxes . . . . . . . . . . . . . . . . . . . . . . . . . . . . . . . . . . . . . . . . . . . . . . $ 10,466 $ 256,926 $ 234,657
Non-cash investing and financing activitiesAcquisition of community development district bonds . . . . . . . . . . . . . . $ 28,627 $ - $ -Tax benefit of non-qualified stock options exercised, net of (reversals)
tax benefits of non-qualified stock options exercised in previousyears . . . . . . . . . . . . . . . . . . . . . . . . . . . . . . . . . . . . . . . . . . . . . . . . . . . $ (32,566) $ 4,391 $ 30,002
3. Information on Business Segments
SFAS No. 131, “Disclosures About Segments of an Enterprise and Related Information” (“SFAS 131”), definesoperating segments as a component of an enterprise for which discrete financial information is available and isreviewed regularly by the chief operating decision-maker, or decision-making group, to evaluate performance andmake operating decisions. The Company has identified its chief operating decision-makers (“CODMs”) as three keyexecutives—the Chief Executive Officer, Chief Operating Officer and Chief Financial Officer.
The Company has identified each homebuilding subdivision as an operating segment in accordance with SFAS131. Each homebuilding subdivision engages in business activities from which it earns revenue primarily from thesale of single-family detached homes, generally to first-time and first-time move-up homebuyers. Subdivisions in thereportable segments noted below have been aggregated because they are similar in the following regards:(1) economic characteristics; (2) housing products; (3) class of homebuyer; (4) regulatory environments; and(5) methods used to construct and sell homes. The Company’s homebuilding reportable segments are as follows:
• West (Arizona, California and Nevada)• Mountain (Colorado and Utah)• East (Virginia and Maryland)• Other Homebuilding (Delaware Valley, Florida, Illinois and Texas)
The Company’s Financial Services and Other reportable segment consists of the operations of the followingoperating segments: (1) HomeAmerican; (2) American Home Insurance; (3) American Home Title; (4) Allegiant; and(5) StarAmerican. These operating segments have been aggregated into one reportable segment because they do notindividually exceed 10 percent of: (1) consolidated revenue; (2) the greater of (A) the combined reported profit of alloperating segments that did not report a loss or (B) the positive value of the combined reported loss of all operatingsegments that reported losses; or (3) consolidated assets. The Company’s Corporate reportable segment incurs generaland administrative expenses that are not identifiable specifically to another operating segment.
Inter-company supervisory fees (“Supervisory Fees”), which are included in (loss) income before income taxes,are charged by the Company’s Corporate segment to the homebuilding segments and the Financial Services and Othersegment. Supervisory Fees represent costs incurred by the Company’s Corporate segment associated with certain
F-23
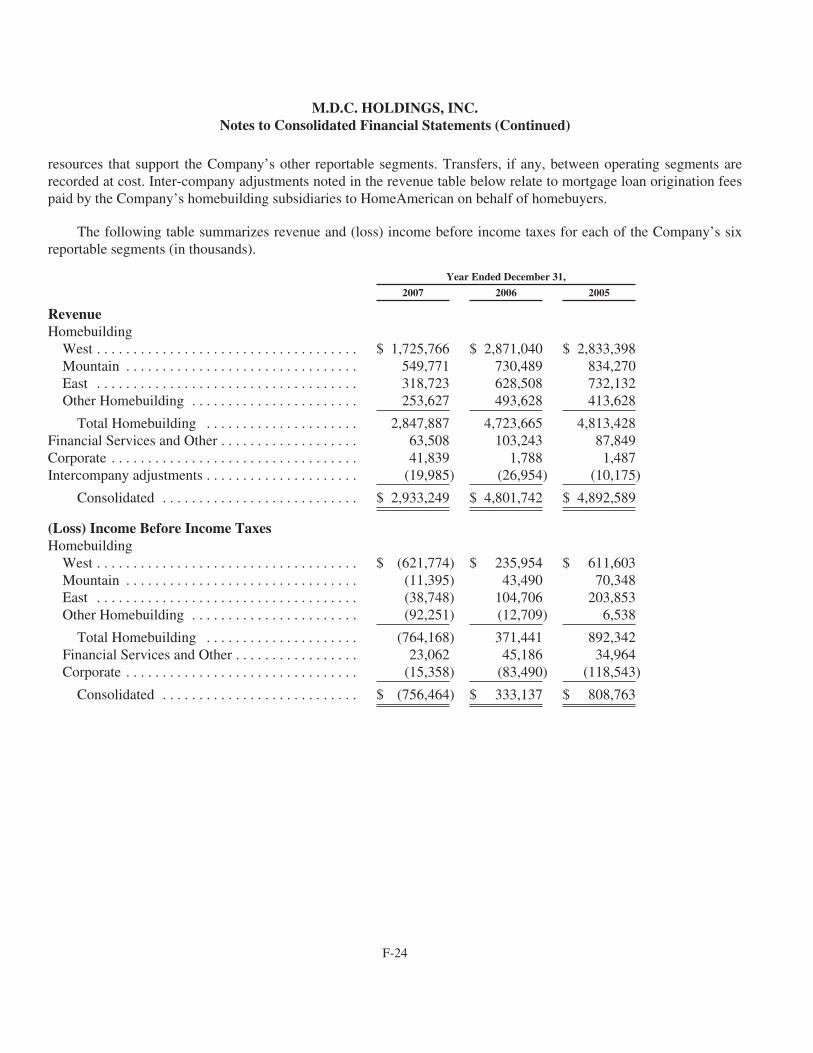
M.D.C. HOLDINGS, INC.Notes to Consolidated Financial Statements (Continued)
resources that support the Company’s other reportable segments. Transfers, if any, between operating segments arerecorded at cost. Inter-company adjustments noted in the revenue table below relate to mortgage loan origination feespaid by the Company’s homebuilding subsidiaries to HomeAmerican on behalf of homebuyers.
The following table summarizes revenue and (loss) income before income taxes for each of the Company’s sixreportable segments (in thousands).
Year Ended December 31,
2007 2006 2005
RevenueHomebuilding
West . . . . . . . . . . . . . . . . . . . . . . . . . . . . . . . . . . . . $ 1,725,766 $ 2,871,040 $ 2,833,398Mountain . . . . . . . . . . . . . . . . . . . . . . . . . . . . . . . . 549,771 730,489 834,270East . . . . . . . . . . . . . . . . . . . . . . . . . . . . . . . . . . . . 318,723 628,508 732,132Other Homebuilding . . . . . . . . . . . . . . . . . . . . . . . 253,627 493,628 413,628
Total Homebuilding . . . . . . . . . . . . . . . . . . . . . 2,847,887 4,723,665 4,813,428Financial Services and Other . . . . . . . . . . . . . . . . . . . 63,508 103,243 87,849Corporate . . . . . . . . . . . . . . . . . . . . . . . . . . . . . . . . . . 41,839 1,788 1,487Intercompany adjustments . . . . . . . . . . . . . . . . . . . . . (19,985) (26,954) (10,175)
Consolidated . . . . . . . . . . . . . . . . . . . . . . . . . . . $ 2,933,249 $ 4,801,742 $ 4,892,589
(Loss) Income Before Income TaxesHomebuilding
West . . . . . . . . . . . . . . . . . . . . . . . . . . . . . . . . . . . . $ (621,774) $ 235,954 $ 611,603Mountain . . . . . . . . . . . . . . . . . . . . . . . . . . . . . . . . (11,395) 43,490 70,348East . . . . . . . . . . . . . . . . . . . . . . . . . . . . . . . . . . . . (38,748) 104,706 203,853Other Homebuilding . . . . . . . . . . . . . . . . . . . . . . . (92,251) (12,709) 6,538
Total Homebuilding . . . . . . . . . . . . . . . . . . . . . (764,168) 371,441 892,342Financial Services and Other . . . . . . . . . . . . . . . . . 23,062 45,186 34,964Corporate . . . . . . . . . . . . . . . . . . . . . . . . . . . . . . . . (15,358) (83,490) (118,543)
Consolidated . . . . . . . . . . . . . . . . . . . . . . . . . . . $ (756,464) $ 333,137 $ 808,763
F-24

M.D.C. HOLDINGS, INC.Notes to Consolidated Financial Statements (Continued)
The following table summarizes total assets for each of the Company’s six reportable segments (in thousands).Inter-company adjustments noted in the table below relate to loans from the Company’s Financial Services and Othersegment to its Corporate segment.
December 31,
2007 2006
HomebuildingWest . . . . . . . . . . . . . . . . . . . . . . . . . . . . . . . . . . . . . . . . . . . . . . . . $ 747,835 $ 1,869,442Mountain . . . . . . . . . . . . . . . . . . . . . . . . . . . . . . . . . . . . . . . . . . . . . 474,203 535,554East . . . . . . . . . . . . . . . . . . . . . . . . . . . . . . . . . . . . . . . . . . . . . . . . . 250,658 333,902Other Homebuilding . . . . . . . . . . . . . . . . . . . . . . . . . . . . . . . . . . . . 125,003 266,326
Total Homebuilding . . . . . . . . . . . . . . . . . . . . . . . . . . . . . . . . . . 1,597,699 3,005,224Financial Services and Other . . . . . . . . . . . . . . . . . . . . . . . . . . . . . 174,617 284,791Corporate . . . . . . . . . . . . . . . . . . . . . . . . . . . . . . . . . . . . . . . . . . . . 1,229,178 657,917Intercompany adjustments . . . . . . . . . . . . . . . . . . . . . . . . . . . . . . . (45,257) (38,057)
Consolidated . . . . . . . . . . . . . . . . . . . . . . . . . . . . . . . . . . . . . . . . $ 2,956,237 $ 3,909,875
The following table summarizes depreciation and amortization of long-lived assets and amortization of deferredmarketing costs for each of the Company’s six reportable segments (in thousands).
Year Ended December 31,
2007 2006 2005
HomebuildingWest . . . . . . . . . . . . . . . . . . . . . . . . . . . . . . . . . . . . $ 28,362 $ 33,946 $ 30,599Mountain . . . . . . . . . . . . . . . . . . . . . . . . . . . . . . . . 4,733 5,272 6,840East . . . . . . . . . . . . . . . . . . . . . . . . . . . . . . . . . . . . 2,753 3,516 2,540Other Homebuilding . . . . . . . . . . . . . . . . . . . . . . . 5,975 10,273 8,207
Total Homebuilding . . . . . . . . . . . . . . . . . . . . . 41,823 53,007 48,186Financial Services and Other . . . . . . . . . . . . . . . . . 462 306 519Corporate . . . . . . . . . . . . . . . . . . . . . . . . . . . . . . . . 5,057 5,717 5,720
Consolidated . . . . . . . . . . . . . . . . . . . . . . . . . . . $ 47,342 $ 59,030 $ 54,425
F-25

M.D.C. HOLDINGS, INC.Notes to Consolidated Financial Statements (Continued)
4. Mortgage Loans Held in Inventory, Net
The following table sets forth the information relating to mortgage loans held in inventory, net (in thousands).
December 31,
2007 2006
Mortgage loansConventional . . . . . . . . . . . . . . . . . . . . . . . . . . . . . . . . . . . . . . . . . . $ 76,039 $ 209,182FHA and VA . . . . . . . . . . . . . . . . . . . . . . . . . . . . . . . . . . . . . . . . . . 27,588 7,774
103,627 216,956Less
Deferred fees and other . . . . . . . . . . . . . . . . . . . . . . . . . . . . . . . . . . (3,483) (4,053)
Total . . . . . . . . . . . . . . . . . . . . . . . . . . . . . . . . . . . . . . . . . . . . . . $ 100,144 $ 212,903
Mortgage loans held in inventory consist primarily of loans collateralized by first mortgages and deeds of trustdue over periods of up to 40 years. The weighted-average effective yield on mortgage loans held in inventory wasapproximately 6.1% and 6.9% at December 31, 2007 and 2006, respectively.
5. Supplemental Balance Sheet Information
The following table sets forth information relating to accrued liabilities (in thousands).
December 31,
2007 2006
Accrued liabilitiesWarranty reserves . . . . . . . . . . . . . . . . . . . . . . . . . . . . . . . . . . . . . . $ 109,118 $ 102,033Insurance reserves . . . . . . . . . . . . . . . . . . . . . . . . . . . . . . . . . . . . . . 57,475 50,854Land development and home construction accruals . . . . . . . . . . . . 42,258 64,224Accrued compensation and related expenses . . . . . . . . . . . . . . . . . 33,883 74,751Customer and escrow deposits . . . . . . . . . . . . . . . . . . . . . . . . . . . . 15,603 28,705Accrued pension liability . . . . . . . . . . . . . . . . . . . . . . . . . . . . . . . . 13,531 13,183Accrued interest payable . . . . . . . . . . . . . . . . . . . . . . . . . . . . . . . . . 12,860 13,321Deferred revenue . . . . . . . . . . . . . . . . . . . . . . . . . . . . . . . . . . . . . . 1,444 23,089Other accrued liabilities . . . . . . . . . . . . . . . . . . . . . . . . . . . . . . . . . 53,181 48,793
Total accrued liabilities . . . . . . . . . . . . . . . . . . . . . . . . . . . . . . . . $ 339,353 $ 418,953
6. Retirement Plans
In October 1997, the Company established a defined benefit retirement and medical plan (collectively, the“Retirement Plan”) for two executive officers of the Company under which the Company agreed to make futurepayments that have a projected benefit obligation of $13.7 million and $13.3 million at December 31, 2007 and 2006,respectively. The Retirement Plan is not funded and benefits were fully vested at December 31, 2007, themeasurement date, for both participants. Unrecognized prior service cost of $1.0 million at December 31, 2007 isbeing recognized over the officers’ average estimated service periods. Included in prepaid expenses and other assets,
F-26
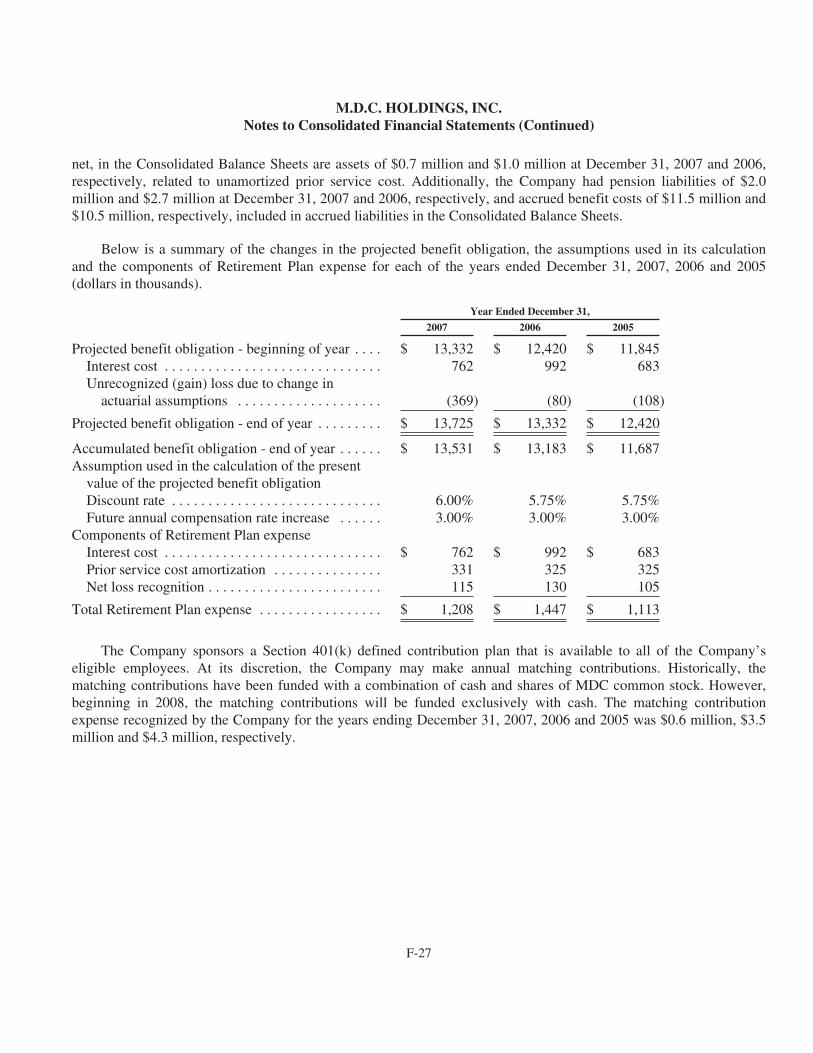
M.D.C. HOLDINGS, INC.Notes to Consolidated Financial Statements (Continued)
net, in the Consolidated Balance Sheets are assets of $0.7 million and $1.0 million at December 31, 2007 and 2006,respectively, related to unamortized prior service cost. Additionally, the Company had pension liabilities of $2.0million and $2.7 million at December 31, 2007 and 2006, respectively, and accrued benefit costs of $11.5 million and$10.5 million, respectively, included in accrued liabilities in the Consolidated Balance Sheets.
Below is a summary of the changes in the projected benefit obligation, the assumptions used in its calculationand the components of Retirement Plan expense for each of the years ended December 31, 2007, 2006 and 2005(dollars in thousands).
Year Ended December 31,
2007 2006 2005
Projected benefit obligation - beginning of year . . . . $ 13,332 $ 12,420 $ 11,845Interest cost . . . . . . . . . . . . . . . . . . . . . . . . . . . . . . 762 992 683Unrecognized (gain) loss due to change in
actuarial assumptions . . . . . . . . . . . . . . . . . . . . (369) (80) (108)
Projected benefit obligation - end of year . . . . . . . . . $ 13,725 $ 13,332 $ 12,420
Accumulated benefit obligation - end of year . . . . . . $ 13,531 $ 13,183 $ 11,687Assumption used in the calculation of the present
value of the projected benefit obligationDiscount rate . . . . . . . . . . . . . . . . . . . . . . . . . . . . . 6.00% 5.75% 5.75%Future annual compensation rate increase . . . . . . 3.00% 3.00% 3.00%
Components of Retirement Plan expenseInterest cost . . . . . . . . . . . . . . . . . . . . . . . . . . . . . . $ 762 $ 992 $ 683Prior service cost amortization . . . . . . . . . . . . . . . 331 325 325Net loss recognition . . . . . . . . . . . . . . . . . . . . . . . . 115 130 105
Total Retirement Plan expense . . . . . . . . . . . . . . . . . $ 1,208 $ 1,447 $ 1,113
The Company sponsors a Section 401(k) defined contribution plan that is available to all of the Company’seligible employees. At its discretion, the Company may make annual matching contributions. Historically, thematching contributions have been funded with a combination of cash and shares of MDC common stock. However,beginning in 2008, the matching contributions will be funded exclusively with cash. The matching contributionexpense recognized by the Company for the years ending December 31, 2007, 2006 and 2005 was $0.6 million, $3.5million and $4.3 million, respectively.
F-27

M.D.C. HOLDINGS, INC.Notes to Consolidated Financial Statements (Continued)
7. Income Taxes
The Company’s provision for income taxes from continuing operations for the years ended December 31, 2007,2006 and 2005 consisted of the following (in thousands):
Year Ended December 31,
2007 2006 2005
Current tax (benefit) expenseFederal . . . . . . . . . . . . . . . . . . . . . . . . . . . . . . . . . . $ (78,385) $ 167,600 $ 277,425State . . . . . . . . . . . . . . . . . . . . . . . . . . . . . . . . . . . . (5,454) 19,542 38,971
Total current . . . . . . . . . . . . . . . . . . . . . . . . . . . (83,839) 187,142 316,396
Deferred tax (benefit) expenseFederal . . . . . . . . . . . . . . . . . . . . . . . . . . . . . . . . . . (25,358) (62,704) (12,662)State . . . . . . . . . . . . . . . . . . . . . . . . . . . . . . . . . . . . (10,327) (5,554) (694)
Total deferred . . . . . . . . . . . . . . . . . . . . . . . . . . (35,685) (68,258) (13,356)
(Benefit from) provision for income taxes . . . . . . . . $ (119,524) $ 118,884 $ 303,040
The provision for income taxes differs from the amount that would be computed by applying the statutory federalincome tax rate of 35% to income before income taxes as a result of the following (dollars in thousands).
Year Ended December 31,
2007 2006 2005
Tax expense computed at federal statutory rate . . . . $ (264,762) $ 116,598 $ 283,067State income tax, net of federal benefit . . . . . . . . . . . (23,450) 10,327 25,072Permanent differences . . . . . . . . . . . . . . . . . . . . . . . . 4,143 (4,331) (5,662)Liability for unrecognized tax benefits . . . . . . . . . . . 4,545 (3,850) -Change in valuation allowance . . . . . . . . . . . . . . . . . 160,000 - -Other, net . . . . . . . . . . . . . . . . . . . . . . . . . . . . . . . . . . - 140 563
(Benefit from) provision for income taxes . . . . . . . . $ (119,524) $ 118,884 $ 303,040
Effective tax rate . . . . . . . . . . . . . . . . . . . . . . . . . . . . 15.8% 35.7% 37.5%
Beginning in 2005, the American Jobs Creation Act of 2004 introduced a special 3% tax deduction underInternal Revenue Code Section 199, “Income Attributable to Domestic Production Activities” (“Section 199”). In2005 and 2006, this Section 199 deduction was accounted for as a permanent difference and reduced current federalincome tax expense. In 2007, this item reduced the current federal income tax benefit. As the carryback of the 2007federal taxable loss decreased the benefit originally claimed in the 2005 federal tax return.
During 2007, the Company recorded a net $4.5 million increase in its provision for income taxes, representing anincrease in its liability for unrecognized tax benefits. This increase primarily related to additional liabilitiesestablished for uncertain tax positions related to prior years, partially offset by the release of liabilities due to theexpiration of certain statute of limitations.
F-28

M.D.C. HOLDINGS, INC.Notes to Consolidated Financial Statements (Continued)
Deferred income taxes reflect the net tax effects of temporary differences between the carrying amounts of theassets and liabilities for financial reporting purposes and the amounts used for income tax purposes. The tax effects ofsignificant temporary differences that give rise to the net deferred tax asset are as follows (in thousands).
December 31,
2007 2006
Deferred tax assetsWarranty, litigation and other reserves . . . . . . . . . . . . . . . . . . . . . . $ 57,757 $ 52,752Asset impairment charges . . . . . . . . . . . . . . . . . . . . . . . . . . . . . . . . 236,462 41,876Accrued liabilities . . . . . . . . . . . . . . . . . . . . . . . . . . . . . . . . . . . . . . 9,138 8,298Deferred revenue . . . . . . . . . . . . . . . . . . . . . . . . . . . . . . . . . . . . . . 652 8,797Inventory, additional costs capitalized for tax purposes . . . . . . . . . 8,246 12,356Stock-based compensation expense . . . . . . . . . . . . . . . . . . . . . . . . 9,775 5,620Property, equipment and other assets, net . . . . . . . . . . . . . . . . . . . 4,597 730State net operating loss carryforward . . . . . . . . . . . . . . . . . . . . . . . 6,698 -
Total deferred tax assets . . . . . . . . . . . . . . . . . . . . . . . . . . . . . . . 333,325 130,429Valuation allowance . . . . . . . . . . . . . . . . . . . . . . . . . . . . . . . . . . . . (160,000) -
Total deferred tax assets, net of valuation allowance . . . . . . . . . 173,325 130,429
Deferred tax liabilitiesDeferred revenue . . . . . . . . . . . . . . . . . . . . . . . . . . . . . . . . . . . . . . 7,205 1,532Inventory, additional costs capitalized for financial statement
purposes . . . . . . . . . . . . . . . . . . . . . . . . . . . . . . . . . . . . . . . . . . . 779 596Accrued liabilities . . . . . . . . . . . . . . . . . . . . . . . . . . . . . . . . . . . . . . 808 -Other, net . . . . . . . . . . . . . . . . . . . . . . . . . . . . . . . . . . . . . . . . . . . . 3,969 3,421
Total deferred tax liabilities . . . . . . . . . . . . . . . . . . . . . . . . . . . . 12,761 5,549
Net deferred tax asset . . . . . . . . . . . . . . . . . . . . . . . . . . . . . . . . . . . $ 160,564 $ 124,880
At December 31, 2007, the Company had $6.7 million in tax benefits associated with state income tax netoperating loss carryforwards. These operating loss carryforwards will begin to expire in 2012.
The Company had deferred tax assets of $160.6 million at December 31, 2007, net of a valuation allowance of$160.0 million, related to amounts that are estimated to be realized during 2008 through federal or state carrybacks orthrough reversals of existing taxable temporary differences. This valuation allowance was recorded during the fourthquarter of 2007 after considering a number of factors, most notably the Company’s expectation of being in a three-year cumulative operating loss position during 2008.
The Company’s future realization of its deferred tax assets ultimately depends on the existence of sufficienttaxable income in the carryforward periods under the tax laws. The Company will continue analyzing, in subsequentreporting periods, the positive and negative evidence in determining the expected realization of its deferred tax assets.
On January 1, 2007, the Company adopted the provisions of FIN 48. As a result of the implementation ofFIN 48, the Company decreased its liability for unrecognized tax benefits by approximately $0.3 million, which was
F-29

M.D.C. HOLDINGS, INC.Notes to Consolidated Financial Statements (Continued)
accounted for as an increase to the January 1, 2007 retained earnings balance. A reconciliation of the beginning andending balance for liabilities associated with unrecognized tax benefits is as follows (in thousands):
Balances at January 1, 2007 . . . . . . . . . . . . . . . . . . . . . . . . . . . . . . . . . . . . . . . . . . . . . $ 18,739Tax positions related to prior years . . . . . . . . . . . . . . . . . . . . . . . . . . . . . . . . . . . . . . . 35,180Tax positions related to the current year . . . . . . . . . . . . . . . . . . . . . . . . . . . . . . . . . . . 1,824Lapse of applicable statute of limitations . . . . . . . . . . . . . . . . . . . . . . . . . . . . . . . . . . . (683)
Balances at December 31, 2007 . . . . . . . . . . . . . . . . . . . . . . . . . . . . . . . . . . . . . . . . . . $ 55,060
The increase in liabilities for unrecognized tax benefits from $18.7 million to $55.1 million primarily is due topotential Internal Revenue Service (“I.R.S.”) audit adjustments concerning deductions taken in the Company’s 2004and 2005 federal income tax returns. As the tax benefits of these tax deductions were originally accounted for asincreases to additional paid-in-capital in the Company’s Consolidated Statements of Stockholders’ Equity, theestablishment of the liability for unrecognized tax benefits was primarily accounted for as a decrease to additionalpaid-in-capital.
The total liabilities associated with unrecognized tax benefits that, if recognized, would impact the effective taxrates were $12.9 million and $13.6 million at January 1, 2007 and December 31, 2007, respectively.
The Company accrues interest and penalties associated with unrecognized tax benefits in income tax expense inthe Consolidated Statements of Operations, and the corresponding liability in income taxes payable or income taxesreceivable, net in the Consolidated Balance Sheets. The expense for interest and penalties reflected in theConsolidated Statements of Operations for the year ended December 31, 2007 was approximately $7.2 million(interest net of related tax benefits). The corresponding liabilities in the Consolidated Balance Sheets were $9.8million and $2.6 million at December 31, 2007 and January 1, 2007, respectively.
The Company has taken positions in certain taxing jurisdictions for which it is reasonably possible that the totalamounts of unrecognized tax benefits may significantly decrease within the next twelve months. The possibledecrease could result from the finalization of the Company’s federal and various state income tax audits. TheCompany’s federal income tax audit concerns various deductions taken in its 2004 and 2005 federal income taxreturns, while various state income tax audits primarily are concerned with apportionment-related issues. Theestimated range of the reasonably possible decrease is $30 million to $40 million.
The Company and its subsidiaries file income tax returns in the U.S. federal jurisdiction and various statejurisdictions. The Company is subject to U.S. federal income tax examination for calendar tax years ending 2004through 2007. The Company currently is under audit from the I.R.S for its 2004 and 2005 tax years. Additionally, theCompany is subject to various state income tax examinations for the 1996 through 2007 calendar tax years. TheCompany currently is under state income tax examination in the states of California, Virginia and Arizona for varioustax years.
8. Related Party Transactions
During 2007, the Company committed to contributing $1.0 million to the MDC/Richmond American HomesFoundation (the “Foundation”), a Delaware non-profit corporation that was incorporated on September 30, 1999, inthe form of shares of MDC common stock. During 2006, the Company committed to contributing $3.3 million to theFoundation. In June 2006 and January 2007, the Company contributed to the Foundation 29,798 and 24,703 shares of
F-30

M.D.C. HOLDINGS, INC.Notes to Consolidated Financial Statements (Continued)
MDC common stock, respectively, in fulfillment of the 2006 commitments. During 2005, the Company committed tocontributing $8.1 million to the Foundation. In January 2006, the Company contributed to the Foundation 125,562shares of MDC common stock in fulfillment of the 2005 commitment.
The Foundation is a non-profit organization operated exclusively for charitable, educational and other purposesbeneficial to social welfare within the meaning of Section 501(c)(3) of the Internal Revenue Code. The followingDirectors, former Director and/or officers of the Company are the trustees of the Foundation, all of whom servewithout compensation:
Name Title
Larry A. Mizel . . . . . . . . . . . . . . . . . . . . . . . . . . . . . . . Trustee, President and Assistant Secretary
Paris G. Reece III . . . . . . . . . . . . . . . . . . . . . . . . . . . . . Trustee, Vice President and Secretary
Steven J. Borick . . . . . . . . . . . . . . . . . . . . . . . . . . . . . . Trustee
Gilbert Goldstein . . . . . . . . . . . . . . . . . . . . . . . . . . . . . Trustee
David D. Mandarich . . . . . . . . . . . . . . . . . . . . . . . . . . . Trustee
The Foundation takes action with respect to securities held by it, including the voting of such shares, by majorityvote of at least three members of the board of trustees. Accordingly, none of the trustees should be considered tobeneficially own such securities. As permitted by the Foundation’s Bylaws, the Trustees have established anInvestment Committee, consisting of Trustees Borick, Mizel and Reece, to supervise the finances of, and makeinvestment decisions for, the Foundation in furtherance of its purposes. Also as permitted by the Bylaws, the Trusteeshave established a Donations Committee, consisting of Trustees Borick, Mandarich and Mizel, to supervise donationsand make donation decisions for the Foundation in furtherance of its purposes.
During 2007, the Company entered into a transaction (the “Transaction”) with the Villages at Castle RockMetropolitan District No. 6 (the “District”), whose board of directors is comprised of officers and employees of MDC.Pursuant to the terms of the Transaction, the District sold to the Company approximately $22.5 million in Limited TaxGeneral Obligation Capital Appreciation Bonds Series 2007 (the “Series 2007 Bonds”), a $1.6 million Limited TaxGeneral Obligation Subordinate Bond (the “Subordinate Bond”) and a $4.5 million supplemental obligation (the“Supplemental Obligation”), which constitutes a multi-year obligation of the District. In exchange for the foregoing,the Company transferred title to approximately $28.6 million in land development improvements to the District. TheCompany has recorded the assets associated with the Series 2007 Bonds, Subordinate Bond and SupplementalObligation as related party assets in the Consolidated Balance Sheets.
9. Lines of Credit
Homebuilding. The Company’s homebuilding line of credit (“Homebuilding Line”) is an unsecured revolvingline of credit with a group of lenders for support of our homebuilding segments. The Homebuilding Line has anaggregate commitment amount to $1.25 billion, (the “Commitment”) and a maturity date of March 21, 2011. Inaccordance with the provisions of the Homebuilding Line, letters of credit are available in the aggregate amount of upto $500 million. The Homebuilding Line permits an increase in the maximum commitment amount to $1.75 billionupon the Company’s request, subject to receipt of additional commitments from existing or additional participantlenders. Interest rates on outstanding borrowings are determined by reference to London Interbank Offered Rate(“LIBOR”), with a spread from LIBOR, which is determined based on changes in the Company’s credit ratings and
F-31

M.D.C. HOLDINGS, INC.Notes to Consolidated Financial Statements (Continued)
leverage ratio, or to an alternate base rate. Additionally, the Company incurs costs associated with unusedcommitment fees pursuant to the terms of the Homebuilding Line. Accordingly, the Company incurred $1.8 million inunused commitment fees with respect to the Homebuilding Line during each of the years ended December 31, 2007and 2006. At December 31, 2007 and 2006, there were no borrowings under the Homebuilding Line and there were$31.7 million and $53.4 million, respectively, in letters of credit outstanding as of such dates, which reduced theamounts available to be borrowed under our Homebuilding Line.
Mortgage Lending. The Company’s mortgage line of credit (“Mortgage Line”) has a borrowing limit of $225million with terms that allow for increases of up to $175 million in the borrowing limit to a maximum of$400 million, subject to concurrence by the participating banks. The terms of the Mortgage Line are set forth in theFourth Amended and Restated Warehousing Credit Agreement dated as of September 5, 2006. Additionally, during2007, the Company completed the First Amendment to Fourth Amended and Restated Warehousing CreditAgreement, which was entered into primarily to set a liquidity measure at $7.5 million, adjust certain mortgage loansublimits and provide for the withdrawal of one participating bank while maintaining the facility at the sameaggregate commitment level. Available borrowings under the Mortgage Line are collateralized by mortgage loans andmortgage-backed certificates and are limited to the value of eligible collateral, as defined. At December 31, 2007 and2006, $70.1 million and $130.5 million were borrowed, respectively, and an additional $23.7 million and $31.5million, respectively, were collateralized and available to be borrowed. The Mortgage Line is cancelable upon 120days notice. At December 31, 2007 and 2006, the interest rates on the Mortgage Line were 5.5% and 6.3%,respectively.
General. The agreements for the Company’s bank lines of credit require compliance with certainrepresentations, warranties and covenants. The Company believes that it is in compliance with these representations,warranties and covenants and the Company is not aware of any covenant violations.
The financial covenants contained in the Homebuilding Line agreement (as amended on January 24, 2008 asdescribed in Note 17) include a leverage test and a consolidated tangible net worth test. Under the leverage test,generally, our consolidated indebtedness is not permitted to exceed 55% (subject to adjustment in certaincircumstances) of the sum of consolidated indebtedness and our “adjusted consolidated tangible net worth,” asdefined. Effective January 24, 2008, the Company’s “consolidated tangible net worth” (as defined) under theHomebuilding Line consolidated tangible net worth test must not be less than (1) $1.055 billion; plus (2) 50% ofconsolidated net income, as defined, earned by the Company and the guarantor subsidiaries after December 31, 2007;plus (3) 50% of the net proceeds or other consideration received by the Company for the issuance of capital stockafter December 31, 2007; minus (4) the lesser of (A) the aggregate amount paid by the Company after December 31,2007 to repurchase its common stock and (B) $300 million. Failure to satisfy the foregoing financial covenant testswould not result in a default, but would result in scheduled reductions in the amount of the Commitment. In addition,“consolidated tangible net worth,” as defined, must not be less than the sum of (1) $850 million; (2) 50% of the“quarterly consolidated net income” of “borrower” and the “guarantors” earned after December 31, 2007; and(3) 50% of the net proceeds or other consideration received for the issuance of capital stock after December 31, 2007.Failure to satisfy this covenant could result in a termination of the facility. We believe that we are in full compliancewith these covenants, and we are not aware of any covenant violations.
10. Senior Notes
In December 2002, the Company completed a public offering of $150 million principal amount of 7% seniornotes due December 2012 (the “7% Senior Notes”) at a discount, with an effective yield of 7.30%. Interest is due and
F-32
M.D.C. HOLDINGS, INC.Notes to Consolidated Financial Statements (Continued)
payable on June 1 and December 15 of each year until maturity. The Company is not required to make any principalpayments and the 7% Senior Notes are fully due in December 2012. The 7% Senior Notes are guaranteed by certainof the Company’s subsidiaries and may be redeemed, at the election of the Company, in whole at any time or in partfrom time to time, at a redemption price equal to the greater of (1) 100% of their principal amount; or (2) the presentvalue of the remaining scheduled payments on the notes being redeemed on the redemption date discounted on asemiannual basis at the Treasury Rate plus 0.45%, plus, in each case, accrued and unpaid interest.
In May 2003, the Company completed a public offering of $150 million principal amount of 51⁄2% senior notesdue May 2013 (the “51⁄2% Senior Notes”) at a discount, with an effective yield of 5.74%. In December 2003, theCompany issued an additional $200 million principal amount of 51⁄2% Senior Notes at a premium, with an effectiveyield of 5.57%. The 51⁄2% Senior Notes have interest due and payable on May 15 and November 15 of each year untilmaturity. The Company is not required to make any principal payments and the 51⁄2% Senior Notes are fully due inMay 2013. The 51⁄2% Senior Notes are guaranteed by certain of the Company’s subsidiaries and may be redeemed, atthe election of the Company, in whole at any time or in part from time to time, at a redemption price equal to thegreater of (1) 100% of their principal amount; or (2) the present value of the remaining scheduled payments on thenotes being redeemed on the redemption date discounted on a semiannual basis at the Treasury Rate plus 0.30%, plus,in each case, accrued and unpaid interest.
In December 2004, the Company completed a public offering of $250 million principal amount of53⁄8% medium-term senior notes due December 2014 (the “53⁄8% Medium-Term Senior Notes”) at a discount, with aneffective yield of 5.55%. The 53⁄8% Medium-Term Senior Notes have interest due and payable on June 15 andDecember 15 of each year until maturity. The Company is not required to make any principal payments until the53⁄8% Medium-Term Senior Notes are fully due in December 2014. The 53⁄8% Medium-Term Senior Notes areguaranteed by certain of the Company’s subsidiaries and may be redeemed, at the election of the Company, in wholeat any time or in part from time to time, at a redemption price equal to the greater of (1) 100% of their principalamount; or (2) the present value of the remaining scheduled payments on the notes being redeemed on the redemptiondate discounted on a semiannual basis at the Treasury Rate plus 0.20%, plus, in each case, accrued and unpaidinterest.
In July 2005, the Company completed a public offering of $250 million principal amount of 53⁄8% medium-termsenior notes due July 2015 (the “2015 Medium-Term Senior Notes”) at a discount, with an effective yield of 5.50%.The 2015 Medium-Term Senior Notes have interest due and payable on January 1 and July 1 of each year untilmaturity. The Company is not required to make any principal payments until the 2015 Medium-Term Senior Notesare fully due in July 2015. The 2015 Medium-Term Senior Notes are guaranteed by certain of the Company’ssubsidiaries and may be redeemed, at the election of the Company, in whole at any time or in part from time to time,at a redemption price equal to the greater of (1) 100% of their principal amount; or (2) the present value of theremaining scheduled payments on the notes being redeemed discounted on a semiannual basis at the Treasury Rateplus 0.25%, plus, in each case, accrued and unpaid interest.
F-33

M.D.C. HOLDINGS, INC.Notes to Consolidated Financial Statements (Continued)
The Company’s total debt obligations relating to senior notes at December 31, 2007 and 2006 are as follows (inthousands).
December 31,
2007 2006
7% Senior Notes due 2012 . . . . . . . . . . . . . . . . . . . . . . . . . . . . . . . . . $ 149,117 $ 148,96351⁄2% Senior Notes due 2013 . . . . . . . . . . . . . . . . . . . . . . . . . . . . . . . 349,449 349,36153⁄8% Medium-Term Senior Notes due 2014 . . . . . . . . . . . . . . . . . . . 248,801 248,66353⁄8% Medium-Term Senior Notes due 2015 . . . . . . . . . . . . . . . . . . . 249,724 249,695
Total Senior Notes, net . . . . . . . . . . . . . . . . . . . . . . . . . . . . . . . . . . $ 997,091 $ 996,682
The Company’s senior notes are not secured and, while the senior notes indentures contain some restrictions onsecured debt and other transactions, they do not contain financial covenants. The senior notes are fully andunconditionally guaranteed on an unsecured basis, jointly and severally, by most of the Company’s homebuildingsegment subsidiaries. The Company believes that it is in compliance with these representations, warranties andcovenants, and the Company is not aware of any covenant violations.
11. Commitments and Contingencies
The Company is subject to risks and uncertainties common to the homebuilding industry, including (1) cyclicalmarkets sensitive to changes in general and local economic conditions; (2) volatility of interest rates, which affectshomebuilding demand and may affect credit availability; (3) seasonal nature of the business due to weather-relatedfactors; (4) significant fluctuations in the price of building materials, land and subcontract labor; (5) counter-partynon-performance risk associated with performance bonds; (6) competition; (7) the availability and cost ofperformance bonds and insurance covering risks associated with the Company’s business; (8) slow growth initiatives;(9) building moratoria; (10) governmental regulation, including the interpretation of tax, labor and environmentallaws; and (11) changes in consumer confidence and preferences.
To reduce exposure to fluctuations in interest rates, HomeAmerican makes commitments to originate (buy) andsell mortgage loans and mortgage-backed securities. The Company had $37.6 million in mortgage loans under interestrate lock commitments at an average interest rate of 6.0%. In addition, the Company had $100.1 million of mortgageloans in inventory available for sale at December 31, 2007.
In the normal course of business, the Company is a defendant in cases primarily relating to construction defects.These cases seek relief from the Company under various theories, including breach of implied and express warranty,negligence, strict liability, misrepresentation and violation of consumer protection statutes. The Company hasreserved for losses that may be incurred with respect to these cases based upon information provided to it by its legalcounsel, including counsel’s on-going evaluation of the merits of the claims and defenses and the likelihood of theCompany prevailing in these cases. Due to uncertainties in the estimation process, actual results could differ fromthose estimates. At December 31, 2007 and 2006, the Company had legal reserves of $12.4 million and $10.0 million,respectively. In the opinion of management, the outcome of these matters will not have a material adverse effect onthe financial condition, results of operations or cash flows of the Company.
F-34
M.D.C. HOLDINGS, INC.Notes to Consolidated Financial Statements (Continued)
MDC leases office space, equipment and furniture and fixtures for its model homes under non-cancelableoperating leases. Rent expense under cancelable and non-cancelable operating leases totaled $21.3 million, $29.6million and $22.1 million in 2007, 2006 and 2005, respectively. The table below shows the future minimum paymentsunder non-cancelable operating leases at December 31, 2007 (in thousands).
2008 . . . . . . . . . . . . . . . . . . . . . . . . . . . . . . . . . . . . . . . . . . . . . . . . . . . . . . . . . . . . . . . $ 14,7212009 . . . . . . . . . . . . . . . . . . . . . . . . . . . . . . . . . . . . . . . . . . . . . . . . . . . . . . . . . . . . . . . 11,5902010 . . . . . . . . . . . . . . . . . . . . . . . . . . . . . . . . . . . . . . . . . . . . . . . . . . . . . . . . . . . . . . . 7,6222011 . . . . . . . . . . . . . . . . . . . . . . . . . . . . . . . . . . . . . . . . . . . . . . . . . . . . . . . . . . . . . . . 5,4222012 . . . . . . . . . . . . . . . . . . . . . . . . . . . . . . . . . . . . . . . . . . . . . . . . . . . . . . . . . . . . . . . 4,500Thereafter . . . . . . . . . . . . . . . . . . . . . . . . . . . . . . . . . . . . . . . . . . . . . . . . . . . . . . . . . . . 11,740
Total . . . . . . . . . . . . . . . . . . . . . . . . . . . . . . . . . . . . . . . . . . . . . . . . . . . . . . . . . . . . . $ 55,595
The Company often is required to obtain performance bonds and letters of credit in support of its relatedobligations primarily with respect to subdivision improvement, homeowners association dues and start-up expenses,warranty work, contractors license fees and Deposits. At December 31, 2007, the Company had issued andoutstanding performance bonds and letters of credit totaling $281.6 million and $51.2 million, respectively, including$16.4 million in letters of credit issued by HomeAmerican. In the event any such performance bonds or letters ofcredit issued by third parties are called, MDC would be obligated to reimburse the issuer of the performance bond orletter of credit.
12. Stockholders’ Equity
Common Stock Repurchase Program. At December 31, 2007, the Company was authorized to repurchase up to4,000,000 shares of its common stock. The Company did not repurchase any shares of its common stock during theyears ended December 31, 2007, 2006 or 2005. At December 31, 2007 and 2006, the Company held 31,000 and14,000 shares of treasury stock with average costs of $21.09 and $46.97 per share, respectively.
13. Equity Incentive Plans
A summary of the Company’s equity incentive plans follows.
Employee Equity Incentive Plans. In April 1993, the Company adopted the Employee Equity Incentive Plan (the“Employee Plan”). The Employee Plan provided for an initial authorization of 2,100,000 shares of MDC commonstock for issuance thereunder, subject to adjustment for stock dividends and stock splits, plus an additional annualauthorization equal to 10% of the then authorized shares of MDC common stock under the Employee Plan as of eachsucceeding annual anniversary of the date the Employee Plan was adopted. Under the Employee Plan, the Companycould grant awards of restricted stock, incentive and non-statutory stock options and dividend equivalents, or anycombination thereof, to officers and employees of the Company or any of its subsidiaries. The incentive andnon-statutory stock options granted under the Employee Plan are exercisable at prices not less than the market valueon the date of grant over periods of up to six years. The Company’s ability to make further grants under the EmployeePlan terminated pursuant to its terms on April 20, 2003.
Effective March 2001, the Company adopted the M.D.C. Holdings, Inc. 2001 Equity Incentive Plan (the “EquityIncentive Plan”). A total of 8,433,693 shares of MDC common stock are reserved for issuance under the Equity
F-35

M.D.C. HOLDINGS, INC.Notes to Consolidated Financial Statements (Continued)
Incentive Plan, of which 3,035,363 and 2,636,252 were available for grant as of December 31, 2007 and 2006,respectively. The Equity Incentive Plan provides for the grant of non-qualified stock options, incentive stock options,stock appreciation rights, restricted stock, stock units and other stock grants to employees of the Company. Incentivestock options granted under the Equity Incentive Plan must have an exercise price that is at least equal to the fairmarket value of the Company’s common stock on the date the incentive stock option is granted. Non-qualified optionawards generally vest over periods of up to seven years and expire in ten years. Restricted stock awards are grantedwith vesting terms of up to five years. During the year ended December 31, 2007, the Company granted options topurchase 460,000 shares of MDC common stock and 276,165 shares of restricted stock under the Equity IncentivePlan which vest over periods up to five years and in certain circumstances, contain ownership transfer restrictions fortwo years after vesting has occurred. In 2006, the Company granted options to purchase 707,500 shares of MDCcommon stock, and 37,371 shares of restricted stock were awarded under the Equity Incentive Plan, which vest overperiods up to five years.
Director Equity Incentive Plan. Effective March 2001, the Company adopted the M.D.C. Holdings, Inc. StockOption Plan for Non-Employee Directors (the “Director Stock Option Plan”). Under the Director Stock Option Plan,non-employee directors of the Company are granted non-qualified stock options. At December 31, 2007, a total of1,532,666 shares of MDC common stock are reserved for issuance under the Director Stock Option Plan, of which353,507 and 364,174 were available for grant as of December 31, 2007 and 2006, respectively. Pursuant to theDirector Stock Option Plan, on October 1 of each year, each non-employee director of the Company is grantedoptions to purchase 25,000 shares of MDC common stock. Each option granted under the Director Stock Option Planvests immediately and expires ten years from the date of grant. The option exercise price must be equal to the fairmarket value (as defined in the plan) of the Company’s common stock on the date of grant of the option. In October2003, the Director Stock Option Plan, which was approved by the shareowners on May 21, 2001, was amended toterminate on May 21, 2011.
14. Stock-Based Compensation
Determining Fair Value of Share-Based Payment Awards. As part of the adoption of SFAS 123(R), theCompany examined its historical pattern of option exercises in an effort to determine if there were any discernableactivity patterns based on certain employee and non-employee populations. Based upon this evaluation, the Companyidentified three distinct populations: (1) executives consisting of the Company’s Chief Executive Officer, ChiefOperating Officer, Chief Financial Officer and General Counsel (collectively, the “Executives”); (2) non-Executiveemployees (“Non-Executives”); and (3) non-employee members of the Company’s board of directors (“Directors”).Accordingly, pursuant to SFAS 123(R), during 2007 and 2006, the Company used separate Black-Scholes optionpricing model assumptions for each of the aforementioned employee and non-employee populations. The fair valuesfor stock options granted for the years ended December 31, 2007, 2006 and 2005 were estimated using the Black-Scholes option pricing model with the following weighted-average assumptions.
Year Ended December 31,
2007 2006 2005
Expected volatility . . . . . . . . . . . . . . . . . . . . . . . . . . . . . . . . . . . . . . . . . . . . . . . . . . . . . . . . . 38.1% 35.8% 45.6%Risk free interest rate . . . . . . . . . . . . . . . . . . . . . . . . . . . . . . . . . . . . . . . . . . . . . . . . . . . . . . . 4.1% 4.7% 4.4%Dividend yield rate . . . . . . . . . . . . . . . . . . . . . . . . . . . . . . . . . . . . . . . . . . . . . . . . . . . . . . . . . 2.6% 2.0% 1.3%Weighted-average expected lives of options . . . . . . . . . . . . . . . . . . . . . . . . . . . . . . . . . . . . . 7.5 yrs. 6.8 yrs. 5.9 yrs.
F-36

M.D.C. HOLDINGS, INC.Notes to Consolidated Financial Statements (Continued)
Based on calculations using the Black-Scholes option pricing model, the weighted-average grant date fair valuesof stock options granted during 2007, 2006 and 2005 were $12.98, $19.14 and $26.95, respectively.
The expected volatility is based on the historical volatility in the price of the Company’s common stock over themost recent period commensurate with the estimated expected life of the Company’s stock options, adjusted for theimpact of unusual fluctuations not reasonably expected to recur and other relevant factors. The risk-free interest rateassumption is determined based upon observed interest rates appropriate for the expected term of the Company’semployee stock options. The dividend yield assumption is based on the Company’s history and expectation ofdividend payouts. The expected life of employee stock options represents the weighted-average period for which thestock options are expected to remain outstanding and are derived primarily from historical exercise patterns.
SFAS 123(R) requires an annual forfeiture rate to be estimated at the time of grant for all share-based paymentawards granted subsequent to December 31, 2005, and revised, if necessary, in subsequent periods if the actualforfeiture rate differs from the Company’s estimate. Additionally, in accordance with SFAS 123(R), the Company hasestimated an annual forfeiture rate to be applied to all share-based payment awards which were unvested atDecember 31, 2005 in determining the number of awards expected to vest in the future. The Company estimated theannual forfeiture rate to be approximately 10% to 25% for share-based payment awards granted to Non-Executivesand 0% for share-based payment awards granted to Executives and Directors, based on the terms of their awards, aswell as historical forfeiture experience. In the Company’s pro forma information required under SFAS 123 for theperiods prior to 2006, the Company accounted for forfeitures as they occurred.
Stock Option Award Activity. Stock option activity under the Company’s option plans at December 31, 2007 andchanges during the year ended December 31, 2007 were as follows.
Number ofShares
Weighted-Average
Exercise Price
Weighted-Average
RemainingContractual
Life (in years)
AggregateIntrinsic Value(in thousands)
Outstanding at December 31, 2006 . . . . . 5,731,861 $ 42.73Granted - at fair market value . . . . . . . . . 430,000 $ 39.03Granted - above fair market value . . . . . . 180,000 $ 41.81Exercised . . . . . . . . . . . . . . . . . . . . . . . . . (510,353) $ 21.96Cancelled . . . . . . . . . . . . . . . . . . . . . . . . . (351,732) $ 58.09
Outstanding at December 31, 2007 . . . . . 5,479,776 $ 43.36 6.39 $ 30,285
F-37

M.D.C. HOLDINGS, INC.Notes to Consolidated Financial Statements (Continued)
The following table summarizes information associated with stock options granted to Executives,Non-Executives and Directors that are vested at December 31, 2007, as well as stock options granted but unvested atDecember 31, 2007 that the Company expects will vest in future reporting periods.
Vested and Expected to Vest at December 31, 2007
Number ofShares
Weighted-Average
Exercise Price
Weighted-Average
RemainingContractual
Life (in years)
AggregateIntrinsic Value(in thousands)
Executives . . . . . . . . . . . . . . . . . . . . 4,323,915 $ 40.65Non-Executives . . . . . . . . . . . . . . . . 429,088 $ 54.78Directors . . . . . . . . . . . . . . . . . . . . . . 616,162 $ 51.99
Total . . . . . . . . . . . . . . . . . . . . . . . . . 5,369,165 $ 43.08 6.37 $ 30,285
The following table summarizes information associated with stock options granted to Executives,Non-Executives and Directors that are exercisable at December 31, 2007.
Exercisable at December 31, 2007
Number ofShares
Weighted-Average
Exercise Price
Weighted-Average
RemainingContractual
Life (in years)
AggregateIntrinsic Value(in thousands)
Executives . . . . . . . . . . . . . . . . . . . . 2,102,279 $ 25.67Non-Executives . . . . . . . . . . . . . . . . 222,454 $ 50.77Directors . . . . . . . . . . . . . . . . . . . . . . 616,162 $ 51.99
Total . . . . . . . . . . . . . . . . . . . . . . . . . 2,940,895 $ 33.08 5.05 $ 30,285
The aggregate intrinsic values in the tables above represent the total pre-tax intrinsic values (the differencebetween the closing price of MDC’s common stock on the last trading day of fiscal 2007 and the exercise price,multiplied by the number of in-the-money stock option shares) that would have been received by the option holdershad all outstanding stock options been exercised on December 31, 2007. The total intrinsic value of options exercisedduring the year ended December 31, 2007, 2006 and 2005 was $18.0 million, $11.5 million and $80.0 million,respectively.
F-38

M.D.C. HOLDINGS, INC.Notes to Consolidated Financial Statements (Continued)
The following table summarizes information associated with outstanding and exercisable stock options atDecember 31, 2007.
Options Outstanding Options Exercisable
Range of Exercise PriceNumber
Outstanding
Weighted-Average
RemainingContractual
Life (in years)
Weighted-Average
Exercise PriceNumber
Exercisable
Weighted-Average
Exercise Price
$ 18.47 - $ 23.35 . . . . . . . . . . . . . . . . . . . . . . 1,556,781 4.16 $ 19.41 1,556,781 $ 19.41$ 23.36 - $ 38.01 . . . . . . . . . . . . . . . . . . . . . . 536,220 5.34 $ 32.55 256,220 $ 26.59$ 38.02 - $ 46.60 . . . . . . . . . . . . . . . . . . . . . . 1,263,435 7.27 $ 43.83 661,724 $ 43.83$ 46.61 - $ 62.76 . . . . . . . . . . . . . . . . . . . . . . 1,310,040 7.93 $ 59.74 186,520 $ 58.85$ 62.77 - $ 79.22 . . . . . . . . . . . . . . . . . . . . . . 813,300 7.52 $ 69.21 279,650 $ 72.51
Total . . . . . . . . . . . . . . . . . . . . . . . . . . . 5,479,776 6.39 $ 43.36 2,940,895 $ 33.08
Total stock-based compensation expense relating to stock options granted by the Company was $11.3 millionand $15.0 million for the years ended December 31, 2007 and 2006, respectively. As of December 31, 2007,$42.5 million of total unrecognized compensation cost related to stock options is expected to be recognized as anexpense by the Company in the future over a weighted-average period of 3.72 years.
The Company received cash proceeds from the exercise of stock options of $11.2 million, $7.3 million and $26.3million during the years ended December 31, 2007, 2006 and 2005, respectively. The tax benefit realized for stockoptions exercised during the years ended December 31, 2007, 2006 and 2005, net of the reversal of tax benefits ofstock options exercised in previous years, was $(32.6) million, $4.4 million and $30.0 million, respectively. TheCompany will issue previously unissued shares and/or treasury stock upon the exercise of stock options.
Restricted and Unrestricted Stock Award Activity. Non-vested restricted stock awards at December 31, 2007 andchanges during the year ended December 31, 2007 were as follows.
Number ofShares
Weighted-Average GrantDate Fair Value
Non-vested at December 31, 2006 . . . . . . . . . . . . . . . . . . . . . . . . . . . 47,125 $ 62.11Granted . . . . . . . . . . . . . . . . . . . . . . . . . . . . . . . . . . . . . . . . . . . . . . . . 276,165 $ 42.71Vested . . . . . . . . . . . . . . . . . . . . . . . . . . . . . . . . . . . . . . . . . . . . . . . . . (28,080) $ 57.78Forfeited . . . . . . . . . . . . . . . . . . . . . . . . . . . . . . . . . . . . . . . . . . . . . . . (16,845) $ 61.58
Non-vested at December 31, 2007 . . . . . . . . . . . . . . . . . . . . . . . . . . . 278,365 $ 43.33
Total stock-based compensation expense relating to restricted stock and unrestricted stock awards was$1.2 million, $1.6 million and $1.2 million for the years ended December 31, 2007, 2006 and 2005, respectively. AtDecember 31, 2007, there was $10.5 million of unrecognized stock-based compensation expense related to non-vestedrestricted stock awards that is expected to be recognized as an expense by the Company in the future over a weighted-average period of 4.62 years. The total intrinsic value of restricted stock awards which vested during each of the yearsended December 31, 2007 and 2006 was $1.7 million and was $1.2 million during the year ended December 31, 2005.
F-39
M.D.C. HOLDINGS, INC.Notes to Consolidated Financial Statements (Continued)
15. Interest Activity
The Company capitalizes interest incurred on its senior notes and Homebuilding Line during the period of activedevelopment and through the completion of construction of its homebuilding inventories. Interest incurred on thesenior notes or Homebuilding Line that is not capitalized, if any, and interest expense on the Mortgage Line isincluded in interest income, net, which is a component of other revenue in the Consolidated Statements of Operations.All interest incurred during 2007, 2006 and 2005 on the senior notes and Homebuilding Line was capitalized. Interestactivity is shown below (in thousands).
Year Ended December 31,
2007 2006 2005
Total Interest IncurredCorporate and homebuilding segments . . . . . . . . . . . . . . . . . . . . . . . . . . $ 57,791 $ 58,141 $ 51,872Financial Services and Other . . . . . . . . . . . . . . . . . . . . . . . . . . . . . . . . . . 1,581 8,816 3,850
Total interest incurred . . . . . . . . . . . . . . . . . . . . . . . . . . . . . . . . . . . . . . . $ 59,372 $ 66,957 $ 55,722
Total Interest CapitalizedInterest capitalized in homebuilding inventory, beginning of year . . . . . $ 50,655 $ 41,999 $ 24,220Interest capitalized, net of interest expense . . . . . . . . . . . . . . . . . . . . . . . 57,791 58,141 51,872Previously capitalized interest included in home cost of sales . . . . . . . . (54,959) (49,485) (34,093)
Interest capitalized in homebuilding inventory, end of year . . . . . . . . . . $ 53,487 $ 50,655 $ 41,999
Interest income and interest expense are shown in the table below (in thousands).
Year Ended December 31,
2007 2006 2005
Interest Income, NetInterest income . . . . . . . . . . . . . . . . . . . . . . . . . . . . . . . . . . . . . . . . . . . . . $ 38,903 $ 17,119 $ 8,500Interest expense, net of interest capitalized . . . . . . . . . . . . . . . . . . . . . . . 1,581 8,816 3,850
Total interest income, net . . . . . . . . . . . . . . . . . . . . . . . . . . . . . . . . . . . . . $ 37,322 $ 8,303 $ 4,650
16. Disclosures About Fair Value of Financial Instruments
The following methods and assumptions were used to estimate the fair value of each class of financialinstruments at December 31, 2007 and 2006.
Cash and Cash Equivalents. For cash and cash equivalents, the fair value approximates carrying value.
Mortgage Loans Held in Inventory, Net. The Company generally purchases forward commitments to delivermortgage loans held for sale. Mortgage loans held in inventory that have no forward commitments are stated at thelower of aggregate cost, as adjusted for fair value changes in exercised interest rate locks and deferred fees and costs,or market value on an aggregate basis. The fair value approximates carrying value.
Lines of Credit. The Company’s lines of credit are at floating rates or at fixed rates that approximate currentmarket rates and have relatively short-term maturities. The fair value approximates carrying value.
F-40
M.D.C. HOLDINGS, INC.Notes to Consolidated Financial Statements (Continued)
Senior Notes. The estimated fair value of the senior notes in the following table are based on dealer quotes (inthousands).
December 31, 2007 December 31, 2006
RecordedAmount
Estimated FairValue
RecordedAmount
Estimated FairValue
7% Senior Notes due 2012 . . . . . . . . . . . . . . . . . . . . . . . . . . $ 149,117 $ 160,950 $ 148,963 $ 157,29051⁄2% Senior Notes due 2013 . . . . . . . . . . . . . . . . . . . . . . . . $ 349,449 $ 351,715 $ 349,361 $ 334,05353⁄8% Medium Term Senior Notes due 2014 . . . . . . . . . . . . $ 248,801 $ 247,625 $ 248,663 $ 232,65053⁄8% Medium Term Senior Notes due 2015 . . . . . . . . . . . . $ 249,724 $ 243,675 $ 249,695 $ 232,437
17. Subsequent Event
On January 24, 2008, the Company entered into a Second Amendment to its Second Amended and RestatedCredit Agreement, dated as of March 22, 2006. The Second Amendment: (1) modified the definition of LeverageRatio (for all purposes other than pricing determination) to allow for credit of unrestricted cash in excess of $50million but not to exceed $500 million; (2) reset the consolidated tangible net worth base amount of the ConsolidatedTangible Net Worth Test to $1.055 billion and reset the date from which subsequent increases from quarterly netincome and net proceeds from equity issues are measured to after December 31, 2007; and (3) reset the date in theConsolidated Tangible Net Worth Floor from which subsequent increases from quarterly net income and net proceedsfrom equity issues are measured to after December 31, 2007. Additionally, no changes were made to the amount ofthe Commitment under the Homebuilding Line or the pricing grid set forth in the credit agreement.
18. Supplemental Guarantor Information
The Company’s senior notes and Homebuilding Line are fully and unconditionally guaranteed on an unsecuredbasis, jointly and severally, by the following subsidiaries (collectively, the “Guarantor Subsidiaries”), which are100%-owned subsidiaries of the Company.
• M.D.C. Land Corporation• RAH of Florida, Inc.• Richmond American Construction, Inc.• Richmond American Homes of Arizona, Inc.• Richmond American Homes of California, Inc.• Richmond American Homes of Colorado, Inc.• Richmond American Homes of Delaware, Inc.• Richmond American Homes of Florida, LP• Richmond American Homes of Illinois, Inc.• Richmond American Homes of Maryland, Inc.• Richmond American Homes of Nevada, Inc.• Richmond American Homes of New Jersey, Inc.• Richmond American Homes of Pennsylvania, Inc.• Richmond American Homes of Utah, Inc.• Richmond American Homes of Virginia, Inc.• Richmond American Homes of West Virginia, Inc.
F-41

M.D.C. HOLDINGS, INC.Notes to Consolidated Financial Statements (Continued)
Subsidiaries that do not guarantee the Company’s senior notes and Homebuilding Line (collectively, the “Non-Guarantor Subsidiaries”) include:
• American Home Insurance• American Home Title• HomeAmerican• StarAmerican• Allegiant• RAH of Texas, LP (as of January 2007)• RAH Texas Holdings, LLC (as of January 2007)• Richmond American Homes of Texas, Inc. (as of January 2007)
The Company has determined that separate, full financial statements of the Guarantor Subsidiaries would not bematerial to investors and, accordingly, supplemental financial information for the Guarantor Subsidiaries is presented.Additionally, the Company records benefit from and provision for income taxes for the guarantor and non-guarantorsubsidiaries in the Supplemental Condensed Combining Statements of Operations based upon the Company’sconsolidated effective tax rate. The Company presents its net deferred tax assets as a component of other assets ofMDC in the Supplemental Condensed Combining Balance Sheets.
The Supplemental Condensed Combining Statements of Operations for the years ended December 31, 2006 and2005 previously disclosed inter-company cost of capital charges by the Company’s Corporate segment to itshomebuilding segments. The Supplemental Condensed Combining Statement of Operations for the years endedDecember 31, 2006 and 2005 have been reclassified to eliminate this inter-company cost of capital charge and therelated income tax effect in order to conform the presentation to the Company’s segment reporting included in Note 3of the Consolidated Financial Statements.
F-42

M.D.C. HOLDINGS, INC.Notes to Consolidated Financial Statements (Continued)
Supplemental Condensed Combining Balance SheetDecember 31, 2007
(In thousands)
MDCGuarantor
Subsidiaries
Non-Guarantor
SubsidiariesEliminating
EntriesConsolidated
MDC
ASSETSCash and cash equivalents . . . . . . . . . . . $ 980,775 $ 3,105 $ 20,883 $ - $ 1,004,763Restricted cash . . . . . . . . . . . . . . . . . . . . - 1,898 - - 1,898Receivables
Home sales receivables . . . . . . . . . . . - 33,647 - - 33,647Income taxes receivable, net . . . . . . . (80,107) 120,591 (3,496) - 36,988Other receivables . . . . . . . . . . . . . . . . 4,880 7,712 49,461 (45,257) 16,796
Mortgage loans held in inventory . . . . . - - 100,144 - 100,144Inventories, netHousing completed or under
construction . . . . . . . . . . . . . . . . . . . . - 902,221 - - 902,221Land and land under development . . . - 554,336 - - 554,336
Investment in and advances to parentand subsidiaries . . . . . . . . . . . . . . . . . (49,622) 136,853 3,116 (90,347) -
Other assets . . . . . . . . . . . . . . . . . . . . . . 206,244 95,072 4,128 - 305,444
Total Assets . . . . . . . . . . . . . . . . . . $ 1,062,170 $ 1,855,435 $ 174,236 $ (135,604) $ 2,956,237
LIABILITIESAccounts payable and related party
liabilities . . . . . . . . . . . . . . . . . . . . . . $ 47,610 $ 70,539 $ 741 $ (45,257) $ 73,633Accrued liabilities . . . . . . . . . . . . . . . . . 77,468 204,768 57,117 - 339,353Advances and notes payable to parent
and subsidiaries . . . . . . . . . . . . . . . . . (1,536,012) 1,539,868 (3,856) - -Homebuilding line of credit . . . . . . . . . . - - - - -Mortgage line of credit . . . . . . . . . . . . . - - 70,147 - 70,147Senior notes, net . . . . . . . . . . . . . . . . . . 997,091 - - - 997,091
Total Liabilities . . . . . . . . . . . . . . . (413,843) 1,815,175 124,149 (45,257) 1,480,224
STOCKHOLDERS’ EQUITY . . . . . . . . 1,476,013 40,260 50,087 (90,347) 1,476,013
Total Liabilities and Stockholders’Equity . . . . . . . . . . . . . . . . . . . . . . . . . $ 1,062,170 $ 1,855,435 $ 174,236 $ (135,604) $ 2,956,237
F-43

M.D.C. HOLDINGS, INC.Notes to Consolidated Financial Statements (Continued)
Supplemental Condensed Combining Balance SheetDecember 31, 2006
(In thousands)
MDCGuarantor
Subsidiaries
Non-Guarantor
SubsidiariesEliminating
EntriesConsolidated
MDC
ASSETSCash and cash equivalents . . . . . . . . . . . . $ 484,682 $ 6,400 $ 16,865 $ - $ 507,947Restricted cash . . . . . . . . . . . . . . . . . . . . . - 2,641 - - 2,641Home sales and other receivables . . . . . . . - 129,559 53,379 (39,002) 143,936Mortgage loans held in inventory . . . . . . . - - 212,903 - 212,903Inventories, net
Housing completed or underconstruction . . . . . . . . . . . . . . . . . . . - 1,178,671 - - 1,178,671
Land and land under development . . . . - 1,575,158 - - 1,575,158Investment in and advances to parent
and subsidiaries . . . . . . . . . . . . . . . . 404,313 1,068 (37,782) (367,599) -Other assets . . . . . . . . . . . . . . . . . . . . . . 169,961 113,383 5,275 - 288,619
Total Assets . . . . . . . . . . . . . . . . . . . $ 1,058,956 $ 3,006,880 $ 250,640 $ (406,601) $ 3,909,875
LIABILITIESAccounts payable and related party
liabilities . . . . . . . . . . . . . . . . . . . . . . . . $ 41,458 $ 168,401 $ 1,604 $ (38,057) $ 173,406Accrued liabilities . . . . . . . . . . . . . . . . . . . 93,755 271,482 54,661 (945) 418,953Advances and notes payable to parent and
subsidiaries . . . . . . . . . . . . . . . . . . . . . . (2,114,146) 2,103,373 10,773 - -Income taxes payable . . . . . . . . . . . . . . . . (120,675) 132,609 16,551 - 28,485Homebuilding line of credit . . . . . . . . . . . - - - - -Mortgage line of credit . . . . . . . . . . . . . . . - - 130,467 - 130,467Senior notes, net . . . . . . . . . . . . . . . . . . . . 996,682 - - - 996,682
Total Liabilities . . . . . . . . . . . . . . . . . . (1,102,926) 2,675,865 214,056 (39,002) 1,747,993
STOCKHOLDERS’ EQUITY . . . . . . . . . 2,161,882 331,015 36,584 (367,599) 2,161,882
Total Liabilities and Stockholders’Equity . . . . . . . . . . . . . . . . . . . . . . . . . . $ 1,058,956 $ 3,006,880 $ 250,640 $ (406,601) $ 3,909,875
F-44
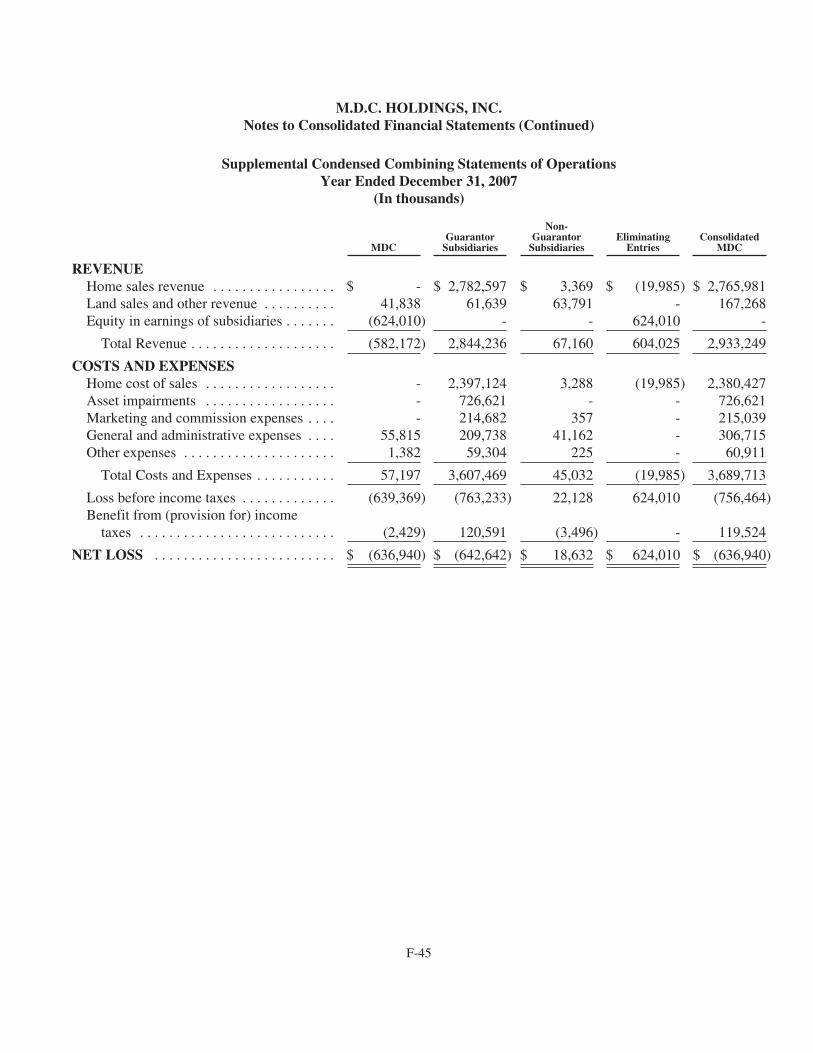
M.D.C. HOLDINGS, INC.Notes to Consolidated Financial Statements (Continued)
Supplemental Condensed Combining Statements of OperationsYear Ended December 31, 2007
(In thousands)
MDCGuarantor
Subsidiaries
Non-Guarantor
SubsidiariesEliminating
EntriesConsolidated
MDC
REVENUEHome sales revenue . . . . . . . . . . . . . . . . . $ - $ 2,782,597 $ 3,369 $ (19,985) $ 2,765,981Land sales and other revenue . . . . . . . . . . 41,838 61,639 63,791 - 167,268Equity in earnings of subsidiaries . . . . . . . (624,010) - - 624,010 -
Total Revenue . . . . . . . . . . . . . . . . . . . . (582,172) 2,844,236 67,160 604,025 2,933,249
COSTS AND EXPENSESHome cost of sales . . . . . . . . . . . . . . . . . . - 2,397,124 3,288 (19,985) 2,380,427Asset impairments . . . . . . . . . . . . . . . . . . - 726,621 - - 726,621Marketing and commission expenses . . . . - 214,682 357 - 215,039General and administrative expenses . . . . 55,815 209,738 41,162 - 306,715Other expenses . . . . . . . . . . . . . . . . . . . . . 1,382 59,304 225 - 60,911
Total Costs and Expenses . . . . . . . . . . . 57,197 3,607,469 45,032 (19,985) 3,689,713
Loss before income taxes . . . . . . . . . . . . . (639,369) (763,233) 22,128 624,010 (756,464)Benefit from (provision for) income
taxes . . . . . . . . . . . . . . . . . . . . . . . . . . . (2,429) 120,591 (3,496) - 119,524
NET LOSS . . . . . . . . . . . . . . . . . . . . . . . . . $ (636,940) $ (642,642) $ 18,632 $ 624,010 $ (636,940)
F-45
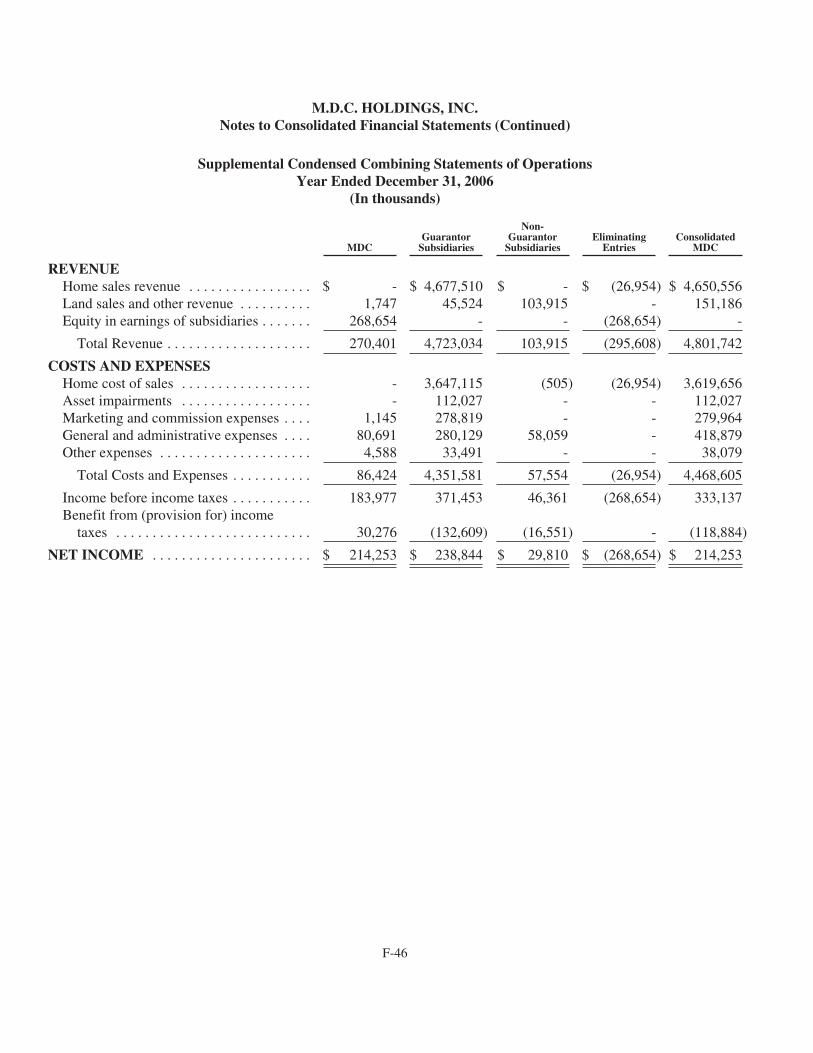
M.D.C. HOLDINGS, INC.Notes to Consolidated Financial Statements (Continued)
Supplemental Condensed Combining Statements of OperationsYear Ended December 31, 2006
(In thousands)
MDCGuarantor
Subsidiaries
Non-Guarantor
SubsidiariesEliminating
EntriesConsolidated
MDC
REVENUEHome sales revenue . . . . . . . . . . . . . . . . . $ - $ 4,677,510 $ - $ (26,954) $ 4,650,556Land sales and other revenue . . . . . . . . . . 1,747 45,524 103,915 - 151,186Equity in earnings of subsidiaries . . . . . . . 268,654 - - (268,654) -
Total Revenue . . . . . . . . . . . . . . . . . . . . 270,401 4,723,034 103,915 (295,608) 4,801,742
COSTS AND EXPENSESHome cost of sales . . . . . . . . . . . . . . . . . . - 3,647,115 (505) (26,954) 3,619,656Asset impairments . . . . . . . . . . . . . . . . . . - 112,027 - - 112,027Marketing and commission expenses . . . . 1,145 278,819 - - 279,964General and administrative expenses . . . . 80,691 280,129 58,059 - 418,879Other expenses . . . . . . . . . . . . . . . . . . . . . 4,588 33,491 - - 38,079
Total Costs and Expenses . . . . . . . . . . . 86,424 4,351,581 57,554 (26,954) 4,468,605
Income before income taxes . . . . . . . . . . . 183,977 371,453 46,361 (268,654) 333,137Benefit from (provision for) income
taxes . . . . . . . . . . . . . . . . . . . . . . . . . . . 30,276 (132,609) (16,551) - (118,884)
NET INCOME . . . . . . . . . . . . . . . . . . . . . . $ 214,253 $ 238,844 $ 29,810 $ (268,654) $ 214,253
F-46

M.D.C. HOLDINGS, INC.Notes to Consolidated Financial Statements (Continued)
Supplemental Condensed Combining Statements of OperationsYear Ended December 31, 2005
(In thousands)
MDCGuarantor
Subsidiaries
Non-Guarantor
SubsidiariesEliminating
EntriesConsolidated
MDC
REVENUEHome sales revenue . . . . . . . . . . . . . . . . . $ - $ 4,802,875 $ - $ (10,175) $ 4,792,700Land sales and other revenue . . . . . . . . . . 1,453 10,010 88,426 - 99,889Equity in earnings of subsidiaries . . . . . . . 579,899 - - (579,899) -
Total Revenue . . . . . . . . . . . . . . . . . . . . 581,352 4,812,885 88,426 (590,074) 4,892,589
COSTS AND EXPENSESHome cost of sales . . . . . . . . . . . . . . . . . . - 3,446,709 (499) (10,175) 3,436,035Marketing and commission expenses . . . . 499 235,823 - - 236,322General and administrative expenses . . . . 111,606 236,695 52,883 - 401,184Other expenses . . . . . . . . . . . . . . . . . . . . . 8,424 1,861 - - 10,285
Total Costs and Expenses . . . . . . . . . . . 120,529 3,921,088 52,384 (10,175) 4,083,826
Income before income taxes . . . . . . . . . . . 460,823 891,797 36,042 (579,899) 808,763Benefit from (provision for) income
taxes . . . . . . . . . . . . . . . . . . . . . . . . . . . 44,900 (334,424) (13,516) - (303,040)
NET INCOME . . . . . . . . . . . . . . . . . . . . . . $ 505,723 $ 557,373 $ 22,526 $ (579,899) $ 505,723
F-47

M.D.C. HOLDINGS, INC.Notes to Consolidated Financial Statements (Continued)
Supplemental Condensed Combining Statements of Cash FlowsYear Ended December 31, 2007
(In thousands)
MDCGuarantor
Subsidiaries
Non-Guarantor
SubsidiariesEliminating
EntriesConsolidated
MDC
Net cash provided by (used in) operatingactivities . . . . . . . . . . . . . . . . . . . . . . . . . . . . $ 527,935 $ (1,949) $ 66,597 $ - $ 592,583
Net cash used in investing activities . . . . . . . 2,158 (1,346) (2,259) - (1,447)
Financing activitiesLines of credits
Advances . . . . . . . . . . . . . . . . . . . . . . . . . . 160,448 - 537,726 - 698,174Principal payments . . . . . . . . . . . . . . . . . . . (160,448) - (598,046) - (758,494)
Dividend payments . . . . . . . . . . . . . . . . . . . . (45,773) - - - (45,773)Proceeds from exercise of stock options and
excess tax benefit from stock-basedcompensation . . . . . . . . . . . . . . . . . . . . . . . 11,773 - - - 11,773
Net cash provided by (used in) financingactivities . . . . . . . . . . . . . . . . . . . . . . . . . . . . (34,000) - (60,320) - (94,320)
Net increase in cash and cash equivalents . . . 496,093 (3,295) 4,018 - 496,816Cash and cash equivalents . . . . . . . . . . . . . . .Beginning of year . . . . . . . . . . . . . . . . . . . . . . 484,682 6,400 16,865 - 507,947
End of year . . . . . . . . . . . . . . . . . . . . . . . . . . . $ 980,775 $ 3,105 $ 20,883 $ - $ 1,004,763
F-48

M.D.C. HOLDINGS, INC.Notes to Consolidated Financial Statements (Continued)
Supplemental Condensed Combining Statements of Cash FlowsYear Ended December 31, 2006
(In thousands)
MDCGuarantor
Subsidiaries
Non-Guarantor
SubsidiariesEliminating
EntriesConsolidated
MDC
Net cash provided by (used in) operatingactivities . . . . . . . . . . . . . . . . . . . . . . . . . . . . $ 325,018 $ 8,045 $ 29,985 $ - $ 363,048
Net cash used in investing activities . . . . . . . (3,022) (7,172) (27) - (10,221)
Financing activitiesLines of credits . . . . . . . . . . . . . . . . . . . . . . . .
Advances . . . . . . . . . . . . . . . . . . . . . . . . . . 450,900 - - - 450,900Principal payments . . . . . . . . . . . . . . . . . . . (450,900) - (26,065) - (476,965)
Dividend payments . . . . . . . . . . . . . . . . . . . . (44,963) - - - (44,963)Proceeds from exercise of stock options and
excess tax benefit from stock-basedcompensation . . . . . . . . . . . . . . . . . . . . . . . 11,617 - - - 11,617
Net cash provided by (used in) financingactivities . . . . . . . . . . . . . . . . . . . . . . . . . . . . (33,346) - (26,065) - (59,411)
Net increase in cash and cash equivalents . . . 288,650 873 3,893 - 293,416Cash and cash equivalents . . . . . . . . . . . . . . .Beginning of year . . . . . . . . . . . . . . . . . . . . . . 196,032 5,527 12,972 - 214,531
End of year . . . . . . . . . . . . . . . . . . . . . . . . . . . $ 484,682 $ 6,400 $ 16,865 $ - $ 507,947
F-49

M.D.C. HOLDINGS, INC.Notes to Consolidated Financial Statements (Continued)
Supplemental Condensed Combining Statements of Cash FlowsYear Ended December 31, 2005
(In thousands)
MDCGuarantor
Subsidiaries
Non-Guarantor
SubsidiariesEliminating
EntriesConsolidated
MDC
Net cash provided by (used in) operatingactivities . . . . . . . . . . . . . . . . . . . . . . . . . . . $ (426,683) $ 15,545 $ (13,791) $ - $ (424,929)
Net cash used in investing activities . . . . . . . (7,449) (15,079) (361) - (22,889)
Financing activitiesLines of credits . . . . . . . . . . . . . . . . . . . . . . .
Advances . . . . . . . . . . . . . . . . . . . . . . . . . 1,441,100 - 21,054 - 1,462,154Principal payments . . . . . . . . . . . . . . . . . . (1,441,100) - - - (1,441,100)
Proceeds from senior notes, net . . . . . . . . . . 247,605 - - - 247,605Dividend payments . . . . . . . . . . . . . . . . . . . . (33,532) - - - (33,532)Proceeds from exercise of stock options . . . 26,263 - - - 26,263
Net cash provided by (used in) financingactivities . . . . . . . . . . . . . . . . . . . . . . . . . . . 240,336 - 21,054 - 261,390
Net increase in cash and cashequivalents . . . . . . . . . . . . . . . . . . . . . . . . (193,796) 466 6,902 - (186,428)
Cash and cash equivalents . . . . . . . . . . . . . .Beginning of year . . . . . . . . . . . . . . . . . . . . . 389,828 5,061 6,070 - 400,959
End of year . . . . . . . . . . . . . . . . . . . . . . . . . . $ 196,032 $ 5,527 $ 12,972 $ - $ 214,531
F-50

Item 9. Changes in and Disagreements with Accountants on Accounting and Financial Disclosure.
None.
Item 9A. Controls and Procedures.
Conclusion Regarding the Effectiveness of Disclosure Controls and Procedures
An evaluation of the effectiveness of the design and operation of the Company’s disclosure controls andprocedures was performed under the supervision, and with the participation, of the Company’s management,including the chief executive officer and the chief financial officer. Based on that evaluation, the Company’smanagement, including the chief executive officer and chief financial officer, concluded that the Company’sdisclosure controls and procedures were effective as of the end of the period covered by this report.
Management’s Report on Internal Control Over Financial Reporting
Management is responsible for establishing and maintaining adequate internal control over financial reporting.Under the supervision and with the participation of our management, including the chief executive officer and thechief financial officer, we conducted an evaluation of the effectiveness of our internal control over financial reportingbased on the framework in Internal Control—Integrated Framework issued by the Committee of SponsoringOrganizations of the Treadway Commission. Based on our evaluation under the framework in Internal Control—Integrated Framework, management concluded that our internal control over financial reporting was effective atDecember 31, 2007.
Ernst & Young LLP, the independent registered public accounting firm that audited the consolidated financialstatements included in this annual report on Form 10-K, has issued an attestation report on the Company’s internalcontrol over financial reporting, which is included herein.
Changes in Internal Control over Financial Reporting
There were no changes in our internal control over financial reporting that occurred during the fourth quarter thathave materially affected, or are reasonably likely to materially affect, our internal control over financial reporting.
- 71 -
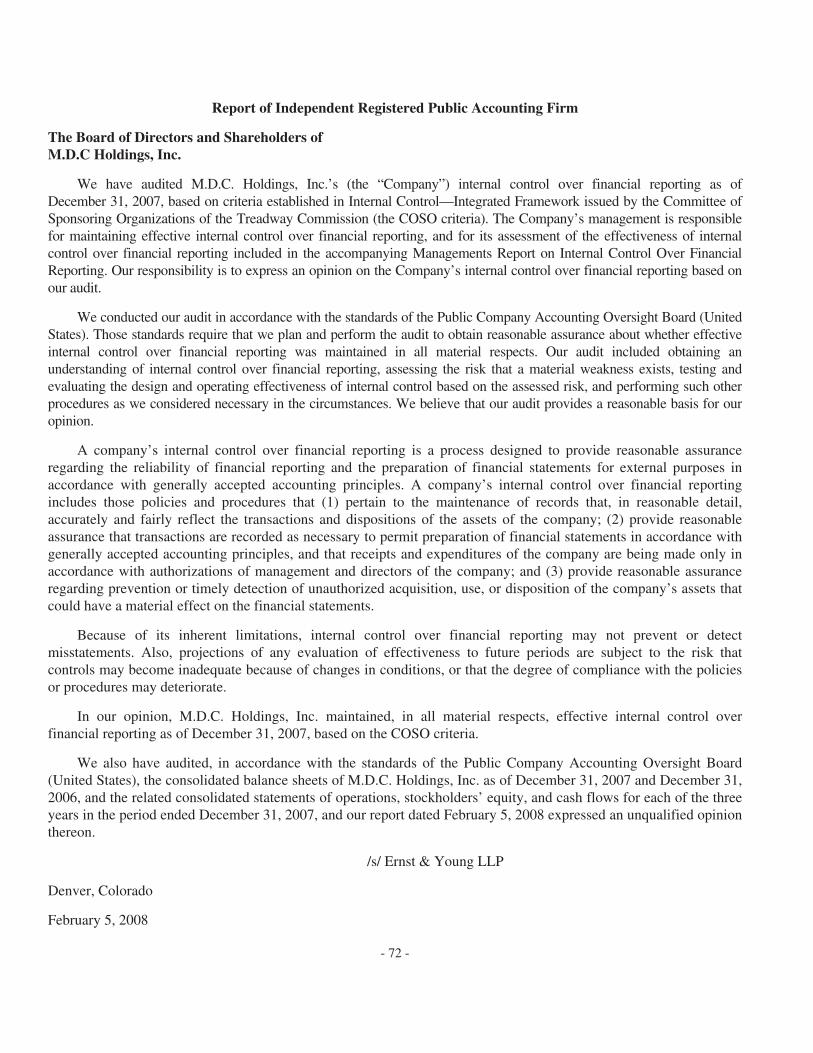
Report of Independent Registered Public Accounting Firm
The Board of Directors and Shareholders ofM.D.C Holdings, Inc.
We have audited M.D.C. Holdings, Inc.’s (the “Company”) internal control over financial reporting as ofDecember 31, 2007, based on criteria established in Internal Control—Integrated Framework issued by the Committee ofSponsoring Organizations of the Treadway Commission (the COSO criteria). The Company’s management is responsiblefor maintaining effective internal control over financial reporting, and for its assessment of the effectiveness of internalcontrol over financial reporting included in the accompanying Managements Report on Internal Control Over FinancialReporting. Our responsibility is to express an opinion on the Company’s internal control over financial reporting based onour audit.
We conducted our audit in accordance with the standards of the Public Company Accounting Oversight Board (UnitedStates). Those standards require that we plan and perform the audit to obtain reasonable assurance about whether effectiveinternal control over financial reporting was maintained in all material respects. Our audit included obtaining anunderstanding of internal control over financial reporting, assessing the risk that a material weakness exists, testing andevaluating the design and operating effectiveness of internal control based on the assessed risk, and performing such otherprocedures as we considered necessary in the circumstances. We believe that our audit provides a reasonable basis for ouropinion.
A company’s internal control over financial reporting is a process designed to provide reasonable assuranceregarding the reliability of financial reporting and the preparation of financial statements for external purposes inaccordance with generally accepted accounting principles. A company’s internal control over financial reportingincludes those policies and procedures that (1) pertain to the maintenance of records that, in reasonable detail,accurately and fairly reflect the transactions and dispositions of the assets of the company; (2) provide reasonableassurance that transactions are recorded as necessary to permit preparation of financial statements in accordance withgenerally accepted accounting principles, and that receipts and expenditures of the company are being made only inaccordance with authorizations of management and directors of the company; and (3) provide reasonable assuranceregarding prevention or timely detection of unauthorized acquisition, use, or disposition of the company’s assets thatcould have a material effect on the financial statements.
Because of its inherent limitations, internal control over financial reporting may not prevent or detectmisstatements. Also, projections of any evaluation of effectiveness to future periods are subject to the risk thatcontrols may become inadequate because of changes in conditions, or that the degree of compliance with the policiesor procedures may deteriorate.
In our opinion, M.D.C. Holdings, Inc. maintained, in all material respects, effective internal control overfinancial reporting as of December 31, 2007, based on the COSO criteria.
We also have audited, in accordance with the standards of the Public Company Accounting Oversight Board(United States), the consolidated balance sheets of M.D.C. Holdings, Inc. as of December 31, 2007 and December 31,2006, and the related consolidated statements of operations, stockholders’ equity, and cash flows for each of the threeyears in the period ended December 31, 2007, and our report dated February 5, 2008 expressed an unqualified opinionthereon.
/s/ Ernst & Young LLP
Denver, Colorado
February 5, 2008
- 72 -

Item 9B. Other Information.
None
PART III
Item 10. Directors and Executive Officers of the Registrant.
The information required with respect to directors and executive officers is incorporated herein by reference,when filed, from the Company’s proxy statement (the “Proxy Statement”) for the Annual Meeting of Shareowners tobe held on or about April 29, 2008, to be filed with the Securities and Exchange Commission pursuant toRegulation 14A under the Securities and Exchange Act of 1934, as amended (the “Exchange Act”). The informationwith respect to our audit committee financial expert is incorporated herein by reference, when filed, from the ProxyStatement.
We will provide to any shareowner or other person without charge, upon request, a copy of our Corporate Codeof Conduct, Corporate Governance Guidelines, code of ethics applicable to our chief executive officer and seniorfinancial officers and the charters for our Audit Committee, Compensation Committee and Corporate Governance/Nominating Committee. You may obtain these documents on our website at http://www.richmondamerican.com,under our Investor Relations section or by contacting our Investor Relations department at 303-977-3451. Ourintention is to post on our website any amendments to or waivers from our code of ethics applicable to our chiefexecutive officer and senior financial officers if such disclosure is required.
The information regarding filings under Section 16(a) of the Exchange Act is incorporated herein by reference,when filed, from the Company’s Proxy Statement.
Pursuant to Section 303A.12(a) of the New York Stock Exchange Listed Company Manual, the Companysubmitted the Annual CEO Certification to the NYSE on July 2, 2007
The Company also filed with the Securities and Exchange Commission the certifications required underSection 302 of the Sarbanes-Oxley Act as exhibits to its Annual Reports on Form 10-K for the years endedDecember 31, 2007 and 2006.
Item 11. Executive Compensation.
Information required to be set forth hereunder has been omitted and will be incorporated by reference, whenfiled, from the Company’s Proxy Statement.
- 73 -
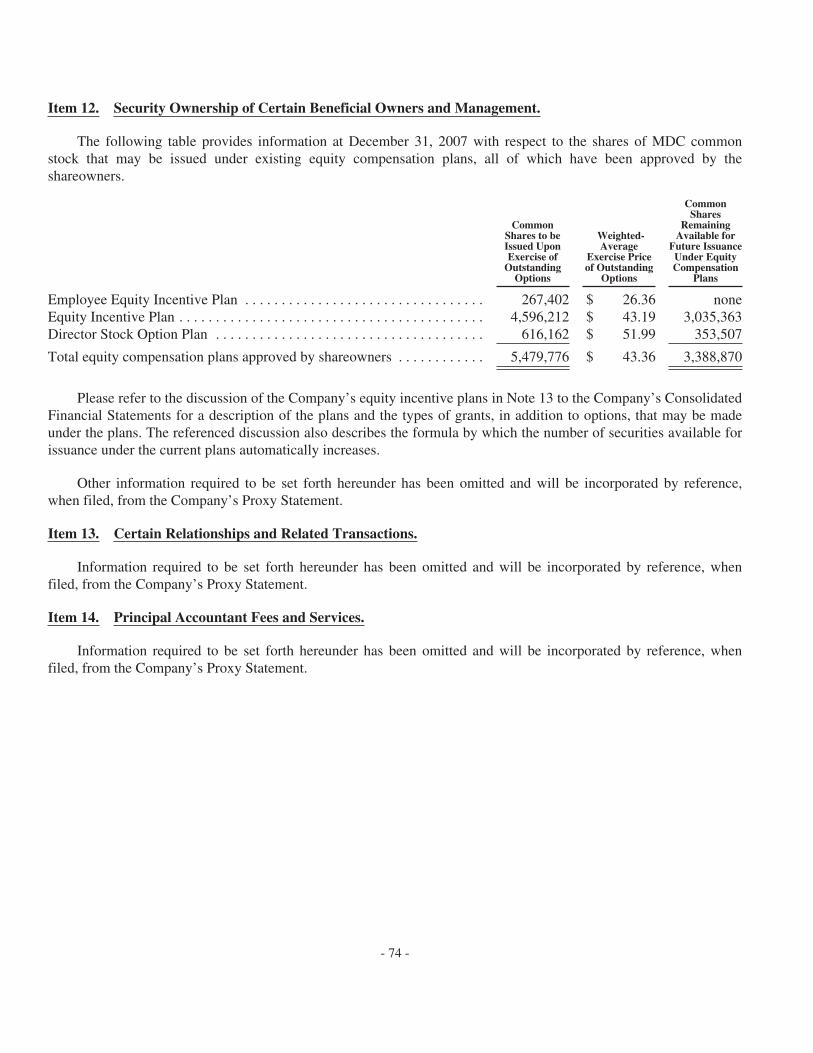
Item 12. Security Ownership of Certain Beneficial Owners and Management.
The following table provides information at December 31, 2007 with respect to the shares of MDC commonstock that may be issued under existing equity compensation plans, all of which have been approved by theshareowners.
CommonShares to beIssued UponExercise of
OutstandingOptions
Weighted-Average
Exercise Priceof Outstanding
Options
CommonShares
RemainingAvailable for
Future IssuanceUnder EquityCompensation
Plans
Employee Equity Incentive Plan . . . . . . . . . . . . . . . . . . . . . . . . . . . . . . . . . 267,402 $ 26.36 noneEquity Incentive Plan . . . . . . . . . . . . . . . . . . . . . . . . . . . . . . . . . . . . . . . . . . 4,596,212 $ 43.19 3,035,363Director Stock Option Plan . . . . . . . . . . . . . . . . . . . . . . . . . . . . . . . . . . . . . 616,162 $ 51.99 353,507
Total equity compensation plans approved by shareowners . . . . . . . . . . . . 5,479,776 $ 43.36 3,388,870
Please refer to the discussion of the Company’s equity incentive plans in Note 13 to the Company’s ConsolidatedFinancial Statements for a description of the plans and the types of grants, in addition to options, that may be madeunder the plans. The referenced discussion also describes the formula by which the number of securities available forissuance under the current plans automatically increases.
Other information required to be set forth hereunder has been omitted and will be incorporated by reference,when filed, from the Company’s Proxy Statement.
Item 13. Certain Relationships and Related Transactions.
Information required to be set forth hereunder has been omitted and will be incorporated by reference, whenfiled, from the Company’s Proxy Statement.
Item 14. Principal Accountant Fees and Services.
Information required to be set forth hereunder has been omitted and will be incorporated by reference, whenfiled, from the Company’s Proxy Statement.
- 74 -

PART IV
Item 15. Exhibits, Financial Statement Schedules.
(a)(1) Financial Statements.
The following Consolidated Financial Statements of the Company and its subsidiaries are included in Part II,Item 8.
Page
M.D.C. Holdings, Inc. and SubsidiariesReport of Independent Registered Public Accounting Firm . . . . . . . . . . . . . . . . . . . . . . . . . . . . . . . . . F-2Consolidated Balance Sheets at December 31, 2007 and December 31, 2006 . . . . . . . . . . . . . . . . . . . . F-3Consolidated Statements of Operations for each of the Three Years in the Period Ended
December 31, 2007 . . . . . . . . . . . . . . . . . . . . . . . . . . . . . . . . . . . . . . . . . . . . . . . . . . . . . . . . . . . . . . . F-4Consolidated Statements of Stockholders’ Equity for each of the Three Years in the Period Ended
December 31, 2007 . . . . . . . . . . . . . . . . . . . . . . . . . . . . . . . . . . . . . . . . . . . . . . . . . . . . . . . . . . . . . . . F-5Consolidated Statements of Cash Flows for each of the Three Years in the Period Ended
December 31, 2007 . . . . . . . . . . . . . . . . . . . . . . . . . . . . . . . . . . . . . . . . . . . . . . . . . . . . . . . . . . . . . . . F-8Notes to Consolidated Financial Statements . . . . . . . . . . . . . . . . . . . . . . . . . . . . . . . . . . . . . . . . . . . . . . F-9
(a)(2) Financial Statement Schedules.
All schedules are omitted because they are not applicable, not material, not required or the required informationis included in the applicable Consolidated Financial Statements or notes thereto.
(a)(3) Exhibits.
ExhibitNumber Description
3.1 Certificate of Amendment to the Certificate of Incorporation of M.D.C. Holdings, Inc. (hereinaftersometimes referred to as “MDC”, the “Company” or the “Registrant”), filed with the Delaware Secretaryof State on April 27, 2006, and Certificate of Incorporation, dated May 17, 1985, as amended(incorporated herein by reference to Exhibit 3.1 of the Company’s Quarterly Report on Form 10-Q datedMarch 31, 2006). *
3.2 Form of Bylaws of MDC, as amended (incorporated herein by reference to Exhibit 3.2(b) of theCompany’s Quarterly Report on Form 10-Q dated June 30, 1987). *
3.3 Form of Amendment to the Bylaws of MDC regarding indemnification adopted by its board of directorsand effective as of March 20, 1987 (incorporated herein by reference to Exhibit 3.2(a) of the Company’sQuarterly Report on Form 10-Q dated June 30, 1987). *
4.1 Indenture dated as of December 3, 2002, by and among MDC and U.S. Bank National Association(incorporated herein by reference to Exhibit 4.2 of the Company’s Form S-3/A filedSeptember 1, 2004). *
4.2 Form of Supplemental Indenture dated as of December 3, 2002, by and among MDC, the Guarantorsparty thereto and U.S. Bank National Association (including without limitation the form of 7.0% SeniorNotes due 2012 and form of Guarantee appended to such Supplemental Indenture) (incorporated hereinby reference to Exhibit 4.3 of the Company’s Current Report on Form 8-K filed December 3, 2002). *
- 75 -

ExhibitNumber Description
4.3 Form of Supplemental Indenture dated as of May 19, 2003, by and among MDC, the Guarantors partythereto and U.S. Bank National Association (including without limitation the form of 5.5% Senior Notesdue 2013 and form of Guarantee appended to such Supplemental Indenture) (incorporated herein byreference to Exhibit 4.3 of the Company’s Current Report on Form 8-K filed May 19, 2003). *
4.4 Second Supplemental Indenture (7.0% Senior Notes Due 2012), dated as of September 29, 2003, by andamong MDC, U.S. Bank National Association, as Trustee, and Richmond American Homes of Florida,LP, a Colorado limited partnership and a wholly owned subsidiary of the Company, as AdditionalGuarantor, including the Guaranty signed by the Additional Guarantor (incorporated herein by referenceto Exhibit 4.1 of the Company’s Quarterly Report on Form 10-Q dated September 30, 2003). *
4.5 Second Supplemental Indenture (5.5% Senior Notes Due 2013), dated as of September 29, 2003, by andamong MDC, U.S. Bank National Association, as Trustee, and Richmond American Homes of Florida,LP, a Colorado limited partnership and a wholly owned subsidiary of the Company, as AdditionalGuarantor, including the Guaranty signed by the Additional Guarantor (incorporated herein by referenceto Exhibit 4.2 of the Company’s Quarterly Report on Form 10-Q dated September 30, 2003). *
4.6 Third Supplemental Indenture (7.0% Senior Notes Due 2012), dated as of February 12, 2004, by andamong MDC, U.S. Bank National Association, as Trustee, and the following wholly owned subsidiariesof the Company: Richmond American Homes of Delaware, Inc., a Colorado corporation, RichmondAmerican Homes of Illinois, Inc., a Colorado corporation, Richmond American Homes of New Jersey,Inc., a Colorado corporation, and Richmond American Homes of Pennsylvania, Inc., a Coloradocorporation, as Additional Guarantors, including the Guaranty signed by the Additional Guarantors(incorporated herein by reference to Exhibit 4.6 of the Company’s Annual Report on Form 10-K datedDecember 31, 2003). *
4.7 Third Supplemental Indenture (5.5% Senior Notes Due 2013), dated as of February 12, 2004, by andamong MDC, U.S. Bank National Association, as Trustee, and the following wholly owned subsidiariesof the Company: Richmond American Homes of Delaware, Inc., a Colorado corporation, RichmondAmerican Homes of Illinois, Inc., a Colorado corporation, Richmond American Homes of New Jersey,Inc., a Colorado corporation, and Richmond American Homes of Pennsylvania, Inc., a Coloradocorporation, as Additional Guarantors, including the Guaranty signed by the Additional Guarantors(incorporated herein by reference to Exhibit 4.7 of the Company’s Annual Report on Form 10-K datedDecember 31, 2003). *
4.8 Supplemental Indenture, dated as of October 6, 2004, by and among MDC, the Guarantors party theretoand U.S. Bank National Association, as Trustee, with respect to MDC’s Medium-Term Senior Notes(incorporated herein by reference to Exhibit 10.3 of the Company’s Current Report on Form 8-K filedOctober 7, 2004). *
4.9 Pricing Supplement No. 1, dated December 6, 2004, with respect to MDC’s 5.375% Medium-TermSenior Notes due 2014 (incorporated herein by reference to the Company’s Rule 424(b)(2) filing onDecember 8, 2004). *
4.10 Pricing Supplement No. 2, dated June 28, 2005, with respect to MDC’s 5.375% Medium-Term SeniorNotes due July 1, 2015 (incorporated herein by reference to the Company’s Rule 424(b)(2) filing on June29, 2005). *
4.11 Amendment No. 1 dated as of July 20, 2005 to Supplemental Indenture dated as of October 6, 2004, withrespect to MDC’s Medium-Term Senior Notes (incorporated herein by reference to Exhibit 10.2 of theCompany’s Current Report on Form 8-K filed July 20, 2005). *
- 76 -

ExhibitNumber Description
4.12 Amendment No. 2 dated as of January 9, 2006 to Supplemental Indenture dated as of October 6, 2004,with respect to MDC’s Medium-Term Senior Notes (incorporated herein by reference to Exhibit 10.2 ofthe Company’s Current Report on Form 8-K filed January 9, 2006). *
10.1 Amended and Restated Credit Agreement dated as of January 28, 2005, among MDC as Borrower andthe Lenders party thereto and JPMorgan Chase Bank, N.A. as Administrative Agent, including form ofAmended and Restated Guaranty and form of Promissory Note (incorporated herein by reference toExhibit 10.1 of the Company’s Annual Report on Form 10-K dated December 31, 2004). *
10.2 Second Amended and Restated Credit Agreement dated as of March 22, 2006, among MDC as Borrowerand the Lenders party thereto and JPMorgan Chase Bank, N.A. as Administrative Agent, including formof Amended and Restated Guaranty and form of Promissory Note (incorporated herein by reference toExhibit 10.1 of the Company’s Current Report on Form 8-K filed March 24, 2006). *
10.3 First Amendment to Second Amended and Restated Credit Agreement, dated as of October 24, 2007(incorporated by reference to Exhibit 10.1 of the Company’s Current Report on Form 8-K filed October24, 2007). *
10.4 Second Amendment to Second Amended and Restated Credit Agreement, dated as of January 24, 2008(incorporated by reference to Exhibit 10.1 of the Company’s Current Report on Form 8-K filedJanuary 25, 2008). *
10.5 Third Amended and Restated Warehousing Credit Agreement dated as of October 23, 2003, amongHomeAmerican Mortgage Corporation and the Banks that are signatories thereto and U.S. Bank NationalAssociation, as administrative agent (incorporated herein by reference to Exhibit 10.1 of the Company’sQuarterly Report on Form 10-Q dated September 30, 2003). *
10.6 First Amendment to Third Amended and Restated Warehousing Credit Agreement dated February 27,2004 among HomeAmerican Mortgage Corporation and the Banks that are signatories thereto and U.S.Bank National Association as administrative agent (incorporated herein by reference to Exhibit 10.1 ofthe Company’s Quarterly Report on Form 10-Q dated June 30, 2004). *
10.7 Second Amendment to Third Amended and Restated Warehousing Credit Agreement, dated September28, 2004, among HomeAmerican Mortgage Corporation and the Banks that are signatories thereto andU.S. Bank National Association as administrative agent (incorporated herein by reference to Exhibit 10.1of the Company’s Quarterly Report on Form 10-Q dated September 30, 2004). *
10.8 Third Amendment to Third Amended and Restated Warehousing Credit Agreement, dated September 28,2005, among HomeAmerican Mortgage Corporation and the Banks that are signatories thereto and U.S.Bank National Association as administrative agent (incorporated herein by reference to Exhibit 99.1 ofthe Company’s Current Report on Form 8-K filed September 30, 2005). *
10.9 Fourth Amendment to Third Amended and Restated Warehousing Credit Agreement, dated December15, 2005, among HomeAmerican Mortgage Corporation and the Banks that are signatories thereto andU.S. Bank National Association as administrative agent (incorporated herein by reference to Exhibit 10.1of the Company’s Current Report on Form 8-K filed December 19, 2005). *
10.10 Fifth Amendment to Third Amended and Restated Warehousing Credit Agreement, datedFebruary 1, 2006, among HomeAmerican Mortgage Corporation and the Banks that are signatoriesthereto and U.S. Bank National Association as administrative agent (Exhibit A, reducing totalcommitment amount to $225 million, omitted) (incorporated herein by reference to Exhibit 10.7 of theCompany’s Annual Report on Form 10-K dated December 31, 2005). *
- 77 -

ExhibitNumber Description
10.11 Fourth Amended and Restated Warehousing Credit Agreement, dated as of September 5, 2006, amongHomeAmerican Mortgage Corporation, the Banks that are signatories thereto and U.S. Bank NationalAssociation, as administrative agent (incorporated by reference to Exhibit 10.1 of the Company’s CurrentReport on Form 8-K filed September 8, 2006).*
10.12 First Amendment to Fourth Amended and Restated Warehousing Credit Agreement, dated as ofNovember 2, 2007 (incorporated by reference to Exhibit 10.1 of the Company’s Current Report on Form8-K filed November 6, 2007).*
10.13 The Company’s Employee Equity Incentive Plan (incorporated herein by reference to Exhibit A of theCompany’s Proxy Statement dated May 14, 1993 relating to the 1993 Annual Meeting ofStockholders). *
10.14 Form of Non-Statutory Option Agreement (Employee Equity Incentive Plan) (incorporated herein byreference to Exhibit 10.6 of the Company’s Annual Report on Form 10-K dated December 31, 2004). *
10.15 Form of Restricted Stock Agreement (Employee Equity Incentive Plan) (incorporated herein by referenceto Exhibit 10.10 of the Company’s Annual Report on Form 10-K dated December 31, 1998). *
10.16 M.D.C. Holdings, Inc. 2001 Equity Incentive Plan Effective March 26, 2001 (incorporated herein byreference to Exhibit B of the Company’s Proxy Statement dated March 31, 2001 relating to the 2001Annual Meeting of Stockholders). *
10.17 First Amendment to M.D.C. Holdings, Inc. 2001 Equity Incentive Plan, effective April 28, 2003(incorporated herein by reference to Exhibit 10.2 of the Company’s Quarterly Report on Form 10-Qdated March 31, 2003). *
10.18 Form of Non-Qualified Stock Option Certificate (2001 Equity Incentive Plan) (incorporated herein byreference to Exhibit 10.10 of the Company’s Annual Report on Form 10-K dated December 31, 2004). *
10.19 Form of Restricted Stock Agreement (2001 Equity Incentive Plan) (incorporated herein by reference toExhibit 10.11 of the Company’s Annual Report on Form 10-K dated December 31, 2004). *
10.20 M.D.C. Holdings, Inc. Stock Option Plan for Non-Employee Directors Effective March 26, 2001(incorporated herein by reference to Exhibit C of the Company’s Proxy Statement dated March 31, 2001relating to the 2001 Annual Meeting of Stockholders). *
10.21 First Amendment to M.D.C. Holdings, Inc. Stock Option Plan for Non-Employee Directors, October 20,2003 (incorporated herein by reference to Exhibit 10.13 of the Company’s Annual Report on Form 10-Kdated December 31, 2004). *
10.22 Form of Non-Qualified Stock Option Agreement (Stock Option Plan for Non-Employee Directors)(incorporated herein by reference to Exhibit 10.14 of the Company’s Annual Report on Form 10-K datedDecember 31, 2004). *
10.23 Form of Indemnification Agreement entered into between the Company and members of its Board ofDirectors (incorporated by reference to Exhibit 10.1 of the Company’s Current Report on Form 8-K filedOctober 26, 2006).*
10.24 Form of Indemnification Agreement entered into between the Company and certain of its officers(incorporated by reference to Exhibit 10.2 of the Company’s Current Report on Form 8-K filedOctober 26, 2006).*
10.25 Consulting Agreement, effective as of March 1, 2003, by and between Gilbert Goldstein, P.C. and theCompany (incorporated herein by reference to Exhibit 10.1 of the Company’s Quarterly Report on Form10-Q dated March 31, 2003). *
- 78 -

ExhibitNumber Description
10.26 Amendment to Consulting Agreement, July 26, 2004, by and between Gilbert Goldstein, P.C. and theCompany (incorporated by reference to Exhibit 10.2 of the Company’s Quarterly Report on Form 10-Qdated June 30, 2004). *
10.27 Consulting Agreement, effective as of March 1, 2006, by and between Gilbert Goldstein, P.C. and theCompany (incorporated herein by reference to Exhibit 10.1 of the Company’s Current Report on Form 8-K filed February 22, 2006). *
10.28 M.D.C. Holdings, Inc. Executive Officer Performance-Based Compensation Plan (incorporated herein byreference to Exhibit A of the Company’s Proxy Statement dated May 25, 1994 related to the 1994Meeting of Stockholders). *
10.29 Amendment to the M.D.C. Holdings, Inc. Executive Officer Performance-Based Compensation Plan,dated December 30, 2005 (incorporated herein by reference to Exhibit 10.1 of the Company’s CurrentReport on Form 8-K filed January 6, 2006). *
10.30 Employment Agreement between the Company and Larry A. Mizel, restated as of February 26, 2003(incorporated herein by reference to Exhibit 99.1 of the Company’s Current Report on Form 8-K filedFebruary 27, 2003). *
10.31 Employment Agreement between the Company and David D. Mandarich, restated as ofFebruary 26, 2003 (incorporated herein by reference to Exhibit 99.2 of the Company’s Current Report onForm 8-K filed February 27, 2003). *
10.32 Lease Agreement among MDC, M.D.C. Land Corporation and Larry A. Mizel, executed February 24,2005 (incorporated herein by reference to Exhibit 99.1 of the Company’s Current Report on Form 8-Kfiled February 28, 2005). *
10.33 Lease Agreement among MDC, M.D.C. Land Corporation and David D. Mandarich, executed February24, 2005 (incorporated herein by reference to Exhibit 99.1 of the Company’s Current Report on Form 8-K filed February 28, 2005). *
10.34 Lease Agreement among MDC, Richmond American Homes of Colorado, Inc. and Larry A. Mizel,August 2, 2007 (incorporated herein by reference to Exhibit 10.4 of the Company’s Quarterly Report onForm 10-Q dated June 30, 2007). *
10.35 Lease Agreement among MDC, Richmond American Homes of Colorado, Inc. and David D. Mandarich,August 2, 2007 (incorporated herein by reference to Exhibit 10.5 of the Company’s Quarterly Report onForm 10-Q dated June 30, 2007). *
10.36 Change in Control Agreement between the Company and Paris G. Reece III effective January 26, 1998(incorporated herein by reference to Exhibit 10.1 of the Company’s Current Report on Form 8-K filedMarch 27, 1998). *
10.37 Change in Control Agreement between the Company and Michael Touff effective January 26, 1998(incorporated herein by reference to Exhibit 10.2 of the Company’s Current Report on Form 8-K filedMarch 27, 1998). *
10.38 Form of Change in Control Agreement between the Company and certain employees of M.D.C.Holdings, Inc. (incorporated herein by reference to Exhibit 10.3 of the Company’s Current Report onForm 8-K filed March 27, 1998). *
10.39 Independent Contractor Agreement between Mizel Design and Decorating Company and the Companyeffective as of January 1, 2005 (incorporated herein by reference to Exhibit 10.26 of the Company’sAnnual Report on Form 10-K dated December 31, 2004). *
- 79 -

ExhibitNumber Description
10.40 M.D.C. Holdings, Inc. 401(k) Savings Plan Prototype Retirement Plan and Trust (incorporated herein byreference to Exhibit 10.20 of the Company’s Annual Report on Form 10-K dated December 31, 2002). *
10.41 M.D.C. Holdings, Inc. 401(k) Savings Plan Prototype Retirement Plan and Trust Adoption Agreementbetween M.D.C. Holdings, Inc. and INVESCO/BankOne, as of January 1, 2003 (incorporated herein byreference to Exhibit 10.21 of the Company’s Annual Report on Form 10-K dated December 31, 2002). *
10.42 2003 Post-EGTRRA Amendments (401(k) Savings Plan Prototype Retirement Plan and Trust), datedDecember 30, 2003 (incorporated herein by reference to Exhibit 10.31 of the Company’s Annual Reporton Form 10-K dated December 31, 2003). *
10.43 Amendment to M.D.C. Holdings, Inc. 401(k) Savings Plan, effective as of January 1, 2004 (incorporatedherein by reference to Exhibit 10.38 of the Company’s Annual Report on Form 10-K datedDecember 31, 2006). *
10.44 Rollover Amendment to M.D.C. Holdings, Inc. 401(k) Savings Plan between M.D.C. Holdings, Inc. andAMVESCAP National Trust Company, effective as of March 28, 2005 (incorporated herein by referenceto Exhibit 10.37 of the Company’s Annual Report on Form 10-K dated December 31, 2005). *
10.45 Amendment to M.D.C. Holdings, Inc. 401(k) Savings Plan, effective as of January 1, 2006 (incorporatedherein by reference to Exhibit 10.40 of the Company’s Annual Report on Form 10-K datedDecember 31, 2006). *
10.46 Final 401(k)/401(m) Regulations Amendment to M.D.C. Holdings, Inc. 401 (k) Savings Plan(incorporated herein by reference to Exhibit 10.41 of the Company’s Annual Report on Form 10-K datedDecember 31, 2006). *
10.47 Stock Limit Amendment to M.D.C. Holdings, Inc. 401(k) Savings Plan, March 26, 2007, (incorporatedherein by reference to Exhibit 10.1 of the Company’s Quarterly Report on Form 10-Q datedMarch 31, 2007). *
10.48 Stock Freeze Amendment to M.D.C. Holdings, Inc. 401(k) Savings Plan, November 19, 2007.
10.49 Purchase Agreement dated as of December 6, 2004, among MDC and Citigroup Global Markets Inc., J.P.Morgan Securities Inc., Wachovia Capital Markets, LLC, Banc of America Securities LLC and BNPParibas Securities Corp. (incorporated herein by reference to Exhibit 10.1 of the Company’s CurrentReport on Form 8-K filed December 14, 2004). *
10.50 Purchase Agreement dated as of June 28, 2005, among MDC and Citigroup Global Markets Inc., J.P.Morgan Securities Inc., Wachovia Capital Markets, LLC, Banc of America Securities LLC, BNP ParibasSecurities Corp., Comerica Securities, Inc., Credit Suisse First Boston LLC, KeyBanc Capital Markets,Greenwich Capital Markets, Inc. and SunTrust Capital Markets, Inc. (incorporated herein by reference toExhibit 10.1 of the Company’s Current Report on Form 8-K filed July 7, 2005). *
10.51 Distribution Agreement, dated October 6, 2004, between the Registrant, certain of its subsidiaries andBanc of America Securities LLC, BNP Paribas Securities Corp., Citigroup Global Markets Inc.,Comerica Securities, Credit Suisse First Boston LLC, Deutsche Bank Securities Inc., Greenwich CapitalMarkets, Inc., J.P. Morgan Securities Inc., McDonald Investments Inc., Merrill Lynch, Pierce, Fenner &Smith Incorporated, SunTrust Robinson Humphrey Capital Markets, UBS Securities LLC and WachoviaCapital Markets, LLC (incorporated herein by reference to Exhibit 10.1 of the Company’s Current Reporton Form 8-K filed October 7, 2004). *
- 80 -
ExhibitNumber Description
10.52 Amendment No. 1 to Distribution Agreement, dated as of July 20, 2005, among MDC, certain of itssubsidiaries and Banc of America Securities LLC, BNP Paribas Securities Corp., Citigroup GlobalMarkets Inc., Comerica Securities, Credit Suisse First Boston LLC, Deutsche Bank Securities Inc.,Greenwich Capital Markets, Inc., J.P. Morgan Securities Inc., McDonald Investments Inc., MerrillLynch, Pierce, Fenner & Smith Incorporated, SunTrust Capital Markets, Inc., UBS Securities LLC andWachovia Capital Markets, LLC (incorporated herein by reference to Exhibit 10.1 of the Company’sCurrent Report on Form 8-K filed July 20, 2005). *
10.53 Amended and Restated Distribution Agreement, dated as of January 9, 2006, among the Registrant,certain of its subsidiaries and Banc of America Securities LLC, BNP Paribas Securities Corp., CitigroupGlobal Markets Inc., Comerica Securities, Credit Suisse First Boston LLC, Deutsche Bank SecuritiesInc., Greenwich Capital Markets, Inc., J.P. Morgan Securities Inc., McDonald Investments Inc., MerrillLynch, Pierce, Fenner & Smith Incorporated, SunTrust Capital Markets, Inc., UBS Securities LLC andWachovia Capital Markets, LLC (incorporated herein by reference to Exhibit 10.1 of the Company’sCurrent Report on Form 8-K filed January 9, 2006). *
10.54 Sub-Sublease agreement between MDC and CVentures, Inc., executed July 25, 2005 (incorporated hereinby reference to Exhibit 10.1 of the Company’s Current Report on Form 8-K filed July 27, 2005). *
10.55 First Amendment to Sub-Sublease agreement between MDC and CVentures, Inc., executed on March 28,2006 (incorporated herein by reference to Exhibit 10.1 of the Company’s Current Report on Form 8-Kfiled March 29, 2006). *
10.56 Aircraft Sale Agreement (incorporated herein by reference to Exhibit 10.1 of the Company’s QuarterlyReport on Form 10-Q dated June 30, 2007). *
10.57 Aircraft Purchase Agreement (incorporated herein by reference to Exhibit 10.2 of the Company’sQuarterly Report on Form 10-Q dated June 30, 2007). *
10.58 Section 1031 Exchange Agreement (incorporated herein by reference to Exhibit 10.3 of the Company’sQuarterly Report on Form 10-Q dated June 30, 2007). *
12 Ratio of Earnings to Fixed Charges Schedule.
21 Subsidiaries of the Company.
23 Consent of Ernst & Young LLP.
31.1 Certification of Chief Executive Officer required by 17 CFR 240.13a-14(a), pursuant to Section 302 ofthe Sarbanes-Oxley Act of 2002.
31.2 Certification of Chief Financial Officer required by 17 CFR 240.13a-14(a), pursuant to Section 302 of theSarbanes-Oxley Act of 2002.
32.1 Certification of Chief Executive Officer required by 17 CFR 240.13a-14(b), pursuant to Section 906 ofthe Sarbanes-Oxley Act of 2002.
32.2 Certification of Chief Financial Officer required by 17 CFR 240.13a-14(b), pursuant to Section 906 ofthe Sarbanes-Oxley Act of 2002.
* Incorporated by reference.
- 81 -
SIGNATURES
Pursuant to the requirements of Section 13 or 15(d) of the Securities Exchange Act of 1934, the Registrant hasduly caused this report to be signed on this 7th day of February, 2008 on its behalf by the undersigned, thereunto dulyauthorized.
M.D.C. HOLDINGS, INC.(Registrant)
By: /s/ Larry A. Mizel
Larry A. MizelChief Executive Officer
By: /s/ Paris G. Reece III
Paris G. Reece IIIExecutive Vice President, Chief FinancialOfficer and Principal Accounting Officer
POWER OF ATTORNEY
KNOW ALL MEN BY THESE PRESENTS, that the undersigned officers and/or directors of the Registrant, by virtueof their signatures to this report, appearing below, hereby constitute and appoint Larry A. Mizel, David D. Mandarich andParis G. Reece III, or any one of them, with full power of substitution, as attorneys-in-fact in their names, places and steadsto execute any and all amendments to this report in the capacities set forth opposite their names and hereby ratify all thatsaid attorneys-in-fact do by virtue hereof.
Pursuant to the requirements of the Securities Exchange Act of 1934, this report has been signed below by thefollowing persons on behalf of the Registrant and in the capacities and on the dates indicated.
Signature Title Date
/s/ Larry A. Mizel
Larry A. Mizel
Chairman of the Board of Directors andChief Executive Officer
February 7, 2008
/s/ David D. Mandarich
David D. Mandarich
Director, President and Chief OperatingOfficer
February 7, 2008
/s/ Steven J. Borick
Steven J. Borick
Director February 7, 2008
/s/ William B. Kemper
William B. Kemper
Director February 7, 2008
/s/ Herbert T. Buchwald
Herbert T. Buchwald
Director February 7, 2008
/s/ David E. Blackford
David E. Blackford
Director February 7, 2008
/s/ Michael A. Berman
Michael A. Berman
Director February 7, 2008
(A Majority of the Board of Directors)
- 82 -