Strategic Cost & Process Initiative Board of Director’s …€¦ · · 2016-01-12Strategic Cost...
17
1 Pre-Decisional Information The OPPD Way January 12, 2016 Pre-Decisional Information Strategic Cost & Process Initiative Board of Director’s Update
Transcript of Strategic Cost & Process Initiative Board of Director’s …€¦ · · 2016-01-12Strategic Cost...
1Pre-Decisional Information
The OPPD Way
January 12, 2016
Pre-Decisional Information
Strategic Cost & Process Initiative
Board of Director’s Update

2Pre-Decisional Information
• Challenges, Objectives and Approach
• Phase 1 – Diagnostic
• Implementation Roadmap
• Phase 2 – Implementation
• Tracking Methodology
Agenda

3Pre-Decisional Information
Challenges currently facing OPPD
Rapidly changing utility industry
Increased customer expectations
Slow load growth
Rising O&M costs
Weakened off system sale revenues

4Pre-Decisional Information
Objectives
Achieve O&M reductions to help achieve the
• Target of 20% below the West North Central Regional average published
rates on a system average basis (per Competitive Rates Board Policy SD-2)
• Becoming a leading public utility
• Setting the foundation for our future customers and employees
• Approach
• Deployed The OPPD Way: Strategic Cost and Process Initiative
• Retained outside expertise with proven abilities
• A collaborative effort
• Phased approach
Addressing the Challenges

• Phase 1 –Diagnostic (completed)
– Sizing the opportunity
• Phase 2 – Implementation (in-progress)
– Detailing the specifics and achieving results
• Phase 3 – Sustainability (future)
– Ensuring ongoing results
Phased Approach
5
Pre-Decisional Information

Phase 1 – Diagnostic
Pre-Decisional Information
7Pre-Decisional Information
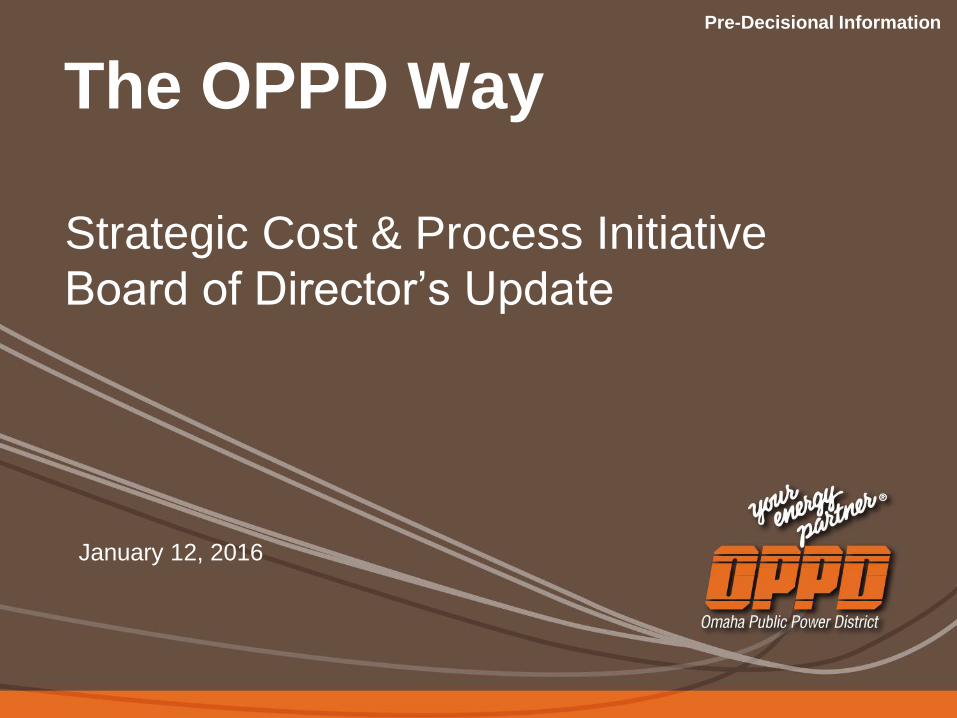
Major areas of the company have been reviewed, with a focus on areas
with high likelihood to impact rates
Energy Production▪ Detailed benchmarking of performance at highest spend units and site visit (Nebraska City)
and targeted deep dive on maintenance
Nuclear▪ Plant-level benchmarking of FCS performance to single-site operators
Procurement / MMD▪ Category spend baseline and “opportunity marker” identification for top categories
▪ Bottom-up “should cost” evaluation of transformers and support for renegotiations
▪ Evaluation of P2P practices
IT▪ Functional cost and performance benchmarking
▪ Idea generation workshop with IT leadership team and roadmap development
HR / Finance /
Benefits
▪ Spans and layers analysis and functional cost and performance benchmarking
▪ Idea generation workshop
Facilities▪ Functional cost and performance benchmarking
▪ Review of corporate security contract
Public Affairs
▪ Functional cost and performance benchmarking
Fleet▪ Internal benchmarking on vehicle repair costs
▪ Low-utilization vehicle analysis and field observation
Energy Delivery▪ FERC level benchmark vs peers
▪ Ride-alongs and field observations reviewed
Customer Service▪ FERC level benchmark vs peers & select bottom-up idea development
What has been covered to date
An implementation roadmap has been developed in all areas
Capital▪ Overview of current capital allocation practices
▪ Comparison with best practice

8Pre-Decisional InformationSource: Source
• Reduced Corporate Sponsorships - $100K
• Reduced Corporate Memberships - $100K
• Nuclear participation reduction (EPRI & EQ User Group) - $500K
• Lime budget reduction @ NCS - $1M
• Eliminated vacant unfilled positions - $1.2M (11 positions)
• Resized exempt travel and training budgets - $1765/emp
Phase 1 – Quick Wins Implemented

9Pre-Decisional Information
IMPLEMENTATION
Very clear roadmap with concrete set of initiativesA
▪ Roadmap consists of 10-30 discrete initiatives clustered
into 3-5 themes
▪ The roadmap covers all functions and all departments
within OPPD.
▪ Initial roadmap should be 2-3 years… Not <1 years (too
short to get the work done) not 3+ years (too long to keep
organization focused and energized)
▪ Initiatives are sequenced with the following goals in mind:
– Need for significant near-term (2016) cost reduction
– Results must be sustainable
– Avoid running more than 3-4 initiatives at the same time,
– Allows for capability building both within and across
specific departments
– Balance of initiatives across the various departments /
VPs

10Pre-Decisional Information
Health
Cost
Strategy
Overview of the implementation roadmap
2015 2016 2017
S O N D J F M A M J J A S O N D J F M A M J J A
Follow-on improvement activities and lean transformation“No regret”
ideas
Lean Trans
& Sub
Customer
strategy and
lean cust ops
Lean Distribution
Lean Fossil: N.
Omaha
Lean Fossil:
NC 1&2
Strategic sourcing to capture value, org design,
capability building, and P2P optimization
Assess industry trends and set strategic direction for OPPD
PMO tracking
PMO design
and setup (e.g.,
Wave)
Capital
planning
Lean HR &
Finance
PMO execution
Lean ITBenefits review OBE1 and
quick wins
Board update Board update Board updateBoard update Stakeholder communications
Production
Energy delivery
Customer
Corp support
Nuclear
Procurement
Capital
1 Organizational and Budget Effectiveness; includes activity review of other corporate functions (e.g., facilities, corp comm)
ROADMAP AND SEQUENCING
PRELIMINARY
Phase 2 - Implementation
Pre-Decisional Information
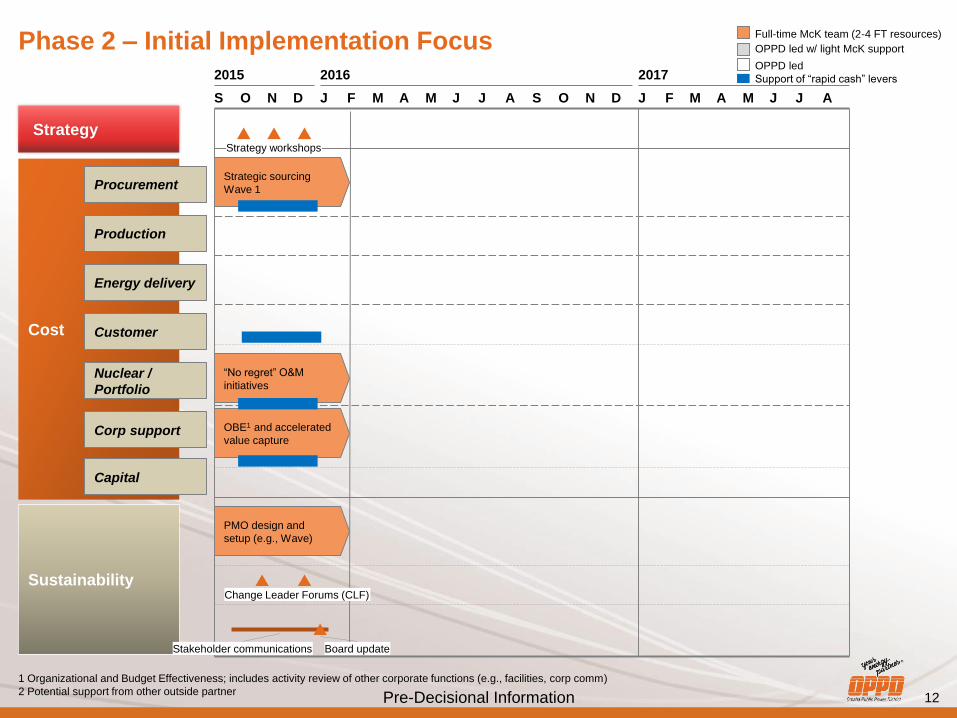
12Pre-Decisional Information
Sustainability
Cost
Strategy
Phase 2 – Initial Implementation Focus 2015 2016 2017
S O N D J F M A M J J A S O N D J F M A M J J A
Strategic sourcing
Wave 1
“No regret” O&M
initiatives
PMO design and
setup (e.g., Wave)
OBE1 and accelerated
value capture
Stakeholder communications
Strategy workshops
Change Leader Forums (CLF)
Board update
Procurement
Production
Energy delivery
Customer
Corp support
Nuclear /
Portfolio
Full-time McK team (2-4 FT resources)
OPPD led w/ light McK support
OPPD led
Capital
1 Organizational and Budget Effectiveness; includes activity review of other corporate functions (e.g., facilities, corp comm)
2 Potential support from other outside partner
Support of “rapid cash” levers

13Pre-Decisional Information
IMPLEMENTATION
Each initiative is held accountable for impact
▪ Every initiative has a well-defined charter, including scope,
success criteria incl. target, team, team leader, and executive
sponsors
▪ Each team is sponsored by two VPs, who are jointly
accountable for the achieved results
▪ A senior leader leads each initiative team (typically a div. mgr
or high potential manager); must be able and willing to
challenge current beliefs and inspire change in the organization
▪ Each initiative team is staffed with full-time cross-functional
“change agents” and part-time SMEs
▪ Each initiative team reports out to the full exec team every 3-4
weeks
▪ No team has a pocket veto; teams present all feasible ideas
to the executive team for approval
B

14Pre-Decisional InformationSource: Source
OBE (Organization Budget Effectiveness)
• ~ 70 initiatives approved across 17 non-Nuclear Divisions with $16M in savings– Some examples:
– Reduce SURGE & IHEPP marketing spend
– Change frequency of transmission line clearance survey
– Reduce armored car service for payment collections
– Reduce janitorial services
– Reduced outside services spend
– Reduce unfilled budgeted positions
– Consolidation of positions
– Eliminate headcount vacancies
– Not backfilling some positions upon retirements
Procurement
• Implemented Procurement Control Tower - $<1M spend deferred, cancelled or decreased
• Distribution Transformer Contract - $1.1M savings
• Software maintenance optimization & leased equipment - $300K savings
• Standardize office supplies (move to generics) - $125k
• $2.1M of inventory freed up for consumption and cash flow
• Cancelled $2M in requests for materials – older than 2015.
• Capability assessment and skills building
Phase 2 – Initiatives Approved / Status

15Pre-Decisional InformationSource: Source
Nuclear
• Launched deep dives into Engineering, Maintenance, Security, Operations (including
RP and Chemistry),Training and Materials
• Control Tower being set up to develop “financial” mindset at FCS
PMO
• Launched customized software solution (Wave) to track initiatives and impacts
• All approved initiatives loaded with link to OPPD budgets
• Training provided on tracking tool (Wave) program
Phase 2 – Initiatives Approved / Status
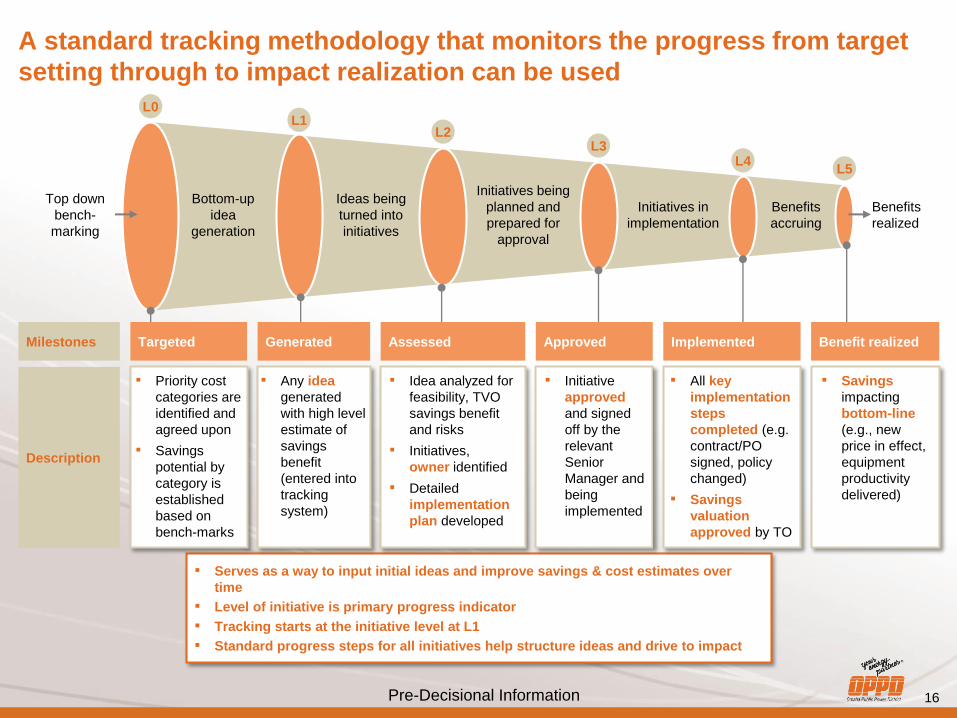
16Pre-Decisional Information
A standard tracking methodology that monitors the progress from target
setting through to impact realization can be used
▪ Serves as a way to input initial ideas and improve savings & cost estimates over
time
▪ Level of initiative is primary progress indicator
▪ Tracking starts at the initiative level at L1
▪ Standard progress steps for all initiatives help structure ideas and drive to impact
L2L3
L4L5
L0
Benefits
accruing
Initiatives being
planned and
prepared for
approval
Initiatives in
implementation
Ideas being
turned into
initiatives
Benefits
realized
L1
Description
Milestones Assessed ImplementedTargeted Generated
▪ Any idea
generated
with high level
estimate of
savings
benefit
(entered into
tracking
system)
Approved Benefit realized
▪ All key
implementation
steps
completed (e.g.
contract/PO
signed, policy
changed)
▪ Savings
valuation
approved by TO
▪ Initiative
approved
and signed
off by the
relevant
Senior
Manager and
being
implemented
▪ Priority cost
categories are
identified and
agreed upon
▪ Savings
potential by
category is
established
based on
bench-marks
▪ Idea analyzed for
feasibility, TVO
savings benefit
and risks
▪ Initiatives,
owner identified
▪ Detailed
implementation
plan developed
▪ Savings
impacting
bottom-line
(e.g., new
price in effect,
equipment
productivity
delivered)
Top down
bench-
marking
Bottom-up
idea
generation

17Pre-Decisional Information
Questions
Any questions?