Strategic Asset Allocation for Endowments, Foundations and ...
13
INVESTMENT PRODUCTS: NOT FDIC INSURED • NOT CDIC INSURED • NOT GOVERNMENT INSURED • NO BANK GUARANTEE • MAY LOSE VALUE Executive Summary We explore various possibilities for an appropriate fixed income benchmark for an Endowment, Foundation or Non-profit strategic asset allocation; and review and evaluate several types of benchmarks based on risk and return under various market conditions. We find intermediate investment grade (IG) and two different long duration IG benchmarks (the first more Treasury heavy and the second more credit heavy) offer meaningful protection during market stress, while high yield (HY) and emerging market (EM) debt fail to provide diversification benefit during these adverse conditions. One way of analyzing benchmarks is to study them as individual indices, in a “stand-alone” context, rather than as a component of a portfolio. In a stand-alone setting (see Table 2 ), among the three IG benchmarks, intermediate IG seems to be more favorable than the two long duration IG benchmarks, given its highest Sharpe Ratio. However, the Treasury heavy benchmark (long duration IG 1) outperforms the credit heavier long duration benchmark (long duration IG 2) and intermediate IG in many stress environments, including in the recent COVID-19 crisis, better offsetting equity risk. Another way of analyzing benchmarks is to study the properties of portfolios within which benchmarks are contributors to portfolio risk and return. Within a (long term) portfolio context, portfolios with long duration IG 1 perform similarly to those with a long duration IG 2 or a pure intermediate IG fixed income component. However, in the stress periods, a portfolio with long duration IG 1 has superior risk/reward properties compared to portfolios with intermediate IG or long duration IG 2. This implies that in non-stress periods, portfolios with more credit exposure will perform somewhat better than those with a heavier long duration Treasury exposure. Strategic Asset Allocation for Endowments, Foundations and Non-profits Fixed Income Component Greg van Inwegen Global Head, Quantitative Research and Asset Allocation Citi Investment Management Paisan Limratanamongkol Head, Quantitative Research and Global Asset Allocation Citi Investment Management Xin He Lead, Quantitative Research and Asset Allocation team Citi Investment Management November 2020
Transcript of Strategic Asset Allocation for Endowments, Foundations and ...
INVESTMENT PRODUCTS: NOT FDIC INSURED • NOT CDIC INSURED • NOT GOVERNMENT INSURED • NO BANK GUARANTEE • MAY LOSE VALUE
Executive Summary
We explore various possibilities for an appropriate fixed income benchmark for an Endowment, Foundation or Non-profit strategic asset allocation; and review and evaluate several types of benchmarks based on risk and return under various market conditions. We find intermediate investment grade (IG) and two different long duration IG benchmarks (the first more Treasury heavy and the second more credit heavy) offer meaningful protection during market stress, while high yield (HY) and emerging market (EM) debt fail to provide diversification benefit during these adverse conditions.
One way of analyzing benchmarks is to study them as individual indices, in a “stand-alone” context, rather than as a component of a portfolio. In a stand-alone setting (see Table 2), among the three IG benchmarks, intermediate IG seems to be more favorable than the two long duration IG benchmarks, given its highest Sharpe Ratio.
However, the Treasury heavy benchmark (long duration IG 1) outperforms the credit heavier long duration benchmark (long duration IG 2) and intermediate IG in many stress environments, including in the recent COVID-19 crisis, better offsetting equity risk.
Another way of analyzing benchmarks is to study the properties of portfolios within which benchmarks are contributors to portfolio risk and return. Within a (long term) portfolio context, portfolios with long duration IG 1 perform similarly to those with a long duration IG 2 or a pure intermediate IG fixed income component. However, in the stress periods, a portfolio with long duration IG 1 has superior risk/reward properties compared to portfolios with intermediate IG or long duration IG 2. This implies that in non-stress periods, portfolios with more credit exposure will perform somewhat better than those with a heavier long duration Treasury exposure.
Strategic Asset Allocation for Endowments, Foundations and Non-profits
Fixed Income Component
Greg van Inwegen Global Head, Quantitative Research and Asset Allocation Citi Investment Management
Paisan Limratanamongkol Head, Quantitative Research and Global Asset Allocation Citi Investment Management
Xin He Lead, Quantitative Research and Asset Allocation team Citi Investment Management
November 2020

2Strategic Asset Allocation for Endowments, Foundations and Non-profits | Fixed Income Component | November 2020 |
We conclude, as evidenced by the performance of the long duration IG 1 benchmark in this analysis, long duration treasuries can play a role in an asset allocation. Over full market cycles, portfolios with heavier long duration exposure provide similar returns to portfolios with heavier credit exposures. While heavier credit exposure portfolios outperform in non-stress periods, the long duration Treasury heavy portfolios provide more diversification benefit and downside protection, especially during equity market stress periods. Thus, given similar overall performance over full market cycles, but better downside protection, it may be appropriate to include a higher weighting to long duration Treasuries in the fixed income component of an Endowment, Foundation or Non-profit strategic asset allocation.
Introduction
Endowments, Foundations and Non-profits (EF&Ns) are mandated to preserve capital over long horizons, while meeting cash flow needs to fund their contributions. Given their mandate, it is appropriate that their investment vehicles are characterized by a long average maturity of payment streams. Public equities have effectively an infinite duration and therefore logically should make up a higher proportion in an EF&N long-term strategic asset allocation.
Diversification considerations suggest that fixed income securities also be included in a well-structured EF&N asset allocation plan. Given the long-term nature of the EF&N investment horizon, it makes sense that there is a significant weighting to long duration fixed income securities, possibly both government and corporate bonds.
In determining the relative size of government versus corporate bonds, one must ask what role in the portfolio this allocation will serve. The answer is that the fixed income allocation will serve as a source of income for EF&Ns’ periodic cash flow needs as well as a partial ballast against equity risk within the portfolio.
In order to provide portfolio construction guidance as to what types of fixed income investors should hold in a portfolio to protect against drawdowns, especially in stress periods, it is helpful to analyze the duration, risk, return and correlation properties of the bonds. To carry out this analysis, we study an intermediate IG benchmark, two long duration IG benchmarks, a HY bond benchmark and an Emerging Market bond benchmark, all from a stand-alone basis. This analysis suggests that IG benchmarks are likely to do well in stress periods and we narrow down the benchmark candidates and focus on analyzing intermediate IG and the two long duration IG benchmarks in the portfolio context.

3Strategic Asset Allocation for Endowments, Foundations and Non-profits | Fixed Income Component | November 2020 |
Table 2. Performance and Risk (using monthly data from January 1, 1992 through May 31, 2020)
Statistics Intermediate IG Long Duration IG 1 Long Duration IG 2 High Yield EM Debt US Large Cap
Cumulative Return 467.1% 624.1% 593.0% 695.1% 1140.9% 1226.5%
Ann. Return 6.3% 7.2% 7.0% 7.6% 9.3% 9.5%
Ann. Standard Deviation 5.0% 7.6% 6.5% 8.4% 10.7% 14.5%
Sharpe Ratio 1.26 0.96 1.09 0.90 0.87 0.66
Worst 12-Month Return -5.5% -8.7% -7.9% -31.2% -35.9% -43.1%
Asset Class Summary Statistics
Table 1 provides duration levels for all of the indices included in the analysis. Notice that the intermediate IG has a duration of 6.5. To see the benefit of having a long duration component in the Fixed Income benchmark, we construct two long duration IG benchmarks, namely, long duration IG 1 and long duration IG 2. Long duration IG 1 is a blended benchmark with 55% in intermediate IG and 45% in the long duration US Treasuries1.
Long duration IG 2 has weights of 55% in intermediate IG and 45% in long duration Gov/Credit2. The two constructed long duration IG benchmarks result in durations of 12.6 and 11, respectively. Long duration IG 2 has more exposure to credits than long duration IG 1. In addition to the IG benchmarks, we also include HY debt, EM debt and US equities in Table 1.
Table 1. Description and Duration for Benchmarks Used in Analysis
Source: FactSet, Bloomberg; as of July 7, 2020. Indices are unmanaged. An investor cannot invest directly in an index. They are shown for illustrative purposes only and do not represent the performance of any specific investment. Index returns do not include any expenses, fees or sales charges, which would lower performance. For illustrative purposes only. Past performance is no guarantee of future results. Please see Table 1 for benchmark composition.
1 Intermediate IG index: Bloomberg Barclays US Agg Gov/Credit Total Return Value Unhedged USD (LD03TRUU) is composed of 48% US Treasuries, 6% US government related, and 46% US corporate bonds.
2 Long duration Gov/Credit index: Bloomberg Barclays US Long Government/Credit (LGC5TRUU) is composed of 39% US Treasuries, 8% US government related and 53% US corporate bonds.
Index Description Duration
Intermediate IG Bloomberg Barclays US Gov/Credit 5-10 Yr Total Return Unhedged USD 6.5
Long Duration IG 1 55% intermediate IG + 45% Bloomberg Barclays US Treasury 20+ 12.6
Long Duration IG 2 55% intermediate IG + 45% Bloomberg Barclays US Long Government/Credit Unhedged USD
11.0
High Yield Bloomberg Barclays US High Yield Corporate 3.8
EM Debt Emerging Market USD-Denominated Sovereign Debt from AVS 8.5
US Large Cap MSCI USA ∞
For each of the benchmarks described in Table 1, we examine monthly data over the period January 1, 1992 through May 31, 2020. The results in Table 2 indicate on a stand-alone basis, that intermediate IG and the two long duration IG benchmarks have higher Sharpe Ratio than HY bond HY and EM Debt.
Among the three IG benchmarks, long duration IG 1 has a highest return (7.2%) and a highest risk (7.6%), but the lowest Sharpe Ratio. The best among the three IG benchmarks, from Sharpe Ratio perspective, is intermediate IG, due to its low risk.
Source: FactSet, Bloomberg; as of July 7, 2020. Indices are unmanaged. An investor cannot invest directly in an index. They are shown for illustrative purposes only and do not represent the performance of any specific investment. Index returns do not include any expenses, fees, or sales charges, which would lower performance. For illustrative purposes only. Past performance is no guarantee of future results.

4Strategic Asset Allocation for Endowments, Foundations and Non-profits | Fixed Income Component | November 2020 |
Figure 1. Scenario-Based Stress Test Note: In all the regressions except for the ones under credit spread widen scenario, the data used is from January 1, 1992 through May 31, 2020. For those under credit spread widen scenario, the data used is from December 1, 1998 through May 31, 2020.
-25%
-20%
-15%
-10%
-5%
0%
5%
Return Under Shock
Credit Spreads Widen Dollar Strengthens Volatility Up
-0.8% -0.9%
2.5%
-12.5%
-9.4%
-14.7%
-2.0% -1.2% -2.0%-3.7% -3.6%
-5.4%
-0.7% -0.7%
1.6%
-9.6%-11.4%
-23.5%
◼ Intermediate IG ◼ Long Duration IG 1 ◼ Long Duration IG 2 ◼ High Yield ◼ EM Debt ◼ US Large Cap
Reviewing the stress scenarios, under a credit spread widening, US equities perform the worst with a loss of 14.7%, followed by HY and EM Debt, with losses of 12.5% and 9.4%, respectively. The three IG benchmarks do better under this scenario. Intermediate IG and long duration IG 2 lose only 0.8% and 0.9%, respectively. Long duration IG 1 performs even better and is the only benchmark that has positive return (2.5%) under this scenario, which is consistent it including a higher quality and long duration treasuries component.
In a volatility spike scenario, it’s a similar picture. US equities is down 23.5%. HY and EM Debt drop 9.6% and 11.4%, respectively. On the contrast, intermediate IG and long duration IG 2 are down only 0.7% while long duration IG 1 is up 1.6%, outperforming all other benchmarks.
In the USD FX appreciation scenario, US equities loses 5.4%, followed by HY and EM Debt with negative performance of -3.7% and -3.6%. The three IG benchmarks are hit the least with intermediate IG and long duration IG 2 down 2% each, and long duration IG 1 down only 1.2%.
Stress Tests
Of additional interest is how each of these benchmarks performs in stress environment. We performed two types of stress tests: scenario-based and historical event based.
For the scenario-based stress test, the definition of variables used to represent each scenario is provided in Table 3 and the index returns in case of a shock are available in Figure 11.
Table 3. Definition of Variables Used to Represent Each Scenario
Scenario Underlying Variable Shock
Credit Spreads Widen Change in OAS of Barclays US Corp Investment Grade Index 1.3%
Dollar Strengthens Change in DXY Index 14.3%
Volatility Up Change in VIX Index 183.9%
Source: FactSet, Bloomberg; as of June 24, 2020. Indices are unmanaged. An investor cannot invest directly in an index. They are shown for illustrative purposes only and do not represent the performance of any specific investment. Index returns do not include any expenses, fees or sales charges, which would lower performance. For illustrative purposes only. Past performance is no guarantee of future results.
1 The shock is defined as 2 times the annualized standard deviation of the underlying variable (using last 10 years of data).
Source: FactSet, Bloomberg; as of June 24, 2020. Indices are unmanaged. An investor cannot invest directly in an index. They are shown for illustrative purposes only and do not represent the performance of any specific investment. Index returns do not include any expenses, fees or sales charges, which would lower performance. For illustrative purposes only. Past performance is no guarantee of future results. Please see Glossary for definitions.

5Strategic Asset Allocation for Endowments, Foundations and Non-profits | Fixed Income Component | November 2020 |
Reviewing the historical stress events, in the September 11, 2001 terrorist attack, US equities were down 27.8% followed by HY bond with a loss of 8.9%. In contrast, EM Debt was up 8.2%, intermediate IG and long duration IG 2 were up 11.4% and 11.7% respectively, while long duration IG 1 was up even higher (13.3%).
During the subprime crisis, US equities dropped 36.7% and HY bond plunged about 30%. EM Debt performed better, but still experienced a decline of 12.8%. The three IG benchmarks all performed positively, with intermediate IG and long duration IG 1 up 5.6% and 4.8%, respectively. Long duration IG 2, performed best with a return of 15.4%. Again, this can be attributed to its higher quality and longer duration Treasury component. In the 1994 US Interest Rate Shock event, all benchmarks had similar performance. Long duration IG 1 performed the worst among all, which dropped by 7.9% during the event, dragged by its high sensitivity to interest rate.
These results provide evidence that IG offers meaningful protection as a hedge against equity performance in many stress environments. Long duration IG 1 protects in all stress scenarios, except for the interest rates up stress case. This can be explained by the fact that intermediate
IG and long duration IG 2 embed more equity exposure through its credit component, which reduces their effectiveness as a hedge against equity risk.
Portfolio Analysis
While the analysis of benchmarks on a stand-alone asset class basis is of some interest, what is of most importance in a strategic asset allocation is the behavior of the asset classes in a portfolio context. From the previous stand-alone stress analysis, it can be concluded that the intermediate IG and two long duration IG benchmarks provided reasonable downside protection. In this section, we take a closer look at these three benchmarks from the portfolio construction perspective.
Table 5 provides the pairwise correlations among the benchmarks being considered. Long duration IG 1 has a -0.13 correlation with US equities. Intermediate IG and long duration IG 2 have close to zero correlation with US equities. These correlations are consistent with the stress test results showing the improved downside protection long duration IG 1 versus intermediate IG
Figure 2. Historical-Based Stress Test
-40%
-30%
-20%
-10%
0%
10%
20%
Return During Market Stress
Shock Increase in US Interest Rate Subprime Mortgage Crisis September 11, 2001
-6.3% -7.9% -7.5%-4.1%-4.7% -5.7%
5.6% 4.8%
15.4%
-29.6%
-12.8%
-36.7%
11.4% 11.7%13.3%
-8.9%
8.2%
-27.8%
◼ Intermediate IG ◼ Long Duration IG 1 ◼ Long Duration IG 2 ◼ High Yield ◼ EM Debt ◼ US Large Cap
Stress Events Start End
1994 US Interest Rate Shock 2/1/1994 4/1/1994
Subprime Mortgage Crisis 8/1/2007 11/1/2008
September 11, 2001 9/1/2001 9/1/2002
Moving to the historical-based stress test, the definition of the stress events are provided in Table 4 and the index returns over the relevant period are provided in Figure 2.
Table 4. List of Market Stress Events
Source: FactSet, Bloomberg; as of June 24, 2020. Indices are unmanaged. An investor cannot invest directly in an index. They are shown for illustrative purposes only and do not represent the performance of any specific investment. Index returns do not include any expenses, fees or sales charges, which would lower performance. For illustrative purposes only. Past performance is no guarantee of future results.

6Strategic Asset Allocation for Endowments and Foundations | Fixed Income Component |
Table 6. Portfolio Summary Statistics
Portfolio NameCumulative
Return Ann. ReturnAnn. Standard
Deviation Sharpe RatioWorst 12-Month
Return
Intermediate IG 467.1% 6.3% 5.0% 1.26 -5.5%
Long Duration IG 1 624.1% 7.2% 7.6% 0.96 -8.7%
Long Duration IG 2 593.0% 7.0% 6.5% 1.09 -7.9%
US Large Cap 1226.5% 9.5% 14.5% 0.66 -43.1%
60 Equity/40 Intermediate IG 922.4% 8.5% 9.0% 0.95 -28.3%
60 Equity/40 Long Duration IG 1 1052.8% 9.0% 8.8% 1.02 -26.4%
60 Equity/40 Long Duration IG 2 1013.7% 8.9% 9.2% 0.97 -28.3%
80 Equity/20 Intermediate IG 1080.3% 9.1% 11.7% 0.78 -36.0%
80 Equity/20 Long Duration IG 1 1158.2% 9.3% 11.5% 0.81 -35.1%
80 Equity/20 Long Duration IG 2 1133.1% 9.2% 11.7% 0.79 -36.0%
1 We assume monthly rebalancing using the data since January 1, 1992 through May 31, 2020.
Statistics Intermediate IG Long Duration IG 1 Long Duration IG 2 High Yield EM Debt US Large Cap
Intermediate IG 1 0.91 0.97 0.23 0.32 0.04
Long Duration IG 1 0.91 1 0.96 -0.01 0.17 -0.13
Long Duration IG 2 0.97 0.96 1 0.22 0.31 0.03
High Yield 0.23 -0.01 0.22 1 0.59 0.64
EM Debt 0.32 0.17 0.31 0.59 1 0.52
US Large Cap 0.04 -0.13 0.03 0.64 0.52 1
and long duration IG 2 during periods of equity market stress. High yield and EM Debt both have positive correlations with US Equities, indicating the least potential benefit of forming a portfolio of those
fixed incomes with US Equities. Of course, the negative correlation of long duration IG 1 with equities implies that when equities rally post-stress, it will be a drag on the portfolio relative to intermediate IG.
Table 5. Pairwise Correlation (monthly data from January 1, 1992 through May 31, 2020)
Indices are unmanaged. An investor cannot invest directly in an index. They are shown for illustrative purposes only and do not represent the performance of any specific investment. Index returns do not include any expenses, fees or sales charges, which would lower performance. For illustrative purposes only. Past performance is no guarantee of future results. Actual results may vary. Please see Table 1 for benchmark composition.
Source: FactSet, Bloomberg; as of July 7, 2020. Correlation is the extent to which the values of different types of investments move in tandem with one another in response to changing economic and market conditions. Correlation is measured on a scale of 1 to +1. Investments with a positive correlation tend to rise and fall in value at the same time, while investments with a negative correlation tend to move in opposite directions. An asset class has a correlation of 1 with itself. Indices are unmanaged. An investor cannot invest directly in an index. They are shown for illustrative purposes only and do not represent the performance of any specific investment. Index returns do not include any expenses, fees or sales charges, which would lower performance. For illustrative purposes only. Past performance is no guarantee of future results. Please see Table 1 for benchmark composition.
We next combine the impact of stand-alone asset class return, risk and correlation to create a range of portfolios. We do this in order to evaluate the efficacy of various fixed income asset classes as a complement to the equity component of a portfolio. We create a simplified strategic asset allocation with two sets of portfolios. The first set
has 60% US equities combined with 40% IG, chosen from Intermediate IG, long duration IG 1 and long duration IG 2. The second set has 80% US equities combined with 20% IG. Table 6 shows the weightings and summary statistics for the various portfolios on an asset class level1. Each portfolio’s return and risk is plotted in Figure 3.

7Strategic Asset Allocation for Endowments, Foundations and Non-profits | Fixed Income Component | November 2020 |
3% 6% 9% 12% 15%4%
6%
8%
10%
12%
Risk and Return for Various Portfolios
Ann
ual R
etur
n
Annual Standard Deviation
Intermediate IG
Long Duration IG 2Long Duration IG 1
60 Equity/40 Long Duration IG 1
60 Equity/40 Intermediate IG
60 Equity/40 Long Duration IG 2
80 Equity/20 Long Duration IG 1 80 Equity/20 Long Duration IG 280 Equity/20 Intermediate IG
US Large Cap
Figure 3. Portfolio Risk and Return (January 1, 1992 through May 31, 2020)
Recall that as a stand-alone investment long duration IG 1 compares unfavorably to intermediate IG and long duration IG 2, given its much higher risk. However, when used as an asset class component in a portfolio, for both the 60/40 and the 80/20 weightings, the portfolios with long duration IG 1 are quite competitive, and have even have slightly better risk/return properties relative to those portfolios using either intermediate IG or long duration IG 2.
COVID-19 Stress Scenario
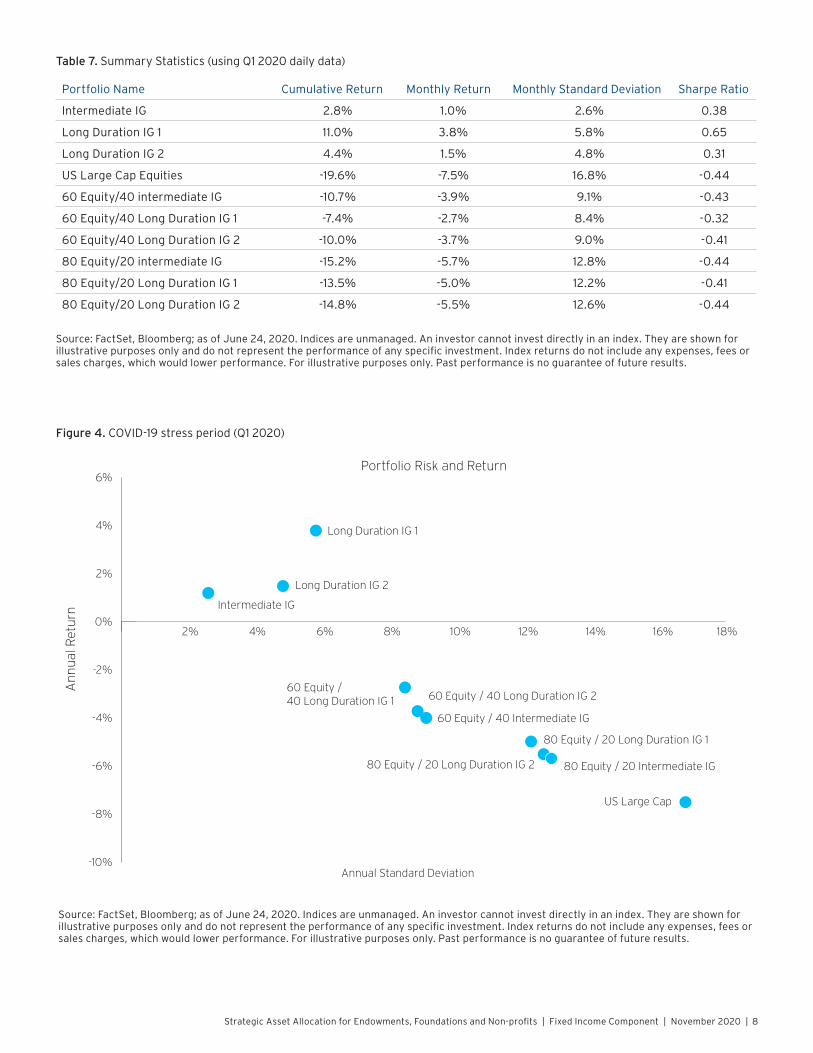
To complete the analysis, we look at stand-alone and portfolio risk and returns over a short horizon during the COVID-19 crisis, using the Q1 2020 daily data.
Table 7 shows that on a stand-alone basis, long duration IG 1 has a substantially higher return than
both intermediate IG and long duration IG 2 (11% versus 2.8% and 4.4%). Even though it also has higher standard deviation than the intermediate IG and long duration IG 2, it is in fact still leading to a highest Sharpe Ratio (0.65).
From a portfolio perspective, the benefit of having the long duration Treasury exposure in the fixed income sleeve is also evident. In Table 7, the Sharpe Ratio for the 60/40 and 80/20 portfolios are highest with the portfolios with long duration IG 1 included relative to the intermediate IG and long duration IG 2. For example, for the 60/40 portfolio the Sharpe Ratios are -0.32 for the portfolio with long duration IG 1 versus -0.43 and -0.41 for portfolios with either intermediate IG or long duration IG 2. Figure 4 also illustrates this point: Portfolios with long duration IG 1 are further to the north and west in the figure have lower risk and higher return than the intermediate IG and long duration IG 2 portfolios.
Source: FactSet, Bloomberg; as of June 24, 2020. Indices are unmanaged. An investor cannot invest directly in an index. They are shown for illustrative purposes only and do not represent the performance of any specific investment. Index returns do not include any expenses, fees or sales charges, which would lower performance. For illustrative purposes only. Past performance is no guarantee of future results.
8Strategic Asset Allocation for Endowments, Foundations and Non-profits | Fixed Income Component | November 2020 |
-10%
-8%
-6%
-4%
-2%
0%2% 4% 6% 8% 10% 12% 14% 16% 18%
2%
4%
6%Portfolio Risk and Return
Ann
ual R
etur
n
Annual Standard Deviation
Intermediate IG
US Large Cap
80 Equity / 20 Long Duration IG 1
80 Equity / 20 Long Duration IG 2 80 Equity / 20 Intermediate IG
60 Equity / 40 Long Duration IG 1 60 Equity / 40 Long Duration IG 2
60 Equity / 40 Intermediate IG
Long Duration IG 1
Long Duration IG 2
Figure 4. COVID-19 stress period (Q1 2020)
Portfolio Name Cumulative Return Monthly Return Monthly Standard Deviation Sharpe Ratio
Intermediate IG 2.8% 1.0% 2.6% 0.38
Long Duration IG 1 11.0% 3.8% 5.8% 0.65
Long Duration IG 2 4.4% 1.5% 4.8% 0.31
US Large Cap Equities -19.6% -7.5% 16.8% -0.44
60 Equity/40 intermediate IG -10.7% -3.9% 9.1% -0.43
60 Equity/40 Long Duration IG 1 -7.4% -2.7% 8.4% -0.32
60 Equity/40 Long Duration IG 2 -10.0% -3.7% 9.0% -0.41
80 Equity/20 intermediate IG -15.2% -5.7% 12.8% -0.44
80 Equity/20 Long Duration IG 1 -13.5% -5.0% 12.2% -0.41
80 Equity/20 Long Duration IG 2 -14.8% -5.5% 12.6% -0.44
Table 7. Summary Statistics (using Q1 2020 daily data)
Source: FactSet, Bloomberg; as of June 24, 2020. Indices are unmanaged. An investor cannot invest directly in an index. They are shown for illustrative purposes only and do not represent the performance of any specific investment. Index returns do not include any expenses, fees or sales charges, which would lower performance. For illustrative purposes only. Past performance is no guarantee of future results.
Source: FactSet, Bloomberg; as of June 24, 2020. Indices are unmanaged. An investor cannot invest directly in an index. They are shown for illustrative purposes only and do not represent the performance of any specific investment. Index returns do not include any expenses, fees or sales charges, which would lower performance. For illustrative purposes only. Past performance is no guarantee of future results.

9Strategic Asset Allocation for Endowments, Foundations and Non-profits | Fixed Income Component | November 2020 |
Summary and Conclusion
In this article, we attempted to answer the question of what is an appropriate fixed income benchmark for a typical EF&N strategic asset allocation. We reviewed several possible asset class benchmarks, evaluating them on the basis of risk and return under various market conditions.
We find the Intermediate IG and two long duration IG benchmarks have relatively better stand-alone statistics than HY and EM Debt over a long-term period. The IG benchmarks also offer downside protection during market stress.
Among the three IG benchmarks in a stand-alone setting, intermediate IG seems to be more favorable than the two long duration IG benchmarks, given its highest Sharpe Ratio. However, long duration IG 1 outperforms in many stress environments (including in the recent COVID-19 crisis), better offsetting equity risk.
Within a long term portfolio context, portfolios with long duration IG 1 performs similarly to those with a long duration IG 2 or a pure intermediate IG fixed income component. However, in the stress periods,
the portfolio with long duration IG 1 has superior risk/reward properties compared to portfolios with intermediate IG or long duration IG 2. This implies that in non-stress periods, portfolios with more credit exposure will perform somewhat better those with a heavier long duration Treasury exposure.
In conclusion, as evidenced by the performance of the long duration IG 1 benchmark in this analysis, long duration treasuries can play role in an asset allocation. Over full market cycles, portfolios with heavier long duration exposure provide similar returns to portfolios with heavier credit exposures. While heavier credit exposure portfolios out perform in non-stress periods, the long duration Treasury heavy portfolios provide a higher level of diversification benefit and downside protection, especially during equity market stress periods. Thus, given similar overall performance over full market cycles, but better downside protection, it may be appropriate to include a higher or increased weighting to long duration Treasuries in the fixed income component of an Endowment, Foundation and Non-profit strategic asset allocations.
10Strategic Asset Allocation for Endowments, Foundations and Non-profits | Fixed Income Component | November 2020 |
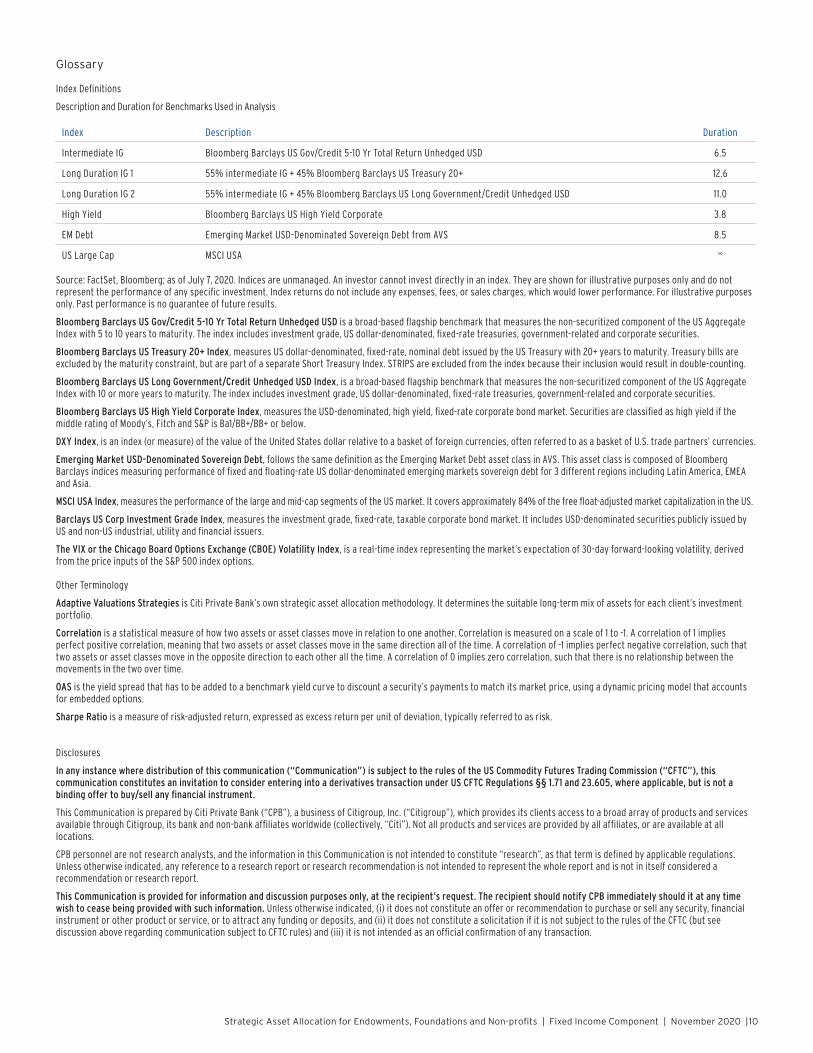
Glossary
Index Definitions
Description and Duration for Benchmarks Used in Analysis
Index Description Duration
Intermediate IG Bloomberg Barclays US Gov/Credit 5-10 Yr Total Return Unhedged USD 6.5
Long Duration IG 1 55% intermediate IG + 45% Bloomberg Barclays US Treasury 20+ 12.6
Long Duration IG 2 55% intermediate IG + 45% Bloomberg Barclays US Long Government/Credit Unhedged USD 11.0
High Yield Bloomberg Barclays US High Yield Corporate 3.8
EM Debt Emerging Market USD-Denominated Sovereign Debt from AVS 8.5
US Large Cap MSCI USA ∞
Source: FactSet, Bloomberg; as of July 7, 2020. Indices are unmanaged. An investor cannot invest directly in an index. They are shown for illustrative purposes only and do not represent the performance of any specific investment. Index returns do not include any expenses, fees, or sales charges, which would lower performance. For illustrative purposes only. Past performance is no guarantee of future results.
Bloomberg Barclays US Gov/Credit 5-10 Yr Total Return Unhedged USD is a broad-based flagship benchmark that measures the non-securitized component of the US Aggregate Index with 5 to 10 years to maturity. The index includes investment grade, US dollar-denominated, fixed-rate treasuries, government-related and corporate securities.
Bloomberg Barclays US Treasury 20+ Index, measures US dollar-denominated, fixed-rate, nominal debt issued by the US Treasury with 20+ years to maturity. Treasury bills are excluded by the maturity constraint, but are part of a separate Short Treasury Index. STRIPS are excluded from the index because their inclusion would result in double-counting.
Bloomberg Barclays US Long Government/Credit Unhedged USD Index, is a broad-based flagship benchmark that measures the non-securitized component of the US Aggregate Index with 10 or more years to maturity. The index includes investment grade, US dollar-denominated, fixed-rate treasuries, government-related and corporate securities.
Bloomberg Barclays US High Yield Corporate Index, measures the USD-denominated, high yield, fixed-rate corporate bond market. Securities are classified as high yield if the middle rating of Moody’s, Fitch and S&P is Ba1/BB+/BB+ or below.
DXY Index, is an index (or measure) of the value of the United States dollar relative to a basket of foreign currencies, often referred to as a basket of U.S. trade partners’ currencies.
Emerging Market USD-Denominated Sovereign Debt, follows the same definition as the Emerging Market Debt asset class in AVS. This asset class is composed of Bloomberg Barclays indices measuring performance of fixed and floating-rate US dollar-denominated emerging markets sovereign debt for 3 different regions including Latin America, EMEA and Asia.
MSCI USA Index, measures the performance of the large and mid-cap segments of the US market. It covers approximately 84% of the free float-adjusted market capitalization in the US.
Barclays US Corp Investment Grade Index, measures the investment grade, fixed-rate, taxable corporate bond market. It includes USD-denominated securities publicly issued by US and non-US industrial, utility and financial issuers.
The VIX or the Chicago Board Options Exchange (CBOE) Volatility Index, is a real-time index representing the market’s expectation of 30-day forward-looking volatility, derived from the price inputs of the S&P 500 index options.
Other Terminology
Adaptive Valuations Strategies is Citi Private Bank’s own strategic asset allocation methodology. It determines the suitable long-term mix of assets for each client’s investment portfolio.
Correlation is a statistical measure of how two assets or asset classes move in relation to one another. Correlation is measured on a scale of 1 to -1. A correlation of 1 implies perfect positive correlation, meaning that two assets or asset classes move in the same direction all of the time. A correlation of -1 implies perfect negative correlation, such that two assets or asset classes move in the opposite direction to each other all the time. A correlation of 0 implies zero correlation, such that there is no relationship between the movements in the two over time.
OAS is the yield spread that has to be added to a benchmark yield curve to discount a security’s payments to match its market price, using a dynamic pricing model that accounts for embedded options.
Sharpe Ratio is a measure of risk-adjusted return, expressed as excess return per unit of deviation, typically referred to as risk.
Disclosures
In any instance where distribution of this communication (“Communication”) is subject to the rules of the US Commodity Futures Trading Commission (“CFTC”), this communication constitutes an invitation to consider entering into a derivatives transaction under US CFTC Regulations §§ 1.71 and 23.605, where applicable, but is not a binding offer to buy/sell any financial instrument.
This Communication is prepared by Citi Private Bank (“CPB”), a business of Citigroup, Inc. (“Citigroup”), which provides its clients access to a broad array of products and services available through Citigroup, its bank and non-bank affiliates worldwide (collectively, “Citi”). Not all products and services are provided by all affiliates, or are available at all locations.
CPB personnel are not research analysts, and the information in this Communication is not intended to constitute “research”, as that term is defined by applicable regulations. Unless otherwise indicated, any reference to a research report or research recommendation is not intended to represent the whole report and is not in itself considered a recommendation or research report.
This Communication is provided for information and discussion purposes only, at the recipient’s request. The recipient should notify CPB immediately should it at any time wish to cease being provided with such information. Unless otherwise indicated, (i) it does not constitute an offer or recommendation to purchase or sell any security, financial instrument or other product or service, or to attract any funding or deposits, and (ii) it does not constitute a solicitation if it is not subject to the rules of the CFTC (but see discussion above regarding communication subject to CFTC rules) and (iii) it is not intended as an official confirmation of any transaction.

11Strategic Asset Allocation for Endowments, Foundations and Non-profits | Fixed Income Component | November 2020 |
Unless otherwise expressly indicated, this Communication does not take into account the investment objectives, risk profile or financial situation of any particular person and as such, investments mentioned in this document may not be suitable for all investors. Citi is not acting as an investment or other advisor, fiduciary or agent. The information contained herein is not intended to be an exhaustive discussion of the strategies or concepts mentioned herein or tax or legal advice. Recipients of this Communication should obtain advice based on their own individual circumstances from their own tax, financial, legal and other advisors about the risks and merits of any transaction before making an investment decision, and only make such decisions on the basis of their own objectives, experience, risk profile and resources.
The information contained in this Communication is based on generally available information and, although obtained from sources believed by Citi to be reliable, its accuracy and completeness cannot be assured, and such information may be incomplete or condensed. Any assumptions or information contained in this Communication constitute a judgment only as of the date of this document or on any specified dates and is subject to change without notice. Insofar as this Communication may contain historical and forward looking information, past performance is neither a guarantee nor an indication of future results, and future results may not meet expectations due to a variety of economic, market and other factors. Further, any projections of potential risk or return are illustrative and should not be taken as limitations of the maximum possible loss or gain. Any prices, values or estimates provided in this Communication (other than those that are identified as being historical) are indicative only, may change without notice and do not represent firm quotes as to either price or size, nor reflect the value Citi may assign a security in its inventory. Forward looking information does not indicate a level at which Citi is prepared to do a trade and may not account for all relevant assumptions and future conditions. Actual conditions may vary substantially from estimates which could have a negative impact on the value of an instrument.
Views, opinions and estimates expressed herein may differ from the opinions expressed by other Citi businesses or affiliates, and are not intended to be a forecast of future events, a guarantee of future results, or investment advice, and are subject to change without notice based on market and other conditions. Citi is under no duty to update this document and accepts no liability for any loss (whether direct, indirect or consequential) that may arise from any use of the information contained in or derived from this Communication.
Investments in financial instruments or other products carry significant risk, including the possible loss of the principal amount invested. Financial instruments or other products denominated in a foreign currency are subject to exchange rate fluctuations, which may have an adverse effect on the price or value of an investment in such products. This Communication does not purport to identify all risks or material considerations which may be associated with entering into any transaction.
Structured products can be highly illiquid and are not suitable for all investors. Additional information can be found in the disclosure documents of the issuer for each respective structured product described herein. Investing in structured products is intended only for experienced and sophisticated investors who are willing and able to bear the high economic risks of such an investment. Investors should carefully review and consider potential risks before investing.
OTC derivative transactions involve risk and are not suitable for all investors. Investment products are not insured, carry no bank or government guarantee and may lose value. Before entering into these transactions, you should: (i) ensure that you have obtained and considered relevant information from independent reliable sources concerning the financial, economic and political conditions of the relevant markets; (ii) determine that you have the necessary knowledge, sophistication and experience in financial, business and investment matters to be able to evaluate the risks involved, and that you are financially able to bear such risks; and (iii) determine, having considered the foregoing points, that capital markets transactions are suitable and appropriate for your financial, tax, business and investment objectives.
This material may mention options regulated by the US Securities and Exchange Commission. Before buying or selling options you should obtain and review the current version of the Options Clearing Corporation booklet, Characteristics and Risks of Standardized Options. A copy of the booklet can be obtained upon request from Citigroup Global Markets Inc., 390 Greenwich Street, 3rd Floor, New York, NY 10013 or by clicking the following links,
http://www.theocc.com/components/docs/riskstoc.pdf and
http://www.theocc.com/components/docs/about/publications/november_2012_supplement.pdf and
https://www.theocc.com/components/docs/about/publications/october_2018_supplement.pdf
If you buy options, the maximum loss is the premium. If you sell put options, the risk is the entire notional below the strike. If you sell call options, the risk is unlimited. The actual profit or loss from any trade will depend on the price at which the trades are executed. The prices used herein are historical and may not be available when you order is entered. Commissions and other transaction costs are not considered in these examples. Option trades in general and these trades in particular may not be appropriate for every investor. Unless noted otherwise, the source of all graphs and tables in this report is Citi. Because of the importance of tax considerations to all option transactions, the investor considering options should consult with his/her tax advisor as to how their tax situation is affected by the outcome of contemplated options transactions.
None of the financial instruments or other products mentioned in this Communication (unless expressly stated otherwise) is (i) insured by the Federal Deposit Insurance Corporation or any other governmental authority, or (ii) deposits or other obligations of, or guaranteed by, Citi or any other insured depository institution.
Citi often acts as an issuer of financial instruments and other products, acts as a market maker and trades as principal in many different financial instruments and other products, and can be expected to perform or seek to perform investment banking and other services for the issuer of such financial instruments or other products. The author of this Communication may have discussed the information contained therein with others within or outside Citi, and the author and/or such other Citi personnel may have already acted on the basis of this information (including by trading for Citi’s proprietary accounts or communicating the information contained herein to other customers of Citi). Citi, Citi’s personnel (including those with whom the author may have consulted in the preparation of this communication), and other customers of Citi may be long or short the financial instruments or other products referred to in this Communication, may have acquired such positions at prices and market conditions that are no longer available, and may have interests different from or adverse to your interests.
IRS Circular 230 Disclosure: Citi and its employees are not in the business of providing, and do not provide, tax or legal advice to any taxpayer outside Citi. Any statement in this Communication regarding tax matters is not intended or written to be used, and cannot be used or relied upon, by any taxpayer for the purpose of avoiding tax penalties. Any such taxpayer should seek advice based on the taxpayer’s particular circumstances from an independent tax advisor.
Neither Citi nor any of its affiliates can accept responsibility for the tax treatment of any investment product, whether or not the investment is purchased by a trust or company administered by an affiliate of Citi. Citi assumes that, before making any commitment to invest, the investor and (where applicable, its beneficial owners) have taken whatever tax, legal or other advice the investor/beneficial owners consider necessary and have arranged to account for any tax lawfully due on the income or gains arising from any investment product provided by Citi.
This Communication is for the sole and exclusive use of the intended recipients, and may contain information proprietary to Citi which may not be reproduced or circulated in whole or in part without Citi’s prior consent. The manner of circulation and distribution may be restricted by law or regulation in certain countries. Persons who come into possession of this document are required to inform themselves of, and to observe such restrictions. Citi accepts no liability whatsoever for the actions of third parties in this respect. Any unauthorized use, duplication, or disclosure of this document is prohibited by law and may result in prosecution.
Other businesses within Citigroup Inc. and affiliates of Citigroup Inc. may give advice, make recommendations, and take action in the interest of their clients, or for their own accounts, that may differ from the views expressed in this document. All expressions of opinion are current as of the date of this document and are subject to change without notice. Citigroup Inc. is not obligated to provide updates or changes to the information contained in this document.
The expressions of opinion are not intended to be a forecast of future events or a guarantee of future results. Past performance is not a guarantee of future results. Real results may vary.

12Strategic Asset Allocation for Endowments, Foundations and Non-profits | Fixed Income Component | November 2020 |
Although information in this document has been obtained from sources believed to be reliable, Citigroup Inc. and its affiliates do not guarantee its accuracy or completeness and accept no liability for any direct or consequential losses arising from its use. Throughout this publication where charts indicate that a third party (parties) is the source, please note that the attributed may refer to the raw data received from such parties. No part of this document may be copied, photocopied or duplicated in any form or by any means, or distributed to any person that is not an employee, officer, director, or authorized agent of the recipient without Citigroup Inc.’s prior written consent.
Citigroup Inc. may act as principal for its own account or as agent for another person in connection with transactions placed by Citigroup Inc. for its clients involving securities that are the subject of this document or future editions of the Quadrant.
Bonds are affected by a number of risks, including fluctuations in interest rates, credit risk and prepayment risk. In general, as prevailing interest rates rise, fixed income securities prices will fall. Bonds face credit risk if a decline in an issuer’s credit rating, or creditworthiness, causes a bond’s price to decline. High yield bonds are subject to additional risks such as increased risk of default and greater volatility because of the lower credit quality of the issues. Finally, bonds can be subject to prepayment risk. When interest rates fall, an issuer may choose to borrow money at a lower interest rate, while paying off its previously issued bonds. As a consequence, underlying bonds will lose the interest payments from the investment and will be forced to reinvest in a market where prevailing interest rates are lower than when the initial investment was made.
Bond rating equivalanceAlpha and/or numeric symbols used to give indications of relative credit quality. In the municipal market, these designations are published by the rating services. Internal ratings are also used by other market participants to indicate credit quality.
Bond credit quality ratings Ratings agencies
Credit risk Moody’s1 Standard and Poor’s2 Fitch Ratings2
Investment Grade
Highest quality Aaa AAA AAA
Highest quality (very strong) Aa AA AA
Upper medium grade (Strong) A A A
Medium grade Baa BBB BBB
Not Investment Grade
Lower medium grade (somewhat speculative) Ba BB BB
Low grade (speculative) B B B
Poor quality (may default) Caa CCC CCC
Most speculative Ca CC CC
No interest being paid or bankruptcy petition filed C D C
In default C D D1 The ratings from Aa to Ca by Moody’s may be modified by the addition of a 1, 2, or 3 to show relative standing within the category. 2 The ratings from AA to CC by Standard and Poor’s and Fitch Ratings may be modified by the addition of a plus or a minus to show relative standing within the category.
(MLP’s) — Energy Related MLPs May Exhibit High Volatility. While not historically very volatile, in certain market environments Energy Related MLPS may exhibit high volatility.
Changes in Regulatory or Tax Treatment of Energy Related MLPs. If the IRS changes the current tax treatment of the master limited partnerships included in the Basket of Energy Related MLPs thereby subjecting them to higher rates of taxation, or if other regulatory authorities enact regulations which negatively affect the ability of the master limited partnerships to generate income or distribute dividends to holders of common units, the return on the Notes, if any, could be dramatically reduced. Investment in a basket of Energy Related MLPs may expose the investor to concentration risk due to industry, geographical, political, and regulatory concentration.
Mortgage-backed securities (“MBS”), which include collateralized mortgage obligations (“CMOs”), also referred to as real estate mortgage investment conduits (“REMICs”), may not be suitable for all investors. There is the possibility of early return of principal due to mortgage prepayments, which can reduce expected yield and result in reinvestment risk. Conversely, return of principal may be slower than initial prepayment speed assumptions, extending the average life of the security up to its listed maturity date (also referred to as extension risk).
Additionally, the underlying collateral supporting non-Agency MBS may default on principal and interest payments. In certain cases, this could cause the income stream of the security to decline and result in loss of principal. Further, an insufficient level of credit support may result in a downgrade of a mortgage bond’s credit rating and lead to a higher probability of principal loss and increased price volatility. Investments in subordinated MBS involve greater credit risk of default than the senior classes of the same issue. Default risk may be pronounced in cases where the MBS security is secured by, or evidencing an interest in, a relatively small or less diverse pool of underlying mortgage loans.
MBS are also sensitive to interest rate changes which can negatively impact the market value of the security. During times of heightened volatility, MBS can experience greater levels of illiquidity and larger price movements. Price volatility may also occur from other factors including, but not limited to, prepayments, future prepayment expectations, credit concerns, underlying collateral performance and technical changes in the market.
Alternative investments referenced in this report are speculative and entail significant risks that can include losses due to leveraging or other speculative investment practices, lack of liquidity, volatility of returns, restrictions on transferring interests in the fund, potential lack of diversification, absence of information regarding valuations and pricing, complex tax structures and delays in tax reporting, less regulation and higher fees than mutual funds and advisor risk.
Asset allocation does not assure a profit or protect against a loss in declining financial markets.
The indexes are unmanaged. An investor cannot invest directly in an index. They are shown for illustrative purposes only and do not represent the performance of any specific investment. Index returns do not include any expenses, fees or sales charges, which would lower performance.
Past performance is no guarantee of future results.
International investing entails greater risk, as well as greater potential rewards compared to US investing. These risks include political and economic uncertainties of foreign countries as well as the risk of currency fluctuations. These risks are magnified in countries with emerging markets, since these countries may have relatively unstable governments and less established markets and economics.
Investing in smaller companies involves greater risks not associated with investing in more established companies, such as business risk, significant stock price fluctuations and illiquidity.

1996125 11/20
Factors affecting commodities generally, index components composed of futures contracts on nickel or copper, which are industrial metals, may be subject to a number of additional factors specific to industrial metals that might cause price volatility. These include changes in the level of industrial activity using industrial metals (including the availability of substitutes such as manmade or synthetic substitutes); disruptions in the supply chain, from mining to storage to smelting or refining; adjustments to inventory; variations in production costs, including storage, labor and energy costs; costs associated with regulatory compliance, including environmental regulations; and changes in industrial, government and consumer demand, both in individual consuming nations and internationally. Index components concentrated in futures contracts on agricultural products, including grains, may be subject to a number of additional factors specific to agricultural products that might cause price volatility. These include weather conditions, including floods, drought and freezing conditions; changes in government policies; planting decisions; and changes in demand for agricultural products, both with end users and as inputs into various industries.
The information contained herein is not intended to be an exhaustive discussion of the strategies or concepts mentioned herein or tax or legal advice. Readers interested in the strategies or concepts should consult their tax, legal, or other advisors, as appropriate.
Diversification does not guarantee a profit or protect against loss. Different asset classes present different risks.
Citi Private Bank is a business of Citigroup Inc. (“Citigroup”), which provides its clients access to a broad array of products and services available through bank and non-bank affiliates of Citigroup. Not all products and services are provided by all affiliates or are available at all locations. In the U.S., investment products and services are provided by Citigroup Global Markets Inc. (“CGMI”), member FINRA and SIPC, and Citi Private Advisory, LLC (“Citi Advisory”), member FINRA and SIPC. CGMI accounts are carried by Pershing LLC, member FINRA, NYSE, SIPC. Citi Advisory acts as distributor of certain alternative investment products to clients of Citi Private Bank. CGMI, Citi Advisory and Citibank, N.A. are affiliated companies under the common control of Citigroup.
Outside the U.S., investment products and services are provided by other Citigroup affiliates. Investment Management services (including portfolio management) are available through CGMI, Citi Advisory, Citibank, N.A. and other affiliated advisory businesses. These Citigroup affiliates, including Citi Advisory, will be compensated for the respective investment management, advisory, administrative, distribution and placement services they may provide.
Citibank, N.A., Hong Kong / Singapore organised under the laws of U.S.A. with limited liability. This communication is distributed in Hong Kong by Citi Private Bank operating through Citibank N.A., Hong Kong Branch, which is registered in Hong Kong with the Securities and Futures Commission for Type 1 (dealing in securities), Type 4 (advising on securities), Type 6 (advising on corporate finance) and Type 9 (asset management) regulated activities with CE No: (AAP937) or in Singapore by Citi Private Bank operating through Citibank, N.A., Singapore Branch which is regulated by the Monetary Authority of Singapore. Any questions in connection with the contents in this communication should be directed to registered or licensed representatives of the relevant aforementioned entity. The contents of this communication have not been reviewed by any regulatory authority in Hong Kong or any regulatory authority in Singapore. This communication contains confidential and proprietary information and is intended only for recipient in accordance with accredited investors requirements in Singapore (as defined under the Securities and Futures Act (Chapter 289 of Singapore) (the “Act” )) and professional investors requirements in Hong Kong(as defined under the Hong Kong Securities and Futures Ordinance and its subsidiary legislation). For regulated asset management services, any mandate will be entered into only with Citibank, N.A., Hong Kong Branch and/or Citibank, N.A. Singapore Branch, as applicable. Citibank, N.A., Hong Kong Branch or Citibank, N.A., Singapore Branch may sub-delegate all or part of its mandate to another Citigroup affiliate or other branch of Citibank, N.A. Any references to named portfolio managers are for your information only, and this communication shall not be construed to be an offer to enter into any portfolio management mandate with any other Citigroup affiliate or other branch of Citibank, N.A. and, at no time will any other Citigroup affiliate or other branch of Citibank, N.A. or any other Citigroup affiliate enter into a mandate relating to the above portfolio with you. To the extent this communication is provided to clients who are booked and/or managed in Hong Kong: No other statement(s) in this communication shall operate to remove, exclude or restrict any of your rights or obligations of Citibank under applicable laws and regulations. Citibank, N.A., Hong Kong Branch does not intend to rely on any provisions herein which are inconsistent with its obligations under the Code of Conduct for Persons Licensed by or Registered with the Securities and Futures Commission, or which mis-describes the actual services to be provided to you.
Citibank, N.A. is incorporated in the United States of America and its principal regulators are the US Office of the Comptroller of Currency and Federal Reserve under US laws, which differ from Australian laws. Citibank, N.A. does not hold an Australian Financial Services Licence under the Corporations Act 2001 as it enjoys the benefit of an exemption under ASIC Class Order CO 03/1101 (remade as ASIC Corporations (Repeal and Transitional) Instrument 2016/396 and extended by ASIC Corporations (Amendment) Instrument 2020/200).
In the United Kingdom, Citibank N.A., London Branch (registered branch number BR001018), Citigroup Centre, Canada Square, Canary Wharf, London, E14 5LB, is authorised and regulated by the Office of the Comptroller of the Currency (USA) and authorised by the Prudential Regulation Authority. Subject to regulation by the Financial Conduct Authority and limited regulation by the Prudential Regulation Authority. Details about the extent of our regulation by the Prudential Regulation Authority are available from us on request. The contact number for Citibank N.A., London Branch is +44 (0)20 7508 8000.
Citibank Europe plc is registered in Ireland with company registration number 132781. It is regulated by the Central Bank of Ireland under the reference number C26553 and supervised by the European Central Bank. Its registered office is at 1 North Wall Quay, Dublin 1, Ireland. Ultimately owned by Citigroup Inc., New York, USA. Citibank Europe plc, UK Branch is registered as a branch in the register of companies for England and Wales with registered branch number BR017844. Its registered address is Citigroup Centre, Canada Square, Canary Wharf, London E14 5LB. VAT No.: GB 429 6256 29. It is authorised by the Central Bank of Ireland and by the Prudential Regulation Authority. It is subject to supervision by the Central Bank of Ireland, and subject to limited regulation by the Financial Conduct Authority and the Prudential Regulation Authority. Details about the extent of our authorisation and regulation by the Prudential Regulation Authority, and regulation by the Financial Conduct Authority are available from us on request.
Citibank Europe plc, Luxembourg Branch is a branch of Citibank Europe plc with trade and companies register number B 200204. It is authorised in Luxembourg and supervised by the Commission de Surveillance du Secteur Financier. It appears on the Commission de Surveillance du Secteur Financier register with company number B00000395. Its business office is at 31, Z.A. Bourmicht, 8070 Bertrange, Grand Duchy of Luxembourg. Citibank Europe plc is registered in Ireland with company registration number 132781. It is regulated by the Central Bank of Ireland under the reference number C26553 and supervised by the European Central Bank. Its registered office is at 1 North Wall Quay, Dublin 1, Ireland.
In Jersey, this document is communicated by Citibank N.A., Jersey Branch which has its registered address at PO Box 104, 38 Esplanade, St Helier, Jersey JE4 8QB. Citibank N.A., Jersey Branch is regulated by the Jersey Financial Services Commission. Citibank N.A. Jersey Branch is a participant in the Jersey Bank Depositors Compensation Scheme. The Scheme offers protection for eligible deposits of up to £50,000. The maximum total amount of compensation is capped at £100,000,000 in any 5 year period. Full details of the Scheme and banking groups covered are available on the States of Jersey website www.gov.je/dcs, or on request.
In Canada, Citi Private Bank is a division of Citibank Canada, a Schedule II Canadian chartered bank. References herein to Citi Private Bank and its activities in Canada relate solely to Citibank Canada and do not refer to any affiliates or subsidiaries of Citibank Canada operating in Canada. Certain investment products are made available through Citibank Canada Investment Funds Limited (“CCIFL”), a wholly owned subsidiary of Citibank Canada. Investment Products are subject to investment risk, including possible loss of principal amount invested. Investment Products are not insured by the CDIC, FDIC or depository insurance regime of any jurisdiction and are not guaranteed by Citigroup or any affiliate thereof.
CCIFL is not currently a member, and does not intend to become a member of the Mutual Fund Dealers Association of Canada (“MFDA”); consequently, clients of CCIFL will not have available to them investor protection benefits that would otherwise derive from membership of CCIFL in the MFDA, including coverage under any investor protection plan for clients of members of the MFDA.
This document is for information purposes only and does not constitute an offer to sell or a solicitation of an offer to buy any securities to any person in any jurisdiction. The information set out herein may be subject to updating, completion, revision, verification and amendment and such information may change materially.
Citigroup, its affiliates and any of the officers, directors, employees, representatives or agents shall not be held liable for any direct, indirect, incidental, special, or consequential damages, including loss of profits, arising out of the use of information contained herein, including through errors whether caused by negligence or otherwise.
© 2020 Citigroup Inc. Citi, Citi and Arc Design and other marks used herein are service marks of Citigroup Inc. or its affiliates, used and registered throughout the world.