Strategic Advisers International Fund
60
Strategic Advisers ® International Fund Offered exclusively to certain managed account clients of Strategic Advisers LLC or its affiliates – not available for sale to the general public Semi-Annual Report August 31, 2021
Transcript of Strategic Advisers International Fund

Strategic Advisers® International FundOffered exclusively to certain managed account clients of Strategic Advisers LLC or its affiliates – not available for sale to the general public
Semi-Annual ReportAugust 31, 2021
Semi-Annual Report
Note to Shareholders 3Investment Summary 4Schedule of Investments 6Financial Statements 42Notes to Financial Statements
46
Shareholder Expense Example
55
Board Approval of Amended Sub-Advisory Agreement
56
To view a fund’s proxy voting record for the 12-month period ended June 30, visit http://www.fidelity.com/proxyvotingresults or visit the Securities and Exchange Commission’s (SEC) web site at http://www.sec.gov.You may also call 1-800-544-3455 to request a free copy of the proxy voting guidelines.Standard & Poor’s, S&P and S&P 500 are registered service marks of The McGraw-Hill Companies, Inc. and have been licensed for use by Fidelity Distributors Corporation.Other third-party marks appearing herein are the property of their respective owners.All other marks appearing herein are registered or unregistered trademarks or service marks of FMR LLC or an affiliated company. © 2021 FMR LLC. All rights reserved.
Contents
This report and the financial statements contained herein are submitted for the general information of the shareholders of the Fund. This report is not authorized for distribution to prospective investors in the Fund unless preceded or accompanied by an effective prospectus.A fund files its complete schedule of portfolio holdings with the SEC for the first and third quarters of each fiscal year on Form N-PORT. Forms N-PORT are available on the SEC’s web site at http://www.sec.gov. A fund’s Forms N-PORT may be reviewed and copied at the SEC’s Public Reference Room in Washington, DC. Information regarding the operation of the SEC’s Public Reference Room may be obtained by calling 1-800-SEC-0330.For a complete list of a fund’s portfolio holdings, view the most recent holdings listing, semiannual report, or annual report on Fidelity’s web site at http://www.fidelity.com, http://www.institutional.fidelity.com, or http://www.401k.com, as applicable.NOT FDIC INSURED •MAY LOSE VALUE •NO BANK GUARANTEENeither the Fund nor Fidelity Distributors Corporation is a bank.
3 Semi-Annual Report
Note to Shareholders:
Early in 2020, the outbreak and spread of COVID-19 emerged as a public health emergency that had a major influence on financial markets, primarily based on its impact on the global economy and corporate earnings. On March 11, 2020, the World Health Organization declared the COVID-19 outbreak a pandemic, citing sustained risk of further global spread. The pandemic prompted a number of measures to limit the spread of COVID-19, including travel and border restrictions, quarantines, and restrictions on large gatherings. In turn, these resulted in lower consumer activity, diminished demand for a wide range of products and services, disruption in manufacturing and supply chains, and – given the wide variability in outcomes regarding the outbreak – significant market uncertainty and volatility. To help stem the turmoil, the U.S. government took unprecedented action – in concert with the U.S. Federal Reserve and central banks around the world – to help support consumers, businesses, and the broader economy, and to limit disruption to the financial system.
In general, the overall impact of the pandemic lessened in 2021, amid a resilient economy and widespread distribu-tion of three COVID-19 vaccines granted emergency use authorization from the U.S. Food and Drug Administration (FDA) early in the year. Still, the situation remains dynamic, and the extent and duration of its influence on financial markets and the economy is highly uncertain, due in part to a recent spike in cases based on highly contagious variants of the coronavirus.
Extreme events such as the COVID-19 crisis are exogenous shocks that can have significant adverse effects on mutual funds and their investments. Although multiple asset classes may be affected by market disruption, the duration and impact may not be the same for all types of assets. Fidelity is committed to helping you stay informed amid news about COVID-19 and during increased market volatility, and we continue to take extra steps to be responsive to customer needs. We encourage you to visit us online, where we offer ongoing updates, commentary, and analysis on the markets and our funds.

4Semi-Annual Report
Investment Summary (Unaudited)
The information in the following tables is based on the direct investments of the Fund.
Top Ten Holdings as of August 31, 2021
(excluding cash equivalents) % of fund’s net assets
Fidelity Advisor International Discovery Fund – Class Z 5.3Fidelity SAI Japan Stock Index Fund 5.2Fidelity SAI International Value Index Fund 4.2Oakmark International Fund Investor Class 4.0Artisan International Value Fund Investor Class 3.9Fidelity Overseas Fund 3.6WCM Focused International Growth Fund Investor Class 3.1Fidelity Diversified International Fund 3.0JOHCM International Select Fund Investor Shares 2.7Fidelity SAI International Index Fund 2.6
37.6
Top Five Market Sectors as of August 31, 2021
(stocks only) % of fund’s net assetsIndustrials 8.4Information Technology 7.1Financials 6.2Health Care 5.0Consumer Staples 5.0
Geographic Diversification (% of fund’s net assets)
As of August 31, 2021
United States of America* 56.7%
Japan 8.0%
United Kingdom 5.9%
Switzerland 5.1%
France 4.9%
Germany 4.6%
Netherlands 2.8%
Sweden 0.8%
Canada 1.1%
Other 10.1%
* Includes Short-Term investments and Net Other Assets (Liabilities).
Percentages are based on country or territory of incorporation and are adjusted for the effect of futures contracts, if applicable.

5 Semi-Annual Report
Asset Allocation (% of fund’s net assets)
As of August 31, 2021
Common Stocks 44.0%
Preferred Stocks 0.4%
Europe Stock Funds 0.4%
Foreign Large Blend Funds 9.2%
Foreign Large Growth Funds 19.2%
Foreign Large Value Funds 11.1%
Foreign Small Mid Growth Funds 0.9%
Foreign Small Mid Blend Funds 1.5%
Foreign Small Mid Value Funds 1.1%
Other 6.5%
Short-Term Investments and Net Other Assets (Liabilities) 5.7%
Asset allocations of funds in the pie chart reflect the categorizations of assets as defined by Morningstar as of the reporting date.

6Semi-Annual Report
See accompanying notes which are an integral part of the financial statements.
Common Stocks – 44.0%Shares Value
COMMUNICATION SERVICES – 1.6%Diversified Telecommunication Services – 0.4%Cellnex Telecom SA (a) 142,847 $ 9,782,663Deutsche Telekom AG 216,749 4,608,789Hellenic Telecommunications Organization SA 346,950 6,827,004Internet Initiative Japan, Inc. 8,300 289,329Koninklijke KPN NV 1,630,204 5,222,143KT Corp. 164,909 4,662,804Liberty Global PLC Class C (b) 486,600 14,101,668Nippon Telegraph & Telephone Corp. 1,181,700 31,483,788Nippon Telegraph & Telephone Corp. sponsored ADR 7,923 212,099NOS SGPS 74,987 316,091Orange SA 653,614 7,431,069Proximus 26,927 527,940Telecom Italia SpA (Risparmio Shares) 7,680,092 3,708,015Telstra Corp. Ltd. 64,914 182,353
89,355,755Entertainment – 0.4%CTS Eventim AG (b) 51,718 3,335,426Konami Holdings Corp. 21,600 1,370,431NetEase, Inc. 358,675 6,866,402NetEase, Inc. ADR 240,025 23,383,236Nintendo Co. Ltd. 39,200 18,833,227Nintendo Co. Ltd. ADR 37,985 2,282,139Sea Ltd. ADR (b) 40,081 13,560,204Square Enix Holdings Co. Ltd. 178,300 10,388,611Ubisoft Entertainment SA (b) 139,600 8,867,662
88,887,338Interactive Media & Services – 0.4%Bengo4.Com, Inc. (b) 16,200 1,023,406carsales.com Ltd. 229,365 4,211,578Info Edge India Ltd. 34,221 2,900,114Kakao Corp. 67,018 8,963,453NAVER Corp. 61,419 23,265,877REA Group Ltd. 28,794 3,233,362Scout24 AG (a) 104,370 8,774,323SEEK Ltd. 190,255 4,528,951Tencent Holdings Ltd. 561,100 34,655,107Trustpilot Group PLC (a) (b) (c) 420,871 2,499,701Yandex NV Series A (b) 89,037 6,846,945Z Holdings Corp. 1,106,600 7,212,037
108,114,854
Schedule of Investments August 31, 2021 (Unaudited)Showing Percentage of Net Assets

7 Semi-Annual Report
See accompanying notes which are an integral part of the financial statements.
Common Stocks – continuedShares Value
COMMUNICATION SERVICES – continuedMedia – 0.2%Arnoldo Mondadori Editore SpA (b) 66,040 $ 145,661CyberAgent, Inc. 688,600 12,649,735Eutelsat Communications 171,546 1,981,373Hakuhodo DY Holdings, Inc. 132,500 2,084,784Informa PLC (b) 1,266,069 9,242,878Mediaset SpA 109,336 340,820Publicis Groupe SA 59,246 3,883,886SES SA (France) (depositary receipt) 62,583 522,289Stroer Out-of-Home Media AG 65,599 5,398,685WPP PLC 975,335 13,224,427WPP PLC ADR (c) 50,688 3,441,715
52,916,253Wireless Telecommunication Services – 0.2%Advanced Info Service PCL (For. Reg.) 1,014,200 5,909,487KDDI Corp. 463,400 14,164,006Millicom International Cellular SA (b) (c) 7,500 282,675SoftBank Group Corp. 275,200 15,508,557Tele2 AB (B Shares) 129,128 1,935,547Vodafone Group PLC sponsored ADR (c) 749,078 12,786,761
50,587,033
TOTAL COMMUNICATION SERVICES 389,861,233
CONSUMER DISCRETIONARY – 4.1%Auto Components – 0.5%Aisin Seiki Co. Ltd. 46,000 1,758,215Autoliv, Inc. (depositary receipt) (c) 70,131 6,244,739Bridgestone Corp. 188,700 8,685,877Compagnie Generale des Etablissements Michelin SCA Series B 65,349 10,579,735Continental AG (b) 86,845 11,670,897DENSO Corp. 109,900 7,701,941Eagle Industry Co. Ltd. 41,300 469,254JTEKT Corp. 73,600 665,655Koito Manufacturing Co. Ltd. 200,000 12,234,695Magna International, Inc. Class A 190,796 15,055,712Musashi Seimitsu Industry Co. Ltd. 44,100 776,455NGK Spark Plug Co. Ltd. 12,100 186,095Piolax, Inc. 60,500 839,186Shoei Co. Ltd. 18,300 803,427Stanley Electric Co. Ltd. 201,200 5,025,657Sumitomo Rubber Industries Ltd. 226,000 2,709,576

8Semi-Annual Report
See accompanying notes which are an integral part of the financial statements.
Schedule of Investments (Unaudited) – continued
Common Stocks – continuedShares Value
CONSUMER DISCRETIONARY – continuedAuto Components – continuedToyoda Gosei Co. Ltd. 11,100 $ 236,095Toyota Industries Corp. 420,600 35,516,739TPR Co. Ltd. 19,100 258,162Valeo SA 412,347 11,724,040Yorozu Corp. 17,400 188,527
133,330,679Automobiles – 0.3%Honda Motor Co. Ltd. 417,900 12,648,430Honda Motor Co. Ltd. sponsored ADR 86,139 2,606,566Isuzu Motors Ltd. 121,900 1,542,379Mazda Motor Corp. (b) 322,300 2,797,768Mitsubishi Motors Corp. of Japan (b) 418,300 1,068,421Nissan Motor Co. Ltd. (b) 752,100 3,945,588Nissan Motor Co. Ltd. sponsored ADR (b) (c) 68,800 723,088Porsche Automobil Holding SE ADR 82,300 827,938Renault SA (b) 89,223 3,313,259Stellantis NV 496,064 9,921,054Suzuki Motor Corp. 175,800 7,599,916Toyota Motor Corp. 279,600 24,351,300Yamaha Motor Co. Ltd. 314,100 7,994,183
79,339,890Distributors – 0.0%B&S Group SARL (a) 89,741 928,224Inchcape PLC 679,229 8,586,640Tadiran Group Ltd. 329 42,861
9,557,725Hotels, Restaurants & Leisure – 0.5%Aristocrat Leisure Ltd. 288,110 9,625,723Compass Group PLC (b) 2,100,652 43,399,374Entain PLC (b) 429,700 11,419,643Evolution AB (a) 66,032 10,639,252Flutter Entertainment PLC (b) 52,746 10,235,893Food & Life Companies Ltd. (c) 71,300 3,065,482Greggs PLC 32,864 1,374,469Marston’s PLC (b) 673,775 799,894Sands China Ltd. (b) 6,270,000 20,142,996Trainline PLC (a) (b) 381,278 1,917,524Yum China Holdings, Inc. 152,144 9,365,985
121,986,235Household Durables – 0.5%Barratt Developments PLC 641,100 6,513,667

9 Semi-Annual Report
See accompanying notes which are an integral part of the financial statements.
Common Stocks – continuedShares Value
CONSUMER DISCRETIONARY – continuedHousehold Durables – continuedCrest Nicholson Holdings PLC 75,968 $ 438,458Crompton Greaves Consumer Electricals Ltd. 415,728 2,698,063Electra Consumer Products 1970 Ltd. 1,912 106,156Forbo Holding AG (Reg.) 439 940,560Iida Group Holdings Co. Ltd. 11,700 297,352Nikon Corp. 510,700 5,380,187Panasonic Corp. 907,100 10,844,448Persimmon PLC 574,387 23,217,062Sangetsu Corp. 10,500 153,565Sekisui Chemical Co. Ltd. 24,300 416,136Sekisui House Ltd. 153,000 3,049,848Sony Group Corp. 544,300 56,278,106
110,333,608Internet & Direct Marketing Retail – 0.5%Alibaba Group Holding Ltd. (b) 551,916 11,556,896Alibaba Group Holding Ltd. sponsored ADR (b) 19,438 3,245,952Allegro.eu SA (a) (b) 221,415 4,104,977ASKUL Corp. 31,200 488,922ASOS PLC (b) 193,245 10,319,123Boohoo.Com PLC (b) 468,798 1,822,078Coupang, Inc. Class A (b) (c) 61,813 1,851,917HelloFresh AG (b) 75,413 8,127,927JD.com, Inc. Class A (b) 160,400 6,303,973Meituan Class B (a) (b) 175,100 5,598,748MercadoLibre, Inc. (b) 4,866 9,087,012Ocado Group PLC (b) 121,841 3,372,039Prosus NV 91,709 8,117,670Rakuten Group, Inc. 1,492,200 15,625,273THG PLC 388,293 3,285,814Zalando SE (a) (b) 189,109 20,944,644ZOZO, Inc. 86,700 3,305,972
117,158,937Leisure Products – 0.1%Sega Sammy Holdings, Inc. 560,200 7,566,761SHIMANO, Inc. 15,500 4,550,743Thule Group AB (a) 53,347 2,911,708Yamaha Corp. 110,200 6,500,914
21,530,126Multiline Retail – 0.1%Harvey Norman Holdings Ltd. 80,288 315,993Magazine Luiza SA 936,900 3,304,915

10Semi-Annual Report
See accompanying notes which are an integral part of the financial statements.
Schedule of Investments (Unaudited) – continued
Common Stocks – continuedShares Value
CONSUMER DISCRETIONARY – continuedMultiline Retail – continuedMarks & Spencer Group PLC (b) 737,812 $ 1,820,814Next PLC 84,531 9,192,800Shinsegae Co. Ltd. 2,718 630,890Tokmanni Group Corp. 20,527 591,389Wesfarmers Ltd. 78,906 3,460,535
19,317,336Specialty Retail – 0.2%Geo Holdings Corp. 16,700 181,094H&M Hennes & Mauritz AB (B Shares) (b) 317,635 6,366,356Halfords Group PLC 126,511 632,423JD Sports Fashion PLC 24,975 346,631Kingfisher PLC 5,997,135 28,876,356Mekonomen AB (b) 70,377 1,321,998Sleep Country Canada Holdings, Inc. (a) 9,400 253,096USS Co. Ltd. 96,400 1,595,641WH Smith PLC (b) 696,791 15,634,284
55,207,879Textiles, Apparel & Luxury Goods – 1.4%adidas AG 81,238 28,819,695adidas AG sponsored ADR 3,088 548,120Asics Corp. 33,800 717,384Brunello Cucinelli SpA (b) 40,160 2,366,204Burberry Group PLC 209,962 5,367,749Canada Goose Holdings, Inc. (b) 79,020 3,031,997Compagnie Financiere Richemont SA:
ADR 21,100 231,784warrants 11/22/23 (b) 562,417 288,655Series A 694,008 76,598,519
Dr. Martens Ltd. (b) 936,378 5,440,465Essilor International SA 183,783 36,078,716Gildan Activewear, Inc. 541 20,797Hermes International SCA 4,382 6,439,101Hugo Boss AG 19,372 1,081,001Kering SA 33,477 26,641,850Li Ning Co. Ltd. 1,050,000 14,108,095lululemon athletica, Inc. (b) 27,092 10,841,406LVMH Moet Hennessy Louis Vuitton SE 104,760 77,607,294Moncler SpA 212,240 13,582,649Pandora A/S 44,544 5,332,663Puma AG 92,373 11,212,336Salvatore Ferragamo Italia SpA (b) 71,453 1,458,725
11 Semi-Annual Report
See accompanying notes which are an integral part of the financial statements.
Common Stocks – continuedShares Value
CONSUMER DISCRETIONARY – continuedTextiles, Apparel & Luxury Goods – continuedSamsonite International SA (a) (b) 1,750,200 $ 3,663,573Seiren Co. Ltd. 23,100 401,885Swatch Group AG (Bearer) 13,741 3,874,339Swatch Group AG (Bearer) (Reg.) 86,127 4,735,457TSI Holdings Co. Ltd. (b) 14,600 41,140
340,531,599
TOTAL CONSUMER DISCRETIONARY 1,008,294,014
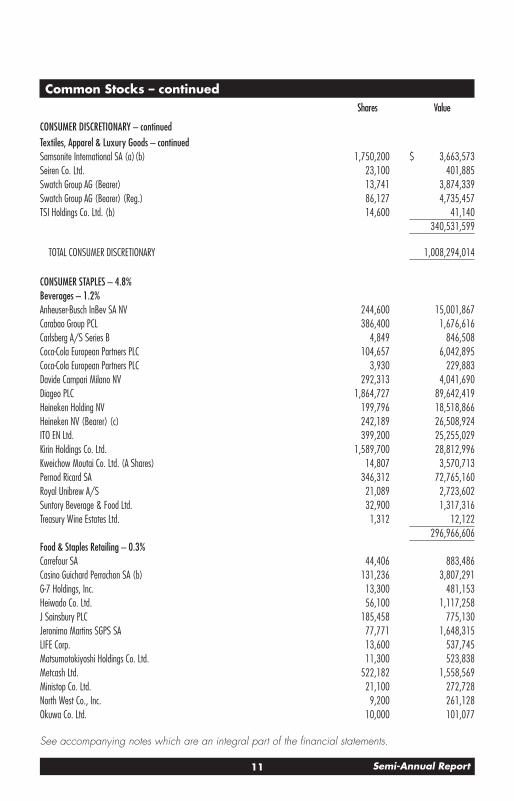
CONSUMER STAPLES – 4.8%Beverages – 1.2%Anheuser-Busch InBev SA NV 244,600 15,001,867Carabao Group PCL 386,400 1,676,616Carlsberg A/S Series B 4,849 846,508Coca-Cola European Partners PLC 104,657 6,042,895Coca-Cola European Partners PLC 3,930 229,883Davide Campari Milano NV 292,313 4,041,690Diageo PLC 1,864,727 89,642,419Heineken Holding NV 199,796 18,518,866Heineken NV (Bearer) (c) 242,189 26,508,924ITO EN Ltd. 399,200 25,255,029Kirin Holdings Co. Ltd. 1,589,700 28,812,996Kweichow Moutai Co. Ltd. (A Shares) 14,807 3,570,713Pernod Ricard SA 346,312 72,765,160Royal Unibrew A/S 21,089 2,723,602Suntory Beverage & Food Ltd. 32,900 1,317,316Treasury Wine Estates Ltd. 1,312 12,122
296,966,606Food & Staples Retailing – 0.3%Carrefour SA 44,406 883,486Casino Guichard Perrachon SA (b) 131,236 3,807,291G-7 Holdings, Inc. 13,300 481,153Heiwado Co. Ltd. 56,100 1,117,258J Sainsbury PLC 185,458 775,130Jeronimo Martins SGPS SA 77,771 1,648,315LIFE Corp. 13,600 537,745Matsumotokiyoshi Holdings Co. Ltd. 11,300 523,838Metcash Ltd. 522,182 1,558,569Ministop Co. Ltd. 21,100 272,728North West Co., Inc. 9,200 261,128Okuwa Co. Ltd. 10,000 101,077

12Semi-Annual Report
See accompanying notes which are an integral part of the financial statements.
Schedule of Investments (Unaudited) – continued
Common Stocks – continuedShares Value
CONSUMER STAPLES – continuedFood & Staples Retailing – continuedQol Holdings Co. Ltd. 60,100 $ 853,850Seven & i Holdings Co. Ltd. 884,700 38,720,452Sugi Holdings Co. Ltd. 70,000 5,408,353Tesco PLC 5,592,552 19,633,339Welcia Holdings Co. Ltd. 135,400 4,781,430Zur Rose Group AG (b) 5,107 2,197,279
83,562,421Food Products – 1.5%Barry Callebaut AG 2,902 7,396,416Chacha Food Co. Ltd. (A Shares) 226,000 1,280,645Danone SA 789,400 57,646,553Dydo Group Holdings, Inc. 2,100 107,276Ezaki Glico Co. Ltd. 209,600 7,925,610Foshan Haitian Flavouring & Food Co. Ltd. (A Shares) 207,870 3,055,937Itoham Yonekyu Holdings, Inc. 127,800 863,113Kerry Group PLC Class A 112,601 16,512,841La Doria SpA 41,028 882,646Lindt & Spruengli AG (participation certificate) 429 5,045,405Mitsui Sugar Co. Ltd. 3,200 56,283Mowi ASA 521,000 13,956,454Nestle SA (Reg. S) 1,749,978 221,002,714Nippon Suisan Kaisha Co. Ltd. 136,700 752,990Nissin Food Holdings Co. Ltd. 70,800 5,508,776Orior AG 9,536 978,852Riken Vitamin Co. Ltd. 23,000 381,121Schouw & Co. 812 88,056Toyo Suisan Kaisha Ltd. 486,800 20,155,197Wilmar International Ltd. 2,885,300 8,884,780Yakult Honsha Co. Ltd. 1,700 97,968Yamazaki Baking Co. Ltd. 33,400 547,989
373,127,622Household Products – 0.4%Colgate-Palmolive Co. 276,743 21,572,117Essity AB (B Shares) 229,500 7,361,489Lion Corp. 270,800 4,610,357Reckitt Benckiser Group PLC 811,777 61,972,049
95,516,012Personal Products – 1.1%Blackmores Ltd. 7,854 573,410Kao Corp. 695,700 42,027,198Kobayashi Pharmaceutical Co. Ltd. 262,800 20,567,268
13 Semi-Annual Report
See accompanying notes which are an integral part of the financial statements.
Common Stocks – continuedShares Value
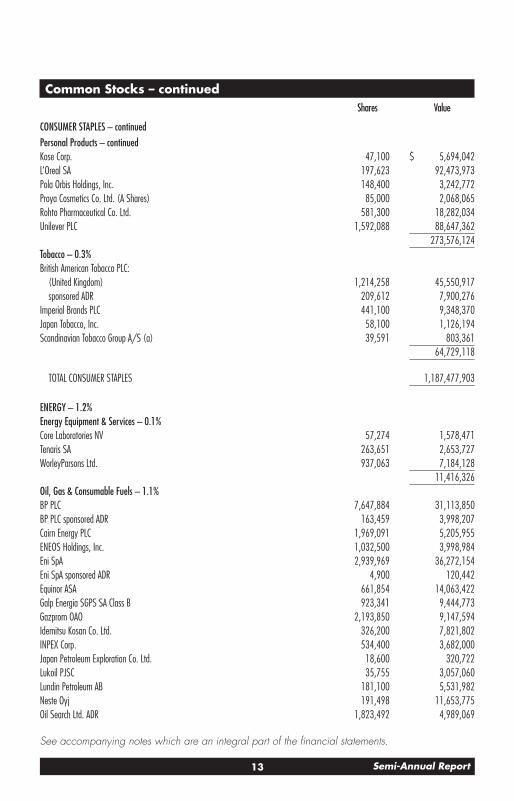
CONSUMER STAPLES – continuedPersonal Products – continuedKose Corp. 47,100 $ 5,694,042L’Oreal SA 197,623 92,473,973Pola Orbis Holdings, Inc. 148,400 3,242,772Proya Cosmetics Co. Ltd. (A Shares) 85,000 2,068,065Rohto Pharmaceutical Co. Ltd. 581,300 18,282,034Unilever PLC 1,592,088 88,647,362
273,576,124Tobacco – 0.3%British American Tobacco PLC:
(United Kingdom) 1,214,258 45,550,917sponsored ADR 209,612 7,900,276
Imperial Brands PLC 441,100 9,348,370Japan Tobacco, Inc. 58,100 1,126,194Scandinavian Tobacco Group A/S (a) 39,591 803,361
64,729,118
TOTAL CONSUMER STAPLES 1,187,477,903
ENERGY – 1.2%Energy Equipment & Services – 0.1%Core Laboratories NV 57,274 1,578,471Tenaris SA 263,651 2,653,727WorleyParsons Ltd. 937,063 7,184,128
11,416,326Oil, Gas & Consumable Fuels – 1.1%BP PLC 7,647,884 31,113,850BP PLC sponsored ADR 163,459 3,998,207Cairn Energy PLC 1,969,091 5,205,955ENEOS Holdings, Inc. 1,032,500 3,998,984Eni SpA 2,939,969 36,272,154Eni SpA sponsored ADR 4,900 120,442Equinor ASA 661,854 14,063,422Galp Energia SGPS SA Class B 923,341 9,444,773Gazprom OAO 2,193,850 9,147,594Idemitsu Kosan Co. Ltd. 326,200 7,821,802INPEX Corp. 534,400 3,682,000Japan Petroleum Exploration Co. Ltd. 18,600 320,722Lukoil PJSC 35,755 3,057,060Lundin Petroleum AB 181,100 5,531,982Neste Oyj 191,498 11,653,775Oil Search Ltd. ADR 1,823,492 4,989,069

14Semi-Annual Report
See accompanying notes which are an integral part of the financial statements.
Schedule of Investments (Unaudited) – continued
Common Stocks – continuedShares Value
ENERGY – continuedOil, Gas & Consumable Fuels – continuedOMV AG 123,777 $ 6,858,805Reliance Industries Ltd. 24,740 548,478Reliance Industries Ltd. 624,027 19,316,343Repsol SA 539,539 6,182,674Rosneft Oil Co. OJSC 420,640 3,066,615Royal Dutch Shell PLC 72,464 1,425,461Royal Dutch Shell PLC:
Class B sponsored ADR 196,199 7,724,355Class B (United Kingdom) 177,103 3,484,965rights (b) (d) 177,103 42,312rights (b) (d) 72,464 17,535
San-Ai Oil Co. Ltd. 24,600 307,011Santos Ltd. 2,187,400 9,681,164TC Energy Corp. 155,191 7,368,082Total SA 1,536,146 67,947,775
284,393,366
TOTAL ENERGY 295,809,692
FINANCIALS – 6.2%Banks – 2.5%ABN AMRO Group NV GDR (a) 26,761 373,552AIB Group PLC (b) 5,914,413 17,842,697Australia & New Zealand Banking Group Ltd. 395,508 8,057,949Banco Bilbao Vizcaya Argentaria SA 3,361,005 21,997,761Barclays PLC 7,944,941 20,143,694BNP Paribas SA 569,330 36,066,986CaixaBank SA 9,107,938 28,293,328Chiba Bank Ltd. 719,600 4,493,616Close Brothers Group PLC 131,904 2,798,203Credicorp Ltd. (United States) 91,371 9,742,890DBS Group Holdings Ltd. 1,081,000 24,097,267DNB Bank ASA 863,519 18,235,281Erste Group Bank AG 176,985 7,075,895First International Bank of Israel 9,258 334,498Grupo Financiero Banorte S.A.B. de CV Series O 1,125,389 7,429,002HDFC Bank Ltd. 1,529,623 33,158,501Hokuhoku Financial Group, Inc. 16,800 128,884ING Groep NV:
(Certificaten Van Aandelen) 3,250,176 44,834,164sponsored ADR (c) 23,900 329,342
15 Semi-Annual Report
See accompanying notes which are an integral part of the financial statements.
Common Stocks – continuedShares Value
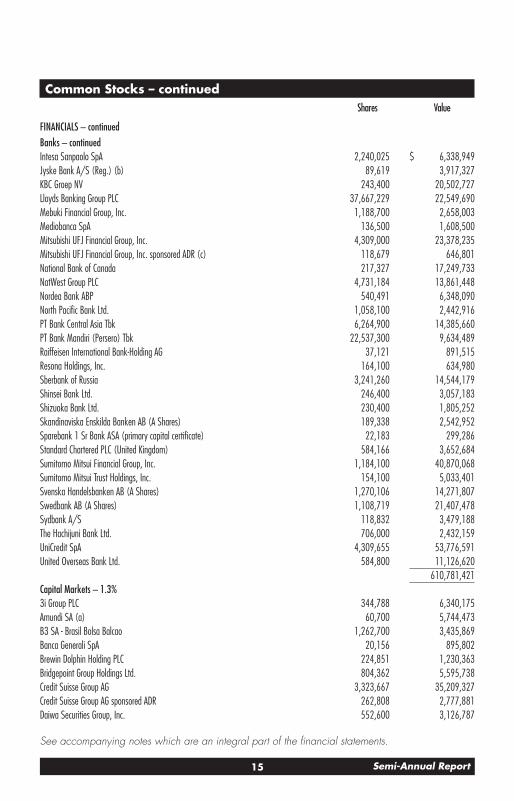
FINANCIALS – continuedBanks – continuedIntesa Sanpaolo SpA 2,240,025 $ 6,338,949Jyske Bank A/S (Reg.) (b) 89,619 3,917,327KBC Groep NV 243,400 20,502,727Lloyds Banking Group PLC 37,667,229 22,549,690Mebuki Financial Group, Inc. 1,188,700 2,658,003Mediobanca SpA 136,500 1,608,500Mitsubishi UFJ Financial Group, Inc. 4,309,000 23,378,235Mitsubishi UFJ Financial Group, Inc. sponsored ADR (c) 118,679 646,801National Bank of Canada 217,327 17,249,733NatWest Group PLC 4,731,184 13,861,448Nordea Bank ABP 540,491 6,348,090North Pacific Bank Ltd. 1,058,100 2,442,916PT Bank Central Asia Tbk 6,264,900 14,385,660PT Bank Mandiri (Persero) Tbk 22,537,300 9,634,489Raiffeisen International Bank-Holding AG 37,121 891,515Resona Holdings, Inc. 164,100 634,980Sberbank of Russia 3,241,260 14,544,179Shinsei Bank Ltd. 246,400 3,057,183Shizuoka Bank Ltd. 230,400 1,805,252Skandinaviska Enskilda Banken AB (A Shares) 189,338 2,542,952Sparebank 1 Sr Bank ASA (primary capital certificate) 22,183 299,286Standard Chartered PLC (United Kingdom) 584,166 3,652,684Sumitomo Mitsui Financial Group, Inc. 1,184,100 40,870,068Sumitomo Mitsui Trust Holdings, Inc. 154,100 5,033,401Svenska Handelsbanken AB (A Shares) 1,270,106 14,271,807Swedbank AB (A Shares) 1,108,719 21,407,478Sydbank A/S 118,832 3,479,188The Hachijuni Bank Ltd. 706,000 2,432,159UniCredit SpA 4,309,655 53,776,591United Overseas Bank Ltd. 584,800 11,126,620
610,781,421Capital Markets – 1.3%3i Group PLC 344,788 6,340,175Amundi SA (a) 60,700 5,744,473B3 SA - Brasil Bolsa Balcao 1,262,700 3,435,869Banca Generali SpA 20,156 895,802Brewin Dolphin Holding PLC 224,851 1,230,363Bridgepoint Group Holdings Ltd. 804,362 5,595,738Credit Suisse Group AG 3,323,667 35,209,327Credit Suisse Group AG sponsored ADR 262,808 2,777,881Daiwa Securities Group, Inc. 552,600 3,126,787

16Semi-Annual Report
See accompanying notes which are an integral part of the financial statements.
Schedule of Investments (Unaudited) – continued
Common Stocks – continuedShares Value
FINANCIALS – continuedCapital Markets – continuedDeutsche Borse AG 98,300 $ 16,957,495Euronext NV (a) 298,701 34,651,911Hong Kong Exchanges and Clearing Ltd. 175,500 11,075,018IG Group Holdings PLC 168,600 2,170,804Intermediate Capital Group PLC 199,939 6,041,997Japan Exchange Group, Inc. 29,300 697,511Julius Baer Group Ltd. 465,768 31,790,345Jupiter Fund Management PLC 142,203 522,006London Stock Exchange Group PLC 107,186 11,741,571Macquarie Group Ltd. 302,025 36,840,601Man Group PLC 1,761,161 5,244,606Netwealth Group Ltd. 161,351 1,843,727Nomura Holdings, Inc. 1,657,900 8,006,400Partners Group Holding AG 10,153 18,005,429Platinum Asset Management Ltd. 328,001 954,998Polar Capital Holdings PLC 33,961 409,949Ratos AB (B Shares) 85,737 566,814UBS Group AG 3,277,601 54,689,318Vontobel Holdings AG 5,866 548,967XP, Inc. Class A (b) 70,671 3,438,144
310,554,026Consumer Finance – 0.0%Hoist Finance AB (a) (b) 34,970 138,997Diversified Financial Services – 0.4%Challenger Ltd. 765,260 3,610,877Element Fleet Management Corp. 942,604 10,392,440EXOR NV 72,100 6,010,325Groupe Bruxelles Lambert SA 118,729 13,612,378Hypoport AG (b) 3,509 2,423,802Industrivarden AB:
(A Shares) 58,039 2,136,079(C Shares) 100,658 3,508,674
Investment AB Oresund 21,591 423,841Investor AB:
(A Shares) 73,161 1,754,959(B Shares) 716,636 17,140,568
L E Lundbergforetagen AB 79,909 5,100,427M&G PLC 144,018 407,886Mitsubishi UFJ Lease & Finance Co. Ltd. 751,700 4,024,463
17 Semi-Annual Report
See accompanying notes which are an integral part of the financial statements.
Common Stocks – continuedShares Value
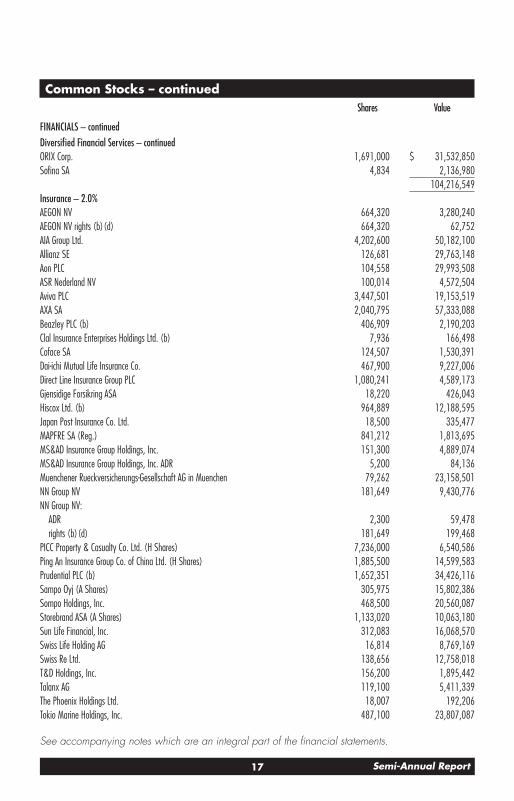
FINANCIALS – continuedDiversified Financial Services – continuedORIX Corp. 1,691,000 $ 31,532,850Sofina SA 4,834 2,136,980
104,216,549Insurance – 2.0%AEGON NV 664,320 3,280,240AEGON NV rights (b) (d) 664,320 62,752AIA Group Ltd. 4,202,600 50,182,100Allianz SE 126,681 29,763,148Aon PLC 104,558 29,993,508ASR Nederland NV 100,014 4,572,504Aviva PLC 3,447,501 19,153,519AXA SA 2,040,795 57,333,088Beazley PLC (b) 406,909 2,190,203Clal Insurance Enterprises Holdings Ltd. (b) 7,936 166,498Coface SA 124,507 1,530,391Dai-ichi Mutual Life Insurance Co. 467,900 9,227,006Direct Line Insurance Group PLC 1,080,241 4,589,173Gjensidige Forsikring ASA 18,220 426,043Hiscox Ltd. (b) 964,889 12,188,595Japan Post Insurance Co. Ltd. 18,500 335,477MAPFRE SA (Reg.) 841,212 1,813,695MS&AD Insurance Group Holdings, Inc. 151,300 4,889,074MS&AD Insurance Group Holdings, Inc. ADR 5,200 84,136Muenchener Rueckversicherungs-Gesellschaft AG in Muenchen 79,262 23,158,501NN Group NV 181,649 9,430,776NN Group NV:
ADR 2,300 59,478rights (b) (d) 181,649 199,468
PICC Property & Casualty Co. Ltd. (H Shares) 7,236,000 6,540,586Ping An Insurance Group Co. of China Ltd. (H Shares) 1,885,500 14,599,583Prudential PLC (b) 1,652,351 34,426,116Sampo Oyj (A Shares) 305,975 15,802,386Sompo Holdings, Inc. 468,500 20,560,087Storebrand ASA (A Shares) 1,133,020 10,063,180Sun Life Financial, Inc. 312,083 16,068,570Swiss Life Holding AG 16,814 8,769,169Swiss Re Ltd. 138,656 12,758,018T&D Holdings, Inc. 156,200 1,895,442Talanx AG 119,100 5,411,339The Phoenix Holdings Ltd. 18,007 192,206Tokio Marine Holdings, Inc. 487,100 23,807,087
18Semi-Annual Report
See accompanying notes which are an integral part of the financial statements.
Schedule of Investments (Unaudited) – continued
Common Stocks – continuedShares Value
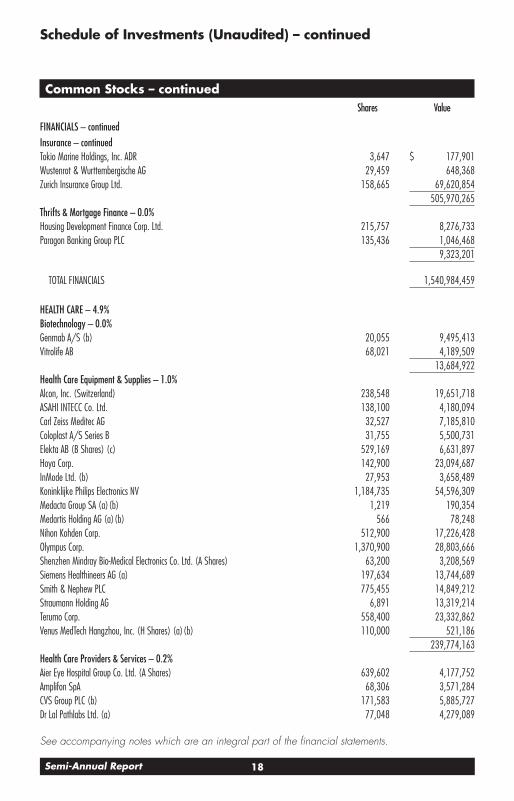
FINANCIALS – continuedInsurance – continuedTokio Marine Holdings, Inc. ADR 3,647 $ 177,901Wustenrot & Wurttembergische AG 29,459 648,368Zurich Insurance Group Ltd. 158,665 69,620,854
505,970,265Thrifts & Mortgage Finance – 0.0%Housing Development Finance Corp. Ltd. 215,757 8,276,733Paragon Banking Group PLC 135,436 1,046,468
9,323,201
TOTAL FINANCIALS 1,540,984,459
HEALTH CARE – 4.9%Biotechnology – 0.0%Genmab A/S (b) 20,055 9,495,413Vitrolife AB 68,021 4,189,509
13,684,922Health Care Equipment & Supplies – 1.0%Alcon, Inc. (Switzerland) 238,548 19,651,718ASAHI INTECC Co. Ltd. 138,100 4,180,094Carl Zeiss Meditec AG 32,527 7,185,810Coloplast A/S Series B 31,755 5,500,731Elekta AB (B Shares) (c) 529,169 6,631,897Hoya Corp. 142,900 23,094,687InMode Ltd. (b) 27,953 3,658,489Koninklijke Philips Electronics NV 1,184,735 54,596,309Medacta Group SA (a) (b) 1,219 190,354Medartis Holding AG (a) (b) 566 78,248Nihon Kohden Corp. 512,900 17,226,428Olympus Corp. 1,370,900 28,803,666Shenzhen Mindray Bio-Medical Electronics Co. Ltd. (A Shares) 63,200 3,208,569Siemens Healthineers AG (a) 197,634 13,744,689Smith & Nephew PLC 775,455 14,849,212Straumann Holding AG 6,891 13,319,214Terumo Corp. 558,400 23,332,862Venus MedTech Hangzhou, Inc. (H Shares) (a) (b) 110,000 521,186
239,774,163Health Care Providers & Services – 0.2%Aier Eye Hospital Group Co. Ltd. (A Shares) 639,602 4,177,752Amplifon SpA 68,306 3,571,284CVS Group PLC (b) 171,583 5,885,727Dr Lal Pathlabs Ltd. (a) 77,048 4,279,089
19 Semi-Annual Report
See accompanying notes which are an integral part of the financial statements.
Common Stocks – continuedShares Value
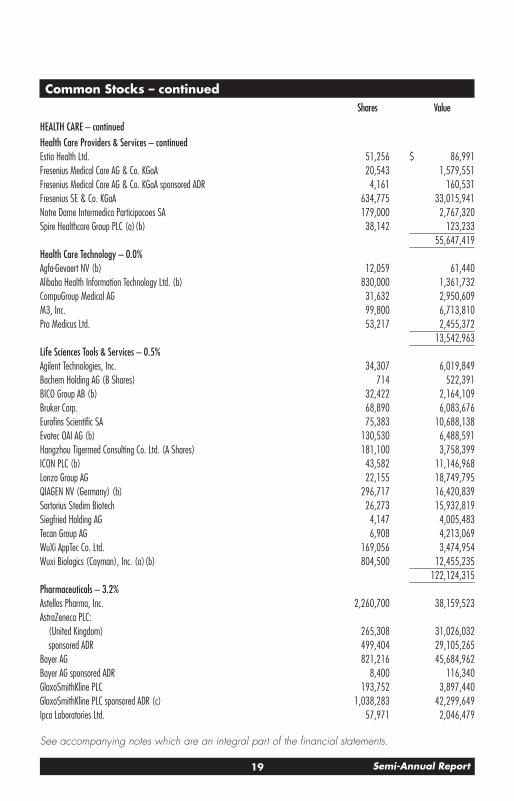
HEALTH CARE – continuedHealth Care Providers & Services – continuedEstia Health Ltd. 51,256 $ 86,991Fresenius Medical Care AG & Co. KGaA 20,543 1,579,551Fresenius Medical Care AG & Co. KGaA sponsored ADR 4,161 160,531Fresenius SE & Co. KGaA 634,775 33,015,941Notre Dame Intermedica Participacoes SA 179,000 2,767,320Spire Healthcare Group PLC (a) (b) 38,142 123,233
55,647,419Health Care Technology – 0.0%Agfa-Gevaert NV (b) 12,059 61,440Alibaba Health Information Technology Ltd. (b) 830,000 1,361,732CompuGroup Medical AG 31,632 2,950,609M3, Inc. 99,800 6,713,810Pro Medicus Ltd. 53,217 2,455,372
13,542,963Life Sciences Tools & Services – 0.5%Agilent Technologies, Inc. 34,307 6,019,849Bachem Holding AG (B Shares) 714 522,391BICO Group AB (b) 32,422 2,164,109Bruker Corp. 68,890 6,083,676Eurofins Scientific SA 75,383 10,688,138Evotec OAI AG (b) 130,530 6,488,591Hangzhou Tigermed Consulting Co. Ltd. (A Shares) 181,100 3,758,399ICON PLC (b) 43,582 11,146,968Lonza Group AG 22,155 18,749,795QIAGEN NV (Germany) (b) 296,717 16,420,839Sartorius Stedim Biotech 26,273 15,932,819Siegfried Holding AG 4,147 4,005,483Tecan Group AG 6,908 4,213,069WuXi AppTec Co. Ltd. 169,056 3,474,954Wuxi Biologics (Cayman), Inc. (a) (b) 804,500 12,455,235
122,124,315Pharmaceuticals – 3.2%Astellas Pharma, Inc. 2,260,700 38,159,523AstraZeneca PLC:
(United Kingdom) 265,308 31,026,032sponsored ADR 499,404 29,105,265
Bayer AG 821,216 45,684,962Bayer AG sponsored ADR 8,400 116,340GlaxoSmithKline PLC 193,752 3,897,440GlaxoSmithKline PLC sponsored ADR (c) 1,038,283 42,299,649Ipca Laboratories Ltd. 57,971 2,046,479

20Semi-Annual Report
See accompanying notes which are an integral part of the financial statements.
Schedule of Investments (Unaudited) – continued
Common Stocks – continuedShares Value
HEALTH CARE – continuedPharmaceuticals – continuedIpsen SA 52,808 $ 5,280,056Kyowa Hakko Kirin Co., Ltd. 497,600 16,260,255Novartis AG 1,199,990 110,988,138Novartis AG sponsored ADR 203,416 18,793,604Novo Nordisk A/S:
Series B 597,814 59,847,140Series B sponsored ADR 45,213 4,519,944
Ono Pharmaceutical Co. Ltd. 25,900 622,457Otsuka Holdings Co. Ltd. 283,200 12,049,804Recordati SpA 1,551 101,749Roche Holding AG:
(participation certificate) 444,075 178,320,612sponsored ADR 9,029 453,436
Sanofi SA 989,085 102,507,398Sanofi SA sponsored ADR 14,066 728,337Santen Pharmaceutical Co. Ltd. 2,120,700 31,613,398Sumitomo Dainippon Pharma Co., Ltd. 13,000 233,023Takeda Pharmaceutical Co. Ltd. 1,408,900 46,895,962Takeda Pharmaceutical Co. Ltd. ADR 216,511 3,591,917
785,142,920
TOTAL HEALTH CARE 1,229,916,702
INDUSTRIALS – 8.4%Aerospace & Defense – 0.7%Airbus Group NV (b) 433,703 59,328,895Dassault Aviation SA 4,800 5,412,558Kongsberg Gruppen ASA 17,768 495,381Leonardo SpA (b) 542,753 4,420,622Meggitt PLC (b) 903,184 10,296,529MTU Aero Engines AG 94,964 21,792,221Rolls-Royce Holdings PLC (b) 39,101,779 61,664,383Safran SA 158,929 19,936,937Senior Engineering Group PLC (b) 325,958 795,903Thales SA 5,653 573,631
184,717,060Air Freight & Logistics – 0.3%Bpost SA (b) 95,367 921,669Deutsche Post AG 423,029 29,759,703Deutsche Post AG ADR 2,200 155,232DSV Panalpina A/S 97,805 24,924,109
21 Semi-Annual Report
See accompanying notes which are an integral part of the financial statements.
Common Stocks – continuedShares Value
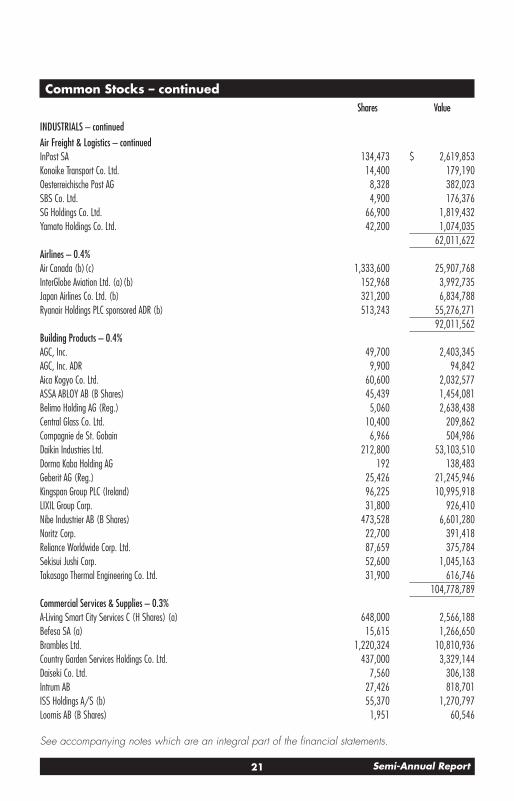
INDUSTRIALS – continuedAir Freight & Logistics – continuedInPost SA 134,473 $ 2,619,853Konoike Transport Co. Ltd. 14,400 179,190Oesterreichische Post AG 8,328 382,023SBS Co. Ltd. 4,900 176,376SG Holdings Co. Ltd. 66,900 1,819,432Yamato Holdings Co. Ltd. 42,200 1,074,035
62,011,622Airlines – 0.4%Air Canada (b) (c) 1,333,600 25,907,768InterGlobe Aviation Ltd. (a) (b) 152,968 3,992,735Japan Airlines Co. Ltd. (b) 321,200 6,834,788Ryanair Holdings PLC sponsored ADR (b) 513,243 55,276,271
92,011,562Building Products – 0.4%AGC, Inc. 49,700 2,403,345AGC, Inc. ADR 9,900 94,842Aica Kogyo Co. Ltd. 60,600 2,032,577ASSA ABLOY AB (B Shares) 45,439 1,454,081Belimo Holding AG (Reg.) 5,060 2,638,438Central Glass Co. Ltd. 10,400 209,862Compagnie de St. Gobain 6,966 504,986Daikin Industries Ltd. 212,800 53,103,510Dorma Kaba Holding AG 192 138,483Geberit AG (Reg.) 25,426 21,245,946Kingspan Group PLC (Ireland) 96,225 10,995,918LIXIL Group Corp. 31,800 926,410Nibe Industrier AB (B Shares) 473,528 6,601,280Noritz Corp. 22,700 391,418Reliance Worldwide Corp. Ltd. 87,659 375,784Sekisui Jushi Corp. 52,600 1,045,163Takasago Thermal Engineering Co. Ltd. 31,900 616,746
104,778,789Commercial Services & Supplies – 0.3%A-Living Smart City Services C (H Shares) (a) 648,000 2,566,188Befesa SA (a) 15,615 1,266,650Brambles Ltd. 1,220,324 10,810,936Country Garden Services Holdings Co. Ltd. 437,000 3,329,144Daiseki Co. Ltd. 7,560 306,138Intrum AB 27,426 818,701ISS Holdings A/S (b) 55,370 1,270,797Loomis AB (B Shares) 1,951 60,546
22Semi-Annual Report
See accompanying notes which are an integral part of the financial statements.
Schedule of Investments (Unaudited) – continued
Common Stocks – continuedShares Value
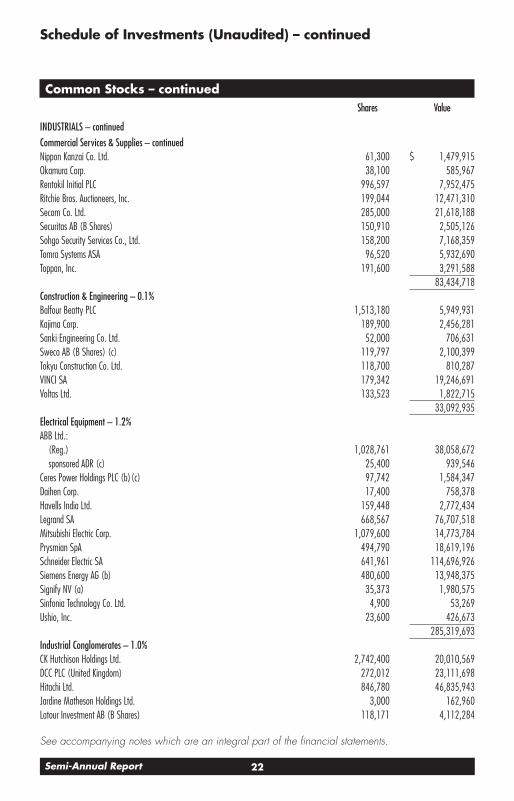
INDUSTRIALS – continuedCommercial Services & Supplies – continuedNippon Kanzai Co. Ltd. 61,300 $ 1,479,915Okamura Corp. 38,100 585,967Rentokil Initial PLC 996,597 7,952,475Ritchie Bros. Auctioneers, Inc. 199,044 12,471,310Secom Co. Ltd. 285,000 21,618,188Securitas AB (B Shares) 150,910 2,505,126Sohgo Security Services Co., Ltd. 158,200 7,168,359Tomra Systems ASA 96,520 5,932,690Toppan, Inc. 191,600 3,291,588
83,434,718Construction & Engineering – 0.1%Balfour Beatty PLC 1,513,180 5,949,931Kajima Corp. 189,900 2,456,281Sanki Engineering Co. Ltd. 52,000 706,631Sweco AB (B Shares) (c) 119,797 2,100,399Tokyu Construction Co. Ltd. 118,700 810,287VINCI SA 179,342 19,246,691Voltas Ltd. 133,523 1,822,715
33,092,935Electrical Equipment – 1.2%ABB Ltd.:
(Reg.) 1,028,761 38,058,672sponsored ADR (c) 25,400 939,546
Ceres Power Holdings PLC (b) (c) 97,742 1,584,347Daihen Corp. 17,400 758,378Havells India Ltd. 159,448 2,772,434Legrand SA 668,567 76,707,518Mitsubishi Electric Corp. 1,079,600 14,773,784Prysmian SpA 494,790 18,619,196Schneider Electric SA 641,961 114,696,926Siemens Energy AG (b) 480,600 13,948,375Signify NV (a) 35,373 1,980,575Sinfonia Technology Co. Ltd. 4,900 53,269Ushio, Inc. 23,600 426,673
285,319,693Industrial Conglomerates – 1.0%CK Hutchison Holdings Ltd. 2,742,400 20,010,569DCC PLC (United Kingdom) 272,012 23,111,698Hitachi Ltd. 846,780 46,835,943Jardine Matheson Holdings Ltd. 3,000 162,960Latour Investment AB (B Shares) 118,171 4,112,284

23 Semi-Annual Report
See accompanying notes which are an integral part of the financial statements.
Common Stocks – continuedShares Value
INDUSTRIALS – continuedIndustrial Conglomerates – continuedLifco AB 150,010 $ 4,439,745Melrose Industries PLC 9,772,232 22,536,462Nolato AB (B Shares) 265,350 3,065,710Siemens AG 588,354 97,604,883Toshiba Corp. 449,390 19,504,952
241,385,206Machinery – 2.0%Airtac International Group 68,000 2,077,669Alstom SA 553,640 23,802,722Amada Co. Ltd. 85,400 866,304Andritz AG 11,396 654,761Atlas Copco AB:
(A Shares) 349,306 23,979,382(B Shares) 13,164 761,517
Bodycote PLC 61,153 810,915Burckhardt Compression Holding AG 374 147,640CNH Industrial NV 828,425 13,694,279Electrolux Professional AB (b) 125,363 981,322Epiroc AB (A Shares) 611,202 13,411,179FANUC Corp. 256,700 55,924,934Furukawa Co. Ltd. 15,900 179,212GEA Group AG 840,096 38,794,905Harmonic Drive Systems, Inc. 39,700 2,197,637IMI PLC 1,198,493 30,038,448Indutrade AB 192,476 6,356,797Jingjin Environmental Protection Co. Ltd. 166,400 1,030,229Kawasaki Heavy Industries Ltd. (b) 183,200 3,899,963KION Group AG 174,706 18,693,466Kitz Corp. 61,200 453,375Knorr-Bremse AG 141,583 16,993,250Kubota Corp. 819,900 16,950,984Misumi Group, Inc. 133,500 5,296,800Mitsubishi Heavy Industries Ltd. 99,100 2,620,387Mitsuboshi Belting Ltd. 21,400 391,567Morgan Advanced Materials PLC 35,343 194,851Nachi-Fujikoshi Corp. 1,300 50,870NGK Insulators Ltd. 113,800 1,887,788Nissei ASB Machine Co. Ltd. 4,500 173,431Nordson Corp. 37,200 8,875,920NTN Corp. (b) 911,800 2,088,566Rational AG 1,253 1,433,024
24Semi-Annual Report
See accompanying notes which are an integral part of the financial statements.
Schedule of Investments (Unaudited) – continued
Common Stocks – continuedShares Value
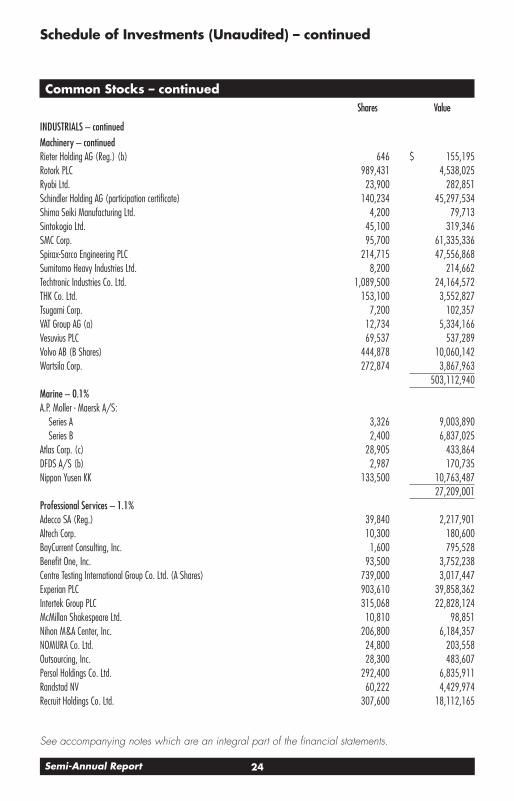
INDUSTRIALS – continuedMachinery – continuedRieter Holding AG (Reg.) (b) 646 $ 155,195Rotork PLC 989,431 4,538,025Ryobi Ltd. 23,900 282,851Schindler Holding AG (participation certificate) 140,234 45,297,534Shima Seiki Manufacturing Ltd. 4,200 79,713Sintokogio Ltd. 45,100 319,346SMC Corp. 95,700 61,335,336Spirax-Sarco Engineering PLC 214,715 47,556,868Sumitomo Heavy Industries Ltd. 8,200 214,662Techtronic Industries Co. Ltd. 1,089,500 24,164,572THK Co. Ltd. 153,100 3,552,827Tsugami Corp. 7,200 102,357VAT Group AG (a) 12,734 5,334,166Vesuvius PLC 69,537 537,289Volvo AB (B Shares) 444,878 10,060,142Wartsila Corp. 272,874 3,867,963
503,112,940Marine – 0.1%A.P. Moller - Maersk A/S:
Series A 3,326 9,003,890Series B 2,400 6,837,025
Atlas Corp. (c) 28,905 433,864DFDS A/S (b) 2,987 170,735Nippon Yusen KK 133,500 10,763,487
27,209,001Professional Services – 1.1%Adecco SA (Reg.) 39,840 2,217,901Altech Corp. 10,300 180,600BayCurrent Consulting, Inc. 1,600 795,528Benefit One, Inc. 93,500 3,752,238Centre Testing International Group Co. Ltd. (A Shares) 739,000 3,017,447Experian PLC 903,610 39,858,362Intertek Group PLC 315,068 22,828,124McMillan Shakespeare Ltd. 10,810 98,851Nihon M&A Center, Inc. 206,800 6,184,357NOMURA Co. Ltd. 24,800 203,558Outsourcing, Inc. 28,300 483,607Persol Holdings Co. Ltd. 292,400 6,835,911Randstad NV 60,222 4,429,974Recruit Holdings Co. Ltd. 307,600 18,112,165
25 Semi-Annual Report
See accompanying notes which are an integral part of the financial statements.
Common Stocks – continuedShares Value
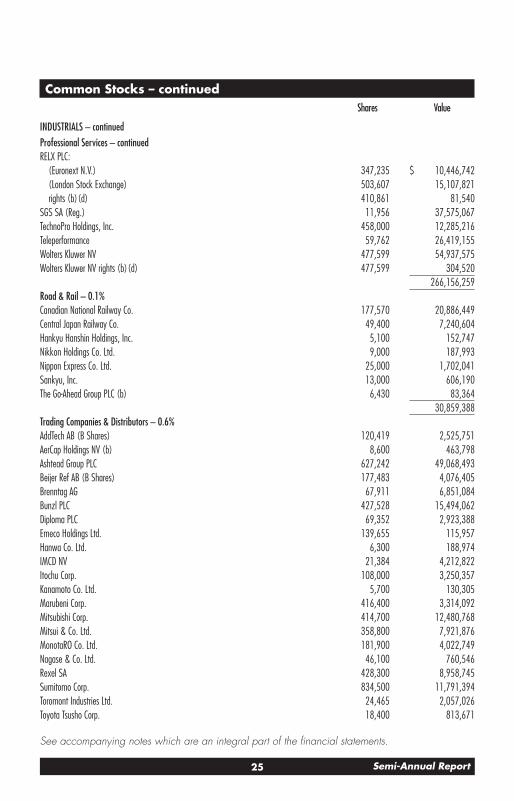
INDUSTRIALS – continuedProfessional Services – continuedRELX PLC:
(Euronext N.V.) 347,235 $ 10,446,742(London Stock Exchange) 503,607 15,107,821rights (b) (d) 410,861 81,540
SGS SA (Reg.) 11,956 37,575,067TechnoPro Holdings, Inc. 458,000 12,285,216Teleperformance 59,762 26,419,155Wolters Kluwer NV 477,599 54,937,575Wolters Kluwer NV rights (b) (d) 477,599 304,520
266,156,259Road & Rail – 0.1%Canadian National Railway Co. 177,570 20,886,449Central Japan Railway Co. 49,400 7,240,604Hankyu Hanshin Holdings, Inc. 5,100 152,747Nikkon Holdings Co. Ltd. 9,000 187,993Nippon Express Co. Ltd. 25,000 1,702,041Sankyu, Inc. 13,000 606,190The Go-Ahead Group PLC (b) 6,430 83,364
30,859,388Trading Companies & Distributors – 0.6%AddTech AB (B Shares) 120,419 2,525,751AerCap Holdings NV (b) 8,600 463,798Ashtead Group PLC 627,242 49,068,493Beijer Ref AB (B Shares) 177,483 4,076,405Brenntag AG 67,911 6,851,084Bunzl PLC 427,528 15,494,062Diploma PLC 69,352 2,923,388Emeco Holdings Ltd. 139,655 115,957Hanwa Co. Ltd. 6,300 188,974IMCD NV 21,384 4,212,822Itochu Corp. 108,000 3,250,357Kanamoto Co. Ltd. 5,700 130,305Marubeni Corp. 416,400 3,314,092Mitsubishi Corp. 414,700 12,480,768Mitsui & Co. Ltd. 358,800 7,921,876MonotaRO Co. Ltd. 181,900 4,022,749Nagase & Co. Ltd. 46,100 760,546Rexel SA 428,300 8,958,745Sumitomo Corp. 834,500 11,791,394Toromont Industries Ltd. 24,465 2,057,026Toyota Tsusho Corp. 18,400 813,671

26Semi-Annual Report
See accompanying notes which are an integral part of the financial statements.
Schedule of Investments (Unaudited) – continued
Common Stocks – continuedShares Value
INDUSTRIALS – continuedTrading Companies & Distributors – continuedWakita & Co. Ltd. 17,400 $ 160,374Yamazen Co. Ltd. 12,000 119,438Yuasa Trading Co. Ltd. 27,400 740,197
142,442,272Transportation Infrastructure – 0.1%Aena SME SA (a) (b) 157,337 25,116,870Beijing Capital International Airport Co. Ltd. (H Shares) 13,422,000 8,093,807Grupo Aeroportuario del Sureste S.A.B. de CV Series B sponsored ADR (b) 12,549 2,243,510The Sumitomo Warehouse Co. Ltd. 21,300 346,175
35,800,362
TOTAL INDUSTRIALS 2,092,331,807
INFORMATION TECHNOLOGY – 7.1%Communications Equipment – 0.2%Ericsson:
(B Shares) 1,714,081 20,303,477(B Shares) sponsored ADR 447,795 5,292,937
Nokia Corp. (b) 3,073,452 18,435,211Nokia Corp. sponsored ADR (b) 281,500 1,677,740
45,709,365Electronic Equipment & Components – 1.2%ALSO Holding AG 2,106 677,278Basler AG 922 160,250Enplas Corp. 34,600 989,111Halma PLC 924,499 38,169,555Hamamatsu Photonics K.K. 148,300 8,654,147Hexagon AB (B Shares) 1,166,401 20,226,188Hirose Electric Co. Ltd. 172,390 28,722,526Keyence Corp. 46,600 28,011,253Kyocera Corp. 330,400 20,560,091Largan Precision Co. Ltd. 40,000 3,876,193Macnica Fuji Electronics Holdings, Inc. 22,400 539,766Murata Manufacturing Co. Ltd. 607,700 50,097,461OMRON Corp. 380,600 35,909,903Renishaw PLC 29,634 2,200,084Samsung SDI Co. Ltd. 10,629 7,273,070Sanshin Electronic Co. Ltd. 20,400 302,806Shimadzu Corp. 759,300 34,060,315Softwareone Holding AG 74,348 2,102,772Spectris PLC 332,979 18,037,170

27 Semi-Annual Report
See accompanying notes which are an integral part of the financial statements.
Common Stocks – continuedShares Value
INFORMATION TECHNOLOGY – continuedElectronic Equipment & Components – continuedTopcon Corp. 125,700 $ 2,134,324Yokogawa Electric Corp. 496,200 7,771,237
310,475,500IT Services – 1.3%Adyen BV (a) (b) 7,331 23,670,046Amadeus IT Holding SA Class A (b) 1,424,171 86,971,830BASE, Inc. (b) (c) 128,400 1,335,178Bechtle AG 55,017 3,976,932Capgemini SA 74,200 16,659,355CGI, Inc. Class A (b) 56,921 5,086,461Dlocal Ltd. 27,961 1,789,504EPAM Systems, Inc. (b) 21,433 13,563,017Fujitsu Ltd. 222,240 41,007,790Globant SA (b) 15,144 4,880,608GMO Payment Gateway, Inc. 23,900 3,143,508Locaweb Servicos de Internet SA (a) 807,888 3,826,328Mitsubishi Research Institute, Inc. 13,900 539,499Nomura Research Institute Ltd. 840,300 31,583,334NTT Data Corp. 1,066,400 19,202,276Nuvei Corp. (a) 64,457 8,354,657OBIC Co. Ltd. 94,500 17,995,501SHIFT, Inc. (b) 15,800 3,610,526Softcat PLC 101,158 2,940,089TIS, Inc. 183,000 5,173,204Visa, Inc. Class A 47,715 10,931,507Wix.com Ltd. (b) 71,060 15,781,005Worldline SA (a) (b) 78,139 6,944,608Zuken, Inc. 6,600 218,970
329,185,733Semiconductors & Semiconductor Equipment – 2.1%Advantest Corp. 44,500 3,850,748ams AG (b) 239,500 4,872,383Analog Devices, Inc. 160,381 26,134,084ASM International NV (Netherlands) 4,097 1,589,613ASMedia Technology, Inc. 32,000 2,400,926ASML Holding NV 17,275 14,390,766ASML Holding NV (Netherlands) 167,579 139,758,835BE Semiconductor Industries NV 24,369 2,217,301Broadcom, Inc. 33,260 16,537,205Disco Corp. 28,200 8,215,334GlobalWafers Co. Ltd. 76,000 2,390,801

28Semi-Annual Report
See accompanying notes which are an integral part of the financial statements.
Schedule of Investments (Unaudited) – continued
Common Stocks – continuedShares Value
INFORMATION TECHNOLOGY – continuedSemiconductors & Semiconductor Equipment – continuedInfineon Technologies AG 908,374 $ 38,676,520MediaTek, Inc. 400,000 13,031,530NAURA Technology Group Co. Ltd. 86,200 4,747,825NXP Semiconductors NV 214,416 46,127,314Renesas Electronics Corp. (b) 494,000 5,289,703Silergy Corp. 17,000 2,446,485SK Hynix, Inc. 167,343 15,378,335Sumco Corp. 62,000 1,309,149Taiwan Semiconductor Manufacturing Co. Ltd. 1,724,000 37,894,976Taiwan Semiconductor Manufacturing Co. Ltd. sponsored ADR 879,895 104,716,304Texas Instruments, Inc. 45,343 8,656,432Tokyo Electron Ltd. 68,900 29,585,384
530,217,953Software – 1.5%ANSYS, Inc. (b) 93,519 34,168,102Atlassian Corp. PLC (b) 31,334 11,501,458Avast PLC (a) 323,872 2,661,856Aveva Group PLC 74,332 4,226,800Cadence Design Systems, Inc. (b) 515,652 84,298,789Check Point Software Technologies Ltd. (b) 180,012 22,614,908Constellation Software, Inc. 9,739 16,505,237Dassault Systemes SA 635,140 36,225,927Descartes Systems Group, Inc. (Canada) (b) 92,176 7,226,353Enghouse Systems Ltd. 32,311 1,562,985Kinaxis, Inc. (b) 23,081 3,744,477Nemetschek Se 26,864 2,633,367Netcompany Group A/S (a) 27,831 3,592,551NICE Systems Ltd. sponsored ADR (b) 14,368 4,176,778Open Text Corp. 55,650 3,051,290Pexip Holding ASA (b) 146,879 1,140,332Rakus Co. Ltd. 105,900 3,744,498Sage Group PLC 275,091 2,807,066SAP SE 716,680 107,652,521TeamViewer AG (a) (b) 54,654 1,820,468Temenos Group AG 72,734 11,548,483Topicus.Com, Inc. 3,161 320,773Weimob, Inc. (a) (b) 731,000 1,067,723
368,292,742Technology Hardware, Storage & Peripherals – 0.8%Brother Industries Ltd. 170,700 3,503,528Canon, Inc. 159,900 3,804,361
29 Semi-Annual Report
See accompanying notes which are an integral part of the financial statements.
Common Stocks – continuedShares Value
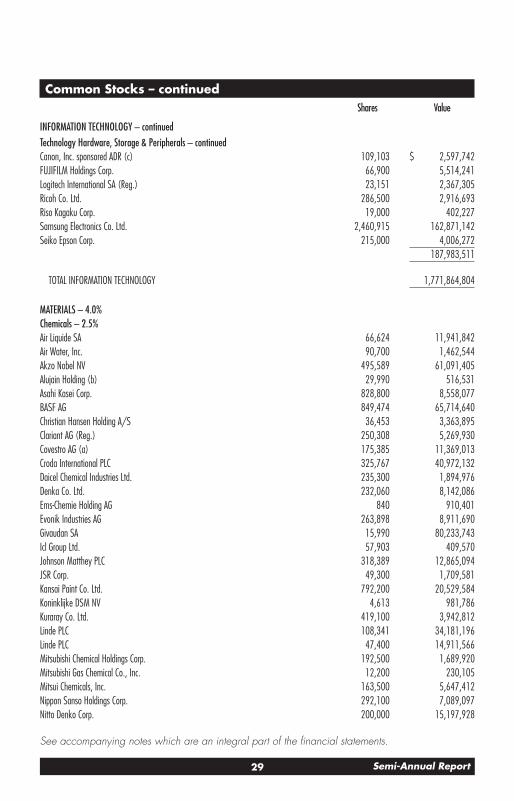
INFORMATION TECHNOLOGY – continuedTechnology Hardware, Storage & Peripherals – continuedCanon, Inc. sponsored ADR (c) 109,103 $ 2,597,742FUJIFILM Holdings Corp. 66,900 5,514,241Logitech International SA (Reg.) 23,151 2,367,305Ricoh Co. Ltd. 286,500 2,916,693Riso Kagaku Corp. 19,000 402,227Samsung Electronics Co. Ltd. 2,460,915 162,871,142Seiko Epson Corp. 215,000 4,006,272
187,983,511
TOTAL INFORMATION TECHNOLOGY 1,771,864,804
MATERIALS – 4.0%Chemicals – 2.5%Air Liquide SA 66,624 11,941,842Air Water, Inc. 90,700 1,462,544Akzo Nobel NV 495,589 61,091,405Alujain Holding (b) 29,990 516,531Asahi Kasei Corp. 828,800 8,558,077BASF AG 849,474 65,714,640Christian Hansen Holding A/S 36,453 3,363,895Clariant AG (Reg.) 250,308 5,269,930Covestro AG (a) 175,385 11,369,013Croda International PLC 325,767 40,972,132Daicel Chemical Industries Ltd. 235,300 1,894,976Denka Co. Ltd. 232,060 8,142,086Ems-Chemie Holding AG 840 910,401Evonik Industries AG 263,898 8,911,690Givaudan SA 15,990 80,233,743Icl Group Ltd. 57,903 409,570Johnson Matthey PLC 318,389 12,865,094JSR Corp. 49,300 1,709,581Kansai Paint Co. Ltd. 792,200 20,529,584Koninklijke DSM NV 4,613 981,786Kuraray Co. Ltd. 419,100 3,942,812Linde PLC 108,341 34,181,196Linde PLC 47,400 14,911,566Mitsubishi Chemical Holdings Corp. 192,500 1,689,920Mitsubishi Gas Chemical Co., Inc. 12,200 230,105Mitsui Chemicals, Inc. 163,500 5,647,412Nippon Sanso Holdings Corp. 292,100 7,089,097Nitto Denko Corp. 200,000 15,197,928

30Semi-Annual Report
See accompanying notes which are an integral part of the financial statements.
Schedule of Investments (Unaudited) – continued
Common Stocks – continuedShares Value
MATERIALS – continuedChemicals – continuedNovozymes A/S Series B 435,465 $ 35,179,034Orica Ltd. 178,946 1,724,058PhosAgro OJSC 53,731 3,569,410Pidilite Industries Ltd. 77,433 2,420,451Shin-Etsu Chemical Co. Ltd. 64,100 10,587,259Sika AG 158,367 57,086,483Solvay SA Class A 23,646 3,097,726Sumitomo Chemical Co. Ltd. 428,800 2,174,889Symrise AG 284,834 40,559,920Takasago International Corp. 3,000 78,889Teijin Ltd. 128,400 1,847,541Tessenderlo Group (b) 4,094 169,673Tokuyama Corp. 19,900 397,946Toray Industries, Inc. 1,324,500 8,930,729Tosoh Corp. 102,400 1,859,703Transfar Zhilian Co. Ltd. 665,000 893,433Umicore SA 139,937 9,209,954Yara International ASA 191,174 9,600,203
619,125,857Construction Materials – 0.1%Cementir SpA 11,392 128,996CSR Ltd. 46,808 186,621HeidelbergCement AG 257,500 22,377,574Holcim Ltd. 6,258 356,721James Hardie Industries PLC CDI 200,134 7,765,482Taiheiyo Cement Corp. 33,600 770,251
31,585,645Containers & Packaging – 0.2%Amcor PLC unit 497,620 6,366,953Fuji Seal International, Inc. 14,700 330,438Sig Combibloc Group AG 150,424 4,605,939Smurfit Kappa Group PLC 410,108 23,524,137Toyo Seikan Group Holdings Ltd. 56,800 790,961
35,618,428Metals & Mining – 1.2%Agnico Eagle Mines Ltd. (Canada) 221,458 12,743,511Alumina Ltd. 471,129 613,485Anglo American PLC (United Kingdom) 87,735 3,705,532Antofagasta PLC 487,657 9,761,828Aperam SA 20,481 1,256,546Aperam SA rights (b) (d) 20,481 10,580
31 Semi-Annual Report
See accompanying notes which are an integral part of the financial statements.
Common Stocks – continuedShares Value
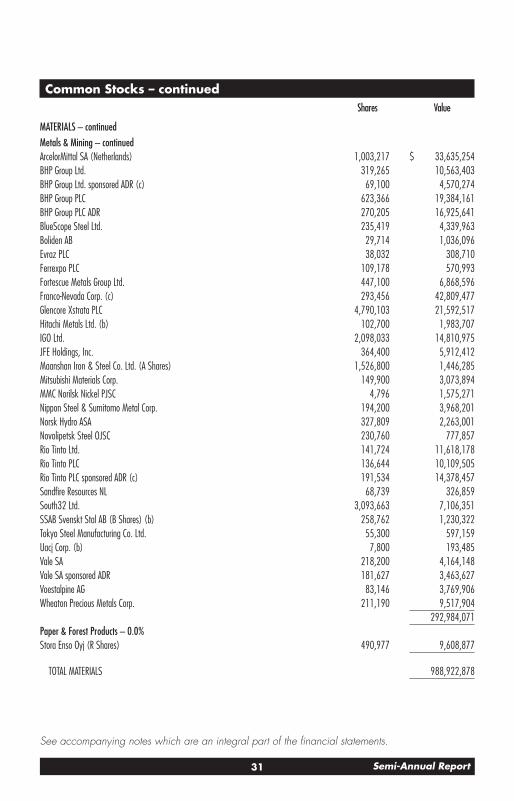
MATERIALS – continuedMetals & Mining – continuedArcelorMittal SA (Netherlands) 1,003,217 $ 33,635,254BHP Group Ltd. 319,265 10,563,403BHP Group Ltd. sponsored ADR (c) 69,100 4,570,274BHP Group PLC 623,366 19,384,161BHP Group PLC ADR 270,205 16,925,641BlueScope Steel Ltd. 235,419 4,339,963Boliden AB 29,714 1,036,096Evraz PLC 38,032 308,710Ferrexpo PLC 109,178 570,993Fortescue Metals Group Ltd. 447,100 6,868,596Franco-Nevada Corp. (c) 293,456 42,809,477Glencore Xstrata PLC 4,790,103 21,592,517Hitachi Metals Ltd. (b) 102,700 1,983,707IGO Ltd. 2,098,033 14,810,975JFE Holdings, Inc. 364,400 5,912,412Maanshan Iron & Steel Co. Ltd. (A Shares) 1,526,800 1,446,285Mitsubishi Materials Corp. 149,900 3,073,894MMC Norilsk Nickel PJSC 4,796 1,575,271Nippon Steel & Sumitomo Metal Corp. 194,200 3,968,201Norsk Hydro ASA 327,809 2,263,001Novolipetsk Steel OJSC 230,760 777,857Rio Tinto Ltd. 141,724 11,618,178Rio Tinto PLC 136,644 10,109,505Rio Tinto PLC sponsored ADR (c) 191,534 14,378,457Sandfire Resources NL 68,739 326,859South32 Ltd. 3,093,663 7,106,351SSAB Svenskt Stal AB (B Shares) (b) 258,762 1,230,322Tokyo Steel Manufacturing Co. Ltd. 55,300 597,159Uacj Corp. (b) 7,800 193,485Vale SA 218,200 4,164,148Vale SA sponsored ADR 181,627 3,463,627Voestalpine AG 83,146 3,769,906Wheaton Precious Metals Corp. 211,190 9,517,904
292,984,071Paper & Forest Products – 0.0%Stora Enso Oyj (R Shares) 490,977 9,608,877
TOTAL MATERIALS 988,922,878

32Semi-Annual Report
See accompanying notes which are an integral part of the financial statements.
Schedule of Investments (Unaudited) – continued
Common Stocks – continuedShares Value
REAL ESTATE – 0.7%Equity Real Estate Investment Trusts (REITs) – 0.2%Big Yellow Group PLC 138,837 $ 2,910,921British Land Co. PLC 1,695,400 12,358,542Great Portland Estates PLC 744,746 7,991,649Scentre Group unit 2,722,001 5,675,148Segro PLC 506,174 8,935,527Warehouses de Pauw 90,783 4,174,058
42,045,845Real Estate Management & Development – 0.5%Airport City Ltd. (b) 7,864 143,954CK Asset Holdings Ltd. 1,497,100 9,759,365Daito Trust Construction Co. Ltd. 2,800 307,449Deutsche Wohnen SE (Bearer) 149,997 9,308,847Dios Fastigheter AB 60,129 708,634ESR Cayman Ltd. (a) (b) 2,278,600 6,943,512Grand City Properties SA 544,859 14,938,407Hang Lung Group Ltd. 205,000 513,459Hongkong Land Holdings Ltd. 92,300 387,660LEG Immobilien AG 191,540 30,531,715Lendlease Group unit 910,900 7,956,445Mitsui Fudosan Co. Ltd. 580,000 13,306,549Nomura Real Estate Holdings, Inc. 58,100 1,486,629Swire Pacific Ltd. (A Shares) 28,000 189,728TAG Immobilien AG 338,691 11,465,402Vonovia SE 228,244 15,404,569
123,352,324
TOTAL REAL ESTATE 165,398,169
UTILITIES – 1.0%Electric Utilities – 0.4%Chubu Electric Power Co., Inc. 507,800 6,134,311CLP Holdings Ltd. 734,000 7,337,688Enel SpA 4,482,484 40,837,401Iberdrola SA 1,189,921 14,744,876Kansai Electric Power Co., Inc. 523,800 5,261,092Origin Energy Ltd. 424,659 1,382,434ORSTED A/S (a) 92,249 14,661,530Shikoku Electric Power Co., Inc. 71,000 497,578Tohoku Electric Power Co., Inc. 69,900 534,980
91,391,890
33 Semi-Annual Report
See accompanying notes which are an integral part of the financial statements.
Common Stocks – continuedShares Value
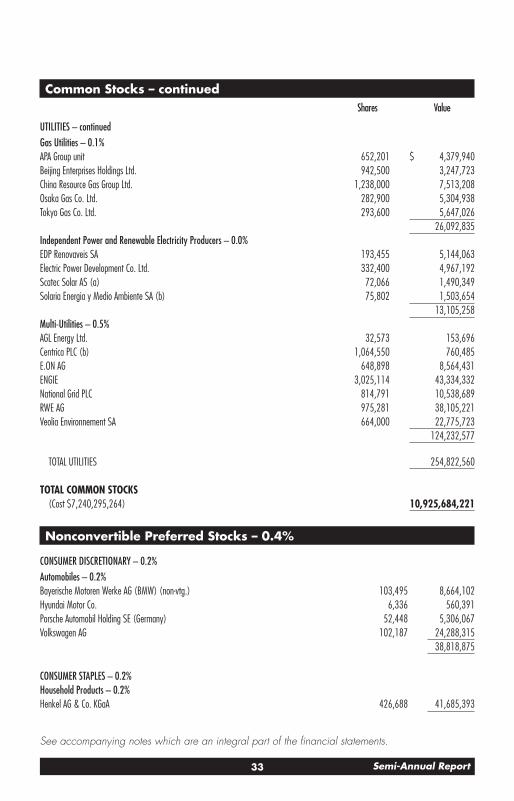
UTILITIES – continuedGas Utilities – 0.1%APA Group unit 652,201 $ 4,379,940Beijing Enterprises Holdings Ltd. 942,500 3,247,723China Resource Gas Group Ltd. 1,238,000 7,513,208Osaka Gas Co. Ltd. 282,900 5,304,938Tokyo Gas Co. Ltd. 293,600 5,647,026
26,092,835Independent Power and Renewable Electricity Producers – 0.0%EDP Renovaveis SA 193,455 5,144,063Electric Power Development Co. Ltd. 332,400 4,967,192Scatec Solar AS (a) 72,066 1,490,349Solaria Energia y Medio Ambiente SA (b) 75,802 1,503,654
13,105,258Multi-Utilities – 0.5%AGL Energy Ltd. 32,573 153,696Centrica PLC (b) 1,064,550 760,485E.ON AG 648,898 8,564,431ENGIE 3,025,114 43,334,332National Grid PLC 814,791 10,538,689RWE AG 975,281 38,105,221Veolia Environnement SA 664,000 22,775,723
124,232,577
TOTAL UTILITIES 254,822,560
TOTAL COMMON STOCKS(Cost $7,240,295,264) 10,925,684,221
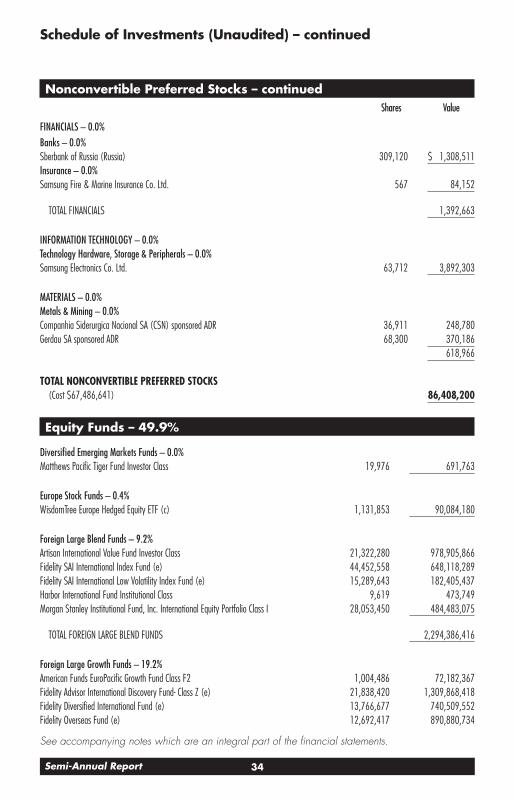
Nonconvertible Preferred Stocks – 0.4%
CONSUMER DISCRETIONARY – 0.2%Automobiles – 0.2%Bayerische Motoren Werke AG (BMW) (non-vtg.) 103,495 8,664,102Hyundai Motor Co. 6,336 560,391Porsche Automobil Holding SE (Germany) 52,448 5,306,067Volkswagen AG 102,187 24,288,315
38,818,875
CONSUMER STAPLES – 0.2%Household Products – 0.2%Henkel AG & Co. KGaA 426,688 41,685,393
34Semi-Annual Report
See accompanying notes which are an integral part of the financial statements.
Schedule of Investments (Unaudited) – continued
Nonconvertible Preferred Stocks – continuedShares Value
FINANCIALS – 0.0%Banks – 0.0%Sberbank of Russia (Russia) 309,120 $ 1,308,511Insurance – 0.0%Samsung Fire & Marine Insurance Co. Ltd. 567 84,152
TOTAL FINANCIALS 1,392,663
INFORMATION TECHNOLOGY – 0.0%Technology Hardware, Storage & Peripherals – 0.0%Samsung Electronics Co. Ltd. 63,712 3,892,303
MATERIALS – 0.0%Metals & Mining – 0.0%Companhia Siderurgica Nacional SA (CSN) sponsored ADR 36,911 248,780Gerdau SA sponsored ADR 68,300 370,186
618,966
TOTAL NONCONVERTIBLE PREFERRED STOCKS(Cost $67,486,641) 86,408,200
Equity Funds – 49.9%
Diversified Emerging Markets Funds – 0.0%Matthews Pacific Tiger Fund Investor Class 19,976 691,763
Europe Stock Funds – 0.4%WisdomTree Europe Hedged Equity ETF (c) 1,131,853 90,084,180
Foreign Large Blend Funds – 9.2%Artisan International Value Fund Investor Class 21,322,280 978,905,866Fidelity SAI International Index Fund (e) 44,452,558 648,118,289Fidelity SAI International Low Volatility Index Fund (e) 15,289,643 182,405,437Harbor International Fund Institutional Class 9,619 473,749Morgan Stanley Institutional Fund, Inc. International Equity Portfolio Class I 28,053,450 484,483,075
TOTAL FOREIGN LARGE BLEND FUNDS 2,294,386,416
Foreign Large Growth Funds – 19.2%American Funds EuroPacific Growth Fund Class F2 1,004,486 72,182,367Fidelity Advisor International Discovery Fund- Class Z (e) 21,838,420 1,309,868,418Fidelity Diversified International Fund (e) 13,766,677 740,509,552Fidelity Overseas Fund (e) 12,692,417 890,880,734
35 Semi-Annual Report
See accompanying notes which are an integral part of the financial statements.
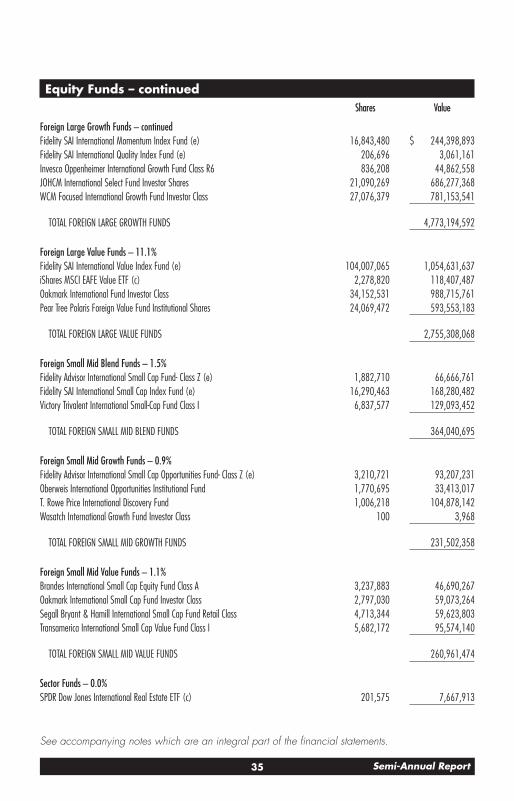
Equity Funds – continuedShares Value
Foreign Large Growth Funds – continuedFidelity SAI International Momentum Index Fund (e) 16,843,480 $ 244,398,893Fidelity SAI International Quality Index Fund (e) 206,696 3,061,161Invesco Oppenheimer International Growth Fund Class R6 836,208 44,862,558JOHCM International Select Fund Investor Shares 21,090,269 686,277,368WCM Focused International Growth Fund Investor Class 27,076,379 781,153,541
TOTAL FOREIGN LARGE GROWTH FUNDS 4,773,194,592
Foreign Large Value Funds – 11.1%Fidelity SAI International Value Index Fund (e) 104,007,065 1,054,631,637iShares MSCI EAFE Value ETF (c) 2,278,820 118,407,487Oakmark International Fund Investor Class 34,152,531 988,715,761Pear Tree Polaris Foreign Value Fund Institutional Shares 24,069,472 593,553,183
TOTAL FOREIGN LARGE VALUE FUNDS 2,755,308,068
Foreign Small Mid Blend Funds – 1.5%Fidelity Advisor International Small Cap Fund- Class Z (e) 1,882,710 66,666,761Fidelity SAI International Small Cap Index Fund (e) 16,290,463 168,280,482Victory Trivalent International Small-Cap Fund Class I 6,837,577 129,093,452
TOTAL FOREIGN SMALL MID BLEND FUNDS 364,040,695
Foreign Small Mid Growth Funds – 0.9%Fidelity Advisor International Small Cap Opportunities Fund- Class Z (e) 3,210,721 93,207,231Oberweis International Opportunities Institutional Fund 1,770,695 33,413,017T. Rowe Price International Discovery Fund 1,006,218 104,878,142Wasatch International Growth Fund Investor Class 100 3,968
TOTAL FOREIGN SMALL MID GROWTH FUNDS 231,502,358
Foreign Small Mid Value Funds – 1.1%Brandes International Small Cap Equity Fund Class A 3,237,883 46,690,267Oakmark International Small Cap Fund Investor Class 2,797,030 59,073,264Segall Bryant & Hamill International Small Cap Fund Retail Class 4,713,344 59,623,803Transamerica International Small Cap Value Fund Class I 5,682,172 95,574,140
TOTAL FOREIGN SMALL MID VALUE FUNDS 260,961,474
Sector Funds – 0.0%SPDR Dow Jones International Real Estate ETF (c) 201,575 7,667,913

36Semi-Annual Report
See accompanying notes which are an integral part of the financial statements.
Schedule of Investments (Unaudited) – continued
Equity Funds – continuedShares Value
Other – 6.5%Fidelity Advisor Japan Fund- Class Z (e) 3,488,090 $ 72,482,510Fidelity Japan Smaller Companies Fund (e) 6,966,190 126,157,704Fidelity SAI Japan Stock Index Fund (e) 126,429,831 1,290,848,579iShares MSCI Australia ETF (c) 4,610,307 119,499,157Matthews Japan Fund Investor Class 198 4,837
TOTAL OTHER 1,608,992,787
TOTAL EQUITY FUNDS(Cost $8,894,059,034) 12,386,830,246
U.S. Treasury Obligations – 0.2%Principal Amount
U.S. Treasury Bills, yield at date of purchase 0.01% to 0.05% 9/2/21 to 11/26/21 (f)(Cost $61,367,172) $ 61,370,000 $ 61,367,146
Money Market Funds – 5.9%Value
Fidelity Securities Lending Cash Central Fund 0.06% (g) (h) 143,767,811 143,782,188State Street Institutional U.S. Government Money Market Fund Premier Class 0.03% (i) 1,332,886,918 1,332,886,918
TOTAL MONEY MARKET FUNDS(Cost $1,476,669,106) 1,476,669,106
TOTAL INVESTMENT IN SECURITIES – 100.4%(Cost $17,739,877,217) 24,936,958,919
NET OTHER ASSETS (LIABILITIES) – (0.4)% (104,145,549)
NET ASSETS – 100% $24,832,813,370

37 Semi-Annual Report
See accompanying notes which are an integral part of the financial statements.
Futures ContractsNumber
of contractsExpiration
DateNotional Amount
Value Unrealized Appreciation/ (Depreciation)
Purchased
Equity Index ContractsCME Nikkei 225 Index Contracts (United States) 1,086 Sept. 2021 $ 152,420,100 $ (5,868,809) $ (5,868,809)ICE E-mini MSCI EAFE Index Contracts (United
States) 8,599 Sept. 2021 1,011,027,425 2,381,485 2,381,485
TOTAL FUTURES CONTRACTS $ (3,487,324)
The notional amount of futures purchased as a percentage of Net Assets is 4.7%
Security Type AbbreviationsETF – Exchange-Traded Fund
Legend(a) Security exempt from registration under Rule 144A of the
Securities Act of 1933. These securities may be resold in transactions exempt from registration, normally to qualified institutional buyers. At the end of the period, the value of these securities amounted to $271,782,586 or 1.1% of net assets.
(b) Non-income producing
(c) Security or a portion of the security is on loan at period end.
(d) Security or a portion of the security purchased on a delayed delivery or when-issued basis.
(e) Affiliated Fund
(f) Security or a portion of the security was pledged to cover margin requirements for futures contracts. At period end, the value of securities pledged amounted to $61,266,146.
(g) Affiliated fund that is generally available only to investment companies and other accounts managed by Fidelity Investments. The rate quoted is the annualized seven-day yield of the fund at period end. A complete unaudited listing of the fund’s holdings as of its most recent quarter end is available upon request. In addition, each Fidelity Central Fund’s financial statements are available on the SEC’s website or upon request.
(h) Investment made with cash collateral received from securities on loan.
(i) The rate quoted is the annualized seven-day yield of the fund at period end.
Affiliated Central FundsFiscal year to date information regarding the Fund’s investments in Fidelity Central Funds, including the ownership percentage, is presented below.

38Semi-Annual Report
See accompanying notes which are an integral part of the financial statements.
Schedule of Investments (Unaudited) – continued
Fund
Value, beginning of period Purchases
Sales Proceeds
Dividend Income
Realized Gain/Loss
Change in Unrealized
appreciation (depreciation)
Value, end
of period
% ownership,
end of period
Fidelity Securities Lending Cash Central Fund 0.06% $ 288,584,994 $ 2,812,756,471 $ 2,957,559,277 $ 1,189,695 $ — $ — $ 143,782,188 0.4%
Total $ 288,584,994 $ 2,812,756,471 $ 2,957,559,277 $ 1,189,695 $ — $ — $ 143,782,188
Amounts in the income column in the above table include any capital gain distributions from underlying funds, which are presented in the corresponding line-item in the Statement of Operations, if applicable. Amount for Fidelity Securities Lending Cash Central Fund represents the income earned on investing cash collateral, less rebates paid to borrowers and any lending agent fees associated with the loan, plus any premium payments received for lending certain types of securities.
Affiliated Underlying FundsFiscal year to date information regarding the Fund’s investments in affiliated Underlying Funds is presented below. Exchanges between classes of the same affiliated Underlying Funds may occur. If an underlying Fund changes its name, the name presented below is the name in effect at period end.
Affiliate
Value, beginning of period Purchases
Sales Proceeds
Dividend Income
Realized Gain (loss)
Change in Unrealized
appreciation (depreciation)
Value, end
of periodFidelity Advisor
International Discovery Fund – Class Z $ — $ — $ — $ — $ — $ 688,560,246 $ 1,309,868,418
Fidelity Advisor International Small Cap Fund – Class Z — — — — — 15,906,101 66,666,761
Fidelity Advisor International Small Cap Opportunities Fund – Class Z — — — — — 32,059,023 93,207,231
Fidelity Advisor Japan Fund – Class Z — — — — — 37,245,688 72,482,510
Fidelity Advisor Japan Fund Class I 69,518,224 — — — — (34,281,402) —
Fidelity Diversified International Fund 631,176,275 62,000,000 38,000,000 — 16,688,668 68,644,609 740,509,552
Fidelity International Discovery Fund 1,206,053,461 — 28,000,001 — 11,674,040 (568,419,328) —
Fidelity International Small Cap Fund 55,266,613 5,630,394 — — — (10,136,347) —
39 Semi-Annual Report
See accompanying notes which are an integral part of the financial statements.
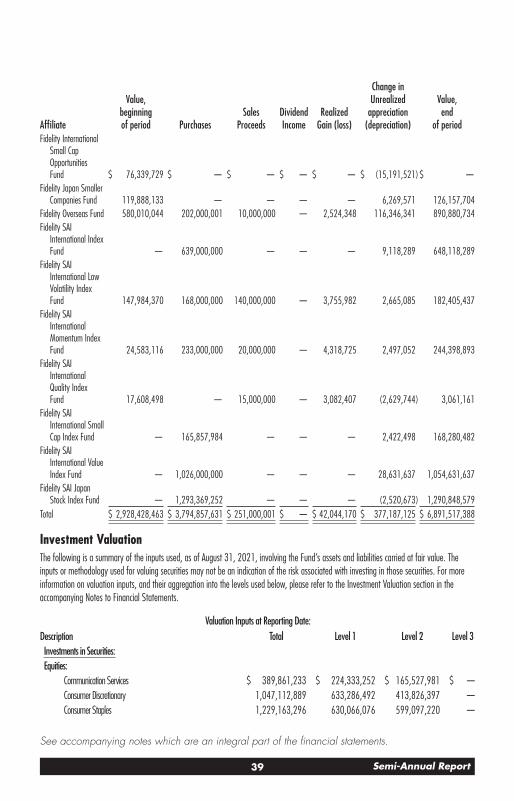
Affiliate
Value, beginning of period Purchases
Sales Proceeds
Dividend Income
Realized Gain (loss)
Change in Unrealized
appreciation (depreciation)
Value, end
of periodFidelity International
Small Cap Opportunities Fund $ 76,339,729 $ — $ — $ — $ — $ (15,191,521)$ —
Fidelity Japan Smaller Companies Fund 119,888,133 — — — — 6,269,571 126,157,704
Fidelity Overseas Fund 580,010,044 202,000,001 10,000,000 — 2,524,348 116,346,341 890,880,734Fidelity SAI
International Index Fund — 639,000,000 — — — 9,118,289 648,118,289
Fidelity SAI International Low Volatility Index Fund 147,984,370 168,000,000 140,000,000 — 3,755,982 2,665,085 182,405,437
Fidelity SAI International Momentum Index Fund 24,583,116 233,000,000 20,000,000 — 4,318,725 2,497,052 244,398,893
Fidelity SAI International Quality Index Fund 17,608,498 — 15,000,000 — 3,082,407 (2,629,744) 3,061,161
Fidelity SAI International Small Cap Index Fund — 165,857,984 — — — 2,422,498 168,280,482
Fidelity SAI International Value Index Fund — 1,026,000,000 — — — 28,631,637 1,054,631,637
Fidelity SAI Japan Stock Index Fund — 1,293,369,252 — — — (2,520,673) 1,290,848,579
Total $ 2,928,428,463 $ 3,794,857,631 $ 251,000,001 $ — $ 42,044,170 $ 377,187,125 $ 6,891,517,388
Investment ValuationThe following is a summary of the inputs used, as of August 31, 2021, involving the Fund’s assets and liabilities carried at fair value. The inputs or methodology used for valuing securities may not be an indication of the risk associated with investing in those securities. For more information on valuation inputs, and their aggregation into the levels used below, please refer to the Investment Valuation section in the accompanying Notes to Financial Statements.
Valuation Inputs at Reporting Date:Description Total Level 1 Level 2 Level 3Investments in Securities:Equities:
Communication Services $ 389,861,233 $ 224,333,252 $ 165,527,981 $ —Consumer Discretionary 1,047,112,889 633,286,492 413,826,397 —Consumer Staples 1,229,163,296 630,066,076 599,097,220 —
40Semi-Annual Report
See accompanying notes which are an integral part of the financial statements.
Schedule of Investments (Unaudited) – continued
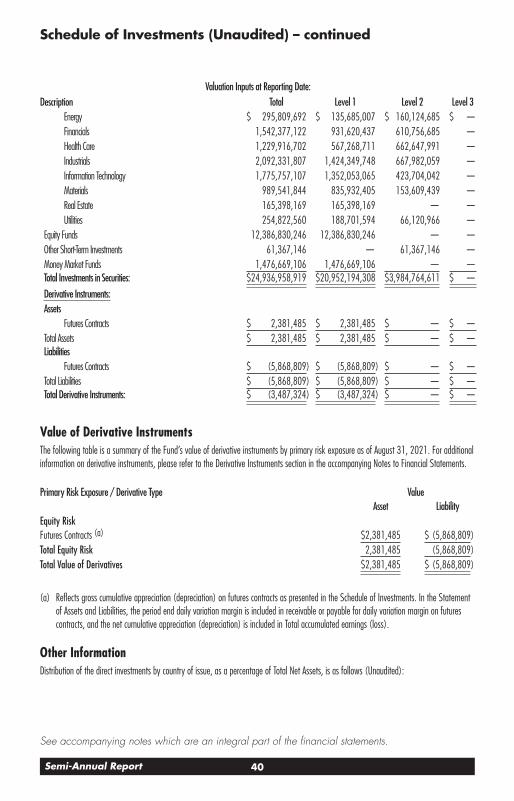
Valuation Inputs at Reporting Date:Description Total Level 1 Level 2 Level 3
Energy $ 295,809,692 $ 135,685,007 $ 160,124,685 $ —Financials 1,542,377,122 931,620,437 610,756,685 —Health Care 1,229,916,702 567,268,711 662,647,991 —Industrials 2,092,331,807 1,424,349,748 667,982,059 —Information Technology 1,775,757,107 1,352,053,065 423,704,042 —Materials 989,541,844 835,932,405 153,609,439 —Real Estate 165,398,169 165,398,169 — —Utilities 254,822,560 188,701,594 66,120,966 —
Equity Funds 12,386,830,246 12,386,830,246 — —Other Short-Term Investments 61,367,146 — 61,367,146 —Money Market Funds 1,476,669,106 1,476,669,106 — —Total Investments in Securities: $ 24,936,958,919 $ 20,952,194,308 $ 3,984,764,611 $ —
Derivative Instruments:Assets
Futures Contracts $ 2,381,485 $ 2,381,485 $ — $ —Total Assets $ 2,381,485 $ 2,381,485 $ — $ —Liabilities
Futures Contracts $ (5,868,809) $ (5,868,809) $ — $ —Total Liabilities $ (5,868,809) $ (5,868,809) $ — $ —Total Derivative Instruments: $ (3,487,324) $ (3,487,324) $ — $ —
Value of Derivative InstrumentsThe following table is a summary of the Fund’s value of derivative instruments by primary risk exposure as of August 31, 2021. For additional information on derivative instruments, please refer to the Derivative Instruments section in the accompanying Notes to Financial Statements.
Primary Risk Exposure / Derivative Type ValueAsset Liability
Equity Risk Futures Contracts (a) $ 2,381,485 $ (5,868,809)Total Equity Risk 2,381,485 (5,868,809)Total Value of Derivatives $ 2,381,485 $ (5,868,809)
(a) Reflects gross cumulative appreciation (depreciation) on futures contracts as presented in the Schedule of Investments. In the Statement of Assets and Liabilities, the period end daily variation margin is included in receivable or payable for daily variation margin on futures contracts, and the net cumulative appreciation (depreciation) is included in Total accumulated earnings (loss).
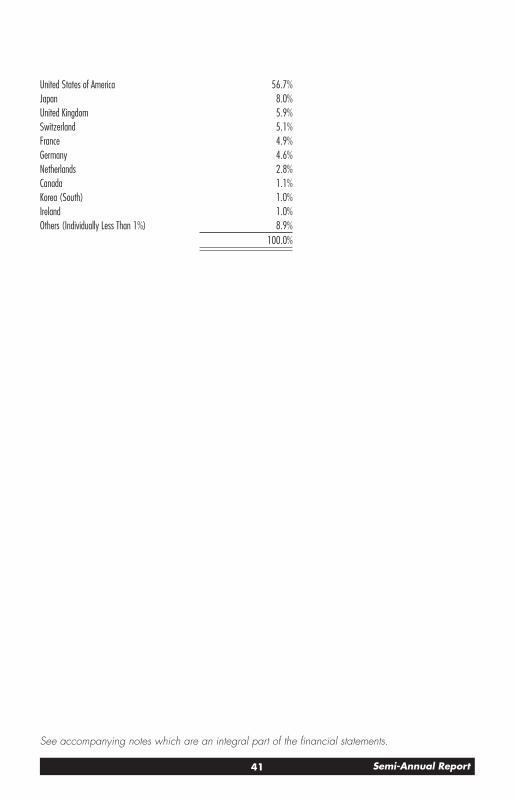
Other InformationDistribution of the direct investments by country of issue, as a percentage of Total Net Assets, is as follows (Unaudited):
41 Semi-Annual Report
See accompanying notes which are an integral part of the financial statements.
United States of America 56.7%Japan 8.0%United Kingdom 5.9%Switzerland 5.1%France 4.9%Germany 4.6%Netherlands 2.8%Canada 1.1%Korea (South) 1.0%Ireland 1.0%Others (Individually Less Than 1%) 8.9%
100.0%
42Semi-Annual Report
See accompanying notes which are an integral part of the financial statements.
Financial Statements
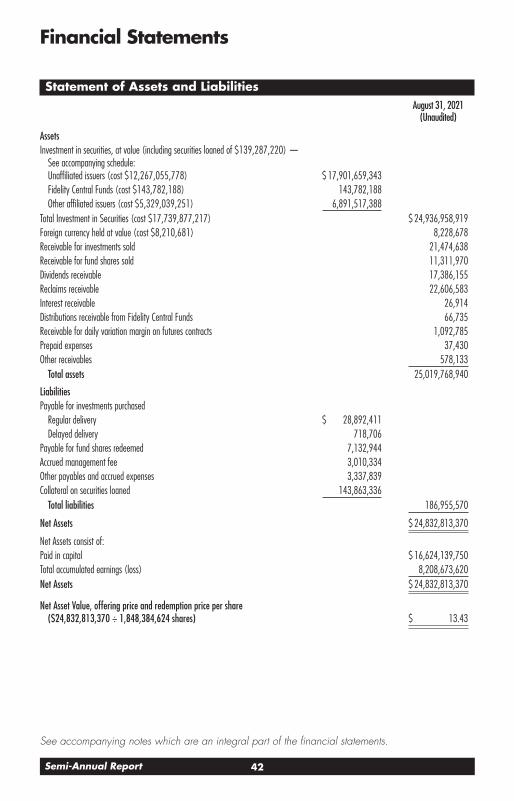
Statement of Assets and LiabilitiesAugust 31, 2021
(Unaudited)
Assets Investment in securities, at value (including securities loaned of $139,287,220) —
See accompanying schedule: Unaffiliated issuers (cost $12,267,055,778) $ 17,901,659,343Fidelity Central Funds (cost $143,782,188) 143,782,188Other affiliated issuers (cost $5,329,039,251) 6,891,517,388
Total Investment in Securities (cost $17,739,877,217) $ 24,936,958,919Foreign currency held at value (cost $8,210,681) 8,228,678Receivable for investments sold 21,474,638Receivable for fund shares sold 11,311,970Dividends receivable 17,386,155Reclaims receivable 22,606,583Interest receivable 26,914Distributions receivable from Fidelity Central Funds 66,735Receivable for daily variation margin on futures contracts 1,092,785Prepaid expenses 37,430Other receivables 578,133
Total assets 25,019,768,940
Liabilities Payable for investments purchased
Regular delivery $ 28,892,411Delayed delivery 718,706
Payable for fund shares redeemed 7,132,944Accrued management fee 3,010,334Other payables and accrued expenses 3,337,839Collateral on securities loaned 143,863,336
Total liabilities 186,955,570
Net Assets $ 24,832,813,370
Net Assets consist of: Paid in capital $ 16,624,139,750Total accumulated earnings (loss) 8,208,673,620Net Assets $ 24,832,813,370
Net Asset Value, offering price and redemption price per share ($24,832,813,370 ÷ 1,848,384,624 shares) $ 13.43
43 Semi-Annual Report
See accompanying notes which are an integral part of the financial statements.
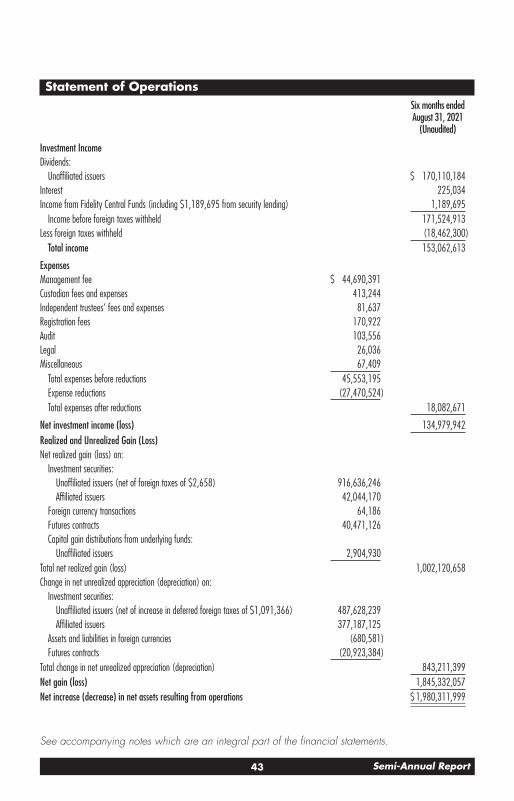
Statement of OperationsSix months ended August 31, 2021
(Unaudited)
Investment Income Dividends:
Unaffiliated issuers $ 170,110,184Interest 225,034Income from Fidelity Central Funds (including $1,189,695 from security lending) 1,189,695
Income before foreign taxes withheld 171,524,913Less foreign taxes withheld (18,462,300)
Total income 153,062,613
Expenses Management fee $ 44,690,391Custodian fees and expenses 413,244Independent trustees’ fees and expenses 81,637Registration fees 170,922Audit 103,556Legal 26,036Miscellaneous 67,409
Total expenses before reductions 45,553,195Expense reductions (27,470,524)Total expenses after reductions 18,082,671
Net investment income (loss) 134,979,942Realized and Unrealized Gain (Loss) Net realized gain (loss) on:
Investment securities: Unaffiliated issuers (net of foreign taxes of $2,658) 916,636,246Affiliated issuers 42,044,170
Foreign currency transactions 64,186Futures contracts 40,471,126Capital gain distributions from underlying funds:
Unaffiliated issuers 2,904,930Total net realized gain (loss) 1,002,120,658Change in net unrealized appreciation (depreciation) on:
Investment securities: Unaffiliated issuers (net of increase in deferred foreign taxes of $1,091,366) 487,628,239Affiliated issuers 377,187,125
Assets and liabilities in foreign currencies (680,581)Futures contracts (20,923,384)
Total change in net unrealized appreciation (depreciation) 843,211,399Net gain (loss) 1,845,332,057Net increase (decrease) in net assets resulting from operations $ 1,980,311,999
44Semi-Annual Report
See accompanying notes which are an integral part of the financial statements.
Financial Statements – continued
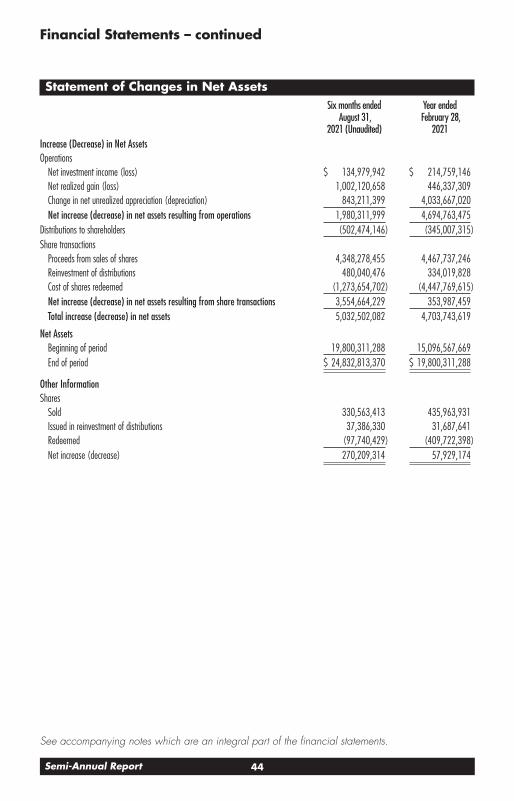
Statement of Changes in Net AssetsSix months ended
August 31, 2021 (Unaudited)
Year ended February 28,
2021Increase (Decrease) in Net Assets Operations
Net investment income (loss) $ 134,979,942 $ 214,759,146Net realized gain (loss) 1,002,120,658 446,337,309Change in net unrealized appreciation (depreciation) 843,211,399 4,033,667,020Net increase (decrease) in net assets resulting from operations 1,980,311,999 4,694,763,475
Distributions to shareholders (502,474,146) (345,007,315)Share transactions
Proceeds from sales of shares 4,348,278,455 4,467,737,246Reinvestment of distributions 480,040,476 334,019,828Cost of shares redeemed (1,273,654,702) (4,447,769,615)Net increase (decrease) in net assets resulting from share transactions 3,554,664,229 353,987,459Total increase (decrease) in net assets 5,032,502,082 4,703,743,619
Net Assets Beginning of period 19,800,311,288 15,096,567,669End of period $ 24,832,813,370 $ 19,800,311,288
Other Information Shares
Sold 330,563,413 435,963,931Issued in reinvestment of distributions 37,386,330 31,687,641Redeemed (97,740,429) (409,722,398)Net increase (decrease) 270,209,314 57,929,174

45 Semi-Annual Report
See accompanying notes which are an integral part of the financial statements.
Financial HighlightsStrategic Advisers International Fund
Six months ended (Unaudited) August 31,
Years ended February 28,
2021 2021 2020 A 2019 2018 2017Selected Per–Share
Data Net asset value, beginning
of period $ 12.55 $ 9.93 $ 10.03 $ 11.43 $ 9.78 $ 8.74Income from Investment
Operations Net investment income
(loss) B .08 .13 .20 .21 .19 .17Net realized and
unrealized gain (loss) 1.12 2.71 .06 (.98) 1.82 1.07
Total from investment operations 1.20 2.84 .26 (.77) 2.01 1.24
Distributions from net investment income (.02) (.14) (.22) (.18) (.18) (.18)
Distributions from net realized gain (.29) (.08) (.14) (.44) (.18) (.02)Total distributions (.32)C (.22) (.36) (.63)C (.36) (.20)
Net asset value, end of period $ 13.43 $ 12.55 $ 9.93 $ 10.03 $ 11.43 $ 9.78
Total Return D,E 9.65% 28.99% 2.35% (6.57)% 20.53% 14.33%Ratios to Average Net
Assets F,G Expenses before
reductions .41%H .43% .44% .45% .50% .48%Expenses net of fee
waivers, if any .16%H .18% .19% .20% .25% .23%Expenses net of all
reductions .16%H .18% .19% .20% .24% .22%Net investment income
(loss) 1.23%H 1.25% 1.91% 1.95% 1.68% 1.81%Supplemental Data
Net assets, end of period (000 omitted) $ 24,832,813 $ 19,800,311 $ 15,096,568 $ 15,904,961 $ 17,256,557 $ 16,141,374
Portfolio turnover rate I 41%H 41% 33% 39% 33% 28%A For the year ended February 29. B Calculated based on average shares outstanding during the period. C Total distributions per share do not sum due to rounding. D Total returns for periods of less than one year are not annualized. E Total returns would have been lower if certain expenses had not been reduced during the applicable periods shown. F Fees and expenses of any underlying mutual funds or exchange-traded funds (ETFs) are not included in the Fund’s expense ratio. The Fund indirectly bears its proportionate share of these expenses. For additional expense information related to investments in Fidelity Central Funds, please refer to the “Investments in Fidelity Central Funds” note found in the Notes to Financial Statements section of the most recent Annual or Semi-Annual report. G Expense ratios reflect operating expenses of the class. Expenses before reductions do not reflect amounts reimbursed, waived, or reduced through arrangements with the investment advisor, brokerage services, or other offset arrangements, if applicable, and do not represent the amount paid by the class during periods when reimbursements, waivers or reductions occur. H Annualized I Amount does not include the portfolio activity of any underlying mutual funds or exchange-traded funds (ETFs).

46Semi-Annual Report
Notes to Financial Statements (Unaudited)For the period ended August 31, 2021
1. Organization.
Strategic Advisers International Fund (the Fund) is a fund of Fidelity Rutland Square Trust II (the Trust), and is autho-rized to issue an unlimited number of shares. The Trust is registered under the Investment Company Act of 1940, as amended (the 1940 Act), as an open-end management investment company organized as a Delaware statutory trust. The Fund is offered exclusively to certain managed account clients of Strategic Advisers LLC (Strategic Advisers), an affiliate of Fidelity Management & Research Company LLC (FMR).
2. Significant Accounting Policies.
The Fund is an investment company and applies the accounting and reporting guidance of the Financial Accounting Standards Board (FASB) Accounting Standards Codification Topic 946 Financial Services – Investment Companies. The financial statements have been prepared in conformity with accounting principles generally accepted in the United States of America (GAAP), which require management to make certain estimates and assumptions at the date of the financial statements. Actual results could differ from those estimates. Subsequent events, if any, through the date that the financial statements were issued have been evaluated in the preparation of the financial statements. The Fund’s Schedule of Investments lists any underlying mutual funds or exchange-traded funds (ETFs) but does not include the underlying holdings of these funds. The following summarizes the significant accounting policies of the Fund:
Investment Valuation. Investments are valued as of 4:00 p.m. Eastern time on the last calendar day of the period. The Board of Trustees (the Board) has delegated the day to day responsibility for the valuation of the Fund’s invest-ments to the Fair Value Committee (the Committee) established by the Fund’s investment adviser. In accordance with valuation policies and procedures approved by the Board, the Fund attempts to obtain prices from one or more third party pricing vendors or brokers to value its investments. When current market prices, quotations or currency exchange rates are not readily available or reliable, investments will be fair valued in good faith by the Committee, in accordance with procedures adopted by the Board. Factors used in determining fair value vary by investment type and may include market or investment specific events, changes in interest rates and credit quality. The frequency with which these procedures are used cannot be predicted and they may be utilized to a significant extent. The Committee oversees the Fund’s valuation policies and procedures and reports to the Board on the Committee’s activities and fair value determinations. The Board monitors the appropriateness of the procedures used in valuing the Fund’s invest-ments and ratifies the fair value determinations of the Committee.
The Fund categorizes the inputs to valuation techniques used to value its investments into a disclosure hierarchy consisting of three levels as shown below:
Level 1 – quoted prices in active markets for identical investments
Level 2 – other significant observable inputs (including quoted prices for similar investments, interest rates, prepayment speeds, etc.)
Level 3 – unobservable inputs (including the Fund’s own assumptions based on the best information available)
Valuation techniques used to value the Fund’s investments by major category are as follows:
Equity securities, including restricted securities, for which market quotations are readily available, are valued at the last reported sale price or official closing price as reported by a third party pricing vendor on the primary market or exchange on which they are traded and are categorized as Level 1 in the hierarchy. In the event there were no sales

47 Semi-Annual Report
during the day or closing prices are not available, securities are valued at the last quoted bid price or may be valued using the last available price and are generally categorized as Level 2 in the hierarchy. For foreign equity securities, when market or security specific events arise, comparisons to the valuation of American Depositary Receipts (ADRs), futures contracts, Exchange-Traded Funds (ETFs) and certain indexes as well as quoted prices for similar securities may be used and would be categorized as Level 2 in the hierarchy. For equity securities, including restricted securities, where observable inputs are limited, assumptions about market activity and risk are used and these securities may be categorized as Level 3 in the hierarchy.
Debt securities, including restricted securities, are valued based on evaluated prices received from third party pricing vendors or from brokers who make markets in such securities. U.S. government and government agency obligations are valued by pricing vendors who utilize matrix pricing which considers yield or price of bonds of comparable quality, coupon, maturity and type or by broker-supplied prices. When independent prices are unavailable or unreliable, debt securities may be valued utilizing pricing methodologies which consider similar factors that would be used by third party pricing vendors. Debt securities are generally categorized as Level 2 in the hierarchy but may be Level 3 depending on the circumstances. ETFs are valued at their last sale price or official closing price as reported by a third party pricing vendor on the primary market or exchange on which they are traded and are categorized as Level 1 in the hierarchy. In the event there were no sales during the day but the exchange reports a closing bid level, ETFs are valued at the closing bid and would be categorized as Level 1 in the hierarchy. In the event there was no closing bid, ETFs may be valued by another method that the Board believes reflects fair value in accordance with the Board’s fair value pricing policies and may be categorized as Level 2 in the hierarchy.
Futures contracts are valued at the settlement price established each day by the board of trade or exchange on which they are traded and are categorized as Level 1 in the hierarchy. Investments in open-end mutual funds, including the Fidelity Central Funds, are valued at their closing net asset value (NAV) each business day and are categorized as Level 1 in the hierarchy. If an unaffiliated open-end mutual fund’s NAV is unavailable, shares of that fund may be valued by another method that the Board believes reflects fair value in accordance with the Board’s fair value pricing policies and is categorized as Level 2 in the hierarchy.
Changes in valuation techniques may result in transfers in or out of an assigned level within the disclosure hierarchy. The aggregate value of investments by input level as of August 31, 2021 is included at the end of the Fund’s Schedule of Investments.
Foreign Currency. Certain Funds may use foreign currency contracts to facilitate transactions in foreign-denominated securities. Gains and losses from these transactions may arise from changes in the value of the foreign currency or if the counterparties do not perform under the contracts’ terms.
Foreign-denominated assets, including investment securities, and liabilities are translated into U.S. dollars at the exchange rates at period end. Purchases and sales of investment securities, income and dividends received, and expenses denominated in foreign currencies are translated into U.S. dollars at the exchange rate in effect on the transaction date.
The effects of exchange rate fluctuations on investments are included with the net realized and unrealized gain (loss) on investment securities. Other foreign currency transactions resulting in realized and unrealized gain (loss) are disclosed separately.
48Semi-Annual Report
Notes to Financial Statements (Unaudited) – continued
Investment Transactions and Income. For financial reporting purposes, the Fund’s investment holdings and NAV include trades executed through the end of the last business day of the period. The NAV per share for processing shareholder transactions is calculated as of the close of business of the New York Stock Exchange (NYSE), normally 4:00 p.m. Eastern time and includes trades executed through the end of the prior business day. Gains and losses on securities sold are determined on the basis of identified cost and include proceeds received from litigation. Dividend income is recorded on the ex-dividend date, except for certain dividends from foreign securities where the ex-dividend date may have passed, which are recorded as soon as the Fund is informed of the ex-dividend date. Non-cash divi-dends included in dividend income, if any, are recorded at the fair market value of the securities received. Income and capital gain distributions from Fidelity Central Funds, if any, are recorded on the ex-dividend date. Income and capital gain distributions from any underlying mutual funds or exchange-traded funds (ETFs) are recorded on the ex-dividend date. Interest income is accrued as earned and includes coupon interest and amortization of premium and accretion of discount on debt securities as applicable. Investment income is recorded net of foreign taxes withheld where recovery of such taxes is uncertain. Funds may file withholding tax reclaims in certain jurisdictions to recover a portion of amounts previously withheld. Any withholding tax reclaims income is included in the Statement of Operations in foreign taxes withheld. Any receivables for withholding tax reclaims are included in the Statement of Assets and Liabilities in reclaims receivable.
Expenses. Expenses directly attributable to a fund are charged to that fund. Expenses attributable to more than one fund are allocated among the respective funds on the basis of relative net assets or other appropriate methods. Expenses included in the accompanying financial statements reflect the expenses of that fund and do not include any expenses associated with any underlying mutual funds or exchange-traded funds. Although not included in a fund’s expenses, a fund indirectly bears its proportionate share of these expenses through the net asset value of each underlying mutual fund or exchange-traded fund. Expense estimates are accrued in the period to which they relate and adjustments are made when actual amounts are known.
Deferred Trustee Compensation. Under a Deferred Compensation Plan (the Plan) for certain Funds, certain independent Trustees have elected to defer receipt of a portion of their annual compensation. Deferred amounts are invested in affiliated mutual funds, are marked-to-market and remain in a fund until distributed in accordance with the Plan. The investment of deferred amounts and the offsetting payable to the Trustees presented below are included in the accompanying Statement of Assets and Liabilities in other receivables and other payables and accrued expenses, as applicable.
Strategic Advisers International Fund $ 338,151
Income Tax Information and Distributions to Shareholders. Each year, the Fund intends to qualify as a regulated investment company under Subchapter M of the Internal Revenue Code, including distributing substantially all of its taxable income and realized gains. As a result, no provision for U.S. Federal income taxes is required. The Fund files a U.S. federal tax return, in addition to state and local tax returns as required. The Fund’s federal income tax returns are subject to examination by the Internal Revenue Service (IRS) for a period of three fiscal years after they are filed. State and local tax returns may be subject to examination for an additional fiscal year depending on the jurisdiction. Foreign taxes are provided for based on the Fund’s understanding of the tax rules and rates that exist in the foreign markets in which it invests. The Fund is subject to a tax imposed on capital gains by certain countries in which it

49 Semi-Annual Report
invests. An estimated deferred tax liability for net unrealized appreciation on the applicable securities is included in Other payables and accrued expenses on the Statement of Assets & Liabilities.
Distributions are declared and recorded on the ex-dividend date. Income and capital gain distributions are determined in accordance with income tax regulations, which may differ from GAAP.
Capital accounts within the financial statements are adjusted for permanent book-tax differences. These adjustments have no impact on net assets or the results of operations. Capital accounts are not adjusted for temporary book-tax differences which will reverse in a subsequent period.
Book-tax differences are primarily due to the short-term gain distributions from the underlying mutual funds or exchange-traded funds (ETFs), futures contracts, foreign currency transactions, passive foreign investment companies (PFIC), market discount, deferred trustees compensation and losses deferred due to wash sales.
As of period end, the cost and unrealized appreciation (depreciation) in securities, and derivatives if applicable, for federal income tax purposes were as follows:
Gross unrealized appreciation $ 7,361,643,620Gross unrealized depreciation (216,239,554)Net unrealized appreciation (depreciation) $ 7,145,404,066
Tax cost $ 17,788,067,529
Delayed Delivery Transactions and When-Issued Securities. During the period, certain Funds transacted in securities on a delayed delivery or when-issued basis. Payment and delivery may take place after the customary settlement period for that security. The price of the underlying securities and the date when the securities will be delivered and paid for are fixed at the time the transaction is negotiated. Securities purchased on a delayed delivery or when-issued basis are identified as such in the Schedule of Investments. Compensation for interest forgone in the purchase of a delayed delivery or when-issued debt security may be received. With respect to purchase commitments, each applicable Fund identifies securities as segregated in its records with a value at least equal to the amount of the commitment. Payables and receivables associated with the purchases and sales of delayed delivery securities having the same coupon, settlement date and broker are offset. Delayed delivery or when-issued securities that have been purchased from and sold to different brokers are reflected as both payables and receivables in the Statement of Assets and Liabilities under the caption “Delayed delivery”, as applicable. Losses may arise due to changes in the value of the underlying securities or if the counterparty does not perform under the contract’s terms, or if the issuer does not issue the securities due to political, economic, or other factors.
Restricted Securities (including Private Placements). Funds may invest in securities that are subject to legal or contractual restrictions on resale. These securities generally may be resold in transactions exempt from registration or to the public if the securities are registered. Disposal of these securities may involve time-consuming negotiations and expense, and prompt sale at an acceptable price may be difficult. Information regarding restricted securities held at period end is included at the end of the Schedule of Investments, if applicable.

50Semi-Annual Report
Notes to Financial Statements (Unaudited) – continued
3. Derivative Instruments.
Risk Exposures and the Use of Derivative Instruments. The Fund’s investment objective allows the Fund to enter into various types of derivative contracts, including futures contracts. Derivatives are investments whose value is primarily derived from underlying assets, indices or reference rates and may be transacted on an exchange or over-the-counter (OTC). Derivatives may involve a future commitment to buy or sell a specified asset based on specified terms, to exchange future cash flows at periodic intervals based on a notional principal amount, or for one party to make one or more payments upon the occurrence of specified events in exchange for periodic payments from the other party.
The Fund used derivatives to increase returns and to manage exposure to certain risks as defined below. The success of any strategy involving derivatives depends on analysis of numerous economic factors, and if the strategies for investment do not work as intended, the Fund may not achieve its objectives.
The Fund’s use of derivatives increased or decreased its exposure to the following risk:
Equity Risk Equity risk relates to the fluctuations in the value of financial instruments as a result of changes in market prices (other than those arising from interest rate risk or foreign exchange risk), whether caused by factors specific to an individual investment, its issuer, or all factors affecting all instruments traded in a market or market segment.
The Fund is also exposed to additional risks from investing in derivatives, such as liquidity risk and counterparty credit risk. Liquidity risk is the risk that the Fund will be unable to close out the derivative in the open market in a timely manner. Counterparty credit risk is the risk that the counterparty will not be able to fulfill its obligation to the Fund. Counterparty credit risk related to exchange-traded futures contracts may be mitigated by the protection provided by the exchange on which they trade.
Investing in derivatives may involve greater risks than investing in the underlying assets directly and, to varying degrees, may involve risk of loss in excess of any initial investment and collateral received and amounts recognized in the Statement of Assets and Liabilities. In addition, there may be the risk that the change in value of the derivative contract does not correspond to the change in value of the underlying instrument.
Futures Contracts. A futures contract is an agreement between two parties to buy or sell a specified underlying instru-ment for a fixed price at a specified future date. The Fund used futures contracts to manage its exposure to the stock market.
Upon entering into a futures contract, a fund is required to deposit either cash or securities (initial margin) with a clearing broker in an amount equal to a certain percentage of the face value of the contract. Futures contracts are marked-to-market daily and subsequent daily payments (variation margin) are made or received by a fund depending on the daily fluctuations in the value of the futures contracts and are recorded as unrealized appreciation or (deprecia-tion). This receivable and/or payable, if any, is included in daily variation margin on futures contracts in the Statement of Assets and Liabilities. Realized gain or (loss) is recorded upon the expiration or closing of a futures contract. The net realized gain (loss) and change in net unrealized appreciation (depreciation) on futures contracts during the period is presented in the Statement of Operations.
Any open futures contracts at period end are presented in the Schedule of Investments under the caption “Futures Contracts”. The notional amount at value reflects each contract’s exposure to the underlying instrument or index at
51 Semi-Annual Report
period end and is representative of volume of activity during the period. Securities deposited to meet initial margin requirements are identified in the Schedule of Investments.
4. Purchases and Sales of Investments.
Purchases and sales of securities, other than short-term securities and in-kind transactions, as applicable, are noted in the table below.
Purchases ($) Sales ($)Strategic Advisers International Fund 6,489,374,876 4,311,150,909
5. Fees and Other Transactions with Affiliates.
Management Fee. Strategic Advisers (the investment adviser) provides the Fund with investment management related services. For these services, the Fund pays a monthly management fee to the investment adviser. The management fee is calculated by adding the annual management fee rate of .25% of the Fund’s average net assets throughout the month to the aggregate of the fee rates, payable monthly by the investment adviser, to the Fund’s sub-advisers. The Fund’s maximum aggregate management fee will not exceed 1.00% of the Fund’s average net assets. For the reporting period, the total annualized management fee rate was .41% of the Fund’s average net assets.
During the period, the investment adviser waived a portion of its management fee as described in the Expense Reductions note.
Sub-Advisers. Arrowstreet Capital, Limited Partnership, Causeway Capital Management, LLC, Massachusetts Financial Services Company (MFS), Thompson, Siegel & Walmsley LLC, T. Rowe Price Associates, Inc. and William Blair Investment Management, LLC each served as a sub-adviser for the Fund during the period. Sub-advisers provide discretionary investment advisory services for their allocated portion of the Fund’s assets and are paid as described in the Management Fee note.
FIAM LLC (an affiliate of the investment adviser), FIL Investment Advisors and Geode Capital Management, LLC, have been retained to serve as a sub-adviser for the Fund. As of the date of this report, these sub-advisers have not been allocated any portion of the Fund’s assets. These sub-advisers in the future may provide discretionary investment advisory services for an allocated portion of the Fund’s assets and will be paid by the investment adviser for providing these services.
Brokerage Commissions. A portion of portfolio transactions were placed with brokerage firms which are affiliates of the investment adviser. Brokerage commissions are included in net realized gain (loss) and change in net unrealized appreciation (depreciation) in the Statement of Operations. The commissions paid to these affiliated firms were as follows:
AmountStrategic Advisers International Fund $ 258

52Semi-Annual Report
Notes to Financial Statements (Unaudited) – continued
Interfund Trades. Funds may purchase from or sell securities to other funds affiliated with each sub-adviser under procedures adopted by the Board. The procedures have been designed to ensure these interfund trades are executed in accordance with Rule 17a-7 of the 1940 Act. Any interfund trades are included within the respective purchases and sales amounts shown in the Purchases and Sales of Investments note.
Other. During the period, the investment adviser reimbursed the Fund for certain losses as follows:
Amount ($)Strategic Advisers International Fund 5,243
6. Investments in Fidelity Central Funds.
Funds may invest in Fidelity Central Funds, which are open-end investment companies generally available only to other investment companies and accounts managed by the investment adviser and its affiliates. The Schedule of Investments lists any Fidelity Central Funds held as an investment as of period end, but does not include the underly-ing holdings of each Fidelity Central Fund. An investing fund indirectly bears its proportionate share of the expenses of the underlying Fidelity Central Funds.
Based on its investment objective, each Fidelity Central Fund may invest or participate in various investment vehicles or strategies that are similar to those of the investing fund. These strategies are consistent with the investment objec-tives of the investing fund and may involve certain economic risks which may cause a decline in value of each of the Fidelity Central Funds and thus a decline in the value of the investing fund.
Fidelity Central Fund Investment Manager Investment Objective Investment Practices Expense Ratio(a)
Fidelity Money Market Central Funds
Fidelity Management & Research Company LLC (FMR)
Each fund seeks to obtain a high level of current income consistent with the preservation of capital and liquidity.
Short-term Investments Less than .005% to .01%
(a) Expenses expressed as a percentage of average net assets and are as of each underlying Central Fund’s most recent annual or semi-annual shareholder report.
A complete unaudited list of holdings for each Fidelity Central Fund is available upon request or at the Securities and Exchange Commission website at www.sec.gov. In addition, the financial statements of the Fidelity Central Funds, which are not covered by the Report of Independent Registered Public Accounting Firm, are available on the Securities and Exchange Commission website or upon request.
7. Committed Line of Credit.
Certain Funds participate with other funds managed by the investment adviser or an affiliate in a $4.25 billion credit facility (the “line of credit”) to be utilized for temporary or emergency purposes to fund shareholder redemptions or for other short-term liquidity purposes. The participating funds have agreed to pay commitment fees on their pro-rata portion of the line of credit, which are reflected in Miscellaneous expenses on the Statement of Operations, and are listed below. During the period, there were no borrowings on this line of credit.

53 Semi-Annual Report
AmountStrategic Advisers International Fund $ 19,125
8. Security Lending.
Funds lend portfolio securities through a lending agent from time to time in order to earn additional income. On the settlement date of the loan, a fund receives collateral (in the form of U.S. Treasury obligations, letters of credit and/or cash) against the loaned securities and maintains collateral in an amount not less than 100% of the market value of the loaned securities during the period of the loan. The market value of the loaned securities is determined at the close of business of a fund and any additional required collateral is delivered to a fund on the next business day. A fund or borrower may terminate the loan at any time, and if the borrower defaults on its obligation to return the securities loaned because of insolvency or other reasons, a fund may apply collateral received from the borrower against the obligation. A fund may experience delays and costs in recovering the securities loaned. Any cash collateral received is invested in the Fidelity Securities Lending Cash Central Fund. Any loaned securities are identified as such in the Schedule of Investments, and the value of loaned securities and cash collateral at period end, as applicable, are presented in the Statement of Assets and Liabilities. Security lending income represents the income earned on investing cash collateral, less rebates paid to borrowers and any lending agent fees associated with the loan, plus any premium payments received for lending certain types of securities. Security lending income is presented in the Statement of Operations as a component of income from Fidelity Central Funds.
9. Expense Reductions.
The investment adviser has contractually agreed to waive the Fund’s management fee in an amount equal to .25% of the Fund’s average net assets until September 30, 2024. During the period, this waiver reduced the Fund’s manage-ment fee by $27,470,267.
In addition, through arrangements with the Fund’s custodian, credits realized as a result of certain uninvested cash balances were used to reduce the Fund’s expenses by $257.
10. Other.
Fund’s organizational documents provide former and current trustees and officers with a limited indemnification against liabilities arising in connection with the performance of their duties to the fund. In the normal course of business, the fund may also enter into contracts that provide general indemnifications. The fund’s maximum exposure under these arrangements is unknown as this would be dependent on future claims that may be made against the fund. The risk of material loss from such claims is considered remote.
Funds do not invest in underlying mutual funds for the purpose of exercising management or control; however, investments by funds within their principal investment strategies may represent a significant portion of the underlying mutual fund’s net assets. At the end of the period, certain Funds were the owners of record of 10% or more of the total outstanding shares of the following underlying mutual funds as shown below.
54Semi-Annual Report
Notes to Financial Statements (Unaudited) – continued
FundStrategic Advisers International Fund
Fidelity International Discovery Fund 11%Fidelity SAI International Index Fund 10%Fidelity SAI International Momentum Index Fund 24%Fidelity SAI International Small Cap Index Fund 19%Fidelity SAI International Value Index Fund 17%Fidelity SAI Japan Stock Index Fund 84%
11. Coronavirus (COVID-19) Pandemic.
An outbreak of COVID-19 first detected in China during December 2019 has since spread globally and was declared a pandemic by the World Health Organization during March 2020. Developments that disrupt global economies and financial markets, such as the COVID-19 pandemic, may magnify factors that affect the Fund’s performance.

55 Semi-Annual Report
Shareholder Expense Example
As a shareholder, you incur two types of costs: (1) transaction costs, which may include sales charges (loads) on purchase payments or redemption proceeds, as applicable and (2) ongoing costs, which generally include manage-ment fees, distribution and/or service (12b-1) fees and other Fund expenses. This Example is intended to help you understand your ongoing costs (in dollars) of investing in a fund and to compare these costs with the ongoing costs of investing in other mutual funds.The Example is based on an investment of $1,000 invested at the beginning of the period and held for the entire period (March 1, 2021 to August 31, 2021).Actual ExpensesThe first line of the accompanying table provides information about actual account values and actual expenses. You may use the information in this line, together with the amount you invested, to estimate the expenses that you paid over the period. Simply divide your account value by $1,000.00 (for example, an $8,600 account value divided by $1,000.00 = 8.6), then multiply the result by the number in the first line for a class/Fund under the heading entitled “Expenses Paid During Period” to estimate the expenses you paid on your account during this period. If any fund is a shareholder of any underlying mutual funds or exchange-traded funds (ETFs) (the Underlying Funds), such fund indirectly bears its proportional share of the expenses of the Underlying Funds in addition to the direct expenses incurred presented in the table. These fees and expenses are not included in the annualized expense ratio used to calculate the expense estimate in the table below.Hypothetical Example for Comparison PurposesThe second line of the accompanying table provides information about hypothetical account values and hypothetical expenses based on the actual expense ratio and an assumed rate of return of 5% per year before expenses, which is not the actual return. The hypothetical account values and expenses may not be used to estimate the actual ending account balance or expenses you paid for the period. You may use this information to compare the ongoing costs of investing in the Fund and other funds. To do so, compare this 5% hypothetical example with the 5% hypothetical examples that appear in the shareholder reports of the other funds. If any fund is a shareholder of any Underlying Funds, such fund indirectly bears its proportional share of the expenses of the Underlying Funds in addition to the direct expenses as presented in the table. These fees and expenses are not included in the annualized expense ratio used to calculate the expense estimate in the table below.Please note that the expenses shown in the table are meant to highlight your ongoing costs only and do not reflect any transaction costs. Therefore, the second line of the table is useful in comparing ongoing costs only, and will not help you determine the relative total costs of owning different funds.
Annualized Expense Ratio- A
Beginning Account Value March 1, 2021
Ending Account Value
August 31, 2021
Expenses Paid During Period- B
March 1, 2021 to August 31, 2021
Strategic Advisers International Fund .16%
Actual $1,000.00 $1,096.50 $.85Hypothetical- C $1,000.00 $1,024.40 $.82
A Annualized expense ratio reflects expenses net of applicable fee waivers.B Expenses are equal to the annualized expense ratio, multiplied by the average account value over the period, multiplied by 184/ 365
(to reflect the one-half year period). The fees and expenses of any Underlying Funds are not included in each annualized expense ratio.C 5% return per year before expenses
56Semi-Annual Report
Board Approval of Amended Sub-Advisory AgreementStrategic Advisers International Fund
In June 2021, the Board of Trustees, including the Independent Trustees (together, the Board) voted to approve amendments to the fee schedules for the investment mandates in the existing sub-advisory agreements among Strategic Advisers LLC (Strategic Advisers), each of Causeway Capital Management LLC (Causeway), Massachusetts Financial Services Company (MFS) (with respect to only one of two investment mandates), and Thompson, Siegel & Walmsley LLC (TSW) (each, a Sub-Adviser), and Fidelity Rutland Square Trust II (Trust) on behalf of the fund, and also voted to approve an amendment in the existing sub-advisory agreement among Strategic Advisers, Causeway, and the Trust on behalf of the fund to add certain additional representations from Causeway regarding a participating affiliate arrangement (each, an Amended Sub-Advisory Agreement). The Board noted that the updated fee schedules in the Amended Sub-Advisory Agreements will result in the same or lower fees at all asset levels. The Board also noted that no other material contract terms are impacted by the Amended Sub-Advisory Agreements. The Board, assisted by the advice of fund counsel and Independent Trustees’ counsel, considered a broad range of information.
In considering whether to approve each Amended Sub-Advisory Agreement, the Board reached a determination, with the assistance of fund counsel and Independent Trustees’ counsel and through the exercise of its business judgment, that the approval of each Amended Sub-Advisory Agreement is in the best interests of the fund and its sharehold-ers and that the approval of such agreement does not involve a conflict of interest from which Strategic Advisers or its affiliates derive an inappropriate advantage. Also, the Board found that the fees to be charged under each Amended Sub-Advisory Agreement bear a reasonable relationship to the services to be rendered and will be based on services provided that will be in addition to, rather than duplicative of services provided under the advisory contract of any underlying fund in which the fund may invest. The Board’s decision to approve each Amended Sub-Advisory Agreement was not based on any single factor, but rather was based on a comprehensive consideration of all the information provided to the Board. In addition, individual Trustees did not necessarily attribute the same weight or importance to each factor.
Nature, Extent, and Quality of Services Provided. The Board considered the backgrounds of the investment personnel that will provide services to the fund, and also considered the fund’s investment objective, strategies and related investment philosophy and current sub-adviser line-up, as well as the structures of the investment personnel compensation programs and whether such structures provide appropriate incentives to act in the best interests of the fund, at its September 2020 meeting. The Board considered the detailed information provided by Strategic Advisers and each Sub-Adviser in the June 2021 annual contract renewal materials.
The Board noted that it had approved the existing sub-advisory agreement with each Sub-Adviser at its September 2020 meeting and that each Amended Sub-Advisory Agreement will not result in any changes to: (i) the nature, extent and quality of the sub-advisory services provided; (ii) the investment process or strategies employed in the management of the fund’s assets; or (iii) the day-to-day management of the fund or the persons primarily responsible for such management.
Investment Performance. The Board did not consider performance to be a material factor in its decision to approve each Amended Sub-Advisory Agreement because the approval of each Amended Sub-Advisory Agreement will not result in any changes (i) to the fund’s investment processes or strategies; or (ii) in the persons primarily responsible for the day-to-day management of the fund.

57 Semi-Annual Report
Based on its review, the Board concluded that the nature, extent, and quality of services that will be provided to the fund under each Amended Sub-Advisory Agreement will continue to benefit the fund’s shareholders.
Competitiveness of Management Fee and Total Fund Expenses.
The Board noted that each Amended Sub-Advisory Agreement will not result in changes to the maximum aggregate annual management fee payable by the fund or Strategic Advisers’ portion of the management fee. The Board considered Strategic Advisers’ contractual agreement to waive its portion of the fund’s management fee. The Board considered that each Amended Sub-Advisory Agreement will or has the potential to result in a decrease in the total management fees of the fund. Based on its review, the Board concluded that the fund’s management fee structure and any changes to projected total expenses bear a reasonable relationship to the services that the fund and its shareholders will receive and the other factors considered.
Because each Amended Sub-Advisory Agreement was negotiated at arm’s length and will have no impact on the maximum management fees payable by the fund, the Board did not consider the costs of services and profitability of the relationship with the fund to Strategic Advisers to be significant factors in its decision to approve each Amended Sub-Advisory Agreement.
Potential Fall-Out Benefits. The Board considered that it reviews information regarding the potential of direct and indirect benefits to Strategic Advisers and its affiliates from their relationships with the fund, including non-advisory fee compensation paid to affiliates of Strategic Advisers, if any, as well as information regarding potential fall-out benefits accruing to each Sub-Adviser, if any, as a result of its relationship with the fund, during its annual renewal of the fund’s management contract, sub-advisory agreements, and sub-subadvisory agreements. The Board considered Strategic Advisers’ representation that it does not anticipate that the approval of each Amended Sub-Advisory Agreement will have a significant impact on the profitability of, or potential fall-out benefits to, Strategic Advisers or its affiliates.
Possible Economies of Scale. The Board considered that it reviews whether there have been economies of scale in connection with the management of the fund during its annual renewal of the fund’s management contract, sub-advisory agreements, and sub-subadvisory agreements. The Board noted that each Amended Sub-Advisory Agreement will continue to provide for breakpoints that have the potential to reduce sub-advisory fees paid to the Sub-Adviser as assets allocated to the Sub-Adviser grow. The Board also noted that it did not consider the possible realization of economies of scale to be a significant factor in its decision to approve each Amended Sub-Advisory Agreement because the fund will not bear any additional management fees or expenses under each Amended Sub-Advisory Agreement.
Conclusion. Based on its evaluation of all of the conclusions noted above, and after considering all factors it believed relevant, the Board concluded that each Amended Sub-Advisory Agreement’s fee structure bears a reasonable relation-ship to the services to be rendered and that each Amended Sub-Advisory Agreement is in the best interests of the fund and its shareholders and should be approved. The Board also concluded that the sub-advisory fees to be charged under each Amended Sub-Advisory Agreement will be based on services provided that will be in addition to, rather than duplicative of, services provided under the advisory contract of any underlying fund in which the fund may invest. In addition, the Board concluded that the approval of each Amended Sub-Advisory Agreement does not involve a conflict of interest from which Strategic Advisers or its affiliates derive an inappropriate advantage.
58Semi-Annual Report
Board Approval of New Sub-Advisory AgreementStrategic Advisers International Fund
In June 2021, the Board of Trustees, including the Independent Trustees (together, the Board) voted to approve a new sub-advisory agreement among Strategic Advisers LLC (Strategic Advisers), Thompson, Siegel & Walmsley LLC (TSW or Sub-Adviser), and Fidelity Rutland Square Trust II (Trust) on behalf of the fund (New Sub-Advisory Agreement) through September 30, 2021, with the understanding that the Board will consider the renewal of the New Sub-Advisory Agreement in September 2021. The Board noted that TSW is an existing sub-adviser to the fund and that the New Sub-Advisory Agreement will take effect upon consummation of a transaction pursuant to which Pendal Group Limited will acquire 100% of the equity interests in TSW (Transaction). The Board, assisted by the advice of fund counsel and Independent Trustees’ counsel, considered a broad range of information.
In considering whether to approve the New Sub-Advisory Agreement, the Board reached a determination, with the assistance of fund counsel and Independent Trustees’ counsel and through the exercise of its business judgment, that the approval of the New Sub-Advisory Agreement is in the best interests of the fund and its shareholders and that the approval of such agreement does not involve a conflict of interest from which Strategic Advisers or its affiliates derive an inappropriate advantage. Also, the Board found that the sub-advisory fees to be charged under the New Sub-Advisory Agreement bear a reasonable relationship to the services to be rendered and will be based upon services provided that will be in addition to, rather than duplicative of services provided under the advisory contract of any underlying fund in which the fund may invest.
The Board noted that it had approved an existing sub-advisory agreement with the Sub-Adviser at its September 2020 meeting. The Board further noted that the Transaction is not expected to result in any changes to: (i) the nature, extent and quality of the sub-advisory services provided; (ii) the investment process or strategies employed in the management of the fund’s assets; or (iii) the day-to-day management of the fund or the persons primarily responsible for such management. The Board also considered the detailed information provided by Strategic Advisers and the Sub-Adviser in the June 2021 annual contract renewal materials.
In connection with its consideration of future renewals of the New Sub-Advisory Agreement, the Board will consider: (i) the nature, extent and quality of services provided to the fund, including investment performance; (ii) the competitiveness of the management fee and total expenses for the fund; (iii) the costs of the services and profit-ability, including the revenues earned and the expenses incurred in conducting the business of developing, marketing, distributing, managing, administering, and servicing the fund and its shareholders; and (iv) whether there have been economies of scale in respect of the Fidelity funds, whether the Strategic Advisers funds (including the fund) have appropriately benefited from any such economies of scale, and whether there is the potential for realization of any further economies.
The Board concluded that the New Sub-Advisory Agreement is in the best interests of the fund and its shareholders and should be approved through September 31, 2021, with the understanding that the Board will consider the renewal of the New Sub-Advisory Agreement in September 2021. The Board also concluded that the sub-advisory fees to be charged under the New Sub-Advisory Agreement will be based on services provided that will be in addition to, rather than duplicative of, services provided under the advisory contract of any underlying fund in which the fund may invest. In addition, the Board concluded that the approval of the New Sub-Advisory Agreement does not involve a conflict of interest from which Strategic Advisers or its affiliates derive an inappropriate advantage.

59 Semi-Annual Report

SIT-SANN-1021 1.912867.111