Strain-induced seismic anisotropy of wadsleyite ... · Strain-induced seismic anisotropy of...
10
Strain-induced seismic anisotropy of wadsleyite polycrystals and flow patterns in the mantle transition zone Andre ´a Tommasi, 1 David Mainprice, 1 Patrick Cordier, 2 Catherine Thoraval, 1 and He ´le `ne Couvy 2,3 Received 29 April 2004; revised 4 October 2004; accepted 8 October 2004; published 17 December 2004. [1] We use forward models based on recent high-pressure experimental data on mantle minerals to predict the seismic anisotropy produced by plastic strain of orthorhombic wadsleyite, the dominant mineral in the upper transition zone. These models predict a weak seismic anisotropy for a polycrystal of pyrolitic composition (60% wadsleyite, 40% garnet) at transition zone conditions: 2% for P and 1% for S waves for a shear strain of 1. Both P and S wave anisotropy patterns show an orthorhombic symmetry. P waves propagate faster at low angle to the shear direction and slower at high angle to the shear plane. S wave anisotropy is characterized by faster propagation of waves polarized at low angle to the shear direction. Horizontal shearing results therefore in higher velocities for horizontally propagating P waves (PH ) and horizontally polarized S waves (SH ), as well as in weak azimuthal variation of SV and SH velocities. On the other hand, vertical flow leads to higher velocities for vertically propagating P waves (PV ) and vertically polarized S waves (SV) and to a weak azimuthal variation of SV velocity but to a roughly constant SH velocity. Analysis of global observations of seismic anisotropy in the transition zone in the light of these models supports dominant horizontal flow in the uppermost transition zone, in agreement with predictions of geodynamical models that explicitly introduce phase transitions. INDEX TERMS: 3902 Mineral Physics: Creep and deformation; 8120 Tectonophysics: Dynamics of lithosphere and mantle—general; 8121 Tectonophysics: Dynamics, convection currents and mantle plumes; 7207 Seismology: Core and mantle; KEYWORDS: mantle convection, seismic anisotropy, crystal preferred orientation Citation: Tommasi, A., D. Mainprice, P. Cordier, C. Thoraval, and H. Couvy (2004), Strain-induced seismic anisotropy of wadsleyite polycrystals and flow patterns in the mantle transition zone, J. Geophys. Res., 109, B12405, doi:10.1029/2004JB003158. 1. Introduction [2] Convection patterns in the Earth’s mantle depend strongly on how physical properties are modified by the pressure-induced phase changes that take place in the transition zone, i.e., between 410 and 670 km depth. After a long debate on whether mantle convection was double- or single-layered, current models tend to favor a single-layer convection in which the transition zone behaves as a more or less permeable barrier. Indeed, geodynamical models show that, because of its negative Clapeyron slope [Akaogi et al., 1989], the ringwoodite to perovskite + magnesiowustite phase change at the base of the transition zone slows material transfer across the transition zone, leading to intermittently layered convection [Christensen and Yuen, 1985; Machetel and Weber, 1991]. This convection style, in between whole mantle and layered convection, may explain, for instance, that some slabs, like the Marianas and Java, plunge steeply across the transition zone, penetrating promptly into the lower mantle, whereas others, like the Japan, southern Kurile, and Izu-Bonin, are deflected within the transition zone [van der Hilst et al., 1991]. Partially (or locally) layered convection also reconciles dynamic topography predicted in mantle circulation models with observations [Thoraval et al., 1995; Cadek and Fleitout, 1999]. [3] Knowledge of flow patterns within the transition zone layer is thus essential to constrain the structure of mantle circulation. Seismic anisotropy observations are undoubtedly the best tool to image flow patterns in the deep Earth, since anisotropy, as in the upper mantle, may result from strain- induced crystal-preferred orientation (CPO) of elastically anisotropic minerals. Seismic anisotropy in the transition zone at a global scale was first suggested by a joint analysis of body wave travel times and free oscillation frequencies [Montagner and Kennett, 1996], which showed that these data may be reconciled by a weak radial anisotropy in the transition zone. This anisotropy is characterized by higher velocities of horizontally propagating compressional waves (PH) and horizontally polarized shear waves (SH ) relatively to vertically propagating compressional waves (PV ) and vertically polarized shear waves (SV ), respectively. Faster JOURNAL OF GEOPHYSICAL RESEARCH, VOL. 109, B12405, doi:10.1029/2004JB003158, 2004 1 Laboratoire de Tectonophysique, CNRS/Universite ´ de Montpellier II, Montpellier, France. 2 Laboratoire Structure et Proprie ´te ´s de l’Etat Solide, CNRS/Universite ´ de Lille, Villeneuve d’Ascq, France. 3 Bayerisches Geoinstitut, Universita ¨t Bayreuth, Bayreuth, Germany. Copyright 2004 by the American Geophysical Union. 0148-0227/04/2004JB003158$09.00 B12405 1 of 10 Correction published on 22 December 2005
Transcript of Strain-induced seismic anisotropy of wadsleyite ... · Strain-induced seismic anisotropy of...
Strain-induced seismic anisotropy of wadsleyite polycrystals
and flow patterns in the mantle transition zone
Andrea Tommasi,1 David Mainprice,1 Patrick Cordier,2 Catherine Thoraval,1
and Helene Couvy2,3
Received 29 April 2004; revised 4 October 2004; accepted 8 October 2004; published 17 December 2004.
[1] We use forward models based on recent high-pressure experimental data on mantleminerals to predict the seismic anisotropy produced by plastic strain of orthorhombicwadsleyite, the dominant mineral in the upper transition zone. These models predict aweak seismic anisotropy for a polycrystal of pyrolitic composition (60% wadsleyite, 40%garnet) at transition zone conditions: �2% for P and �1% for S waves for a shear strain of1. Both P and S wave anisotropy patterns show an orthorhombic symmetry. P wavespropagate faster at low angle to the shear direction and slower at high angle to the shearplane. S wave anisotropy is characterized by faster propagation of waves polarized at lowangle to the shear direction. Horizontal shearing results therefore in higher velocities forhorizontally propagating P waves (PH ) and horizontally polarized S waves (SH ), aswell as in weak azimuthal variation of SV and SH velocities. On the other hand, verticalflow leads to higher velocities for vertically propagating P waves (PV ) and verticallypolarized S waves (SV) and to a weak azimuthal variation of SV velocity but to a roughlyconstant SH velocity. Analysis of global observations of seismic anisotropy in thetransition zone in the light of these models supports dominant horizontal flow in theuppermost transition zone, in agreement with predictions of geodynamical models thatexplicitly introduce phase transitions. INDEX TERMS: 3902 Mineral Physics: Creep and
deformation; 8120 Tectonophysics: Dynamics of lithosphere and mantle—general; 8121 Tectonophysics:
Dynamics, convection currents and mantle plumes; 7207 Seismology: Core and mantle; KEYWORDS: mantle
convection, seismic anisotropy, crystal preferred orientation
Citation: Tommasi, A., D. Mainprice, P. Cordier, C. Thoraval, and H. Couvy (2004), Strain-induced seismic anisotropy of wadsleyite
polycrystals and flow patterns in the mantle transition zone, J. Geophys. Res., 109, B12405, doi:10.1029/2004JB003158.
1. Introduction
[2] Convection patterns in the Earth’s mantle dependstrongly on how physical properties are modified by thepressure-induced phase changes that take place in thetransition zone, i.e., between 410 and 670 km depth. Aftera long debate on whether mantle convection was double- orsingle-layered, current models tend to favor a single-layerconvection in which the transition zone behaves as a moreor less permeable barrier. Indeed, geodynamical modelsshow that, because of its negative Clapeyron slope[Akaogi et al., 1989], the ringwoodite to perovskite +magnesiowustite phase change at the base of the transitionzone slows material transfer across the transition zone,leading to intermittently layered convection [Christensenand Yuen, 1985;Machetel andWeber, 1991]. This convectionstyle, in between whole mantle and layered convection, may
explain, for instance, that some slabs, like the Marianas andJava, plunge steeply across the transition zone, penetratingpromptly into the lower mantle, whereas others, like theJapan, southern Kurile, and Izu-Bonin, are deflected withinthe transition zone [van der Hilst et al., 1991]. Partially(or locally) layered convection also reconciles dynamictopography predicted in mantle circulation models withobservations [Thoraval et al., 1995; Cadek and Fleitout,1999].[3] Knowledge of flow patterns within the transition zone
layer is thus essential to constrain the structure of mantlecirculation. Seismic anisotropy observations are undoubtedlythe best tool to image flow patterns in the deep Earth, sinceanisotropy, as in the upper mantle, may result from strain-induced crystal-preferred orientation (CPO) of elasticallyanisotropic minerals. Seismic anisotropy in the transitionzone at a global scale was first suggested by a joint analysisof body wave travel times and free oscillation frequencies[Montagner and Kennett, 1996], which showed that thesedata may be reconciled by a weak radial anisotropy in thetransition zone. This anisotropy is characterized by highervelocities of horizontally propagating compressional waves(PH) and horizontally polarized shear waves (SH ) relativelyto vertically propagating compressional waves (PV ) andvertically polarized shear waves (SV ), respectively. Faster
JOURNAL OF GEOPHYSICAL RESEARCH, VOL. 109, B12405, doi:10.1029/2004JB003158, 2004
1Laboratoire de Tectonophysique, CNRS/Universite de Montpellier II,Montpellier, France.
2Laboratoire Structure et Proprietes de l’Etat Solide, CNRS/Universitede Lille, Villeneuve d’Ascq, France.
3Bayerisches Geoinstitut, Universitat Bayreuth, Bayreuth, Germany.
Copyright 2004 by the American Geophysical Union.0148-0227/04/2004JB003158$09.00
B12405 1 of 10
Correction published on 22 December 2005
propagation of SH waves in the transition zone beneathoceans is also suggested by probability density functionsfor radial anisotropy obtained from Love and Rayleigh phasevelocity models [Beghein and Trampert, 2004]. In contrast,these data suggest that PVwaves tend to propagate faster thanPH beneath tectonically active regions. Additional evidencefor an anisotropic transition zone comes from global surfacewave dispersion measurements for Love wave overtones thatimply azimuthal anisotropy for both vertically and horizon-tally polarized shear waves in the transition zone, the formerdisplaying a higher anisotropy (up to 2%) than the latter[Trampert and van Heijst, 2002].[4] Anisotropy in the transition zone is also evidenced by
regional studies that analyze the polarization anisotropy ofshear waves turning within the transition zone beneathnorthern Australia and within the northern Tonga subduction[Tong et al., 1994; Chen and Brudzinski, 2003]. Both datasets show horizontally polarized shear waves (SH ) arriving2–3 s earlier than vertically polarized shear waves (SV ). Incontrast, comparison between SKS and local S splitting databeneath various North Pacific subduction zones shows thatvertically propagating shear waves generally do not detectseismic anisotropy in the transition zone, except for weakanisotropy in the 410–520 km depth range beneath the SouthKurils [Fouch and Fischer, 1996]. Finally, azimuthal anisot-ropy in the deep transition zone beneath Eurasia is alsosuggested by analysis of compressional to shear wave con-versions [Vinnik and Montagner, 1996].[5] Within the volumetrically important mineral phases in
the transition zone (wadsleyite, ringwoodite, and garnet),wadsleyite, which is the dominant mineral phase between410 and 520 km depth, displays the strongest intrinsicelastic anisotropy [Mainprice et al., 2000]. At transitionzone pressures, the wadsleyite crystal shows 11–13%propagation anisotropy for shear waves and compressionalwaves, respectively [Zha et al., 1997; Sinogeikin et al.,1998]. However, seismic anisotropy will only be observed ifdeformation in the transition zone leads to the developmentof coherent crystal preferred orientations of wadsleyite atthe length scales sampled by seismic waves, i.e., at leastseveral hundreds of kilometers for surface waves. More-over, crystal preferred orientations may result in a large-scale seismic anisotropy pattern that significantly differsfrom the single-crystal one. Finally, layered structures ororiented inclusions of materials with contrasting elasticproperties may also produce seismic anisotropy. Deductionof flow patterns from seismic anisotropy data is thereforenot straightforward.[6] For the upper mantle, forward modeling of develop-
ment of crystal preferred orientations and seismic anisotropyin response to a given flow process has provensuccessful in constraining the interpretation of seismologi-cal observations in terms of mantle deformation [Ribe,1989; Chastel et al., 1993; Blackman et al., 1996; Tommasi,1998; Tommasi et al., 1999; Kaminski and Ribe, 2002]. Thisapproach can now be used to unravel flow patterns in thedeep mantle. Recent technological developments allowdeformation experiments on mantle materials to be per-formed at transition zone temperature and pressure condi-tions [Bussod et al., 1993; Cordier and Rubie, 2001;Durham et al., 2002]. These experiments provide essentialinformation on flow mechanisms of the transition zone and
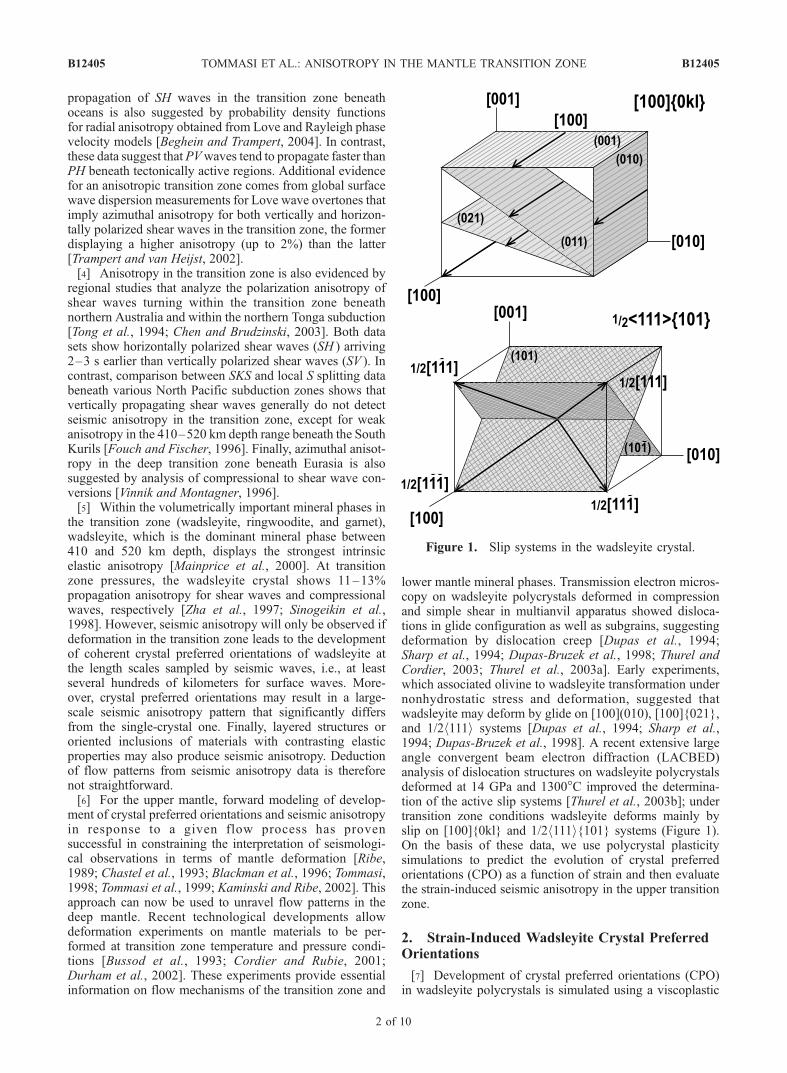
lower mantle mineral phases. Transmission electron micros-copy on wadsleyite polycrystals deformed in compressionand simple shear in multianvil apparatus showed disloca-tions in glide configuration as well as subgrains, suggestingdeformation by dislocation creep [Dupas et al., 1994;Sharp et al., 1994; Dupas-Bruzek et al., 1998; Thurel andCordier, 2003; Thurel et al., 2003a]. Early experiments,which associated olivine to wadsleyite transformation undernonhydrostatic stress and deformation, suggested thatwadsleyite may deform by glide on [100](010), [100]{021},and 1/2h111i systems [Dupas et al., 1994; Sharp et al.,1994; Dupas-Bruzek et al., 1998]. A recent extensive largeangle convergent beam electron diffraction (LACBED)analysis of dislocation structures on wadsleyite polycrystalsdeformed at 14 GPa and 1300�C improved the determina-tion of the active slip systems [Thurel et al., 2003b]; undertransition zone conditions wadsleyite deforms mainly byslip on [100]{0kl} and 1/2h111i{101} systems (Figure 1).On the basis of these data, we use polycrystal plasticitysimulations to predict the evolution of crystal preferredorientations (CPO) as a function of strain and then evaluatethe strain-induced seismic anisotropy in the upper transitionzone.
2. Strain-Induced Wadsleyite Crystal PreferredOrientations
[7] Development of crystal preferred orientations (CPO)in wadsleyite polycrystals is simulated using a viscoplastic
Figure 1. Slip systems in the wadsleyite crystal.
B12405 TOMMASI ET AL.: ANISOTROPY IN THE MANTLE TRANSITION ZONE
2 of 10
B12405
self-consistent (VPSC) model [Lebensohn and Tome, 1993].In this model, as in all polycrystal plasticity approaches,CPO evolution is essentially controlled by the imposeddeformation, the initial texture (crystal preferred and, to alesser extent, shape preferred orientation), and the activeslip systems. The latter depend on the mineral structure, butalso on the temperature and pressure conditions, whichcontrol their relative strength or critical resolved shear stress(CRSS). Extensive testing on metallic alloys [Lebensohnand Tome, 1993; Loge et al., 2000], halite [Lebensohn et al.,2003], as well as on highly anisotropic minerals, such ascalcite [Tome et al., 1991], olivine [Wenk et al., 1991;Tommasi et al., 2000], and clinopyroxene [Bascou etal., 2002], shows that this model produces robust CPOpredictions.[8] In contrast to classical lower or upper bound
approaches, which impose respectively homogeneous stress[Sachs, 1928] or strain [Taylor, 1938] within the aggregate,the VPSC approach allows both the microscopic stress andstrain rate to differ from the corresponding macroscopicquantities. Strain compatibility and stress equilibrium areensured only at the aggregate scale. At the grain scale,deformation is homogeneous. It is accommodated by dis-location glide only. The shear rate in a slip system s is relatedto the local deviatoric stress tensor s by a viscoplastic law:
_gs ¼ _g0tsrts0
� �¼ _g0
rsijsij
ts0
� �ns
; ð1Þ
where _g0 is a reference strain rate, taken as 1 s�1, and ns, trs,
and t0s are respectively the stress exponent, the resolved
shear stress, and the CRSS for the system s, whoseorientation relative to the macroscopic axis is expressedby its Schmid tensor rs.[9] The problem lies in the calculation of a microscopic
state (s, _e) for each grain, whose volume average determinesthe response of the polycrystal (�S, �D). The ‘‘one-site’’approximation [Molinari et al., 1987; Lebensohn and Tome,1993] is used in the anisotropic VPSC formulation; inter-actions between neighboring grains are hence not taken intoaccount. Interactions between each grain and its surround-ings are replaced by the interaction between an inclusionwith the same lattice orientation and an infinite homoge-neous equivalent medium (HEM), whose behavior is thevolume weighted average of the grain’s behavior. This leadsto:
_eij � Dij ¼ �aMijkl Skl � Sklð Þ; ð2Þ
where ~M is the interaction tensor and a is a constant used toparameterize the interaction between grains and the HEM;a = 0 corresponds to the upper bound model (homogeneousstrain), a = 1 is the classical self-consistent model, used inthe present simulations (linear relationship between volumeaveraged stress and strain rate), and a = infinity correspondsto the lower bound model (stress equilibrium).[10] In the present study, we investigate the evolution of
wadsleyite CPO for an end-member deformation regime:simple shear. Actual flow in the transition zone is mostlikely three-dimensional, but regions submitted to largedeformations probably display a strong shear component,
whose orientation (horizontal or steeply dipping) willdepend on the large-scale convection pattern. We alsoperformed simulations in transpression (transtension), inwhich we add a weak compression (extension) normal tothe shear plane, in axial compression, and in axial extensionto evaluate the effect of a three-dimensional deformation onthe CPO evolution and on the resulting seismic anisotropy.The strain history is imposed by prescribing a constantmacroscopic velocity gradient tensor L, which for simpleshear is
L ¼
0 1 0
0 0 0
0 0 0
66666664
77777775; ð3Þ
and a time increment, dt, set to achieve an equivalent strainof 0.025 in each deformation step. The equivalent strain isdefined as
eeq ¼Z
Deq tð Þdt; ð4Þ
where the Von Mises equivalent strain rate is:
Deq ¼ffiffiffiffiffiffiffiffiffiffiffiffiffiffiffiffi2=3DijDij
q: ð5Þ
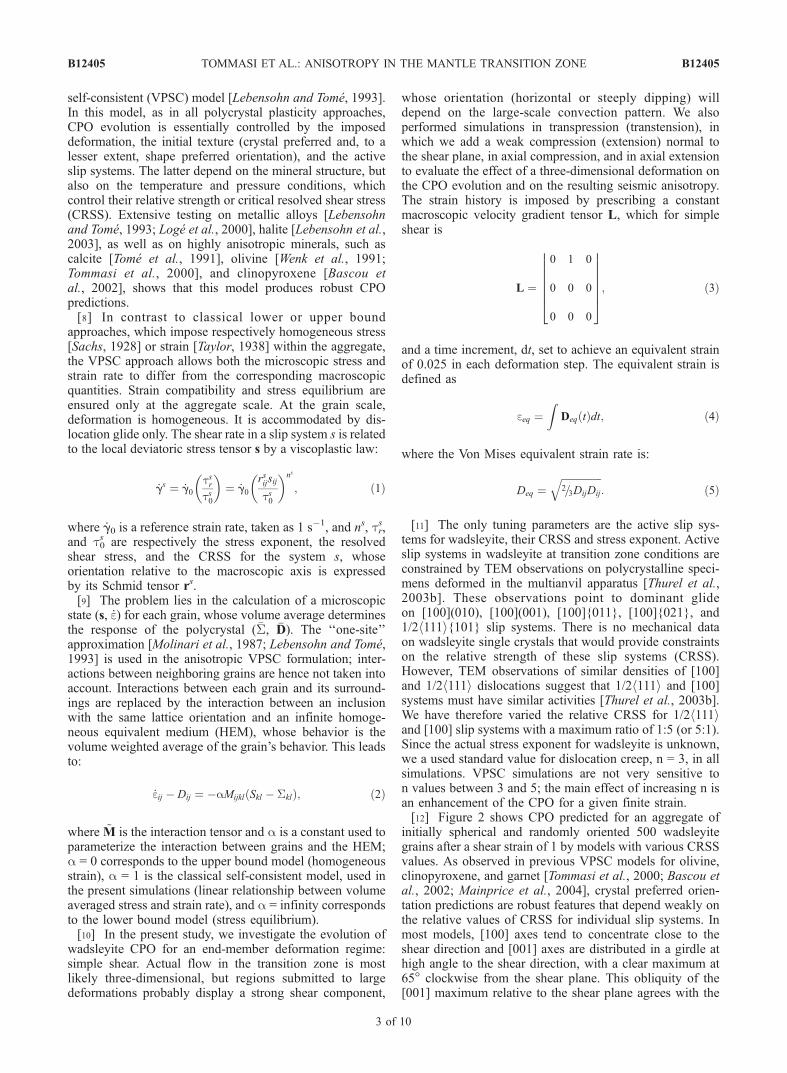
[11] The only tuning parameters are the active slip sys-tems for wadsleyite, their CRSS and stress exponent. Activeslip systems in wadsleyite at transition zone conditions areconstrained by TEM observations on polycrystalline speci-mens deformed in the multianvil apparatus [Thurel et al.,2003b]. These observations point to dominant glideon [100](010), [100](001), [100]{011}, [100]{021}, and1/2h111i{101} slip systems. There is no mechanical dataon wadsleyite single crystals that would provide constraintson the relative strength of these slip systems (CRSS).However, TEM observations of similar densities of [100]and 1/2h111i dislocations suggest that 1/2h111i and [100]systems must have similar activities [Thurel et al., 2003b].We have therefore varied the relative CRSS for 1/2h111iand [100] slip systems with a maximum ratio of 1:5 (or 5:1).Since the actual stress exponent for wadsleyite is unknown,we a used standard value for dislocation creep, n = 3, in allsimulations. VPSC simulations are not very sensitive ton values between 3 and 5; the main effect of increasing n isan enhancement of the CPO for a given finite strain.[12] Figure 2 shows CPO predicted for an aggregate of
initially spherical and randomly oriented 500 wadsleyitegrains after a shear strain of 1 by models with various CRSSvalues. As observed in previous VPSC models for olivine,clinopyroxene, and garnet [Tommasi et al., 2000; Bascou etal., 2002; Mainprice et al., 2004], crystal preferred orien-tation predictions are robust features that depend weakly onthe relative values of CRSS for individual slip systems. Inmost models, [100] axes tend to concentrate close to theshear direction and [001] axes are distributed in a girdle athigh angle to the shear direction, with a clear maximum at65� clockwise from the shear plane. This obliquity of the[001] maximum relative to the shear plane agrees with the
B12405 TOMMASI ET AL.: ANISOTROPY IN THE MANTLE TRANSITION ZONE
3 of 10
B12405
imposed dextral shear. A different pattern is only observedin model 4 that shows [100] aligned normal to the foliation(flattening plane) and [010] parallel to the lineation (mainstretching direction). However, 95% of strain in thismodel is accommodated by glide on 1/2h111i{101} systems(Figure 3), in disagreement with frequent observations of[100] dislocations in experimentally deformed wadsleyitecrystals [Dupas et al., 1994; Sharp et al., 1994; Dupas-Bruzek et al., 1998; Thurel et al., 2003b].[13] In models 1 to 3, the [010] axes distribution is
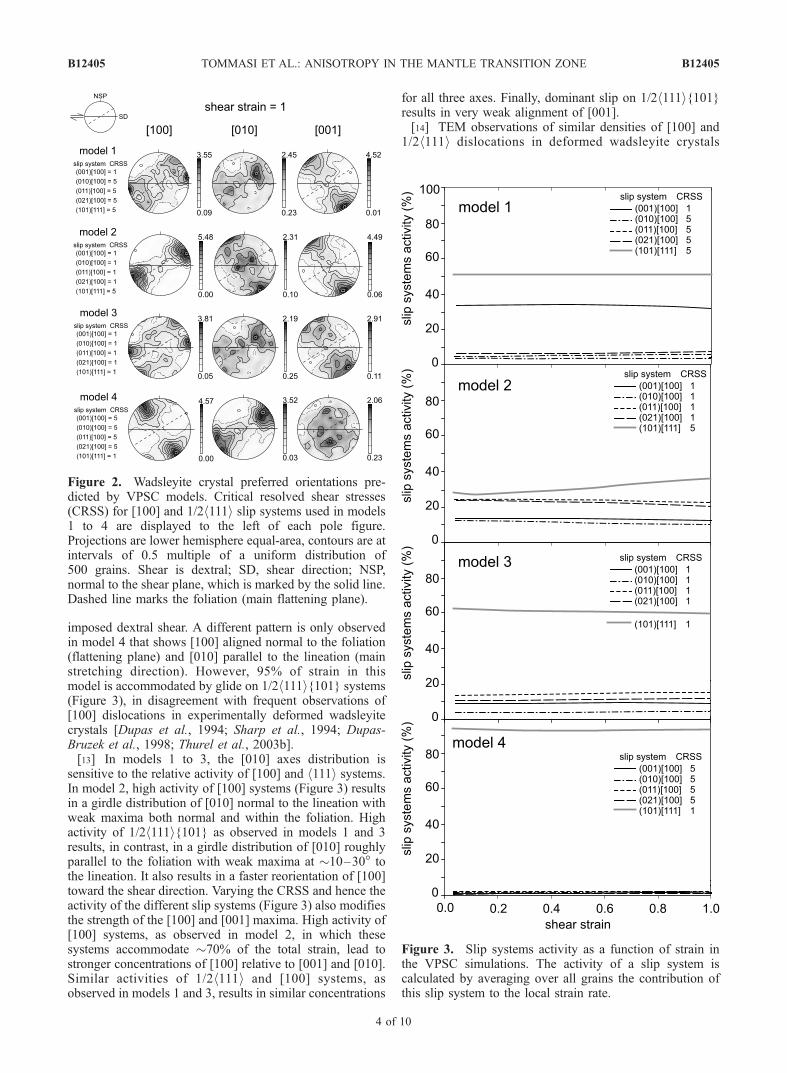
sensitive to the relative activity of [100] and h111i systems.In model 2, high activity of [100] systems (Figure 3) resultsin a girdle distribution of [010] normal to the lineation withweak maxima both normal and within the foliation. Highactivity of 1/2h111i{101} as observed in models 1 and 3results, in contrast, in a girdle distribution of [010] roughlyparallel to the foliation with weak maxima at �10–30� tothe lineation. It also results in a faster reorientation of [100]toward the shear direction. Varying the CRSS and hence theactivity of the different slip systems (Figure 3) also modifiesthe strength of the [100] and [001] maxima. High activity of[100] systems, as observed in model 2, in which thesesystems accommodate �70% of the total strain, lead tostronger concentrations of [100] relative to [001] and [010].Similar activities of 1/2h111i and [100] systems, asobserved in models 1 and 3, results in similar concentrations
for all three axes. Finally, dominant slip on 1/2h111i{101}results in very weak alignment of [001].[14] TEM observations of similar densities of [100] and
1/2h111i dislocations in deformed wadsleyite crystals
Figure 2. Wadsleyite crystal preferred orientations pre-dicted by VPSC models. Critical resolved shear stresses(CRSS) for [100] and 1/2h111i slip systems used in models1 to 4 are displayed to the left of each pole figure.Projections are lower hemisphere equal-area, contours are atintervals of 0.5 multiple of a uniform distribution of500 grains. Shear is dextral; SD, shear direction; NSP,normal to the shear plane, which is marked by the solid line.Dashed line marks the foliation (main flattening plane).
Figure 3. Slip systems activity as a function of strain inthe VPSC simulations. The activity of a slip system iscalculated by averaging over all grains the contribution ofthis slip system to the local strain rate.
B12405 TOMMASI ET AL.: ANISOTROPY IN THE MANTLE TRANSITION ZONE
4 of 10
B12405
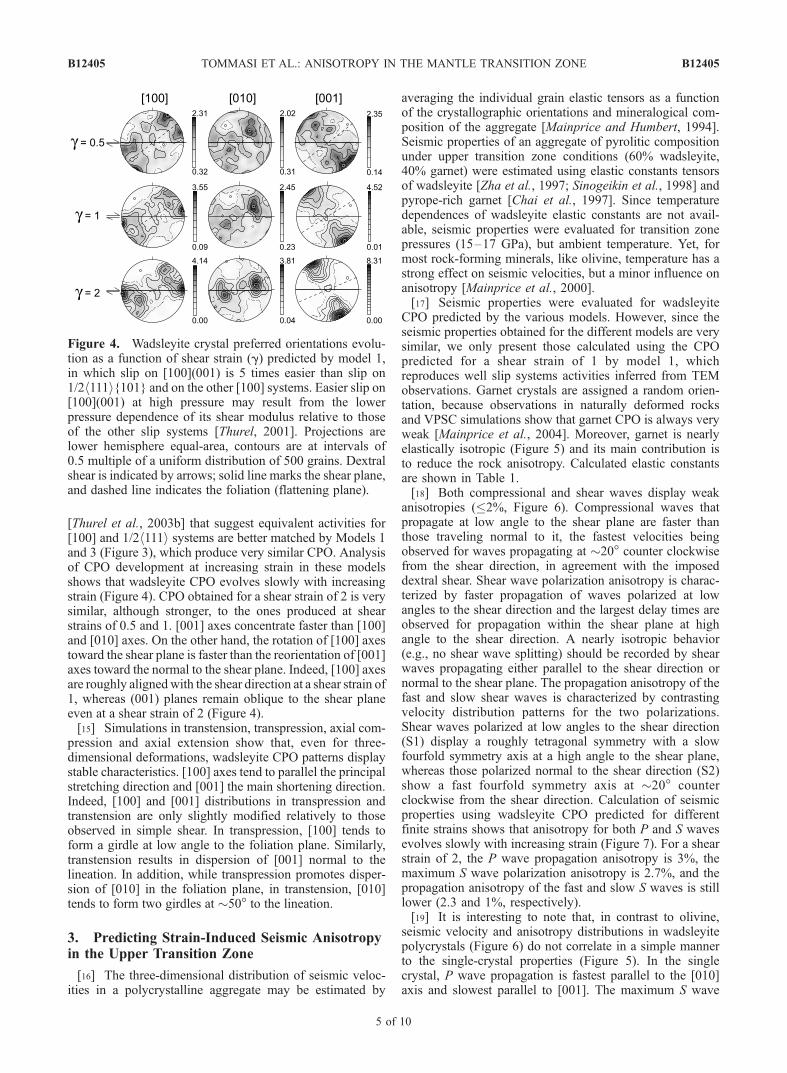
[Thurel et al., 2003b] that suggest equivalent activities for[100] and 1/2h111i systems are better matched by Models 1and 3 (Figure 3), which produce very similar CPO. Analysisof CPO development at increasing strain in these modelsshows that wadsleyite CPO evolves slowly with increasingstrain (Figure 4). CPO obtained for a shear strain of 2 is verysimilar, although stronger, to the ones produced at shearstrains of 0.5 and 1. [001] axes concentrate faster than [100]and [010] axes. On the other hand, the rotation of [100] axestoward the shear plane is faster than the reorientation of [001]axes toward the normal to the shear plane. Indeed, [100] axesare roughly alignedwith the shear direction at a shear strain of1, whereas (001) planes remain oblique to the shear planeeven at a shear strain of 2 (Figure 4).[15] Simulations in transtension, transpression, axial com-
pression and axial extension show that, even for three-dimensional deformations, wadsleyite CPO patterns displaystable characteristics. [100] axes tend to parallel the principalstretching direction and [001] the main shortening direction.Indeed, [100] and [001] distributions in transpression andtranstension are only slightly modified relatively to thoseobserved in simple shear. In transpression, [100] tends toform a girdle at low angle to the foliation plane. Similarly,transtension results in dispersion of [001] normal to thelineation. In addition, while transpression promotes disper-sion of [010] in the foliation plane, in transtension, [010]tends to form two girdles at �50� to the lineation.
3. Predicting Strain-Induced Seismic Anisotropyin the Upper Transition Zone
[16] The three-dimensional distribution of seismic veloc-ities in a polycrystalline aggregate may be estimated by
averaging the individual grain elastic tensors as a functionof the crystallographic orientations and mineralogical com-position of the aggregate [Mainprice and Humbert, 1994].Seismic properties of an aggregate of pyrolitic compositionunder upper transition zone conditions (60% wadsleyite,40% garnet) were estimated using elastic constants tensorsof wadsleyite [Zha et al., 1997; Sinogeikin et al., 1998] andpyrope-rich garnet [Chai et al., 1997]. Since temperaturedependences of wadsleyite elastic constants are not avail-able, seismic properties were evaluated for transition zonepressures (15–17 GPa), but ambient temperature. Yet, formost rock-forming minerals, like olivine, temperature has astrong effect on seismic velocities, but a minor influence onanisotropy [Mainprice et al., 2000].[17] Seismic properties were evaluated for wadsleyite
CPO predicted by the various models. However, since theseismic properties obtained for the different models are verysimilar, we only present those calculated using the CPOpredicted for a shear strain of 1 by model 1, whichreproduces well slip systems activities inferred from TEMobservations. Garnet crystals are assigned a random orien-tation, because observations in naturally deformed rocksand VPSC simulations show that garnet CPO is always veryweak [Mainprice et al., 2004]. Moreover, garnet is nearlyelastically isotropic (Figure 5) and its main contribution isto reduce the rock anisotropy. Calculated elastic constantsare shown in Table 1.[18] Both compressional and shear waves display weak
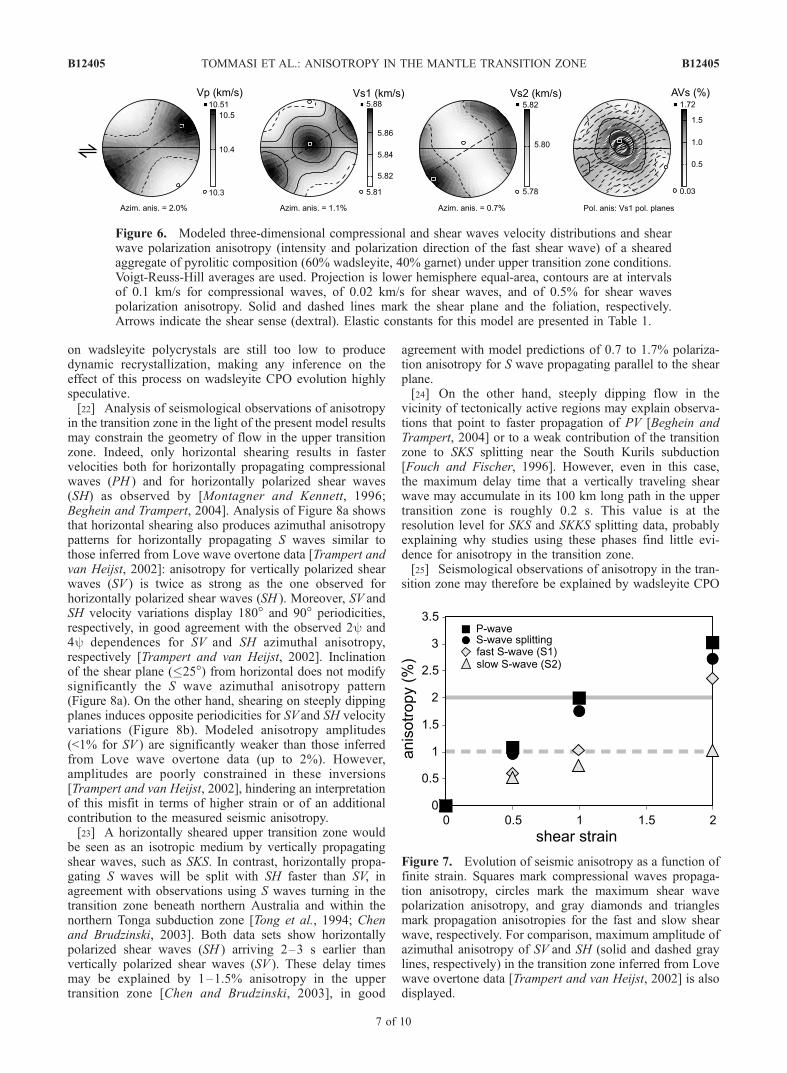
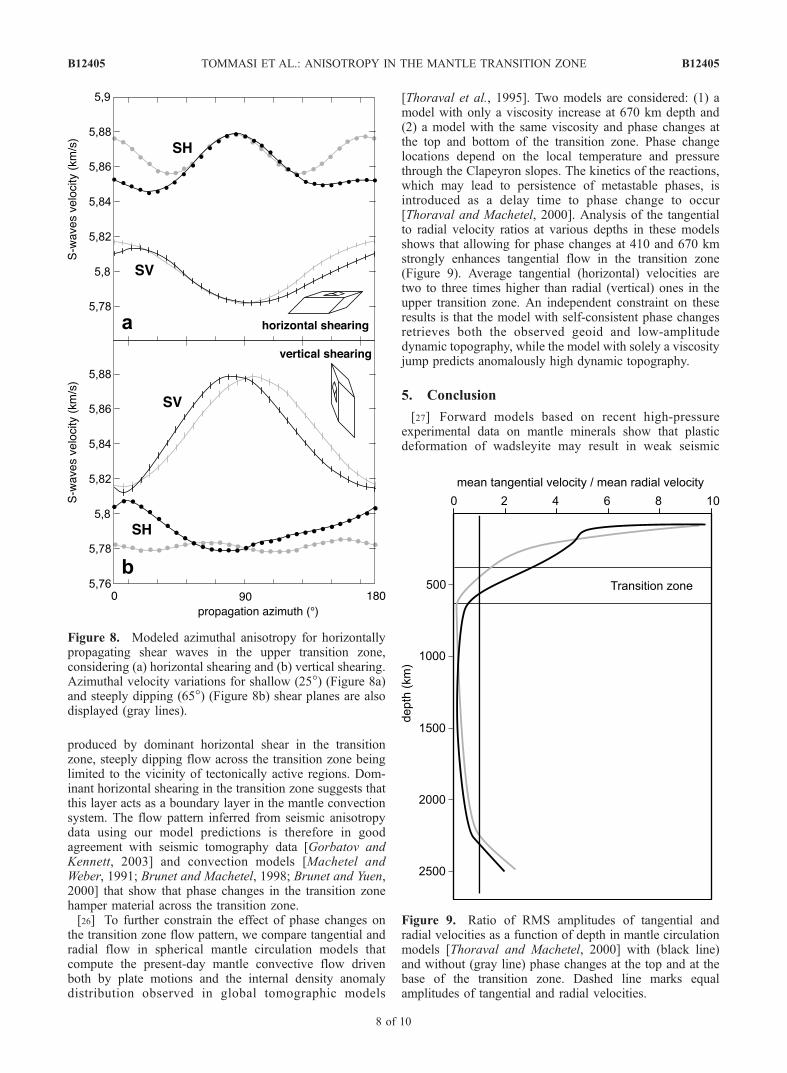
anisotropies (�2%, Figure 6). Compressional waves thatpropagate at low angle to the shear plane are faster thanthose traveling normal to it, the fastest velocities beingobserved for waves propagating at �20� counter clockwisefrom the shear direction, in agreement with the imposeddextral shear. Shear wave polarization anisotropy is charac-terized by faster propagation of waves polarized at lowangles to the shear direction and the largest delay times areobserved for propagation within the shear plane at highangle to the shear direction. A nearly isotropic behavior(e.g., no shear wave splitting) should be recorded by shearwaves propagating either parallel to the shear direction ornormal to the shear plane. The propagation anisotropy of thefast and slow shear waves is characterized by contrastingvelocity distribution patterns for the two polarizations.Shear waves polarized at low angles to the shear direction(S1) display a roughly tetragonal symmetry with a slowfourfold symmetry axis at a high angle to the shear plane,whereas those polarized normal to the shear direction (S2)show a fast fourfold symmetry axis at �20� counterclockwise from the shear direction. Calculation of seismicproperties using wadsleyite CPO predicted for differentfinite strains shows that anisotropy for both P and S wavesevolves slowly with increasing strain (Figure 7). For a shearstrain of 2, the P wave propagation anisotropy is 3%, themaximum S wave polarization anisotropy is 2.7%, and thepropagation anisotropy of the fast and slow S waves is stilllower (2.3 and 1%, respectively).[19] It is interesting to note that, in contrast to olivine,
seismic velocity and anisotropy distributions in wadsleyitepolycrystals (Figure 6) do not correlate in a simple mannerto the single-crystal properties (Figure 5). In the singlecrystal, P wave propagation is fastest parallel to the [010]axis and slowest parallel to [001]. The maximum S wave
Figure 4. Wadsleyite crystal preferred orientations evolu-tion as a function of shear strain (g) predicted by model 1,in which slip on [100](001) is 5 times easier than slip on1/2h111i{101} and on the other [100] systems. Easier slip on[100](001) at high pressure may result from the lowerpressure dependence of its shear modulus relative to thoseof the other slip systems [Thurel, 2001]. Projections arelower hemisphere equal-area, contours are at intervals of0.5 multiple of a uniform distribution of 500 grains. Dextralshear is indicated by arrows; solid line marks the shear plane,and dashed line indicates the foliation (flattening plane).
B12405 TOMMASI ET AL.: ANISOTROPY IN THE MANTLE TRANSITION ZONE
5 of 10
B12405
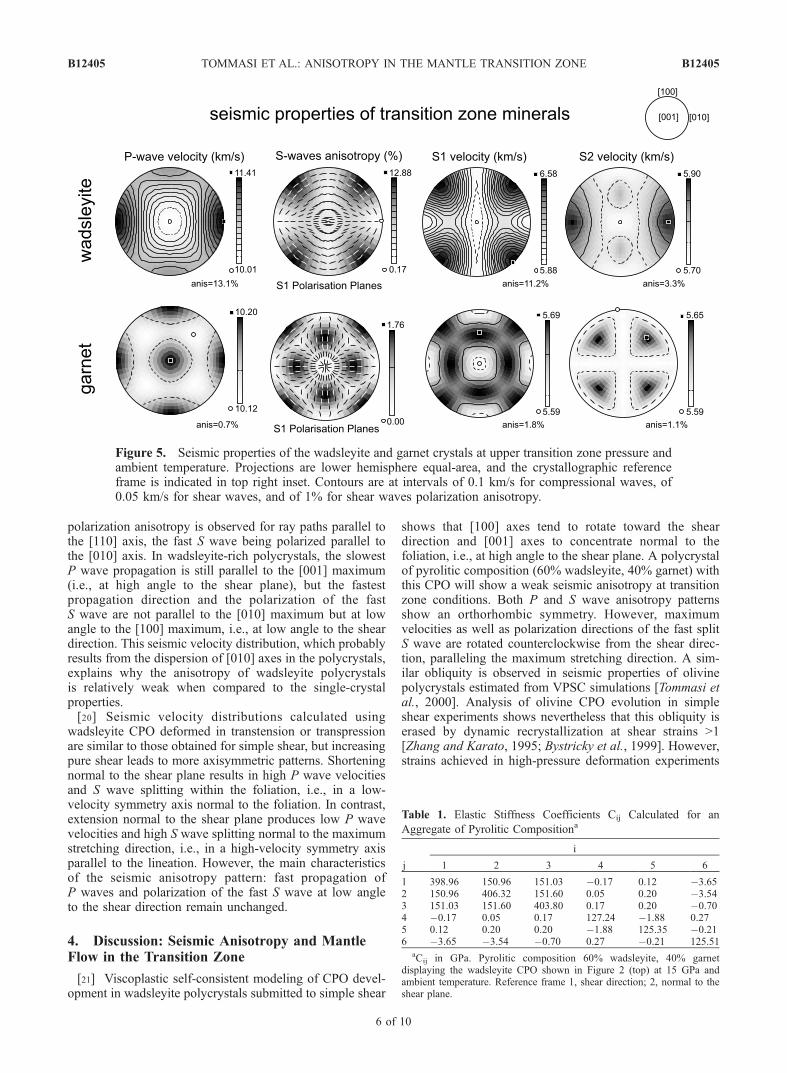
polarization anisotropy is observed for ray paths parallel tothe [110] axis, the fast S wave being polarized parallel tothe [010] axis. In wadsleyite-rich polycrystals, the slowestP wave propagation is still parallel to the [001] maximum(i.e., at high angle to the shear plane), but the fastestpropagation direction and the polarization of the fastS wave are not parallel to the [010] maximum but at lowangle to the [100] maximum, i.e., at low angle to the sheardirection. This seismic velocity distribution, which probablyresults from the dispersion of [010] axes in the polycrystals,explains why the anisotropy of wadsleyite polycrystalsis relatively weak when compared to the single-crystalproperties.[20] Seismic velocity distributions calculated using
wadsleyite CPO deformed in transtension or transpressionare similar to those obtained for simple shear, but increasingpure shear leads to more axisymmetric patterns. Shorteningnormal to the shear plane results in high P wave velocitiesand S wave splitting within the foliation, i.e., in a low-velocity symmetry axis normal to the foliation. In contrast,extension normal to the shear plane produces low P wavevelocities and high S wave splitting normal to the maximumstretching direction, i.e., in a high-velocity symmetry axisparallel to the lineation. However, the main characteristicsof the seismic anisotropy pattern: fast propagation ofP waves and polarization of the fast S wave at low angleto the shear direction remain unchanged.
4. Discussion: Seismic Anisotropy and MantleFlow in the Transition Zone
[21] Viscoplastic self-consistent modeling of CPO devel-opment in wadsleyite polycrystals submitted to simple shear
shows that [100] axes tend to rotate toward the sheardirection and [001] axes to concentrate normal to thefoliation, i.e., at high angle to the shear plane. A polycrystalof pyrolitic composition (60% wadsleyite, 40% garnet) withthis CPO will show a weak seismic anisotropy at transitionzone conditions. Both P and S wave anisotropy patternsshow an orthorhombic symmetry. However, maximumvelocities as well as polarization directions of the fast splitS wave are rotated counterclockwise from the shear direc-tion, paralleling the maximum stretching direction. A sim-ilar obliquity is observed in seismic properties of olivinepolycrystals estimated from VPSC simulations [Tommasi etal., 2000]. Analysis of olivine CPO evolution in simpleshear experiments shows nevertheless that this obliquity iserased by dynamic recrystallization at shear strains >1[Zhang and Karato, 1995; Bystricky et al., 1999]. However,strains achieved in high-pressure deformation experiments
Figure 5. Seismic properties of the wadsleyite and garnet crystals at upper transition zone pressure andambient temperature. Projections are lower hemisphere equal-area, and the crystallographic referenceframe is indicated in top right inset. Contours are at intervals of 0.1 km/s for compressional waves, of0.05 km/s for shear waves, and of 1% for shear waves polarization anisotropy.
Table 1. Elastic Stiffness Coefficients Cij Calculated for an
Aggregate of Pyrolitic Compositiona
j
i
1 2 3 4 5 6
1 398.96 150.96 151.03 �0.17 0.12 �3.652 150.96 406.32 151.60 0.05 0.20 �3.543 151.03 151.60 403.80 0.17 0.20 �0.704 �0.17 0.05 0.17 127.24 �1.88 0.275 0.12 0.20 0.20 �1.88 125.35 �0.216 �3.65 �3.54 �0.70 0.27 �0.21 125.51
aCij in GPa. Pyrolitic composition 60% wadsleyite, 40% garnetdisplaying the wadsleyite CPO shown in Figure 2 (top) at 15 GPa andambient temperature. Reference frame 1, shear direction; 2, normal to theshear plane.
B12405 TOMMASI ET AL.: ANISOTROPY IN THE MANTLE TRANSITION ZONE
6 of 10
B12405
on wadsleyite polycrystals are still too low to producedynamic recrystallization, making any inference on theeffect of this process on wadsleyite CPO evolution highlyspeculative.[22] Analysis of seismological observations of anisotropy
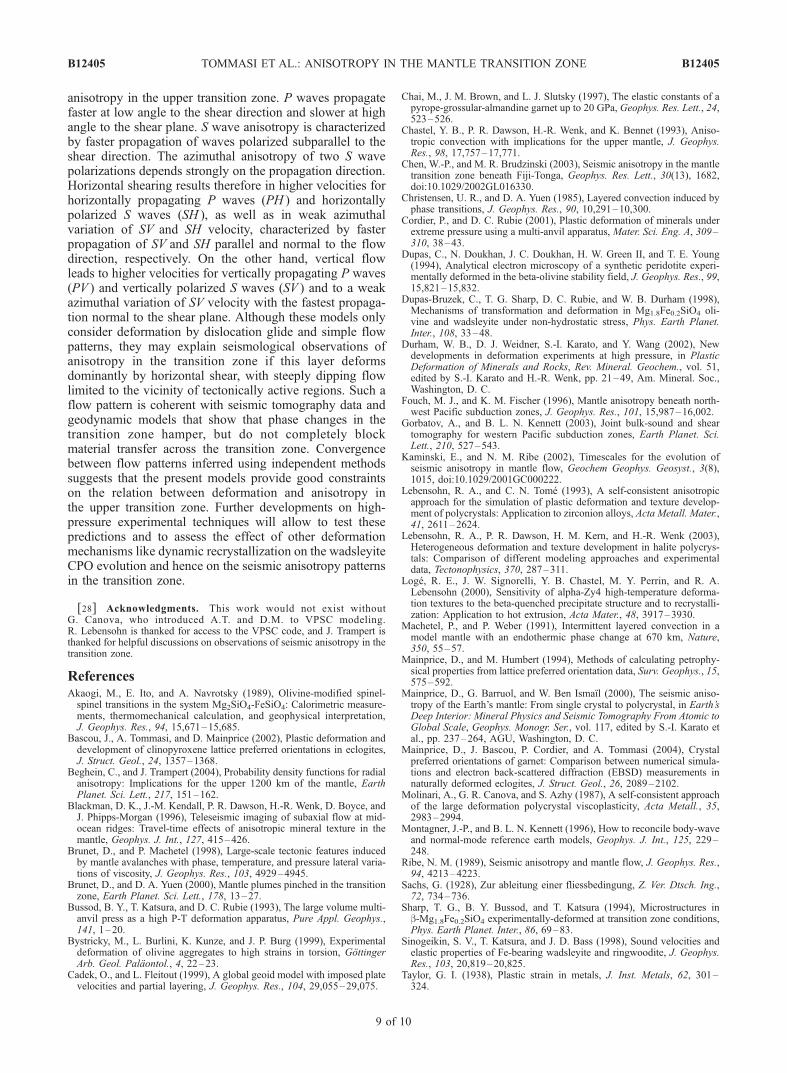
in the transition zone in the light of the present model resultsmay constrain the geometry of flow in the upper transitionzone. Indeed, only horizontal shearing results in fastervelocities both for horizontally propagating compressionalwaves (PH ) and for horizontally polarized shear waves(SH) as observed by [Montagner and Kennett, 1996;Beghein and Trampert, 2004]. Analysis of Figure 8a showsthat horizontal shearing also produces azimuthal anisotropypatterns for horizontally propagating S waves similar tothose inferred from Love wave overtone data [Trampert andvan Heijst, 2002]: anisotropy for vertically polarized shearwaves (SV ) is twice as strong as the one observed forhorizontally polarized shear waves (SH ). Moreover, SV andSH velocity variations display 180� and 90� periodicities,respectively, in good agreement with the observed 2y and4y dependences for SV and SH azimuthal anisotropy,respectively [Trampert and van Heijst, 2002]. Inclinationof the shear plane (�25�) from horizontal does not modifysignificantly the S wave azimuthal anisotropy pattern(Figure 8a). On the other hand, shearing on steeply dippingplanes induces opposite periodicities for SV and SH velocityvariations (Figure 8b). Modeled anisotropy amplitudes(<1% for SV ) are significantly weaker than those inferredfrom Love wave overtone data (up to 2%). However,amplitudes are poorly constrained in these inversions[Trampert and van Heijst, 2002], hindering an interpretationof this misfit in terms of higher strain or of an additionalcontribution to the measured seismic anisotropy.[23] A horizontally sheared upper transition zone would
be seen as an isotropic medium by vertically propagatingshear waves, such as SKS. In contrast, horizontally propa-gating S waves will be split with SH faster than SV, inagreement with observations using S waves turning in thetransition zone beneath northern Australia and within thenorthern Tonga subduction zone [Tong et al., 1994; Chenand Brudzinski, 2003]. Both data sets show horizontallypolarized shear waves (SH ) arriving 2–3 s earlier thanvertically polarized shear waves (SV ). These delay timesmay be explained by 1–1.5% anisotropy in the uppertransition zone [Chen and Brudzinski, 2003], in good
agreement with model predictions of 0.7 to 1.7% polariza-tion anisotropy for S wave propagating parallel to the shearplane.[24] On the other hand, steeply dipping flow in the
vicinity of tectonically active regions may explain observa-tions that point to faster propagation of PV [Beghein andTrampert, 2004] or to a weak contribution of the transitionzone to SKS splitting near the South Kurils subduction[Fouch and Fischer, 1996]. However, even in this case,the maximum delay time that a vertically traveling shearwave may accumulate in its 100 km long path in the uppertransition zone is roughly 0.2 s. This value is at theresolution level for SKS and SKKS splitting data, probablyexplaining why studies using these phases find little evi-dence for anisotropy in the transition zone.[25] Seismological observations of anisotropy in the tran-
sition zone may therefore be explained by wadsleyite CPO
Figure 6. Modeled three-dimensional compressional and shear waves velocity distributions and shearwave polarization anisotropy (intensity and polarization direction of the fast shear wave) of a shearedaggregate of pyrolitic composition (60% wadsleyite, 40% garnet) under upper transition zone conditions.Voigt-Reuss-Hill averages are used. Projection is lower hemisphere equal-area, contours are at intervalsof 0.1 km/s for compressional waves, of 0.02 km/s for shear waves, and of 0.5% for shear wavespolarization anisotropy. Solid and dashed lines mark the shear plane and the foliation, respectively.Arrows indicate the shear sense (dextral). Elastic constants for this model are presented in Table 1.
Figure 7. Evolution of seismic anisotropy as a function offinite strain. Squares mark compressional waves propaga-tion anisotropy, circles mark the maximum shear wavepolarization anisotropy, and gray diamonds and trianglesmark propagation anisotropies for the fast and slow shearwave, respectively. For comparison, maximum amplitude ofazimuthal anisotropy of SV and SH (solid and dashed graylines, respectively) in the transition zone inferred from Lovewave overtone data [Trampert and van Heijst, 2002] is alsodisplayed.
B12405 TOMMASI ET AL.: ANISOTROPY IN THE MANTLE TRANSITION ZONE
7 of 10
B12405
produced by dominant horizontal shear in the transitionzone, steeply dipping flow across the transition zone beinglimited to the vicinity of tectonically active regions. Dom-inant horizontal shearing in the transition zone suggests thatthis layer acts as a boundary layer in the mantle convectionsystem. The flow pattern inferred from seismic anisotropydata using our model predictions is therefore in goodagreement with seismic tomography data [Gorbatov andKennett, 2003] and convection models [Machetel andWeber, 1991; Brunet and Machetel, 1998; Brunet and Yuen,2000] that show that phase changes in the transition zonehamper material across the transition zone.[26] To further constrain the effect of phase changes on
the transition zone flow pattern, we compare tangential andradial flow in spherical mantle circulation models thatcompute the present-day mantle convective flow drivenboth by plate motions and the internal density anomalydistribution observed in global tomographic models
[Thoraval et al., 1995]. Two models are considered: (1) amodel with only a viscosity increase at 670 km depth and(2) a model with the same viscosity and phase changes atthe top and bottom of the transition zone. Phase changelocations depend on the local temperature and pressurethrough the Clapeyron slopes. The kinetics of the reactions,which may lead to persistence of metastable phases, isintroduced as a delay time to phase change to occur[Thoraval and Machetel, 2000]. Analysis of the tangentialto radial velocity ratios at various depths in these modelsshows that allowing for phase changes at 410 and 670 kmstrongly enhances tangential flow in the transition zone(Figure 9). Average tangential (horizontal) velocities aretwo to three times higher than radial (vertical) ones in theupper transition zone. An independent constraint on theseresults is that the model with self-consistent phase changesretrieves both the observed geoid and low-amplitudedynamic topography, while the model with solely a viscosityjump predicts anomalously high dynamic topography.
5. Conclusion
[27] Forward models based on recent high-pressureexperimental data on mantle minerals show that plasticdeformation of wadsleyite may result in weak seismic
Figure 8. Modeled azimuthal anisotropy for horizontallypropagating shear waves in the upper transition zone,considering (a) horizontal shearing and (b) vertical shearing.Azimuthal velocity variations for shallow (25�) (Figure 8a)and steeply dipping (65�) (Figure 8b) shear planes are alsodisplayed (gray lines).
Figure 9. Ratio of RMS amplitudes of tangential andradial velocities as a function of depth in mantle circulationmodels [Thoraval and Machetel, 2000] with (black line)and without (gray line) phase changes at the top and at thebase of the transition zone. Dashed line marks equalamplitudes of tangential and radial velocities.
B12405 TOMMASI ET AL.: ANISOTROPY IN THE MANTLE TRANSITION ZONE
8 of 10
B12405
anisotropy in the upper transition zone. P waves propagatefaster at low angle to the shear direction and slower at highangle to the shear plane. S wave anisotropy is characterizedby faster propagation of waves polarized subparallel to theshear direction. The azimuthal anisotropy of two S wavepolarizations depends strongly on the propagation direction.Horizontal shearing results therefore in higher velocities forhorizontally propagating P waves (PH ) and horizontallypolarized S waves (SH ), as well as in weak azimuthalvariation of SV and SH velocity, characterized by fasterpropagation of SV and SH parallel and normal to the flowdirection, respectively. On the other hand, vertical flowleads to higher velocities for vertically propagating P waves(PV ) and vertically polarized S waves (SV ) and to a weakazimuthal variation of SV velocity with the fastest propaga-tion normal to the shear plane. Although these models onlyconsider deformation by dislocation glide and simple flowpatterns, they may explain seismological observations ofanisotropy in the transition zone if this layer deformsdominantly by horizontal shear, with steeply dipping flowlimited to the vicinity of tectonically active regions. Such aflow pattern is coherent with seismic tomography data andgeodynamic models that show that phase changes in thetransition zone hamper, but do not completely blockmaterial transfer across the transition zone. Convergencebetween flow patterns inferred using independent methodssuggests that the present models provide good constraintson the relation between deformation and anisotropy inthe upper transition zone. Further developments on high-pressure experimental techniques will allow to test thesepredictions and to assess the effect of other deformationmechanisms like dynamic recrystallization on the wadsleyiteCPO evolution and hence on the seismic anisotropy patternsin the transition zone.
[28] Acknowledgments. This work would not exist withoutG. Canova, who introduced A.T. and D.M. to VPSC modeling.R. Lebensohn is thanked for access to the VPSC code, and J. Trampert isthanked for helpful discussions on observations of seismic anisotropy in thetransition zone.
ReferencesAkaogi, M., E. Ito, and A. Navrotsky (1989), Olivine-modified spinel-spinel transitions in the system Mg2SiO4-FeSiO4: Calorimetric measure-ments, thermomechanical calculation, and geophysical interpretation,J. Geophys. Res., 94, 15,671–15,685.
Bascou, J., A. Tommasi, and D. Mainprice (2002), Plastic deformation anddevelopment of clinopyroxene lattice preferred orientations in eclogites,J. Struct. Geol., 24, 1357–1368.
Beghein, C., and J. Trampert (2004), Probability density functions for radialanisotropy: Implications for the upper 1200 km of the mantle, EarthPlanet. Sci. Lett., 217, 151–162.
Blackman, D. K., J.-M. Kendall, P. R. Dawson, H.-R. Wenk, D. Boyce, andJ. Phipps-Morgan (1996), Teleseismic imaging of subaxial flow at mid-ocean ridges: Travel-time effects of anisotropic mineral texture in themantle, Geophys. J. Int., 127, 415–426.
Brunet, D., and P. Machetel (1998), Large-scale tectonic features inducedby mantle avalanches with phase, temperature, and pressure lateral varia-tions of viscosity, J. Geophys. Res., 103, 4929–4945.
Brunet, D., and D. A. Yuen (2000), Mantle plumes pinched in the transitionzone, Earth Planet. Sci. Lett., 178, 13–27.
Bussod, B. Y., T. Katsura, and D. C. Rubie (1993), The large volume multi-anvil press as a high P-T deformation apparatus, Pure Appl. Geophys.,141, 1–20.
Bystricky, M., L. Burlini, K. Kunze, and J. P. Burg (1999), Experimentaldeformation of olivine aggregates to high strains in torsion, GottingerArb. Geol. Palaontol., 4, 22–23.
Cadek, O., and L. Fleitout (1999), A global geoid model with imposed platevelocities and partial layering, J. Geophys. Res., 104, 29,055–29,075.
Chai, M., J. M. Brown, and L. J. Slutsky (1997), The elastic constants of apyrope-grossular-almandine garnet up to 20 GPa, Geophys. Res. Lett., 24,523–526.
Chastel, Y. B., P. R. Dawson, H.-R. Wenk, and K. Bennet (1993), Aniso-tropic convection with implications for the upper mantle, J. Geophys.Res., 98, 17,757–17,771.
Chen, W.-P., and M. R. Brudzinski (2003), Seismic anisotropy in the mantletransition zone beneath Fiji-Tonga, Geophys. Res. Lett., 30(13), 1682,doi:10.1029/2002GL016330.
Christensen, U. R., and D. A. Yuen (1985), Layered convection induced byphase transitions, J. Geophys. Res., 90, 10,291–10,300.
Cordier, P., and D. C. Rubie (2001), Plastic deformation of minerals underextreme pressure using a multi-anvil apparatus, Mater. Sci. Eng. A, 309–310, 38–43.
Dupas, C., N. Doukhan, J. C. Doukhan, H. W. Green II, and T. E. Young(1994), Analytical electron microscopy of a synthetic peridotite experi-mentally deformed in the beta-olivine stability field, J. Geophys. Res., 99,15,821–15,832.
Dupas-Bruzek, C., T. G. Sharp, D. C. Rubie, and W. B. Durham (1998),Mechanisms of transformation and deformation in Mg1.8Fe0.2SiO4 oli-vine and wadsleyite under non-hydrostatic stress, Phys. Earth Planet.Inter., 108, 33–48.
Durham, W. B., D. J. Weidner, S.-I. Karato, and Y. Wang (2002), Newdevelopments in deformation experiments at high pressure, in PlasticDeformation of Minerals and Rocks, Rev. Mineral. Geochem., vol. 51,edited by S.-I. Karato and H.-R. Wenk, pp. 21–49, Am. Mineral. Soc.,Washington, D. C.
Fouch, M. J., and K. M. Fischer (1996), Mantle anisotropy beneath north-west Pacific subduction zones, J. Geophys. Res., 101, 15,987–16,002.
Gorbatov, A., and B. L. N. Kennett (2003), Joint bulk-sound and sheartomography for western Pacific subduction zones, Earth Planet. Sci.Lett., 210, 527–543.
Kaminski, E., and N. M. Ribe (2002), Timescales for the evolution ofseismic anisotropy in mantle flow, Geochem Geophys. Geosyst., 3(8),1015, doi:10.1029/2001GC000222.
Lebensohn, R. A., and C. N. Tome (1993), A self-consistent anisotropicapproach for the simulation of plastic deformation and texture develop-ment of polycrystals: Application to zirconion alloys, Acta Metall. Mater.,41, 2611–2624.
Lebensohn, R. A., P. R. Dawson, H. M. Kern, and H.-R. Wenk (2003),Heterogeneous deformation and texture development in halite polycrys-tals: Comparison of different modeling approaches and experimentaldata, Tectonophysics, 370, 287–311.
Loge, R. E., J. W. Signorelli, Y. B. Chastel, M. Y. Perrin, and R. A.Lebensohn (2000), Sensitivity of alpha-Zy4 high-temperature deforma-tion textures to the beta-quenched precipitate structure and to recrystalli-zation: Application to hot extrusion, Acta Mater., 48, 3917–3930.
Machetel, P., and P. Weber (1991), Intermittent layered convection in amodel mantle with an endothermic phase change at 670 km, Nature,350, 55–57.
Mainprice, D., and M. Humbert (1994), Methods of calculating petrophy-sical properties from lattice preferred orientation data, Surv. Geophys., 15,575–592.
Mainprice, D., G. Barruol, and W. Ben Ismaıl (2000), The seismic aniso-tropy of the Earth’s mantle: From single crystal to polycrystal, in Earth’sDeep Interior: Mineral Physics and Seismic Tomography From Atomic toGlobal Scale, Geophys. Monogr. Ser., vol. 117, edited by S.-I. Karato etal., pp. 237–264, AGU, Washington, D. C.
Mainprice, D., J. Bascou, P. Cordier, and A. Tommasi (2004), Crystalpreferred orientations of garnet: Comparison between numerical simula-tions and electron back-scattered diffraction (EBSD) measurements innaturally deformed eclogites, J. Struct. Geol., 26, 2089–2102.
Molinari, A., G. R. Canova, and S. Azhy (1987), A self-consistent approachof the large deformation polycrystal viscoplasticity, Acta Metall., 35,2983–2994.
Montagner, J.-P., and B. L. N. Kennett (1996), How to reconcile body-waveand normal-mode reference earth models, Geophys. J. Int., 125, 229–248.
Ribe, N. M. (1989), Seismic anisotropy and mantle flow, J. Geophys. Res.,94, 4213–4223.
Sachs, G. (1928), Zur ableitung einer fliessbedingung, Z. Ver. Dtsch. Ing.,72, 734–736.
Sharp, T. G., B. Y. Bussod, and T. Katsura (1994), Microstructures inb-Mg1.8Fe0.2SiO4 experimentally-deformed at transition zone conditions,Phys. Earth Planet. Inter., 86, 69–83.
Sinogeikin, S. V., T. Katsura, and J. D. Bass (1998), Sound velocities andelastic properties of Fe-bearing wadsleyite and ringwoodite, J. Geophys.Res., 103, 20,819–20,825.
Taylor, G. I. (1938), Plastic strain in metals, J. Inst. Metals, 62, 301–324.
B12405 TOMMASI ET AL.: ANISOTROPY IN THE MANTLE TRANSITION ZONE
9 of 10
B12405
Thoraval, C., and P. Machetel (2000), Accounting for phase changes andtheir kinetics within geodynamic models for the geoid, Eos Trans. AGU,81(48), Fall Meet. Suppl., Abstract T22E-07.
Thoraval, C., P. Machetel, and A. Cazenave (1995), Locally layered con-vection inferred from dynamic models of the Earth’s mantle, Nature, 375,777–780.
Thurel, E. (2001), Etude par microscopie electronique en transmission dasmecanismes de deformation de la wadsleyite et de la ringwoodite, Ph.D.thesis, Univ. des Sci. et Technol., Lille, France.
Thurel, E., and P. Cordier (2003), Plastic deformation of wadsleyite:I. High-pressure deformation in compression, Phys. Chem. Miner., 30,256–266.
Thurel, E., P. Cordier, D. Frost, and S.-I. Karato (2003a), Plastic deforma-tion of wadsleyite: II. High-pressure deformation in shear, Phys. Chem.Miner., 30, 267–270.
Thurel, E., J. Douin, and P. Cordier (2003b), Plastic deformation ofwadsleyite: III. Interpretation of dislocations and slip systems, Phys.Chem. Miner., 30, 271–279.
Tome, C. N., H.-R. Wenk, G. R. Canova, and U. F. Kocks (1991), Simula-tions of texture development in calcite: Comparison of polycrystals plas-ticity theories, J. Geophys. Res., 96, 11,865–11,875.
Tommasi, A. (1998), Forward modeling of the development of seismicanisotropy in the upper mantle, Earth Planet. Sci. Lett., 160, 1–13.
Tommasi, A., B. Tikoff, and A. Vauchez (1999), Upper mantle tectonics:Three-dimensional deformation, olivine crystallographic fabrics and seis-mic properties, Earth Planet. Sci. Lett., 168, 173–186.
Tommasi, A., D. Mainprice, G. Canova, and Y. Chastel (2000), Viscoplasticself-consistent and equilibrium-based modeling of olivine latticepreferred orientations. Implications for upper mantle seismic anisotropy,J. Geophys. Res., 105, 7893–7908.
Tong, C., O. Gudmundsson, and B. L. N. Kennett (1994), Shear wavesplitting in refracted waves returned from the upper mantle transitionzone beneath northern Australia, J. Geophys. Res., 99, 15,783–15,797.
Trampert, J., and H. J. van Heijst (2002), Global azimuthal anisotropy in thetransition zone, Science, 296, 1297–1299.
van der Hilst, R. D., R. Engdahl, W. Spakman, and G. Nolet (1991),Tomographic imaging of subducted lithosphere below Northwest Pacificisland arcs, Nature, 353, 37–43.
Vinnik, L. P., and J. P. Montagner (1996), Shear wave splitting in the mantlePs phases, Geophys. Res. Lett., 23, 2449–2452.
Wenk, H.-R., K. Bennet, G. R. Canova, and A. Molinari (1991), Modellingplastic deformation of peridotite with the self-consistent theory, J. Geo-phys. Res., 96, 8337–8349.
Zha, C. S., T. S. Duffy, H. Mao, R. T. Downs, R. J. Hemley, and D. J.Weidner (1997), Single-crystal elasticity of b-Mg2SiO4 to the pressure ofthe 410 km seismic discontinuity in the Earth’s mantle, Earth Planet. Sci.Lett., 147, E9–E15.
Zhang, S., and S. Karato (1995), Lattice preferred orientation of olivineaggregates in simple shear, Nature, 375, 774–777.
�����������������������P. Cordier, Laboratoire Structure et Proprietes de l’Etat Solide, CNRS/
Universite de Lille, F-59650 Villeneuve d’Ascq cedex, France.H. Couvy, Bayerisches Geoinstitut, Universitat Bayreuth, D-95440
Bayreuth, Germany.D. Mainprice, C. Thoraval, and A. Tommasi, Laboratoire de Tectono-
physique, CNRS/Universite de Montpellier II, F-34095 Montpellier cedex5, France. ([email protected])
B12405 TOMMASI ET AL.: ANISOTROPY IN THE MANTLE TRANSITION ZONE
10 of 10
B12405