Strain improvement of Parageobacillus thermoglucosidasius ...
242
University of Bath PHD Strain improvement of Parageobacillus thermoglucosidasius - Continuous mutagenesis and selection to elicit complex phenotypes Ortenzi, Maria Vittoria Award date: 2021 Awarding institution: University of Bath Link to publication Alternative formats If you require this document in an alternative format, please contact: [email protected] Copyright of this thesis rests with the author. Access is subject to the above licence, if given. If no licence is specified above, original content in this thesis is licensed under the terms of the Creative Commons Attribution-NonCommercial 4.0 International (CC BY-NC-ND 4.0) Licence (https://creativecommons.org/licenses/by-nc-nd/4.0/). Any third-party copyright material present remains the property of its respective owner(s) and is licensed under its existing terms. Take down policy If you consider content within Bath's Research Portal to be in breach of UK law, please contact: [email protected] with the details. Your claim will be investigated and, where appropriate, the item will be removed from public view as soon as possible. Download date: 22. Jan. 2022
Transcript of Strain improvement of Parageobacillus thermoglucosidasius ...
University of Bath
PHD
Strain improvement of Parageobacillus thermoglucosidasius - Continuousmutagenesis and selection to elicit complex phenotypes
Ortenzi, Maria Vittoria
Award date:2021
Awarding institution:University of Bath
Link to publication
Alternative formatsIf you require this document in an alternative format, please contact:[email protected]
Copyright of this thesis rests with the author. Access is subject to the above licence, if given. If no licence is specified above,original content in this thesis is licensed under the terms of the Creative Commons Attribution-NonCommercial 4.0International (CC BY-NC-ND 4.0) Licence (https://creativecommons.org/licenses/by-nc-nd/4.0/). Any third-party copyrightmaterial present remains the property of its respective owner(s) and is licensed under its existing terms.
Take down policyIf you consider content within Bath's Research Portal to be in breach of UK law, please contact: [email protected] with the details.Your claim will be investigated and, where appropriate, the item will be removed from public view as soon as possible.
Download date: 22. Jan. 2022
i
Strain improvement of Parageobacillus thermoglucosidasius –
Continuous mutagenesis and selection to elicit complex
phenotypes
Maria Vittoria Ortenzi
A thesis submitted for the degree of Doctor of Philosophy
University of Bath
Department of Biology and Biochemistry
December 2020
Supervisors: Prof David J. Leak, Dr Susanne Gebhard
Copyright notice
Attention is drawn to the fact that copyright of this thesis/portfolio rests with the author and
copyright of any previously published materials included may rest with third parties. A copy of
this thesis/portfolio has been supplied on condition that anyone who consults it understands
that they must not copy it or use material from it except as licenced, permitted by law or with
the consent of the author or other copyright owners, as applicable.
Maria Vittoria Ortenzi

ii
Table of contents
List of figures .................................................................................................................................... vi
List of tables .................................................................................................................................... xii
Acknowledgements ........................................................................................................................ xiv
Abstract ........................................................................................................................................... xv
List of abbreviations ...................................................................................................................... xvii
Chapter 1 .......................................................................................................................................... 1
Introduction ..................................................................................................................................... 1
1.1 Second generation bioethanol production ...................................................................... 1
1.2 Thermophiles as microbial cell factories ......................................................................... 7
1.3 Parageobacillus thermoglucosidasius .............................................................................. 8
1.4 Inhibition by high concentration of initial substrate and fermentation end-products . 10
1.4.1 Glucose inhibition .................................................................................................. 10
1.4.2 Ethanol inhibition ................................................................................................... 12
1.4.3 Pre-treatment by-products .................................................................................... 14
1.5 Metabolic engineering and strain improvement ........................................................... 15
1.6 Evolutionary engineering with mutators ....................................................................... 16
1.6.1 Physical or chemical mutagens .............................................................................. 16
1.6.2 Hypermutagenic host strains ................................................................................. 17
1.6.3 Genome replication engineering assisted continuous evolution (GREACE) .......... 19
1.6.4 Genome shuffling ................................................................................................... 20
1.6.5 Transposon engineering ......................................................................................... 21
1.7 Evolutionary engineering with perturbators ................................................................. 21
1.7.1 Global transcription machinery engineering (gTME) ............................................. 21
1.7.2 Ribosome engineering ........................................................................................... 22
1.7.3 Heterologous expression of heat shock proteins .................................................. 23
1.8 Comparison between mutators and perturbators for engineering of complex
phenotypes ................................................................................................................................ 23
1.9 Introduction to DNA replication in bacteria .................................................................. 25
1.9.1 DNA replication in E. coli ........................................................................................ 27
1.9.2 Replicative DNA polymerases ................................................................................ 31
1.9.3 Translesion polymerases ........................................................................................ 33
1.10 Mechanisms of fidelity control ...................................................................................... 36
1.10.1 Base selection ........................................................................................................ 36
iii
1.10.2 Proofreading ........................................................................................................... 37
1.10.3 Mismatch repair ..................................................................................................... 38
1.10.4 Post-replication DNA conservation mechanisms ................................................... 40
1.11 GREACE for P. thermoglucosidasius strain improvement .............................................. 41
Aim and objectives ......................................................................................................................... 43
Chapter 2 ........................................................................................................................................ 44
General methods and materials ..................................................................................................... 44
2.1 Bacterial strains and microbiological techniques ........................................................... 44
2.1.1 Bacterial strains ...................................................................................................... 44
2.1.2 E. coli growth .......................................................................................................... 44
2.1.3 P. thermoglucosidasius aerobic growth ................................................................. 44
2.1.4 P. thermoglucosidasius anaerobic growth ............................................................. 45
2.1.5 Cells harvesting and washing.................................................................................. 46
2.1.6 Antibiotic selection ................................................................................................. 46
2.1.7 Microbial fermentation in benchtop bioreactor .................................................... 47
2.1.8 Calculation of viable cells on agar plates ................................................................ 49
2.1.9 Calculation of growth rate ...................................................................................... 49
2.1.10 Conservation of bacterial strains ............................................................................ 50
2.2 Molecular biology tool and techniques .......................................................................... 50
2.2.1 Cloning vector ......................................................................................................... 50
2.2.2 Oligonucleotides ..................................................................................................... 51
2.2.3 Genomic and plasmid DNA extraction ................................................................... 51
2.2.4 DNA electrophoresis on agarose gel ...................................................................... 51
2.2.5 Quantification of DNA ............................................................................................ 52
2.2.6 Restriction enzyme digestion and ligation of DNA ................................................. 52
2.2.7 PCR techniques ....................................................................................................... 52
2.2.8 Cloning in E. coli ...................................................................................................... 55
2.2.9 Cloning in P. thermoglucosidasius .......................................................................... 55
2.3 DNA sequencing and bioinformatics .............................................................................. 56
2.3.1 Short DNA sequencing and analysis ....................................................................... 56
2.3.2 Whole genome sequencing and variants identification ......................................... 56
2.3.3 Construction of phylogenetic tree .......................................................................... 56
2.4 Chemical analysis ............................................................................................................ 57
2.4.1 High-Performance Liquid Chromatography (HPLC) ................................................ 57
iv
2.4.2 Calculation of glucose and ethanol concentrations from HPLC samples ............... 57
2.4.3 Calculation of ethanol yield from fermented glucose ........................................... 58
Chapter 3 – Part I ........................................................................................................................... 59
Validation of a dnaQ homologue in P. thermoglucosidasius ......................................................... 59
3.1 dnaQ and the ε subunit of DNA Pol III from E. coli ........................................................ 59
3.2 DnaQ in P. thermoglucosidasius .................................................................................... 61
3.3 DnaQ peptide sequence analysis ................................................................................... 64
3.4 DnaQ structure analysis ................................................................................................. 68
3.5 Discussion ....................................................................................................................... 70
Chapter 3 – Part II .......................................................................................................................... 73
Preparation of dnaQ mutants ........................................................................................................ 73
3.6 DnaQ amino acid substitution rationale ........................................................................ 73
3.7 Site-directed mutagenesis of dnaQ ............................................................................... 74
3.8 Discussion ....................................................................................................................... 77
Chapter 4 ........................................................................................................................................ 79
Mutation frequency of dnaQ mutants ........................................................................................... 79
4.1 Evaluation of mutagenic strength .................................................................................. 79
4.2 Mutation frequency in P. thermoglucosidasius ............................................................. 81
4.3 Ciprofloxacin .................................................................................................................. 82
4.4 P. thermoglucosidasius NCIMB 11955 growth curves at 50°C, 55°C and 60°C .............. 83
4.5 Determination of ciprofloxacin working concentrations ............................................... 84
4.6 Ciprofloxacin thermostability at 11955 optimum growth temperature ....................... 86
4.7 Mutation frequency of wt strain carrying dnaQ in vivo mutators ................................. 88
4.8 Discussion ....................................................................................................................... 90
Chapter 5 ........................................................................................................................................ 92
Isolation of glucose-tolerant strains generated using an error-prone DnaQ ................................ 92
5.1 Introduction ................................................................................................................... 92
5.2 Glucose minimum inhibitory concentration .................................................................. 92
5.3 Test at increasing concentrations of glucose ................................................................. 94
5.4 Selection of a small subset of resistant mutants ........................................................... 98
5.5 Plasmid curing ................................................................................................................ 99
5.6 Confirmation of unimpaired glucose uptake ................................................................. 99
5.7 Analysis of genome sequences .................................................................................... 104
5.7.1 Mutations in strains 20.29 and 41.42 .................................................................. 107
v
5.7.2 Mutations in strain 49.32 ..................................................................................... 107
5.7.3 Mutations in strain 53.10 ..................................................................................... 107
5.8 Description of mutations .............................................................................................. 107
5.9 Discussion ..................................................................................................................... 112
Chapter 6 ...................................................................................................................................... 114
Directed evolution in chemostat culture ..................................................................................... 114
6.1 Introduction .................................................................................................................. 114
6.2 Experiment outline ....................................................................................................... 116
6.3 Initial bioreactor experiments in continuous culture ................................................... 116
6.4 Second continuous culture experiment ....................................................................... 121
6.5 Third bioreactor experiment in continuous culture ..................................................... 123
6.6 Plasmid curing .............................................................................................................. 131
6.7 Discussion ..................................................................................................................... 131
Chapter 7 ...................................................................................................................................... 134
Analysis and selection of evolved strains ..................................................................................... 134
7.1 Introduction on experimental settings ......................................................................... 134
7.2 Ethanol tolerance of the parent strain P. thermoglucosidasius TM242 ....................... 135
7.3 Test of acquired ethanol resistance in selected bioreactor samples ........................... 137
7.4 Analysis of 25A isolates ................................................................................................ 138
7.5 Analysis of 96B isolates ................................................................................................ 139
7.6 Analysis of 120B isolates .............................................................................................. 140
7.7 Analysis of 136B isolates .............................................................................................. 141
7.8 Analysis of 136B.32 ....................................................................................................... 142
7.9 Discussion ..................................................................................................................... 144
Chapter 8 ...................................................................................................................................... 151
Analysis of sequenced genomes of evolved strains ..................................................................... 151
8.1 Introduction .................................................................................................................. 151
8.2 Analysis of the genomes of ethanol-tolerant 25A and 136B isolates .......................... 151
8.3 Analysis of mutations in non-coding sequences ......................................................... 152
8.4 Analysis of mutations located in coding sequences and pseudogenes........................ 158
8.5 Discussion ..................................................................................................................... 168
Chapter 9 ...................................................................................................................................... 177
General discussion ........................................................................................................................ 177
References .................................................................................................................................... 182
vi
List of figures
Figure 1 - Cellulose (A) and example of xylan (B) structures and degradative enzymes involved in
depolymerisation. (Adapted from Dutta et al., 2014). .................................................................... 3
Figure 2 - Steps of bioethanol production from lignocellulosic materials. (U.S. Department of
energy, 2011). .................................................................................................................................. 4
Figure 3 – Schematic representation of lactate, acetate and ethanol production by fermentative
metabolism. In anaerobic conditions, glucose is quickly catabolised into pyruvate to obtain ATP
and NADH + H+ by glycolysis; the NAD+ pool is recreated by fermentation which can generate
various products including ethanol, lactate and acetate (Jeffrey G Gardner and Escalante-
Semerena, 2009)(adapted from Olson et al., 2015). Enzymes abbreviations are LDH: lactate
dehydrogenase; PFL: pyruvate formate lyase; PDH: pyruvate dehydrogenase; FDH: formate
dehydrogenase; PDC: pyruvate decarboxylase; PFOR: pyruvate ferredoxin oxidoreductase; NFO:
NAD+-ferredoxin oxidoreductase; PTA: phosphotransacetylase; AcK: acetate kinase; AcS: acetyl-
CoA synthetase; AdhE: bifunctional alcohol-aldehyde dehydrogenase; AldH: aldehyde
dehydrogenase; ADH: alcohol dehydrogenase. ............................................................................... 5
Figure 4 - Catabolism of pyruvate in P. thermoglucosidasius. The triple mutant TM242 strain (ldh-
in red, pdhup in green, pfl- in red) produces ethanol and acetate (adapted from Cripps et al.,
2009). Enzymes names abbreviations are LDH: lactate dehydrogenase; PFL: pyruvate formate
lyase; PDH: pyruvate dehydrogenase; FDH: formate dehydrogenase; PTA:
phosphotransacetylase; AcK: acetate kinase; AcS: acetyl-CoA synthetase; AdhE: bifunctional
alcohol-aldehyde dehydrogenase with aldehyde dehydrogenase (AldH) and alcohol
dehydrogenase (ADH ) activities. ..................................................................................................... 9
Figure 5 - Compatible solutes for osmotic stress response and their permeases or synthesis
processes in B. subtilis. (Image adapted from Kempf and Bremer, 1998; created with Biorender).
....................................................................................................................................................... 12
Figure 6 - Phases of Okazaki fragment synthesis. Starting from top-left and following arrows: the
helicase DnaB unwinds DNA upstream of the replicative fork, emerging single stranded DNA is
protected by SSB proteins, DnaG primase synthesises the RNA primer (in purple), the CLC
complex (γ/τ complex) loads the sliding clamp β2 (in red) on the RNA:DNA duplex , while the DNA
Pol III core is recruited and loaded on β2 to start primer elongation. Image adapted from Johnson
and O’donnell (2005). .................................................................................................................... 28
Figure 7 – Schematic representation of DNA Polymerase holoenzyme (DNA Pol HE) replicating
DNA on the replicative fork in E. coli. Taken from Lewis et al., 2016. ........................................... 29
Figure 8 - Families of replicative proofreading-proficient polymerases and their distribution
across domains of life. (Taken from Raia et al., 2019). .................................................................. 31
Figure 9 - Chemostat in operation, connected to the Biostat B system (Sartorius Stedim Biotech).
....................................................................................................................................................... 48
Figure 10 - Plasmid pG1AK mCherry map. Modularity was obtained with unique restriction sites
between blocks of genes (NotI, PmeI, AscI, SwaI, FseI). Restriction enzymes NheI and XhoI sites in
the multiple cloning site (MCS) used for cloning are highlighted. Drawn with Benchling
(https://benchling.com/, San Francisco, CA, USA). ....................................................................... 50
Figure 11 - Steps to insert point mutation in a gene of interest by overlapping PCR. The gene of
interest is in blue, the red star is the base pair to be mutated; external primers are in orange,
vii
internal primers are in green. Internal primers anneal roughly 20 bp apart on the gene, they have
a complementary tail that corresponds to the 20 bp linker region and it carries the new base that
insert the point mutation (yellow star). A.The sequences upstream and downstream the bp to be
mutated are PCR amplified separately. B1.The two sequences are then mixed together in a short
PCR with only 10 cycles, they anneal by the tails which also prime the amplification of one
another (dashed arrows). B2. External primers are added to the PCR mixture, the gene of
interest is amplified in a standard PCR and the product now carries the desired point mutation.
External primers have restriction enzymes recognition sites which allow digestion and ligation
with a vector. .................................................................................................................................. 53
Figure 12 - Conditions of the two-step overlapping PCR. Boxes indicate variable temperature and
times depending on sequences. In the first round of cycles the extension time depends on the
size of the sequences upstream and downstream the point mutation. In the second round of
cycles the melting temperature (Tm) depends on the external primers and the extension time
doubles the one in the first round. ................................................................................................ 54
Figure 13 - Standard curves used to calculate glucose and ethanol concentrations in HPLC
samples. .......................................................................................................................................... 58
Figure 14 - Protein alignment of some enzymes with 3’-5’ exonuclease activity of the DEDD
family from E. coli. Numbers indicate amino acids not shown in the alignment, letters in bold red
indicate the conserved amino acids of the DEDD motif, red boxes highlight the histidine (H) or
the tyrosine (Y) involved in catalysis. Image modified from Lovett (2011). ................................... 60
Figure 15 - Structure of E. coli DNA Pol III core composed of subunits α (in yellow), ε (in green)
and θ (in light blue) bound to β2 helicase (in violet and pink) and DNA (in orange) (ID 5M1S). .... 60
Figure 16 - Primary structure and schematic representation of subunit ε of the DNA Pol III core in
E. coli K12 substrain MG1655 (E. coli). Conserved motif DEDDh is distributed among domains Exo
I, Exo II and Exo III. The N-terminus interacts with β2 helicase and core subunit θ. The short
flexible Q-rich linker connects the N-terminus with the C-terminus, which interacts with the
subunit α through H225 and W241. (Adapted from Taft-Benz and Schaaper, 1999) .................... 61
Figure 17 - Results of conserved domains in putative DnaQ of P. thermoglucosidasius NCIMB
11955 and DSM 2542 obtained by NCBI Conserved Domain search from primary structure of
DnaQ. .............................................................................................................................................. 62
Figure 18 - Neighbor joining phylogenetic tree of proteins with the PRK07740 domain
architecture found in Bacillus, Geobacillus and Parageobacillus spp. by CDART. Annotation shows
proteins accession numbers and species of origin. Parageobacillus spp are highlighted in light
blue, Geobacillus spp are in pink, all other spp. are from the Bacillus genus. External coloured
ring shows Blastp bit-score values from high to low: ranges 510-355 in green, 307-295 in yellow,
204-100 in orange and 99-44 in red. .............................................................................................. 63
Figure 19 - Pairwise alignment of the amino acid sequences of the putative DnaQ from P.
thermoglucosidasius NCIMB 11955 (ε_Gtherm11955) and the ε subunit from E. coli K12
substrain MG1655 (ε_Ecoli) performed by Clustal Omega. The conserved amino acids of the
DEDDh-like active site of the ε subunit from E. coli are in yellow (D12, E14, D103, H162 and
D167), the corresponding amino acids in 11955 DnaQ are in green (D68, E70, D154, H207,
D210/D212): the residues that matched perfectly are in bright green, those that did not are in
dark green....................................................................................................................................... 65
viii
Figure 20 - Prediction of disordered regions (in red) and binding regions of disordered proteins
(in blue) performed by IUPred and ANCHOR of E. coli K12 substrain MG1655 DNA Pol III ε subunit
(A) and of putative DnaQ from P. thermoglucosidasius NCIMB 11955 (B).................................... 66
Figure 21 - Prediction of disordered regions (indicated with letters D in red) predicted by ESpritz
of E. COLI DNA Pol III ε subunit (A) and of putative DnaQ from P. thermoglucosidasius NCIMB
11955 (B). ....................................................................................................................................... 67
Figure 22 - Clustal Omega alignment of C-terminus peptide sequence of ε from E. coli K12
substrain MG1655 and reverse of N-terminus of DnaQ from P. thermoglucosidasius NCIMB
11955. Amino acids H225 and W241 in E. coli ε are underlined. .................................................. 67
Figure 23 - Primary structure and schematic representation of proposed domains organisation of
putative DnaQ from P. thermoglucosidasius NCIMB 11955. Conserved motif DEDDh is distributed
among domains Exo I, Exo II and Exo III at the C-terminus. The position of a binding domain and a
Q-rich linker was hypothesised to be at the N-terminus. .............................................................. 68
Figure 24 - Predicted structure of DnaQ from P. thermoglucosidasius NCIMB 11955 by Swiss-
Model. Homology modeling was based on the crystal structure of PolC 3’-5’ exonuclease domain
from T. maritima. Ranges of colour between blue and orange indicate QMEAN local values from
high to low quality. The first 62 and the last 18 amino acids of DnaQ were not modelled, the
sequence identity was limited to 26.16%, GMQE 0.45, QMEAN -2.16. The α-helix containing Exo
III of each monomer in bright orange indicates that the structure was assessed of poor quality. 69
Figure 25 - Predicted structure of DnaQ from P. thermoglucosidasius NCIMB 11955 by Swiss-
Model based on the deposited template of the ε subunit of DNA Pol III from E. coli. Ranges of
colour between blue and orange indicate QMEAN local values from high to low quality. The first
62 and the last 14 amino acids of DnaQ were not modelled. H207 of Exo III was in a low QMEAN
region (blue arrow). ....................................................................................................................... 70
Figure 26 - Comparison of the DEDDh-like active site residues positions between (A) the
deposited structure of DNA pol III ε subunit from E. coli and (B) the predicted structure of DnaQ
from P. thermoglucosidasius NCIMB 11955 modelled on ε, obtained with Swiss-Model. A. The 3’-
5’ exonuclease (in violet) interacts with DNA (in orange); H162 faces the ssDNA. B. Modelled
DnaQ (missing the unmodelled N-terminus) from P. thermoglucosidasius NCIMB 11955 shows
H207 (corresponding to H162 in ε) facing outwards on the unstructured loop. The tubular view
shows positively and negatively charged amino acids highlighted in blue and in red, respectively.
....................................................................................................................................................... 70
Figure 27 - Primers arrangement on 11955 dnaQ and the upstream and downstream sequences
to insert point mutations in the open reading frame (in blue) by overlapping PCR. External
primers are in orange. Pairs of green internal primers of same height were used for the same
assembly. Yellow stars are the base pairs in the wild type gene to be mutated, blue curved lines
are the primers tails for overlapping PCR; red stars indicate the new base pairs to be inserted.
External primers for the pair D68E and E70V (thick orange) were used to PCR amplify the
mutated dnaQD68E, dnaQE70V, dnaQH207L, dnaQD210E and dnaQD212E and restrict the
sequence to the minimum without unnecessary downstream sequences. dnaQD154E was
inserted in the host vector with extra downstream sequence, carried over from amplification
with thick orange forward primer and orange dashed reverse primer. ........................................ 75
Figure 28 - Agarose gel showing diagnostic restriction enzyme digests of constructs. NheI and
XhoI double digest of the empty pG1AK mCherry plasmid (lane 10, 5583 bp + 37 bp) or carrying
the amplicons dnaQD68E (lane 2, 5583 bp + 1127 bp), E70V (lane 3, 5583 bp + 1127 bp),D154E

ix
(lane 4, 5583 bp + 1562 bp), H207L (lane 5, 5583 bp + 1127 bp),D210E (lane 6, 5583 bp + 1127
bp) and D212E (lane 7, 5583 bp + 1127 bp). Lanes 8 and 9 show single digests of empty pG1AK
mCherryplasmid with NheI and XhoI, respectively. GeneRuler 1kb DNA ladder (ThermoFischer) is
in lane 1 for reference. ................................................................................................................... 76
Figure 29 - Growth curves of P. thermoglucosidasius NCIMB 11955 in liquid 2TY at 50°C, 55°C and
60°C shaking at 250 rpm. Every time point is an average of a triplicate. ....................................... 84
Figure 30 - Growth curves of subcultured P. thermoglucosidasius NCIMB 11955 (A), or freshly
inoculated cultures from plate (B) grown at 60°C in liquid 2TY only or 2TY added with
ciprofloxacin (Cpx 0.2 µg/mL, 0.4 µg/mL, 0.8 µg/mL, 1.6 µg/mL). ................................................. 85
Figure 31 - Growth curves of subcultured P. thermoglucosidasius NCIMB 11955 at 60°C in liquid
2TY only (A) or added with 1.6 µg/mL ciprofloxacin (B). Media were kept at 60°C for 2, 4, 6, 9, 11
and 17 days before utilisation. The OD600 at each time point is an average of three replicates. .. 87
Figure 32 - Mutation frequencies of wild type P. thermoglucosidasius NCIMB 11955, and carrying
pG1AK mCherry pdnaQwt, 11955 pdnaQD68E, 11955 pdnaQE70V, 11955 pdnaQD154E, 11955
pdnaQH207L, 11955 pdnaQD210E and 11955 pdnaQD212E. ....................................................... 90
Figure 33 - OD600 values over time of P. thermoglucosidasius NCIMB 11955 pG1AKmCherry
dnaQwt grown at 60°C in 2TYK, 2TYKG20, 2TYKG35, 2TYKG50, 2TYKG65, 2TYKG80 in triplicates
(1, 2 and 3). ..................................................................................................................................... 93
Figure 34 - P. thermoglucosidasius NCIMB 11955 strains carrying pG1AK mCherry containing a
different version of dnaQ (wt, D68E, D154E, D210E and H207L) resistant to increasing
concentration of glucose (50, 75, 100, 125, 150 and 175 g/L). Plates were 2TY agar supplemented
with 12.5 µg/mL of kanamycin and glucose incubated for 24 hours at 60°C (11955 pdnaQD154E
grown on 100 g/L glucose for 48 hours is also shown). Plates with 125, 150 and 175 g/L of
glucose also contained 40 mM triple buffer. 200 µL of culture were spread on each plate. Picture
of 11955 pdnaQD210E grown on 2TYKG100 is missing. ................................................................ 96
Figure 35 - Growth of P. thermoglucosidasius NCIMB 11955 pdnaQH207L isolates resistant to
150 g/L of glucose in (A) 2TYK and in (B) 2TYKG150TB. Only the strains with the shortest lag
phase in 150 g/L glucose (isolates 20, 24, 41, 49 and 53) and one example of a strain with a long
lag phase and slow growth rate (strain number 52) were picked for further analyses. ................ 98
Figure 36 - Growth of P. thermoglucosidasius NCIMB 11955 in ASSM supplemented with 1 g/L, 2
g/L and 5 g/L of yeast extract. ...................................................................................................... 100
Figure 37 - Growth of plasmid-cured isolates of glucose resistant P. thermoglucosidasius NCIMB
11955 mutants and wild type control in liquid culture of ASSM supplemented with 150 g/L
glucose, 1 g/L yeast extract and 40 mM triple buffer at 60°C. Three replicates of each isolate
were grown in different experiments and their OD600 values are plotted separately. Underlining
of the isolate numbers indicates those for which genome sequence were obtained. ................ 102
Figure 38 – Examples of mutations covered by a low number of reads in sequences that
appeared as mutation hot spots, visualised on Integrative Genomics Viewer. Each track (the two
11955 wild types, 20.29, 49.32, 41.42 and 53.10 – “.bam” file format) represents the alignment
of the sequencing reads to the reference for each strain sequenced in the two batches (1 or 2);
the variant call file (annotated “.vcf” format) of the reference genome shows where the
mutations are located in the regions from 1,534,929 to 1,535,718 and from 2,715,135 to
2,715,530 on the chromosome NZ_CP016622. The grey and coloured bars represent the number
of reads covering each position, each sequenced strain track shows the maximum number of
sequencing reads that aligned to the reference in the areas showed (e.g. [0-72] and [0-46] for
x
11955 (1) in the two intervals). Grey bars indicate unmutated bases. Variants are coloured bars
that show the proportions of reads that registered a mutation into T (in red), C (in blue), G (in
orange) or A (in green). Short bars indicate low reading depth that replicated across batches
(indicated by the curly brackets). ................................................................................................ 105
Figure 39 - Batch culture of P. thermoglucosidasius TM242 pdnaQH207L grown in 2SPYKG30 in
bioreactor; redox -280 mV, stirring and air sparging varied accordingly. A. OD600 values (blue,
primary axis), glucose (red) and ethanol (green) concentrations (secondary axis). B. Growth curve
obtained plotting ln(OD600)values against time. .......................................................................... 117
Figure 40 - OD600 trend (blue), glucose (red) and ethanol (green) concentrations (right axis) in the
first continuous culture of P. thermoglucosidasius TM242 pdnaQH207L in 2SPYKG30 and from
40.43 h in 2SPYKG45. Sample number 75 at hour 139.68 was used to prepare the seed culture of
the second bioreactor experiment. ............................................................................................. 119
Figure 41 - Cell density (OD600), glucose and ethanol concentrations (right axis) in the second
continuous culture of P. thermoglucosidasius TM242 pdnaQH207L in 2SPYKG30E32. Sample
number 25A at log time 74.33 was used to prepare the seed culture of the third bioreactor
experiment. .................................................................................................................................. 122
Figure 42 - Washout profile P. thermoglucosidasius TM242 pdnaQH207L cells experiencing
ethanol toxicity in continuous culture. Cells were being supplied with 2SPYKG30E32 at a dilution
rate D of 0.1 h-1. ........................................................................................................................... 123
Figure 43 - OD600 trend, glucose and ethanol concentrations of continuous culture of the
population of P. thermoglucosidasius TM242 pdnaQH207L in 2SPYKG30 after technical problems
were addressed. ........................................................................................................................... 124
Figure 44 - OD600 trend, glucose and ethanol concentrations between hours 107.67 and 193.42
of continuous culture of the population of P. thermoglucosidasius TM242 pdnaQH207L in
2SPYKG30E16. .............................................................................................................................. 125
Figure 45 - OD600 trend, glucose and ethanol concentrations between hours 193.42 and 223.67
of continuous culture of the population of P. thermoglucosidasius TM242 pdnaQH207L in
2SPYKG30E28. .............................................................................................................................. 126
Figure 46 - OD600 trend, glucose and ethanol concentrations between hours 225.67 and 312.67
of continuous culture of the population of P. thermoglucosidasius TM242 pdnaQH207L in
2SPYKG30E32. Sample 96B at hour 296.17 was selected for further analyses. .......................... 127
Figure 47 - OD600 trend, glucose and ethanol concentrations between hours 316.91 and 530.67
of continuous culture of the population of P. thermoglucosidasius TM242 pdnaQH207L in
2SPYKG30E35. Samples 120B at hour 382.17 and 136B at hour 438.83 were selected for further
analyses. ....................................................................................................................................... 129
Figure 48 - Growth curve of continuous culture of the population of P. thermoglucosidasius
TM242 pdnaQH207L in 2SPYKG30E35 since the dilution rate was set at 𝑫 = 0.115h-1. A.
Trendline of the growth curve used to calculate the washout rate. B. Small increase in OD600
indicating that resistant mutants had been selected in the last 100 hours of continuous culture.
..................................................................................................................................................... 130
Figure 49 - Residual glucose (A) and total ethanol (B) concentrations detected after 24, 48 and 72
hours growth in liquid cultures of P. thermoglucosidasius TM242 under fermentative conditions
in 2SPY supplemented with 26.4 g/L of glucose, 40 mM triple buffer, 200 μL antifoam
(abbreviated as medium A) and ethanol 0 g/L, 6.9 g/L, 13.9 g/L, 20.8 g/L, 27.8 g/L (abbreviated as
E0, E7, E14, E21, E28, E35). Each experiment was done in triplicate. ......................................... 136
xi
Figure 50 - Residual glucose (A) and total ethanol (B) concentrations in g/L at 24 and 48 hours of
isolates from sample 25A in experiment 1 and experiment 2 (exp 1 and exp 2, respectively).
Cultures were grown under fermentative conditions in 2SPY supplemented with 40 mM triple
buffer, 200 μL antifoam, 27.4 g/L of glucose and 16.1 g/L ethanol in exp 1 and 28.9 g/L glucose
and 12.25 g/L ethanol in exp 2. Samples that registered concurrent glucose decrease and ethanol
increase over the medium control are highlighted in yellow. ..................................................... 138
Figure 51 - Residual glucose (A) and total ethanol (B) concentrations in g/L at 24 and 48 hours of
isolates from sample 96B in experiment 1 and experiment 2 (exp 1 and exp 2, respectively).
Cultures were grown under fermentative conditions in 2SPY supplemented with 40 mM triple
buffer, 200 μL antifoam, 27.4 g/L of glucose and 16.1 g/L ethanol in exp 1 and 28.9 g/L glucose
and 12.25 g/L ethanol in exp 2. The only sample that registered concurrent glucose decrease and
ethanol increase over the medium control is highlighted in yellow. ........................................... 139
Figure 52 - Residual glucose (A) and total ethanol (B) concentrations in g/L at 24 and 48 hours
from sample 120B in experiment 1 and experiment 2 (exp 1 and exp 2, respectively). Cultures
were grown under fermentative conditions in 2SPY supplemented with 40 mM triple buffer, 200
μL antifoam, 27.4 g/L of glucose and 16.1 g/L ethanol in exp 1 and 28.9 g/L glucose and 12.25 g/L
ethanol in exp 2. Samples that registered concurrent glucose decrease and ethanol increase over
the medium control are highlighted in yellow. ............................................................................ 140
Figure 53 - Residual glucose (A) and total ethanol (B) concentrations in g/L at 24 and 48 hours of
isolates from sample 136B in experiment 1 and experiment 2 (exp 1 and exp 2, respectively).
Cultures were grown under fermentative conditions in 2SPY supplemented with 40 mM triple
buffer, 200 μL antifoam, 27.4 g/L of glucose and16.1 g/L ethanol in exp 1 and 28.9 g/L glucose
and 12.25 g/L ethanol in exp 2. Samples that registered concurrent glucose decrease and ethanol
increase over the medium control are highlighted in yellow. ..................................................... 142
Figure 54 - Residual glucose (A) and total ethanol (B) concentrations after 24 and 72 hours
incubation of P. thermoglucosidasius TM242 and 136B.32 isolates under fermentative conditions
in 2SPY supplemented with 26.6 g/L of glucose, 40 mM triple buffer, 200 μL antifoam and
ethanol 14 g/L. .............................................................................................................................. 143
Figure 55 - Residual glucose (A) and total ethanol (B) concentrations after 24 and 72 hours of P.
thermoglucosidasius TM242 and 136B.32 cultures under fermentative conditions in 2SPY
supplemented with 50 g/L of glucose, 40 mM triple buffer and 200 μL antifoam. ..................... 144
Figure 56 - Percentages of isolates from bioreactor samples 25A and 136B that under
fermentative conditions in 2SPY supplemented with 40 mM triple buffer, 200 μL antifoam, 27.4
g/L of glucose and 16.1 g/L ethanol in exp 1 and 28.9 g/L glucose and 12.25 g/L ethanol in exp 2:
did not produce ethanol and did not consume glucose (group 1); produced less ethanol than P.
thermoglucosidasius TM242 control (group 2); produced more ethanol but did not consume
more sugar than TM242 (group 3); produced more ethanol and consumed more glucose than
TM242 (group 4). .......................................................................................................................... 148
Figure 57 - COG category distribution of genes whose putative regulatory elements contained
mutations, assigned by isolate. .................................................................................................... 158
Figure 58 - COG category distribution of mutations allocated to genes or pseudogenes assigned
to each isolate. ............................................................................................................................. 161
Figure 59 - Number of mutations divided by COG categories of frame shifts and stop gains (in
black), substitutions (in grey) and mutations in regulating elements (in greyscale) shared by all or
most of 136B isolates. .................................................................................................................. 170
xii
List of tables
Table 1 - Proteins involved in DNA replication in E. coli and their location at the replicative fork.
Genes for proteins that assemble to form the DNA Pol III holoenzyme (HE) are all essential,
except θ and χ (Viguera et al., 2003). ............................................................................................ 27
Table 2 - List of bacterial strains used in this study. ...................................................................... 44
Table 3 - Antibiotics used for selection and their working concentrations. .................................. 46
Table 4 - Abbreviation of media supplements used in this study. ................................................ 46
Table 5 - List of primers used in this study. ................................................................................... 51
Table 6 - PCR mix and primers mix to be used at different steps of the overlapping PCR. ........... 54
Table 7 - HPLC typical retention times for carbohydrates degradation products, selected organic
acids, sugars and alcohols in fermentations liquid fractions. ........................................................ 57
Table 8 - Positions of residues of the DEDDh (or DEDD) motif in ε from E. coli, correspondent
amino acids in DnaQ from P. thermoglucosidasius NCIMB 11955 and amino acids they were
mutated into by site-directed mutagenesis. .................................................................................. 74
Table 9 - Combination of primers used for the insertion of a point mutation by overlapping PCR.
....................................................................................................................................................... 74
Table 10 - Abbreviations of P. thermoglucosidasius NCIMB 11955 strains electroporated with
pG1AK mCherry carrying dnaQ alleles. .......................................................................................... 77
Table 11 - Growth rates and doubling times of P. thermoglucosidasius NCIMB 11955 grown in
liquid 2TY at 50°C, 55°C and 60°C. ................................................................................................. 84
Table 12 - Growth rates and doubling times of subcultured P. thermoglucosidasius NCIMB 11955
or freshly inoculated cultures from plate grown at 60°C in liquid 2TY only or 2TY added with
ciprofloxacin (Cpx 0.2 µg/mL, 0.4 µg/mL, 0.8 µg/mL, 1.6 µg/mL). ................................................ 86
Table 13 - Growth rates and doubling times of P. thermoglucosidasius NCIMB 11955 grown at
60°C in liquid 2TY incubated at 60°C for 2, 4, 6, 9, 11, 17 days. .................................................... 87
Table 14 - Growth rates and doubling times of P. thermoglucosidasius NCIMB 11955
pG1AKmCherry pdnaQwt grown at 60°C in 2TYK, 2TYKG20, 2TYKG35, 2TYKG50 and 2TYKG65 in
triplicates (1, 2 and 3). No growth was observed in 2TYKG80. ...................................................... 94
Table 15 - Mutations found on the chromosome of the four high glucose concentration resistant
strains sequenced considered for analysis. ................................................................................. 106
Table 16 - Original sequences and mutated versions of putative RBSs that showed mutations (in
red) within the first 20 bp upstream the ATG or GTG of the regulated gene. By comparison the
strong RBS sequence of pheB from G. stearothermophilus is shown. ......................................... 154
Table 17 - Mutations in intergenic regions shared by all or most of 136B isolates, predicted role
of the intergenic sequence showing mutation (ter: terminator; RBS: ribosome binding site),
description of regulated protein and its function following the COG categories system. The “t”
variant at position 1534948 differs from the laboratory P. thermoglucosidasius TM242 genome
sequence but is the same as the NCBI reference genome of TM242. ......................................... 157
Table 18 - Mutations in coding sequences (CDS) and pseudogenes found in all or most of the
136B isolates, their position on the chromosome (chr) or mega-plasmids (pCNI001 and pCNI002),
the type of mutation, the recorded variant that differs from the progenitor strain (Lab TM242),
the name of the gene (when present), the protein product of the CDS where mutations are
located and their predicted function (COG category). Mutations that caused a frame shift or the

xiii
gain of a stop codon are in bold. Mutations that appeared on the same gene are close and
underlined. ................................................................................................................................... 162

xiv
Acknowledgements
I would like to thank my supervisors Professor David Leak and Dr Susanne Gebhard for their
constant guidance and support throughout my PhD and from whom I have learnt invaluable
lessons. I still can’t believe this work started as a Master’s project, I am very thankful that I was
given the opportunity to carry it forward to this point. I wish to thank also Professor Micheal
Danson and EPSRC for financial support.
I thank my labmates, past and present, from labs 1.28 and 1.33, because it wouldn’t have been
the same without your professional help and advice: Dr Edward Nesbitt, Dr Christopher
Ibenegbu, Helen Liang, Dr Matthew Styles, Dr Emanuele Kendrick, Dr Michaela Chacon, Dr
Natthaya Mangkorn, Dr Anna Panek, Dr Leann Bacon, Dr Charlie Hamley-Bennett, Dr Alice
Marriott, Martyn Bennet, Dr Andrew Daab, Dr Lisa Buddrus, Dr Beata Lisoskwa, Dr Ali Hussein,
Dr Alex Holland, Dr Timothy Hoffmann, Dr Dragana Catici, Dr Hannah Jones, Dr Rory Crean,
Samuel Winter, Dr Alex Lathbridge, Dr Daniel Baxter and Dr Meade. Every single one of you
taught me something that made me the scientist I am today. I am grateful to have met you, for
all the time we spent together and all the feels we shared. Thanks Dragana for pulling me
through the difficult times.
I would especially like to mention Dr Andrea Gori who has seen me growing as a scientist and as
a person since my first year at uni, I will never thank you enough for your help, your support and
all the laughs. I also would like to thank Grazia Rovelli and Anally Salinas Sequera, Benedetta
Biagioni and Elisa Mazzoni for being the friends I needed outside the lab, and thanks to Chiamate
Roma Triuno Triuno for cheering me up in my very long days in the lab.
And finally, thanks to my family, who above all believed in me since day 1 and show me everyday
what is worth living for.
xv
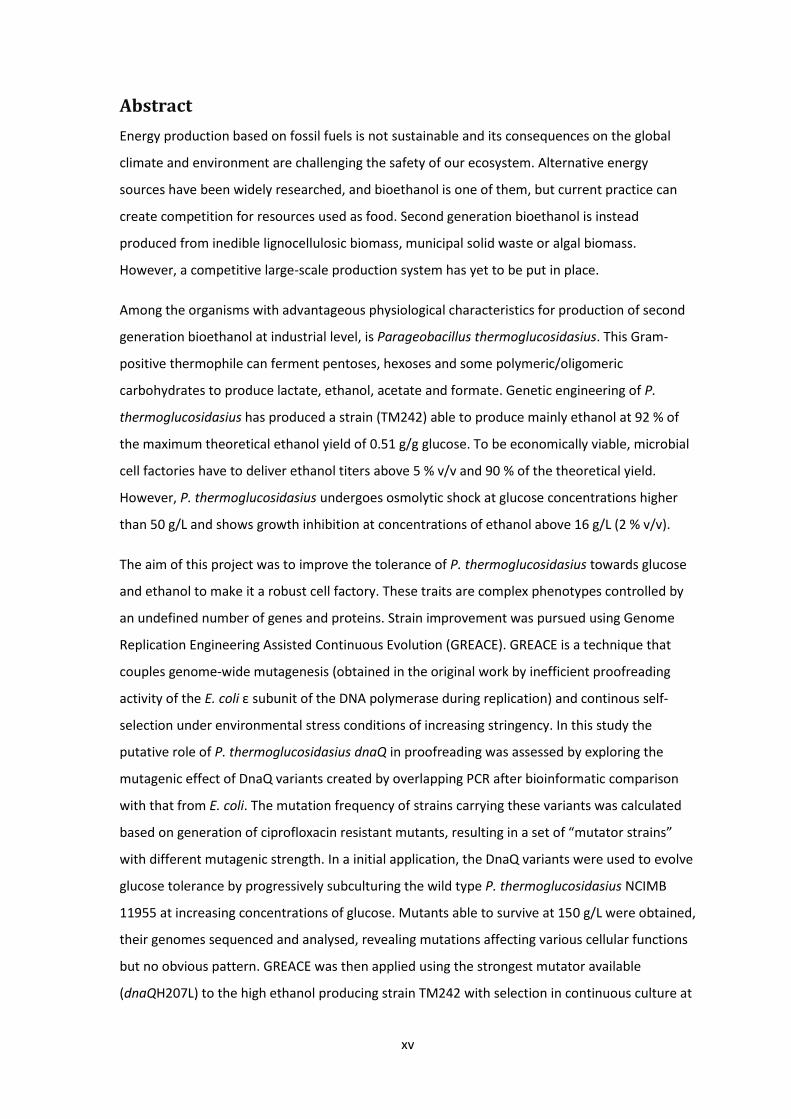
Abstract
Energy production based on fossil fuels is not sustainable and its consequences on the global
climate and environment are challenging the safety of our ecosystem. Alternative energy
sources have been widely researched, and bioethanol is one of them, but current practice can
create competition for resources used as food. Second generation bioethanol is instead
produced from inedible lignocellulosic biomass, municipal solid waste or algal biomass.
However, a competitive large-scale production system has yet to be put in place.
Among the organisms with advantageous physiological characteristics for production of second
generation bioethanol at industrial level, is Parageobacillus thermoglucosidasius. This Gram-
positive thermophile can ferment pentoses, hexoses and some polymeric/oligomeric
carbohydrates to produce lactate, ethanol, acetate and formate. Genetic engineering of P.
thermoglucosidasius has produced a strain (TM242) able to produce mainly ethanol at 92 % of
the maximum theoretical ethanol yield of 0.51 g/g glucose. To be economically viable, microbial
cell factories have to deliver ethanol titers above 5 % v/v and 90 % of the theoretical yield.
However, P. thermoglucosidasius undergoes osmolytic shock at glucose concentrations higher
than 50 g/L and shows growth inhibition at concentrations of ethanol above 16 g/L (2 % v/v).
The aim of this project was to improve the tolerance of P. thermoglucosidasius towards glucose
and ethanol to make it a robust cell factory. These traits are complex phenotypes controlled by
an undefined number of genes and proteins. Strain improvement was pursued using Genome
Replication Engineering Assisted Continuous Evolution (GREACE). GREACE is a technique that
couples genome-wide mutagenesis (obtained in the original work by inefficient proofreading
activity of the E. coli ε subunit of the DNA polymerase during replication) and continous self-
selection under environmental stress conditions of increasing stringency. In this study the
putative role of P. thermoglucosidasius dnaQ in proofreading was assessed by exploring the
mutagenic effect of DnaQ variants created by overlapping PCR after bioinformatic comparison
with that from E. coli. The mutation frequency of strains carrying these variants was calculated
based on generation of ciprofloxacin resistant mutants, resulting in a set of “mutator strains”
with different mutagenic strength. In a initial application, the DnaQ variants were used to evolve
glucose tolerance by progressively subculturing the wild type P. thermoglucosidasius NCIMB
11955 at increasing concentrations of glucose. Mutants able to survive at 150 g/L were obtained,
their genomes sequenced and analysed, revealing mutations affecting various cellular functions
but no obvious pattern. GREACE was then applied using the strongest mutator available
(dnaQH207L) to the high ethanol producing strain TM242 with selection in continuous culture at

xvi
increasing concentrations of ethanol. This produced strains able to tolerate 26.5 g/L (3.36 % v/v)
ethanol. Isolates of key bioreactor samples were tested in a high-throughput screen to confirm
the phenotype and their genomes were sequenced. Among the numerous mutations observed
contributing to survival in high ethanol concentration, the most relevant ones were those
relating to acetaldehyde detoxification.
xvii
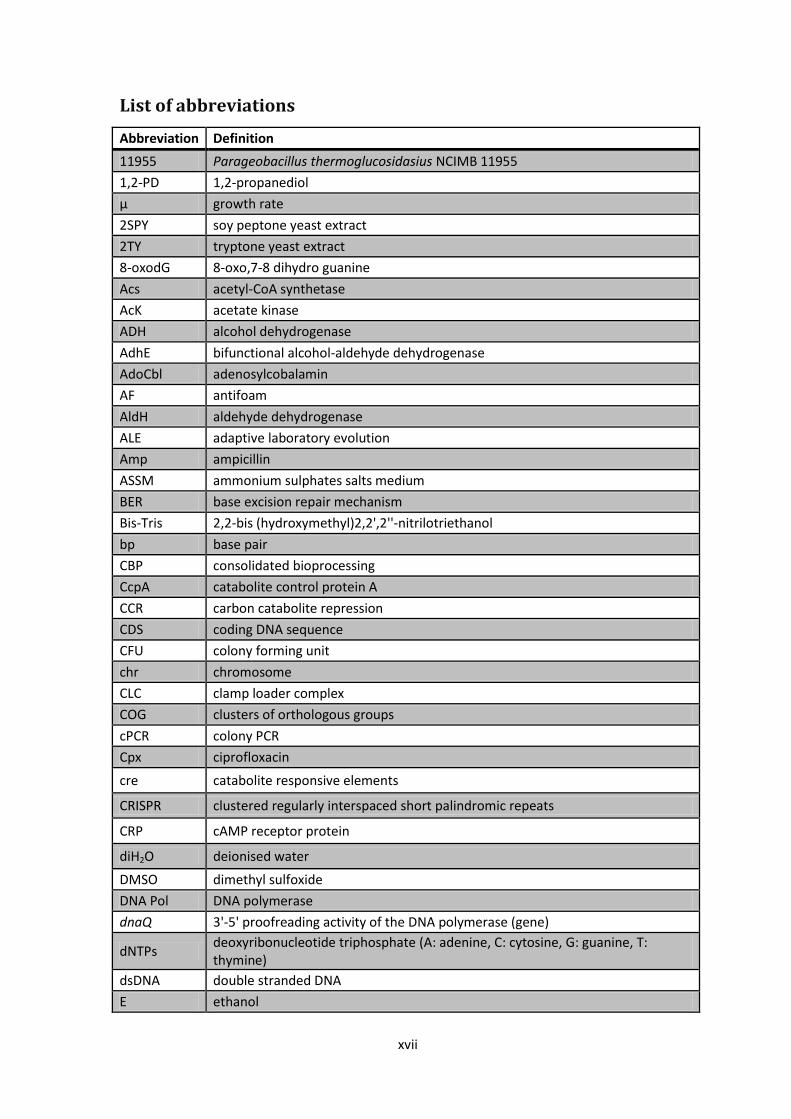
List of abbreviations
Abbreviation Definition
11955 Parageobacillus thermoglucosidasius NCIMB 11955
1,2-PD 1,2-propanediol
µ growth rate
2SPY soy peptone yeast extract
2TY tryptone yeast extract
8-oxodG 8-oxo,7-8 dihydro guanine
Acs acetyl-CoA synthetase
AcK acetate kinase
ADH alcohol dehydrogenase
AdhE bifunctional alcohol-aldehyde dehydrogenase
AdoCbl adenosylcobalamin
AF antifoam
AldH aldehyde dehydrogenase
ALE adaptive laboratory evolution
Amp ampicillin
ASSM ammonium sulphates salts medium
BER base excision repair mechanism
Bis-Tris 2,2-bis (hydroxymethyl)2,2',2''-nitrilotriethanol
bp base pair
CBP consolidated bioprocessing
CcpA catabolite control protein A
CCR carbon catabolite repression
CDS coding DNA sequence
CFU colony forming unit
chr chromosome
CLC clamp loader complex
COG clusters of orthologous groups
cPCR colony PCR
Cpx ciprofloxacin
cre catabolite responsive elements
CRISPR clustered regularly interspaced short palindromic repeats
CRP cAMP receptor protein
diH2O deionised water
DMSO dimethyl sulfoxide
DNA Pol DNA polymerase
dnaQ 3'-5' proofreading activity of the DNA polymerase (gene)
dNTPs deoxyribonucleotide triphosphate (A: adenine, C: cytosine, G: guanine, T: thymine)
dsDNA double stranded DNA
E ethanol
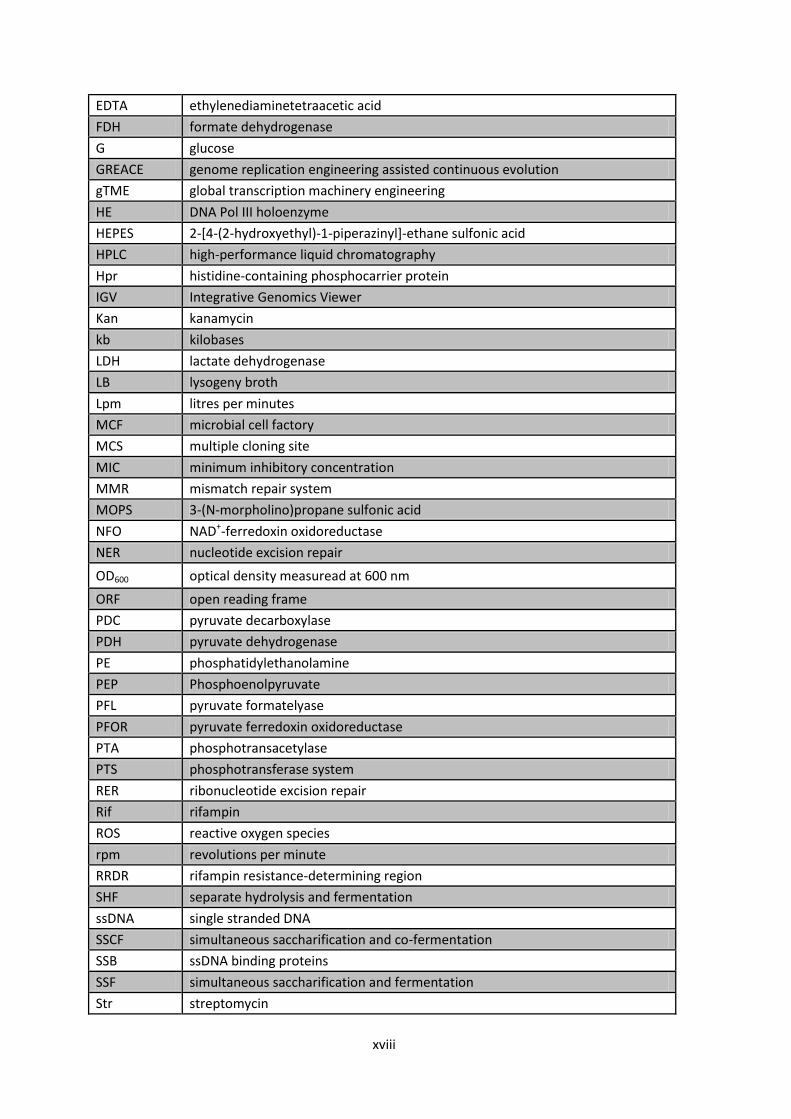
xviii
EDTA ethylenediaminetetraacetic acid
FDH formate dehydrogenase
G glucose
GREACE genome replication engineering assisted continuous evolution
gTME global transcription machinery engineering
HE DNA Pol III holoenzyme
HEPES 2-[4-(2-hydroxyethyl)-1-piperazinyl]-ethane sulfonic acid
HPLC high-performance liquid chromatography
Hpr histidine-containing phosphocarrier protein
IGV Integrative Genomics Viewer
Kan kanamycin
kb kilobases
LDH lactate dehydrogenase
LB lysogeny broth
Lpm litres per minutes
MCF microbial cell factory
MCS multiple cloning site
MIC minimum inhibitory concentration
MMR mismatch repair system
MOPS 3-(N-morpholino)propane sulfonic acid
NFO NAD+-ferredoxin oxidoreductase
NER nucleotide excision repair
OD600 optical density measuread at 600 nm
ORF open reading frame
PDC pyruvate decarboxylase
PDH pyruvate dehydrogenase
PE phosphatidylethanolamine
PEP Phosphoenolpyruvate
PFL pyruvate formatelyase
PFOR pyruvate ferredoxin oxidoreductase
PTA phosphotransacetylase
PTS phosphotransferase system
RER ribonucleotide excision repair
Rif rifampin
ROS reactive oxygen species
rpm revolutions per minute
RRDR rifampin resistance-determining region
SHF separate hydrolysis and fermentation
ssDNA single stranded DNA
SSCF simultaneous saccharification and co-fermentation
SSB ssDNA binding proteins
SSF simultaneous saccharification and fermentation
Str streptomycin
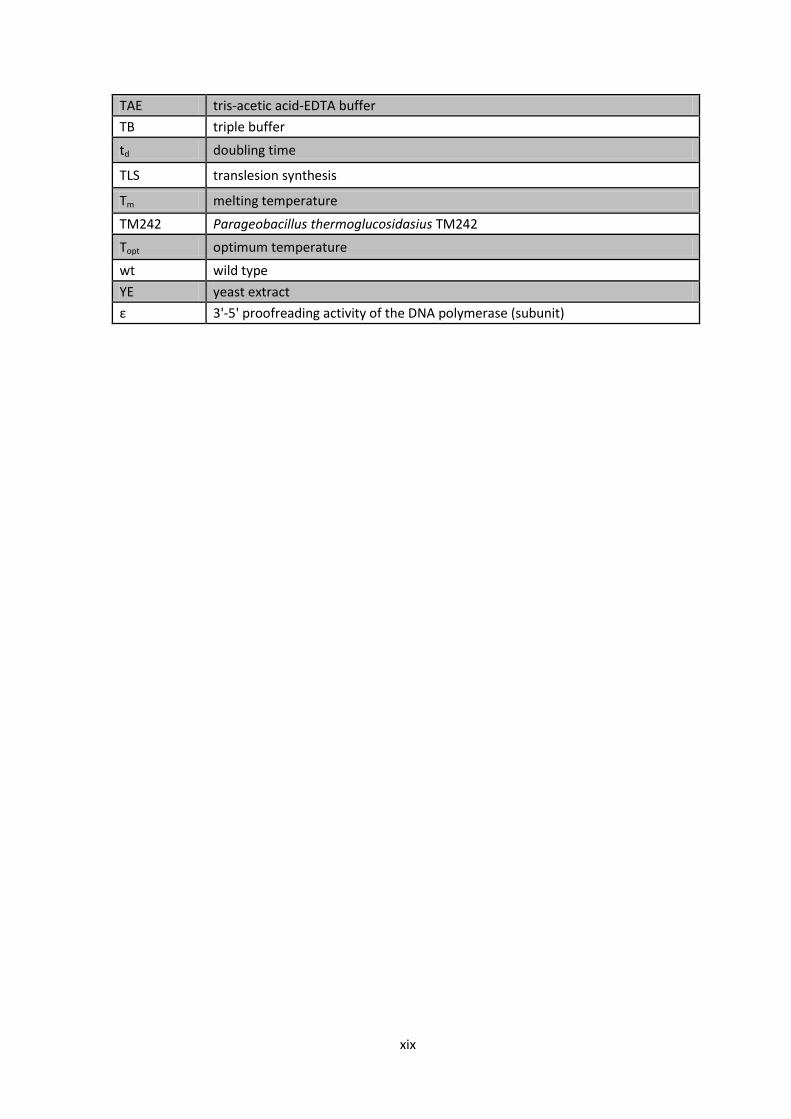
xix
TAE tris-acetic acid-EDTA buffer
TB triple buffer
td doubling time
TLS translesion synthesis
Tm melting temperature
TM242 Parageobacillus thermoglucosidasius TM242
Topt optimum temperature
wt wild type
YE yeast extract
ε 3'-5' proofreading activity of the DNA polymerase (subunit)


1
Chapter 1
Introduction
1.1 Second generation bioethanol production Increasing energy demand and the need to decrease our dependence on fossil fuels has
considerably enhanced research on alternative energy sources (Baeyens et al., 2015). Moreover,
reports on environment pollution levels, awareness of climate change crisis and national and
international agreements on plans to reduce greenhouse gas emissions have highlighted the
necessity to shift towards sustainable energy production as soon as possible (IPCC, 2014; Fatma
et al., 2018). In 2009, the European Commission established that at least 10 % of transportation
fuel in all EU countries had to come from renewable sources before 2020, this committment was
renovated and the percentage has been increased to 14 % by 2030 (Directive 2009/28/EC and
Directive (EU) 2018/2001). In 2015, the United Nations’ Framework Convention on Climate
Change ratified the Paris agreement on the collective efforts to reduce greenhouse gas emission
to hold the world temperature increase of maximum 1.5°C above pre-industrial level (UNFCCC,
2015). Renewable energy comes from transformation of energy enclosed in natural elements,
events or processes, such as wind, sun, waves or carbon fixation into organic materials. Biofuels
production from biomass fermentation have the potential to sustain the energy demand while
being eco-friendly, reduce greenhouse gasses emissions and strengthen energy security (Fatma
et al., 2018). Common biofuels are bioethanol, biogas, biodiesel, butanol and hydrogen.
Currently, bioethanol from plant biomass fermentation is the primary biofuel produced
worldwide (Liao et al., 2016). In 2018 United States produced 16,061 million gallons (mil. gal.) of
bioethanol, while Brazil produced 7,920 mil. gal., corresponding to 56 % and 28 % of total world
production, respectively (Renewable Fuels Association outlook, Koehler et al., 2019).
Ethanol is a colourless alcohol produced mainly for transportation and to a much lesser extent
for the chemical industry. Ethanol as a fuel can be used in standard spark-ignition engines in
blends with gasoline (i.e. pure ethanol is unsuitable for cold-start below 20°C) or in vehicles
equipped with ethanol-only engines, although its energy content is a third less than gasoline
(Baeyens et al., 2015). Ethanol contains oxygen, therefore its combustion is more efficient than
gasoline’s and does not produce significant quantities of toxic compounds (Krylova et al., 2008;
Bhatia et al., 2012). Combustion of bioethanol is technically carbon-neutral, because it emits
only the carbon dioxide that was fixed by photosynthesis of plants used as substrate for ethanol
production. However, by including the CO2 emissions from farming and manufacturing
2
processes, the net carbon footprint of bioethanol production is not zero (Liao et al., 2016) unless
the CO2 released during fermentation is captured.
Currently, ethanol production is mostly based on fermentation of starch- or sugar-rich food
crops, such as corn in the USA, sugar cane in Brazil, wheat, sugar beet, rye and barley in Europe
(Baeyens et al., 2015). The most common microbes used for plant biomass fermentation are
Saccharomyces cerevisiae and Zymomonas mobilis (Liao et al., 2016; Favaro et al., 2019). First
generation bioethanol production has the potential to create competition between food and
biofuel industries. It has been argued that biofuel production undermines food security and
increases food prices, while having a large impact on biodiversity of arable land and water
consumption (Hertel et al., 2013). Second generation biofuel production is based on
fermentation of lignocellulosic biomass, municipal solid waste or algal biomass, the former being
the more representative (Fatma et al., 2018). The most available sources of lignocellulose are
non-edible plants, food crops waste materials and forestry residues (e.g. miscanthus,
switchgrass, rice and wheat straw, leaves, wood chips, sawdust, etc.).
Lignocellulose comprises the wall of plant cells and gives protection, structural strength and has
a complex organisation: it is composed of microfibrils of cellulose surrounded by hemicelluloses,
lignin and dispersed pectic polysaccharides. The specific proportions of lignocellulose
components vary depending on the origin. In feedstock lignocelluloses, almost half of the dry
weight is cellulose, less than a third is hemicelluloses, the rest is lignin with small amounts of
other substances such as extractives and minerals (Singh Nee Nigam and Pandey, 2009).
Cellulose is the core of microfibrils and it is composed of long chains of β-1,4-linked glucose
molecules. Since adjacent glucose molecules are rotated by 180°, the repeating unit is a
disaccharide called cellobiose. Cellulose chains are stacked together by hydrogen bonds to form
an impenetrable insoluble crystalline structure that can be attacked by endoglucanases only in
irregularly interspersed amorphous regions. Sheets of parallel microfibrils are organised in non-
directional layers and are immersed in a matrix of hemicelluloses, lignin and pectines (Béguin
and Aubert, 1994). Hemicelluloses are heterogenous, they are composed of short linear or
branched polymers of various pentoses (xylose and arabinose), hexoses (mannose, glucose and
galactose) and sugar acids (glucoronic acid, galacturonic acid) (Figure 1) (Bhatia et al., 2012).
Xylans are the most abundant hemicelluloses (Zabed et al., 2016), they are composed of a xylose
backbone linked by β 1,4 glycosidic bonds; xylose can constitute up to 60 % of hemicelluloses (Su
et al., 2017). Xylans are covalently bound with hydrophobic lignin (Du et al., 2013), a polymer of
three aromatic molecules (i.e. sinapyl alcohol, p-coumarylalcohol and coniferyl alcohol) of
extremely diverse organisation that make the cell wall hard and recalcitrant to degradation

3
(Bhatia et al., 2012; Kumar et al., 2016). Pectins are polymers of galacturonic acid with variable
carbohydrates branches responsible for cell-cell cohesion (Singh Nee Nigam and Pandey, 2009).
Overall, the complex structure described above naturally impedes accessibility to carbohydrates
of lignocelluloses and to plant cells, therefore to allow availability of fermentable sugars, it has
to be broken up (Branco et al., 2019).
Figure 1 - Cellulose (A) and example of xylan (B) structures and degradative enzymes involved in depolymerisation. (Adapted from Dutta et al., 2014).
Pre-treatment technologies are either biological (using fungal enzymes), mechanical (grinding,
chipping and milling), physical (steam-explosion) or chemical (using acids, alkali or other
solvents) and they can be combined for the best results (Xu and Huang, 2014; Fatma et al.,
2018). During pre-treatment, lignocellulose microfibrils are separated, carbohydrate polymers
are shortened and made available for enzymatic hydrolysis (Khare et al., 2015). This process is
called saccharification and its efficiency depends on the presence of enzymes able to
monomerise the pre-treated biomass. Enzymes like endo-β-1,4-glucanases (cellulases that break
the cellulose backbone in amorphous regions), exo-β-1,4-glucanases (cellobiohydrolases that
hydrolyse glycosidic bonds to form cellobiose), β-1,4-glucosidase (that monomerise cellobiose in
glucose units), endo-β-1,4-xylanases, α-arabinofuranosidases, α-galactosidases, endo-β-
mannanases, glucomannanases, β-mannosidases, α-glucoronidases, β-xylosidases, α-
rhamnosidases, acetylxylanesterases etc. (that break hemicellulose backbones and branches) are
4
either produced in situ by micro-organisms or externally added (Turner et al., 2007; Scheller and
Ulvskov, 2010; Jarle Horn et al., 2012; Jiajun Hu et al., 2017; Vermaas et al., 2019).
After saccharification with a commercial “cellulose” cocktail, monomeric carbohydrates are in a
mixture of hexoses and pentoses; frequently other short oligosaccharides are also present.
These are fermented by selected micro-organisms to produce ethanol, which is then recovered
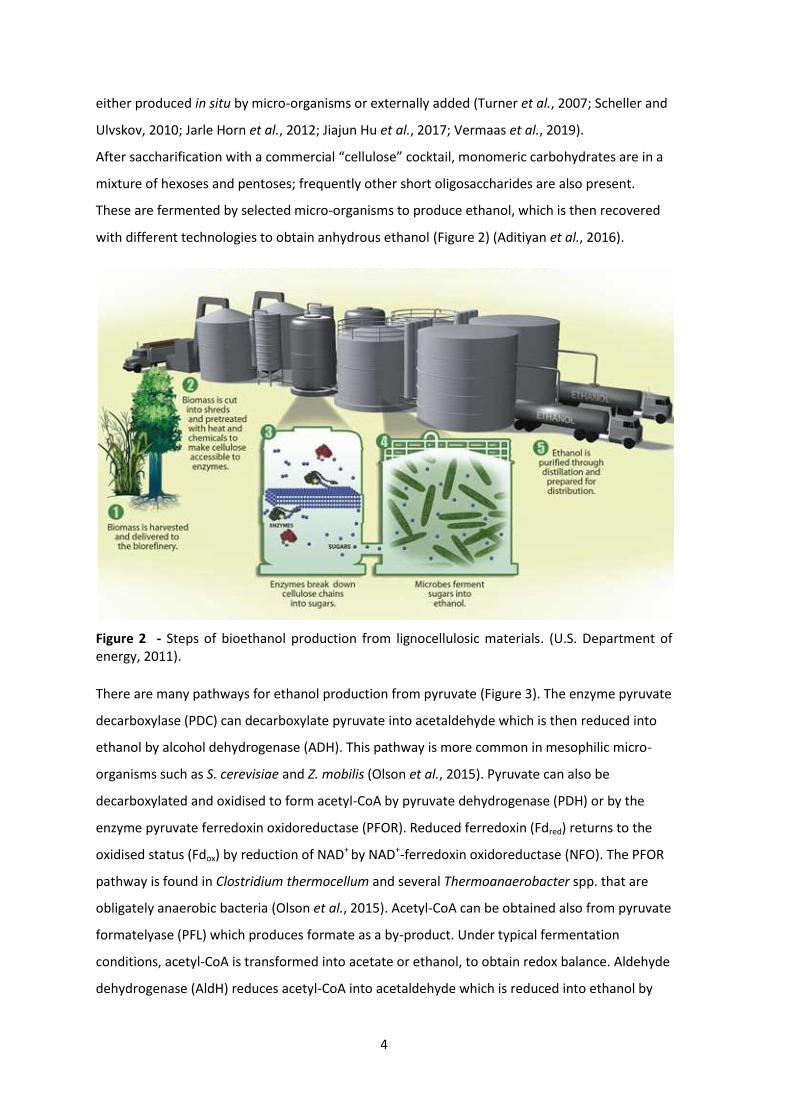
with different technologies to obtain anhydrous ethanol (Figure 2) (Aditiyan et al., 2016).
Figure 2 - Steps of bioethanol production from lignocellulosic materials. (U.S. Department of energy, 2011).
There are many pathways for ethanol production from pyruvate (Figure 3). The enzyme pyruvate
decarboxylase (PDC) can decarboxylate pyruvate into acetaldehyde which is then reduced into
ethanol by alcohol dehydrogenase (ADH). This pathway is more common in mesophilic micro-
organisms such as S. cerevisiae and Z. mobilis (Olson et al., 2015). Pyruvate can also be
decarboxylated and oxidised to form acetyl-CoA by pyruvate dehydrogenase (PDH) or by the
enzyme pyruvate ferredoxin oxidoreductase (PFOR). Reduced ferredoxin (Fdred) returns to the
oxidised status (Fdox) by reduction of NAD+ by NAD+-ferredoxin oxidoreductase (NFO). The PFOR
pathway is found in Clostridium thermocellum and several Thermoanaerobacter spp. that are
obligately anaerobic bacteria (Olson et al., 2015). Acetyl-CoA can be obtained also from pyruvate
formatelyase (PFL) which produces formate as a by-product. Under typical fermentation
conditions, acetyl-CoA is transformed into acetate or ethanol, to obtain redox balance. Aldehyde
dehydrogenase (AldH) reduces acetyl-CoA into acetaldehyde which is reduced into ethanol by
5
ADH oxidising 2 NADH in total. These reactions can also be carried out by the bifunctional
alcohol and aldehyde dehydrogenase (AdhE) (Extance et al., 2016). AdhE is present in P.
thermoglucosidasius and several anaerobic (facultative and obligate) thermophiles. Inactivation
of AdhE suppresses ethanol production in Thermoanaerobacter mathranii, C. thermocellum, T.
saccharolyticum and P. thermoglucosidasius (Lo et al., 2015; Olson et al., 2015).
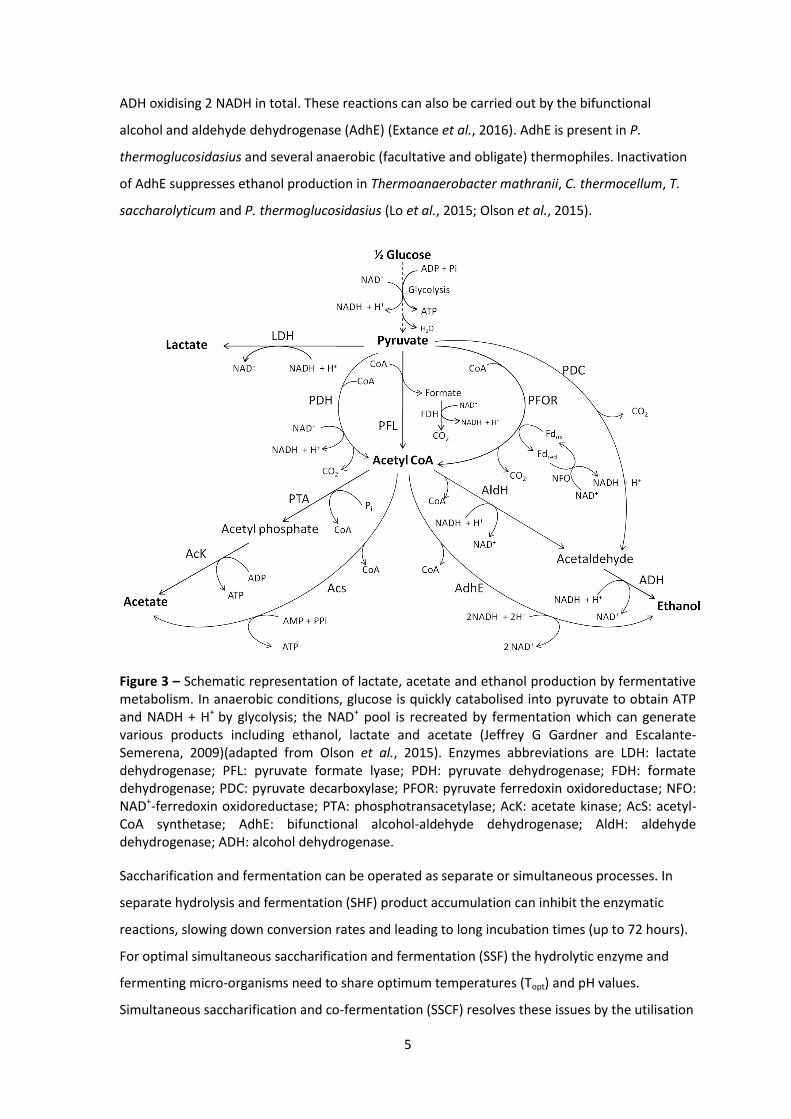
Figure 3 – Schematic representation of lactate, acetate and ethanol production by fermentative metabolism. In anaerobic conditions, glucose is quickly catabolised into pyruvate to obtain ATP and NADH + H+ by glycolysis; the NAD+ pool is recreated by fermentation which can generate various products including ethanol, lactate and acetate (Jeffrey G Gardner and Escalante-Semerena, 2009)(adapted from Olson et al., 2015). Enzymes abbreviations are LDH: lactate dehydrogenase; PFL: pyruvate formate lyase; PDH: pyruvate dehydrogenase; FDH: formate dehydrogenase; PDC: pyruvate decarboxylase; PFOR: pyruvate ferredoxin oxidoreductase; NFO: NAD+-ferredoxin oxidoreductase; PTA: phosphotransacetylase; AcK: acetate kinase; AcS: acetyl-CoA synthetase; AdhE: bifunctional alcohol-aldehyde dehydrogenase; AldH: aldehyde dehydrogenase; ADH: alcohol dehydrogenase.
Saccharification and fermentation can be operated as separate or simultaneous processes. In
separate hydrolysis and fermentation (SHF) product accumulation can inhibit the enzymatic
reactions, slowing down conversion rates and leading to long incubation times (up to 72 hours).
For optimal simultaneous saccharification and fermentation (SSF) the hydrolytic enzyme and
fermenting micro-organisms need to share optimum temperatures (Topt) and pH values.
Simultaneous saccharification and co-fermentation (SSCF) resolves these issues by the utilisation
6
of micro-organisms that produce enzymes able to fully hydrolyse pre-treated lignocellulose and
simultaneously ferment carbohydrates. In principle, consolidated bioprocessing (CBP) is the ideal
processes integration of lignocellulose break up, cellulose and hemicellulose depolymerisation
and saccharification followed by fermentation, all carried out by the same micro-organism
(Devarapalli and Atiyeh, 2015). Such ‘super-bugs’ do not exist and are often difficult to obtain
solely by genetic engineering of suitable microbial platforms. Consortia of micro-organisms with
complementary characteristics for fermentation of lignocellulosic biomass have been
investigated, although the inaccuracy of modelling due to poor knowledge and control over
species interactions is a high risk in large-scale production processes and impedes broad
diffusion of this approach (Peng et al., 2016; Puentes-Téllez and Falcao Salles, 2018).
Currently SSF with mesophilic yeasts and bacteria is the most cost-effective approach, but it is
still considered inefficient (Taherzadeh and Karimi, 2007). S. cerevisiae and Z. mobilis are not
naturally able to ferment C5 sugars (xylose and arabinose) nor cellobiose and xylobiose. Z.
mobilis has a higher fermentation rate than S. cerevisiae and produces up to 97 % of theoretical
ethanol yield (versus 90-93 % for S. cerevisiae) (Dmytruk et al., 2017), however it is strongly
inhibited by pre-treatment by-products such as acetate and lignocellulose-derived phenols
(Baeyens et al., 2015). Several strains of S. cerevisiae and Z. mobilis have been engineered to
express heterologous enzymes for xylose catabolism, although these metabolic perturbation
slowed down glucose consumption and decreased ethanol yield in large-scale production (Zhang
et al., 1995; Colin et al., 2011; Ratnaparkhe et al., 2015; Favaro et al., 2019). S. cerevisiae grows
below 35°C, while the Topt of cellulases and xylanase is between 35°C and 70°C (Farinas et al.,
2010). Therefore, saccharification is inefficient at mesophilic temperatures and large quantities
of cellulolytic enzymes are usually needed. The cost of enzyme cocktails is the major bottleneck
in second generation bioethanol production (Koppram et al., 2014). Overall, first generation
bioethanol production is still more convenient since physical pre-treatment of starch-rich
biomass is limited to milling, while saccharification is achieved with only two enzymes (α-
amylase and glucoamylase) or sulphuric acid (Baeyens et al., 2015) and glucose monosaccharides
are immediately available for fermentation.
Second generation bioethanol production is expensive and there is no single organism that is the
obvious bioprocess candidate. Any strategy that cuts production costs could make a significant
contribution to the development of commercial sustainable second generation processes. SSCF
and CBP are the ideal goals for inexpensive second generation bioethanol production, although
SSCF is more achievable than CBP (Su et al., 2017).
7
1.2 Thermophiles as microbial cell factories A range of different micro-organisms have been considered as suitable cell platforms for
bioethanol production by SSF and ultimately for SSCF, not only for their ability to hydrolyse pre-
treated lignocellulose by naturally expressing enzymes for (hemi)cellulose saccharification, but
also for their intrinsic physiological characteristics that diminish processing costs (Taylor et al.,
2009). Desirable characteristics of biomass fermenting micro-organisms are wide metabolic
versatility, tolerance to pre-treatments by-products or extreme pH/temperature conditions, high
growth rate, high substrate (high gravity)/end product concentration tolerance, a simple
metabolic network that channels cell energy towards one product of interest and finally
availability of molecular tools for genetic engineering (Su et al., 2017). Other desirable traits are
a low biomass production (compared to product formation) and the possibility to recycle cells.
To be economically viable, microbial cell factories have to deliver ethanol titers above 5 % v/v
and 90 % of the theoretical yield (Scully and Orlygsson, 2015), calculated on the stoichiometry of
alcoholic fermentation of glucose (C6H12O6 → 2 C2H5OH + 2 CO2). One mole of glucose gives two
moles of ethanol, the ratio 2:1 corresponds to (2 x 46.07 g/mol) / (180.15 g/mol) = 0.51 g of
ethanol per g of glucose, therefore 90 % of theoretical yield is 0.46 g of ethanol per gram of
consumed glucose.
Extensive research on thermophilic micro-organisms has been done to select suitable species for
bio-production of fuels and other chemicals (Fernández-Cabezón et al., 2019). Thermophiles are
micro-organisms that grow at a temperature range between 50°C and 80°C, they are more
robust to temperature and pH fluctuations and are catabolically versatile (Zeikus, 1979). Optimal
growth temperatures are similar to those used for enzymatic pre-treatment, thus reducing
substrate cooling costs (Cripps et al., 2009), while growth at 55-60oC removes the need to
remove the metabolic heat produced during the fermentation process. At high temperatures the
low solubility of oxygen ensures that facultative organisms start to ferment at low cell densities
without the provision of a low oxygen environment and contamination by common mesophilic
contaminants such as lactic acid bacteria is avoided. In addition, medium viscosity reduces with
increasing temperature and substrate solubility increases, both of which can improve process
performance. Finally, increasing temperature increases the vapour pressure of volatile solvents
making them easier to remove in the gas stream. Given that the boiling point of ethanol is
78.2oC, at temperatures above 50oC there is sufficient ethanol in the vapour phase to allow it to
be removed under mild vacuum or via gas stripping (Turner et al., 2007; Taylor et al., 2009),
facilitating continuous removal and, hence, continuous process operation.
Some species of the genera Clostridium, Thermoanaerobacterium, Thermoanaerobacter,
Caldanaerobacter, Parageobacillus and Geobacillus, have been studied and employed in
8
industry for efficient bioethanol production from lignocellulosic materials. Currently C.
thermocellum is the thermophilic micro-organism most studied and employed for second
generation bioethanol production (Ellis et al., 2012). However these microbes produce a mixture
of acids that decrease total ethanol yield, they share very low tolerance towards end-products,
and for some of them (i.e. Clostridium spp.) strict anaerobiosis can be a problem at large-scale
levels of production (Su et al., 2017).
1.3 Parageobacillus thermoglucosidasius Parageobacillus thermoglucosidasius is a rod-shaped, motile, sporogenic, thermophilic and
neutrophilic Gram-positive bacterium. It is able to survive in aerobic and microaerobic
conditions, at a temperature range of 42°C-69°C, but its optimum growth temperature is 60°C-
61°C (Suzuki et al., 1983). Despite these growth limits, spores of Parageobacillus species are
widely distributed even in cooler environments (Suzuki, 2018). The generation time is 22-29
minutes in liquid culture in a rich medium, similar to Escherichia coli (Suzuki et al., 1983;
Coorevits et al., 2012). Originally named Bacillus thermoglucosidasius (Suzuki et al., 1983), 16S
rRNA analysis assigned this bacterium to the genus Geobacillus (Nazina et al., 2001), but recN
sequencing and phylogenomic analysis finally repositioned it within the genus Parageobacillus of
lower GC content (42.1 - 44.4 %) (Aliyu et al., 2016; Coorevits et al., 2012). The species name of
this bacterium derives from the characteristic high expression of the enzyme exo-oligo-α-1,6-
glucosidase, also known as isomaltase, which hydrolases α-1,6-glycosidic bonds of isomaltose
and dextrins created from starch by α-amylase to produce glucose (Watanabe et al., 1989;
Suzuki et al., 1983). Coorevits et al. (2012) suggested changing the name of the species to
thermoglucosidans but this has not been collectively adopted and both names are found in the
literature. Under microaerobic conditions the wild type (wt) P. thermoglucosidasius NCIMB
11955 ferments hexoses, pentoses and cellobiose to a mixture of lactic acid, ethanol, formate
and acetate. A culture of P. thermoglucosidasius NCIMB 11955 in 30 g/L of glucose grown in
fermentative conditions produces mainly lactic acid (210 mM), followed by ethanol (69 mM),
acetic acid and formic acid (30 mM and 26 mM, respectively) (Cripps et al., 2009). Under low
oxygen availability P. thermoglucosidasius regenerates NAD+ from NADH+H+ produced in
glycolysis mainly by reducing pyruvate into lactate. Ethanol is produced from acetyl-CoA using a
bifunctional aldehyde-alcohol dehydrogenase (AdhE) encoded by adhE. Seven more genes
encoding alcohol dehydrogenases are found in P. thermoglucosidasius, however ethanol
production is abolished only by adhE knock out (Extance, 2012). Naturally, ethanol is not the
most abundant fermentation product and is only produced at low redox potential. Nevertheless
P. thermoglucosidasius has had industrial relevance in bioethanol production.
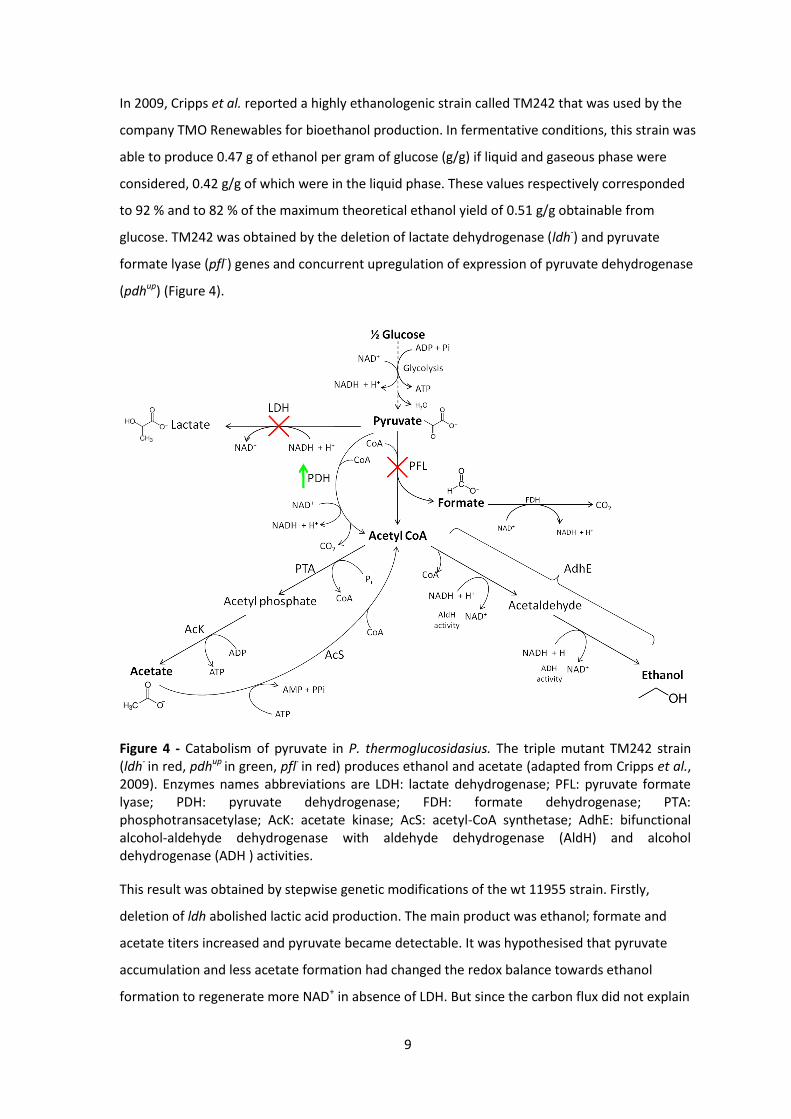
9
In 2009, Cripps et al. reported a highly ethanologenic strain called TM242 that was used by the
company TMO Renewables for bioethanol production. In fermentative conditions, this strain was
able to produce 0.47 g of ethanol per gram of glucose (g/g) if liquid and gaseous phase were
considered, 0.42 g/g of which were in the liquid phase. These values respectively corresponded
to 92 % and to 82 % of the maximum theoretical ethanol yield of 0.51 g/g obtainable from
glucose. TM242 was obtained by the deletion of lactate dehydrogenase (ldh-) and pyruvate
formate lyase (pfl-) genes and concurrent upregulation of expression of pyruvate dehydrogenase
(pdhup) (Figure 4).
Figure 4 - Catabolism of pyruvate in P. thermoglucosidasius. The triple mutant TM242 strain (ldh- in red, pdhup in green, pfl- in red) produces ethanol and acetate (adapted from Cripps et al., 2009). Enzymes names abbreviations are LDH: lactate dehydrogenase; PFL: pyruvate formate lyase; PDH: pyruvate dehydrogenase; FDH: formate dehydrogenase; PTA: phosphotransacetylase; AcK: acetate kinase; AcS: acetyl-CoA synthetase; AdhE: bifunctional alcohol-aldehyde dehydrogenase with aldehyde dehydrogenase (AldH) and alcohol dehydrogenase (ADH ) activities.
This result was obtained by stepwise genetic modifications of the wt 11955 strain. Firstly,
deletion of ldh abolished lactic acid production. The main product was ethanol; formate and
acetate titers increased and pyruvate became detectable. It was hypothesised that pyruvate
accumulation and less acetate formation had changed the redox balance towards ethanol
formation to regenerate more NAD+ in absence of LDH. But since the carbon flux did not explain
10
why formate was found to be less concentrated than ethanol and acetate together, it was
hypothesised that a pyruvate dehydrogenase was also used by the cell to produce acetyl-coA
from pyruvate. In anaerobic conditions, PDH activity is usually inhibited by negative feedback
imposed by high NADH concentrations (Kim et al., 2008), however evidences showed that in
Parageobacillus thermoglucosidasius a weak PDH activity was appreciable. Therefore, the
second step was the upregulation of pdh expression with the anaerobically inducible promoter
of a lactate dehydrogenase from Geobacillus stearothermophilus NCA1503. Lastly, the
production of formate was removed by knocking out pfl. The phenotype of the triple mutant
ldh-, pdhup, pfl- in fermentative conditions showed that the majority of pyruvate produced in
glycolysis was transformed into ethanol, but small quantities of acetate could still be detected.
Removal of the activities of phosphotransacetylase (PTA) and acetate kinase (AcK) for complete
abolition of acetate formation as a co-product was attempted by Dr C. Hills in his PhD project
(Hills, 2014), however his results suggested that TM242 carried unknown alternative acetate
synthesis pathways and complete abolition of acetate formation as a by-product was
complicated to achieve.
In the Cripps et al. (2009) study, high ethanol yields were obtained on glucose (82 %), on
cellobiose (92 %) and on xylose (68 %). Co-fermentation of hexoses and pentoses suggested that
TM242 was not under the effect of catabolite repression. Ethanol productivity by strain TM242
was high on glucose and even higher on cellobiose (2.85 g/L/h and 3.2 g/L/h, respectively).
These characteristics indicated that SSF processes could be more efficient with P.
thermoglucosidasius TM242 than with S. cerevisiae (Cripps et al., 2009).
However, despite the apparent industrially relevant advantages, interest in P.
thermoglucosidasius TM242 as a valuable microbial cell factory for second generation bioethanol
production has dwindled, partly due to the insolvency of TMO Renewables. An intrinsic low
tolerance to high glucose concentrations and high ethanol concentrations, together with low
resistance to pre-treatment by-products dramatically affect cost-effective production by TM242.
Although TMO Renewables operated a pilot demonstration unit, large-scale high gravity
productions with P. thermoglucosidasius TM242 have never been ventured, and currently
mesophilic micro-organisms and other thermophiles are still preferred.
1.4 Inhibition by high concentration of initial substrate and
fermentation end-products
1.4.1 Glucose inhibition
High initial sugar concentrations can cause osmotic shock to the fermenting micro-organisms
even in SSCF. S. cerevisiae is able to tolerate up to 400 g/L of glucose and this represents a clear
11
advantage in high gravity fermentations (Watanabe et al., 2010). In hypertonic solutions, cells
lose water, causing intracellular metabolite imbalances that can result in cell death. All cells
counteract hyperosmosis by internally accumulating osmolytes; S. cerevisiae and the majority of
Eukaryotes utilise glycerol which is produced following the activation of the mitogen-activated
protein kinase (MAPK) pathway called high osmolarity glycerol (Hohmann, 2009). Most microbes
do not possess aquaporins to pump water in or out of their cytoplasm specifically to control
osmotic pressure (Bremer and Krämer, 2019). E. coli has one, AqpZ (Calamita et al., 1995), but it
is unclear whether it takes part in osmolarity regulation (Tanghe et al., 2006). Other strategies
are adopted to maintain physiological turgor. Most bacteria circumvent lethal osmolarity
fluctuations caused by environmental changes by the uptake/synthesis or conversely
release/degradation of water-soluble organic compounds, these are compatible with the native
physiology and biochemistry of the cell and do not harm their metabolic processes (Kempf and
Bremer, 1998; Csonka, 1989). The so-called ‘compatible solutes’ include amino acids like proline
or glutamate, amino acid derivatives like glycine betaine, proline betaine, carnitine or ectoine,
carbohydrates like sucrose, trehalose, glucosylglycerol or methylamines (Meadows and Wargo,
2015; Kapfhammer et al., 2005; Czech et al., 2018; Wood et al., 2001; Bremer and Krämer, 2019;
Kempf and Bremer, 1998).
In Bacillius subtilis (the model organism for low GC Gram-positive species; Borriss et al., 2018)
osmotic stress (Figure 5) is initially compensated by the intake of K+ ions by unidentified
transporters and unknown counter-ion balance. This happens within less than one hour from
perception of the osmolarity change in the environment (Whatmore and Reed, 1990). The
second response to osmotic stress is much slower, taking up to nine hours for B. subtilis to
synthesise or uptake and accumulate compensatory concentrations of proline in the cytosol
(Whatmore et al., 1990). Proline is the main compatible solute for osmoprotection in B. subtilis,
therefore in a hypertonic environment the catabolism of proline as a nitrogen and carbon source
needs to be repressed. The mechanism of control of this differentiation is unknown (Kempf and
Bremer, 1998). In B. subtilis there are transporters involved in osmoadaptation named OpuA,
OpuB, OpuC, OpuD, OpuE (osmoprotectant uptake proteins) (Hoffmann et al., 2013). OpuA,
OpuB and OpuC are ATPases of the ABC transporter family, the other two are secondary
transporters, OpuD is a proton symporter of the BCCT family (betaine/carnitine/choline
transporter) and OpuE is a sodium/solute symporter (Kapfhammer et al., 2005). The transporter
OpuE promotes the uptake of proline only. The other transporters are employed for the uptake
of other compatible solutes for use as osmoprotectants that B. subtilis cannot synthesise de
novo, like proline betaine (OpuA, OpuC), glycine betaine (OpuA, OpuC and OpuD), choline (OpuB
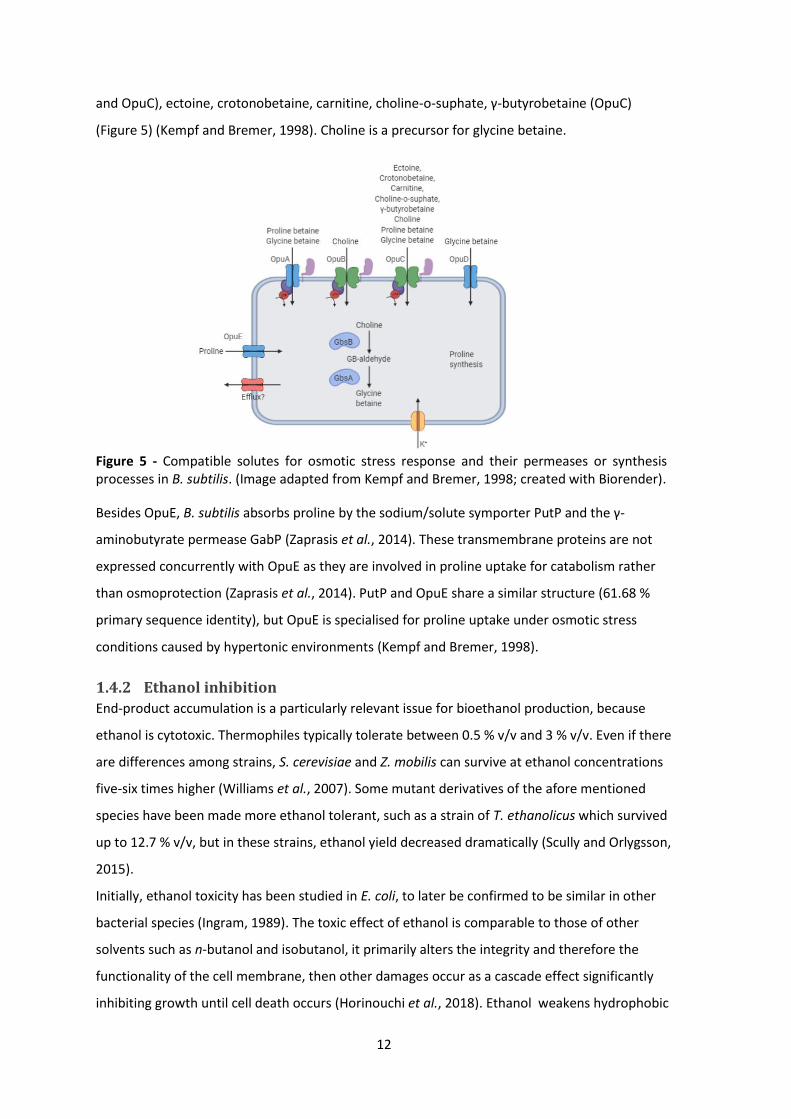
12
and OpuC), ectoine, crotonobetaine, carnitine, choline-o-suphate, γ-butyrobetaine (OpuC)
(Figure 5) (Kempf and Bremer, 1998). Choline is a precursor for glycine betaine.
Figure 5 - Compatible solutes for osmotic stress response and their permeases or synthesis processes in B. subtilis. (Image adapted from Kempf and Bremer, 1998; created with Biorender).
Besides OpuE, B. subtilis absorbs proline by the sodium/solute symporter PutP and the γ-
aminobutyrate permease GabP (Zaprasis et al., 2014). These transmembrane proteins are not
expressed concurrently with OpuE as they are involved in proline uptake for catabolism rather
than osmoprotection (Zaprasis et al., 2014). PutP and OpuE share a similar structure (61.68 %
primary sequence identity), but OpuE is specialised for proline uptake under osmotic stress
conditions caused by hypertonic environments (Kempf and Bremer, 1998).
1.4.2 Ethanol inhibition
End-product accumulation is a particularly relevant issue for bioethanol production, because
ethanol is cytotoxic. Thermophiles typically tolerate between 0.5 % v/v and 3 % v/v. Even if there
are differences among strains, S. cerevisiae and Z. mobilis can survive at ethanol concentrations
five-six times higher (Williams et al., 2007). Some mutant derivatives of the afore mentioned
species have been made more ethanol tolerant, such as a strain of T. ethanolicus which survived
up to 12.7 % v/v, but in these strains, ethanol yield decreased dramatically (Scully and Orlygsson,
2015).
Initially, ethanol toxicity has been studied in E. coli, to later be confirmed to be similar in other
bacterial species (Ingram, 1989). The toxic effect of ethanol is comparable to those of other
solvents such as n-butanol and isobutanol, it primarily alters the integrity and therefore the
functionality of the cell membrane, then other damages occur as a cascade effect significantly
inhibiting growth until cell death occurs (Horinouchi et al., 2018). Ethanol weakens hydrophobic

13
interactions of biological molecules; it is less polar than water, it is permeable across the
membrane and its amphiphilic nature allows it to invade the lipid bilayer of cell membranes
(Ingram, 1976); in the aqueous milieu inside and outside the cell, it replaces water in hydrogen
bonds, it solvates molecules causing dehydration, denaturation of proteins and interference with
the quaternary structure of multi-protein complexes (Ingram, 1989). A study on C. thermocellum
(Herrero et al., 1985) found that glucose-6-phospate and fructose-6-phosphate accumulate in
the wt strain exposed to ethanol, while this phenomenon is not observed in an ethanol adapted
strain. This finding suggested that concentration and/or activity of glycolytic enzymes are
significantly diminished and lead to reduced growth rate; the authors hypothesised that
perturbation of the lipid bilayer by ethanol directly affects these membrane-associated enzymes.
In fact, ethanol increases cell membrane fluidity, it destabilises peptidoglycan cross-linking
(Ingram and Vreeland, 1980), it facilitates ion and polar molecules passage through the
membrane (in particular Mg2+, H+, K+), inducing oxidative stress and altering membrane potential
and therefore energy production (Ingram, 1976; Cartwright, Juroszek and Beavan, 1986; Lovitt et
al., 1988; Cao et al., 2017). These effects seem to be exacerbated by high temperatures, and also
for thermophiles it has been observed that wt strains under ethanol stress decrease their
optimum growth temperature, nevertheless ethanol tolerant strains do not change their Topt
(Herrero and Gomez, 1980). Comparison of an ethanol adapted C. thermocellum strain with the
wild type highlighted a significant decrease in the expression level of cellulosomes and
carbohydrate transporters, while Mg2+ transporters, chemotaxis and signal transduction proteins
were up-regulated, possibly to counteract excessive ion leaks through the cell membrane
(Williams et al., 2007). An overexpression of membrane proteins also counterbalances the
membrane surface availability for free diffusion of charged molecules (Ingram, 1989). In E. coli
and B. subtilis under ethanol stress, the proportion of phosphatidylethanolamine (i.e. the most
represented phospholipid in bacterial membrane) decreases, while a switch towards the
production of anionic phospholipids (cardiolipin and phosphatidylglycerol) is observed (Ingram
and Buttke, 1985; Bohin and Lubochinsky, 1982). In E. coli, intracellular ethanol dramatically
affects transcription and translation accuracy: transcripts are erroneously elongated, ribosomes
stalling uncouples translation from transcription causing premature Rho-dependent termination
and formation of aberrant proteins (Haft et al., 2014).
As a consequence of ethanol damage growth is significantly inhibited (Ingram, 1976; Cao et al.,
2017). The cell adaptive response is the overproduction of heat shock proteins (Neidhardt et al.,
1984), an alteration of the fatty acid conformation and composition and membrane proteins
distribution. In E. coli grown under high ethanol stress, fatty acids containing unsaturated and
14
unusually long chains (18:1) are typically produced to consolidate the cell membrane and
counteract excessive fluidity (Ingram, 1976). It is thought that ethanol can occupy the empty
spaces created by unsaturated fatty acids creating a more rigid structure, therefore “freezing”
the fluidified membrane (Ingram, 1989). However, different species alter their membrane
composition in order to keep it fluid and functional (Huffer et al., 2011). Some thermophiles
under ethanol stress (e.g. C. thermocellum) or ethanol adapted (e.g. C. thermosaccharolyticum)
seem to have short chained unsaturated fatty acids and increased membrane fluidity (Baskaran
et al., 1995; Williams et al., 2007). Ethanol tolerating microorganisms such as Z. mobilis do not
alter their membrane composition, however the average length of the phospholipids of their
membranes is generally higher (Ingram, 1989). Studies on ethanol toxicity carried out in
fermentative conditions where ethanol was also externally added, found that tolerance to
endogenous ethanol was lower than to supplemented ethanol. Despite actively dividing cells are
thought to be responding to environmental changes more effectively than cells in stationary
phase (Herrero and Gomez, 1980), ethanol tolerance in continuous culture is generally found to
be at lower levels than in batch (Lynd, 2005). This discrepancy has been attributed to the fact
that produced ethanol accumulates inside the cell at a higher rate than secretion. However, it
has been argued that the experimental methods used by different groups can affect proper
concentration calculations, as discussed by D’Amore and Stewart (1987). A later study on T.
thermosaccharolyticum proved that the discrepancy depended on the buffer used to pH the
culture and suggested that endogenous and exogenous ethanol are equally inhibitory (Lynd et
al., 2001). However, it has been hypothesised that ethanol fermentation intermediates such as
acetaldehyde is the real cause of endogenous ethanol toxicity in yeast (Matsufuji et al., 2008;
Jones, 1990). Despite being internal ethanol a more important indicator of tolerance level for
experimental and applicative purposes, higher external ethanol tolerance may suggest the
range of improvement yet to be achieved (Lynd, 2005).
1.4.3 Pre-treatment by-products
Physico-chemical pre-treatment of lignocellulose produces soluble cytotoxic by-products (i.e.
acetic acid, formic acid, levulinic acid, furfural, hydroxymethyfurfural and phenolic aromatic
compounds) and this is exacerbated at high temperatures or extremes of pH (Zabed et al., 2016).
These inhibitors can dramatically reduce the rates of enzyme hydrolysis, therefore increasing the
enzyme requirement for full conversion or only partly hydrolysing the pre-treated substrate.
Directed evolution of cellulases and carbohydrases has been developed to improve their kinetics
in the presence of residual toxic reagents from pre-treatment (Koppram et al., 2014; Jönsson
and Martín, 2016). Cell robustness against high sugar and ethanol concentrations is a major
15
objective to ensure high productivity of second generation bioethanol fermentations using
thermophiles (Mukhopadhyay, 2015). However, these traits are complex phenotypes that
depend on an unknown number of factors. Genetic modification aimed at enhancing glucose
and ethanol tolerance would significantly improve the attractiveness of P. thermoglucosidasius
as a microbial cell factory for second generation bioethanol production but requires knowledge
of specific targets to be modified.
1.5 Metabolic engineering and strain improvement Metabolic engineering is the modification of native cellular pathways by the use of molecular
tools from homologous or heterologous sources for the overproduction of enzymes, desired
natural metabolites or non-natural products (Hossain et al., 2018; Martinelli and Nikel, 2019;
Bailey, 1991). Through metabolic engineering, microbes can become efficient cell factories
(MCF) (Bailey, 1991) for production of target molecules. The ideal microbial chassis catabolises a
broad spectrum of substrates, is robust, genetically stable, safe, and its metabolism is not
affected by the accumulation of products or co-products in the growth medium (Keasling, 2012;
Fernández-Cabezón et al., 2019). However, such micro-organisms do not naturally exist,
therefore to increase titres, maximise yields and productivity, metabolic engineering of microbes
of interest is often the basis of strain improvement.
Since the start of the metabolic engineering era in the 1990s, the objective of research has
expanded towards a more complete approach that integrates metabolic engineering with
synthetic and systems biology. Synthetic biology is the artificial reprogramming of native or non-
native metabolic pathways for enzyme or compound production by the fine-tuning of gene
expression. Quantitative modulation relies on the availability of molecular tools of defined
characteristics (e.g. vectors, promoters) (Keasling, 2012) such that different combinations of
“parts” have a predictable output. Systems biology is the discipline that creates mathematical
models of biological systems based on data acquired from high-throughput “omics” techniques
and in silico simulation of metabolic fluxes (Campbell et al., 2017; Horinouchi et al., 2018). The
strategic integration of metabolic engineering, synthetic biology and systems biology to better
predict and design all the phases of chemical production with micro-organisms is known as
systems metabolic engineering. This approach aims at improving strains for the most convenient
production process and recovery strategy (Choi et al., 2019). Successful systems metabolic
engineering depends on extensive knowledge of host genetics, physiology and relationships
between environmental changes and phenotype, including the effects of process scale-up (Yu et
al , 2019). However, biotechnology research is often focussed on non-model microbes of poorly
understood genetic background that show interesting physiological characteristics which are
16
potentially advantageous for specific industrial processes (Liu et al., 2015). Not all molecular
tools and technologies that apply to model organisms are versatile enough to be used in all
industrially relevant microbes (Yang et al., 2019). Despite the availability of next-generation
sequencing techniques and the low cost of DNA synthesis services, strain improvement of such
species is not always attainable with a synthetic biology approach.
This is particularly evident in studies with thermophiles. Heterologous genes for markers, genes
or substrates for counter selection or antibiotics resistance, origins of plasmid replication,
artificial episomal constructs of genes encoding enzymes of interest or modern well established
techniques (such as CRISPR/Cas9) have to be thermostable to be active in thermophiles (Freed et
al., 2018; Kananavičiute and Čitavičius, 2015). The performance of microbial cell factories with
limited access to molecular tools or knowledge of specific targets is difficult to improve when the
modification, deletion or supplement of a small set of genes is not sufficient. More often in fact,
the characteristics that significantly improve strain performance are either complex phenotypes
or not predictable based on genomic sequences. When simple metabolic engineering of target
genes is impractical or insufficient, a broader approach known as ‘evolutionary engineering’ can
be attempted. Evolutionary engineering does not require extensive knowledge of the biological
background of the host organism but, if designed appropriately, can result in the creation or
elicitation of new or cryptic complex phenotypes, such as diversification of production pathways
or tolerance towards toxic compounds that are virtually impossible to achieve with a rational
design. Evolutionary engineering of complex phenotypes is based on the increase of variability
obtained through increasing the frequency of mutation or selecting from very large variant
populations. Variation can be directed at the whole genome or targeted at single genes which
are capable of imposing large-scale influence over native transcription, translation or post-
translational processes. Both approaches will be examined in the following sections, with
adaptive laboratory evolution (ALE) techniques that use genome-wide mutators described first,
followed by the description of perturbators that rewire global gene expression.
1.6 Evolutionary engineering with mutators Some in vivo mutagenesis techniques traditionally used for directed evolution of specific genes
are valid approaches for genome wide mutagenesis experiments: these include the utilisation of
chemical agents, ultraviolet or x or γ radiation and hypermutagenic host strains.
1.6.1 Physical or chemical mutagens
Physical or chemical mutagens have been widely used in the past as their effect is aspecific and
applies to all types of micro-organism or plants (Kodym and Afza, 2003). The mutation rate can
be controlled with dosage modulation, although the determination of appropriate exposure
17
times or concentrations of mutagens is not straightforward and may require alternation of
multiple agents. Chemical mutagens can be classified into alkylating agents (ethyl
methanesulfonate, diethyl sulphate and N-methyl-N-nitro-N-nitrosoguanidine), intercalating
agents (proflavine, acriflavine, acridine orange, ethidium bromide), base analogs (5-bromouracil)
and base modifiers (hydroxylamine, nitrous acid). Mutagenesis with UV light is sequence
aspecific, the mutational spectrum (i.e. the types of mutations; Schaaper and Dunn, 1987) is
similar to that of spontaneous mutations of wild type strains and poses risks to the operator
(Shibai et al., 2017; Gawel et al., 2002). Safety and the cost of specialised equipment is the major
drawback for the widespread utilisation of γ and X radiation or α and β particles (Liu et al.,
2015).
1.6.2 Hypermutagenic host strains
Hypermutable strains exist in nature and knowledge of mutator alleles (Wechsler and Gross,
1971; Wechsler et al., 1973; Sevastopoulos and Glaser, 1977; Konrad, 1978; described here in
paragraph 1.10) was fundamental for the artificial construction of hypermutagenic host strains.
The commercially available mutagenic E. coli strain XL1-Red (Agilent) was created to introduce
random mutations in genes of interest carried on vectors (Greener et al., 1997). The background
of the XL1-Red strain contains mutations in the ε subunit of the DNA Pol III (mutD5 allele), MutS
and MutL, resulting in disrupted proofreading, mismatch repair and base excision processes
(Greener et al., 1997). The XL1-Red strain increases the mutation rate of the wild type by 5000-
fold (Greener et al., 1997). Due to the nature of these mutations the XL1-Red strain is
intrinsically unstable, genomic manipulation is very difficult and reiterative use is limited by
inevitable error catastrophe. Mutagenesis with the XL1-Red strain and selection of randomly
mutated genes are separate processes. This discontinuity implies that the attainment of the
desired phenotype is stochastic and there is no certain definition of improvement range. Efforts
have been put towards the development of controllable tools that could circumvent this
drawback but retain the same principle of in vivo mutagenesis with strain XL-1 Red.
In Badran and Liu (2015) the authors describe a small set of strong in vivo mutator vectors that
could ensure a wide mutational spectrum in E. coli and couple mutation with selection. The most
potent hyper-mutation tool was the mutagenesis plasmid 6 (MP6, 6th variant of a set of MP)
which contained the dnaQ926 allele, dam, seqA (encoding a protein that temporarily binds to
adenines of methylated GATC sequences of hemi-methylated double stranded DNA molecules
(dsDNA); Waldminghaus et al., 2012), emrR (encoding a transcriptional repressor of the ermAB
genes encoding an efflux pump involved in multidrug resistance and export of mutagenic
nucleobases; Gabrovskyet al., 2005), ugi and cda1 (encoding an uracil–DNA glycosylase
18
repressor and a cytidine deaminase, respectively; Lada et al., 2011) all under control of the
arabinose inducible promoter araC. The mutation rate of MP6 was found to be 322,000-fold
higher than the wild type, but the highly detrimental effects of the mutator agents were
constrained by use of conditional expression. It was demonstrated that through continuous
evolution, MP6 could develop antibiotic resistance and T7 RNA polymerase alleles compatible
with T3 promoter expression systems in less than 24 hours.
Another relevant study on the creation of in vivo mutators was performed by Suzuki et al. (2015)
for thermophilic systems. The Gram-positive thermophile bacterium Geobacillus kaustophilus
HTA426 was mutated in genes involved in base excision repair to create error-prone strains with
the purpose of increasing the thermostability of enzymes of mesophilic origin by random
mutagenesis. Before this study, thermostability was pursued by selection in thermophiles of
spontaneously mutated thermolabile enzymes (Liao et al., 1986; Hoseki et al., 1999; Tamakoshi
et al., 2001; Fridjonsson et al., 2002; Brouns et al., 2005). In this study mutagenesis rate was
significantly enhanced and it was coupled with in vivo selection. G. kaustophilus HTA426 was
mutated in the genes mutS, mutL, mutM, mutY, mutT, ung, and mfd, encoding MutS, MutL,
MutM, MutY, MutT, Ung (uracil-DNA glycosylase) and the Mfd protein which binds to RNA
polymerases stalling on DNA distortions, to recruit UvrA and start nucleotide excision repair
(Kisker et al., 2013). The frequency of mutations increased up to 400-fold in strains with single
knock-outs of genes mutS, mutL, ung, and mfd, while in the mutY deletion strain it was up to
4,000-fold above the control; ΔmutM and ΔmutT strains did not show a significant perturbation
of the basic mutation frequency. Additionally, the quadruple mutS, mutL, ung, and mfd deletion
strain was created and shown to increase the mutation frequency by 700- to 9,000-fold: this
strain, called G. kaustophilus MK480, was successfully used to create the thermostable version
of the Staphylococcus aureus chloramphenicol acetyltransferase (CAT), named CATA138T (Ala 138
Thr) (Kobayashi et al., 2015). CATA138Twas later used as a selection marker in one of the modular
plasmids described by Reeve et al. (2016) and now in use in Geobacillus and Parageobacillus
cloning systems.
While strain XL-1 Red is very effective for in vivo random mutagenesis of episomal genes, its high
mutagenic potency is unsuitable for strain improvement (Bornscheuer et al., 1998; Henke and
Bornscheuer, 1999; Lu et al., 2001; Bélanger et al., 2005). The series of mutagenic plasmids
described in the study by Badran and Liu (2015) certainly improved the toolkit for directed
evolution in E. coli by permitting control over hypermutator genes with conditional expression.
MP6 has been used successfully mainly for episomal gene mining and to date only once for a
whole-genome mutagenesis experiment (Schmied et al., 2018; Kelpšas and Wachenfeldt, 2019;
19
Pu et al., 2019). The mutagenic G. kaustophilus HTA426 strains have been used for
thermoadaptation-directed enzyme evolution only, but so far they have never been used for in
vivo whole genome mutagenesis (Suzuki, 2018).
Some hypermutagenic alleles of genes involved in DNA replication fidelity are found to increase
their frequency in a population that needs to rapidly adapt to environmental changes, however
when the fitness cost of detrimental mutations is too high, their frequency decreases again. This
variation has been ascribed to many factors (Denamur and Matic, 2006). Control over mutation
rate in bacteria is fine-tuned. In E.coli the basal mutation rate per genome per replication is 2 x
10-9, any increase above 2-8 x 10⁻⁴ is considered deleterious (Denamur and Matic, 2006). The
chance of increasing the fitness of micro-organisms in changing selective environments and thus
their performance as microbial cell factories is higher with small or moderate mutation rate
variations (less than 1,000-fold) (Drake, 1991; Taddei et al., 1997; Denamur and Matic, 2006).
The ideal in vivo mutagenesis for complex phenotypes requires the advantages of classic
techniques and avoids the setbacks: it should be safe, permit control over the mutation rate and
avoid biases, bear large mutational spectrum, avoid lengthy processes of phenotype selection to
allow goal achievement in relatively short periods of time and ultimately, it should be flexible
enough to be applicable to a variety of issues, preferably in as many species as possible at least
of the same genus (Badran and Liu, 2015).
1.6.3 Genome replication engineering assisted continuous evolution
(GREACE)
A interesting attempt to build such a tool for strain improvement was devised by Luan et al. in
2013 for E. coli systems. In this study, the authors designed an experiment that coupled genome-
wide mutagenesis with in vivo continuous selection through the use of in vivo mutators,
effectively reducing time and efforts to obtain strains with desired complex phenotypes. The in
vivo mutators were obtained from a randomly mutated variant library of the 3’-5’ endonuclease
subunit of the DNA polymerase III (ε, encoded by the gene dnaQ) created by error prone PCR.
The technique was therefore named Genome Replication Engineering Assisted Continuous
Evolution (GREACE). Depending on the strength of the mutators, the mutation rate varied in the
population of cells grown under selection. Because mutations accumulated in cells during rounds
of DNA replication, this approach was suitable for finding combinations of favourable mutations
which conferred higher fitness to cells in a continuously self-selecting environment. Increasing
stringency of selection successfully evolved kanamycin resistance and n-butanol, acetate and
heat tolerance in the parent E. coli strain (Luan et al., 2013; Luan et al., 2015). In the first
GREACE experiment, parallel cultures of E. coli carrying the dnaQ library and controls were
20
grown in non-toxic media containing kanamycin, n-butanol and acetate, then subcultures were
grown at higher and progressively increasing concentrations of each substance. Only the
cultures of cells transformed with the dnaQ library managed to survive at high concentrations of
the antibiotic and the chemicals, whereas the controls did not grow beyond the known
minimum toxic concentration of each substance. The population of plasmids at each passage
was monitored and eventually for each condition, only one member of the library dominated the
cultures. The predominant dnaQ mutators were categorised on the basis of the mutation rate,
calculated based on the generation of rifampin resistance (weak, mild and strong mutators). The
authors found that the mutagenesis strength of the elements of the library played a role in the
evolution of the host cell in the different selective environments. For instance, in n-butanol
resistant selection strong mutators were favoured, i.e. versions of dnaQ that increased the
mutation rate more than 1000-fold over the wild type were predominant at the highest
concentration of n-butanol tested (1.25 % v/v). Acetate selected weak mutators, while
kanamycin selected mutators of medium strength. Once the target character was achieved the
plasmid carrying the mutagenic gene was cured from the cell, so that the improved strain
performance depended on genetically stable mutations. More recent studies have used GREACE
principles to improve lysine production and evolve cadmium resistance in E. coli and develop
acetic acid tolerance in S. cerevisiae (Qin et al., 2019; Xu et al., 2018).
1.6.4 Genome shuffling
Whole-genome mutagenesis for evolutionary engineering can be achieved with other
techniques that do not involve DNA replication machinery components. Strain improvement for
complex phenotypes has been attempted with successful results by genome shuffling (Patnaik et
al., 2002; Zhang et al., 2002; Hida et al., 2007). This technique is based on single or reiterative
intraspecific fusion of protoplasts of strains that show variation of phenotypes of interest.
Genetic variation between isolates can be already present in nature or it may be artificially
induced by mutagenesis. Recombination between DNA molecules ‘shuffles’ the genome at
random and at multiple sites. Protoplast are created by enzymatic digestion of the cell wall,
fusion of protoplast occurs by chemical treatment (Fodor and Alfoldi, 1976). Protoplast
formation, stability and regeneration are difficult to achieve, consequently fusion efficiency is
highly variable and non-reproducible. Moreover protocols for protoplast transformation are not
universal but are strain specific. Mutagenesis and selection are uncoupled, the hybrid genome is
tested for the desired phenotype in a separate step (Verma and Kumar, 2000; Trieu-Cuot et al.,
1987).

21
1.6.5 Transposon engineering
Transposable elements have been used to create random deletion libraries and elicit complex
phenotypes (Löwe et al., 2017; Martínez-García et al., 2017; Calero et al., 2018). This system
shows a narrow mutational spectrum, limited to knock outs or altered expression of genes, and
depending on the type of transposon also shows sequence bias. The random insertion of
transposons in the recipient genome and selection can be achieved in just one step, although
due to the nature of the mutagenic agent, selected strains are genetically unstable. Useful
information can be retrieved by genome sequencing and stable improvement requires reverse
engineering, which can be time consuming (Ertesvåg et al., 2017).
1.7 Evolutionary engineering with perturbators Diversification of expression profiles can be achieved by the creation and selection of libraries of
perturbators, mutating sigma factors or carbon catabolite control receptors for global
transcription machinery engineering (gTME); alternatively it can be obtained with ribosome
engineering or heterologous expression of heat shock proteins.
1.7.1 Global transcription machinery engineering (gTME)
Sigma factors are transient components of the RNA polymerase holoenzyme, they adjust the
positioning of these multimeric enzymes on gene promoters for correct and efficient
transcription. Sigma factors preferentially recognise consensus sequences on promoters and this
capability defines promoter strength and gene expression levels. Transcription profiles are highly
dependent on differentiation between promoters and the presence of specialised sigma factors.
E. coli carries seven sigma factors, whereas B. subtilis uses ten. Among these, housekeeping
sigma factors have been pinpointed in both model organisms, named σ70 and σA and encoded by
the genes rpoD and sigA in E. coli and B. subtilis, respectively (Haldenwang, 1995; Maeda et al.,
2000). The remaining sigma factors are employed for specific growth phases, stress conditions or
sporulation. Modification of housekeeping sigma factors reshapes affinity to RNA polymerase
core and to consensus sequences on promoters of a large number of genes. Newly formed
interaction rules create unusual expression combinations that can have a strong impact on cell
metabolism and stress responses. Diversification of housekeeping sigma factors by random
mutagenesis potentially creates variants able to elicit complex phenotypes otherwise impossible
to obtain from a wild type transcriptional profile (Alper et al., 2006).
With gTME, a library of mutated versions of sigma factors is tested in a selective environment
that requires the expression of the complex phenotype of interest for cell survival. gTME was
initially used to improve glucose consumption and ethanol production and tolerance in S.
cerevisiae (Alper et al., 2006). Since then, it has been applied for the elicitation of multigenic
22
traits in many micro-organisms. In E. coli, gTME based on mutated rpoD was able to elicit
ethanol tolerance, lycopene overproduction and tolerance towards sodium dodecyl sulphate
(SDS), demonstrating that this technique could also improve complex phenotypes for single or
multiple stresses and improve metabolite production in bacteria (Alper and Stephanopoulos,
2007). More recently, E. coli strains have been improved by gTME to be able to tolerate low pH
values, overproduce hyaluronic acid and phenylalanine (Yu et al., 2008; Doroshenko et al., 2015;
Gao et al., 2016). In Lactobacillus plantarum gTME has been adopted to improve tolerance to
low pH and lactic acid (Klein-Marcuschamer and Stephanopoulos, 2008), while in Z. mobilis it
increased ethanol tolerance (Tan et al., 2016).
gTME principles for strain improvement for bioethanol production can be based on mutant
libraries of global transcription regulators other than sigma factors (Chong et al., 2013).
Transcription factors are proteins that bind to promoters and activate or repress expression of
individual, a few or a large number of genes in response to specific signals. Among the over 300
genes predicted to encode transcription factors in E. coli, only 175 have been characterised and
only seven are considered global regulators (Keseler et al., 2011; Browning and Busby, 2004). In
Gram-negative bacteria, the global transcription regulator cAMP receptor protein (CRP)
intercepts cyclic AMP (cAMP) to alleviate the cell from carbon catabolite repression (CCR).
Activation of CRP upon cAMP binding allows RNA polymerase recruitment on promoters of
hundreds of genes involved in sugar catabolic pathways in E. coli (Sabourin and Beckwith, 1975;
Karimova et al., 2004; Franchini et al., 2015). Several studies have obtained good results with
gTME based on mutant libraries of cAMP receptor proteins. In E. coli, selected crp transcription
perturbators conferred resistance to ethanol, 1-butanol, toluene, improved osmotolerance and
reaction to oxidative stress (Basak et al., 2012; Zhang et al., 2012; Chong et al., 2013). However,
Gram-positive bacteria lack of CRP and carbon catabolite control is carried out by the carbon
catabolite control protein A (CcpA) that binds to catabolite responsive elements (cre) upstream
of sugar utilisation genes and regulates their expression (Saier et al., 1995; Marciniak et al.,
2012). CcpA mutagenesis in Gram-positives has been used mostly to disrupt CCR and allow
simultaneous consumption of hexoses and pentoses (Ren et al., 2010; Wu et al., 2015).
1.7.2 Ribosome engineering
Isolates resistant to antibiotics that affect ribosome components, such as kanamycin,
streptomycin and chloramphenicol, can be used for strain improvement based on ribosome
engineering. Their variants of ribosomal proteins, rRNAs or translation factors, alter the overall
translation profile inducing protein overexpression in late growth phase (Ochi et al., 2004).
Ribosome engineering has been used to improve α-amylase production in B. subtilis (Kurosawa
23
et al., 2006) and more recently to increase ethanol tolerance and production in Klebsiella
variicola (Suzuki et al., 2015). Using the same concept, isolates of Actinomycetes species
naturally resistant to rifampin (which affects rpoB, encoding the β-subunit of the RNA
polymerase) have been used for overproduction of numerous secondary metabolites (Tanaka et
al., 2013).
1.7.3 Heterologous expression of heat shock proteins
Heat-shock proteins or molecular chaperones are ubiquitous proteins that assist folding of
polypeptides, they are over-expressed in stress conditions, when proteins do not fold properly
or fail to correctly assume their native form, occasionally forming misfolded aggregates as a
consequence of the stress (Zingaro et al., 2012). It has been shown in several studies that over-
expression of genes encoding heat shock proteins improves the performance of microbes in the
selective environment created in fermentation processes (Xu et al., 2019; Mezzina et al., 2017;
Marc et al., 2017; Zhang et al., 2017). The robustness of cell platforms selected for their
interesting natural physiological characteristics can be further enhanced by heterologous
expression of chaperonins from species extremophilic species (Luan et al., 2014).
1.8 Comparison between mutators and perturbators for engineering of
complex phenotypes Complex phenotype elicitation using gene expression perturbators depends on the continued
presence and type of the perturbator, while the genetic background is left intact. Mutagenesis
and selection are separate processes; the former usually involves the in vitro creation of a library
based on a single gene using molecular techniques such as error-prone PCR, aimed at creating a
wide number of variants. The phenotypic selection narrows down the library to the optimal
variant for the selection conditions. The selected allele is therefore tailored to a specific stress
condition, but the library can be assessed under a range of conditions, selecting a different allele
of the pertubator in each experiment. Evolution of complex phenotypes of higher stringency or
combined with new traits therefore requires repetition of the whole selection process.
To ensure that a large library of perturbators can be screened, variants are typically carried on
extrachromosomal vectors, preferably present in low copy-number in the cell so that
competition with native gene expression avoids severe disruption of essential gene functionality
(Lanza and Alper, 2012). When the allele that elicits the best performing phenotype is selected,
its vector has to be reinserted into the ‘clean’ host cell background to confirm the result. Any
further utilisation of the strain carrying the pertubator allele on the vector will require
maintenance of the plasmid, which can be a problem in large-scale production processes.
Although the perturbator gene may be integrated in the cell chromosome to stably retain the
24
genetic information that produces the desired expression profile, this reduces the copy number
and hence the balance between expression of wild-type and mutant allele. Additionally it should
be remembered that the rule in any evolutionary programme is that “you get what you screen
for”, so selection in a laboratory environment may not produce strains which are optimal for
large-scale production. Some ALE techniques with mutators, such as genome shuffling and
transposon engineering also have separate steps for mutagenesis and selection. Any further
improvement following the intial selection requires repetition of the whole process. Only
processes that involve continuous low-level mutation, such as GREACE, allow continuous
mutagenesis coupled with selection, which can be applied under simulated production
conditions. In all cases, transcriptome and/or proteome analyses are necessary to extrapolate
information on the consequences of expression profile perturbation (Wang et al., 2018). Indeed,
information on the genotype-to-phenotype relationship is a desirable adjunct to all strain
improvement techniques. Extended knowledge of genes or regulatory pathways involved in
complex phenotypes would enable reverse engineering. With reverse engineering, the ‘clean’
wild type background is modified only in targeted loci (genes or intragenic DNA portions) that
were found to be important for the specific environmental stress condition. This process clears
all mutations or changes in gene expression profiles that are not directly involved in the
development of the complex phenotype of interest, but may interfere with the background
physiology of the cell platform (Fernández-Cabezón et al., 2019). In evolutionary engineering
with GREACE, mutagenesis is coupled with selection in a continuous process. The best
performing mutant is self-selected and once the plasmid is expelled from the host cell or the
expression of the in vivo mutator is shut down, the evolved microbial cell factory is genetically
stable. No further manipulation is required and utilisation of the strain with improved
performance should be straightforward.
After reviewing the state-of-the art in the field of metabolic engineering and considering the
limited molecular toolkit available at the onset of this project, GREACE and gTME were
considered the most feasible methods for strain improvement of P. thermoglucosidasius. The
possibility of obtaining P. thermoglucosidasius variants of immediate applicability for efficient
and potentially competitive bioethanol production directed this study towards the analysis of
the GREACE approach first. However, in order to have a higher degree of confidence on
pinpointing genes involved in complex traits of interest, a comparison with results obtained with
gTME was desirable. In GREACE, whole-genome mutagenesis of E. coli was achieved by
introducing random mutations into the dnaQ gene, that encodes the proofreading subunit of the
DNA polymerase III. However, genome-wide mutagenesis approaches that rely on rapid stable
25
acquisition of favourable traits can be achieved by hijacking of one of the three mechanisms of
fidelity control in DNA replication or post-replication DNA integrity maintainance: 1) base
selection during synthesis controlled by the α subunit of the DNA polymerase, 2) proofreading
operated by the 3’-5’exonuclease activity element of the DNA polymerase, and 3) repair of the
mismatches left unchecked by the first two mechanisms and the occasional DNA damage that
arises from internal or external sources (Echols and Goodman, 1991). In E. coli, correct base
selection lowers the mutation rate to 10-4-10-5, proofreading and base editing by a further 10-2 -
10-3, leaving a contribution of 10-3 -10-4 for mismatch repair (Schaaper, 1993). Overall, the
observed mutation rate in E. coli is about 5x10⁻¹⁰ mutations/base pair/chromosome replication
event, while in B. subtilis it is 3 x 10⁻⁹ (Drake, 1991; Sasaki et al., 2000). To make a comparison, in
mammals the rate of spontaneous mutations is about 5x10-11 (Drake, 1991).
To elaborate on these three options, DNA duplication and molecular mechanisms of accuracy
control is reviewed below.
1.9 Introduction to DNA replication in bacteria DNA replication is the fundamental event that precedes cell division in all domains of life. It
produces two identical DNA molecules from one in a semi-conservative process; the two
parental strands are divided between the two daughter molecules and serve as templates for
the synthesis of the new complementary DNA strands. The substrates for DNA replication are
the four dNTPs and the 3’-OH end of the double stranded DNA molecule of primer-template
complex. The latter is composed of one of the two parental strands in single form, which guides
the selection of the next dNMP to be added based on complementarity, and the newly created
double stranded DNA exposing the 3’-OH of the last nucleotide added. In the synthesis reaction
the free 3’-OH of the primer attacks the α-phosphate on the 5’ carbon of the dNTP, releasing a
pyrophosphate and creating a covalent phosphodiester bond with the dNMP, which becomes
part of the growing DNA chain. Since nucleotides are incorporated by the 5’ carbon of the
deoxyribose and promote the addition of the next by their 3’ carbon, the direction of synthesis is
5’→3’. The enzyme that catalyses this reaction is the DNA polymerase. The active site of this
enzyme is the same for all the four dNTPs, the selection of the correct one is driven by perfect
geometry of the base pairs A:T and G:C between the template strand and the incoming
nucleotides. Only if the correct base pairing is respected the maximum number of hydrogen
bonds is formed. Strict selectivity is operating also to avoid DNA-RNA hybrids, given that
ribonucleotydes triphosphates (NTPs) are up to 100-fold more concentrated in the cell than
dNTPs: the presence of the 2’-OH impedes access to the active site of the enzyme (Buckstein et
al., 2008). In the perfect reaction conditions the processivity of the DNA polymerase is of 1000
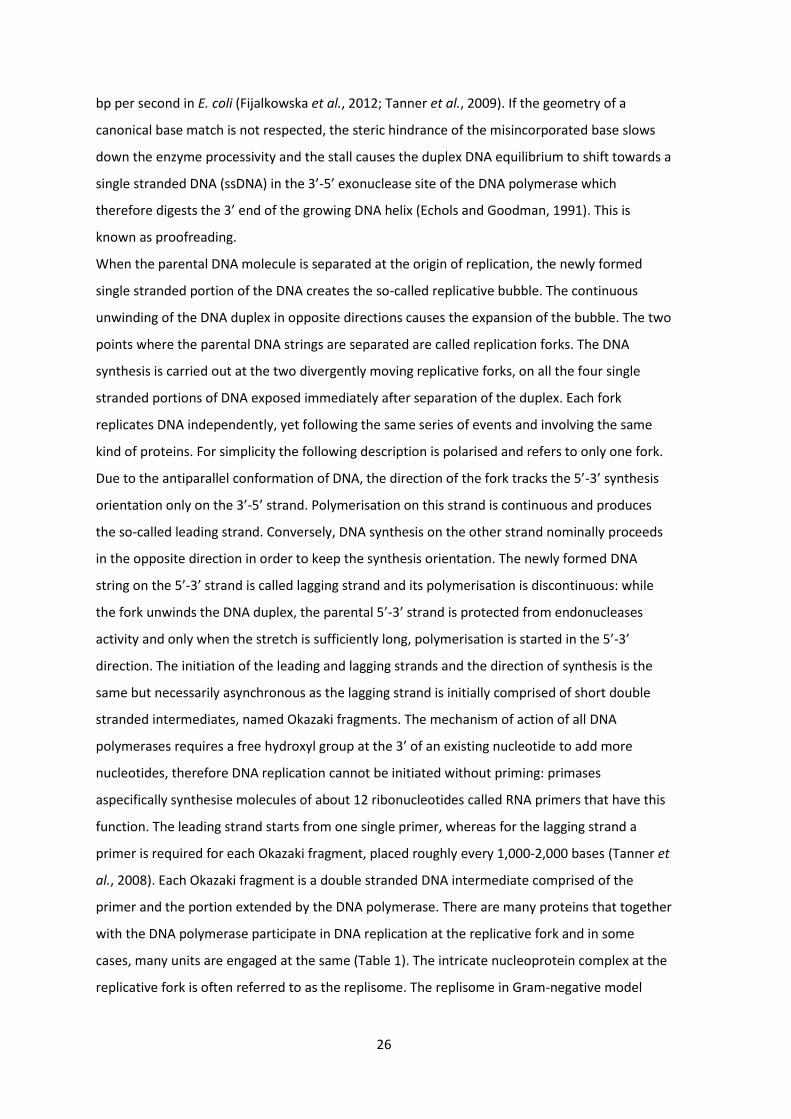
26
bp per second in E. coli (Fijalkowska et al., 2012; Tanner et al., 2009). If the geometry of a
canonical base match is not respected, the steric hindrance of the misincorporated base slows
down the enzyme processivity and the stall causes the duplex DNA equilibrium to shift towards a
single stranded DNA (ssDNA) in the 3’-5’ exonuclease site of the DNA polymerase which
therefore digests the 3’ end of the growing DNA helix (Echols and Goodman, 1991). This is
known as proofreading.
When the parental DNA molecule is separated at the origin of replication, the newly formed
single stranded portion of the DNA creates the so-called replicative bubble. The continuous
unwinding of the DNA duplex in opposite directions causes the expansion of the bubble. The two
points where the parental DNA strings are separated are called replication forks. The DNA
synthesis is carried out at the two divergently moving replicative forks, on all the four single
stranded portions of DNA exposed immediately after separation of the duplex. Each fork
replicates DNA independently, yet following the same series of events and involving the same
kind of proteins. For simplicity the following description is polarised and refers to only one fork.
Due to the antiparallel conformation of DNA, the direction of the fork tracks the 5’-3’ synthesis
orientation only on the 3’-5’ strand. Polymerisation on this strand is continuous and produces
the so-called leading strand. Conversely, DNA synthesis on the other strand nominally proceeds
in the opposite direction in order to keep the synthesis orientation. The newly formed DNA
string on the 5’-3’ strand is called lagging strand and its polymerisation is discontinuous: while
the fork unwinds the DNA duplex, the parental 5’-3’ strand is protected from endonucleases
activity and only when the stretch is sufficiently long, polymerisation is started in the 5’-3’
direction. The initiation of the leading and lagging strands and the direction of synthesis is the
same but necessarily asynchronous as the lagging strand is initially comprised of short double
stranded intermediates, named Okazaki fragments. The mechanism of action of all DNA
polymerases requires a free hydroxyl group at the 3’ of an existing nucleotide to add more
nucleotides, therefore DNA replication cannot be initiated without priming: primases
aspecifically synthesise molecules of about 12 ribonucleotides called RNA primers that have this
function. The leading strand starts from one single primer, whereas for the lagging strand a
primer is required for each Okazaki fragment, placed roughly every 1,000-2,000 bases (Tanner et
al., 2008). Each Okazaki fragment is a double stranded DNA intermediate comprised of the
primer and the portion extended by the DNA polymerase. There are many proteins that together
with the DNA polymerase participate in DNA replication at the replicative fork and in some
cases, many units are engaged at the same (Table 1). The intricate nucleoprotein complex at the
replicative fork is often referred to as the replisome. The replisome in Gram-negative model

27
organism E. coli is the most studied and will be described below in order to then highlight the
differences with the DNA replication processes of B. subtilis and other Gram-positive bacteria.
Table 1 - Proteins involved in DNA replication in E. coli and their location at the replicative fork. Genes for proteins that assemble to form the DNA Pol III holoenzyme (HE) are all essential, except θ and χ (Viguera et al., 2003).
Gene Enzyme Role in DNA replication Location
dnaB DnaB Helicase On the lagging strand template
dnaG DnaG Primase Bound to DnaB and to RNA
primers
Ssb SSB Single stranded DNA binding
proteins
On single stranded template
DNA
parC,
parE
Topoisomerase
IV
Introduces negative supercoiling
downstream of the replicative fork
Downstream of the replicative
fork
dnaE α Polymerase Core of the DNA Pol III HE
dnaQ ε 3’-5’ exonuclease Core of the DNA Pol III HE
holE θ Stabilises core, enhances ε Core of the DNA Pol III HE
dnaN Β2 Sliding clamp DNA Pol III HE
dnaX γ (DnaX
truncated)
When bound to ATP, binds to Β2
and opens it
Clamp loader complex, DNA Pol
III HE
dnaX τ2 (DnaX full
length)
Loads Β2 on the RNA primer Clamp loader complex, DNA Pol
III HE
holA δ Link between loader and Β2 Clamp loader complex, DNA Pol
III HE
holB δ' Enhances laoding activity Clamp loader complex, DNA Pol
III HE
holC χ Links loader to SSB Clamp loader complex, DNA Pol
III HE
holD ψ Binds to χ and γ Clamp loader complex, DNA Pol
III HE
1.9.1 DNA replication in E. coli
DNA duplication (Figure 6) is preceded by the separation of the DNA double helix at the origin or
replication site (oriC). DnaA proteins recognise sequences called DnaA boxes in oriC (Margulies
and Kaguni, 1996) and separate the DNA duplex in the AT-rich region of oriC (Mott and Berger,
2007). The hexameric DnaC mediator bound to DnaA recruits two DnaB helicases to unwind
DNA. The DnaB helicase is a ring-shaped protein composed of six subunits that encircles a single
stranded DNA molecule and starts unwinding the double stranded DNA by breaking the
hydrogen bonds between bases using ATP hydrolysis (Mott et al., 2008). Two helicases are
loaded on the lagging strand templates and move in direction 5’-3’ at each replicative fork
(Galletto et al., 2004). While the DNA duplex is untwisted, the parental single strand with
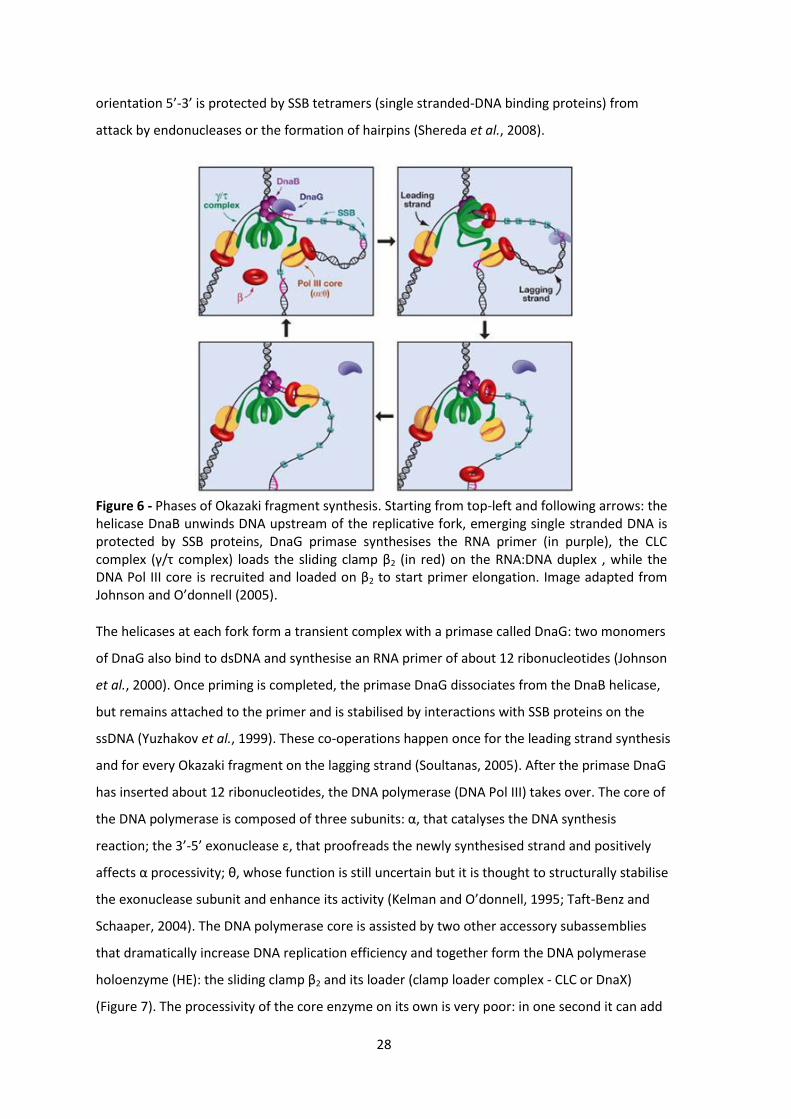
28
orientation 5’-3’ is protected by SSB tetramers (single stranded-DNA binding proteins) from
attack by endonucleases or the formation of hairpins (Shereda et al., 2008).
Figure 6 - Phases of Okazaki fragment synthesis. Starting from top-left and following arrows: the helicase DnaB unwinds DNA upstream of the replicative fork, emerging single stranded DNA is protected by SSB proteins, DnaG primase synthesises the RNA primer (in purple), the CLC complex (γ/τ complex) loads the sliding clamp β2 (in red) on the RNA:DNA duplex , while the DNA Pol III core is recruited and loaded on β2 to start primer elongation. Image adapted from Johnson and O’donnell (2005).
The helicases at each fork form a transient complex with a primase called DnaG: two monomers
of DnaG also bind to dsDNA and synthesise an RNA primer of about 12 ribonucleotides (Johnson
et al., 2000). Once priming is completed, the primase DnaG dissociates from the DnaB helicase,
but remains attached to the primer and is stabilised by interactions with SSB proteins on the
ssDNA (Yuzhakov et al., 1999). These co-operations happen once for the leading strand synthesis
and for every Okazaki fragment on the lagging strand (Soultanas, 2005). After the primase DnaG
has inserted about 12 ribonucleotides, the DNA polymerase (DNA Pol III) takes over. The core of
the DNA polymerase is composed of three subunits: α, that catalyses the DNA synthesis
reaction; the 3’-5’ exonuclease ε, that proofreads the newly synthesised strand and positively
affects α processivity; θ, whose function is still uncertain but it is thought to structurally stabilise
the exonuclease subunit and enhance its activity (Kelman and O’donnell, 1995; Taft-Benz and
Schaaper, 2004). The DNA polymerase core is assisted by two other accessory subassemblies
that dramatically increase DNA replication efficiency and together form the DNA polymerase
holoenzyme (HE): the sliding clamp β2 and its loader (clamp loader complex - CLC or DnaX)
(Figure 7). The processivity of the core enzyme on its own is very poor: in one second it can add
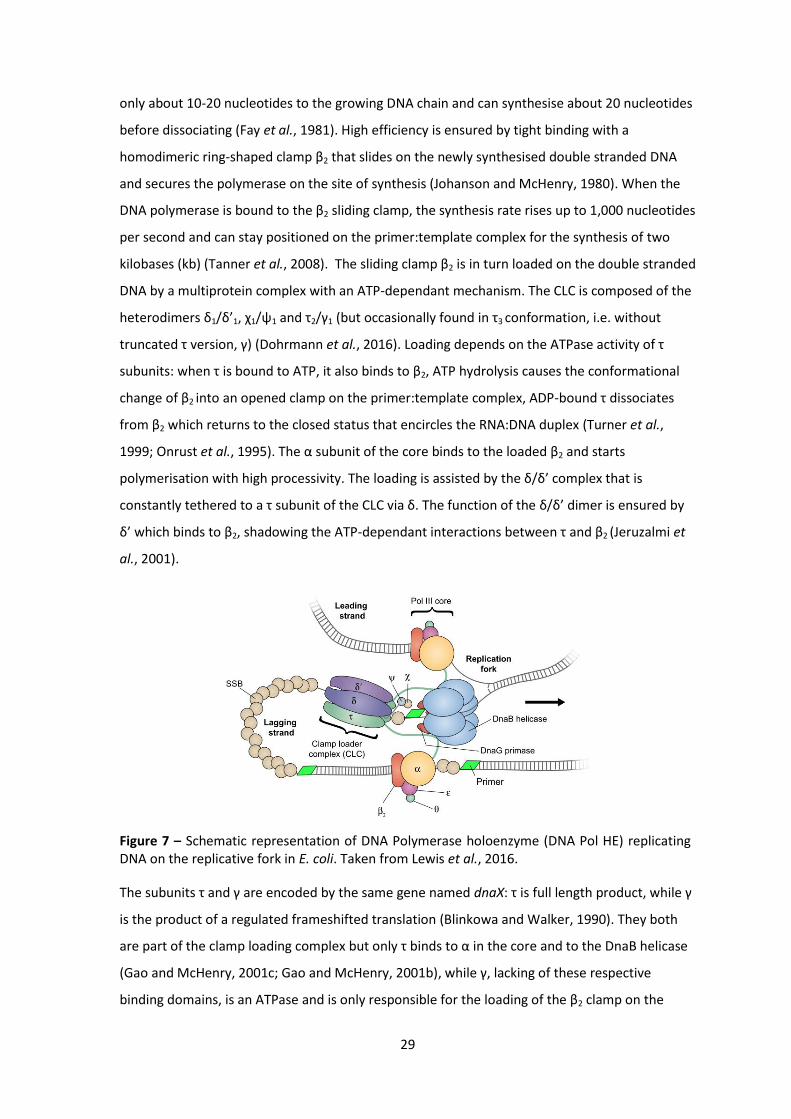
29
only about 10-20 nucleotides to the growing DNA chain and can synthesise about 20 nucleotides
before dissociating (Fay et al., 1981). High efficiency is ensured by tight binding with a
homodimeric ring-shaped clamp β2 that slides on the newly synthesised double stranded DNA
and secures the polymerase on the site of synthesis (Johanson and McHenry, 1980). When the
DNA polymerase is bound to the β2 sliding clamp, the synthesis rate rises up to 1,000 nucleotides
per second and can stay positioned on the primer:template complex for the synthesis of two
kilobases (kb) (Tanner et al., 2008). The sliding clamp β2 is in turn loaded on the double stranded
DNA by a multiprotein complex with an ATP-dependant mechanism. The CLC is composed of the
heterodimers δ1/δ’1, χ1/ψ1 and τ2/γ1 (but occasionally found in τ3 conformation, i.e. without
truncated τ version, γ) (Dohrmann et al., 2016). Loading depends on the ATPase activity of τ
subunits: when τ is bound to ATP, it also binds to β2, ATP hydrolysis causes the conformational
change of β2 into an opened clamp on the primer:template complex, ADP-bound τ dissociates
from β2 which returns to the closed status that encircles the RNA:DNA duplex (Turner et al.,
1999; Onrust et al., 1995). The α subunit of the core binds to the loaded β2 and starts
polymerisation with high processivity. The loading is assisted by the δ/δ’ complex that is
constantly tethered to a τ subunit of the CLC via δ. The function of the δ/δ’ dimer is ensured by
δ’ which binds to β2, shadowing the ATP-dependant interactions between τ and β2 (Jeruzalmi et
al., 2001).
Figure 7 – Schematic representation of DNA Polymerase holoenzyme (DNA Pol HE) replicating DNA on the replicative fork in E. coli. Taken from Lewis et al., 2016.
The subunits τ and γ are encoded by the same gene named dnaX: τ is full length product, while γ
is the product of a regulated frameshifted translation (Blinkowa and Walker, 1990). They both
are part of the clamp loading complex but only τ binds to α in the core and to the DnaB helicase
(Gao and McHenry, 2001c; Gao and McHenry, 2001b), while γ, lacking of these respective
binding domains, is an ATPase and is only responsible for the loading of the β2 clamp on the
30
primer:template complex and binding to δ and δ’ (Gao and Mchenry, 2000b). As the connection
between the core and the CLC, the subunit τ is effectively responsible for the holoenzyme
assembly and for the tight coordination of DNA synthesis on both strands of the replicative fork
(Onrust et al., 1995). In E. coli the DNA polymerase III HE follows the replicative fork and tracks
along the DNA duplex. In contrast, in B. subtilis the ssDNA helices created at the fork are pulled
through the replication machinery to be used as templates. DNA replisomes in B. subtilis are
assembled and anchored at midcell positions, either of the mother cell or of the future two
daughters cells (Lemon and Grossman, 1998; Berkmen and Grossman, 2006).
The CLC heterodimer function is to structurally stabilise the holoenzyme, its connections with
other components of the replisome allow the CLC to be located in proximity of the ssDNA
templates and facilitate efficient loading of a sliding clamp and the tethered DNA Pol III core to a
primer:template complex, once a primer is created. The ψ subunit binds to τ, while χ, on the
opposite side of the heterodimer, binds to C-terminal tails of SSB proteins (Reyes-Lamothe et al.,
2010) and facilitates DnaG primase displacement on primers in a mechanism called the ‘three-
point switch’: while the primase is removed, the CLC loads a β2 clamp and a DNA Pol III core on
the RNA:DNA duplex to start DNA synthesis (Yuzhakov et al., 1999). The complex χ/ψ appears to
be non-essential for the holoenzyme as in other genera is not found or their sequences share
little homology with E. coli’s (Robinson et al., 2010). The DNA Pol III core cycle is forced on the
lagging strand. It has been determined that DNA Pol III core is destabilised by the presence of
the primer of the Okazaki fragment previously synthesised, its dissociation from the
primer:template complex allows the loading of a new polymerase (Yuan and McHenry, 2014)
even if the Okazaki fragment is not completed (Wu et al., 1992). When the polymerisation of the
Okazaki fragment is completed, the RNA primers need to be replaced by DNA and the nick at its
5’ end mended. Full maturation of the Okazaki fragments is in two steps. Firstly, the DNA
polymerase I (DNA Pol I, encoded by polA) substitutes RNA primers inserted by DnaG during
replication with DNA. Secondly, the gap with the previous Okazaki fragment is sealed by a DNA
ligase A (LigA) with the utilisation of one ATP as a co-factor (Kornberg et al., 1992).
To replicate the 4,639 kb that constitutes E. coli’s genome, the lagging strand is synthesised from
over 4,000 Okazaki fragments, while the leading strand is synthesised form one single primer
(Tanner et al., 2011). It has been shown that there is a bias between lagging and leading strand
fidelity control during DNA replication (Fijalkowska et al., 1998; Gawel et al., 2002; Banach-
Orlowska et al., 2005; Kuban et al., 2005; Makiela-Dzbenska et al., 2011). The lagging strand
appears to be two- to six-fold more accurately synthesised than the leading strand. It has been
hypothesised that this is due to the frequent DNA Pol III core changes on the lagging strand
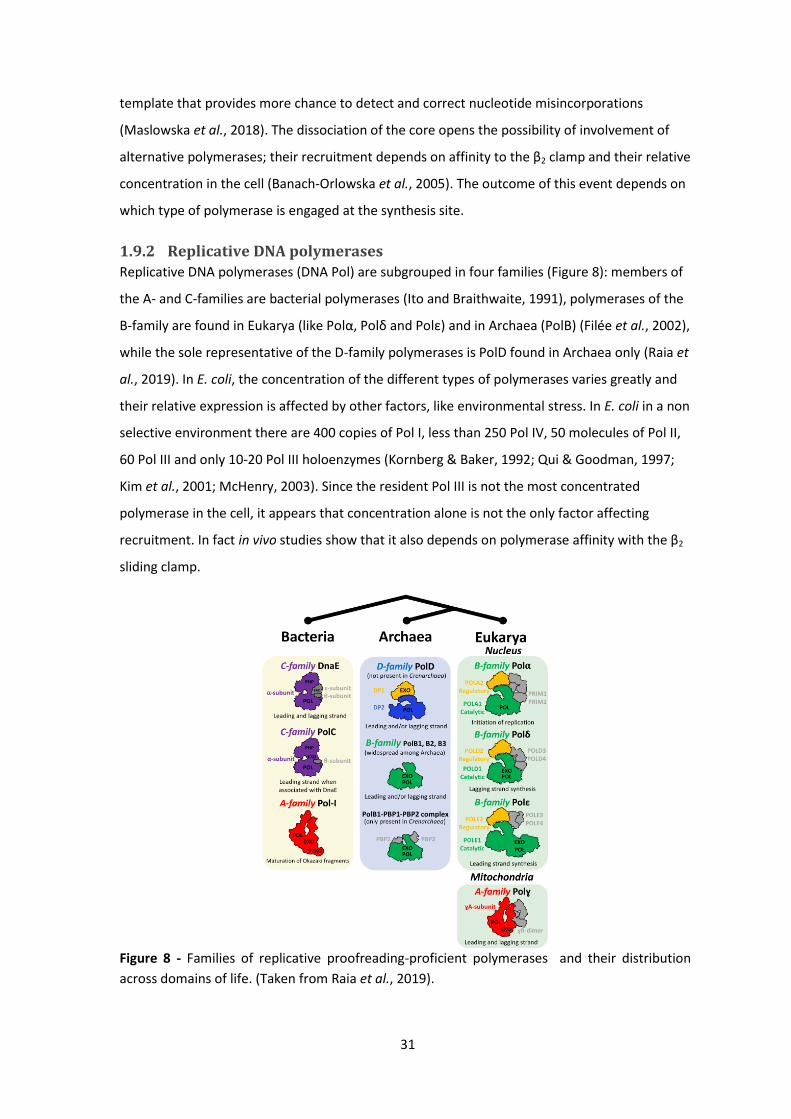
31
template that provides more chance to detect and correct nucleotide misincorporations
(Maslowska et al., 2018). The dissociation of the core opens the possibility of involvement of
alternative polymerases; their recruitment depends on affinity to the β2 clamp and their relative
concentration in the cell (Banach-Orlowska et al., 2005). The outcome of this event depends on
which type of polymerase is engaged at the synthesis site.
1.9.2 Replicative DNA polymerases
Replicative DNA polymerases (DNA Pol) are subgrouped in four families (Figure 8): members of
the A- and C-families are bacterial polymerases (Ito and Braithwaite, 1991), polymerases of the
B-family are found in Eukarya (like Polα, Polδ and Polε) and in Archaea (PolB) (Filée et al., 2002),
while the sole representative of the D-family polymerases is PolD found in Archaea only (Raia et
al., 2019). In E. coli, the concentration of the different types of polymerases varies greatly and
their relative expression is affected by other factors, like environmental stress. In E. coli in a non
selective environment there are 400 copies of Pol I, less than 250 Pol IV, 50 molecules of Pol II,
60 Pol III and only 10-20 Pol III holoenzymes (Kornberg & Baker, 1992; Qui & Goodman, 1997;
Kim et al., 2001; McHenry, 2003). Since the resident Pol III is not the most concentrated
polymerase in the cell, it appears that concentration alone is not the only factor affecting
recruitment. In fact in vivo studies show that it also depends on polymerase affinity with the β2
sliding clamp.
Figure 8 - Families of replicative proofreading-proficient polymerases and their distribution
across domains of life. (Taken from Raia et al., 2019).
32
1.9.2.1 Pol I
DNA Polymerase I (Pol I) is the first polymerase ever discovered and it is the representative of
the A-family of replicative polymerases (Bessman et al., 1956). It is a single subunit DNA
polymerase with three domains: the C-terminus carries out the 5’-3’ polymerase activity and the
3’-5’ exonuclease activity and sometimes it is referred to as ‘Klenow fragment’ (Beese and Steitz,
1991; Ricchetti and Buc, 1993); the N-terminus of Pol I is also capable of exonuclease activity but
in direction 5’-3’ (Klett et al., 1968), and it is responsible for the removal of the RNA primer
inserted by DnaG during replication. The degradation of the RNA primer advances by small
oligonucleotides at a time in a process called flap endonuclease activity, FEN (Lundquist and
Olivera, 1982). Concurrently with FEN, Pol I inserts 10-20 nucleotides per second to replace the
RNA primer (Bryant et al., 1983; Lewis et al., 2016). It is interesting to note that polA knock out
mutants are still able to grow in rich media, meaning that Pol I function is not essential or, at
least, it can be compensated by other enzymes, for this reason Pol I is considered an accessory
polymerase (Nagata et al., 2002). RNase HI and RNase HII are 5’-3’ exonucleases in E. coli that
can degrade the RNA primers for Okazaki fragment maturation, although they leave a few
ribonucleotides behind at the RNA-DNA junctions (Fukushima et al., 2007) so their major
involvement seems unlikely (Lewis et al., 2016). Pol I can occasionally be used for damage repair
as an alternative to DNA Pol II, IV and V that are translesion polymerases (Rattray and Strathern,
2003).
1.9.2.2 DnaE and PolC polymerases
The C- family of bacterial replicative polymerases is sub-grouped into DnaE and PolC
polymerases (Akashi and Yoshikawa, 2013). The main difference between the two types is that
DnaE enzymes have the polymerase activity only, whilst PolC enzymes also carry the
proofreading domain on the same polypeptide. The majority of bacterial species have a DnaE
type as the main replicative enzyme. In E. coli the DnaE polymerase is called DNA Pol III and its
proofreading activity is carried out by the ε subunit of the core (i.e. encoded by the gene dnaQ).
Low GC Gram-positive Firmicutes such as B. subtilis have both DnaE and PolC types and the
enzymes keep this nomenclature for easy distinction from DNA Pol III (Inoue et al., 2001).
A study with single-molecule microscopy showed that in B. subtilis about 60 copies of PolC are
found in the duplicating cell in vivo, but only three PolC are engaged at each replication fork.
DnaE is found in about 300 copies, but 80 copies are found to be sufficient for growth (Li et al.,
2018). In E. coli there are on average 40 DNA polymerase core assemblies in the cell while DNA is
duplicated, but only three are actively involved in the replisome (Reyes-Lamothe et al., 2010). In
B. subtilis, both DNA PolC and DnaE are essential (Jayaraman, 2010). Early studies on these two
33
DNA Pol enzymes suggested that they were specialised for DNA replication of leading and
lagging strands, respectively (Dervyn et al., 2001). However, later studies demonstrated that
PolC did the bulk of replication on both nascent strands but was unable to extend the RNA
primer with dNTPS and that DnaE was the indispensable intermediate polymerase assigned to
this task; DnaE adds about 25 nucleotides before PolC takes over (Sanders et al., 2010). This
extra step curiously resembles the eukaryotic mechanism of DNA replication in which Pol α adds
the first few nucleotides to the RNA primer before handing over to Pol δ (Kunkel and Burgers,
2008).
During DNA replication DnaE is supposed to be engaged only once on the leading strand but it is
required multiple times on the lagging strand (i.e. for each Okazaki fragment). DnaE is not a
processive polymerase, it is highly error-prone, but just like DNA Pol III, it is more accurate when
bound to DnaN (i.e. β2 sliding clamp homologue) (Paschalis et al., 2017). In B. subtilis the
proofreading subunit ε homolog is missing. Some B. subtilis knock out strains of enzymes with 3’-
5’ exonuclease activity were tested (dinG, kapD, yprB, ppsA and yhaM), but they did not increase
the mutation rate, suggesting that proofreading was not associated with them (Paschalis et al.,
2017). In the same study, other in vivo experiments showed that mismatches left unchecked by
DnaE are corrected post-replication by PolC and the mismatch repair system (Paschalis et al.,
2017).
DnaE forms a tertiary complex with PolC and the DNA template. This conformation facilitates
proofreading performed in trans by PolC and handing over to PolC polymerase after DnaE
priming activity (Paschalis et al., 2017). DnaE expression was found to increase three-fold in B.
subtilis and 14-fold in Mycobacterium tubercolosis under SOS response (Davis et al., 2002; Le
Chatelier et al., 2003). Therefore, it has been suggested that DnaE functions as a replicative
polymerase and also as a translesion polymerase (Tippin et al., 2004). However, DnaE is essential
in all Gram-positive organisms tested, while translesion polymerases are not (Bruck et al., 2003).
Additionally, over-expression of DnaE does not result in a hypermutagenic phenotype which is
characteristic of translesion polymerases (Duigou et al., 2004).
1.9.3 Translesion polymerases
Translesion synthesis (TLS) DNA polymerases are not the main replicative enzymes in the cell.
These alternative polymerases have active sites which are more permissive to nucleotide
misincorporations or lack proofreading activity and therefore contribute to error-prone DNA
synthesis reactions. TLS polymerase are employed by the cells as part of the SOS response to
replace the main DNA polymerase at damaged spots of the template DNA, which otherwise

34
would cause premature termination of DNA duplication. Alternative DNA polymerases are
dynamically involved in DNA synthesis of undamaged DNA as well (Wagner et al., 2002).
1.9.3.1 Pol II
Pol II is classified as a translesion DNA polymerase as it is involved in damage repair during DNA
replication, usually induced by the activation of the SOS response (Iwasaki et al., 1990).
Representative of the B-family polymerases, DNA Pol II is a single polypeptide with α and 3’-5’
exonuclease domains (Cai et al., 1995). The copy number of Pol II molecules per cell is similar to
that of Pol III (30-50 versus 40; Qiu and Goodman, 1997; Li et al., 2018) but can rise seven- to
ten-fold in cells that have the SOS response activated (Napolitano et al., 2000). Pol II can bypass
an abasic nucleotide (Tessman and Kennedy, 1994) or bulky adducts in particular sequence
contexts causing -2 frameshift mutations (Wagner et al., 2002). As a proofreading-proficient
polymerase, Pol II has been defined as a backup for DNA Pol III failures: the current accepted
hypothesis is that DNA Pol III normally replicates DNA with a low error rate, but occasional
stalling at the synthesis site can be promptly assisted by an alternative polymerase, preferably
Pol II (Banach-Orlowska et al., 2005). This idea has been confirmed by several observations:
deletion in polB does not dramatically increase the mutation rate (Banach-Orlowska et al., 2005)
although if the exonuclease domain is disrupted (polBex1) and the gene enconding the α subunit
of DNA Pol III is in an antimutator variant (dnaE915), the mutation rate increases (Rangarajan et
al., 1997). The contribution of Pol II in a wild type strain at these occasions is minimal, but
overall enough to be appreciable in the PolBex1 strain (Fijalkowska et al., 2012).
In addition to families A, B and C, there are two more families of DNA polymerases, widely
accepted as proofreading-deficient. These enzymes are used in emergency DNA replication
events that block all other types of high-fidelity DNA polymerases. Previously known as the
UmuC/DinB/Rev1/Rad30 superfamily with homologues found in Prokaryotes and Eukaryotes,
the current nomenclature refers to them as translesion Y-polymerases (Ohmori et al., 2001). The
other family with similar cellular function comprises the X-polymerases β, λ and µ found in
Eukaryotes only (Yamtich and Sweasy, 2010).
E. coli contains five types of DNA polymerase in total: beyond the described Pol I, Pol II and Pol
III there are also the translesion polymerases Pol IV and Pol V (Stratmann and Van Oijen, 2014)
which are members of the Y-family of translesion polymerases (Wagner et al., 1999; Tang et al.,
1999; Reuven et al., 1999). In B. subtilis there are PolC, DnaE, Pol I and two TLS Pol IV and Pol V-
like polymerases: Pol Y1 and Pol Y2.
35
1.9.3.2 Pol IV and Pol Y1
Pol IV is a single polypeptide encoded by the gene dinB lacking proofreading activity and its DNA
synthesis activity is therefore error-prone. Pol IV is found in higher concentrations than any
other polymerases. The high constitutive expression of dinB increases 10-fold during the SOS
response (Kim et al., 2001). It has been hypothesised that mutagenesis due to Pol IV is targeted
to specific sequence contexts, but that when the concentration of Pol IV increases mutagenes is
becomes untargeted (Kim et al., 2001). This is supported by the fact that episomal dinB
overexpression impairs viability, although the mutation rate is unaffected by deletion of dinB
(Kuban et al., 2004; Wolff et al., 2004; McKenzie et al., 2003). Pol Y1 in B. subtilis is constitutively
expressed but it is not used for UV-induced mutations repair. It has been shown that
overexpression of the gene yqjH that encodes Pol Y1 leads to a hypermutable phenotype but it is
not linked to the SOS response. Overexpression of yqjH negatively affects growth rates at low
temperatures by sequestering DnaN sliding clamps. It has been hypothesised that Pol Y1 takes
part in normal DNA replication (Duigou et al., 2004).
1.9.3.3 Pol V and Pol Y2
Pol V is not a single peptide, but is composed of one copy of UmuC encoded by umuC and two
UmuD’ subunits derived from RecA-guided self-cleavage of UmuD (McDonald et al., 1998). The
copy number of Pol V is very low (20 molecules per cell), but upon SOS response expression of
UmuD rises up to 2,400 molecules per cell and UmuC to 200 (Woodgate and Ennis, 1991).
Hypermutable phenotypes derived from overexpression of accessory polymerases have been
analysed in many mutagenesis studies. Pol IV and Pol V knockout strains show antimutator
phenotypes (Jayaraman, 2010), therefore rather than examining specific mutations in the
polymerase encoding genes, studies on DNA damage repair have focussed on regulation of their
expression. The nucleoprotein RecA induces repressor LexA self-cleavage which in normal
conditions binds to promoters of genes involved in SOS response to DNA damage, including
polA, dinB, umuC and umuD (Michel, 2005). When diffuse DNA damage is perceived by the cell it
is addressed through an increase of RecA level. In addition, RecA significantly enhances Pol V
activity. The E. coli variants recA441 (Tessman and Peterson, 1985) and recA730 (Witkin et al.,
1982) impede their own down regulation resulting in constitutive expression of SOS genes,
triggering the ‘spontaneous SOS induction’ and therefore increased levels of Pol IV, Pol V and
also Pol I (Janion, 2008). In B. subtilis Pol Y2 is comprised of a single peptide encoded by the gene
yqjW. Pol Y2 expression is induced only by SOS signals and it is employed in the UV-mutagenesis
response. yqjW overexpression increases spontaneous and UV-induced mutation rates, but has
36
no impact on growth during the SOS-response, as Pol Y2 does not bind to DnaN in the replisome
under those conditions (Duigou et al., 2004).
1.10 Mechanisms of fidelity control
1.10.1 Base selection
The gene dnaE encoding the α subunit of the DNA polymerase (DNA Pol III) is an essential gene
in E. coli. Mutations in dnaE curiously cause two types of phenotype with opposite outcomes:
they can act as antimutators or they can have a mutator effect. Many antimutator dnaE alleles
have been characterised and they have been given a progressive numbered reference, the most
interesting ones are from dnaE910 to dnaE925, and also dnaE40 and dnaE41 (Schaaper and
Cornacchio, 1992; Fijalkowska and Schaaper, 1993; Fijalkowska et al., 1993; Schaaper, 1993;
Oller and Schaaper, 1994; Schaaper, 1996). Several naturally occurring dnaE mutator alleles have
been identified since the 1970s, such as dnaE9 (Konrad, 1978), dnaE74 (Sevastopoulos and
Glaser, 1977), dnaE1026 (Wechsler et al., 1973), dnaE486 and dnaE511 (Wechsler and Gross,
1971). There have been many hypotheses on how some mutations in dnaE can lower mutation
rate in the cell. Possibly in these cases the base selection in the α subunit is more stringent
(Fijalkowska and Schaaper, 1993; Fijalkowska et al., 1993; Schaaper, 1993; Oller and Schaaper,
1994; Schaaper, 1998); conversely the α mutant could be less accurate in polymerisation and the
higher number of misincorporations could shift the equilibrium of the growing strand more
often towards the single stranded status, that is processed by the 3’-5’ exonuclease subunit,
causing a dramatic enhancement of ε activity, hence a lower mutation rate (Reha-Krantzs and
Nonay, 1993; Reha-Krantz, 1995; Banach-Orlowska et al., 2005; Fijalkowska et al., 2012).
Alternatively, an error prone α or simply an α with a lower reaction rate overloads ε with so
many errors to check that it forces the DNA Pol core to stall, causing polymerase cycle: removal
and replacement by alternative polymerases to increase the overall replication fidelity
(Fijalkowskaet al., 2012). Reasonably, the outcome of this polymerase switch depends on the
status of the cell (SOS induced or not) and the type of polymerase engaged (Makiela-Dzbenska et
al., 2019; Banach-Orlowska et al., 2005). This hypothesis supports the data presented in the
study by Vandewiele et al. (2002) in which many dnaE mutators were characterised:
mutagenesis appeared to be strongly correlated either with the absence or the constitutive
expression of the error-prone accessory DNA Pol V rather than the mutated dnaE itself. Finally,
affinity to the other subunits of the DNA Pol core also plays a key factor in DNA replication
fidelity; a study on the mutator allele dnaE173 found that the origin of the strong mutator
phenotype appeared to be the disrupted interaction with ε (Maki et al., 1991), therefore the
hypermutagenesis was attributed to the structural impairment/absence of the proofreading
37
activity rather than the loss of polymerase function.
The mutator dnaE alleles discovered and studied, appear to be weak or mild. As dnaE is an
essential gene that cannot be knocked out, it is impossible to have a controlled measure of the
real contribution of dnaE alleles to spontaneous mutagenesis. Therefore dnaE variants have
been assessed on their ability to balance or counteract the detrimental consequences of
increases in mutation rate caused by other gene deletions (Schaaper and Cornacchio, 1992; Oller
and Schaaper, 1994; Schaaper, 1996). Information about phenotypes of dnaE variants has been
gathered indirectly from E. coli knockouts strains of genes involved in DNA repair (dnaQ for
proofreading, mutS, mutL, mutH or uvrD for mismatch repair, see paragraphs 1.10.2, 1.10.3,
1.10.4) or genes encoding alternative polymerases (see paragraph 1.9.2.3).
1.10.2 Proofreading
Alleles of the gene dnaQ encoding the ε subunit of DNA Pol III in E. coli have been studied
extensively for the purpose of understanding the DNA replication mechanism and its role in
spontaneous mutagenesis. The first two mutants described were dnaQ49 (Horiuchi et al., 1978)
and the allele commonly known as mutD5 (Degnen and Cox, 1974; Cox and Horner, 1981). They
both showed conditional phenotypes. The allele dnaQ49 (Val 96 Gly, Taft-Benz and Schaaper,
1998) was a thermosensitive mutator whose mutation frequency increased by 102/2 x 103 at
30°C but at 35°C or above increased to 5 x 10⁴/105. The variant mutD5 (Thr 15 Ile, Taft-Benz and
Schaaper, 1998), was mutagenic in rich medium but not in minimal medium and the mutagenic
strength was in the order of 105 and 102 above the wild type control, respectively (Cox and
Horner, 1982; Schaaper and Cornacchio, 1992).
More recently, 20 mutagenic dnaQ alleles have been assessed for their capacity to increase the
mutation rate (Taft-Benz and Schaaper, 1998) revealing a range between weak and strong
mutators (six- to 20-fold and 7x10² to 8 x 10⁴-fold increase over the wild type, respectively). The
strongest mutator allele described is called dnaQ926 and it was created by site-specific
mutagenesis of two conserved amino acids of the active site of ε (D12A and E14A) (Fijalkowska
and Schaaper, 1996). As suggested by studies of the dnaE173 mutator, correct interaction
between subunits of the DNA polymerase core contributes to ε efficiency (Maki et al., 1991).
Mutant dnaQ991, lacking 57 amino acids from the C-terminus retained the exonuclease active
site and θ binding site but was unable to bind to the α subunit and showed a high mutation rate
(Taft-Benz and Schaaper, 1999). However, mutations in the holE gene encoding the θ subunit,
only marginally altered the mutation rate of E. coli, suggesting that θ only enhances the activity
of ε (Taft-Benz and Schaaper, 2004). dnaQ variants with strong mutator phenotypes have been
demonstrated to dramatically affect viability, dragging cells into the so-called ‘error catastrophe’
38
that other fidelity control systems are not able to buffer (Fijalkowska and Schaaper, 1996).
1.10.3 Mismatch repair
Nucleotide misincorporations that slip under base selection and proofreading activities operated
by the α and the ε subunits of the DNA Pol III core are intercepted and corrected by the
mismatch repair system (MMR).
In E. coli, MMR depends on a regulatory system based on DNA modification by methylation
(Løbner-Olesen et al., 2005). After DNA replication, a fully formed DNA molecule is methylated
on both strands. While replication is in progress, the DNA duplex becomes hemi-methylated for
about two minutes (Campbell and Kleckner, 1990), the template DNA strands are methylated
and the elongating strands are temporarily nude. Then the enzyme deoxyadenosine
methyltransferase (encoded by the gene dam) marks the adenines of the palindromic GATC
sequences of newly synthesised DNA helices with a methyl group (Marinus and Morris, 1973).
The three enzymes uniquely involved in MMR are MutS, MutL and MutH. The dimer MutS scans
the developing DNA double helix during replication (Modrich and Lahue, 1996); when it
encounters a distortion, which corresponds to an incorrect base pairing, it recruits an ATP-bound
MutL dimer that operates as an adaptor for MutH binding (Ban and Yang, 1998). MutL
hydrolyses ATP and causes a conformational change that allows MutS to activate MutH (Junop et
al., 2001). MutH is an endonuclease that nicks an unmethylated GATC sequence upstream or
downstream of the mismatch found by MutS (Junop et al., 2001); the helicase II (UvrD encoded
by uvrD) loaded on the resulting nick by MutL displaces the newly synthesised strand (Dao and
Modrich, 1998) which is degraded by an exonuclease (Exo VI or RecJ if degradation proceeds in
the 5’-3’ direction, or ExoI, ExoVII or ExoX if in the opposite orientation) (Modrich and Lahue,
1996). The ssDNA gap is initially protected by SSB and then repaired by DNA Pol III and finally
sealed by LigA. Mismatch repair is thought to be tightly associated with DNA replication, as MutS
and MutL have been shown to bind to the β2 clamp, to the subunits γ, δ and δ’ of the CLC and to
α of the core of the DNA Pol III (Pluciennik et al., 2009; Li et al., 2008; López De Saro et al., 2006).
The MMR system of E. coli is not conserved among all prokaryotes. MutH is found in some
Gram-negative bacteria only (Li, 2008) and strand discrimination is dam-independent in most
prokaryotes and all Eukaryotes (Lenhart et al., 2012).
The B. subtilis MMR system has been studied as a model for other Gram-positive species
(Lenhart et al., 2012) but its mechanism is not yet fully understood. It is evident that MutS
loaded on a sliding clamp (DnaN) scans DNA for mismatches (Lenhart et al., 2013) and once a
mismatch is recognised MutS recruits a MutL homologue (MutLH) which changes conformation
transforming MutS into a sliding clamp that scans DNA for a signal that permits recognition of
39
the newly synthesised strand (Lenhart et al., 2016); after recognition of the signal, MutLH
interacts with DnaN and nicks the nascent strand with its endonuclease active site (Pillon et al.,
2010). It is not clear whether an helicase that separates the two strands is present in all species
after MutLH activity, a UvrD homolog called RecD2 has been found in B. anthracis (Yang et al.,
2011) but in B. subtilis the same protein is not involved in MMR but in DNA replication only
(Walsh et al., 2014).The 5’-3’ Zn2+ dependent exonuclease WalJ degrades the elongating strand
while a DNA polymerase fills the gap and a ligase fixes the nick (Lenhart et al., 2016). It is not
known which type of DNA polymerase takes part in synthesis of the removed fragment, whether
it is PolC or DnaE or another accessory polymerase.
MutS has been found to be mostly present at the replicative fork in actively replicating cells in B.
subtilis (Liao et al., 2015). MutS and MutL bind to DnaE in vitro and in vivo they assemble at
active replisomes (Smith et al., 2001). A study with DnaE fused with Green Fluorescent Protein
(GFP) observed a decrease in DnaE concentration at replication forks after nucleotide
misincorporation in the nascent DNA strand (Klocko et al., 2011). It was hypothesised that MutS
bound to the DnaN clamp is able to immediately intercept mistakes left uncorrected by α and ε
of the core and when it does so, it dissociates from the replisome carrying DnaE polymerases
along with it to recruit them in DNA synthesis after mismatch removal (Klocko et al., 2011).
Localisation of MMR proteins at replisomes is independent of mismatch formation rates,
meaning that DNA replication and MMR are coordinated events and concurrently function to
avoid nucleotide substitutions early on in cell duplication in both E. coli and B. subtilis (Li et al.,
2018).
Strand discrimination is the major unexplained element of the MMR system in B. subtilis.
In Eukaryotes, strand discrimination is tightly associated with DNA replication and nicks
between Okazaki fragments serve as indicators of the newly polymerised strand; MutLH
recognises these nicks already present on the strand, and proceeds to recruit an exonuclease
(Pluciennik et al., 2010; Kadyrov et al., 2007). It is unclear how this system applies to errors on
the leading strand. Possibly, nicks in the leading strand are present as a consequence of Pol ε
activity, which takes part in the leading strand synthesis in Eukaryotes (Pursell et al., 2007). Pol ε
is more prone to accidental ribonucleotide incorporation than other polymerases (Lujan et al.,
2012). Misincorporated ribonucleotides are removed by RNase H2, which scars the nascent
strand with nicks used as markers for MMR (Lujan et al., 2013).
However how this system could apply to B. subtilis and more in general to Gram-positive
bacteria is still unknown, because it lacks a strand-specific DNA polymerase (Sanders et al.,
2010). Early studies using S. pneumoniae suggested that a ribonucleotide excision repair (RER)

40
system could serve as a dam-methylation alternative signalling system (Lacks et al., 1982). RNase
H are enzymes that cut RNA in DNA:RNA hybrids. In B. subtilis, deletion of genes encoding the
RNase H2 homologs RnhB and RnhC increased the mutation rate by only 2.4- and 1.3-fold,
respectively (Yao et al., 2013). By comparison, the deletion of mutS and mutL increased the
mutation rate by 40- 196-fold over the wild type (Ginetti et al., 1996; Sasaki et al., 2000). The
double knock out strain ΔrnhBC increased the mutation rate five-fold but also dramatically
decreased viability, possibly caused by the error catastrophe triggered by the faulty RER system
(Yao et al., 2013). The relevance of this finding was further highlighted by comparison with the
deletion of rnhB in E. coli that was not source of hypermutable phenotypes, suggesting a
specialisation of alternative systems for strand discrimination between Gram-positive and Gram-
negative bacteria (Yao et al., 2013).
The MMR system also functions to resolve the infrequent recombination of non-identical
sequences that may occur during horizontal gene transfer, although the involvement of MutS
and MutL is species-specific (Claverys and Lacks, 1986; Prunier and Leclercq, 2005; Junop et al.,
2003). It appears that in B. subtilis MMR is not as central as in E. coli and control over divergent
sequence recombination mostly relies on sequence identity at both ends of the donor strand
(Majewski and Cohan, 1998).
1.10.4 Post-replication DNA conservation mechanisms
Genomic DNA can be damaged in numerous ways from internal and external sources and,
beyond the mechanisms of fidelity control described above, other pathways are employed to
preserve DNA integrity and avoid spontaneous mutations before and after DNA replication. In
the base excision repair mechanism (BER), an incorrect base is removed by specific glycosylases
or enzymes with combined glycosylase/lyase activity that break the N-glycosyl bond between
the base and the deoxyribose of an incorrect nucleotide; apurinic/apyrimidinic endonucleases
(AP endonucleases) cut at 5’ of the abasic ribose and remove it. The most important AP
endonucleases in E. coli are exonuclease III (Exo III, which also has a 3’-5’ exonuclease domain)
and endonuclease IV (Endo IV) (Mol et al., 2000). Nucleotide excision repair (NER) is less base-
specific: the proteins UvrA and UvrB recognise DNA distortions, UvrC creates two nicks up- and
downstream the lesion and UvrD helicase removes the small portion of strand between the nicks
(Kiskeret al., 2013). The exposed 3’-OH at the gaps created by AP endonucleases or UvrD
helicases are recognised by DNA Pol I as the ends of primers and are elongated to fill the gaps. In
BER, Pol I repairs the interrupted DNA strand by degrading and simultaneously re-synthesising a
small sequence of DNA. In both systems the nick in the phospodiester backbone is fixed by a
DNA ligase (Husain et al., 1985). The fidelity control components, MutS/L/H also take part in

41
mismatch repair systems of damaged DNA in error-prone recombination events or deamination
or depurination of bases (Jinchuan Hu et al., 2017). Reactive oxygen species (ROS) create free
radicals can damage cell macromolecules and ultimately cause cell death (Ezraty et al., 2017;
Birben et al., 2012). ROS can attack DNA and create oxidised purines and pyrimidines, such as 8-
oxo,7-8 dihydro guanine (8-oxodG) and 2-oxo-dATP. During DNA replication, the two tautomeric
forms of 8-oxodG can be read as a normal G or mistaken for a T in the active site of DNA
polymerase and be paired with C or with an A, respectively. In the former case, the 8-oxodG:C
pairing causes DNA distortion, but it can be repaired by BER; in the latter case, 8-oxodG:A
pairing can result in a G:C→T:A transversion if the misincorporation is not corrected before the
next replication event (Shibutani et al., 1991; Hsu et al., 2004).
In E. coli there are three proteins involved in counteracting the mutagenic effect of 8-oxodG:
MutT, MutM and MutY encoded by the genes mutT, mutM, mutY (Fowler et al., 2003). The
nucleoside triphosphatase MutT recognises 8-oxo dGTP in the pool of dNTP and hydrolyses a
pyrophosphate from 8-oxo dGMP effectively reducing 8-oxo dGTP availability as a template for
DNA replication (Fowler and Schaaper, 1997). Following 8-oxodG misincorporation though, the
glycosylase MutM removes 8-oxodG from the nucleotide involved in the 8-oxodG:C pairing.
MutY is an adenine glycosylase that removes incorrect adenines paired with 8-oxodguanines
(Fowler et al., 2003; Michaels and Miller, 1992; Grollman and Moriya, 1993). Deletion strains of
mutT in E. coli are hypermutagenic and show a mutation rate 3,000-fold higher than the wild
type. Single and double mutM/MutY mutants are also highly mutagenic (Fowler and Schaaper,
1997). In a study by Sasaki et al. (2000) the mutagenesis rate of B. subtilis knock out strains of
some genes involved in fidelity control systems has been calculated. MutT deletion did not
affect spontaneous mutagenesis but the double mutant MutM/MutY showed the highest
mutation rate with a 1,000-fold increase over the wild type.
1.11 GREACE for P. thermoglucosidasius strain improvement At the onset of this study, genome-wide mutagenesis with GREACE had not been used for strain
improvement of B. subtilis or other Gram-positive Bacillaceae species.
Revision of the processes involved in DNA replication, fidelity control and DNA conservation
provided a number of options for producing in vivo mutators. However, it was decided to follow
the original GREACE protocol that employed proofreading-defective strains that increased their
mutation rate because of dnaQ mutation. This was in consequence of an interesting preliminary
analysis of the essential DNA replication elements of P. thermoglucosidasius. In B. subtilis strain
168 (the wild type reference strain), the 3’-5’ proofreading subunit ε and the θ subunit for DnaE
polymerase appear to be absent (Lenhart et al., 2012). Based on this model organism, we would
42
expect this to be true of P. thermoglucosidasius. However, while no gene encoding the θ subunit
homologue is evident on the P. thermoglucosidasius NCIMB 11955 chromosome, this species
does encode a 3’-5’ exonuclease of the ε-type (DnaQ) similar to that in E. coli. While the amino
acid sequence identity of the putative DnaQ from P. thermoglucosidasius NCIMB 11955 and ε
from E. coli performed with BLASTp (Gertz et al., 2006) is only 21.56 %, the DEDDh motif in the
active active site is conserved.
The presence of an ε homologue in P. thermoglucosidasius NCIMB 11955 is not unique within
the Firmicutes phylum (Akashi and Yoshikawa, 2013). Bruck and colleagues (2003) found that in
Streptococcus pyogenes there is a ε homologue with 3’-5’ exonuclease activity (DnaQ,
AAL98426.1), but also no evidence of a θ homologue. DnaQ could not associate with α tightly
enough to be co-separated by gel filtration, and α was not stalled by DnaQ in bypassing a
misincorporation (in E. coli, α activity slows down to let ε correct the lesion) (Bruck et al., 2003).
These evidences suggested that DnaQ in S. pyogenes was not directly involved in proofreading of
the DnaE polymerase. However, in a study of the replisome components in the Gram-negative
extremophile Aquifex aeolicus, Bruck et al., (2002) found that the subunits α (DnaE) and ε
(DnaQ) interacted in an ELISA-like test but did not co-migrate on a gel separation column. The
authors suggested that tight interaction was conditional and required high temperatures, a
primed DNA or the involvement of other proteins, given that the θ subunit is also missing in A.
aeolicus. S. pyogenes MGAS8232 DnaQ retains DEDDh motif of the DnaQ-like/exo superfamily
(cl10012) and shares 27.54 % identity with P. thermoglucosidasius NCIMB 11955 DnaQ, but none
with ε from E. coli (performed with BLASTp; Gertz et al., 2006).
The role of DnaQ in Gram-positive bacteria does not appear to have been investigated any
further. However, the evidence from S. pyogenes that this is likely to be a functional
endonuclease, together with transcriptomic evidence that dnaQ is expressed in P.
thermoglucosidasius NCIMB 11955 (Lisowska, Ferla and Leak, unpublished data) and the fact
that later analyses showed that DnaQ is ubiquitous amongst Parageobacillus and Geobacillus
spp. suggests that it must have some role in fidelity control in these organisms. This exercise
could have been done mutating the proofreading domain of P. thermoglucosidasius PolC,
however, given the advantage of working with a homologue of the E. coli protein and the
problems of mutating a polymerase (a 4.3 kb-gene) with an integral exonuclease, this project
focussed on the DnaQ homologue in P. thermoglucosidasisus NCIMB 11955.
43
Aim and objectives
The ethanologenic thermophile P. thermoglucosidasius has been used in industry to produce
second generation bioethanol from renewable sources. However, its low tolerance to high
concentrations of glucose and moderate concentrations of ethanol limit its commercial
application. Although there may be process engineering approaches to address these problems,
improvement in both glucose tolerance and ethanol tolerance would widen process options and
create a more versatile ethanologen. These traits are complex phenotypes controlled by an
undefined number of genes and proteins.
At the start of the project a conservative approach was taken, following both GREACE and gTME
strategies in parallel to elicit complex phenotypes. However, given the success of the GREACE
strategy and the limited time available the gTME strategy was not pursued beyond the
development of tools which could be valuable for future studies. Therefore, at the outset the
aims of this project were:
1) to use the information available from mutagenic studies with dnaQ in E. coli to create
mutator versions of the dnaQ homologue in P. thermoglucosidasius NCIMB 11955 and,
through the development of the necessary tools, evaluate their potential;
2) to develop and apply gTME methodology for P. thermoglucosidasius NCIMB 11955 with
a focus on the sigma factor σ70;
3) to apply one or both of these methods to the evolution/selection of complex
phenotypes in P. thermoglucosidasius NCIMB 11955, with a particular focus on glucose
tolerance and ethanol tolerance;
4) use genomic or transcriptomic analysis to reveal the underlying mutations of expression
patterns that gave rise to these complex phenotypes.
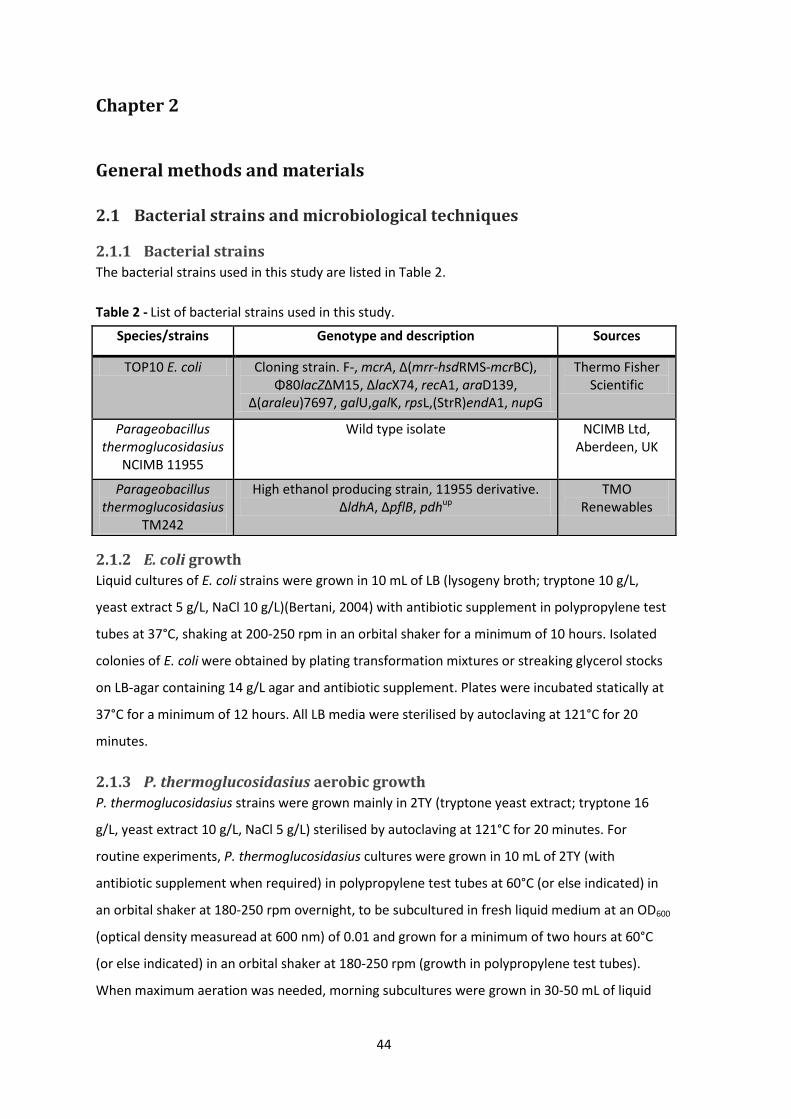
44
Chapter 2
General methods and materials
2.1 Bacterial strains and microbiological techniques
2.1.1 Bacterial strains
The bacterial strains used in this study are listed in Table 2.
Table 2 - List of bacterial strains used in this study.
Species/strains Genotype and description Sources
TOP10 E. coli Cloning strain. F-, mcrA, Δ(mrr-hsdRMS-mcrBC), Φ80lacZΔM15, ΔlacX74, recA1, araD139,
Δ(araleu)7697, galU,galK, rpsL,(StrR)endA1, nupG
Thermo Fisher Scientific
Parageobacillus thermoglucosidasius
NCIMB 11955
Wild type isolate NCIMB Ltd, Aberdeen, UK
Parageobacillus thermoglucosidasius
TM242
High ethanol producing strain, 11955 derivative. ΔldhA, ΔpflB, pdhup
TMO Renewables
2.1.2 E. coli growth
Liquid cultures of E. coli strains were grown in 10 mL of LB (lysogeny broth; tryptone 10 g/L,
yeast extract 5 g/L, NaCl 10 g/L)(Bertani, 2004) with antibiotic supplement in polypropylene test
tubes at 37°C, shaking at 200-250 rpm in an orbital shaker for a minimum of 10 hours. Isolated
colonies of E. coli were obtained by plating transformation mixtures or streaking glycerol stocks
on LB-agar containing 14 g/L agar and antibiotic supplement. Plates were incubated statically at
37°C for a minimum of 12 hours. All LB media were sterilised by autoclaving at 121°C for 20
minutes.
2.1.3 P. thermoglucosidasius aerobic growth
P. thermoglucosidasius strains were grown mainly in 2TY (tryptone yeast extract; tryptone 16
g/L, yeast extract 10 g/L, NaCl 5 g/L) sterilised by autoclaving at 121°C for 20 minutes. For
routine experiments, P. thermoglucosidasius cultures were grown in 10 mL of 2TY (with
antibiotic supplement when required) in polypropylene test tubes at 60°C (or else indicated) in
an orbital shaker at 180-250 rpm overnight, to be subcultured in fresh liquid medium at an OD600
(optical density measuread at 600 nm) of 0.01 and grown for a minimum of two hours at 60°C
(or else indicated) in an orbital shaker at 180-250 rpm (growth in polypropylene test tubes).
When maximum aeration was needed, morning subcultures were grown in 30-50 mL of liquid
45
2TY (with antibiotic supplement when required) in 250 mL baffled flasks with silicone sponge
closures (Chemglass), at 60°C in an orbital shaker at 180 to 250 rpm for a minimum of 2 hours
(growth in flasks).
2TY plates were made by adding 14 g/L agar prior to autoclaving. P. thermoglucosidasius plates
were wrapped in plastic bags prior to incubation at 52°C, 55°C or 60°C to prevent from drying.
To avoid dramatic changes in temperature when sub-culturing, the new medium was pre-
warmed to at least 50°C prior to inoculation.
Where specified, P. thermoglucosidasius was grown in minimal medium ASSM (ammonium
sulphates salts medium) supplemented with a carbon source. ASSM was prepared with 8 mM
citric acid, 5 mM MgSO4·7H2O, 20 mM NaH2PO4·2H2O, 10mM K2SO4, 25 mM (NH4)2SO4, 80 µM
CaCl2, 1.65 µM Na2MoO4·2H2O, trace element solution 5mL/L, 12 µM biotin and 13 µM thiamine,
adjusted to pH 7.0 with KOH prior to filter sterilisation. Trace elements contained ZnSO4·7H2O
1.44 g/L, CoSO4·6H2O 0.56 g/L,CuSO4·5H2O 0.25 g/L, FeSO4·6H2O 0.89 g/L, NiSO4·6H2O 0.89 g/L,
MnSO4 1.69 g/L, H3BO3 0.08 g/L and 12M H2SO4 5.0 mL/L. In flask growth experiments, this was
typically supplemented with 10 g/L glucose and 1 g/L yeast extract, however in this study
glucose and yeast extract concentrations are specified in the relevant results section. ASSM
medium with and without supplements was filter-sterilised.
The P. thermoglucosidasius strain cultured in bioreactor (described in paragraph 2.1.7) was
grown in 2SPY medium composed of 16 g/L soy peptone, 8 g/L yeast extract, 5 g/L NaCl
supplemented with various concentrations of glucose or ethanol and kanamycin for plasmid
retention. Since 2SPY was prepared in large batches and it contained glucose and ethanol,
sterilisation was performed with bottle-top filter units of 0.02 µm-pore diameter (Nalgene
Rapid-flow sterile disposable bottle top filters with PES membrane, Thermo Fisher Scientific).
2.1.4 P. thermoglucosidasius anaerobic growth
Overnight cultures from separate colonies were prepared in 10 mL of 2SPY (with antibiotic
supplement when required) in polypropylene test tubes and grown at 60°C in an orbital shaker
at 200 rpm, they were subcultured in the morning in ratio 1/10 in the same kind of medium and
grown at 60°C in an orbital shaker at 250 rpm, when the subcultures reached an OD600 of 1.5-2, 1
mL was used to inoculate liquid cultures of 10 mL prepared in glass test tubes of 15 mL for
anaerobic growth at 60°C with horizontal shaking at 200 rpm. To avoid foam formation,
Antifoam 204 (Sigma) (AF) was used in proportion 1/50 to the culture volume. Media for
anaerobic growth in small volumes were adjusted to pH 7 and then supplemented with filter-
sterilised 40 mM triple buffer (TB), composed of 40 mM HEPES (2-[4-(2-hydroxyethyl)-1-
piperazinyl]-ethane sulfonic acid, adjusted to pH 7.46), 40 mM MOPS (3-(N-morpholino)propane
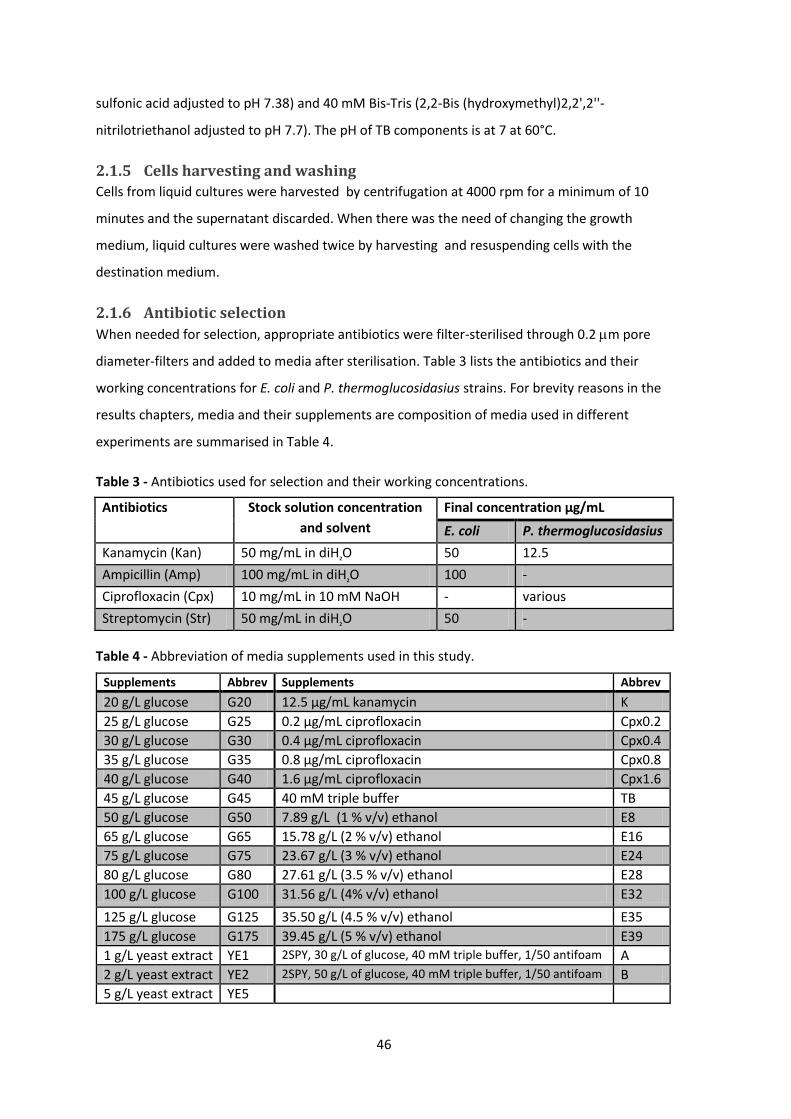
46
sulfonic acid adjusted to pH 7.38) and 40 mM Bis-Tris (2,2-Bis (hydroxymethyl)2,2',2''-
nitrilotriethanol adjusted to pH 7.7). The pH of TB components is at 7 at 60°C.
2.1.5 Cells harvesting and washing
Cells from liquid cultures were harvested by centrifugation at 4000 rpm for a minimum of 10
minutes and the supernatant discarded. When there was the need of changing the growth
medium, liquid cultures were washed twice by harvesting and resuspending cells with the
destination medium.
2.1.6 Antibiotic selection
When needed for selection, appropriate antibiotics were filter-sterilised through 0.2 m pore
diameter-filters and added to media after sterilisation. Table 3 lists the antibiotics and their
working concentrations for E. coli and P. thermoglucosidasius strains. For brevity reasons in the
results chapters, media and their supplements are composition of media used in different
experiments are summarised in Table 4.
Table 3 - Antibiotics used for selection and their working concentrations.
Antibiotics Stock solution concentration
and solvent
Final concentration µg/mL
E. coli P. thermoglucosidasius
Kanamycin (Kan) 50 mg/mL in diH₂O 50 12.5
Ampicillin (Amp) 100 mg/mL in diH₂O 100 -
Ciprofloxacin (Cpx) 10 mg/mL in 10 mM NaOH - various
Streptomycin (Str) 50 mg/mL in diH₂O 50 -
Table 4 - Abbreviation of media supplements used in this study.
Supplements Abbrev Supplements Abbrev
20 g/L glucose G20 12.5 µg/mL kanamycin K
25 g/L glucose G25 0.2 µg/mL ciprofloxacin Cpx0.2
30 g/L glucose G30 0.4 µg/mL ciprofloxacin Cpx0.4
35 g/L glucose G35 0.8 µg/mL ciprofloxacin Cpx0.8
40 g/L glucose G40 1.6 µg/mL ciprofloxacin Cpx1.6
45 g/L glucose G45 40 mM triple buffer TB
50 g/L glucose G50 7.89 g/L (1 % v/v) ethanol E8
65 g/L glucose G65 15.78 g/L (2 % v/v) ethanol E16
75 g/L glucose G75 23.67 g/L (3 % v/v) ethanol E24
80 g/L glucose G80 27.61 g/L (3.5 % v/v) ethanol E28
100 g/L glucose G100 31.56 g/L (4% v/v) ethanol E32
125 g/L glucose G125 35.50 g/L (4.5 % v/v) ethanol E35
175 g/L glucose G175 39.45 g/L (5 % v/v) ethanol E39
1 g/L yeast extract YE1 2SPY, 30 g/L of glucose, 40 mM triple buffer, 1/50 antifoam A
2 g/L yeast extract YE2 2SPY, 50 g/L of glucose, 40 mM triple buffer, 1/50 antifoam B
5 g/L yeast extract YE5

47
2.1.7 Microbial fermentation in benchtop bioreactor
The kanamycin resisitant P. thermoglucosidasius strain of interest was run in continuous culture
in a benchtop chemostat controlled by the DCU tower of Biostat B (Sartorius Stedim Biotech).
The culture volume was 1.5 L in a 2 L jacketed glass vessel topped with a stainless steel
headplate from Bbi-Biotech GmbH with ports for inoculation, pH and redox probe, oxygen
probe, thermometer, foam detector, air inlet, air outlet with condenser, media inlet and outlet,
anti-foam inlet, acid and base inlets, stirrer for two six-bladed impellers on a single shaft and
sampling system (Figure 9). Before utilisation the vessel was filled with 1.5 L of deionised water
(diH2O), the probes were calibrated, tubing was fitted in all inlets and outlets and properly
clamped, 0.2 µm pore filters were placed at air outlets and inlets and acid, base and antifoam
inlets were connected to bottles and filled with 5 M H3PO4, 5 M KOH and Antifoam 204 (Sigma),
respectively. The whole apparatus, the waste bottle and the media bottle were autoclaved at
121°C for 20 minutes. After sterilisation the bioreactor was placed on the integrated scale and
connected to the Biostat B. All the hoses where properly fitted and clamped to the pumps, water
was pumped out and replaced with media, pH was adjusted to 7 and temperature set at 60°C.
The P. thermoglucosidasius strain from either a glycerol stock or a liquid culture was spread on a
2TYK plate making sure of covering the full plate surface and incubated overnight at 60°C in a
static incubator; in the morning about ¾ of the cells on the plate were used to start a liquid
culture in 120 mL of 2TYK in a 250 mL baffled flask incubated at 60°C in an orbital shaker at 250
rpm; when the OD600 reached 4-5, 100 mL were used to inoculate 1.5 L of 2SPYK supplemented
with 30 g/L of glucose in the bioreactor (2SPYKG30).
After inoculation the bioreactor ran in batch in aerobic conditions for 1 hour (1 litre per minute
(Lpm) of air, agitation at 600 rpm), pH at 7, antifoam automatically controlled by the main unit
and temperature kept at 60°C. After 1 hour the settings were changed to have micro-aerobic
conditions in “cascade” mode: with this setting, while pH and temperature were maintained
constant by the main unit, stirring and air sparging were allowed to vary in order to have the
redox value at -280 mV with ±10 mV of range, which was determined to be the setting for
glucose fermentation into ethanol by previous experiments (Hussein et al., 2015). The operator
can still manipulate redox values indirectly by setting ranges for stirring and aeration. Culture
samples were taken hourly to measure OD600 and quantify the glucose content on the HPLC.
When glucose was less than 10 g/L and OD600 reached high values between 15 and 20, the
chemostat was run in continuous.
Medium was constantly fed by an external pump at a defined flow rate (mostly 150 mL/h, but
there were some variations), the weight of the culture was maintained constant by an integrated
gravimetric system that pumped out culture volume when weight increase was detected to be

48
more than 10 % of the total weight.
In this study, glucose fermentation into ethanol was carried out in micro-aeration conditions.
Low concentrations of oxygen are not precisely detectable with oxygen probes, therefore the
oxidation-reduction potential probe is used to infer the oxygen concentration instead. Redox
values vary linearly with the logarithmic of oxygen in solution, small variations of oxygen
concentration are more finely detected (Chen et al., 2020). Negative redox values indicate that
the culture medium is a reductive environment that counterbalances intracellular oxidative
processes. Dividing cells that require energy (increasing OD600 values) tend to decrease redox
values. In other words, redox values express the difference between provided and used oxygen.
In chemostat experiments, specific redox values are associated with metabolic processes and to
keep these values constant when OD600 varies one can alter aeration or stirring.
Media to be fed in were prepared in large batches (3-10 L) and filter sterilised in the media
bottle directly using a capsule filter with 0.2 µm diameter pore PES membrane Polycap TC 36
Figure 9 - Chemostat in operation, connected to the Biostat B system (Sartorius Stedim Biotech).
49
(Whatman). To avoid contamination in the media bottle, pH was adjusted to 5.7 with H3PO4,
being 5.5 the lower limit for kanamycin stability (Sigma fact sheet for kanamycin sulphate) and
media bottle was wrapped with frozen ice bags. To keep glucose in solution, media was slowly
agitated with a magnetic stirrer. At regular intervals of 2-3 hours, a culture sample of about 2 mL
was taken to measure OD600 and determine the concentration of glucose and ethanol by HPLC.
At the steady state reached after 30 hours corresponding to three culture volumes (1.5 L x 3 =
4.5 L) of media pumped in at a flow rate of 0.150 L/h (1.5L /0.150 L/h) x 3 = 30 h, samples were
taken and analysed by HPLC every half hour to verify that OD600, glucose and ethanol content
remained constant.
2.1.8 Calculation of viable cells on agar plates
To calculate the number of viable cells in a liquid culture, a tenfold dilution series (usually up to
10-6 ) in 1 mL final volume was prepared in sterile 1.5 mL tubes. Pipette tips were changed from
one dilution to the next to avoid technical errors, cells were mixed thoroughly by inverting the
1.5 mL tubes three times before passing to the next dilution. From each tube, three spots of 20
µL were placed on a well dry plate of solid medium with appropriate antibiotic selection divided
in sections corresponding to dilutions. When spots were dry, plates were moved to a static
incubator (if E. coli at 37°C , if P. thermoglucosdidasius 55-60°C) and left overnight to let cells
grow. Single colonies were counted on dilution sections where they appeared clearly separated
from one another and less than 200 in all the three spots. If the tenfold dilution was respected
from one section to the next, the number of colonies in the lower dilution was considered to
calculate the colony forming unit per mL (CFU/mL) using the following formula:
CFU mL = number of colonies in the three 20 µL spots 3 × 50 × dilution factor
2.1.9 Calculation of growth rate
The growth curves of strains grown in batch liquid culture were obtained by plotting the natural
logarithm of the OD600 values 𝐥𝐧(𝐎𝐃𝟔𝟎𝟎) registered at regular intervals against time (hours).
The growth rate µ was calculated from the slope m of the trend line of the growth curve limited
to the exponential phase. Doubling time in h-1 was calculated by the formula:
𝒕𝒅 = 𝐥𝐧(𝟐) 𝝁
Equivalent values in minutes were obtained by multiplying by 60.
The growth rate µ of continuous culture not at steady state but at washing out risk was
calculated using the formula:
𝝁 = 𝒎 + 𝑫
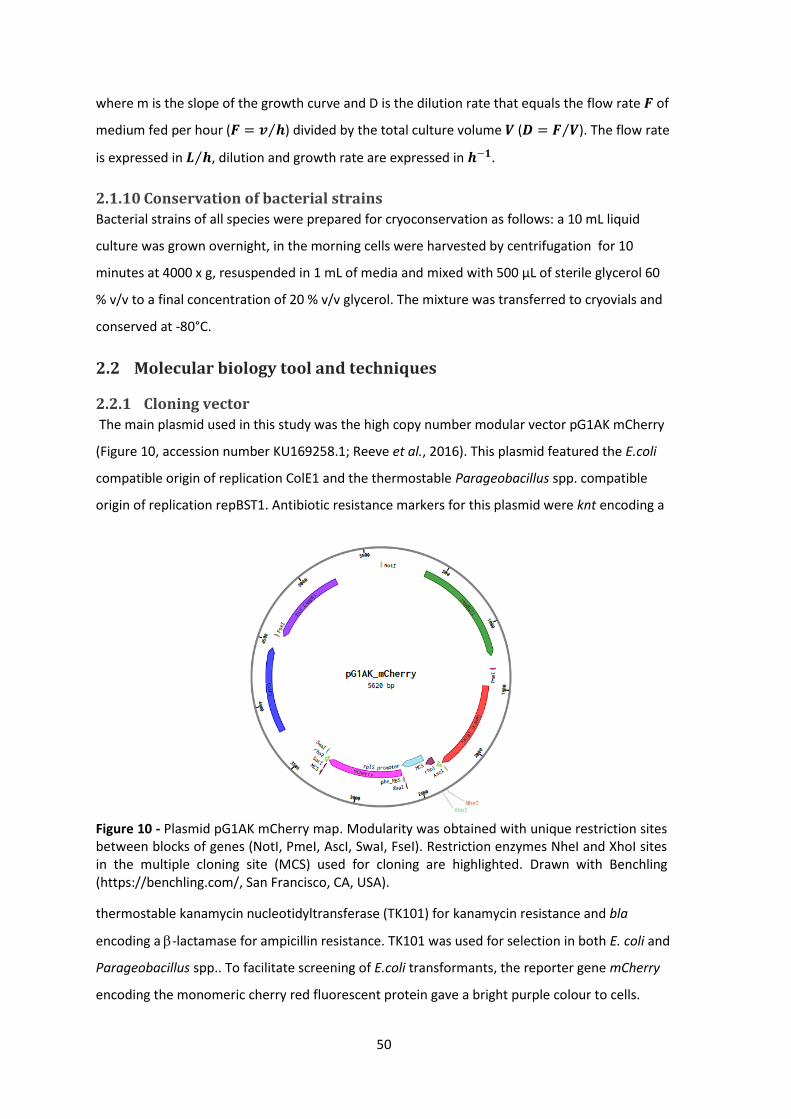
50
where m is the slope of the growth curve and D is the dilution rate that equals the flow rate 𝑭 of
medium fed per hour (𝑭 = 𝒗 𝒉 ) divided by the total culture volume 𝑽 (𝑫 = 𝑭 𝑽 ). The flow rate
is expressed in 𝑳 𝒉 , dilution and growth rate are expressed in 𝒉−𝟏.
2.1.10 Conservation of bacterial strains
Bacterial strains of all species were prepared for cryoconservation as follows: a 10 mL liquid
culture was grown overnight, in the morning cells were harvested by centrifugation for 10
minutes at 4000 x g, resuspended in 1 mL of media and mixed with 500 µL of sterile glycerol 60
% v/v to a final concentration of 20 % v/v glycerol. The mixture was transferred to cryovials and
conserved at -80°C.
2.2 Molecular biology tool and techniques
2.2.1 Cloning vector
The main plasmid used in this study was the high copy number modular vector pG1AK mCherry
(Figure 10, accession number KU169258.1; Reeve et al., 2016). This plasmid featured the E.coli
compatible origin of replication ColE1 and the thermostable Parageobacillus spp. compatible
origin of replication repBST1. Antibiotic resistance markers for this plasmid were knt encoding a
thermostable kanamycin nucleotidyltransferase (TK101) for kanamycin resistance and bla
encoding a -lactamase for ampicillin resistance. TK101 was used for selection in both E. coli and
Parageobacillus spp.. To facilitate screening of E.coli transformants, the reporter gene mCherry
encoding the monomeric cherry red fluorescent protein gave a bright purple colour to cells.
Figure 10 - Plasmid pG1AK mCherry map. Modularity was obtained with unique restriction sites between blocks of genes (NotI, PmeI, AscI, SwaI, FseI). Restriction enzymes NheI and XhoI sites in the multiple cloning site (MCS) used for cloning are highlighted. Drawn with Benchling (https://benchling.com/, San Francisco, CA, USA).
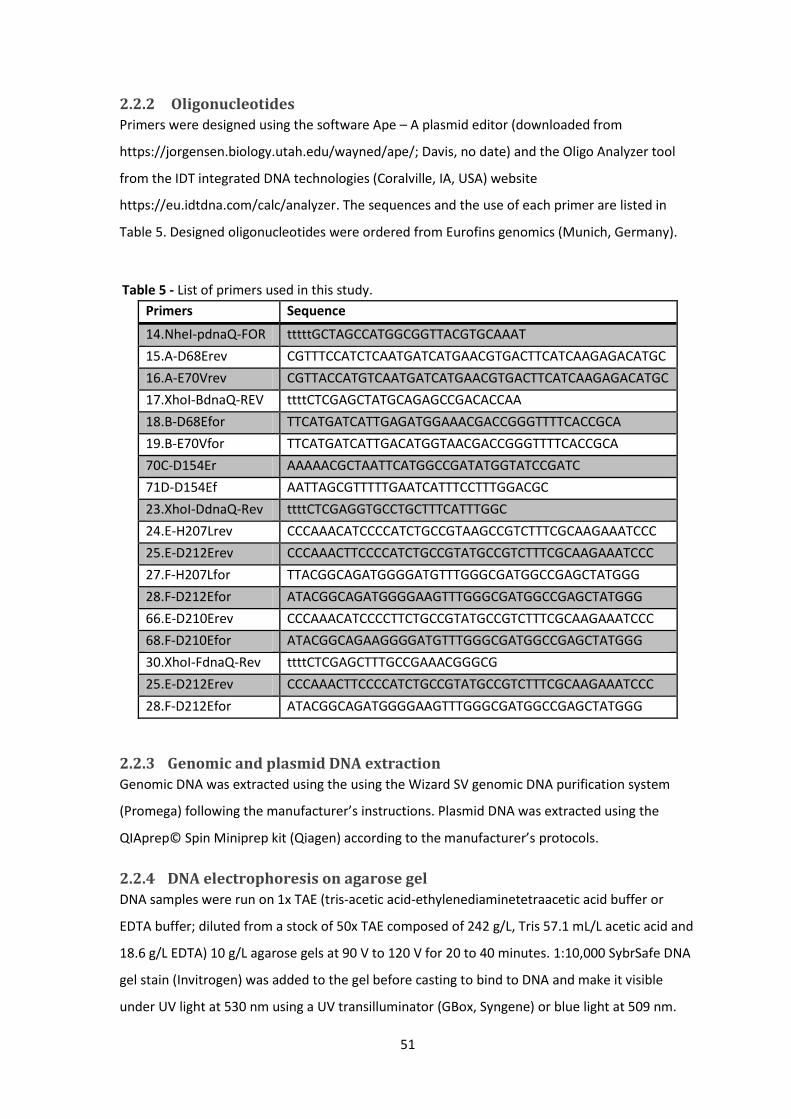
51
2.2.2 Oligonucleotides
Primers were designed using the software Ape – A plasmid editor (downloaded from
https://jorgensen.biology.utah.edu/wayned/ape/; Davis, no date) and the Oligo Analyzer tool
from the IDT integrated DNA technologies (Coralville, IA, USA) website
https://eu.idtdna.com/calc/analyzer. The sequences and the use of each primer are listed in
Table 5. Designed oligonucleotides were ordered from Eurofins genomics (Munich, Germany).
2.2.3 Genomic and plasmid DNA extraction
Genomic DNA was extracted using the using the Wizard SV genomic DNA purification system
(Promega) following the manufacturer’s instructions. Plasmid DNA was extracted using the
QIAprep© Spin Miniprep kit (Qiagen) according to the manufacturer’s protocols.
2.2.4 DNA electrophoresis on agarose gel
DNA samples were run on 1x TAE (tris-acetic acid-ethylenediaminetetraacetic acid buffer or
EDTA buffer; diluted from a stock of 50x TAE composed of 242 g/L, Tris 57.1 mL/L acetic acid and
18.6 g/L EDTA) 10 g/L agarose gels at 90 V to 120 V for 20 to 40 minutes. 1:10,000 SybrSafe DNA
gel stain (Invitrogen) was added to the gel before casting to bind to DNA and make it visible
under UV light at 530 nm using a UV transilluminator (GBox, Syngene) or blue light at 509 nm.
Table 5 - List of primers used in this study.
Primers Sequence
14.NheI-pdnaQ-FOR tttttGCTAGCCATGGCGGTTACGTGCAAAT
15.A-D68Erev CGTTTCCATCTCAATGATCATGAACGTGACTTCATCAAGAGACATGC
16.A-E70Vrev CGTTACCATGTCAATGATCATGAACGTGACTTCATCAAGAGACATGC
17.XhoI-BdnaQ-REV ttttCTCGAGCTATGCAGAGCCGACACCAA
18.B-D68Efor TTCATGATCATTGAGATGGAAACGACCGGGTTTTCACCGCA
19.B-E70Vfor TTCATGATCATTGACATGGTAACGACCGGGTTTTCACCGCA
70C-D154Er AAAAACGCTAATTCATGGCCGATATGGTATCCGATC
71D-D154Ef AATTAGCGTTTTTGAATCATTTCCTTTGGACGC
23.XhoI-DdnaQ-Rev ttttCTCGAGGTGCCTGCTTTCATTTGGC
24.E-H207Lrev CCCAAACATCCCCATCTGCCGTAAGCCGTCTTTCGCAAGAAATCCC
25.E-D212Erev CCCAAACTTCCCCATCTGCCGTATGCCGTCTTTCGCAAGAAATCCC
27.F-H207Lfor TTACGGCAGATGGGGATGTTTGGGCGATGGCCGAGCTATGGG
28.F-D212Efor ATACGGCAGATGGGGAAGTTTGGGCGATGGCCGAGCTATGGG
66.E-D210Erev CCCAAACATCCCCTTCTGCCGTATGCCGTCTTTCGCAAGAAATCCC
68.F-D210Efor ATACGGCAGAAGGGGATGTTTGGGCGATGGCCGAGCTATGGG
30.XhoI-FdnaQ-Rev ttttCTCGAGCTTTGCCGAAACGGGCG
25.E-D212Erev CCCAAACTTCCCCATCTGCCGTATGCCGTCTTTCGCAAGAAATCCC
28.F-D212Efor ATACGGCAGATGGGGAAGTTTGGGCGATGGCCGAGCTATGGG
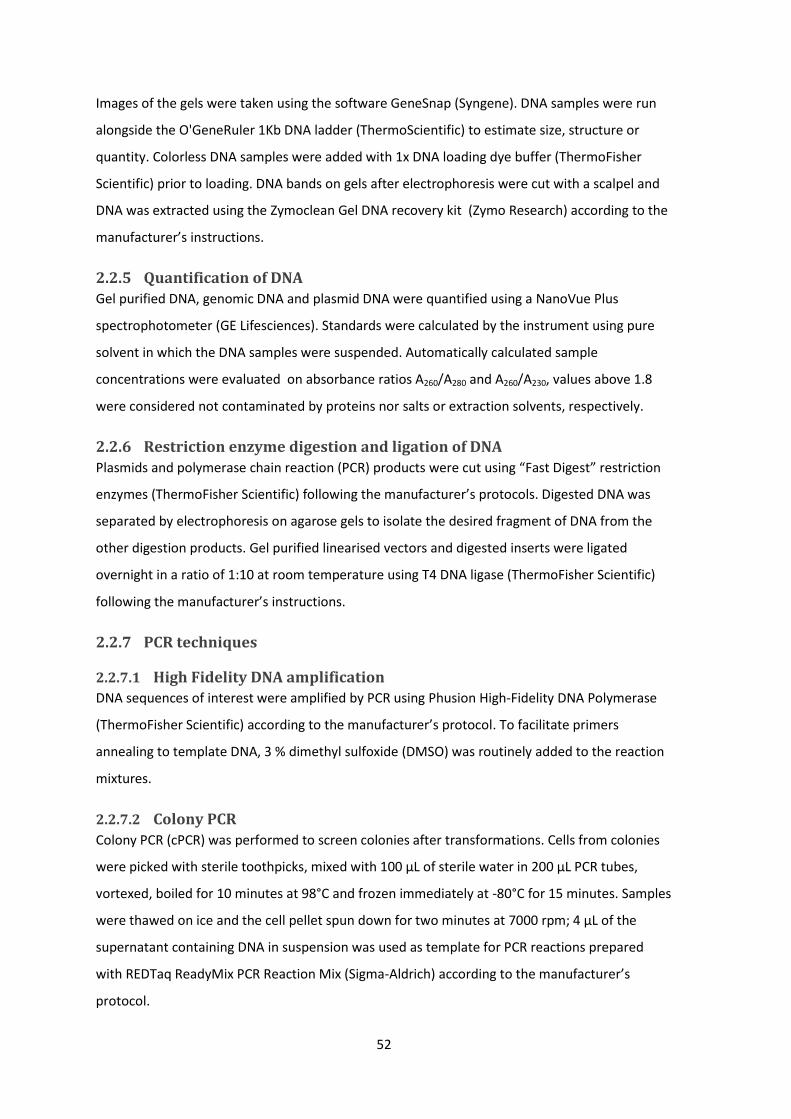
52
Images of the gels were taken using the software GeneSnap (Syngene). DNA samples were run
alongside the O'GeneRuler 1Kb DNA ladder (ThermoScientific) to estimate size, structure or
quantity. Colorless DNA samples were added with 1x DNA loading dye buffer (ThermoFisher
Scientific) prior to loading. DNA bands on gels after electrophoresis were cut with a scalpel and
DNA was extracted using the Zymoclean Gel DNA recovery kit (Zymo Research) according to the
manufacturer’s instructions.
2.2.5 Quantification of DNA
Gel purified DNA, genomic DNA and plasmid DNA were quantified using a NanoVue Plus
spectrophotometer (GE Lifesciences). Standards were calculated by the instrument using pure
solvent in which the DNA samples were suspended. Automatically calculated sample
concentrations were evaluated on absorbance ratios A260/A280 and A260/A230, values above 1.8
were considered not contaminated by proteins nor salts or extraction solvents, respectively.
2.2.6 Restriction enzyme digestion and ligation of DNA
Plasmids and polymerase chain reaction (PCR) products were cut using “Fast Digest” restriction
enzymes (ThermoFisher Scientific) following the manufacturer’s protocols. Digested DNA was
separated by electrophoresis on agarose gels to isolate the desired fragment of DNA from the
other digestion products. Gel purified linearised vectors and digested inserts were ligated
overnight in a ratio of 1:10 at room temperature using T4 DNA ligase (ThermoFisher Scientific)
following the manufacturer’s instructions.
2.2.7 PCR techniques
2.2.7.1 High Fidelity DNA amplification
DNA sequences of interest were amplified by PCR using Phusion High-Fidelity DNA Polymerase
(ThermoFisher Scientific) according to the manufacturer’s protocol. To facilitate primers
annealing to template DNA, 3 % dimethyl sulfoxide (DMSO) was routinely added to the reaction
mixtures.
2.2.7.2 Colony PCR
Colony PCR (cPCR) was performed to screen colonies after transformations. Cells from colonies
were picked with sterile toothpicks, mixed with 100 µL of sterile water in 200 µL PCR tubes,
vortexed, boiled for 10 minutes at 98°C and frozen immediately at -80°C for 15 minutes. Samples
were thawed on ice and the cell pellet spun down for two minutes at 7000 rpm; 4 µL of the
supernatant containing DNA in suspension was used as template for PCR reactions prepared
with REDTaq ReadyMix PCR Reaction Mix (Sigma-Aldrich) according to the manufacturer’s
protocol.
53
2.2.7.3 Overlapping PCR
Overlapping PCR was performed as a fast method to insert point mutations in genes of interest.
Firstly, two sequences of roughly the same size flanking the base to be mutated were PCR
amplified with Phusion High-Fidelity DNA Polymerase (ThermoFisher Scientific, paragraph
2.2.7.1) (Figure 11.A). They were roughly 20 base pairs (bp) apart and between the two they
covered the full length of the gene of interest. The 20 bp linker contained the base to be
mutated. The reverse primer of the sequence upstream the mutation and the forward primer of
the downstream sequence were modified to have a tail similar to the 20 bp linker but comprising
a new base in correspondence of the desired point mutation.
Secondly, amplicons were run on an agarose gel, the bands were cut and the DNA purified (as
described in paragraph 2.2.4). Thirdly, the two sequences were mixed together in a short PCR
reaction without primers, where amplification was primed by the overlapping linker regions
(Figure 11.B1). After ten cycles they assembled and formed a DNA molecule with the full length
sequence of the gene of interest modified at the desired base. Finally, the forward primer of the
upstream sequence and the reverse primer of the downstream sequence were added to the
same mixture to amplify the newly formed template (Figure 11.B2). These primers were
modified to have restriction enzymes recognition sites at their 5’ end to allow digestion and
Figure 11 - Steps to insert point mutation in a gene of interest by overlapping PCR. The gene of interest is in blue, the red star is the base pair to be mutated; external primers are in orange, internal primers are in green. Internal primers anneal roughly 20 bp apart on the gene, they have a complementary tail that corresponds to the 20 bp linker region and it carries the new base that insert the point mutation (yellow star). A.The sequences upstream and downstream the bp to be mutated are PCR amplified separately. B1.The two sequences are then mixed together in a short PCR with only 10 cycles, they anneal by the tails which also prime the amplification of one another (dashed arrows). B2. External primers are added to the PCR mixture, the gene of interest is amplified in a standard PCR and the product now carries the desired point mutation. External primers have restriction enzymes recognition sites which allow digestion and ligation with a vector.

54
ligation in the multiple cloning site (MCS) of the vector. Overlapping PCR was carried out with
Phusion High-Fidelity DNA Polymerase (ThermoFisher Scientific) following the conditions
described in Table 6 and Figure 12.
Table 6 - PCR mix and primers mix to be used at different steps of the overlapping PCR.
Overlapping PCR mix Volume up to 15 µL
diH₂O 9.4 µL
HF buffer (5x→1x) 4 µL
dNTPs (10 mM→0.2 µM) 0.4 µL
PCR amplified, gel purified upstream DNA sequence (100 ng/µL) 0.5 µL
PCR amplified, gel purified downstream DNA sequence (100 ng/µL) 0.5 µL
Phusion High-Fidelity DNA Polymerase (0.2 u/µL) 0.2 µL
Primers mix Volume up to 5 µL
Forward primer (10 µM→0.5 µM) 1 µL
Reverse primer (10 µM→0.5 µM) 1 µL
diH₂O 3 µL
Figure 12 - Conditions of the two-step overlapping PCR. Boxes indicate variable temperature and times depending on sequences. In the first round of cycles the extension time depends on the size of the sequences upstream and downstream the point mutation. In the second round of cycles the melting temperature (Tm) depends on the external primers and the extension time doubles the one in the first round.
55
2.2.8 Cloning in E. coli
2.2.8.1 Preparation of chemically competent E. coli cells
E. coli cloning strain TOP10 was grown overnight in liquid LB with 50 µg/mL streptomycin at 37°C
with horizontal shaking at 200 rpm, in the morning 1 mL was used to inoculated 100 mL of fresh
LB, without antibiotic, at 37°C, kept in aerobic conditions by using a 250 mL glass baffled flask, a
silicone sponge closure (Chemglass) and horizontal shaking at 200-250 rpm. When OD600 reached
0.8-1, the liquid culture was aliquoted in two 50 mL polypropylene test tubes and chilled on ice
for 10 minutes, cells were spun down at 4000 rpm for 15 minutes at 4°C, the supernatant was
discarded and cells were resuspended in 25 mL of ice-cold TfbI buffer (30 mM C2H3KO2, 50 mM
MCl2, 10 mM RbCl2, 10 mM CaCl2, 15% glycerol, pH 5.8 using acetic acid); after incubation on ice
for 10 minutes cells were spun down again at 4000 rpm for 15 minutes at 4°C, the supernatant
discarded, 2 mL of ice-cold TfbII buffer (10 mM MOPS, 75 mM CaCl2, 10 mM RbCl2, 15% glycerol,
pH 6.5 using KOH) were added, cells were resuspended and incubated on ice for 2 hours; 100 µL
aliquots were prepared in 1.5 mL tubes, snap-frozen in liquid nitrogen and stored at -80°C.
2.2.8.2 Transformation of chemically competent E. coli cells
Chemically competent E. coli cells were thawed on ice for 15 minutes, 300 ng of plasmid DNA or
5 µL of ligation reactions were gently added and the plasmid-cells mixture was incubated for 30
minutes on ice; after heat shock at 42°C for 1 minute, cells were incubated on ice for 5 minutes;
1 mL of LB with no antibiotics was added to the tube and cells were left to recover and grow for
1 hour at 37°C in a shaking incubator at 200 rpm; cells were harvested by centrifugation for 5
minutes at 5000 rpm, resuspended in 100 mL of LB and plated on solid LB with the appropriate
antibiotic selection.
2.2.9 Cloning in P. thermoglucosidasius
2.2.9.1 Preparation of electrocompetent P. thermoglucosidasius cells
P. thermoglucosidasius was made electrocompetent using an adapted protocol from TMO
Renewables. A P. thermoglucosidasius overnight culture was passaged in 100 mL of liquid 2TY in
a 250 mL glass baffled flask with a silicone sponge closure (Chemglass) with horizontal shaking at
200-250 rpm, at 60°C, to an OD600 of 0.1. When the OD600 reached 1.5, the liquid culture was
aliquoted in two 50 mL polypropylene test tubes and chilled on ice for 15 minutes. Cells were
washed 3 times with 50 mL, 25 mL and 10 mL of freshly made electroporation medium (0.5 M
sorbitol, 0.5 M mannitol, 10 % v/v glycerol, filter sterilised and pre-cooled at -20°C) by
centrifugation at 4°C at 4000 rpm for 10 minutes. Cells were gently resuspended using cut sterile
p1000 tips pre-cooled at -20°C. After the last washing step, cells were resuspended in 1 mL of

56
electroporation medium, 100 µL aliquots in 1.5 mL tubes pre-cooled at -20°C were flash-frozen
in liquid nitrogen and stored at -80°C.
2.2.9.2 Electroporation of P. thermoglucosidasius
Electrocompetent P. thermoglucosidasius cells were thawed on ice for 15 minutes, 200 ng of
plasmid DNA were added, the whole mixture was transferred to an ice-cold electroporation
cuvette (1 mm gap) and incubated on ice for 30 minutes; cells were electroshocked using an
electroporator set at 2500 V, electrical pulse capacitance 25 µF, resistance 600 Ω ; cells were
collected from the cuvette using 1 mL of 2TY and transfered to a 50 mL polypropylene test tube,
incubated for 2 hours at 60°C in a shaking incubator at 100 rpm to allow recovery; cells were
spun down at 5000 rpm for 5 minutes, resuspended in 100 µL of 2TY, plated on prewarmed 2TY
plates with appropriate antibiotic selection and incubated at 60°C overnight.
2.3 DNA sequencing and bioinformatics
2.3.1 Short DNA sequencing and analysis
To check the sequences of cloned constructs, plasmid cargos were verified using the Lightrun
Sanger sequencing service at GATC Biotech and Eurofins (Ebersberg, Germany) and sequences
were analysed with the EMBL web tool Muscle available at
https://www.ebi.ac.uk/Tools/msa/muscle/ (Edgar, 2004).
2.3.2 Whole genome sequencing and variants identification
P. thermoglucosidasius strains were prepared according to requirements and sequenced by
MicrobesNG with the Illumina HiSeq Platform (University of Birmingham, United Kingdom).
Sequencing files were processed by MicrobesNG. Automated variant calling was performed
using VarScan (Koboldt et al., 2009) and manually curated by visualising .bam and .vcf files on
Integrative Genomics Viewer (IGV) (Robinson et al., 2011). Variant calling sensitivity was set at
90 %, meaning that at least 90 % of reads covering a putative mutation had that variant. Variants
were considered acceptable with an average depth of 10. Observed silent mutations were not
considered for analysis.
2.3.3 Construction of phylogenetic tree
SeaView program (Gouy et al., 2010) was used to produce and visualise the alignments and
phylogeny. Alignment was produced with Muscle algorithm (Edgar, 2004), phylogeny was
produced with BioNJ algorithm (Poisson distance method, 100 bootstrap replicates). Online tool
iTol (available at https://itol.embl.de/) was used to edit and annotate the tree. DnaQ similarity
was calculated via NCBI’s blastp alignment, and reported as blast bit-score (i.e. higher scores

57
summarise a higher alignment coverage and a higher similarity) (Karlin and Altschul, 1990;
Altschul et al., 1990).
2.4 Chemical analysis
2.4.1 High-Performance Liquid Chromatography (HPLC)
To verify the presence and concentration of wanted or unwanted compounds in liquid cultures,
samples were taken at regular intervals and analysed by ion exclusion High-Performance Liquid
Chromatography (HPLC) on a Agilent Technologies 1200 Series LC system. Samples of 1 to 3 mL
were spun down for 1 minute at 12000 rpm, the supernatant was filtered with Millipore 0.2 µm
diameter pore filters and diluted 1/10 in water. From each sample vial the HPLC used 10 µL that
run through a Rezex RHM-Monosaccharide H+ (8%), LC Column (300 mm length x 7.8 mm
diameter ) column using 5 mM sulphuric acid as a mobile phase; run time was 25 minutes;
sugars, buffers and ethanol were identified by a refractive index detector (RID) whereas
pyruvate and typical known fermentation products (lactate, formate, acetate) were detected by
UV absortion at 215 nm. The flow rate was 0.6 mL/min, the LC temperature was 60°C, the
typical retention times of known compounds are listed in Table 7.
Table 7 - HPLC typical retention times for carbohydrates degradation products, selected organic acids, sugars and alcohols in fermentations liquid fractions.
Detection Compound Minutes
RID Glucose 10
Xylose 10.7
TB 20
Ethanol 21 - 22
UV Pyruvate 10
Lactate 13
Formate 14
Acetate 16
2.4.2 Calculation of glucose and ethanol concentrations from HPLC samples
Standard curves for glucose and ethanol concentration calculation from raw HPLC data were
obtained plotting the nRIU*s (nano Refractive Index Unit multiplied by the retention time to give
the peak area) of ethanol and glucose solutions plotted against their known concentrations (2.5,
5, 12.25, 25, 50, 75 and 100 mM) (Figure 13).
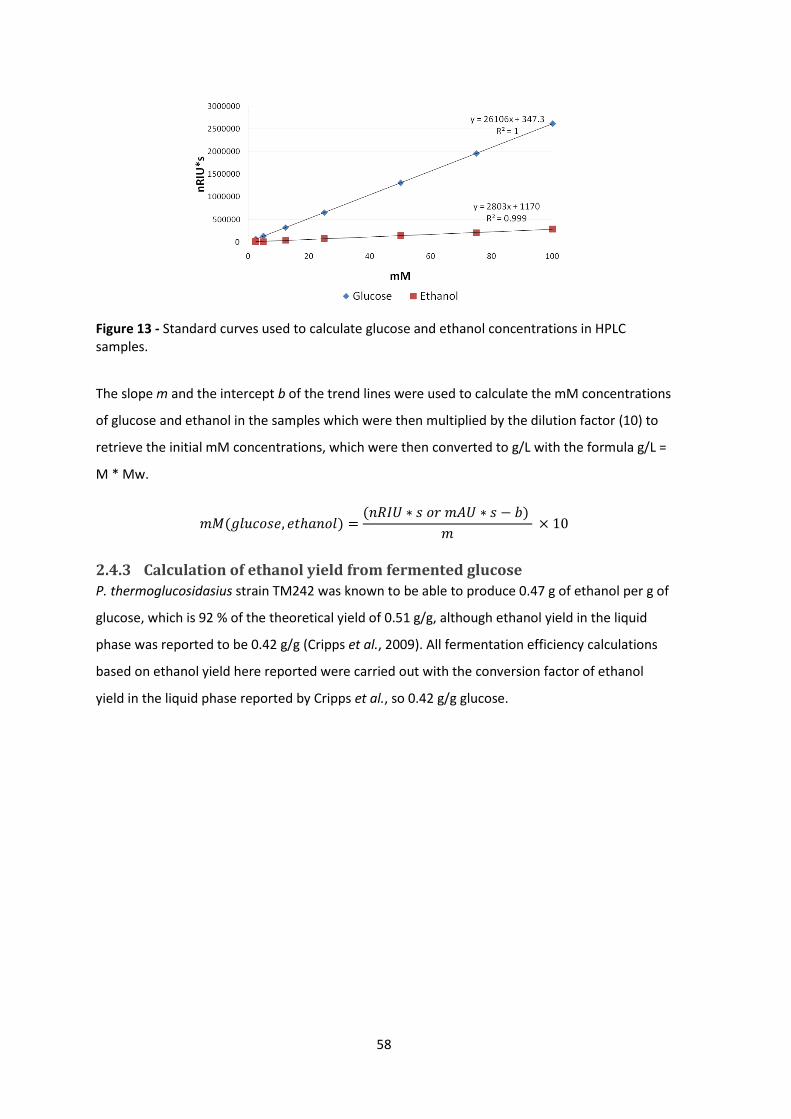
58
Figure 13 - Standard curves used to calculate glucose and ethanol concentrations in HPLC samples.
The slope m and the intercept b of the trend lines were used to calculate the mM concentrations
of glucose and ethanol in the samples which were then multiplied by the dilution factor (10) to
retrieve the initial mM concentrations, which were then converted to g/L with the formula g/L =
M * Mw.
𝑚𝑀(𝑔𝑙𝑢𝑐𝑜𝑠𝑒, 𝑒𝑡𝑎𝑛𝑜𝑙) =(𝑛𝑅𝐼𝑈 ∗ 𝑠 𝑜𝑟 𝑚𝐴𝑈 ∗ 𝑠 − 𝑏)
𝑚 × 10
2.4.3 Calculation of ethanol yield from fermented glucose
P. thermoglucosidasius strain TM242 was known to be able to produce 0.47 g of ethanol per g of
glucose, which is 92 % of the theoretical yield of 0.51 g/g, although ethanol yield in the liquid
phase was reported to be 0.42 g/g (Cripps et al., 2009). All fermentation efficiency calculations
based on ethanol yield here reported were carried out with the conversion factor of ethanol
yield in the liquid phase reported by Cripps et al., so 0.42 g/g glucose.
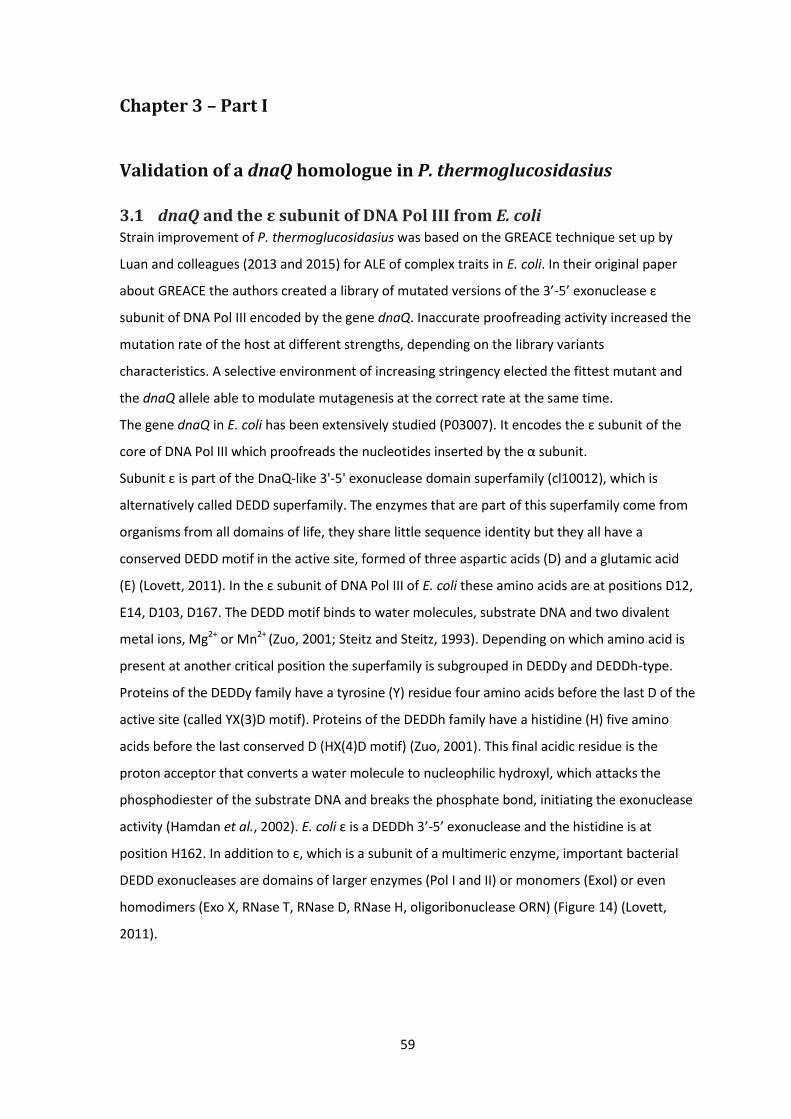
59
Chapter 3 – Part I
Validation of a dnaQ homologue in P. thermoglucosidasius
3.1 dnaQ and the ε subunit of DNA Pol III from E. coli Strain improvement of P. thermoglucosidasius was based on the GREACE technique set up by
Luan and colleagues (2013 and 2015) for ALE of complex traits in E. coli. In their original paper
about GREACE the authors created a library of mutated versions of the 3’-5’ exonuclease ε
subunit of DNA Pol III encoded by the gene dnaQ. Inaccurate proofreading activity increased the
mutation rate of the host at different strengths, depending on the library variants
characteristics. A selective environment of increasing stringency elected the fittest mutant and
the dnaQ allele able to modulate mutagenesis at the correct rate at the same time.
The gene dnaQ in E. coli has been extensively studied (P03007). It encodes the ε subunit of the
core of DNA Pol III which proofreads the nucleotides inserted by the α subunit.
Subunit ε is part of the DnaQ-like 3'-5' exonuclease domain superfamily (cl10012), which is
alternatively called DEDD superfamily. The enzymes that are part of this superfamily come from
organisms from all domains of life, they share little sequence identity but they all have a
conserved DEDD motif in the active site, formed of three aspartic acids (D) and a glutamic acid
(E) (Lovett, 2011). In the ε subunit of DNA Pol III of E. coli these amino acids are at positions D12,
E14, D103, D167. The DEDD motif binds to water molecules, substrate DNA and two divalent
metal ions, Mg2+ or Mn2+ (Zuo, 2001; Steitz and Steitz, 1993). Depending on which amino acid is
present at another critical position the superfamily is subgrouped in DEDDy and DEDDh-type.
Proteins of the DEDDy family have a tyrosine (Y) residue four amino acids before the last D of the
active site (called YX(3)D motif). Proteins of the DEDDh family have a histidine (H) five amino
acids before the last conserved D (HX(4)D motif) (Zuo, 2001). This final acidic residue is the
proton acceptor that converts a water molecule to nucleophilic hydroxyl, which attacks the
phosphodiester of the substrate DNA and breaks the phosphate bond, initiating the exonuclease
activity (Hamdan et al., 2002). E. coli ε is a DEDDh 3’-5’ exonuclease and the histidine is at
position H162. In addition to ε, which is a subunit of a multimeric enzyme, important bacterial
DEDD exonucleases are domains of larger enzymes (Pol I and II) or monomers (ExoI) or even
homodimers (Exo X, RNase T, RNase D, RNase H, oligoribonuclease ORN) (Figure 14) (Lovett,
2011).
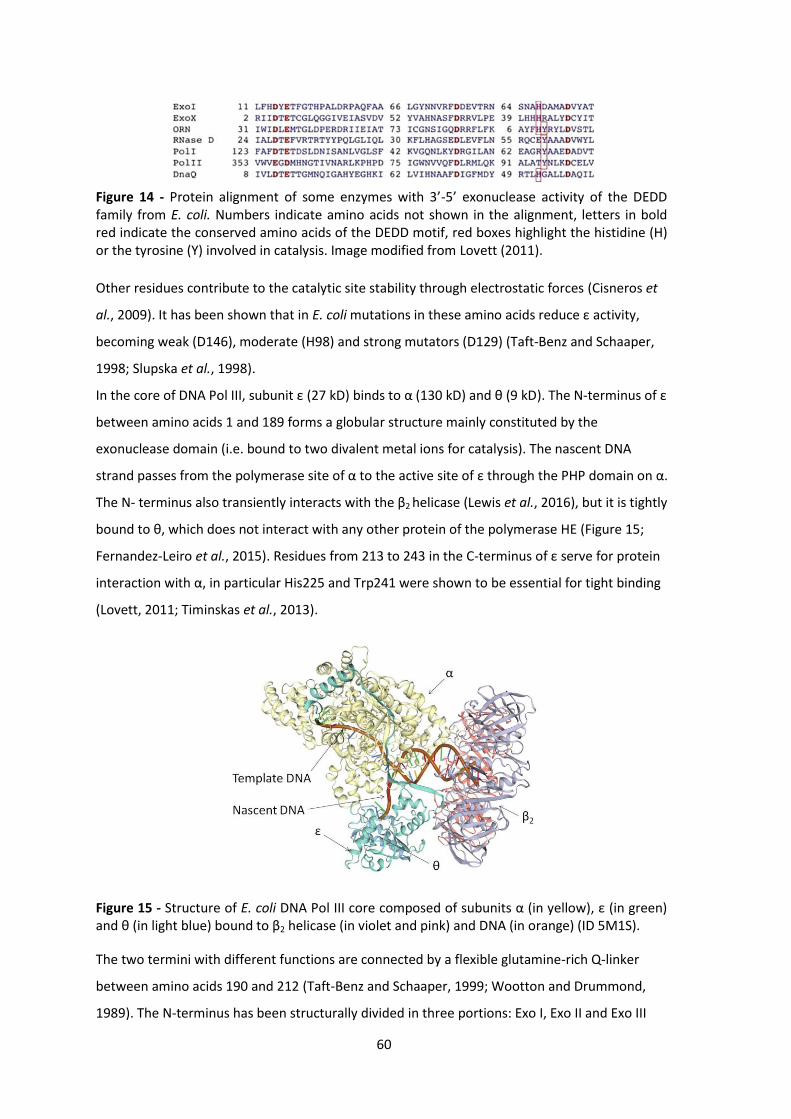
60
Other residues contribute to the catalytic site stability through electrostatic forces (Cisneros et
al., 2009). It has been shown that in E. coli mutations in these amino acids reduce ε activity,
becoming weak (D146), moderate (H98) and strong mutators (D129) (Taft-Benz and Schaaper,
1998; Slupska et al., 1998).
In the core of DNA Pol III, subunit ε (27 kD) binds to α (130 kD) and θ (9 kD). The N-terminus of ε
between amino acids 1 and 189 forms a globular structure mainly constituted by the
exonuclease domain (i.e. bound to two divalent metal ions for catalysis). The nascent DNA
strand passes from the polymerase site of α to the active site of ε through the PHP domain on α.
The N- terminus also transiently interacts with the β2 helicase (Lewis et al., 2016), but it is tightly
bound to θ, which does not interact with any other protein of the polymerase HE (Figure 15;
Fernandez-Leiro et al., 2015). Residues from 213 to 243 in the C-terminus of ε serve for protein
interaction with α, in particular His225 and Trp241 were shown to be essential for tight binding
(Lovett, 2011; Timinskas et al., 2013).
Figure 15 - Structure of E. coli DNA Pol III core composed of subunits α (in yellow), ε (in green) and θ (in light blue) bound to β2 helicase (in violet and pink) and DNA (in orange) (ID 5M1S).
The two termini with different functions are connected by a flexible glutamine-rich Q-linker
between amino acids 190 and 212 (Taft-Benz and Schaaper, 1999; Wootton and Drummond,
1989). The N-terminus has been structurally divided in three portions: Exo I, Exo II and Exo III
Figure 14 - Protein alignment of some enzymes with 3’-5’ exonuclease activity of the DEDD family from E. coli. Numbers indicate amino acids not shown in the alignment, letters in bold red indicate the conserved amino acids of the DEDD motif, red boxes highlight the histidine (H) or the tyrosine (Y) involved in catalysis. Image modified from Lovett (2011).

61
(Figure 16). In Exo I there are the conserved amino acids D12 and E14. The importance of the
residues in Exo I has been shown by the double mutant dnaQ926 (Asp12Ala; Glu14Ala), which
was found to be unviable (Fijalkowska and Schaaper, 1996). The residue D103 is in Exo II, while
residue D167 and H162 are in Exo III.
>ε_EcoliK12
MSTAITRQIVLDTETTGMNQIGAHYEGHKIIEIGAVEVVNRRLTGNNFHVYLKPDRLVDPEAFGVHGIADEFLLDKPTF
AEVADEFMDYIRGAELVIHNAAFDIGFMDYEFSLLKRDIPKTNTFCKVTDSLAVARKMFPGKRNSLDALCARYEIDNSK
RTLHGALLDAQILAEVYLAMTGGQTSMAFAMEGETQQQQGEATIQRIVRQASKLRVVFATDEEIAAHEARLDLVQKKG
GSCLWRA
Figure 16 - Primary structure and schematic representation of subunit ε of the DNA Pol III core in E. coli K12 substrain MG1655 (E. coli). Conserved motif DEDDh is distributed among domains Exo I, Exo II and Exo III. The N-terminus interacts with β2 helicase and core subunit θ. The short flexible Q-rich linker connects the N-terminus with the C-terminus, which interacts with the subunit α through H225 and W241. (Adapted from Taft-Benz and Schaaper, 1999)
3.2 DnaQ in P. thermoglucosidasius In this study it was decided to adopt the principle used in GREACE of exploiting the continuous
mutagenic effect of dnaQ variants in a selective environment.
First, putative DnaQ had to be evaluated as an ε homologue. When this study started in October
2015, the P. thermoglucosidasius NCIMB 11955 (11955) genome sequence was not yet publicly
available on NCBI; it was annotated and submitted by Dr Sheng et al. (University of Nottingham)
in July 2016 (genome reference: PRJNA330787). However, prior to this publication, the 11955
genome sequence had been privately obtained by TMO Renewables and was accessible only to
our laboratory members for genetic engineering experiments design.
The transcriptomes of P. thermoglucosidasius TM242 in aerobic and anaerobic conditions were
sequenced by members of our group (Dr Bacon and Dr Maskapalli, 2014, unpublished data).
Expression levels of transcribed genes were organised by Dr Ferla and were available at the
website http://geobacillus-matteoferla.rhcloud.com/ (2015, unpublished data) [accessed in
October 2015, not accessible in 2020]. Being P. thermoglucosidasius TM242 a 11955 derivative
strain, the RNAseq database was consulted to retrieve information about the dnaQ homologue
of interest.
Search for dnaQ was by annotation. The sequence of putative dnaQ was used for a BLASTn
search (https://blast.ncbi.nlm.nih.gov/Blast.cgi) (Gertz et al., 2006). The best hit with 100 %
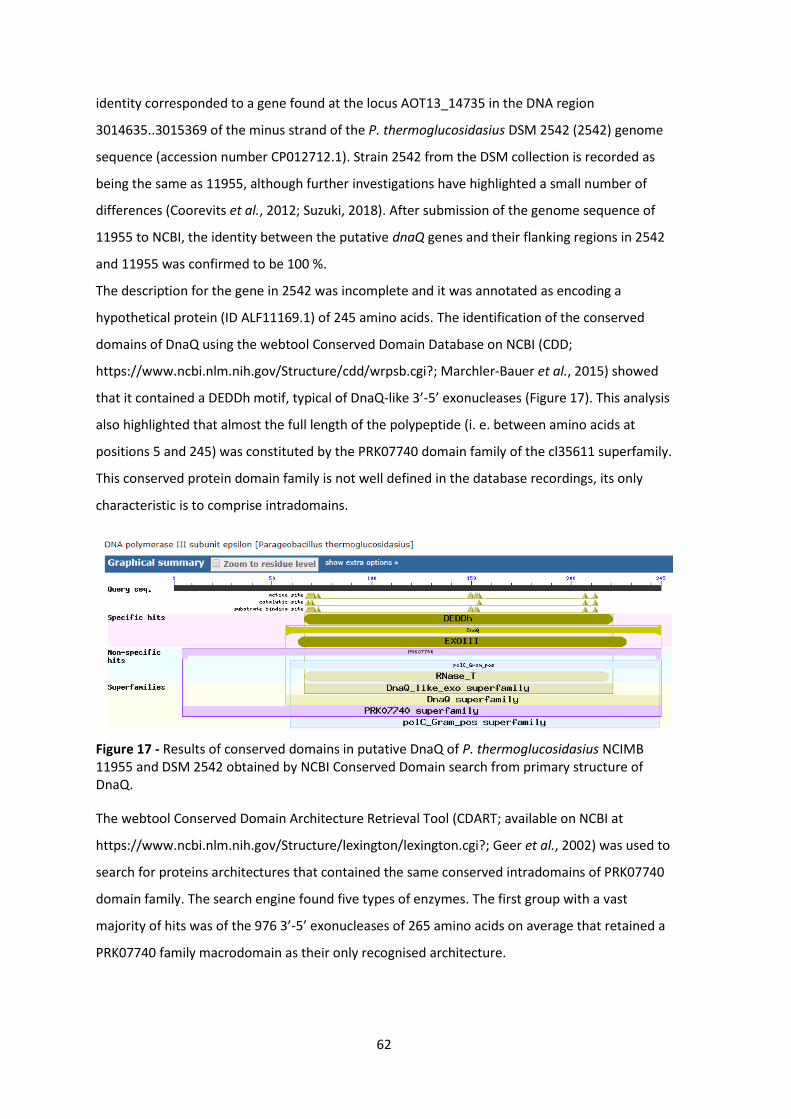
62
identity corresponded to a gene found at the locus AOT13_14735 in the DNA region
3014635..3015369 of the minus strand of the P. thermoglucosidasius DSM 2542 (2542) genome
sequence (accession number CP012712.1). Strain 2542 from the DSM collection is recorded as
being the same as 11955, although further investigations have highlighted a small number of
differences (Coorevits et al., 2012; Suzuki, 2018). After submission of the genome sequence of
11955 to NCBI, the identity between the putative dnaQ genes and their flanking regions in 2542
and 11955 was confirmed to be 100 %.
The description for the gene in 2542 was incomplete and it was annotated as encoding a
hypothetical protein (ID ALF11169.1) of 245 amino acids. The identification of the conserved
domains of DnaQ using the webtool Conserved Domain Database on NCBI (CDD;
https://www.ncbi.nlm.nih.gov/Structure/cdd/wrpsb.cgi?; Marchler-Bauer et al., 2015) showed
that it contained a DEDDh motif, typical of DnaQ-like 3’-5’ exonucleases (Figure 17). This analysis
also highlighted that almost the full length of the polypeptide (i. e. between amino acids at
positions 5 and 245) was constituted by the PRK07740 domain family of the cl35611 superfamily.
This conserved protein domain family is not well defined in the database recordings, its only
characteristic is to comprise intradomains.
Figure 17 - Results of conserved domains in putative DnaQ of P. thermoglucosidasius NCIMB 11955 and DSM 2542 obtained by NCBI Conserved Domain search from primary structure of DnaQ.
The webtool Conserved Domain Architecture Retrieval Tool (CDART; available on NCBI at
https://www.ncbi.nlm.nih.gov/Structure/lexington/lexington.cgi?; Geer et al., 2002) was used to
search for proteins architectures that contained the same conserved intradomains of PRK07740
domain family. The search engine found five types of enzymes. The first group with a vast
majority of hits was of the 976 3’-5’ exonucleases of 265 amino acids on average that retained a
PRK07740 family macrodomain as their only recognised architecture.
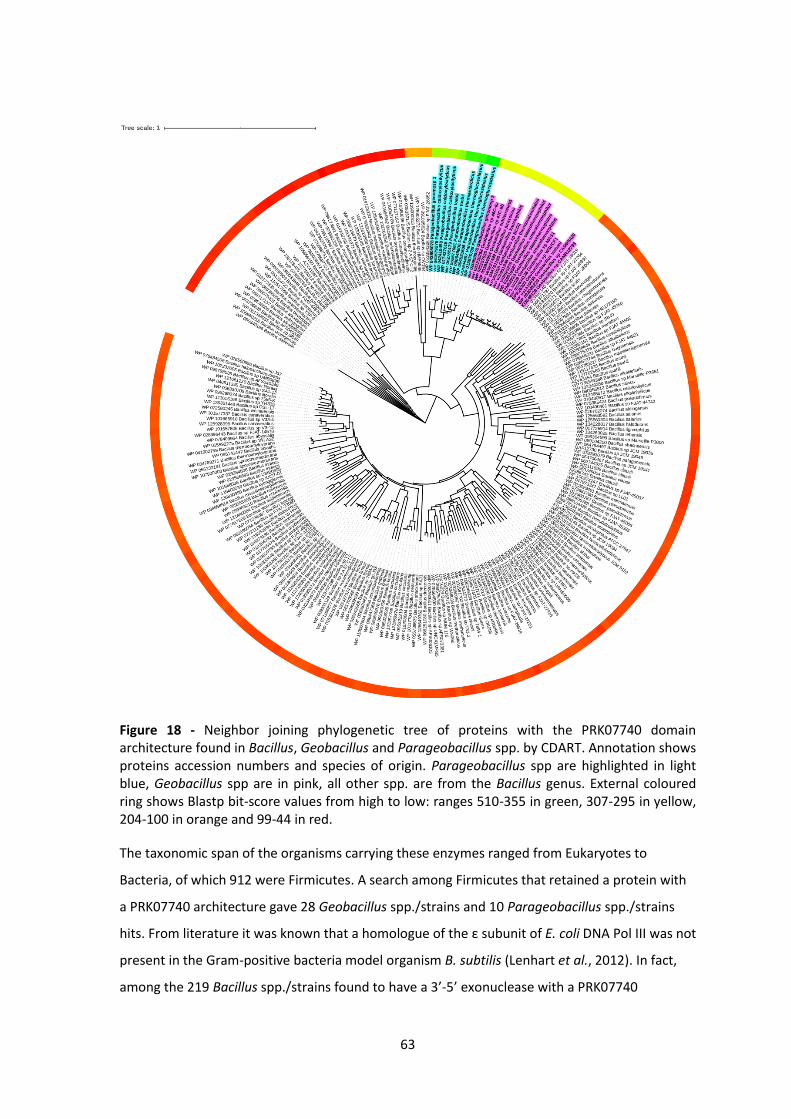
63
The taxonomic span of the organisms carrying these enzymes ranged from Eukaryotes to
Bacteria, of which 912 were Firmicutes. A search among Firmicutes that retained a protein with
a PRK07740 architecture gave 28 Geobacillus spp./strains and 10 Parageobacillus spp./strains
hits. From literature it was known that a homologue of the ε subunit of E. coli DNA Pol III was not
present in the Gram-positive bacteria model organism B. subtilis (Lenhart et al., 2012). In fact,
among the 219 Bacillus spp./strains found to have a 3’-5’ exonuclease with a PRK07740
Figure 18 - Neighbor joining phylogenetic tree of proteins with the PRK07740 domain architecture found in Bacillus, Geobacillus and Parageobacillus spp. by CDART. Annotation shows proteins accession numbers and species of origin. Parageobacillus spp are highlighted in light blue, Geobacillus spp are in pink, all other spp. are from the Bacillus genus. External coloured ring shows Blastp bit-score values from high to low: ranges 510-355 in green, 307-295 in yellow, 204-100 in orange and 99-44 in red.
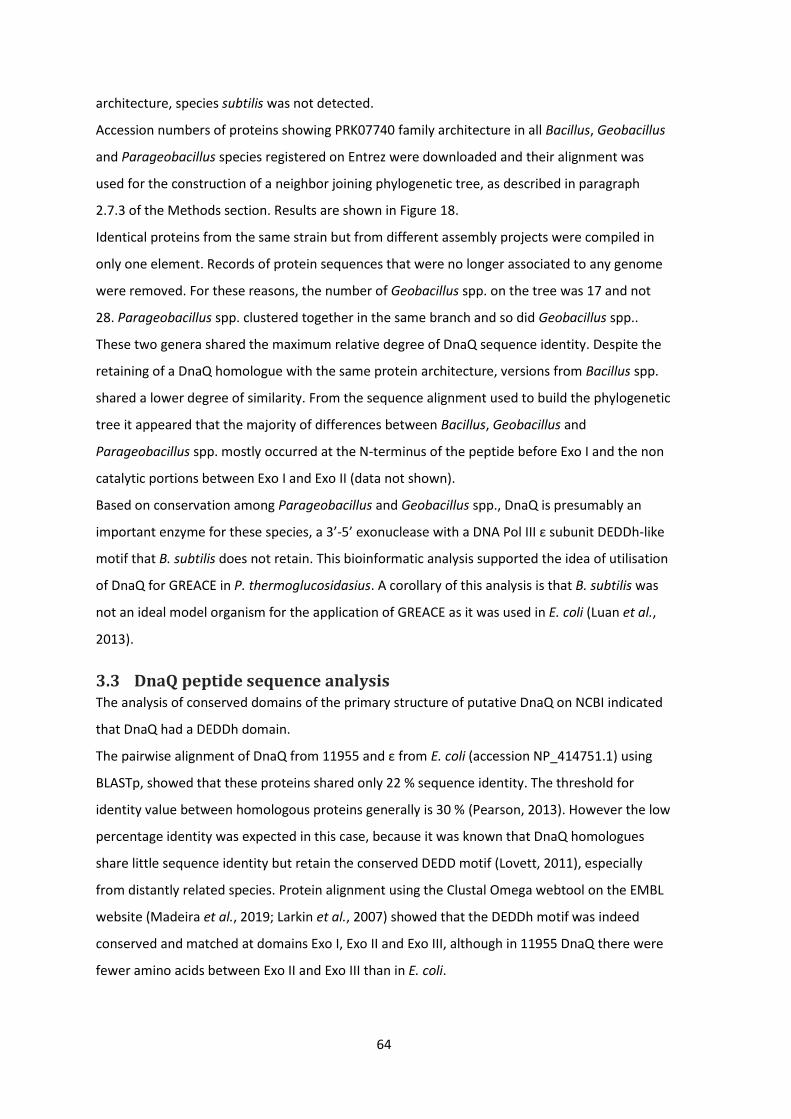
64
architecture, species subtilis was not detected.
Accession numbers of proteins showing PRK07740 family architecture in all Bacillus, Geobacillus
and Parageobacillus species registered on Entrez were downloaded and their alignment was
used for the construction of a neighbor joining phylogenetic tree, as described in paragraph
2.7.3 of the Methods section. Results are shown in Figure 18.
Identical proteins from the same strain but from different assembly projects were compiled in
only one element. Records of protein sequences that were no longer associated to any genome
were removed. For these reasons, the number of Geobacillus spp. on the tree was 17 and not
28. Parageobacillus spp. clustered together in the same branch and so did Geobacillus spp..
These two genera shared the maximum relative degree of DnaQ sequence identity. Despite the
retaining of a DnaQ homologue with the same protein architecture, versions from Bacillus spp.
shared a lower degree of similarity. From the sequence alignment used to build the phylogenetic
tree it appeared that the majority of differences between Bacillus, Geobacillus and
Parageobacillus spp. mostly occurred at the N-terminus of the peptide before Exo I and the non
catalytic portions between Exo I and Exo II (data not shown).
Based on conservation among Parageobacillus and Geobacillus spp., DnaQ is presumably an
important enzyme for these species, a 3’-5’ exonuclease with a DNA Pol III ε subunit DEDDh-like
motif that B. subtilis does not retain. This bioinformatic analysis supported the idea of utilisation
of DnaQ for GREACE in P. thermoglucosidasius. A corollary of this analysis is that B. subtilis was
not an ideal model organism for the application of GREACE as it was used in E. coli (Luan et al.,
2013).
3.3 DnaQ peptide sequence analysis The analysis of conserved domains of the primary structure of putative DnaQ on NCBI indicated
that DnaQ had a DEDDh domain.
The pairwise alignment of DnaQ from 11955 and ε from E. coli (accession NP_414751.1) using
BLASTp, showed that these proteins shared only 22 % sequence identity. The threshold for
identity value between homologous proteins generally is 30 % (Pearson, 2013). However the low
percentage identity was expected in this case, because it was known that DnaQ homologues
share little sequence identity but retain the conserved DEDD motif (Lovett, 2011), especially
from distantly related species. Protein alignment using the Clustal Omega webtool on the EMBL
website (Madeira et al., 2019; Larkin et al., 2007) showed that the DEDDh motif was indeed
conserved and matched at domains Exo I, Exo II and Exo III, although in 11955 DnaQ there were
fewer amino acids between Exo II and Exo III than in E. coli.
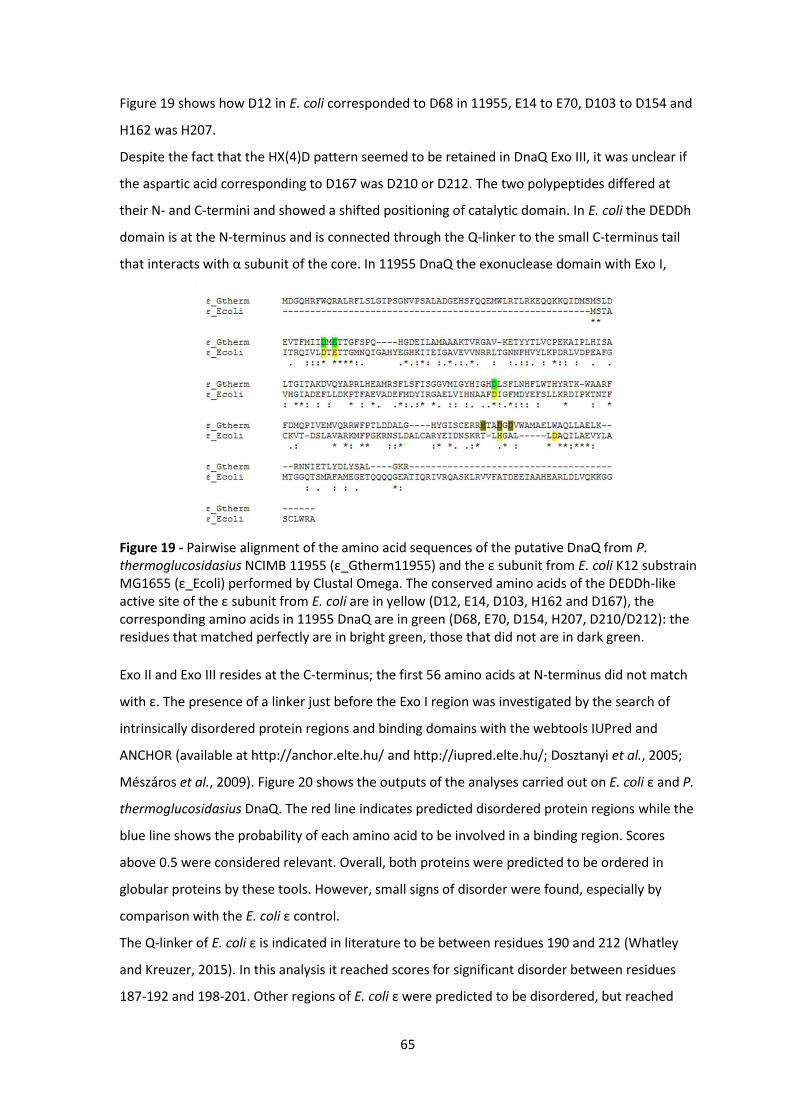
65
Figure 19 shows how D12 in E. coli corresponded to D68 in 11955, E14 to E70, D103 to D154 and
H162 was H207.
Despite the fact that the HX(4)D pattern seemed to be retained in DnaQ Exo III, it was unclear if
the aspartic acid corresponding to D167 was D210 or D212. The two polypeptides differed at
their N- and C-termini and showed a shifted positioning of catalytic domain. In E. coli the DEDDh
domain is at the N-terminus and is connected through the Q-linker to the small C-terminus tail
that interacts with α subunit of the core. In 11955 DnaQ the exonuclease domain with Exo I,
Exo II and Exo III resides at the C-terminus; the first 56 amino acids at N-terminus did not match
with ε. The presence of a linker just before the Exo I region was investigated by the search of
intrinsically disordered protein regions and binding domains with the webtools IUPred and
ANCHOR (available at http://anchor.elte.hu/ and http://iupred.elte.hu/; Dosztanyi et al., 2005;
Mészáros et al., 2009). Figure 20 shows the outputs of the analyses carried out on E. coli ε and P.
thermoglucosidasius DnaQ. The red line indicates predicted disordered protein regions while the
blue line shows the probability of each amino acid to be involved in a binding region. Scores
above 0.5 were considered relevant. Overall, both proteins were predicted to be ordered in
globular proteins by these tools. However, small signs of disorder were found, especially by
comparison with the E. coli ε control.
The Q-linker of E. coli ε is indicated in literature to be between residues 190 and 212 (Whatley
and Kreuzer, 2015). In this analysis it reached scores for significant disorder between residues
187-192 and 198-201. Other regions of E. coli ε were predicted to be disordered, but reached
Figure 19 - Pairwise alignment of the amino acid sequences of the putative DnaQ from P. thermoglucosidasius NCIMB 11955 (ε_Gtherm11955) and the ε subunit from E. coli K12 substrain MG1655 (ε_Ecoli) performed by Clustal Omega. The conserved amino acids of the DEDDh-like active site of the ε subunit from E. coli are in yellow (D12, E14, D103, H162 and D167), the corresponding amino acids in 11955 DnaQ are in green (D68, E70, D154, H207, D210/D212): the residues that matched perfectly are in bright green, those that did not are in dark green.
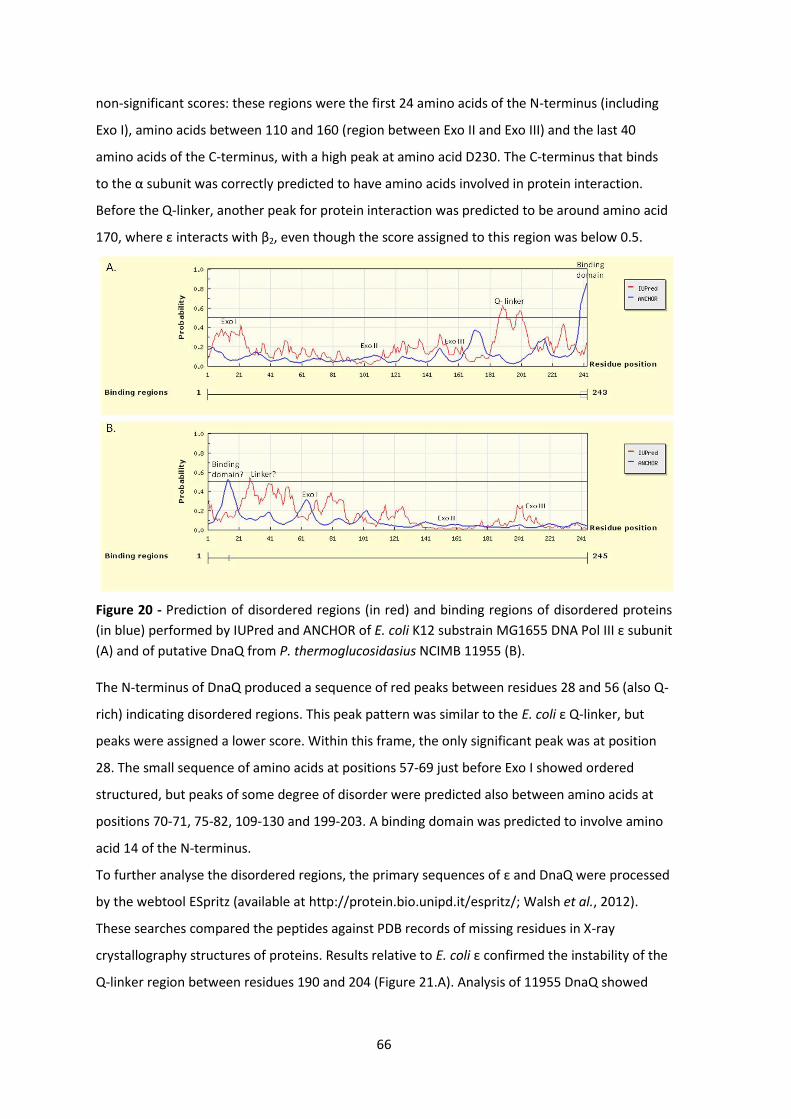
66
non-significant scores: these regions were the first 24 amino acids of the N-terminus (including
Exo I), amino acids between 110 and 160 (region between Exo II and Exo III) and the last 40
amino acids of the C-terminus, with a high peak at amino acid D230. The C-terminus that binds
to the α subunit was correctly predicted to have amino acids involved in protein interaction.
Before the Q-linker, another peak for protein interaction was predicted to be around amino acid
170, where ε interacts with β2, even though the score assigned to this region was below 0.5.
Figure 20 - Prediction of disordered regions (in red) and binding regions of disordered proteins
(in blue) performed by IUPred and ANCHOR of E. coli K12 substrain MG1655 DNA Pol III ε subunit
(A) and of putative DnaQ from P. thermoglucosidasius NCIMB 11955 (B).
The N-terminus of DnaQ produced a sequence of red peaks between residues 28 and 56 (also Q-
rich) indicating disordered regions. This peak pattern was similar to the E. coli ε Q-linker, but
peaks were assigned a lower score. Within this frame, the only significant peak was at position
28. The small sequence of amino acids at positions 57-69 just before Exo I showed ordered
structured, but peaks of some degree of disorder were predicted also between amino acids at
positions 70-71, 75-82, 109-130 and 199-203. A binding domain was predicted to involve amino
acid 14 of the N-terminus.
To further analyse the disordered regions, the primary sequences of ε and DnaQ were processed
by the webtool ESpritz (available at http://protein.bio.unipd.it/espritz/; Walsh et al., 2012).
These searches compared the peptides against PDB records of missing residues in X-ray
crystallography structures of proteins. Results relative to E. coli ε confirmed the instability of the
Q-linker region between residues 190 and 204 (Figure 21.A). Analysis of 11955 DnaQ showed
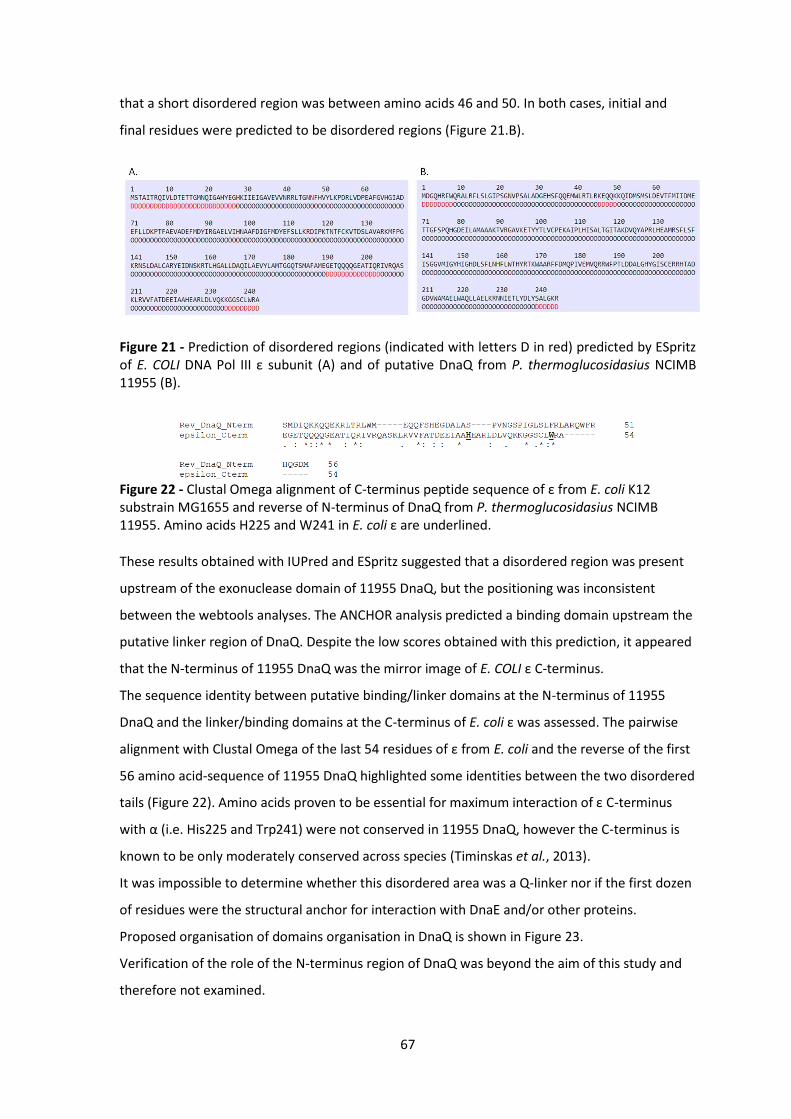
67
that a short disordered region was between amino acids 46 and 50. In both cases, initial and
final residues were predicted to be disordered regions (Figure 21.B).
Figure 21 - Prediction of disordered regions (indicated with letters D in red) predicted by ESpritz of E. COLI DNA Pol III ε subunit (A) and of putative DnaQ from P. thermoglucosidasius NCIMB 11955 (B).
These results obtained with IUPred and ESpritz suggested that a disordered region was present
upstream of the exonuclease domain of 11955 DnaQ, but the positioning was inconsistent
between the webtools analyses. The ANCHOR analysis predicted a binding domain upstream the
putative linker region of DnaQ. Despite the low scores obtained with this prediction, it appeared
that the N-terminus of 11955 DnaQ was the mirror image of E. COLI ε C-terminus.
The sequence identity between putative binding/linker domains at the N-terminus of 11955
DnaQ and the linker/binding domains at the C-terminus of E. coli ε was assessed. The pairwise
alignment with Clustal Omega of the last 54 residues of ε from E. coli and the reverse of the first
56 amino acid-sequence of 11955 DnaQ highlighted some identities between the two disordered
tails (Figure 22). Amino acids proven to be essential for maximum interaction of ε C-terminus
with α (i.e. His225 and Trp241) were not conserved in 11955 DnaQ, however the C-terminus is
known to be only moderately conserved across species (Timinskas et al., 2013).
It was impossible to determine whether this disordered area was a Q-linker nor if the first dozen
of residues were the structural anchor for interaction with DnaE and/or other proteins.
Proposed organisation of domains organisation in DnaQ is shown in Figure 23.
Verification of the role of the N-terminus region of DnaQ was beyond the aim of this study and
therefore not examined.
Figure 22 - Clustal Omega alignment of C-terminus peptide sequence of ε from E. coli K12 substrain MG1655 and reverse of N-terminus of DnaQ from P. thermoglucosidasius NCIMB 11955. Amino acids H225 and W241 in E. coli ε are underlined.
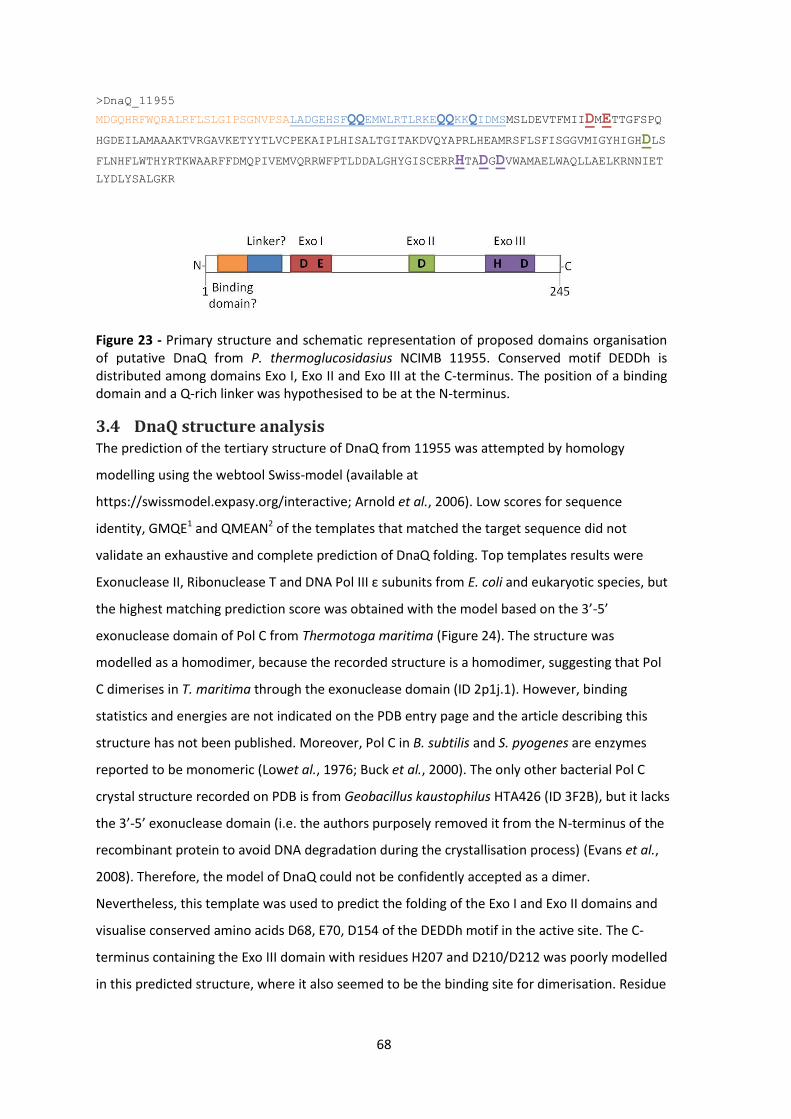
68
>DnaQ_11955
MDGQHRFWQRALRFLSLGIPSGNVPSALADGEHSFQQEMWLRTLRKEQQKKQIDMSMSLDEVTFMIIDMETTGFSPQ
HGDEILAMAAAKTVRGAVKETYYTLVCPEKAIPLHISALTGITAKDVQYAPRLHEAMRSFLSFISGGVMIGYHIGHDLS
FLNHFLWTHYRTKWAARFFDMQPIVEMVQRRWFPTLDDALGHYGISCERRHTADGDVWAMAELWAQLLAELKRNNIET
LYDLYSALGKR
Figure 23 - Primary structure and schematic representation of proposed domains organisation of putative DnaQ from P. thermoglucosidasius NCIMB 11955. Conserved motif DEDDh is distributed among domains Exo I, Exo II and Exo III at the C-terminus. The position of a binding domain and a Q-rich linker was hypothesised to be at the N-terminus.
3.4 DnaQ structure analysis The prediction of the tertiary structure of DnaQ from 11955 was attempted by homology
modelling using the webtool Swiss-model (available at
https://swissmodel.expasy.org/interactive; Arnold et al., 2006). Low scores for sequence
identity, GMQE1 and QMEAN2 of the templates that matched the target sequence did not
validate an exhaustive and complete prediction of DnaQ folding. Top templates results were
Exonuclease II, Ribonuclease T and DNA Pol III ε subunits from E. coli and eukaryotic species, but
the highest matching prediction score was obtained with the model based on the 3’-5’
exonuclease domain of Pol C from Thermotoga maritima (Figure 24). The structure was
modelled as a homodimer, because the recorded structure is a homodimer, suggesting that Pol
C dimerises in T. maritima through the exonuclease domain (ID 2p1j.1). However, binding
statistics and energies are not indicated on the PDB entry page and the article describing this
structure has not been published. Moreover, Pol C in B. subtilis and S. pyogenes are enzymes
reported to be monomeric (Lowet al., 1976; Buck et al., 2000). The only other bacterial Pol C
crystal structure recorded on PDB is from Geobacillus kaustophilus HTA426 (ID 3F2B), but it lacks
the 3’-5’ exonuclease domain (i.e. the authors purposely removed it from the N-terminus of the
recombinant protein to avoid DNA degradation during the crystallisation process) (Evans et al.,
2008). Therefore, the model of DnaQ could not be confidently accepted as a dimer.
Nevertheless, this template was used to predict the folding of the Exo I and Exo II domains and
visualise conserved amino acids D68, E70, D154 of the DEDDh motif in the active site. The C-
terminus containing the Exo III domain with residues H207 and D210/D212 was poorly modelled
in this predicted structure, where it also seemed to be the binding site for dimerisation. Residue
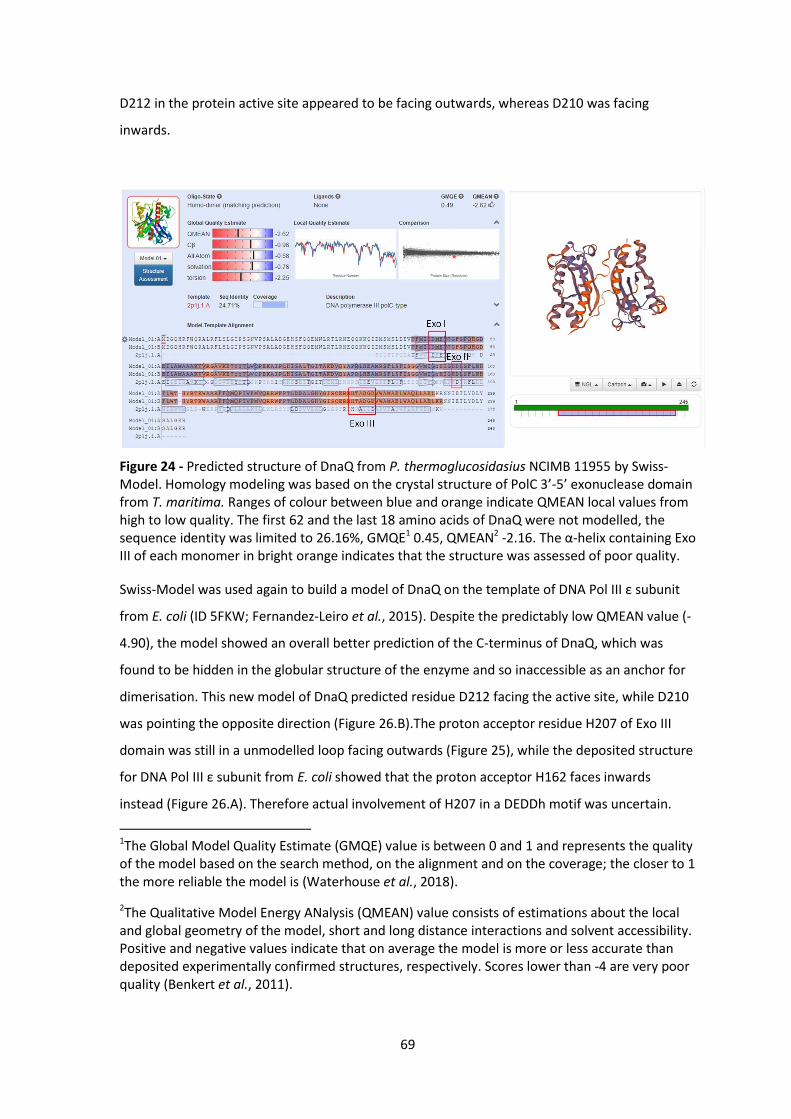
69
D212 in the protein active site appeared to be facing outwards, whereas D210 was facing
inwards.
Swiss-Model was used again to build a model of DnaQ on the template of DNA Pol III ε subunit
from E. coli (ID 5FKW; Fernandez-Leiro et al., 2015). Despite the predictably low QMEAN value (-
4.90), the model showed an overall better prediction of the C-terminus of DnaQ, which was
found to be hidden in the globular structure of the enzyme and so inaccessible as an anchor for
dimerisation. This new model of DnaQ predicted residue D212 facing the active site, while D210
was pointing the opposite direction (Figure 26.B).The proton acceptor residue H207 of Exo III
domain was still in a unmodelled loop facing outwards (Figure 25), while the deposited structure
for DNA Pol III ε subunit from E. coli showed that the proton acceptor H162 faces inwards
instead (Figure 26.A). Therefore actual involvement of H207 in a DEDDh motif was uncertain.
1The Global Model Quality Estimate (GMQE) value is between 0 and 1 and represents the quality of the model based on the search method, on the alignment and on the coverage; the closer to 1 the more reliable the model is (Waterhouse et al., 2018).
2The Qualitative Model Energy ANalysis (QMEAN) value consists of estimations about the local and global geometry of the model, short and long distance interactions and solvent accessibility. Positive and negative values indicate that on average the model is more or less accurate than deposited experimentally confirmed structures, respectively. Scores lower than -4 are very poor quality (Benkert et al., 2011).
Figure 24 - Predicted structure of DnaQ from P. thermoglucosidasius NCIMB 11955 by Swiss-Model. Homology modeling was based on the crystal structure of PolC 3’-5’ exonuclease domain from T. maritima. Ranges of colour between blue and orange indicate QMEAN local values from high to low quality. The first 62 and the last 18 amino acids of DnaQ were not modelled, the sequence identity was limited to 26.16%, GMQE1 0.45, QMEAN2 -2.16. The α-helix containing Exo III of each monomer in bright orange indicates that the structure was assessed of poor quality.

70
3.5 Discussion In the first part of this study, the possibility to use the same molecular tools described in the
original work about GREACE was explored. It was known from literature that the proofreading
activity during DNA replication was not carried out by an E. coli ε homologue in B. subtilis
(Sanders et al., 2010; Lenhart et al., 2012; Paschalis et al., 2017). According to this model, P.
thermoglucosidasius was expected to not have a gene encoding an ε homologue. However,
Figure 25 - Predicted structure of DnaQ from P. thermoglucosidasius NCIMB 11955 by Swiss-Model based on the deposited template of the ε subunit of DNA Pol III from E. coli. Ranges of colour between blue and orange indicate QMEAN local values from high to low quality. The first 62 and the last 14 amino acids of DnaQ were not modelled. H207 of Exo III was in a low QMEAN region (blue arrow).
Figure 26 - Comparison of the DEDDh-like active site residues positions between (A) the deposited structure of DNA pol III ε subunit from E. coli and (B) the predicted structure of DnaQ from P. thermoglucosidasius NCIMB 11955 modelled on ε, obtained with Swiss-Model. A. The 3’-5’ exonuclease (in violet) interacts with DNA (in orange); H162 faces the ssDNA. B. Modelled DnaQ (missing the unmodelled N-terminus) from P. thermoglucosidasius NCIMB 11955 shows H207 (corresponding to H162 in ε) facing outwards on the unstructured loop. The tubular view shows positively and negatively charged amino acids highlighted in blue and in red, respectively.

71
homology search based on protein primary structure showed the presence of an expressed 3’-5’
exonuclease of similar size that automatic annotation described as a DNA Pol III-like ε subunit. In
silico analyses of the structure of putative DnaQ highlighted many similarities with ε that could
fit the hypothesis of the enzyme being the proofreading subunit of the DNA polymerase core in
P. thermoglucosidasius. Pairwise alignment of peptide sequences allowed pinpointing of
conserved amino acids of the active site with a good degree of confidence. This suggested the
conservation of a DEDDh motif typical of 3’-5’ exonucleases.
The exonuclease domain was found to be at the C-terminus, while a possible anchor region for
DnaE binding was found at the N- terminus. This internal organisation of domains in DnaQ
appeared inverted from that of ε in E. coli, but structure modelling confirmed that the protein
could still carry out both the same functions. This atypical organisation permitted the search of
DnaQ homologues among other Firmicutes. As expected, DnaQ was conserved among
Parageobacillus spp., and with a lower sequence identity also in the Geobacillus genus. The
presence of DnaQ in P. thermoglucosidasius was contradictory with what is found in B. subtilis
where this protein is missing. However, it was interesting to note that other Bacillus spp. have
DnaQ.
Amino acids of the active site in Exo I and Exo II (D68, E70 and D154) were confidently positioned
within the DnaQ structure by both of the models (i.e. built on PolC 3’-5’ exonuclease domain
from T. maritima and DNA Pol III ε subunit from E. coli structures). From the sequence alignment
of ε and DnaQ, the Exo III residues of the DEDDh motif were hypothesised to be H207 and D212
in DnaQ. However, since the position of H207 was not predicted to fit the active site with
consistent outcomes in the two structure models, its role was not certain. As it was noticed
already in the pairwise alignment of ε and DnaQ, the possibility that the DEDDh motif was ‘only’
a DEDD motif was not excluded: also D210 was considered as putative amino acid of the active
site, even if it appeared to point outwards from it.
The α subunit of the E. coli DNA Pol III is of the DnaE1 type, while in B. subtilis the DnaE
polymerase subunit is of the DnaE3 type. The main differences between the two classes is the
overall low level of sequence conservation in DnaE3 polymerases and the fact that the metal
binding site of the PHP domain is defective in DnaE3 polymerases (Timinskas et al., 2013). The
PHP domain is an important binding domain between α and ε in the DNA Pol III core (Lewis et
al., 2016). Timinskas et al. (2013) hypothesised that DnaE3 polymerases cannot interact with the
proofreading subunit or that the α-ε interaction is significantly different from that of E. coli’s
core structure. These hypotheses are in accordance with the absence of DnaQ in B. subtilis
reported in literature and verified in this study (Lenhart et al., 2012). Search of conserved
72
domains in DNA polymerase subunit α from P. thermoglucosidasius NCIMB 11955 (accession
number ANZ31880.1) with the NCBI webtool Conserved Domain Database (Marchler-Bauer et
al., 2015) show that the PHP domain is of the DnaE1 type (data not shown). This preliminary
investigation on the α subunit suggests the presence of a DNA Pol III core-like assembly of α and
DnaQ in P. thermoglucosidasius and provides evidences of an involvement of DnaQ in a DNA
replication mechanism that differs significantly from that of B. subtilis.
The core of DNA Pol III in E. coli is composed of subunits α, ε and θ. The gene holE encoding θ
was not found in P. thermoglucosidasius. The θ subunit is known to increase ε activity, but is not
essential in E. coli and other species (Lewis et al., 2016), therefore absence of holE was not
considered against the hypothesis of DnaQ involvement in P. thermoglucosidasius DNA
replication, but suggesting the idea of a unidentified core conformation.
The study of the DNA replication machinery in P. thermoglucosidasius was not the main
objective of this study, therefore the hypothesis of DnaQ binding to DnaE to form a DNA Pol III
core-like structure was not directly addressed. As testing the enzyme activity in vitro was not
within the scope of this project, it was decided to assess the role of DnaQ in P.
thermoglucosidasius by generating mutants, use them to create genetic diversity and
simultaneously evolve strains, as it had been done with GREACE in the original work by Luan and
colleagues (2013).
73
Chapter 3 – Part II
Preparation of dnaQ mutants
3.6 DnaQ amino acid substitution rationale The original work that used GREACE for ALE, created a library of dnaQ mutants (Luan et al.,
2013). Cloning a library in P. thermoglucosidasius was predicted to be difficult due to the very
low electroporation efficiency and the known risks of library narrowing with bi or tri-parental
mating.
It had been shown before that mutations and combinations of mutations at the DEDDh sites
caused either a reduction of proofreading rate (making ε an in vivo mutator) or cell death for
non-permissive accumulation of mutations (Fijalkowska and Schaaper, 1996).
For the purpose of this study, cell viability had not to be compromised by mutations of residues
D68, E70, D154, H207, D210 and D212. Driven by the need to not disrupt the active site
irremediably, the rationale behind the amino acids substitutions was based on information
gathered from Luan et al. (2013). In the original paper where GREACE was first described, the
dnaQ gene was randomly mutated by error prone PCR, the library of mutated versions of the E.
coli ε subunit was tested at different stress conditions, the best performing mutants in the
selective environments were isolated and analysed. The authors noticed that most of the
mutations were around or precisely at the residues of the DEDDh motif of ε. This was consistent
with the studies performed on the E. coli DNA Pol III ε subunit by site-specific mutagenesis to
pinpoint the amino acids involved in the active site (Bernad et al., 1989). In the pool of 31
selected mutators, Luan and colleagues found that residues D12, E14, D103, H162 were hit by
point mutation three, five, two and two times, respectively. The new bases inserted at these
positions showed no bias, apart from E14 that had a valine (V) in three cases out of five and
H162 that had a leucine (L) in both cases.
For the residues corresponding to E14 and H162 in P. thermoglucosidasius DnaQ, it was decided
to conserve the same pattern: glutamate 70 was mutated to a valine (E70V) and histidine 207 to
a leucine (H207L). All the remaining aspartates of the DEDDh or DEDD-like active site were
mutated to glutamate, which is a negatively charged residue with four carbon atoms rather than
three; it was believed that the longer side chain would have caused some steric hindrance
without changing the mechanism of catalysis in the active site of ε. Table 8 shows the residues of
the DEDDh motif of the ε subunit of DNA Pol III from E. coli, their corresponding residues in Exo I,
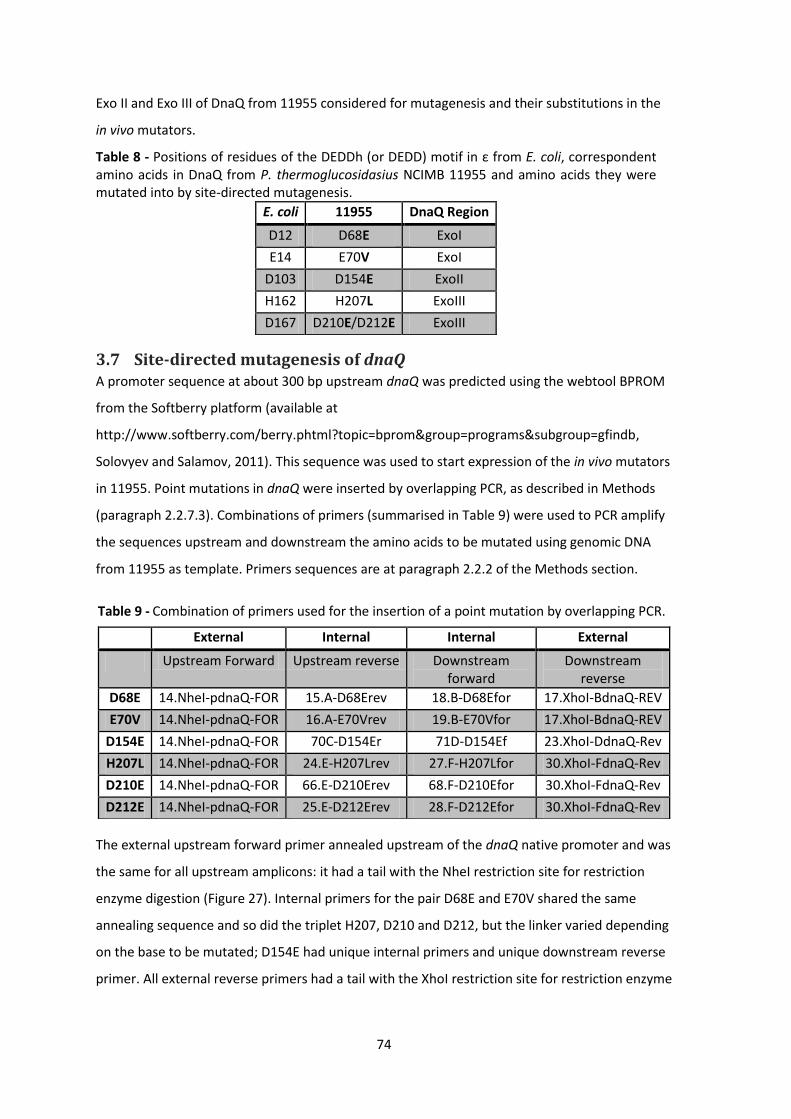
74
Exo II and Exo III of DnaQ from 11955 considered for mutagenesis and their substitutions in the
in vivo mutators.
Table 8 - Positions of residues of the DEDDh (or DEDD) motif in ε from E. coli, correspondent amino acids in DnaQ from P. thermoglucosidasius NCIMB 11955 and amino acids they were mutated into by site-directed mutagenesis.
E. coli 11955 DnaQ Region
D12 D68E ExoI
E14 E70V ExoI
D103 D154E ExoII
H162 H207L ExoIII
D167 D210E/D212E ExoIII
3.7 Site-directed mutagenesis of dnaQ A promoter sequence at about 300 bp upstream dnaQ was predicted using the webtool BPROM
from the Softberry platform (available at
http://www.softberry.com/berry.phtml?topic=bprom&group=programs&subgroup=gfindb,
Solovyev and Salamov, 2011). This sequence was used to start expression of the in vivo mutators
in 11955. Point mutations in dnaQ were inserted by overlapping PCR, as described in Methods
(paragraph 2.2.7.3). Combinations of primers (summarised in Table 9) were used to PCR amplify
the sequences upstream and downstream the amino acids to be mutated using genomic DNA
from 11955 as template. Primers sequences are at paragraph 2.2.2 of the Methods section.
Table 9 - Combination of primers used for the insertion of a point mutation by overlapping PCR.
External Internal Internal External
Upstream Forward Upstream reverse Downstream forward
Downstream reverse
D68E 14.NheI-pdnaQ-FOR 15.A-D68Erev 18.B-D68Efor 17.XhoI-BdnaQ-REV
E70V 14.NheI-pdnaQ-FOR 16.A-E70Vrev 19.B-E70Vfor 17.XhoI-BdnaQ-REV
D154E 14.NheI-pdnaQ-FOR 70C-D154Er 71D-D154Ef 23.XhoI-DdnaQ-Rev
H207L 14.NheI-pdnaQ-FOR 24.E-H207Lrev 27.F-H207Lfor 30.XhoI-FdnaQ-Rev
D210E 14.NheI-pdnaQ-FOR 66.E-D210Erev 68.F-D210Efor 30.XhoI-FdnaQ-Rev
D212E 14.NheI-pdnaQ-FOR 25.E-D212Erev 28.F-D212Efor 30.XhoI-FdnaQ-Rev
The external upstream forward primer annealed upstream of the dnaQ native promoter and was
the same for all upstream amplicons: it had a tail with the NheI restriction site for restriction
enzyme digestion (Figure 27). Internal primers for the pair D68E and E70V shared the same
annealing sequence and so did the triplet H207, D210 and D212, but the linker varied depending
on the base to be mutated; D154E had unique internal primers and unique downstream reverse
primer. All external reverse primers had a tail with the XhoI restriction site for restriction enzyme
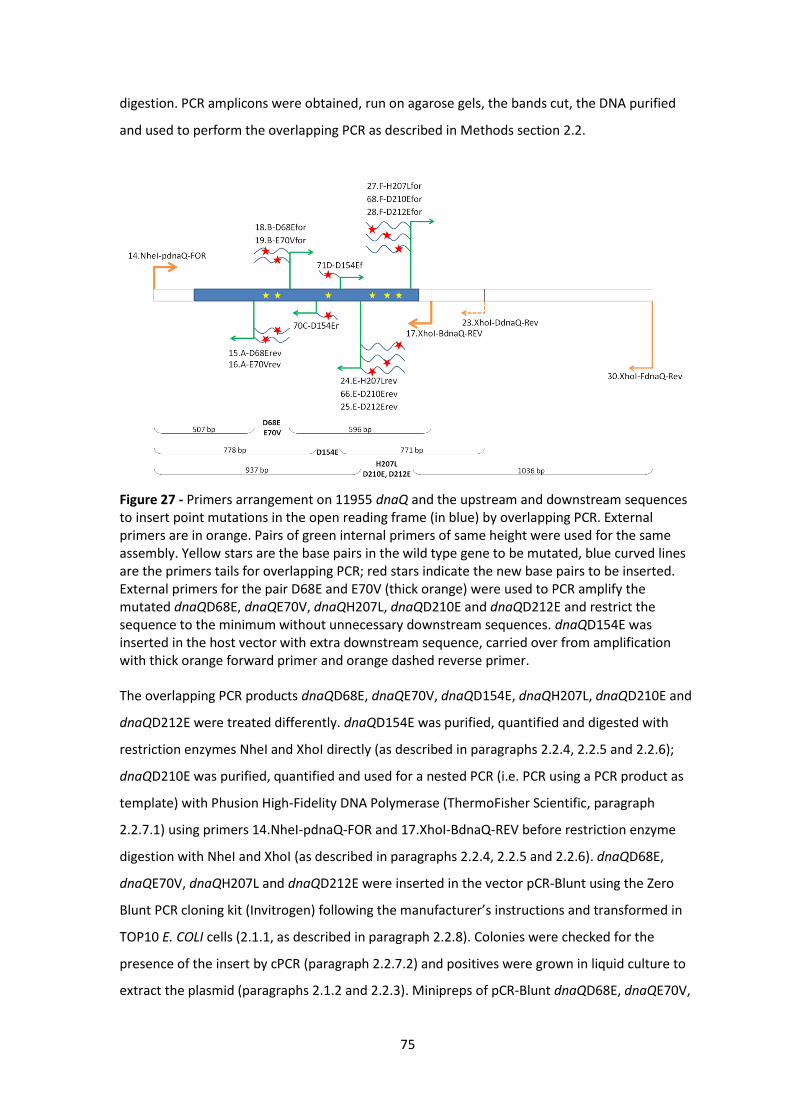
75
digestion. PCR amplicons were obtained, run on agarose gels, the bands cut, the DNA purified
and used to perform the overlapping PCR as described in Methods section 2.2.
Figure 27 - Primers arrangement on 11955 dnaQ and the upstream and downstream sequences to insert point mutations in the open reading frame (in blue) by overlapping PCR. External primers are in orange. Pairs of green internal primers of same height were used for the same assembly. Yellow stars are the base pairs in the wild type gene to be mutated, blue curved lines are the primers tails for overlapping PCR; red stars indicate the new base pairs to be inserted. External primers for the pair D68E and E70V (thick orange) were used to PCR amplify the mutated dnaQD68E, dnaQE70V, dnaQH207L, dnaQD210E and dnaQD212E and restrict the sequence to the minimum without unnecessary downstream sequences. dnaQD154E was inserted in the host vector with extra downstream sequence, carried over from amplification with thick orange forward primer and orange dashed reverse primer.
The overlapping PCR products dnaQD68E, dnaQE70V, dnaQD154E, dnaQH207L, dnaQD210E and
dnaQD212E were treated differently. dnaQD154E was purified, quantified and digested with
restriction enzymes NheI and XhoI directly (as described in paragraphs 2.2.4, 2.2.5 and 2.2.6);
dnaQD210E was purified, quantified and used for a nested PCR (i.e. PCR using a PCR product as
template) with Phusion High-Fidelity DNA Polymerase (ThermoFisher Scientific, paragraph
2.2.7.1) using primers 14.NheI-pdnaQ-FOR and 17.XhoI-BdnaQ-REV before restriction enzyme
digestion with NheI and XhoI (as described in paragraphs 2.2.4, 2.2.5 and 2.2.6). dnaQD68E,
dnaQE70V, dnaQH207L and dnaQD212E were inserted in the vector pCR-Blunt using the Zero
Blunt PCR cloning kit (Invitrogen) following the manufacturer’s instructions and transformed in
TOP10 E. COLI cells (2.1.1, as described in paragraph 2.2.8). Colonies were checked for the
presence of the insert by cPCR (paragraph 2.2.7.2) and positives were grown in liquid culture to
extract the plasmid (paragraphs 2.1.2 and 2.2.3). Minipreps of pCR-Blunt dnaQD68E, dnaQE70V,

76
dnaQH207L and dnaQD212E (obtained as described at paragraph 2.2.3) were used as template
to PCR amplify the promoter and the dnaQ open reading frame (ORF) with the primers 14.NheI-
pdnaQ-FOR and 17.XhoI-BdnaQ-REV (thick orange external primers in Figure 27) using Phusion
High-Fidelity DNA Polymerase (ThermoFisher Scientific, paragraph 2.2.7.1). In the case of
dnaQH207L and dnaQD212E this step shortened the sequence from 1997 bp to 1127 bp,
excluding the extra unwanted sequence downstream of dnaQ. The PCR products were run on
agarose gels, the bands cut, the DNA purified and quantified before digestion with restriction
enzymes NheI and XhoI (paragraphs 2.2.4, 2.25, 2.2.6).
The primers 14.NheI-pdnaQ-FOR and 17.XhoI-BdnaQ-REV were used also to PCR amplify the wild
type dnaQ (wtdnaQ) and its putative promoter from 11955 genome using Phusion High-Fidelity
DNA Polymerase (ThermoFisher Scientific, paragraph 2.2.7.1). The amplicon was run on an
agarose gel, purified and digested with restriction enzymes NheI and XhoI (paragraphs 2.2.4,
2.25, 2.2.6) to be inserted in the vector as a control for the downstream experiments.
The high copy number vector pG1AK mCherry was digested with restriction enzymes NheI and
XhoI (paragraphs 2.2.1 and 2.2.6). Digested vector and dnaQ inserts were run on a agarose gel
(paragraph 2.2.4). Linearised vector, dnaQwt and dnaQD68E, dnaQE70V, dnaQD154E,
dnaQH207L, dnaQD210E and dnaQD212E were purified from the gel, the yields quantified and
plasmid/fragments combinations ligated prior to transformation in chemically competent TOP10
E. COLI cells, as described at paragraphs 2.2.4, 2.25, 2.2.6, 2.1.1, 2.2.8).
Figure 28 - Agarose gel showing diagnostic restriction enzyme digests of constructs. NheI and XhoI double digest of the empty pG1AK mCherry plasmid (lane 10, 5583 bp + 37 bp) or carrying the amplicons dnaQD68E (lane 2, 5583 bp + 1127 bp), E70V (lane 3, 5583 bp + 1127 bp),D154E (lane 4, 5583 bp + 1562 bp), H207L (lane 5, 5583 bp + 1127 bp),D210E (lane 6, 5583 bp + 1127 bp) and D212E (lane 7, 5583 bp + 1127 bp). Lanes 8 and 9 show single digests of empty pG1AK mCherry plasmid with NheI and XhoI, respectively. GeneRuler 1kb DNA ladder (ThermoFischer) is in lane 1 for reference.
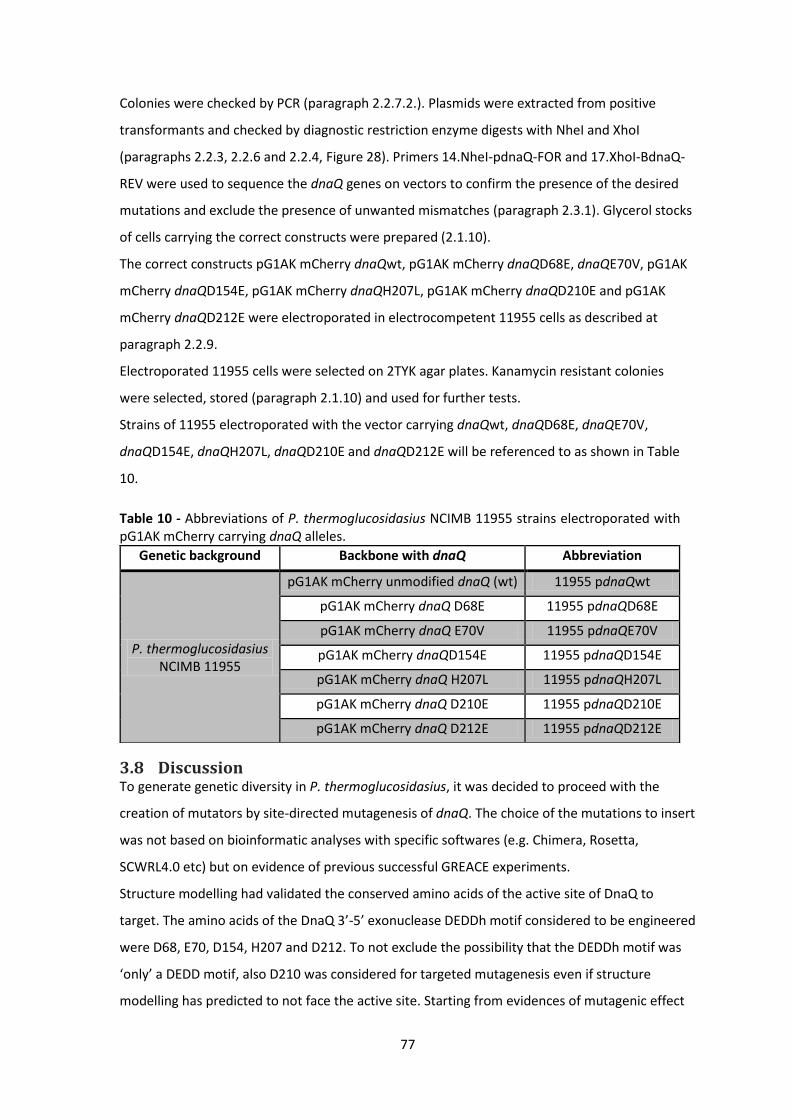
77
Colonies were checked by PCR (paragraph 2.2.7.2.). Plasmids were extracted from positive
transformants and checked by diagnostic restriction enzyme digests with NheI and XhoI
(paragraphs 2.2.3, 2.2.6 and 2.2.4, Figure 28). Primers 14.NheI-pdnaQ-FOR and 17.XhoI-BdnaQ-
REV were used to sequence the dnaQ genes on vectors to confirm the presence of the desired
mutations and exclude the presence of unwanted mismatches (paragraph 2.3.1). Glycerol stocks
of cells carrying the correct constructs were prepared (2.1.10).
The correct constructs pG1AK mCherry dnaQwt, pG1AK mCherry dnaQD68E, dnaQE70V, pG1AK
mCherry dnaQD154E, pG1AK mCherry dnaQH207L, pG1AK mCherry dnaQD210E and pG1AK
mCherry dnaQD212E were electroporated in electrocompetent 11955 cells as described at
paragraph 2.2.9.
Electroporated 11955 cells were selected on 2TYK agar plates. Kanamycin resistant colonies
were selected, stored (paragraph 2.1.10) and used for further tests.
Strains of 11955 electroporated with the vector carrying dnaQwt, dnaQD68E, dnaQE70V,
dnaQD154E, dnaQH207L, dnaQD210E and dnaQD212E will be referenced to as shown in Table
10.
Table 10 - Abbreviations of P. thermoglucosidasius NCIMB 11955 strains electroporated with pG1AK mCherry carrying dnaQ alleles.
Genetic background Backbone with dnaQ Abbreviation
P. thermoglucosidasius NCIMB 11955
pG1AK mCherry unmodified dnaQ (wt) 11955 pdnaQwt
pG1AK mCherry dnaQ D68E 11955 pdnaQD68E
pG1AK mCherry dnaQ E70V 11955 pdnaQE70V
pG1AK mCherry dnaQD154E 11955 pdnaQD154E
pG1AK mCherry dnaQ H207L 11955 pdnaQH207L
pG1AK mCherry dnaQ D210E 11955 pdnaQD210E
pG1AK mCherry dnaQ D212E 11955 pdnaQD212E
3.8 Discussion To generate genetic diversity in P. thermoglucosidasius, it was decided to proceed with the
creation of mutators by site-directed mutagenesis of dnaQ. The choice of the mutations to insert
was not based on bioinformatic analyses with specific softwares (e.g. Chimera, Rosetta,
SCWRL4.0 etc) but on evidence of previous successful GREACE experiments.
Structure modelling had validated the conserved amino acids of the active site of DnaQ to
target. The amino acids of the DnaQ 3’-5’ exonuclease DEDDh motif considered to be engineered
were D68, E70, D154, H207 and D212. To not exclude the possibility that the DEDDh motif was
‘only’ a DEDD motif, also D210 was considered for targeted mutagenesis even if structure
modelling has predicted to not face the active site. Starting from evidences of mutagenic effect
78
of substitutions at conserved residues of the active site from the original work (Luan et al.,
2013), these residues of DnaQ were mutated into D68E, E70V, D154E, H207L, D210E and D212E.
Despite the different cloning routes, all the designed dnaQ mutants were created by overlapping
PCR. They could have been obtained with the use of site directed mutagenesis kits but it was
preferred to not risk the introduction of mutations in the backbone. Successfully created
constructs were transferred into 11955 and the strains were used for the following experiments.
Prior to their utilisation in the GREACE experiment, they had to be proven to influence the
mutation frequency of P. thermoglucosidasius.
79
Chapter 4
Mutation frequency of dnaQ mutants
4.1 Evaluation of mutagenic strength Mutations of the conserved amino acids of the active site of dnaQ were thought to decrease the
exonuclease activity of the enzyme. If the hypothesis of dnaQ being involved in DNA replication
fidelity control was correct, the misincorporations occasionally introduced by DnaE polymerase
were not going to be checked efficiently by mutated DnaQ, resulting in a sensible increase of
mutagenesis.
Mutagenesis of strains can be evaluated by the perturbation of basal mutation rate or mutation
frequency. Mutation rate 𝜇𝑚 is the probability of mutation per base pair per genome
replication event and it reflects the possibility of a cell to encounter a mutation during its
lifetime. Mutation frequency 𝑓𝑚 instead, is the fraction of a bacterial population that has
mutated and it is calculated by dividing the number of mutants (𝑟) over the total number of
cells in a culture (𝑁), with the formula 𝑓𝑚 = 𝑟 𝑁 (Pope et al., 2008).
Mutation rate can be inferred from mutation accumulation in a growing cell culture, by
calculating increments of mutation frequency and the generation number in the exponential
phase, using the formula 𝜇𝑚 = 𝑓2 − 𝑓1 × ln 𝑁2
𝑁1 (Pope et al., 2008). This method can be
very precise if multiple time points of the exponential phase are considered, the slope of the line
describing the mutation accumulation is an accurate estimation of the mutation rate of a
bacterial population. However, this method assumes that wild type and mutated strains have
the same growth rate and does not consider the fitness costs of mutagenesis, which can have a
large impact on growth (Denamur and Matic, 2006). Alternatively, mutation rates can be
calculated with the fluctuation test. With this test Luria and Delbrück (1943) demonstrated that
mutations are pre-adaptive. In the standard protocol, a liquid culture is grown until the end of
exponential phase, a small number of cells from the seed culture is aliquoted in many
subcultures in non-selective medium and grown until the final number of cells is much larger
than the initial; subcultures are diluted and spread on solid selective and non-selective medium
to calculate the number of mutants and the number of viable cells, respectively. The validity of
calculation of the mutation rate from the Luria and Delbrück fluctuation test is based on the
assumption of various conditions: a significant mutation can appear at any stage of culture
growth before death phase and the probability of this to happen is constant all throughout the
80
lifetime of a cell; mutation reversion is irrelevant; mutagenesis is confined to error-prone
duplication events only and produce one mutant of the same growth rate of the wild type; all
screened mutants are the result of a pre-adaptive mutation. Realistically these conditions are
not always met. For example, the growth rate of mutants is affected by the metabolic burden
caused by mutations, and if mutations appear at late stages of exponential phase, a phenotypic
lag can cause an underestimation of the number of mutants. This problem cannot be addressed
with extended incubation times because the counting would mistakenly include cells that
mutated after plating on selective medium (Foster, 2006; Pope et al., 2008). The mutation rate is
the mean number of mutation events that occurred in the culture divided by the final number of
cells, to give the mean number of mutation events occurred in the lifetime of a cell. The
distribution of the number of mutants of the parallel cultures is used to calculate the mean
number of mutations using mathematical estimators that take into account the real test
settings. Fluctuation tests are heavily affected by experiment design. In order to choose the
most precise mutation rate calculation method, preliminary tests on the order of the mean of
mutation events have to be attempted. To reach an appropriate range of mutation events per
cell culture, one can modify the final number of cells by changing the cell density or the culture
volume (Foster, 2006). Examples of mathematical estimators are: the p0 method, the mean
estimator, the Lea-Coulson method of the mean, the MMS-maximum likelihood method, Drake’s
formula, the Jones median estimator, the quartile method and the accumulation of clones
method (Foster, 2006; Wu et al., 2009). The outputs are only estimates that are not comparable
(Pope et al., 2008). When calculating the mutation rate, the choice of selective compound, the
initial number of cells of the subcultures and the number of parallel cultures have to be
evaluated in advance with pre-tests (Pope et al., 2008). The choice of the selective compound is
usually directed by the fact that resistance can be acquired by the micro-organism with a single-
step mutation in one gene. Tipically, mutability of mutagenic strains is tested with rifampin,
which is a bacteriocidal antibiotic that targets the β-subunit of the RNA polymerase, encoded by
the gene rpoB. Resistance to rifampin arises when mutations appear in a specific region of rpoB
called the rifampin resistance-determining region (RRDR) which is 81 bp long and involves 27
codons (Ahmad and Mokaddas, 2005). Since rifampin resistance is acquired by a single-step
mutation in RRDR, rifampin is considered a mutational marker. In more than 96 % of the cases
the mutations that lead to resistance are missense mutations or indels in the RRDR and they
result in different levels of resistance (Somoskovi et al., 2001). In the remaining cases resistance
is given by mutations at the N-terminal of the β-subunit of the RNA polymerase (Ahmad and
Mokaddas, 2005).
81
The concentration of selective compound is usually two or four times higher than the minimum
inhibitory concentration (MIC) of that substance, so for non-model organisms the MIC has to be
predetermined (Pope et al., 2008). The small size of the inoculum of each subculture is required
to ensure absence of pre-existing mutants, but when the initial number of cells is too low, taking
off of the cultures is delayed and can be inconsistent due to biologic variability. The number of
parallel cultures can vary between few tens up to 100. The higher the number of samples, the
more precise is the evaluation of the mutation rate, but commonly they are 20-30.
4.2 Mutation frequency in P. thermoglucosidasius The dnaQ mutants created by site-directed mutagenesis were going to be tested for their
capacity to increase mutagenesis of the wt gene without compromising viability. It was sufficient
to determine a difference in mutagenic strength of 11955 cells electroporated with the high
copy number vector pG1AK mCherry carrying dnaQ D68E, E70V, D154E, H207L, D210E and
D212E.
The calculation of the mutation rate of each mutator with the fluctuation and the mutation
accumulation tests was predicted to be difficult. In fact, P. thermoglucosidasius typically shows
high biological variability and the high number of repeats required for each strain to be analysed
suggested that the experiment was going to be overly laborious. Therefore it was decided to
proceed with the calculation of the mutation frequency of each DnaQ mutator.
Rifampin (Rif) had been used to calculate mutation frequency of G. kaustophilus HTA426 in a
recent study by Suzuki et al. (2015); in this procedure a liquid culture of 106 cells from glycerol
stock was grown in LB for two hours at 60°C until OD600 reached 1, 109 cells were plated on solid
rich medium supplemented with 0 µg/mL, 10 µg/mL and 50 µg/mL rifampin (Rif10 and Rif50,
respectively). After 24 hours incubation at 60°C the number of colonies were counted and the
mutation frequency calculated by dividing the number of Rif resistant colonies by 109 cells. A
preliminary test for the calculation of the mutation frequency with 11955 pdnaQE70V and 11955
pdnaQD210E was carried out to assess the protocol described by Suzuki and colleagues. LB
plates for selection of mutants were supplemented with Rif10 (rather than Rif10 and Rif50, as
described), but no growth was observed. The same experiment was performed also with 1
µg/mL and 1.6 µg/mL ciprofloxacin (Cpx1 and Cpx1.6, respectively): no growth was observed on
the plates with Cpx1.6, while 2-10 colonies appeared on the plate with Cpx1 (data not shown).
Although there were some differences with the original protocol, imposed by P.
thermoglucosidasius characteristics and growth rate. When revived directly from glycerol stock,
P. thermoglucosidasius is unable to vigorously grow in liquid culture, therefore overnight liquid
cultures were prepared from freshly streaked plates and subcultured in the morning in ratio
82
1/10. Subcultures were grown for 3 hours and 45 minutes until OD600 reached values between
1.5 and 2. To avoid false negative results frequently obtained with the appearance of colonies
grown on a layer of dead cells on the plate, only a dilution of the total number of cells was
plated, corresponding to concentrations between 2.88 and 4.53 x 10⁴ cells. From this and other
protocols subsequently tried with increased concentration of cells it was deduced that the
calculation of the mutation frequency on solid medium was not to pursue. It was decided to
consistently grow and test the mutation frequency of P. thermoglucosidasius in liquid culture.
In a study that analysed rifampin stability by HPLC at different temperatures and media
commonly used for drug susceptibility testing of Mycobacterium tubercolosis it was found that
almost 50 % of rifampin degrades at 37°C after seven days in 7H9 and L-J medium, and at 75°C,
21.43 % of rifampin degrades in 50 minutes in L-J medium (Yu et al., 2011). Long incubation
periods and high optimum growth temperature of P. thermoglucosidasius (60°C) were
anticipated to decrease selection stringency of rifampin, allowing false positive resistant cells to
grow. Therefore, while seeking a valid alternative to rifampin, it was decided to test
ciprofloxacin.
4.3 Ciprofloxacin Ciprofloxacin is a synthetic fluoroquinolone, a broad spectrum antibiotic agent with bacteriocidal
effects that severely affects DNA replication (Sanders, 1988). Ciprofloxacin is thermostable. It
has been shown that only 0.01 % of ciprofloxacin degrades in milk at 72°C for 15 seconds and
that this percentage increases to only 12.71 % at 120°C for 20 minutes (Roca et al., 2010).
Ciprofloxacin targets the topoisomerases II called DNA gyrase and topoisomerase IV. Upstream
the replicative fork, the activity of the helicase DnaB causes positive DNA supercoiling. It has
been calculated that every second the torsional stress of DNA increases of 100 supercoils and if
it is not resolved it causes the arrest and dissociation of the replisome (Postow et al., 2001). In
order to allow the smooth progression of the replisome and let cell divide, topoisomerases
change the topological status of DNA molecules using energy from ATP hydrolysis. DNA gyrases
relax the double helix by introducing negative supercoils at replicative forks, topoisomerases IV
disentangle interlocked circular chromosomes or plasmids after replication. In Gram-negative
bacteria the primary target is the DNA gyrase, whereas in Gram-positive micro-organisms it is
the topoisomerase IV (Alovero et al., 2000). Ciprofloxacin is toxic because it binds to the DNA-
topoisomerase complex, when the replication fork collides with this complex, the topoisomerase
is permanently blocked in this conformation, therefore replication is inhibited and attempts to
denature the topoisomerase by SOS responses of the cell free the double strand breaks
ultimately causing cell death (Shea and Hiasa, 1999). Resistance towards ciprofloxacin is
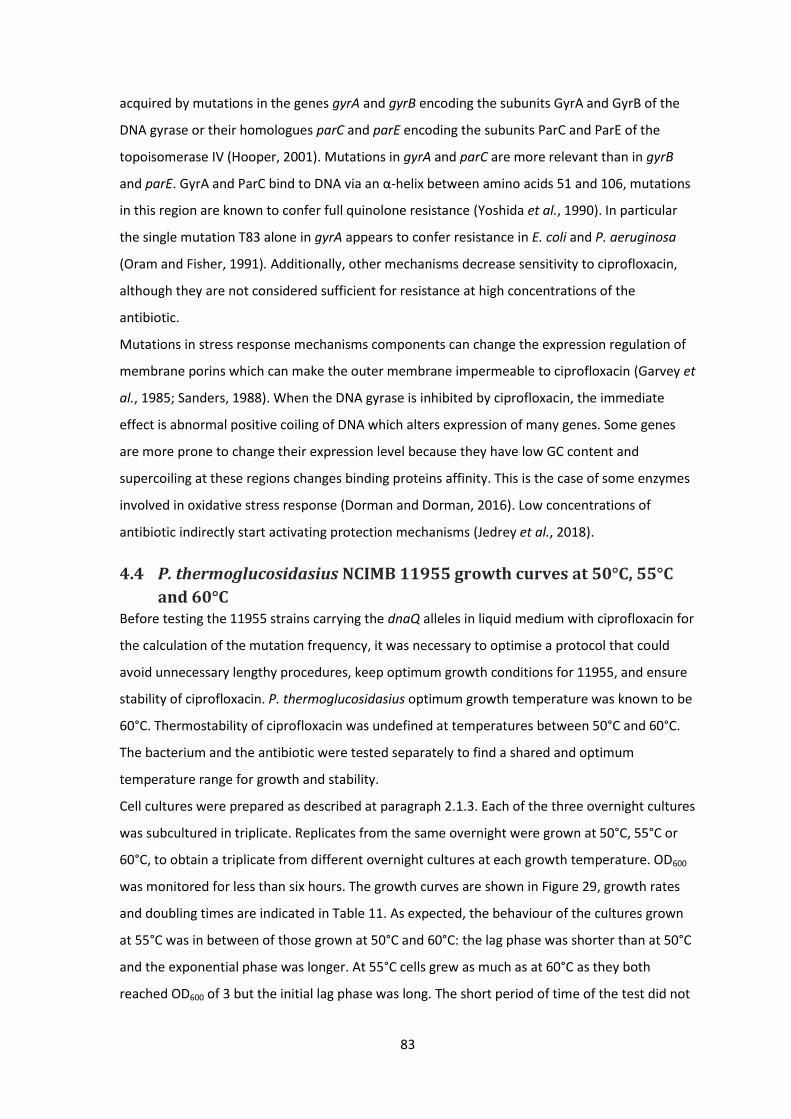
83
acquired by mutations in the genes gyrA and gyrB encoding the subunits GyrA and GyrB of the
DNA gyrase or their homologues parC and parE encoding the subunits ParC and ParE of the
topoisomerase IV (Hooper, 2001). Mutations in gyrA and parC are more relevant than in gyrB
and parE. GyrA and ParC bind to DNA via an α-helix between amino acids 51 and 106, mutations
in this region are known to confer full quinolone resistance (Yoshida et al., 1990). In particular
the single mutation T83 alone in gyrA appears to confer resistance in E. coli and P. aeruginosa
(Oram and Fisher, 1991). Additionally, other mechanisms decrease sensitivity to ciprofloxacin,
although they are not considered sufficient for resistance at high concentrations of the
antibiotic.
Mutations in stress response mechanisms components can change the expression regulation of
membrane porins which can make the outer membrane impermeable to ciprofloxacin (Garvey et
al., 1985; Sanders, 1988). When the DNA gyrase is inhibited by ciprofloxacin, the immediate
effect is abnormal positive coiling of DNA which alters expression of many genes. Some genes
are more prone to change their expression level because they have low GC content and
supercoiling at these regions changes binding proteins affinity. This is the case of some enzymes
involved in oxidative stress response (Dorman and Dorman, 2016). Low concentrations of
antibiotic indirectly start activating protection mechanisms (Jedrey et al., 2018).
4.4 P. thermoglucosidasius NCIMB 11955 growth curves at 50°C, 55°C
and 60°C Before testing the 11955 strains carrying the dnaQ alleles in liquid medium with ciprofloxacin for
the calculation of the mutation frequency, it was necessary to optimise a protocol that could
avoid unnecessary lengthy procedures, keep optimum growth conditions for 11955, and ensure
stability of ciprofloxacin. P. thermoglucosidasius optimum growth temperature was known to be
60°C. Thermostability of ciprofloxacin was undefined at temperatures between 50°C and 60°C.
The bacterium and the antibiotic were tested separately to find a shared and optimum
temperature range for growth and stability.
Cell cultures were prepared as described at paragraph 2.1.3. Each of the three overnight cultures
was subcultured in triplicate. Replicates from the same overnight were grown at 50°C, 55°C or
60°C, to obtain a triplicate from different overnight cultures at each growth temperature. OD600
was monitored for less than six hours. The growth curves are shown in Figure 29, growth rates
and doubling times are indicated in Table 11. As expected, the behaviour of the cultures grown
at 55°C was in between of those grown at 50°C and 60°C: the lag phase was shorter than at 50°C
and the exponential phase was longer. At 55°C cells grew as much as at 60°C as they both
reached OD600 of 3 but the initial lag phase was long. The short period of time of the test did not

84
provide data on the stationary phase of the cultures at 55°C and 50°C, although at the last time
point taken, the trend of the curves suggested cells stopped growing exponentially.
Figure 29 - Growth curves of P. thermoglucosidasius NCIMB 11955 in liquid 2TY at 50°C, 55°C and 60°C shaking at 250 rpm. Every time point is an average of a triplicate.
Exponential phase of the culture at 60°C lasted three hours and the growth rate was calculated
between the first and the fourth time point, while for the cultures at 50°C and 55°C the cultures
grew exponentially for only two hours between the second and the fourth hour. Table 11 shows
that the higher the temperature, the lower the growth rate: 11955 population at 60°C took 12
minutes more to double than at 50°C and 5 minutes more than at 55°C, although the lag phase
at 60°C was not detected. This was seen as a very important characteristic for the downstream
experiments where 11955 had to be in the best growth conditions from the very start. This
second experiment confirmed the results of the first tests: the optimum growth condition for
11955 was 60°C.
Table 11 - Growth rates and doubling times of P. thermoglucosidasius NCIMB 11955 grown in liquid 2TY at 50°C, 55°C and 60°C.
Growth condition
Trend line of exponential phase
Growth rate µ (h-1)
Doubling time td (min)
50°C y = 1.711x - 6.665 R² = 0.998 1.711 24
55°C y = 1.344x - 4.830 R² = 0.995 1.344 31
60°C y = 1.163x - 3.713 R² = 0.978 1.163 36
4.5 Determination of ciprofloxacin working concentrations P. thermoglucosidasius cells were prepared as described at paragraph 2.1.3. A single overnight
culture was subcultured in the morning in five separate liquid cultures. Five more 2TY liquid
cultures were started fresh in the morning (i.e. inoculated with a loopful of cell mass taken from
the same freshly streaked plate that was used to inoculate the overnight culture). Each set had
four cultures added with different volumes of ciprofloxacin to the final concentrations of 0.2
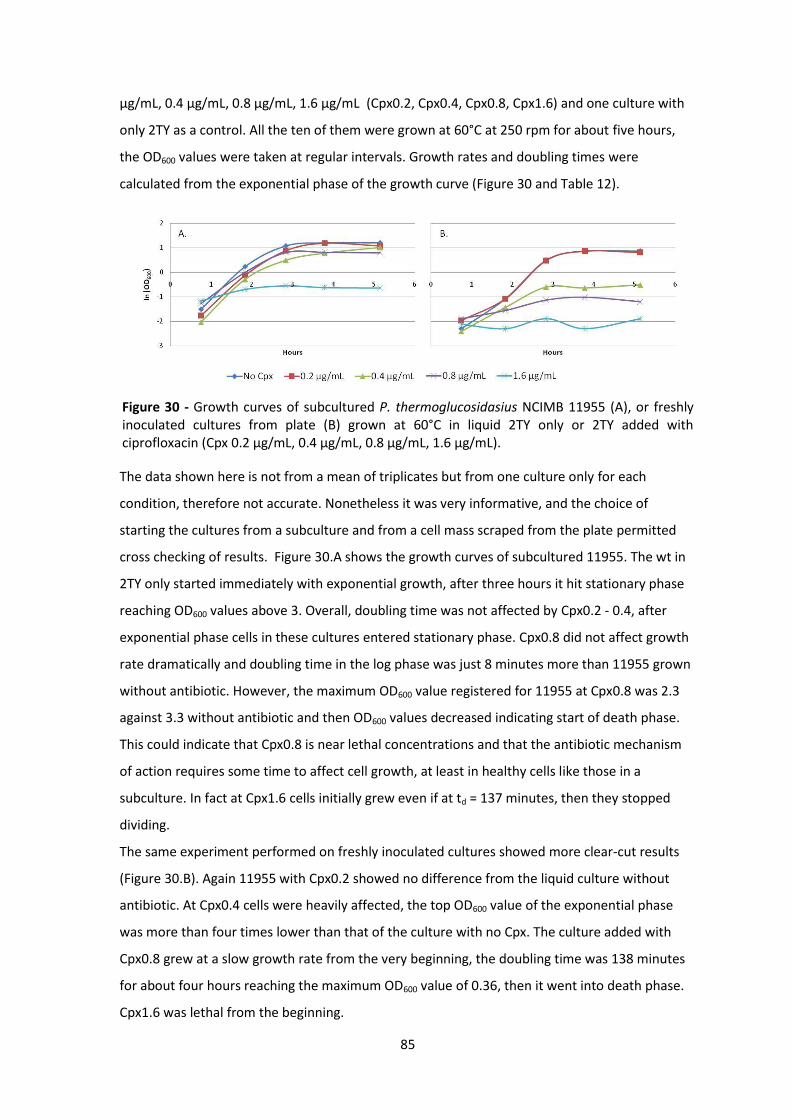
85
µg/mL, 0.4 µg/mL, 0.8 µg/mL, 1.6 µg/mL (Cpx0.2, Cpx0.4, Cpx0.8, Cpx1.6) and one culture with
only 2TY as a control. All the ten of them were grown at 60°C at 250 rpm for about five hours,
the OD600 values were taken at regular intervals. Growth rates and doubling times were
calculated from the exponential phase of the growth curve (Figure 30 and Table 12).
Figure 30 - Growth curves of subcultured P. thermoglucosidasius NCIMB 11955 (A), or freshly inoculated cultures from plate (B) grown at 60°C in liquid 2TY only or 2TY added with ciprofloxacin (Cpx 0.2 µg/mL, 0.4 µg/mL, 0.8 µg/mL, 1.6 µg/mL).
The data shown here is not from a mean of triplicates but from one culture only for each
condition, therefore not accurate. Nonetheless it was very informative, and the choice of
starting the cultures from a subculture and from a cell mass scraped from the plate permitted
cross checking of results. Figure 30.A shows the growth curves of subcultured 11955. The wt in
2TY only started immediately with exponential growth, after three hours it hit stationary phase
reaching OD600 values above 3. Overall, doubling time was not affected by Cpx0.2 - 0.4, after
exponential phase cells in these cultures entered stationary phase. Cpx0.8 did not affect growth
rate dramatically and doubling time in the log phase was just 8 minutes more than 11955 grown
without antibiotic. However, the maximum OD600 value registered for 11955 at Cpx0.8 was 2.3
against 3.3 without antibiotic and then OD600 values decreased indicating start of death phase.
This could indicate that Cpx0.8 is near lethal concentrations and that the antibiotic mechanism
of action requires some time to affect cell growth, at least in healthy cells like those in a
subculture. In fact at Cpx1.6 cells initially grew even if at td = 137 minutes, then they stopped
dividing.
The same experiment performed on freshly inoculated cultures showed more clear-cut results
(Figure 30.B). Again 11955 with Cpx0.2 showed no difference from the liquid culture without
antibiotic. At Cpx0.4 cells were heavily affected, the top OD600 value of the exponential phase
was more than four times lower than that of the culture with no Cpx. The culture added with
Cpx0.8 grew at a slow growth rate from the very beginning, the doubling time was 138 minutes
for about four hours reaching the maximum OD600 value of 0.36, then it went into death phase.
Cpx1.6 was lethal from the beginning.
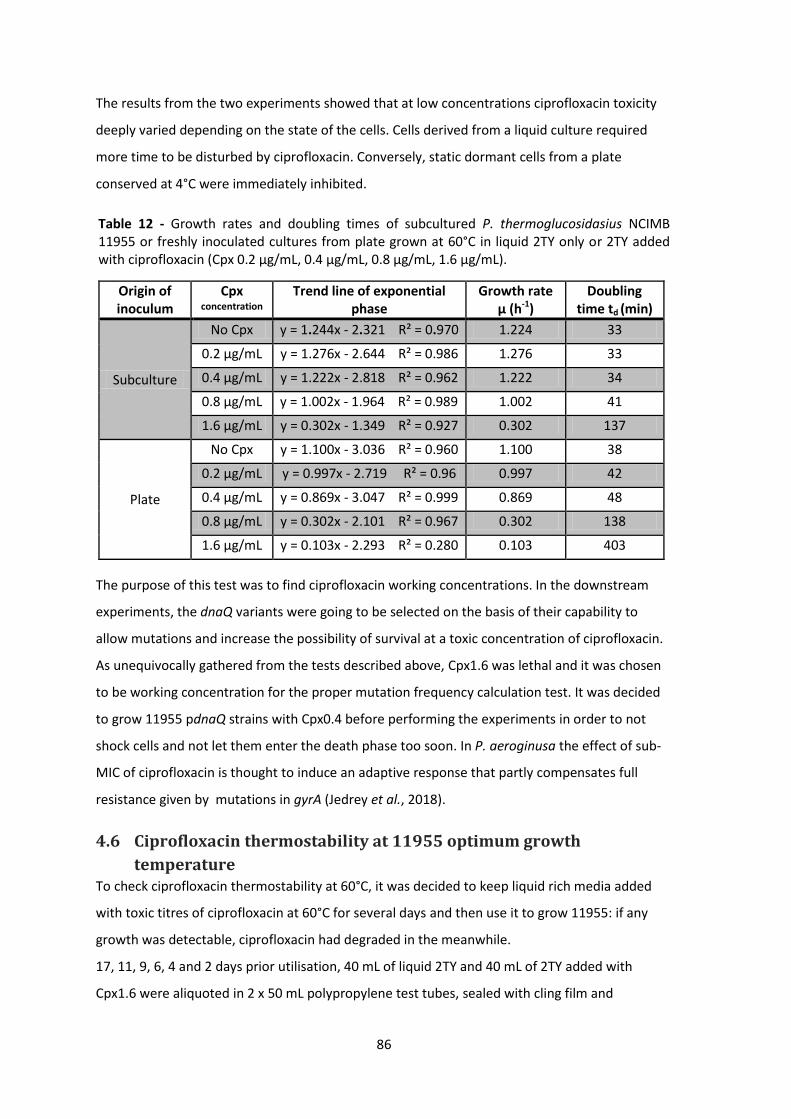
86
The results from the two experiments showed that at low concentrations ciprofloxacin toxicity
deeply varied depending on the state of the cells. Cells derived from a liquid culture required
more time to be disturbed by ciprofloxacin. Conversely, static dormant cells from a plate
conserved at 4°C were immediately inhibited.
Table 12 - Growth rates and doubling times of subcultured P. thermoglucosidasius NCIMB 11955 or freshly inoculated cultures from plate grown at 60°C in liquid 2TY only or 2TY added with ciprofloxacin (Cpx 0.2 µg/mL, 0.4 µg/mL, 0.8 µg/mL, 1.6 µg/mL).
Origin of inoculum
Cpx concentration
Trend line of exponential phase
Growth rate µ (h-1)
Doubling time td (min)
Subculture
No Cpx y = 1.244x - 2.321 R² = 0.970 1.224 33
0.2 µg/mL y = 1.276x - 2.644 R² = 0.986 1.276 33
0.4 µg/mL y = 1.222x - 2.818 R² = 0.962 1.222 34
0.8 µg/mL y = 1.002x - 1.964 R² = 0.989 1.002 41
1.6 µg/mL y = 0.302x - 1.349 R² = 0.927 0.302 137
Plate
No Cpx y = 1.100x - 3.036 R² = 0.960 1.100 38
0.2 µg/mL y = 0.997x - 2.719 R² = 0.96 0.997 42
0.4 µg/mL y = 0.869x - 3.047 R² = 0.999 0.869 48
0.8 µg/mL y = 0.302x - 2.101 R² = 0.967 0.302 138
1.6 µg/mL y = 0.103x - 2.293 R² = 0.280 0.103 403
The purpose of this test was to find ciprofloxacin working concentrations. In the downstream
experiments, the dnaQ variants were going to be selected on the basis of their capability to
allow mutations and increase the possibility of survival at a toxic concentration of ciprofloxacin.
As unequivocally gathered from the tests described above, Cpx1.6 was lethal and it was chosen
to be working concentration for the proper mutation frequency calculation test. It was decided
to grow 11955 pdnaQ strains with Cpx0.4 before performing the experiments in order to not
shock cells and not let them enter the death phase too soon. In P. aeroginusa the effect of sub-
MIC of ciprofloxacin is thought to induce an adaptive response that partly compensates full
resistance given by mutations in gyrA (Jedrey et al., 2018).
4.6 Ciprofloxacin thermostability at 11955 optimum growth
temperature To check ciprofloxacin thermostability at 60°C, it was decided to keep liquid rich media added
with toxic titres of ciprofloxacin at 60°C for several days and then use it to grow 11955: if any
growth was detectable, ciprofloxacin had degraded in the meanwhile.
17, 11, 9, 6, 4 and 2 days prior utilisation, 40 mL of liquid 2TY and 40 mL of 2TY added with
Cpx1.6 were aliquoted in 2 x 50 mL polypropylene test tubes, sealed with cling film and
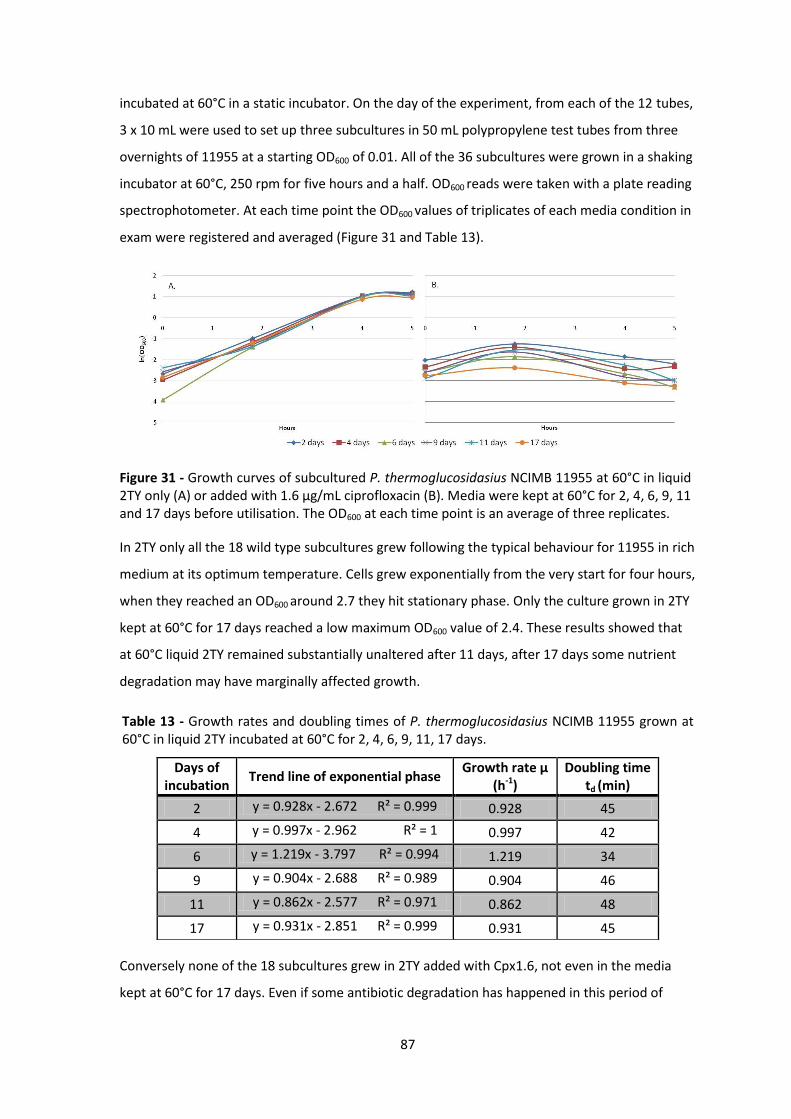
87
incubated at 60°C in a static incubator. On the day of the experiment, from each of the 12 tubes,
3 x 10 mL were used to set up three subcultures in 50 mL polypropylene test tubes from three
overnights of 11955 at a starting OD600 of 0.01. All of the 36 subcultures were grown in a shaking
incubator at 60°C, 250 rpm for five hours and a half. OD600 reads were taken with a plate reading
spectrophotometer. At each time point the OD600 values of triplicates of each media condition in
exam were registered and averaged (Figure 31 and Table 13).
Figure 31 - Growth curves of subcultured P. thermoglucosidasius NCIMB 11955 at 60°C in liquid 2TY only (A) or added with 1.6 µg/mL ciprofloxacin (B). Media were kept at 60°C for 2, 4, 6, 9, 11 and 17 days before utilisation. The OD600 at each time point is an average of three replicates.
In 2TY only all the 18 wild type subcultures grew following the typical behaviour for 11955 in rich
medium at its optimum temperature. Cells grew exponentially from the very start for four hours,
when they reached an OD600 around 2.7 they hit stationary phase. Only the culture grown in 2TY
kept at 60°C for 17 days reached a low maximum OD600 value of 2.4. These results showed that
at 60°C liquid 2TY remained substantially unaltered after 11 days, after 17 days some nutrient
degradation may have marginally affected growth.
Table 13 - Growth rates and doubling times of P. thermoglucosidasius NCIMB 11955 grown at 60°C in liquid 2TY incubated at 60°C for 2, 4, 6, 9, 11, 17 days.
Days of incubation
Trend line of exponential phase Growth rate µ
(h-1) Doubling time
td (min)
2 y = 0.928x - 2.672 R² = 0.999 0.928 45
4 y = 0.997x - 2.962 R² = 1 0.997 42
6 y = 1.219x - 3.797 R² = 0.994 1.219 34
9 y = 0.904x - 2.688 R² = 0.989 0.904 46
11 y = 0.862x - 2.577 R² = 0.971 0.862 48
17 y = 0.931x - 2.851 R² = 0.999 0.931 45
Conversely none of the 18 subcultures grew in 2TY added with Cpx1.6, not even in the media
kept at 60°C for 17 days. Even if some antibiotic degradation has happened in this period of
88
time, results suggested that after 17 days the concentration of ciprofloxacin was still toxic to
11955. These findings validated the feasibility of the mutation frequency calculation experiment
in optima conditions for 11955 (in 2TY at 60°C), without the possibility of having false positives
as a consequence of ciprofloxacin thermosensitivity.
4.7 Mutation frequency of wt strain carrying dnaQ in vivo mutators The calculation of the relative mutation frequencies of 11955 pdnaQ strains were calculated
following a protocol that was the best compromise of all the information gathered from several
failed attempted protocols (not shown). It was designed to keep the bacterium at its optimum
growth conditions and minimise biological variability, while being time efficient. The strains
tested were the wild type 11955, 11955 pdnaQwt, 11955 pdnaQD68E, 11955 pdnaQE70V, 11955
pdnaQD154E, 11955 pdnaQH207L, 11955 pdnaQD210E and 11955 pdnaQD212E. The test on
each of the eight strains was carried out in triplicates. Because of the long procedure of the
protocol the whole experiment was divided in at least three slots.
The strains to be tested were grown overnight in triplicates at 60°C in 2TY with Cpx0.4 and 12.5
µg/mL kan (apart form the wt) and subcultured in the morning in ratio 1/10 in the same kind of
medium. When the OD600 reached 2-2.5 they were diluted to an OD600 of 0.0004 in 110 mL of 2TY
with 12.5 µg/mL kan, if needed. The number of cells in this starting culture (called “master
culture”) was calculated by inferring the CFU/mL in the volume from the morning subculture
used to have an OD600 of 0.0004 in the master culture (as described at paragraph 2.1.8).
To check if cells remained viable in the wells of 48-well plates (ThermoFisher Scientific) that
were used in this experiment, 800 µL of master cultures at on OD600 of 0.0004 were aliquoted in
16 wells of a 48-well plate. Fully loaded plates were wrapped in plastic bags, incubated overnight
at 60°C in a static incubator and the following day wells were checked for turbidity.
The remaining volume of the master cultures was calculated and the appropriate volume of
ciprofloxacin was added to obtain a final concentration of 1.6 µg/mL. 800 µL were aliquoted into
96 wells (2 x 48-well plates). Plates were carefully wrapped in plastic bags and incubated for 90
hours (almost four days) at 60°C in a static incubator. On the fourth day after the start of the
experiment, the number of turbid wells was counted.
All throughout the incubation time, plates were briefly checked: on the first and the second day
all wells were always clear (a part from 11955 pdnaQH207L), on the third day some wells started
to get turbid, but precise numbers were noted down only on the fourth day as many wells
became more clearly turbid overnight. No more turbid wells were considered after the fourth
day. In fact, leaving plates for longer in the incubator at 60°C in many occasions let more wells
get turbid, although waiting too long would have compromised viability of the cultures that grew
89
earlier and so the rise of false negatives. The difference in mutation frequency among all the
dnaQ mutants and the controls in a short period of time was also more relevant to the purpose
of the study rather than an absolute calculation of the mutation frequency. To confirm viability
and acquired resistance to Cpx1.6, 80 µL from each turbid well were used to inoculate wells of
two mirror plates with fresh 2TY with kanamycin (if required) with or without Cpx1.6. Plates
were wrapped in plastic bags and incubated at 60°C in a static incubator. Wells with 2TY only
turned turbid after 12 hours (confirming viability), plates with 2TY and Cpx1.6 required a 30-hour
incubation (confirming resistance).
The calculation of the mutation frequency was an average of the replicates mutation frequency
determined by dividing the number of turbid wells by the initial number of cells in their master
cultures. The necessity to start from the very low OD600 of 0.0004 (which corresponded to a few
hundreds of cells) was to be able to correlate the number of turbid wells to the number of
mutated genotypes without compromising viability. Results for 11955, 11955 pdnaQwt, 11955
pdnaQE70V and 11955 pdnaQD212E were obtained from a single triplicate. To narrow down
standard deviation for 11955 pdnaQD154E, 11955 pdnaQH207L, and 11955 pdnaQD210E the
experiment was repeated twice (2 x 3 replicates), for 11955 pdnaQD68E it was done three times
(3 x 3 triplicates). In these cases a statistical test was performed to exclude outliers from data
sets of six or nine values (Kenna et al., 2007).
Data values were divided in quartiles, quartile Q1 (first 25% of the data), quartile Q3 (the last
25% of the data) and the interquartile values (IQR, Q3-Q1, which covered the 50 % of the values
range) were calculated. This simple statistical test was a two-sided outlier test that excluded all
values that were less than or equal to Q1 - (IQR x 1.5) and greater than or equal to Q3 + (IQR x
1.5). Only two values were excluded from 11955 pdnaQD68E data set and one from 11955
pdnaQD154E as ≥ Q3 + (IQR x 1.5). All other values were considered to plot the following bar
chart (Figure 32). This graph shows that the mutation frequency 11955 wt was very low (in
yellow). Somehow even just the presence of the extra copies of the wild type dnaQ gene on the
vector moderately perturbed fidelity of DNA replication (in green) resulting in a threefold
increase of the mutation frequency of 11955 pdnaQwt, 11955 pdnaQE70V (in dark blue)
appeared to compensate the effect of multicopy dnaQ and was less mutagenic. 11955
pdnaQD212E (in orange) and 11955 pdnaQD154E (in purple) seemed to have an intermediate
mutation frequency. 11955 pdnaQD210E, 11955 pdnaQD68E and 11955 pdnaQH207L (red, light
blue and indigo bars) showed a high mutation frequency.
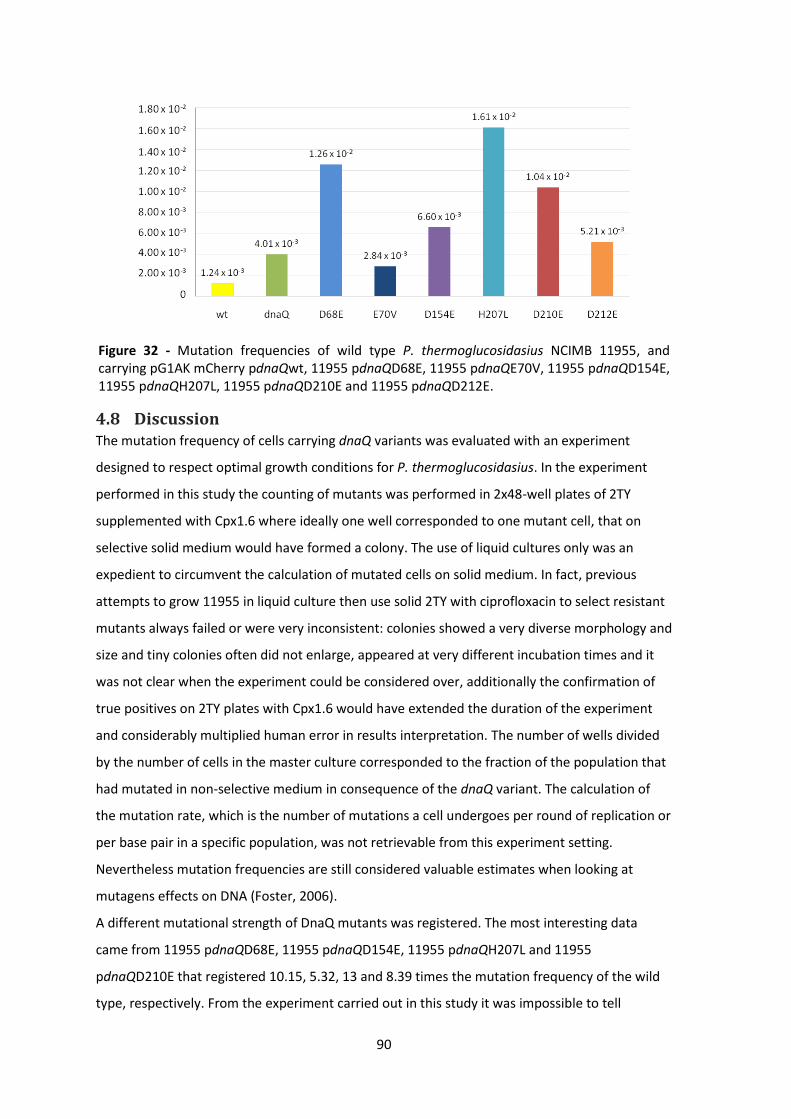
90
Figure 32 - Mutation frequencies of wild type P. thermoglucosidasius NCIMB 11955, and carrying pG1AK mCherry pdnaQwt, 11955 pdnaQD68E, 11955 pdnaQE70V, 11955 pdnaQD154E, 11955 pdnaQH207L, 11955 pdnaQD210E and 11955 pdnaQD212E.
4.8 Discussion The mutation frequency of cells carrying dnaQ variants was evaluated with an experiment
designed to respect optimal growth conditions for P. thermoglucosidasius. In the experiment
performed in this study the counting of mutants was performed in 2x48-well plates of 2TY
supplemented with Cpx1.6 where ideally one well corresponded to one mutant cell, that on
selective solid medium would have formed a colony. The use of liquid cultures only was an
expedient to circumvent the calculation of mutated cells on solid medium. In fact, previous
attempts to grow 11955 in liquid culture then use solid 2TY with ciprofloxacin to select resistant
mutants always failed or were very inconsistent: colonies showed a very diverse morphology and
size and tiny colonies often did not enlarge, appeared at very different incubation times and it
was not clear when the experiment could be considered over, additionally the confirmation of
true positives on 2TY plates with Cpx1.6 would have extended the duration of the experiment
and considerably multiplied human error in results interpretation. The number of wells divided
by the number of cells in the master culture corresponded to the fraction of the population that
had mutated in non-selective medium in consequence of the dnaQ variant. The calculation of
the mutation rate, which is the number of mutations a cell undergoes per round of replication or
per base pair in a specific population, was not retrievable from this experiment setting.
Nevertheless mutation frequencies are still considered valuable estimates when looking at
mutagens effects on DNA (Foster, 2006).
A different mutational strength of DnaQ mutants was registered. The most interesting data
came from 11955 pdnaQD68E, 11955 pdnaQD154E, 11955 pdnaQH207L and 11955
pdnaQD210E that registered 10.15, 5.32, 13 and 8.39 times the mutation frequency of the wild
type, respectively. From the experiment carried out in this study it was impossible to tell
91
whether the difference in mutation frequencies among dnaQ mutants depended on the order of
relevance of the amino acids of the DEDDh-like active site or on the specific amino acids that
were mutated into. For instance, from aspartic acid to glutamic acid there was a small change in
terms of characteristics of the amino acids (i.e. they both are negatively charged, but glutamic
acid has a longer side chain) and yet D68E was a mutation that induced a high mutation
frequency. Conversely E70V did not influence mutagenesis that much, but Glu70Val was a
significant change from an acidic to a non-polar residue. D210 was considered part of a DEDD
motif, while D212 was considered part of a DEDDh motif and therefore a mutation in D212 was
expected to have a stronger effect than in D210. On the contrary, the mutation frequency of
dnaQD210E was twice as much the mutation frequency of dnaQD212E. It could be hypothesised
that D210 was an important amino acid of the active site, and/or that E210 impeded correct
interaction of substrate with other important amino acids of the active site. Major impact was
expected from both mutations at positions D68 and E70, giving that in a study on E. coli the
double mutation D12A and E14A (D68 and E70 correspondent amino acids of the active site of P.
thermoglucosidasius DnaQ) produced a mutator so potent (named dnaQ926) that cells were
completely unviable (Fijalkowska and Schaaper, 1996). It would have been interesting to test the
mutation frequency of different amino acidic substitutions at the same sites or even simple
combinations of the designed mutations to find out if the mutation frequency changed.
Although, for the purpose of this study the creation of a small set of mutagenic DnaQ with
different strengths was satisfactory.
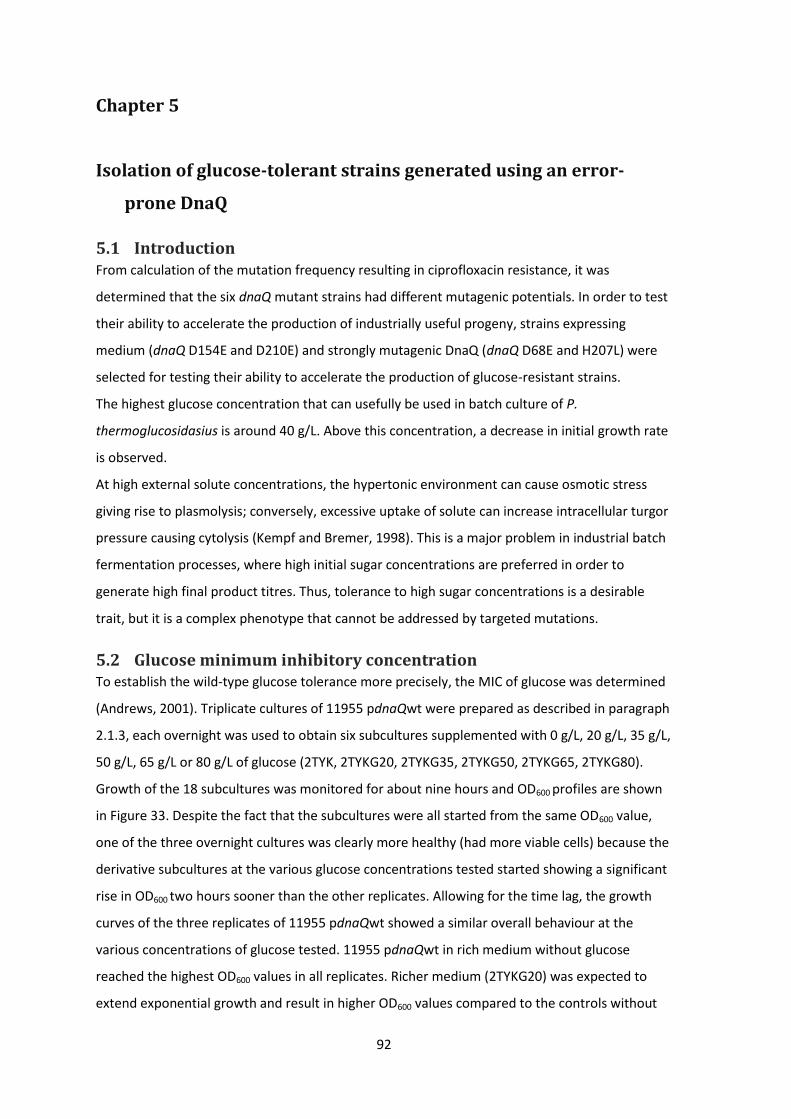
92
Chapter 5
Isolation of glucose-tolerant strains generated using an error-
prone DnaQ
5.1 Introduction From calculation of the mutation frequency resulting in ciprofloxacin resistance, it was
determined that the six dnaQ mutant strains had different mutagenic potentials. In order to test
their ability to accelerate the production of industrially useful progeny, strains expressing
medium (dnaQ D154E and D210E) and strongly mutagenic DnaQ (dnaQ D68E and H207L) were
selected for testing their ability to accelerate the production of glucose-resistant strains.
The highest glucose concentration that can usefully be used in batch culture of P.
thermoglucosidasius is around 40 g/L. Above this concentration, a decrease in initial growth rate
is observed.
At high external solute concentrations, the hypertonic environment can cause osmotic stress
giving rise to plasmolysis; conversely, excessive uptake of solute can increase intracellular turgor
pressure causing cytolysis (Kempf and Bremer, 1998). This is a major problem in industrial batch
fermentation processes, where high initial sugar concentrations are preferred in order to
generate high final product titres. Thus, tolerance to high sugar concentrations is a desirable
trait, but it is a complex phenotype that cannot be addressed by targeted mutations.
5.2 Glucose minimum inhibitory concentration To establish the wild-type glucose tolerance more precisely, the MIC of glucose was determined
(Andrews, 2001). Triplicate cultures of 11955 pdnaQwt were prepared as described in paragraph
2.1.3, each overnight was used to obtain six subcultures supplemented with 0 g/L, 20 g/L, 35 g/L,
50 g/L, 65 g/L or 80 g/L of glucose (2TYK, 2TYKG20, 2TYKG35, 2TYKG50, 2TYKG65, 2TYKG80).
Growth of the 18 subcultures was monitored for about nine hours and OD600 profiles are shown
in Figure 33. Despite the fact that the subcultures were all started from the same OD600 value,
one of the three overnight cultures was clearly more healthy (had more viable cells) because the
derivative subcultures at the various glucose concentrations tested started showing a significant
rise in OD600 two hours sooner than the other replicates. Allowing for the time lag, the growth
curves of the three replicates of 11955 pdnaQwt showed a similar overall behaviour at the
various concentrations of glucose tested. 11955 pdnaQwt in rich medium without glucose
reached the highest OD600 values in all replicates. Richer medium (2TYKG20) was expected to
extend exponential growth and result in higher OD600 values compared to the controls without
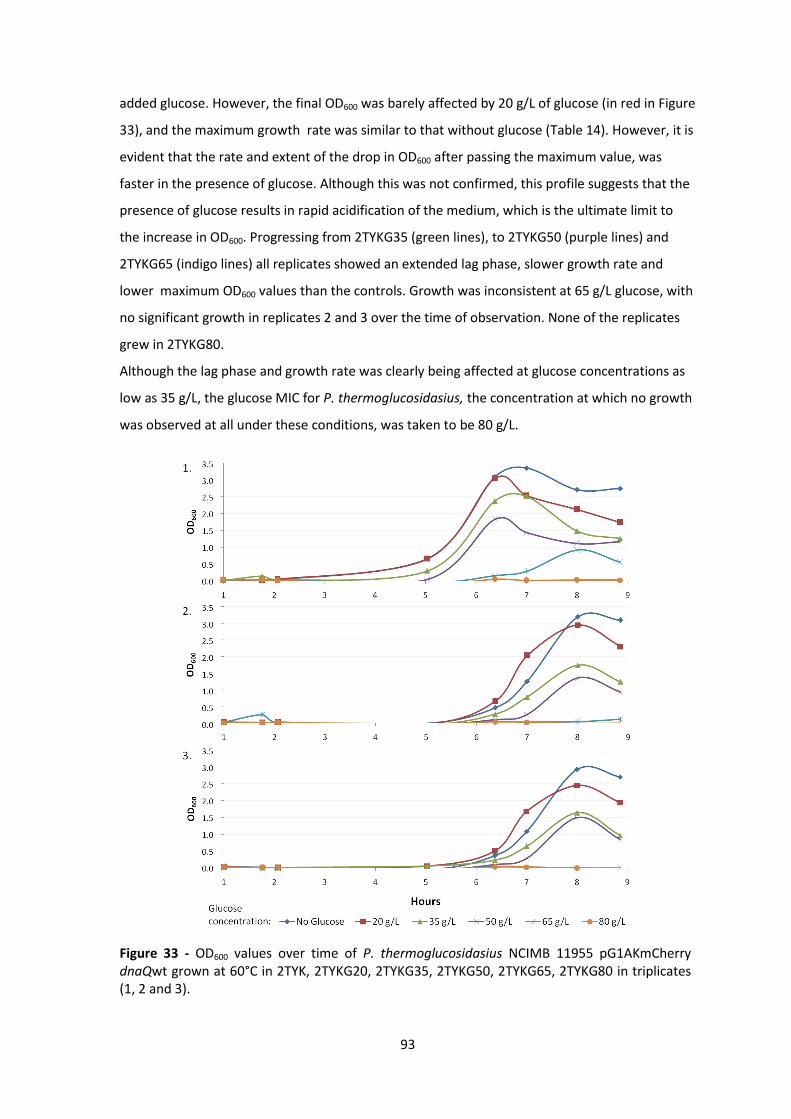
93
added glucose. However, the final OD600 was barely affected by 20 g/L of glucose (in red in Figure
33), and the maximum growth rate was similar to that without glucose (Table 14). However, it is
evident that the rate and extent of the drop in OD600 after passing the maximum value, was
faster in the presence of glucose. Although this was not confirmed, this profile suggests that the
presence of glucose results in rapid acidification of the medium, which is the ultimate limit to
the increase in OD600. Progressing from 2TYKG35 (green lines), to 2TYKG50 (purple lines) and
2TYKG65 (indigo lines) all replicates showed an extended lag phase, slower growth rate and
lower maximum OD600 values than the controls. Growth was inconsistent at 65 g/L glucose, with
no significant growth in replicates 2 and 3 over the time of observation. None of the replicates
grew in 2TYKG80.
Although the lag phase and growth rate was clearly being affected at glucose concentrations as
low as 35 g/L, the glucose MIC for P. thermoglucosidasius, the concentration at which no growth
was observed at all under these conditions, was taken to be 80 g/L.
Figure 33 - OD600 values over time of P. thermoglucosidasius NCIMB 11955 pG1AKmCherry dnaQwt grown at 60°C in 2TYK, 2TYKG20, 2TYKG35, 2TYKG50, 2TYKG65, 2TYKG80 in triplicates (1, 2 and 3).

94
A second aim of this experiment was to find a glucose concentration below the MIC that could
be used to grow P. thermoglucosidasius in before transferring to media containing toxic
concentrations of glucose. It was decided to consider 50 g/L as the starting concentration for
pre-growing cells in the next experiment.
Table 14 - Growth rates and doubling times of P. thermoglucosidasius NCIMB 11955 pG1AKmCherry pdnaQwt grown at 60°C in 2TYK, 2TYKG20, 2TYKG35, 2TYKG50 and 2TYKG65 in triplicates (1, 2 and 3). No growth was observed in 2TYKG80.
Glucose concentration
Replicates Trend line of exponential phase Growth rate µ (h-1)
Doubling time td
(min)
Mean td min
-
1 y = 1.079x - 5.791 R² = 0.999 1.079 38.54
36 2 y = 1.164x - 8.093 R² = 0.977 1.164 35.73
3 y = 1.248x - 8.841 R² = 0.976 1.248 33.32
20 g/L
1 y = 1.243x - 6.713 R² = 0.916 1.243 33.46
39 2 y = 0.913x - 6.048 R² = 0.973 0.913 45.55
3 y = 1.111x - 7.821 R² = 0.968 1.111 37.43
35 g/L
1 y = 0.973x - 5.756 R² = 0.975 0.973 42.74
48 2 y = 0.768x - 5.791 R² = 0.980 0.768 54.15
3 y = 0.862x - 6.703 R² = 0.977 0.862 48.25
50 g/L
1 y = 0.944x - 6.371 R² = 0.777 0.944 44.05
46 2 y = 0.825x - 7.081 R² = 0.955 0.825 50.41
3 y = 0.976x - 8.210 R² = 0.959 0.976 42.61
65 g/L
1 y = 0.540x - 4.884 R² = 0.924 0.540 77.02
321 2 y = 0.068x – 3.696 R² = 0.902 0.068 611.60
3 y = 0.151x - 4.204 R² = 0.997 0.151 275.42
5.3 Test at increasing concentrations of glucose To test whether the expression of error-prone mutants of DnaQ was able to accelerate the
evolution of a complex phenotype such as resistance towards glucose in P. thermoglucosidasius,
the dnaQ mutant strains were grown in sequentially increasing concentrations of glucose with
viability in both liquid and on solid (agar) medium being verified. Cultures were allowed to
recover in rich medium without glucose in between selection steps (Figure 34). It was decided to
increase the concentration of glucose by 25 g/L at each selection step. From an initial
concentration of 50 g/L of glucose, the plan was to passage cells onto 75 g/L, then 100 g/L, 125
g/L, 150 g/L, 175 g/L and possibly up to 200 g/L of glucose.
Strains 11955 pdnaQwt, 11955 pdnaQD68E, 11955 pdnaQD154E, 11955 pdnaQH207L and 11955
pdnaQD210E were prepared as described at paragraph 2.1.3 in polypropylene test tubes in
2TYK. The following morning they were diluted ten-fold in 100 mL of fresh 2TYK supplemented
95
with 40 mM triple buffer (TB) and 50 g/L glucose (2TYKG50TB) in flask until cell growth reached
stationary phase. From these cultures, 200 µL aliquots were plated on 2TYK agar plates and 200
µL aliquots were plated on 2TYKG50 agar plates. At first, cell cultures at increasing
concentrations of glucose were restarted from cell pellet derived from centrifuged cultures
revived in 2TYK. A 50 mL sample was centrifuged at 4000 rpm for 15 minutes at 4°C, the
supernatant discarded and the pellet stored at 4°C overnight. To restart the culture the cell
pellet was resuspended in 20 mL of 2TYK and revived at 60°C for one hour in a shaking incubator
at 200 rpm. Cells were harvested again by centrifugation at room temperature for 10 minutes at
4000 rpm and used to inoculate 100 mL of fresh 2TYKTB supplemented with 75 g/L glucose
(2TYKG75TB) and incubated at 60°C until the cultures reached stationary phase. Again 200 µL
aliquots were plated on 2TYK agar plates with and without 75 g/L glucose. The same procedure
was carried out to grow cells in 2TYKTB supplemented with 100 g/L glucose (2TYKG100TB).
Again, 200 µL aliquots were spread on 2TYK agar plates with and without 100 g/L glucose and
TB. This protocol was subsequently changed because the high concentration of cells in the
starting inocula did not permit accurate control over growth. Therefore, it was decided to use
the unstressed cells revived on the 2TYK agar plates (without glucose) to inoculate 100 mL of
fresh 2TYKTB supplemented with 125 g/L glucose (2TYKG125TB) and monitor growth throughout
the day. The inoculum consisted of the entire mass of cells scraped off the surface of the agar
plate. These cells were grown to stationary phase, then 200 µL were plated on 2TYK agar plates;
200 µL aliquots were also plated on 2TYKTB plates supplemented with 125 g/L glucose
(2TYKG125TB) and on 2TYKG100TB agar plates to confirm acquired resistance to the new and
previous selective conditions, respectively. Cells were allowed to recover overnight on solid
medium and the same protocol was repeated with 150 and 175 g/L of glucose. The experiment
was terminated at 175 g/L glucose as no viable colonies grew on the plates containing 175 g/L of
glucose and TB.
Figure 34 shows representative plates from this experiment. The control 11955 pdnaQwt grew in
liquid cultures of 2TYKG50TB and 2TYKG75TB, but only one colony grew on an agar plate of
2TYKG75 (later confirmed as a false positive); 11955 pdnaQD68E grew in liquid cultures of
2TYKG50TB, 2TYKG75TB and 2TYKG100TB, on 2TYKG50 and 2TYKG75 plates, but did not grow on
the 2TYKG100 plate; 11955 pdnaQD154E grew on plates and in liquid cultures of 2TYKG50TB,
2TYKG75TB and 2TYKG100TB, but only four colonies grew on plates with 100 g/L
of glucose and required two days of incubation (last two pictures of relevant row in Figure 34 are
of the same plate taken 24 and 48 hours after spreading and incubation at 60°C); 11955
pdnaQD210E grew on plates and in liquid cultures of 2TYKG50TB, 2TYKG75TB, 2TYKG100TB,
96
2TYKG125TB, 2TYKG150TB (picture of plate with 100 g/L of glucose is missing); 11955
pdnaQH207L grew on agar plates and in liquid cultures of 2TYKG50TB, 2TYKG75TB, 2TYKG100TB,
2TYKG125TB and 2TYKG150TB, it also grew in 2TYKG175TB in liquid culture to a very low OD600,
but only one colony grew on the corresponding plate later, and was later confirmed to be a false
positive.
Despite the changes to the protocol in intinere, all the strains were treated in the same way and
yet they responded differently to the increased concentrations of glucose. All the tested in vivo
mutators produced glucose resistant mutants at a higher frequency than the wild-type control,
which did not produce mutants capable of growing on plates containing more than 50 g/L
Figure 34 - P. thermoglucosidasius NCIMB 11955 strains carrying pG1AK mCherry containing a different version of dnaQ (wt, D68E, D154E, D210E and H207L) resistant to increasing concentration of glucose (50, 75, 100, 125, 150 and 175 g/L). Plates were 2TY agar supplemented with 12.5 µg/mL of kanamycin and glucose incubated for 24 hours at 60°C (11955 pdnaQD154E grown on 100 g/L glucose for 48 hours is also shown). Plates with 125, 150 and 175 g/L of glucose also contained 40 mM triple buffer. 200 µL of culture were spread on each plate. Picture of 11955 pdnaQD210E grown on 2TYKG100 is missing.
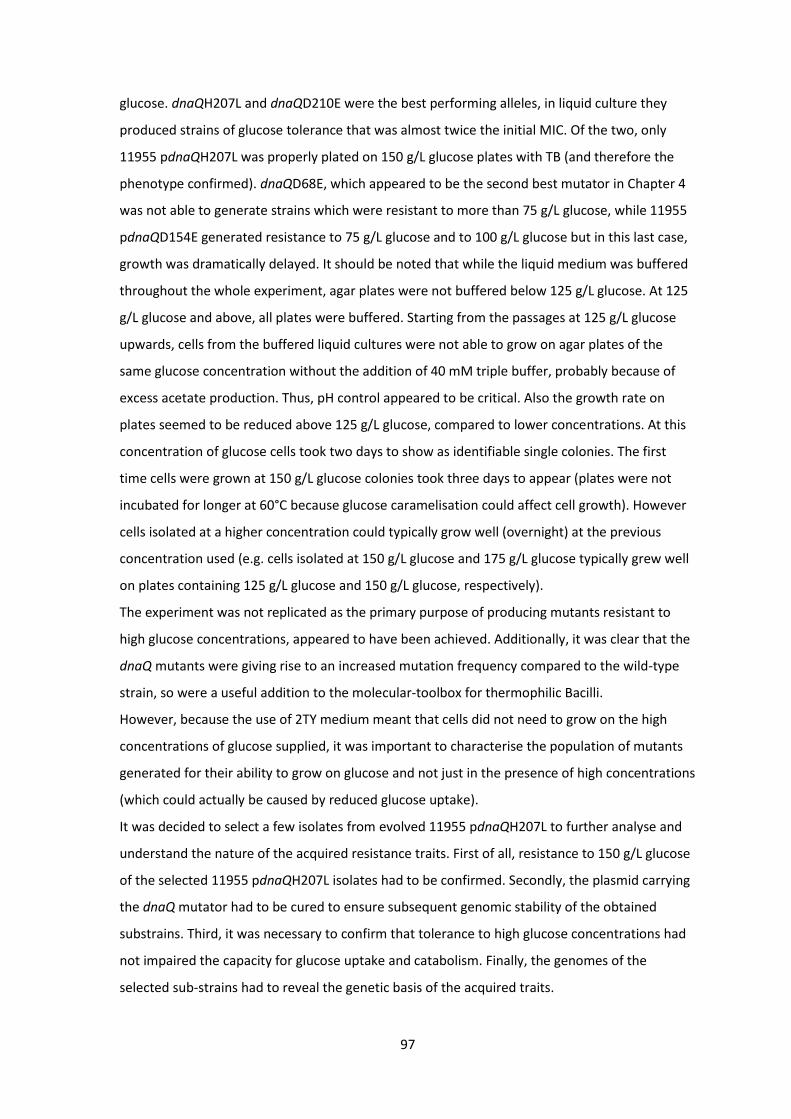
97
glucose. dnaQH207L and dnaQD210E were the best performing alleles, in liquid culture they
produced strains of glucose tolerance that was almost twice the initial MIC. Of the two, only
11955 pdnaQH207L was properly plated on 150 g/L glucose plates with TB (and therefore the
phenotype confirmed). dnaQD68E, which appeared to be the second best mutator in Chapter 4
was not able to generate strains which were resistant to more than 75 g/L glucose, while 11955
pdnaQD154E generated resistance to 75 g/L glucose and to 100 g/L glucose but in this last case,
growth was dramatically delayed. It should be noted that while the liquid medium was buffered
throughout the whole experiment, agar plates were not buffered below 125 g/L glucose. At 125
g/L glucose and above, all plates were buffered. Starting from the passages at 125 g/L glucose
upwards, cells from the buffered liquid cultures were not able to grow on agar plates of the
same glucose concentration without the addition of 40 mM triple buffer, probably because of
excess acetate production. Thus, pH control appeared to be critical. Also the growth rate on
plates seemed to be reduced above 125 g/L glucose, compared to lower concentrations. At this
concentration of glucose cells took two days to show as identifiable single colonies. The first
time cells were grown at 150 g/L glucose colonies took three days to appear (plates were not
incubated for longer at 60°C because glucose caramelisation could affect cell growth). However
cells isolated at a higher concentration could typically grow well (overnight) at the previous
concentration used (e.g. cells isolated at 150 g/L glucose and 175 g/L glucose typically grew well
on plates containing 125 g/L glucose and 150 g/L glucose, respectively).
The experiment was not replicated as the primary purpose of producing mutants resistant to
high glucose concentrations, appeared to have been achieved. Additionally, it was clear that the
dnaQ mutants were giving rise to an increased mutation frequency compared to the wild-type
strain, so were a useful addition to the molecular-toolbox for thermophilic Bacilli.
However, because the use of 2TY medium meant that cells did not need to grow on the high
concentrations of glucose supplied, it was important to characterise the population of mutants
generated for their ability to grow on glucose and not just in the presence of high concentrations
(which could actually be caused by reduced glucose uptake).
It was decided to select a few isolates from evolved 11955 pdnaQH207L to further analyse and
understand the nature of the acquired resistance traits. First of all, resistance to 150 g/L glucose
of the selected 11955 pdnaQH207L isolates had to be confirmed. Secondly, the plasmid carrying
the dnaQ mutator had to be cured to ensure subsequent genomic stability of the obtained
substrains. Third, it was necessary to confirm that tolerance to high glucose concentrations had
not impaired the capacity for glucose uptake and catabolism. Finally, the genomes of the
selected sub-strains had to reveal the genetic basis of the acquired traits.
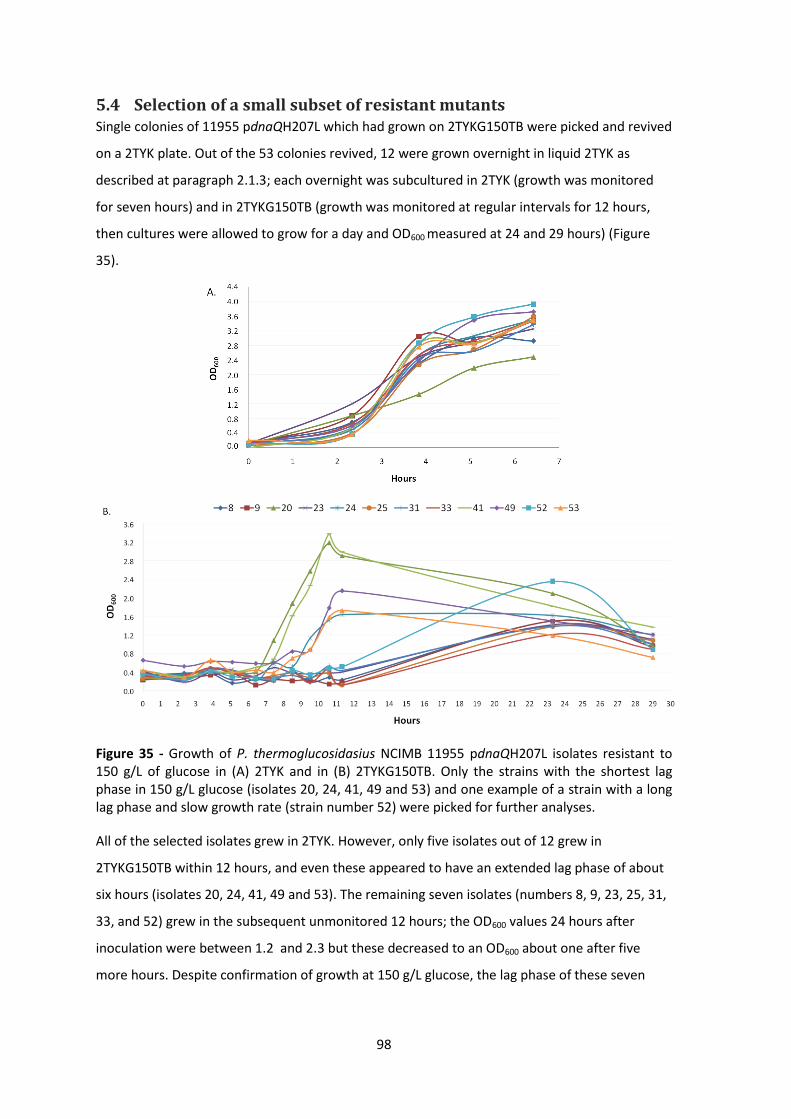
98
5.4 Selection of a small subset of resistant mutants Single colonies of 11955 pdnaQH207L which had grown on 2TYKG150TB were picked and revived
on a 2TYK plate. Out of the 53 colonies revived, 12 were grown overnight in liquid 2TYK as
described at paragraph 2.1.3; each overnight was subcultured in 2TYK (growth was monitored
for seven hours) and in 2TYKG150TB (growth was monitored at regular intervals for 12 hours,
then cultures were allowed to grow for a day and OD600 measured at 24 and 29 hours) (Figure
35).
Figure 35 - Growth of P. thermoglucosidasius NCIMB 11955 pdnaQH207L isolates resistant to 150 g/L of glucose in (A) 2TYK and in (B) 2TYKG150TB. Only the strains with the shortest lag phase in 150 g/L glucose (isolates 20, 24, 41, 49 and 53) and one example of a strain with a long lag phase and slow growth rate (strain number 52) were picked for further analyses.
All of the selected isolates grew in 2TYK. However, only five isolates out of 12 grew in
2TYKG150TB within 12 hours, and even these appeared to have an extended lag phase of about
six hours (isolates 20, 24, 41, 49 and 53). The remaining seven isolates (numbers 8, 9, 23, 25, 31,
33, and 52) grew in the subsequent unmonitored 12 hours; the OD600 values 24 hours after
inoculation were between 1.2 and 2.3 but these decreased to an OD600 about one after five
more hours. Despite confirmation of growth at 150 g/L glucose, the lag phase of these seven
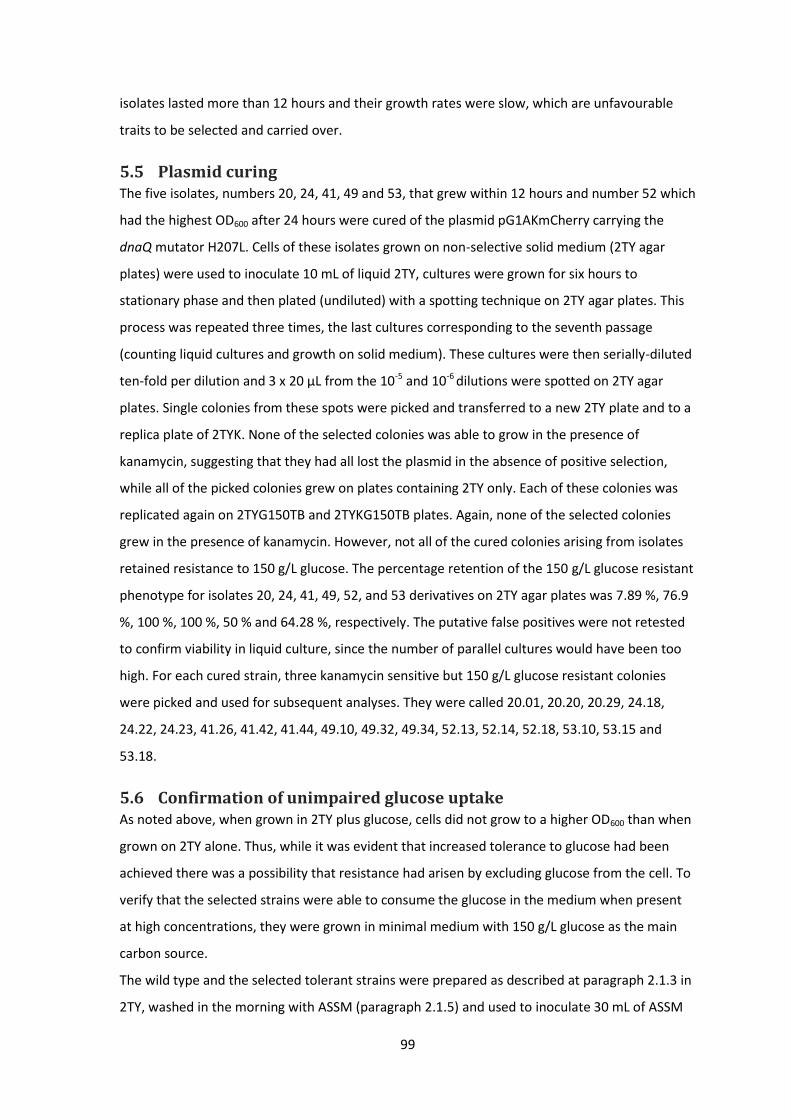
99
isolates lasted more than 12 hours and their growth rates were slow, which are unfavourable
traits to be selected and carried over.
5.5 Plasmid curing The five isolates, numbers 20, 24, 41, 49 and 53, that grew within 12 hours and number 52 which
had the highest OD600 after 24 hours were cured of the plasmid pG1AKmCherry carrying the
dnaQ mutator H207L. Cells of these isolates grown on non-selective solid medium (2TY agar
plates) were used to inoculate 10 mL of liquid 2TY, cultures were grown for six hours to
stationary phase and then plated (undiluted) with a spotting technique on 2TY agar plates. This
process was repeated three times, the last cultures corresponding to the seventh passage
(counting liquid cultures and growth on solid medium). These cultures were then serially-diluted
ten-fold per dilution and 3 x 20 µL from the 10-5 and 10-6 dilutions were spotted on 2TY agar
plates. Single colonies from these spots were picked and transferred to a new 2TY plate and to a
replica plate of 2TYK. None of the selected colonies was able to grow in the presence of
kanamycin, suggesting that they had all lost the plasmid in the absence of positive selection,
while all of the picked colonies grew on plates containing 2TY only. Each of these colonies was
replicated again on 2TYG150TB and 2TYKG150TB plates. Again, none of the selected colonies
grew in the presence of kanamycin. However, not all of the cured colonies arising from isolates
retained resistance to 150 g/L glucose. The percentage retention of the 150 g/L glucose resistant
phenotype for isolates 20, 24, 41, 49, 52, and 53 derivatives on 2TY agar plates was 7.89 %, 76.9
%, 100 %, 100 %, 50 % and 64.28 %, respectively. The putative false positives were not retested
to confirm viability in liquid culture, since the number of parallel cultures would have been too
high. For each cured strain, three kanamycin sensitive but 150 g/L glucose resistant colonies
were picked and used for subsequent analyses. They were called 20.01, 20.20, 20.29, 24.18,
24.22, 24.23, 41.26, 41.42, 41.44, 49.10, 49.32, 49.34, 52.13, 52.14, 52.18, 53.10, 53.15 and
53.18.
5.6 Confirmation of unimpaired glucose uptake As noted above, when grown in 2TY plus glucose, cells did not grow to a higher OD600 than when
grown on 2TY alone. Thus, while it was evident that increased tolerance to glucose had been
achieved there was a possibility that resistance had arisen by excluding glucose from the cell. To
verify that the selected strains were able to consume the glucose in the medium when present
at high concentrations, they were grown in minimal medium with 150 g/L glucose as the main
carbon source.
The wild type and the selected tolerant strains were prepared as described at paragraph 2.1.3 in
2TY, washed in the morning with ASSM (paragraph 2.1.5) and used to inoculate 30 mL of ASSM
100
in a baffled flask containing 40 mM triple buffer and 150 g/L of glucose (ASSMG150TB). OD600
values were monitored for 28 hours. However, none of the strain tested grew. In this test, the
initial overnight cultures were not supplemented with the sub-toxic concentration of glucose (50
g/L), therefore it is possible that the high osmotic stress imposed by 150 g/L of glucose shocked
cells before they had time to elicit an adaptive transcription profile. P. thermoglucosidasius is
known to grow in ASSM and 10 g/L of glucose without yeast extract or tryptone
supplementation. The cellular control of osmotic stress is thought to require K+ ions, amino acids
and amino acid derivatives like proline, glycine, carnitine, choline and glycine betaine (Kempf
and Bremer, 1998).
It was hypothesised that when transferred directly into such a high concentration of glucose,
cells needed to be supported by an external source of certain nutrients before metabolism could
adjust, in order to counteract the effect of the high-osmolarity. Therefore, the ASSM medium
was supplemented with a small amount of yeast extract. As the point of the experiment was to
prove that the mutant strains were able to grow and consume the 150 g/L of glucose added to
the medium, it was necessary to add yeast extract in minimal quantities to ensure that it did not
represent a sufficient source of carbon and nitrogen for substantial cell growth. Therefore, a
preliminary test with the wild type strain was carried out to determine the concentration of
yeast extract that would limit cell growth on this substrate alone to a maximum OD600 of about
1, so that any growth to higher cell densities in glucose containing media could be attributed to
catabolism of the glucose.
Figure 36 - Growth of P. thermoglucosidasius NCIMB 11955 in ASSM supplemented with 1 g/L, 2 g/L and 5 g/L of yeast extract.
Liquid ASSM was prepared containing 1 g/L, 2 g/L and 5 g/L of yeast extract but no glucose
(ASSMYE1, ASSMYE2, ASSMYE5). Strain 11955 was grown overnight in 40 mL of ASSM containing
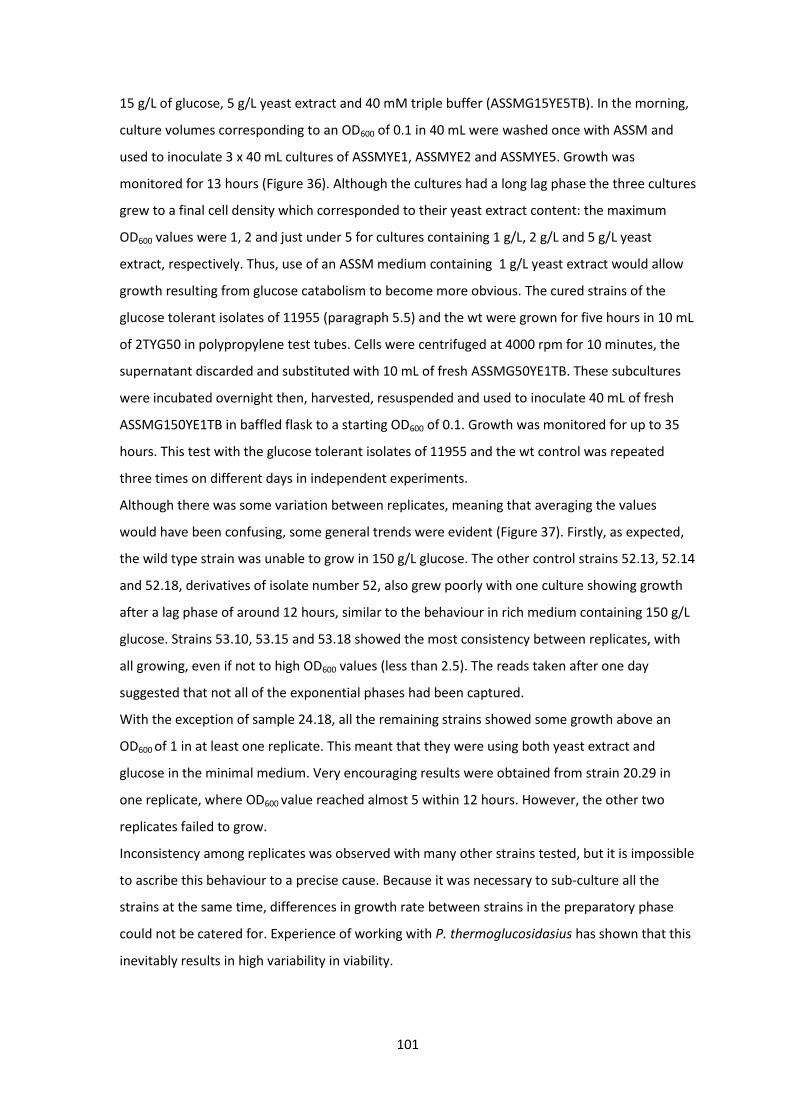
101
15 g/L of glucose, 5 g/L yeast extract and 40 mM triple buffer (ASSMG15YE5TB). In the morning,
culture volumes corresponding to an OD600 of 0.1 in 40 mL were washed once with ASSM and
used to inoculate 3 x 40 mL cultures of ASSMYE1, ASSMYE2 and ASSMYE5. Growth was
monitored for 13 hours (Figure 36). Although the cultures had a long lag phase the three cultures
grew to a final cell density which corresponded to their yeast extract content: the maximum
OD600 values were 1, 2 and just under 5 for cultures containing 1 g/L, 2 g/L and 5 g/L yeast
extract, respectively. Thus, use of an ASSM medium containing 1 g/L yeast extract would allow
growth resulting from glucose catabolism to become more obvious. The cured strains of the
glucose tolerant isolates of 11955 (paragraph 5.5) and the wt were grown for five hours in 10 mL
of 2TYG50 in polypropylene test tubes. Cells were centrifuged at 4000 rpm for 10 minutes, the
supernatant discarded and substituted with 10 mL of fresh ASSMG50YE1TB. These subcultures
were incubated overnight then, harvested, resuspended and used to inoculate 40 mL of fresh
ASSMG150YE1TB in baffled flask to a starting OD600 of 0.1. Growth was monitored for up to 35
hours. This test with the glucose tolerant isolates of 11955 and the wt control was repeated
three times on different days in independent experiments.
Although there was some variation between replicates, meaning that averaging the values
would have been confusing, some general trends were evident (Figure 37). Firstly, as expected,
the wild type strain was unable to grow in 150 g/L glucose. The other control strains 52.13, 52.14
and 52.18, derivatives of isolate number 52, also grew poorly with one culture showing growth
after a lag phase of around 12 hours, similar to the behaviour in rich medium containing 150 g/L
glucose. Strains 53.10, 53.15 and 53.18 showed the most consistency between replicates, with
all growing, even if not to high OD600 values (less than 2.5). The reads taken after one day
suggested that not all of the exponential phases had been captured.
With the exception of sample 24.18, all the remaining strains showed some growth above an
OD600 of 1 in at least one replicate. This meant that they were using both yeast extract and
glucose in the minimal medium. Very encouraging results were obtained from strain 20.29 in
one replicate, where OD600 value reached almost 5 within 12 hours. However, the other two
replicates failed to grow.
Inconsistency among replicates was observed with many other strains tested, but it is impossible
to ascribe this behaviour to a precise cause. Because it was necessary to sub-culture all the
strains at the same time, differences in growth rate between strains in the preparatory phase
could not be catered for. Experience of working with P. thermoglucosidasius has shown that this
inevitably results in high variability in viability.
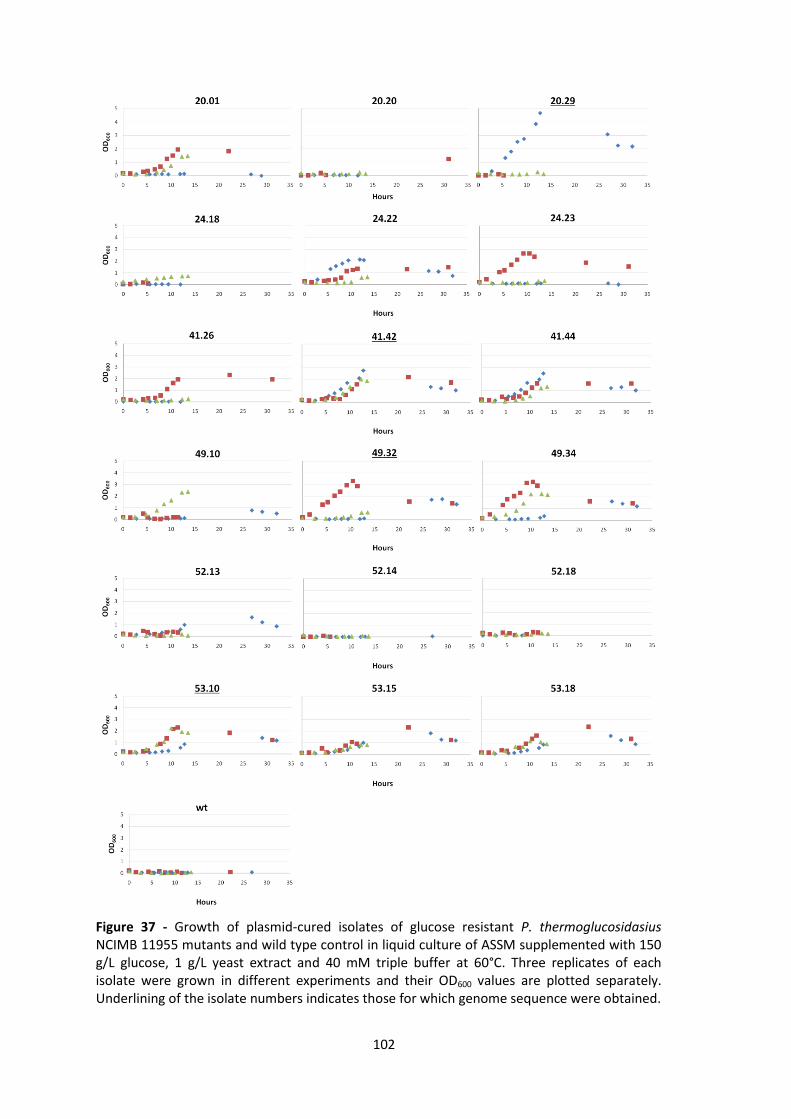
102
Figure 37 - Growth of plasmid-cured isolates of glucose resistant P. thermoglucosidasius NCIMB 11955 mutants and wild type control in liquid culture of ASSM supplemented with 150 g/L glucose, 1 g/L yeast extract and 40 mM triple buffer at 60°C. Three replicates of each isolate were grown in different experiments and their OD600 values are plotted separately. Underlining of the isolate numbers indicates those for which genome sequence were obtained.
103
Consequently, some cultures may not have been in an appropriate state to respond to the stress
condition, leading either to no growth or a long lag phase. Nevertheless, it was evident that a
number of resistant strains were able to tolerate and grow on glucose concentrations three
times higher than the wild type, with some strains growing better than others. As expected,
when yeast extract was added to the medium, all of the mutant strains (but not the wt and the
controls) were able to grow, even though they showed particularly long lag phases and some
were considerably longer than others. The composition of commercial laboratory quality yeast
extract or tryptone powder depends on the source (Bridson and Brecker, 1970) and detailed
description is not always provided, although as the pancreatic digest of casein it can be inferred
that tryptone contained mainly amino acids. It has been shown that many oligopeptides
obtained by casein proteolysis contain proline (Porfírio et al., 1997), which is the main
compatible solute for osmotic stress control in hypertonic environments for B. subtilis. It would
have been interesting to use tryptone instead of yeast extract and test whether readily available
proline in the medium could reduce the lag phase, even if the proline in casamino acids would
probably not be enough to counteract the osmotic pressure on a large population. In nature,
microbial cells adopt many molecules as osmoregulators depending on their physiological status
(Galinski and Trüper, 1994). The choice of yeast extract was based on the fact that
osmoadapation is an unexplored topic in Parageobacillus spp. and yeast extract provides a
broader range of organic compounds and inorganic ions for use as compatible solutes.
It is recognised that, after the first attempt to grow cells in a minimal medium at high glucose
concentrations, two changes were made at the same time. Before attempting to counteract high
osmolarity stress by the addition of yeast extract to the medium, the simple addition of 50 g/L of
glucose to the overnight cultures might have been effective on its own. There is clearly further
work to be done to evaluate the dependency of these P. thermoglucosidasius evolved strains on
additional amino acids and other osmoregulators under high osmotic stress. This experiment
was not carried out at lower concentrations of glucose, but it is reasonable to expect that strains
tolerant to 150 g/L glucose would be less stressed by 125 g/L or 100 g/L glucose.
These experiments have shown that using the in vivo mutator strains, in particular dnaQH207L,
in a programme of forced evolution under increasing glucose stress, had enabled the rapid
production of mutants of 11955 with a complex phenotype, able to tolerate and grow on 150 g/L
glucose. Because these were evolved in a rich medium there may be certain dependencies on
supplementary nutrients that need to be resolved to fully exploit these strains. Alternatively,
having proved the principle that increased glucose tolerance is accessible using plasmid
104
expressed dnaQ mutants, it would be interesting to re-investigate this process in minimal or less
rich medium. Glucose concentrations were not monitored during the culture, so the glucose
consumption rate is not known for these strains. Although no accurate measurements of growth
rate were obtained, it was clear that the evolutionary process involved a number of steps and
different isolates had different phenotypes.
Therefore, to gather information about the mutations that had elicited these complex
phenotypes, samples of isolate derivatives 20.29, 41.42, 49.32 and 53.10 were sent for genome
sequencing.
5.7 Analysis of genome sequences Four strains of interest were divided in two groups and sequenced as described in Methods
(paragraph 2.3.2) along with the 11955 parent laboratory strain. Sequencing was performed in
two separate batches (i.e. 20.29, 49.32 and 11955; 41.42, 53.10 and 11955). Alignment of
sequences was performed using the wt sequence of P. thermoglucosidasius NCIMB 11955
(chromosome CP016622.1, pNCI001 CP016623.1 and pNCI002 CP016624.1) deposited on NCBI
as a reference genome. Any mutations at the same position appearing in all five strains (and six
sequenced genomes) were excluded from analysis, suggesting a genetic drift of the wt parental
laboratory strain rather than a true mutation in the glucose resistant strains.
Mutations detected at specific positions in either run showing inconsistency between wt
sequences or covered by a low number of reads were considered poor quality reading and
excluded from analysis. Variants assessed with low confidence by VarScan were manually
evaluated on IGV. This was required for regions with low coverage (Figure 38) that appeared as
mutational hot spots and occurred exclusively in intergenic sequences. Variant calling analysis of
the four mutant genomes compared to the parent laboratory wt strain showed that mutations
potentially imparting resistance to high glucose concentration occurred in the chromosome,
while the mega-plasmids pNCI001 and pNCI002 did not contain any mutations (Table 15).
Mutations were mainly base substitutions, with a few insertions and deletions; they occurred in
both intergenic loci (i.e. putative promoters, terminators, etc.) and in coding sequences (CDS).
Gene names and references given here to locate mutations were taken from the most recent
update of the annotation of the 11955 chromosome sequence on NCBI (i.e. NZ_CP016622.1,
from July 2020).

105
Figure 38 – Examples of mutations covered by a low number of reads in sequences that appeared as mutation hot spots, visualised on Integrative Genomics Viewer. Each track (the two 11955 wild types, 20.29, 49.32, 41.42 and 53.10 – “.bam” file format) represents the alignment of the sequencing reads to the reference for each strain sequenced in the two batches (1 or 2); the variant call file (annotated “.vcf” format) of the reference genome shows where the mutations are located in the regions from 1,534,929 to 1,535,718 and from 2,715,135 to 2,715,530 on the chromosome NZ_CP016622. The grey and coloured bars represent the number of reads covering each position, each sequenced strain track shows the maximum number of sequencing reads that aligned to the reference in the areas showed (e.g. [0-72] and [0-46] for 11955 (1) in the two intervals). Grey bars indicate unmutated bases. Variants are coloured bars that show the proportions of reads that registered a mutation into T (in red), C (in blue), G (in orange) or A (in green). Short bars indicate low reading depth that replicated across batches (indicated by the curly brackets).
10
5
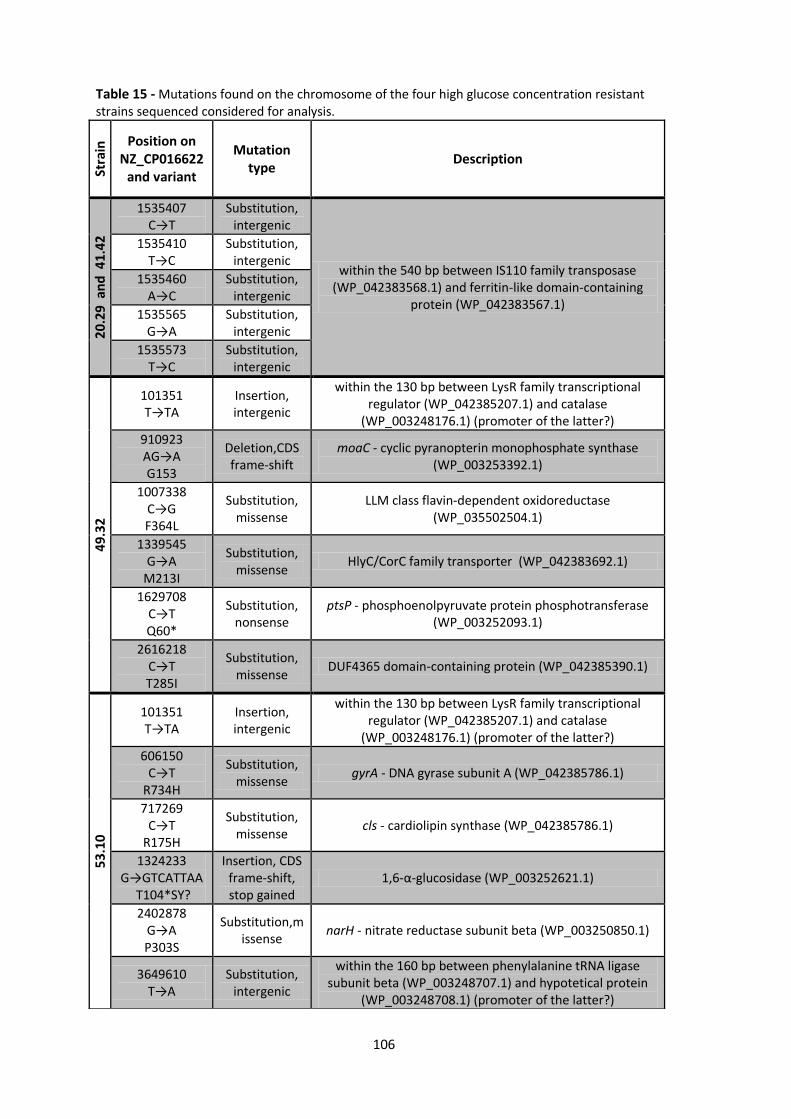
106
Table 15 - Mutations found on the chromosome of the four high glucose concentration resistant strains sequenced considered for analysis.
Stra
in Position on
NZ_CP016622 and variant
Mutation type
Description
20
.29
an
d 4
1.4
2
1535407 C→T
Substitution, intergenic
within the 540 bp between IS110 family transposase (WP_042383568.1) and ferritin-like domain-containing
protein (WP_042383567.1)
1535410 T→C
Substitution, intergenic
1535460 A→C
Substitution, intergenic
1535565 G→A
Substitution, intergenic
1535573 T→C
Substitution, intergenic
49
.32
101351 T→TA
Insertion, intergenic
within the 130 bp between LysR family transcriptional regulator (WP_042385207.1) and catalase
(WP_003248176.1) (promoter of the latter?)
910923 AG→A G153
Deletion,CDS frame-shift
moaC - cyclic pyranopterin monophosphate synthase (WP_003253392.1)
1007338 C→G F364L
Substitution, missense
LLM class flavin-dependent oxidoreductase (WP_035502504.1)
1339545 G→A
M213I
Substitution, missense
HlyC/CorC family transporter (WP_042383692.1)
1629708 C→T Q60*
Substitution, nonsense
ptsP - phosphoenolpyruvate protein phosphotransferase (WP_003252093.1)
2616218 C→T T285I
Substitution, missense
DUF4365 domain-containing protein (WP_042385390.1)
53.
10
101351 T→TA
Insertion, intergenic
within the 130 bp between LysR family transcriptional regulator (WP_042385207.1) and catalase
(WP_003248176.1) (promoter of the latter?)
606150 C→T
R734H
Substitution, missense
gyrA - DNA gyrase subunit A (WP_042385786.1)
717269 C→T
R175H
Substitution, missense
cls - cardiolipin synthase (WP_042385786.1)
1324233 G→GTCATTAA
T104*SY?
Insertion, CDS frame-shift, stop gained
1,6-α-glucosidase (WP_003252621.1)
2402878 G→A P303S
Substitution,missense
narH - nitrate reductase subunit beta (WP_003250850.1)
3649610 T→A
Substitution, intergenic
within the 160 bp between phenylalanine tRNA ligase subunit beta (WP_003248707.1) and hypotetical protein
(WP_003248708.1) (promoter of the latter?)
107
5.7.1 Mutations in strains 20.29 and 41.42
After the narrowing down process, strains 20.29 and 41.42 showed an identical set of relevant
mutations. Confirmed variants for these strains were five substitutions, located in a region
between genes encoding a IS110 family transposase (WP_042383568.1) and a ferritin-like
domain-containing protein (WP_042383567.1) on the + strand of the chromosome (positions
1535407, 1535410, 1535460, 1535565, 1535573).
5.7.2 Mutations in strain 49.32
In strain 49.32 all mutations were intragenic, apart from one mutation (an insertion) observed in
a non-coding sequence at position 101351 on the + strand, in the 131 bp intergenic space
downstream of a LysR family DNA binding transcriptional regulator (WP_042385207.1) and
upstream of a catalase gene (WP_003248176.1). A deletion at position 910923 caused a frame-
shift in the gene encoding cyclic pyranopterin monophosphate synthase moaC
(WP_003253392.1). Three substitutions caused missense mutations: in an LLM class flavin-
dependent oxidoreductase (position 1007338, WP_035502504.1), a HlyC/CorC family
transporter (position 1339545, WP_042383692.1) and a DUF4365 domain-containing protein
(position 2616218, WP_042385390.1). Finally, another substitution caused a nonsense mutation
that introduced a premature stop codon in the phosphoenolpyruvate protein
phosphotransferase ptsP gene (position 1629708, WP_003252093.1).
5.7.3 Mutations in strain 53.10
The insertion found at position 101351 of strain 49.32 was also observed in strain 53.10. Another
intergenic mutation of 53.10 was the substitution at position 3649610, between the CDS
encoding phenylalanine tRNA ligase subunit beta (WP_003248707.1) and that encoding a
hypotetical protein (WP_003248708.1) on the - strand. Three substitutions were observed in
coding sequences of the genes for theDNA gyrase subunit A gyrA (position 606150,
WP_042385786.1), cardiolipin synthase cls (position 717269, WP_042385786.1) and nitrate
reductase subunit beta narH (position 2402878, WP_003250850.1) on the - strand. Expression of
1,6-α-glucosidase at position 1324233 (WP_003252621.1) on the + strand appeared to be
blocked by the insertion of seven bases that caused a frame-shift and the gain of a stop codon.
5.8 Description of mutations The mutation in gyrA, which encodes subunit A of DNA gyrase (WP_042385786.1, described in
paragraph 4.2) is close to the C-terminus, unlike most of the well-characterised mutations near
the N-terminus region involved in quinolone resistance (Yoshida et al., 1990).
108
Expression of a 1,6-α-glucosidase (WP_003252621.1) was blocked by the duplication of a seven
bp sequence (gTCATTAAvtcat → gTCATTAATCATTAAtcat) that caused a frameshift mutation and
also introduced a premature stop codon (gTC-ATT-AAvt-cat → gTC-ATT-AAT-CAT-TAA-tca-t).
Strain 11955 possesses two further 1,6-α-glucosidase genes (WP_042386239.1,
WP_042384969.1 and an amylo-α-1,6-glucosidase, WP_042384977.1). As P. thermoglucosidasius
is amylolytic (Suzuki et al., 1983) then one (WP_042384977.1) or more of these 1,6-α-
glucosidases is probably dedicated to amylodextrin debranching. However, during growth on
glucose it is unlikely that this activity is important, or even expressed. The genomic context of
these 1,6-α-glucosidases was analysed to help elucidate if there may be some specialisation in
their function.
The amylodextrin debranching amylo-alpha-1,6-glucosidase (WP_042384977.1) and 1,6-α-
glucosidase WP_042384969.1 appear to be part of the same operon under the control of a LacI
family DNA-binding transcriptional regulator (WP_013877285.1), composed of the starch
debranching amylo-alpha-1,6-glucosidase (WP_042384977.1), an ABC transporter substrate-
binding protein (WP_042384974.1), two sugar ABC transporter permeases (WP_003252178.1
and WP_042384971.1) and finally the 1,6-α-glucosidase (WP_042384969.1). The fact that this
operon includes genes encoding transport proteins clearly indicates that it function is to break
down starch, or other extracellular α-glucosides. The other non-mutated 1,6-α-glucosidase
(WP_042386239.1) gene appears to be part of a glycogenolysis operon as, downstream of this
gene there is a phospho-sugar mutase (WP_013401561.1) that catalyses the reversible
conversion of 1-phospho sugars (that can be obtained from phosphoylysis of glycogen 1,4
linkages) to 5- or 6-phospho sugars. Therefore, the mutated 1,6-α-glucosidase WP_003252621.1
possibly has a unique function, not associated with either starch or glycogen breakdown. It is not
part of an operon and it is not flanked by other genes encoding enzymes involved in glycosidic
bond cleavage reactions, so there is no genomic context which would hint at its function. The
search of a signal peptide and the location of its cleavage site in all four α-1,6-glucosidases with
SignalP 5.0 (available at http://www.cbs.dtu.dk/services/SignalP/; Almagro Armenteros et al.,
2019) showed that these proteins are not exported and are therefore intracellular.
Cyclic pyranopterin monophosphate synthase (WP_003253392.1, encoded by the gene moaC) is
the first enzyme of the conserved pathway of molybdenum cofactor (MoCo) synthesis and, in
concert with MoaA, it catalyses the conversion of GTP into cyclic pyranopterin phosphate and
the release of the disphosphate (Schwarz et al., 2009). MoCo is a pterin cofactor that controls
the molybdenum redox state of molybdenum-dependent proteins, such as sulphite, xanthine
and DMSO reductases that are used by the cell for electron transfer under anaerobic conditions
109
(Leimkühler and Iobbi-Nivol, 2015). Localisation of the base deletion in the primary polypeptide
sequence of 11955 MoaC with CDART on NCBI (Geer et al., 2002) showed involvement of the
trimeric interface among MoaC dimers. Given the subsequent movement out of frame this
would clearly disrupt its quaternary structure and function (Wuebbens et al., 2000).
NarH (WP_003250850.1) is one of the three subunits of the transmembrane nitrate reductase
NarGHI that takes part in conversion of metabolic energy under anaerobic conditions, in the
presence of nitrate (Leimkühler and Iobbi-Nivol, 2015). NarGHI uses nitrate as a terminal
electron acceptor of the respiratory chain to form nitrite and water. The active site is in NarG,
which harbours a MoCo of the DMSO family and a Fe-S center, NarH transfers electrons through
four Fe-S clusters, NarI is anchored to the membrane and with its cytochrome b is the first
electron acceptor of the nitrate respiratory chain (Leimkühler and Iobbi-Nivol, 2015). The
complex NarGHI is functional only after the correct insertion of MoCo into NarG by the action of
the chaperone NarJ. In 11955, genes encoding NarGHI subunits and NarJ are organised in an
operon (ORFs order narG, narH, narJ and narI) that resembles the nar operon in B. subtilis.
However in 11955 the nar operon is not part of the larger nar locus that in B. subtilis comprises
the process regulatory genes nark, ywiC, arfM and fnr (Hoffmann et al., 1995). Mutation P303S
in 11955 NarH does not directly involve conserved amino acids of the Fe-S binding site nor of the
trimer assembly, however proline residues typically induce a change in the local secondary
structure, so the substitution with a serine is likely to have consequences on the tertiary
structure and hence, function. It is interesting to note that both the moaC mutation and the
narH mutation affect functions to do with anaerobic electron transfer involving molybdenum
cofactors.
The luciferase-like monoxygenase (LLM) class flavin-dependent oxidoreductase
(WP_035502504.1, TIGRFAM TIGR04036) is a flavin mononucleotide (FMN)-dependent
oxidoreductase of the nitriloacetate monooxygenase family (TIGRFAM TIGR03860). Mutation
F364L in WP_035502504.1 of strain 49.32 does not involve conserved amino acids of the active
site, and given the generic function of this class of enzyme it is impossible to deduce the
significance of this mutation. Overlapping of CDSs suggests that WP_035502504.1 is co-
expressed with the upstream LLM class flavin-dependent oxidoreductase (WP_042383961.1),
however no information about the difference between the two proteins was retrieved.
Transporters of the HlyC/CorC family show similarity with hemolysin transporter C or Mg2+ and
Co2+ efflux pumps, they carry a cystathionine beta-synthase (CBS) binding domain that is
composed of two tandem repeats. The CBS domain has been found in ion transporters such as
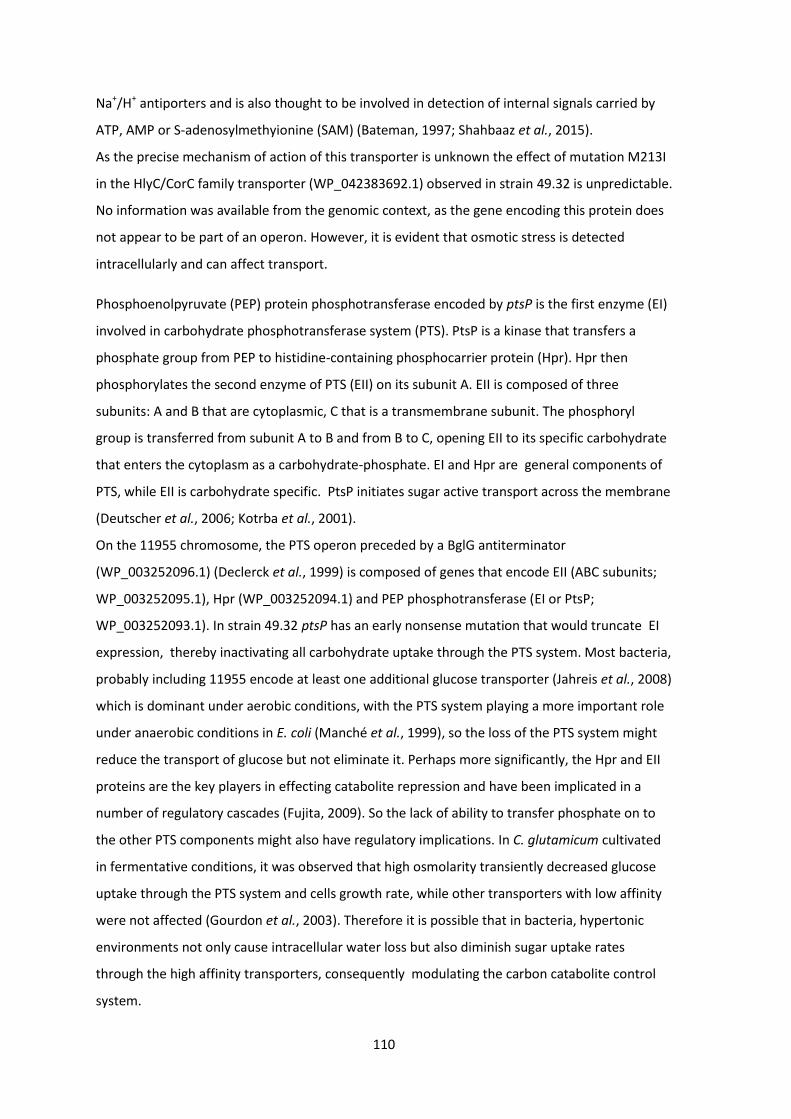
110
Na+/H+ antiporters and is also thought to be involved in detection of internal signals carried by
ATP, AMP or S-adenosylmethyionine (SAM) (Bateman, 1997; Shahbaaz et al., 2015).
As the precise mechanism of action of this transporter is unknown the effect of mutation M213I
in the HlyC/CorC family transporter (WP_042383692.1) observed in strain 49.32 is unpredictable.
No information was available from the genomic context, as the gene encoding this protein does
not appear to be part of an operon. However, it is evident that osmotic stress is detected
intracellularly and can affect transport.
Phosphoenolpyruvate (PEP) protein phosphotransferase encoded by ptsP is the first enzyme (EI)
involved in carbohydrate phosphotransferase system (PTS). PtsP is a kinase that transfers a
phosphate group from PEP to histidine-containing phosphocarrier protein (Hpr). Hpr then
phosphorylates the second enzyme of PTS (EII) on its subunit A. EII is composed of three
subunits: A and B that are cytoplasmic, C that is a transmembrane subunit. The phosphoryl
group is transferred from subunit A to B and from B to C, opening EII to its specific carbohydrate
that enters the cytoplasm as a carbohydrate-phosphate. EI and Hpr are general components of
PTS, while EII is carbohydrate specific. PtsP initiates sugar active transport across the membrane
(Deutscher et al., 2006; Kotrba et al., 2001).
On the 11955 chromosome, the PTS operon preceded by a BglG antiterminator
(WP_003252096.1) (Declerck et al., 1999) is composed of genes that encode EII (ABC subunits;
WP_003252095.1), Hpr (WP_003252094.1) and PEP phosphotransferase (EI or PtsP;
WP_003252093.1). In strain 49.32 ptsP has an early nonsense mutation that would truncate EI
expression, thereby inactivating all carbohydrate uptake through the PTS system. Most bacteria,
probably including 11955 encode at least one additional glucose transporter (Jahreis et al., 2008)
which is dominant under aerobic conditions, with the PTS system playing a more important role
under anaerobic conditions in E. coli (Manché et al., 1999), so the loss of the PTS system might
reduce the transport of glucose but not eliminate it. Perhaps more significantly, the Hpr and EII
proteins are the key players in effecting catabolite repression and have been implicated in a
number of regulatory cascades (Fujita, 2009). So the lack of ability to transfer phosphate on to
the other PTS components might also have regulatory implications. In C. glutamicum cultivated
in fermentative conditions, it was observed that high osmolarity transiently decreased glucose
uptake through the PTS system and cells growth rate, while other transporters with low affinity
were not affected (Gourdon et al., 2003). Therefore it is possible that in bacteria, hypertonic
environments not only cause intracellular water loss but also diminish sugar uptake rates
through the high affinity transporters, consequently modulating the carbon catabolite control
system.
111
Cardiolipin is present in bacteria and mitochondria. E. coli carries three cardiolipin synthases
(encoded by the genes clsA, clsB and clsC) (Tan et al., 2012) that seem to be growth phase
specific enzymes and media composition dependent (i.e. ClsA is expressed in stationary phase
and in increased osmolarity conditions). ClsA catalyses the condensation of two
phosphatidylglycerol molecules to give cardiolipin and glycerol. Cardiolipin synthases are
transmembrane proteins that accumulate at rod shape cell poles and division septa (Romantsov
et al., 2009) and cardiolipin is thought to be involved in DNA replication initiation and cell
division, in situations of energy deprivation and under osmotic stress (Wood, 2018; Tan et al.,
2012). In hypertonic solutions the B. subtilis cell membrane has double the normal quantity of
cardiolipin, while phosphatidylglycerol decreases by a quarter (López et al., 2000). This is
thought to increase membrane hydrophobicity and retain membrane turgor by increasing the
orderly stacking of phospholipids. A higher concentration of cardiolipin is also thought to create
a barrier against a hypersaline medium, as water that interacts with the glycerol moiety of
cardiolipin thickens the network of hydrogen bonds involved in proton lateral diffusion (i.e. it is
usually employed for more efficient H+ transport between proton pumps in the cell membrane)
(López et al., 2000; Serowy et al., 2003).
On the 11955 chromosome there are two annotated cardiolipin synthase genes, one on the -
and one on the + strand. S. aureus also has two copies of cls (cls1 and cls2) (Koprivnjak et al.,
2011). B. subtilis has a cardiolipin synthase called ClsA and two minor cardiolipin synthetases
YwJE and YwIE (i.e. ClsA paralogs) involved in sporulation and stress responses, respectively
(López et al., 2006). The mutation observed in strain 53.10 is on the gene on the - strand. CDART
analysis (Geer et al., 2002) shows that mutation R175H in WP_003253737.1 is next to a
predicted conserved amino acid of the active site, even though this amino acid is not usually
indicated as part of the Cls active site (Koprivnjak et al., 2011; Serricchio and Bütikofer, 2012). Its
proximity to the active site suggests that mutation may affect catalytic activity (e.g. arginine
residues are frequently found in salt bridges which provide active site structure). While there is
insufficient information to be precise about the consequences of this mutation, the involvement
of cardiolipin synthase in osmotic stress response correlates with the effect of high glucose
concentrations.
Among mutations that were excluded from analysis, one was noteworthy. At position 3514990,
all the mutant strains and the laboratory wt strain registered an insertion compared to the
11955 NCBI sequence (A→AT) that caused a frame-shift mutation in the adenine phosphoribosyl
transferase aprt coding sequence (WP_065868245.1, - strand), suggesting that this mutation
was already in the parent laboratory strain. This enzyme is involved in AMP biosynthesis from

112
adenine by a salvage pathway. Mutations in aprt had been reported to be involved in
improvement of glucose consumption in a study by Zhou, Wu and Rao (2016). The double
deletion strain P. thermoglucosidasius DSM2452 Δldh, Δpfl that was serially diluted in minimal
medium supplemented with 10 g/L glucose and 0.1 % v/v acetate (i.e. the latter used to ensure
acetyl-CoA production given that pyruvate formate lyase was knocked out) significantly
improved growth on glucose and ethanol production under micro-aerobic conditions over the
unevolved double mutant. Genome sequencing of evolved isolates showed that aptr was
mutated in all cases. However, while the triple deletion strain P. thermoglucosidasius DSM2452
Δldh, Δpfl, Δaprt performed better than the double mutant, it consumed less glucose and
produced less ethanol than the evolved double mutant. The reason why aprt depletion
improved glucose consumption and ethanol production was not investigate by Zhou and
colleagues.
Consistent with sequencing results collected in this study, a strain tested in our laboratory
carrying a mutation in aprt and pstP had low glucose uptake under anaerobic conditions in ASSM
supplemented with 10 g/L glucose and 10 g/L xylose (Liang, 2020; unpublished data). So despite
the uncertainty about negative or positive correlation of mutations in aprt with glucose
consumption, it appears to be associated with glucose uptake or metabolism; however, the
extent of the contribution to the acquired phenotype of growth on 150 g/L glucose is
questionable.
5.9 Discussion The experiments described in this chapter are the first to demonstrate that the dnaQ mutator
strains are able to elicit a complex phenotype in 11955. Although not statistically proven, there
appeared to be a correlation between the degree of mutagenesis operating in a dnaQ mutator
strain and the frequency of adaptation to more stringent environmental pressure. This would be
consistent with the need for multiple mutations to provide the highest levels of glucose
resistance.
Beyond the proof of concept, this experiment also provided strains able to resist high
concentrations of glucose and information about the genetic elements involved in this trait.
Selected isolates were able to well withstand three times the concentration of glucose that the
wt could tolerate. Osmolysis decreased and glucose uptake and consumption did not appear to
be disrupted (although accurate measurements of growth rate and glucose uptake were not
made), effectively opening the possibility of high gravity fermentation for ethanol production
with P. thermoglucosidasius. In principle, conversion of 150 g/L of glucose should generate more
than 70 g/L (8.8 % v/v) of ethanol in a simple batch fermentation. However, it should be noted
113
that one mutation, that in ptsP, would probably impair anaerobic glucose metabolism so
screening the strains for good anaerobic growth would be an advisable next step. Now that the
effectiveness of the dnaQ mutator approach has been established, it should be simple to apply
this method to cells growing anaerobically, to ensure that mutants consistent with good
anaerobic growth and metabolism are recovered.
Analysis of the genomes of glucose resistant strains showed that a complex phenotype could be
elicited by different mechanisms which did not necessarily rely on increased production of
osmolytes or ion transporters (although it should be recognised that this was done in a rich
medium, where some of these components may already have been available). Mutations
occurred in genes involved in DNA replication, transcription regulation, cell division, cell
membrane lipid composition, energy production, anaerobic respiration, coenzyme biosynthesis,
ion transport and carbohydrate transport and metabolism. The effect of mutations arising in
intergenic regions or in genes encoding proteins with unknown functions was impossible to
evaluate with the time available. However, it is interesting to note that two isolates out of four
(20.29 and 41.42) had identical mutation profiles and the variants did not involve coding
sequences.
In further work it would be interesting to interrogate each of these mutations by introducing
them individually and in combination into a wt background. Transcriptomic comparison of
glucose resistant strains would also be valuable as this should give a clearer picture of the
consequences of these mutations on cell physiology and their resultant phenotype. It has been
observed in several study that genome alterations only partly explain the development of
complex phenotypes and that trans-generational plasticity and epigenetic memory (i.e. the
ability of cells to memorise phenotypes by non–genetically determined elements and to pass
them onto progeny) could also be involved (Horinouchi et al., 2015; Adam et al., 2008; Ghosh et
al., 2020; Erickson et al., 2017).
114
Chapter 6
Directed evolution in chemostat culture
6.1 Introduction Although P. thermoglucosidasius produces ethanol naturally as one of its fermentation products
it is not particularly tolerant to high concentrations of ethanol. Experience of utilisation of P.
thermoglucosidasius has shown that toxicity starts to be observed above 15.78 g/L (2 % v/v)
ethanol, while no growth is observed above 31.56 g/L (4 % v/v) ethanol (Ibenegbu, personal
communication). In industrial yeast fermentations titres of 78.9 – 94.68 g/L (10 – 12 % v/v) and
also of 118.35 g/L (15 % v/v) in very high gravity fermentation systems can be achieved.
Although, commercially, batch fermentations are typically harvested at around 63.90 g/L (8%
v/v), when volumetric productivity is high (Puligundla et al., 2011). Therefore, for P.
thermoglucosidasius to be considered as a serious organism for ethanol production, tolerance to
ethanol needs to be increased. In practice this does not have to be increased to the levels of
industrial yeasts because growing at high temperatures makes it easier to remove ethanol in the
gas stream. In a recent study (Ibenegbu et al., in preparation) it was shown that gas stripping
with microbubbles allowed ethanol concentrations in the reactor to be maintained at around
15.78 g/L (2 % v/v) in chemostat cultures producing a nominal 55.23 g/L (7 % v/v) ethanol.
Therefore, even a small increase in tolerance offers the possibility of increasing productivity
using gas-stripping into an industrially relevant range.
As observed with the isolation of glucose tolerant strains, isolating mutants resistant to most
inhibitors typically involves selecting colonies that grow at normally toxic concentrations of the
inhibitor. However, with ethanol tolerance this is not straightforward as it has been shown that
tolerance to exogenously supplied ethanol is not the same as tolerance to endogenously
produced ethanol (D’Amore and Stewart, 1987; Dombek and Ingram, 1987; Jones, 1990;
Baskaran et al., 1995; Matsufuji et al., 2008). Indeed, it may be that tolerance to endogenously
produced ethanol is actually tolerance to a precursor such as acetaldehyde or acetyl-CoA, which
might build up at high ethanol concentrations sequestering Co-A. Therefore, to isolate useful
ethanol-tolerant mutants it is essential that this is done under ethanol production conditions.
The best way to do this is to apply the continuous selection conditions achievable in chemostat
culture.
Often, in adaptive laboratory evolution experiments, induced mutagenesis is followed by
selection, and if this is successful the two steps are repeated until an acceptable phenotypic
115
improvement is achieved. This is tipically attained in batch, where cultures go through all the
growth phases in the same starting medium, and the outcomes of selection also depend on
growth conditions and the growth phase at wich cells are passaged (Sandberg et al., 2019;
Gresham and Dunham, 2014). These discontinuous rounds of mutagenesis and selection slow
down the whole process and are very laborious (Luan et al., 2013). Contrarily, efficient strain
improvement processes couple mutagenesis with selection: in this continuous process, mutants
gradually increases their fitness and only few external interventions are needed to keep constant
growth conditions. The culturing setup for this kind of experiment is continuous cultures in
bioreactors, where fresh medium is constantly added and the correspondent culture volume is
automatically removed from the vessel. In turbidostats, the dilution rate varies depending on
culture turbidity that is maintained constant by an internal system of cell density detection, cells
are grown at maximum growth rate and never become nutrient limited. Cells density is subject
to thier ability to replicate, therefore in the selective environment of interest, survival depends
on mutants’ increase of growth rate (Sandberg et al., 2019). In chemostats cells are nutrient-
limited and are kept in the exponential phase by a fixed dilution rate. At steady-state dilution
rate matches growth rate: the culture density depends on the concentration of nutrients that is
consumed at the same rate as it is externally added. By definition, cells will only be maintained
in chemostat culture if they are able to grow at a rate which is faster than the imposed dilution
rate; otherwise, cells will “wash-out” from the culture. By altering paramenters that affect
growth rate, mutants that (tend to) re-establish steady-state conditions are continuously
selected.
In this study, an additional the limiting factor was the presence of ethanol in the culture. If
ethanol titres reach a level which causes toxicity which reduces cell growth rate, then only
mutant cells that are capable of growing at this concentration of ethanol should survive. This
should typically be observed as an initial drop in cell density in chemostat culture after toxicity is
encountered, followed by a recovery to normal steady-state levels as tolerant mutants take
over.
This directed evolution process in chemostat culture has been shown to be effective in many
species. In E. coli it was used to increase acetate tolerance or adaptation to metal ion starvation
(Rajaraman et al., 2016; Warsi et al., 2018), in S. pastorianus it was used to evolve increased
affinity for maltotriose for efficient beer brewing (Brickwedde et al., 2017); in Corynebacterium
glutamicum (i.e. used as a microbial cell factory) it increased oxidative stress tolerance and
response to other toxic substances (i.e. SDS, HCl, NaOH, ampicillin, etc.) (Lee et al., 2013); a two-
116
year continuous culture of S. cerevisiae grown on 40 g/L glucose, doubled ethanol tolerance
threshold from 47.34 g/L to 94.68 g/L (from 6 % v/v to 12 % v/v) (Voordeckers et al., 2015).
6.2 Experiment outline The initial plan was to grow the strain in rich media added with glucose at a concentration that
was known to be fermented to a subtoxic titre of ethanol, once cells had consumed all the
glucose and reached steady state, glucose was going to be added to the media to increase the
concentration of ethanol to toxic levels. Cells that had accumulated mutations as a consequence
of the in vivo dnaQ mutator were going to be selected for ethanol tolerance; after an initial
decrease of the number of cells, those that had acquired a favourable genotype were going to
grow until steady state. This process was going to be repeated as many times as possible, until
cells were able to tolerate glucose and ethanol at high concentrations. However the initial
approach had to be changed in itinere because of some technical limitations and because of
unexpected cells response to the stress conditions that they were exposed to.
The fermentation of rich media in continuous culture was started and stopped three times. The
seed cultures of the second and third runs were evolved derivatives of the previous run (first and
second, respectively). The first two runs and the beginning of the third run were also functional
to find more appropriate settings. Samples were taken at regular intervals to measure OD600 and
quantify glucose and ethanol concentration in the liquid phase by HPLC, as described in methods
section at paragraphs 2.4.1 and 2.4.2. Some key cells samples were also plated on 2TYK plates
and conserved as glycerol stocks for future record and/or analysis. Ethanol tolerance estimation
was based on growth arrest and accumulation of glucose.
The plasmid pG1AKmCherry carrying the dnaQ mutant H207L was electroporated into
electrocompetent P. thermoglucosidasius TM242 cells as described in methods section 2.2.9. A
single kanamycin resistant colony was isolated and glycerol stocks were made as described in
the methods section 2.1.10. The strain was named TM242 pdnaQH207L.
6.3 Initial bioreactor experiments in continuous culture In order to assess the appropriate dilution rate to use in chemostat culture it was necessary to
establish the growth rate of TM242 pdnaQH207L under fermentative conditions. For this, a seed
culture was prepared and the bioreactor was started as described in methods section at
paragraph 2.1.7.
Glucose concentration started decreasing after about 3 hours of batch culture, ethanol
concentration increased after 3.5 hours and reached the maximum value of 5 g/L (0.63 % v/v) at
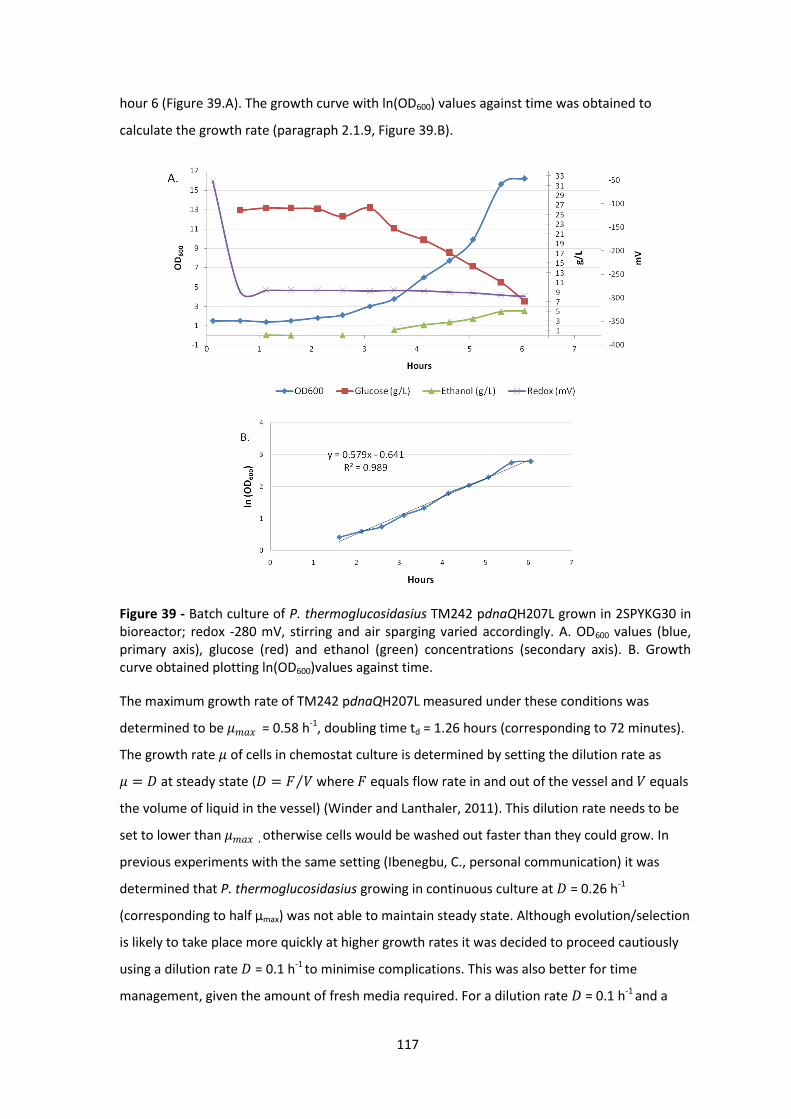
117
hour 6 (Figure 39.A). The growth curve with ln(OD600) values against time was obtained to
calculate the growth rate (paragraph 2.1.9, Figure 39.B).
Figure 39 - Batch culture of P. thermoglucosidasius TM242 pdnaQH207L grown in 2SPYKG30 in bioreactor; redox -280 mV, stirring and air sparging varied accordingly. A. OD600 values (blue, primary axis), glucose (red) and ethanol (green) concentrations (secondary axis). B. Growth curve obtained plotting ln(OD600)values against time.
The maximum growth rate of TM242 pdnaQH207L measured under these conditions was
determined to be 𝜇𝑚𝑎𝑥 = 0.58 h-1, doubling time td = 1.26 hours (corresponding to 72 minutes).
The growth rate 𝜇 of cells in chemostat culture is determined by setting the dilution rate as
𝜇 = 𝐷 at steady state (𝐷 = 𝐹 𝑉 where 𝐹 equals flow rate in and out of the vessel and 𝑉 equals
the volume of liquid in the vessel) (Winder and Lanthaler, 2011). This dilution rate needs to be
set to lower than 𝜇𝑚𝑎𝑥 , otherwise cells would be washed out faster than they could grow. In
previous experiments with the same setting (Ibenegbu, C., personal communication) it was
determined that P. thermoglucosidasius growing in continuous culture at 𝐷 = 0.26 h-1
(corresponding to half µmax) was not able to maintain steady state. Although evolution/selection
is likely to take place more quickly at higher growth rates it was decided to proceed cautiously
using a dilution rate 𝐷 = 0.1 h-1 to minimise complications. This was also better for time
management, given the amount of fresh media required. For a dilution rate 𝐷 = 0.1 h-1 and a
118
working volume 𝑉 = 1.5 L, this required setting the media pump to a flow rate 𝐹 = 𝐷 × 𝑉 of 0.15
L/h. When glucose was 7 g/L and OD600 reached 16, the chemostat was run in continuous.
Initially, the same medium was used (2SPYKG30). From 30 g/L of glucose TM242 pdnaQH207L
was expected to produce a sub-toxic concentration of ethanol of around 12.6 g/L (1.60 % v/v)
which should be detectable by HPLC analysis of the liquid phase. Figure 40 shows the trends of
cell, glucose and ethanol concentrations of the first bioreactor experiment since the switch to
continuous culture. Initially the redox range was set at -280 ± 10 mV, aeration to a maximum of
0.3 Lpm of air and agitation at 740 rpm. Although there had been a disturbance around 20 - 25
hour log time, a pseudo-steady state was reached after 30 hours (36.23 hour log time) based on
the residual glucose concentrations: OD600 was 16.80, glucose 0.03 g/L, ethanol 1.32 g/L (0.17 %
v/v). The latter had decreased from a maximum of 5.94 g/L (0.753 % v/v) at 6.25 hour log time,
to a minimum of 1.22 g/L (0.15 % v/v) over 30 hours. These values were well below the 12.60 g/L
(1.60 % v/v) of ethanol expected from the fermentation of 30 g/L of glucose by TM242 in the
liquid phase. It was discovered that the condenser was not working properly so, although the
aeration rate was low, the reduction in bubble size and increased bubble retention time
resulting from the high agitation rate was clearly effective at stripping ethanol from the culture.
While this was a good demonstration of gas stripping of ethanol at temperatures close to its
boiling point, it highlighted a potential problem for creating an effective selective pressure
needed to evolve ethanol tolerance. To limit gas stripping the agitation rate was lowered from
740 to 300 rpm at log time 40.43, with the aeration range unchanged. The concentration of
glucose in the medium was also increased to get closer to toxic levels of ethanol, taking into
account that some ethanol was being stripped because the faulty condenser. However, the
glucose concentration could not be increased dramatically because of the osmotic stress that
high concentrations impose on cells.
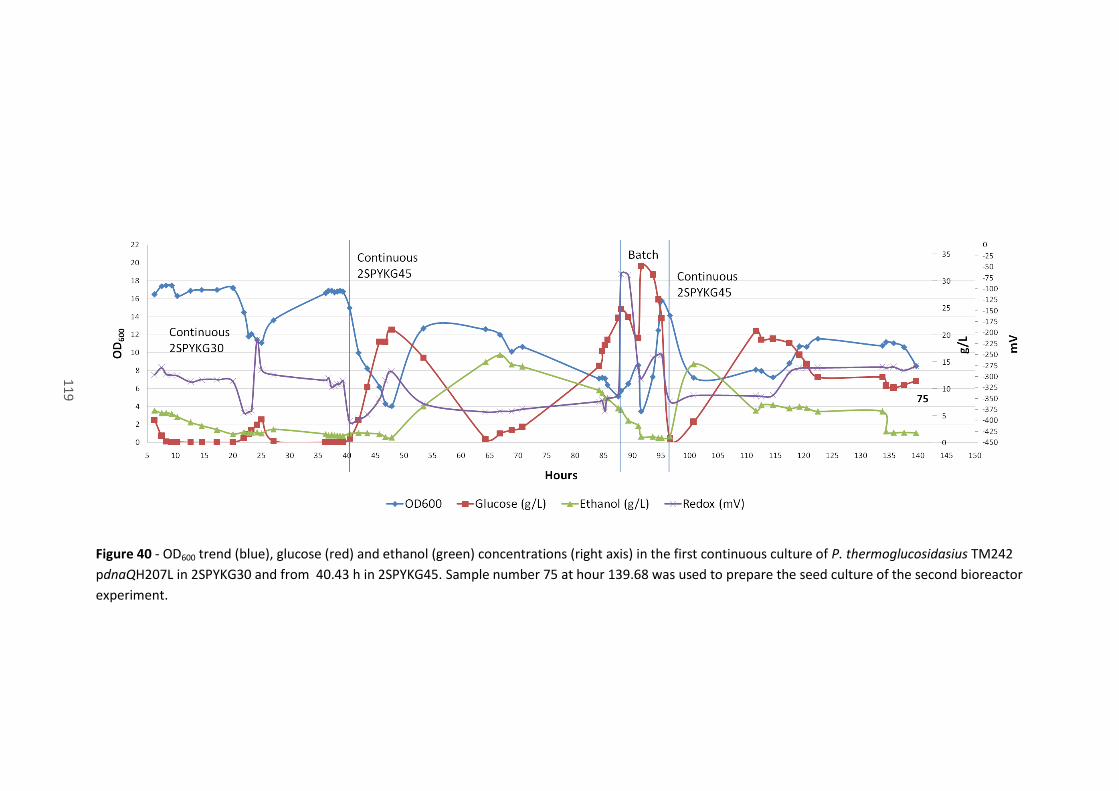
119
Figure 40 - OD600 trend (blue), glucose (red) and ethanol (green) concentrations (right axis) in the first continuous culture of P. thermoglucosidasius TM242
pdnaQH207L in 2SPYKG30 and from 40.43 h in 2SPYKG45. Sample number 75 at hour 139.68 was used to prepare the seed culture of the second bioreactor
experiment.
11
9
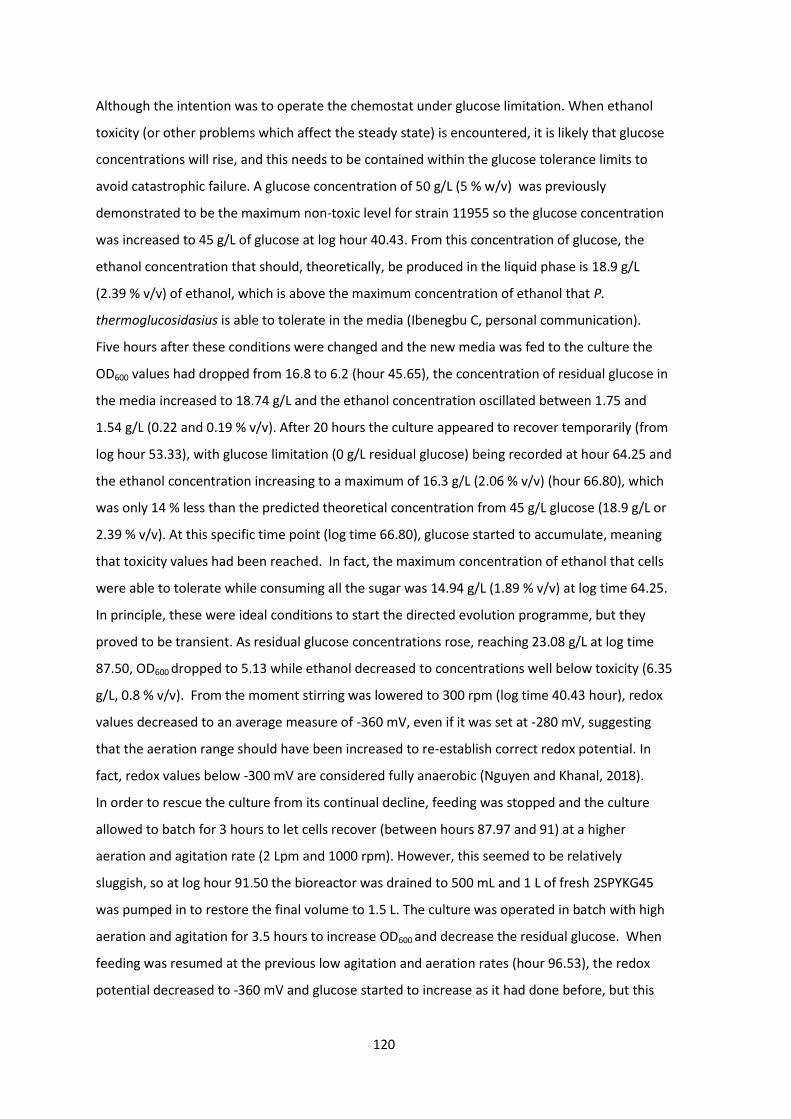
120
Although the intention was to operate the chemostat under glucose limitation. When ethanol
toxicity (or other problems which affect the steady state) is encountered, it is likely that glucose
concentrations will rise, and this needs to be contained within the glucose tolerance limits to
avoid catastrophic failure. A glucose concentration of 50 g/L (5 % w/v) was previously
demonstrated to be the maximum non-toxic level for strain 11955 so the glucose concentration
was increased to 45 g/L of glucose at log hour 40.43. From this concentration of glucose, the
ethanol concentration that should, theoretically, be produced in the liquid phase is 18.9 g/L
(2.39 % v/v) of ethanol, which is above the maximum concentration of ethanol that P.
thermoglucosidasius is able to tolerate in the media (Ibenegbu C, personal communication).
Five hours after these conditions were changed and the new media was fed to the culture the
OD600 values had dropped from 16.8 to 6.2 (hour 45.65), the concentration of residual glucose in
the media increased to 18.74 g/L and the ethanol concentration oscillated between 1.75 and
1.54 g/L (0.22 and 0.19 % v/v). After 20 hours the culture appeared to recover temporarily (from
log hour 53.33), with glucose limitation (0 g/L residual glucose) being recorded at hour 64.25 and
the ethanol concentration increasing to a maximum of 16.3 g/L (2.06 % v/v) (hour 66.80), which
was only 14 % less than the predicted theoretical concentration from 45 g/L glucose (18.9 g/L or
2.39 % v/v). At this specific time point (log time 66.80), glucose started to accumulate, meaning
that toxicity values had been reached. In fact, the maximum concentration of ethanol that cells
were able to tolerate while consuming all the sugar was 14.94 g/L (1.89 % v/v) at log time 64.25.
In principle, these were ideal conditions to start the directed evolution programme, but they
proved to be transient. As residual glucose concentrations rose, reaching 23.08 g/L at log time
87.50, OD600 dropped to 5.13 while ethanol decreased to concentrations well below toxicity (6.35
g/L, 0.8 % v/v). From the moment stirring was lowered to 300 rpm (log time 40.43 hour), redox
values decreased to an average measure of -360 mV, even if it was set at -280 mV, suggesting
that the aeration range should have been increased to re-establish correct redox potential. In
fact, redox values below -300 mV are considered fully anaerobic (Nguyen and Khanal, 2018).
In order to rescue the culture from its continual decline, feeding was stopped and the culture
allowed to batch for 3 hours to let cells recover (between hours 87.97 and 91) at a higher
aeration and agitation rate (2 Lpm and 1000 rpm). However, this seemed to be relatively
sluggish, so at log hour 91.50 the bioreactor was drained to 500 mL and 1 L of fresh 2SPYKG45
was pumped in to restore the final volume to 1.5 L. The culture was operated in batch with high
aeration and agitation for 3.5 hours to increase OD600 and decrease the residual glucose. When
feeding was resumed at the previous low agitation and aeration rates (hour 96.53), the redox
potential decreased to -360 mV and glucose started to increase as it had done before, but this
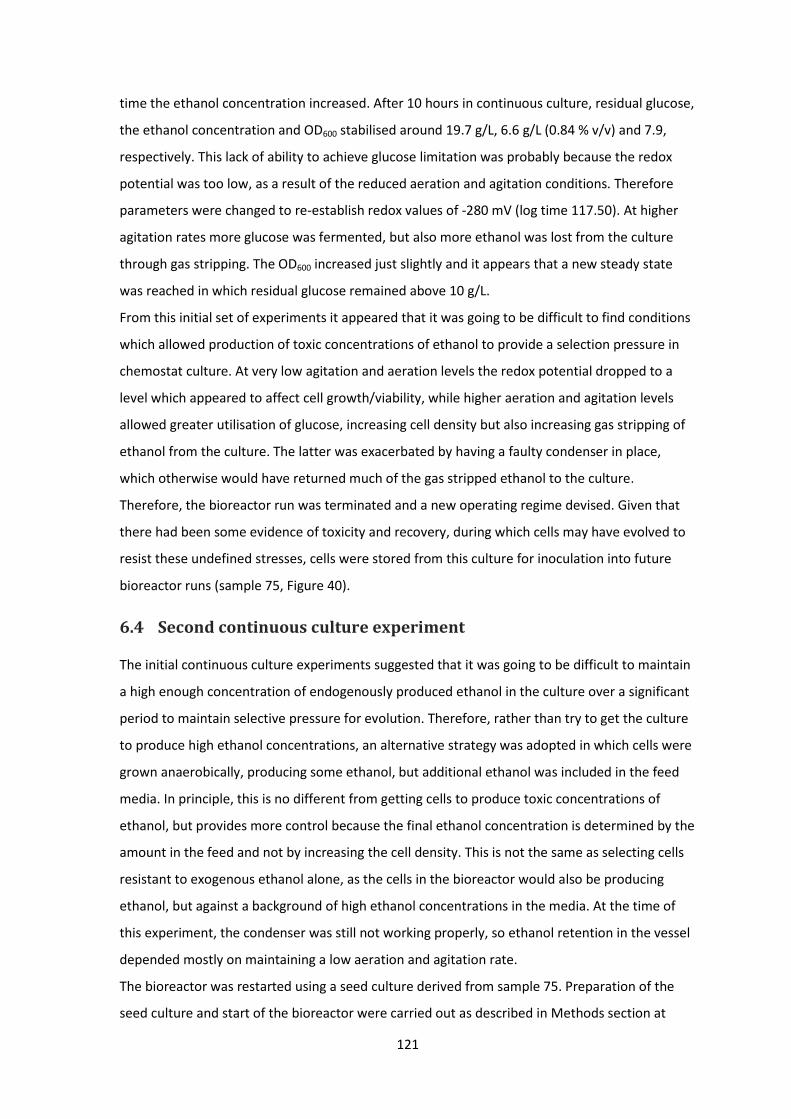
121
time the ethanol concentration increased. After 10 hours in continuous culture, residual glucose,
the ethanol concentration and OD600 stabilised around 19.7 g/L, 6.6 g/L (0.84 % v/v) and 7.9,
respectively. This lack of ability to achieve glucose limitation was probably because the redox
potential was too low, as a result of the reduced aeration and agitation conditions. Therefore
parameters were changed to re-establish redox values of -280 mV (log time 117.50). At higher
agitation rates more glucose was fermented, but also more ethanol was lost from the culture
through gas stripping. The OD600 increased just slightly and it appears that a new steady state
was reached in which residual glucose remained above 10 g/L.
From this initial set of experiments it appeared that it was going to be difficult to find conditions
which allowed production of toxic concentrations of ethanol to provide a selection pressure in
chemostat culture. At very low agitation and aeration levels the redox potential dropped to a
level which appeared to affect cell growth/viability, while higher aeration and agitation levels
allowed greater utilisation of glucose, increasing cell density but also increasing gas stripping of
ethanol from the culture. The latter was exacerbated by having a faulty condenser in place,
which otherwise would have returned much of the gas stripped ethanol to the culture.
Therefore, the bioreactor run was terminated and a new operating regime devised. Given that
there had been some evidence of toxicity and recovery, during which cells may have evolved to
resist these undefined stresses, cells were stored from this culture for inoculation into future
bioreactor runs (sample 75, Figure 40).
6.4 Second continuous culture experiment
The initial continuous culture experiments suggested that it was going to be difficult to maintain
a high enough concentration of endogenously produced ethanol in the culture over a significant
period to maintain selective pressure for evolution. Therefore, rather than try to get the culture
to produce high ethanol concentrations, an alternative strategy was adopted in which cells were
grown anaerobically, producing some ethanol, but additional ethanol was included in the feed
media. In principle, this is no different from getting cells to produce toxic concentrations of
ethanol, but provides more control because the final ethanol concentration is determined by the
amount in the feed and not by increasing the cell density. This is not the same as selecting cells
resistant to exogenous ethanol alone, as the cells in the bioreactor would also be producing
ethanol, but against a background of high ethanol concentrations in the media. At the time of
this experiment, the condenser was still not working properly, so ethanol retention in the vessel
depended mostly on maintaining a low aeration and agitation rate.
The bioreactor was restarted using a seed culture derived from sample 75. Preparation of the
seed culture and start of the bioreactor were carried out as described in Methods section at
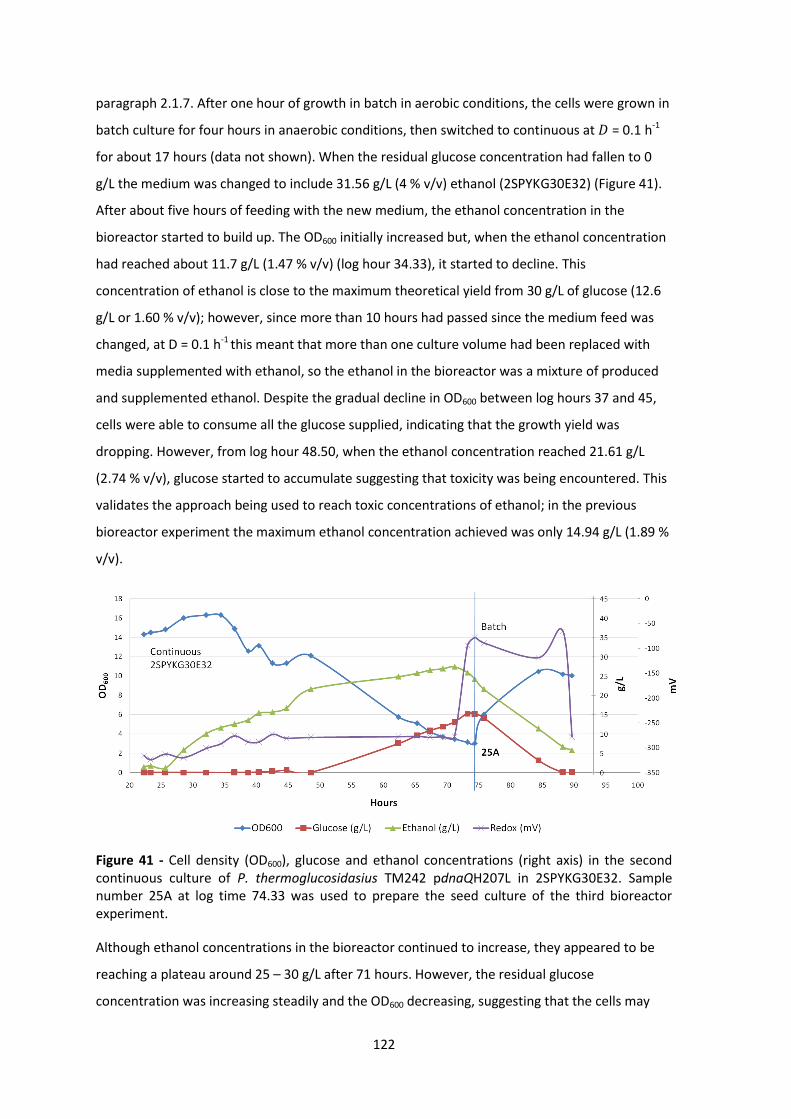
122
paragraph 2.1.7. After one hour of growth in batch in aerobic conditions, the cells were grown in
batch culture for four hours in anaerobic conditions, then switched to continuous at 𝐷 = 0.1 h-1
for about 17 hours (data not shown). When the residual glucose concentration had fallen to 0
g/L the medium was changed to include 31.56 g/L (4 % v/v) ethanol (2SPYKG30E32) (Figure 41).
After about five hours of feeding with the new medium, the ethanol concentration in the
bioreactor started to build up. The OD600 initially increased but, when the ethanol concentration
had reached about 11.7 g/L (1.47 % v/v) (log hour 34.33), it started to decline. This
concentration of ethanol is close to the maximum theoretical yield from 30 g/L of glucose (12.6
g/L or 1.60 % v/v); however, since more than 10 hours had passed since the medium feed was
changed, at D = 0.1 h-1 this meant that more than one culture volume had been replaced with
media supplemented with ethanol, so the ethanol in the bioreactor was a mixture of produced
and supplemented ethanol. Despite the gradual decline in OD600 between log hours 37 and 45,
cells were able to consume all the glucose supplied, indicating that the growth yield was
dropping. However, from log hour 48.50, when the ethanol concentration reached 21.61 g/L
(2.74 % v/v), glucose started to accumulate suggesting that toxicity was being encountered. This
validates the approach being used to reach toxic concentrations of ethanol; in the previous
bioreactor experiment the maximum ethanol concentration achieved was only 14.94 g/L (1.89 %
v/v).
Figure 41 - Cell density (OD600), glucose and ethanol concentrations (right axis) in the second continuous culture of P. thermoglucosidasius TM242 pdnaQH207L in 2SPYKG30E32. Sample number 25A at log time 74.33 was used to prepare the seed culture of the third bioreactor experiment.
Although ethanol concentrations in the bioreactor continued to increase, they appeared to be
reaching a plateau around 25 – 30 g/L after 71 hours. However, the residual glucose
concentration was increasing steadily and the OD600 decreasing, suggesting that the cells may
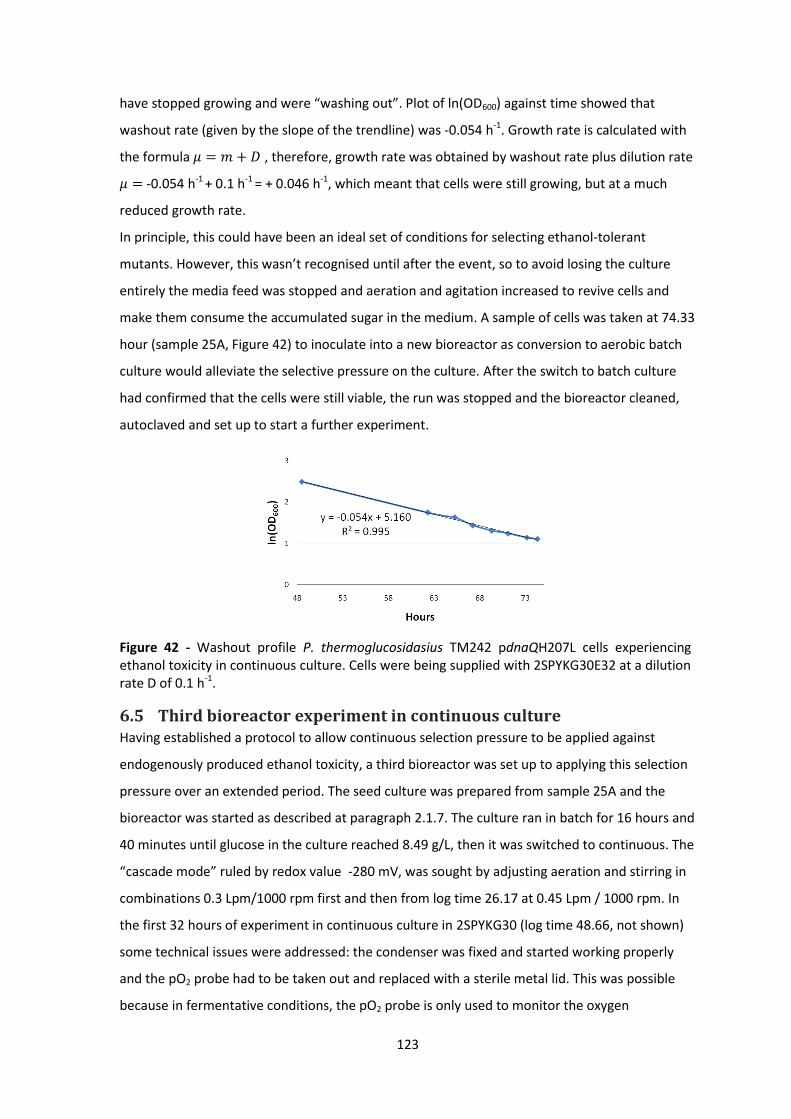
123
have stopped growing and were “washing out”. Plot of ln(OD600) against time showed that
washout rate (given by the slope of the trendline) was -0.054 h-1. Growth rate is calculated with
the formula 𝜇 = 𝑚 + 𝐷 , therefore, growth rate was obtained by washout rate plus dilution rate
𝜇 = -0.054 h-1 + 0.1 h-1 = + 0.046 h-1, which meant that cells were still growing, but at a much
reduced growth rate.
In principle, this could have been an ideal set of conditions for selecting ethanol-tolerant
mutants. However, this wasn’t recognised until after the event, so to avoid losing the culture
entirely the media feed was stopped and aeration and agitation increased to revive cells and
make them consume the accumulated sugar in the medium. A sample of cells was taken at 74.33
hour (sample 25A, Figure 42) to inoculate into a new bioreactor as conversion to aerobic batch
culture would alleviate the selective pressure on the culture. After the switch to batch culture
had confirmed that the cells were still viable, the run was stopped and the bioreactor cleaned,
autoclaved and set up to start a further experiment.
Figure 42 - Washout profile P. thermoglucosidasius TM242 pdnaQH207L cells experiencing ethanol toxicity in continuous culture. Cells were being supplied with 2SPYKG30E32 at a dilution rate D of 0.1 h-1.
6.5 Third bioreactor experiment in continuous culture Having established a protocol to allow continuous selection pressure to be applied against
endogenously produced ethanol toxicity, a third bioreactor was set up to applying this selection
pressure over an extended period. The seed culture was prepared from sample 25A and the
bioreactor was started as described at paragraph 2.1.7. The culture ran in batch for 16 hours and
40 minutes until glucose in the culture reached 8.49 g/L, then it was switched to continuous. The
“cascade mode” ruled by redox value -280 mV, was sought by adjusting aeration and stirring in
combinations 0.3 Lpm/1000 rpm first and then from log time 26.17 at 0.45 Lpm / 1000 rpm. In
the first 32 hours of experiment in continuous culture in 2SPYKG30 (log time 48.66, not shown)
some technical issues were addressed: the condenser was fixed and started working properly
and the pO2 probe had to be taken out and replaced with a sterile metal lid. This was possible
because in fermentative conditions, the pO2 probe is only used to monitor the oxygen
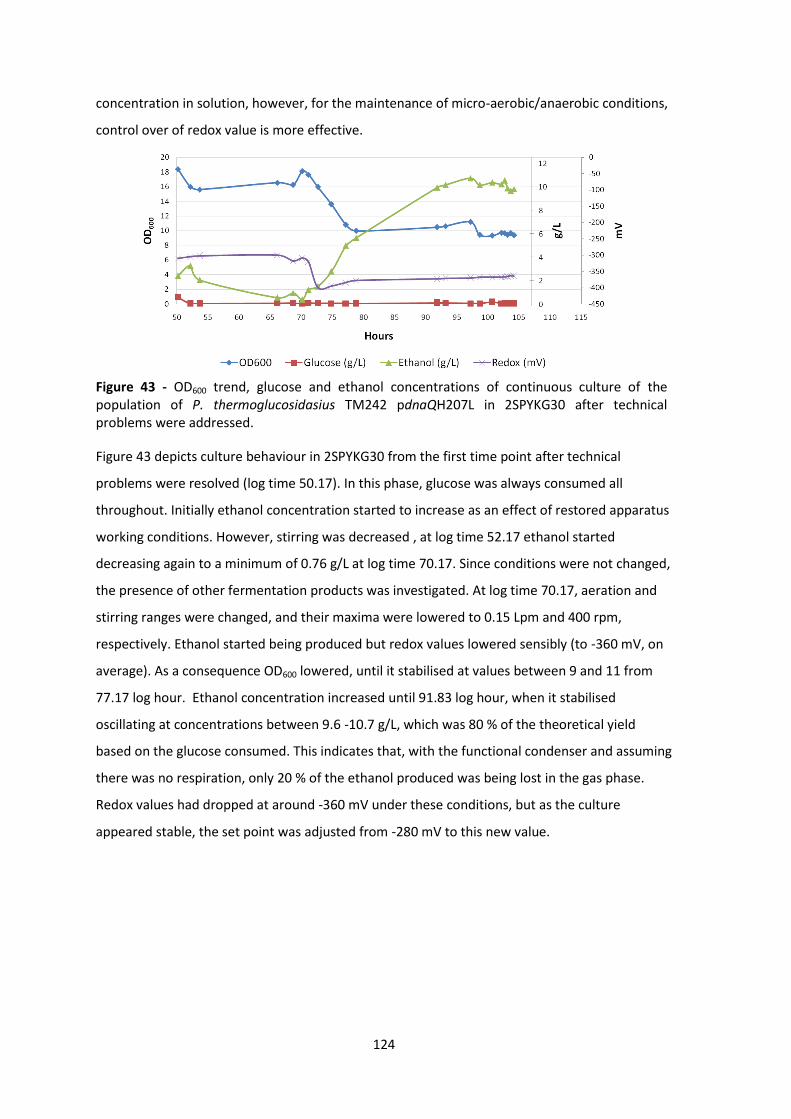
124
concentration in solution, however, for the maintenance of micro-aerobic/anaerobic conditions,
control over of redox value is more effective.
Figure 43 - OD600 trend, glucose and ethanol concentrations of continuous culture of the population of P. thermoglucosidasius TM242 pdnaQH207L in 2SPYKG30 after technical problems were addressed.
Figure 43 depicts culture behaviour in 2SPYKG30 from the first time point after technical
problems were resolved (log time 50.17). In this phase, glucose was always consumed all
throughout. Initially ethanol concentration started to increase as an effect of restored apparatus
working conditions. However, stirring was decreased , at log time 52.17 ethanol started
decreasing again to a minimum of 0.76 g/L at log time 70.17. Since conditions were not changed,
the presence of other fermentation products was investigated. At log time 70.17, aeration and
stirring ranges were changed, and their maxima were lowered to 0.15 Lpm and 400 rpm,
respectively. Ethanol started being produced but redox values lowered sensibly (to -360 mV, on
average). As a consequence OD600 lowered, until it stabilised at values between 9 and 11 from
77.17 log hour. Ethanol concentration increased until 91.83 log hour, when it stabilised
oscillating at concentrations between 9.6 -10.7 g/L, which was 80 % of the theoretical yield
based on the glucose consumed. This indicates that, with the functional condenser and assuming
there was no respiration, only 20 % of the ethanol produced was being lost in the gas phase.
Redox values had dropped at around -360 mV under these conditions, but as the culture
appeared stable, the set point was adjusted from -280 mV to this new value.

125
Figure 44 - OD600 trend, glucose and ethanol concentrations between hours 107.67 and 193.42 of continuous culture of the population of P. thermoglucosidasius TM242 pdnaQH207L in 2SPYKG30E16.
Once steady state had been reached, at log hour 107.67 the feed medium was changed to
2SPYKG30 containing 15.8 g/L (2 % v/v) of ethanol (2SPYKG30E16) (Figure 44). In the subsequent
34 hours, although the ethanol slowly increased, reaching 13.7 g/L (1.7 % v/v), this was less than
expected given the starting concentration and the concentration in the feed. Over the same
period, although there was some oscillation, the cell concentration declined to an OD600 of 4-5
and the residual glucose concentration increased to approximately 17-19 g/L. Although it was
discovered that there was an underlying problem with media being removed from the reactor,
this does not affect the conclusion that the cells were experiencing ethanol toxicity, resulting in
a reduction in cell numbers and consequent reduction in endogenously produced ethanol.
Interestingly, together with ethanol loss in the gas phase this allowed the culture to stabilise at
an OD600 and residual glucose concentration determined by the ethanol concentration. While, in
principle these were the conditions being sought for directed evolution experiments, the
concentration of ethanol was only 13.7 g/L (1.7 % v/v) which was less than concentrations
previously shown to be non-toxic. Therefore, other unknown factors must have been affecting
the cells, the consequence of which might have been to increase ethanol sensitivity.
Although the observation of a potential hyper-(ethanol) sensitive state is interesting and worth
recording for future studies, the purpose of this work was to increase ethanol tolerance at
industrially relevant levels. So, the underlying problem with volume control was corrected and
the culture returned to batch conditions under increased aeration (log time 142.17), allowing
cells to recover and the residual glucose concentration to fall to 0 g/L. Although this was
achieved and the cell density increased (hour 152.83), when the culture was switched to
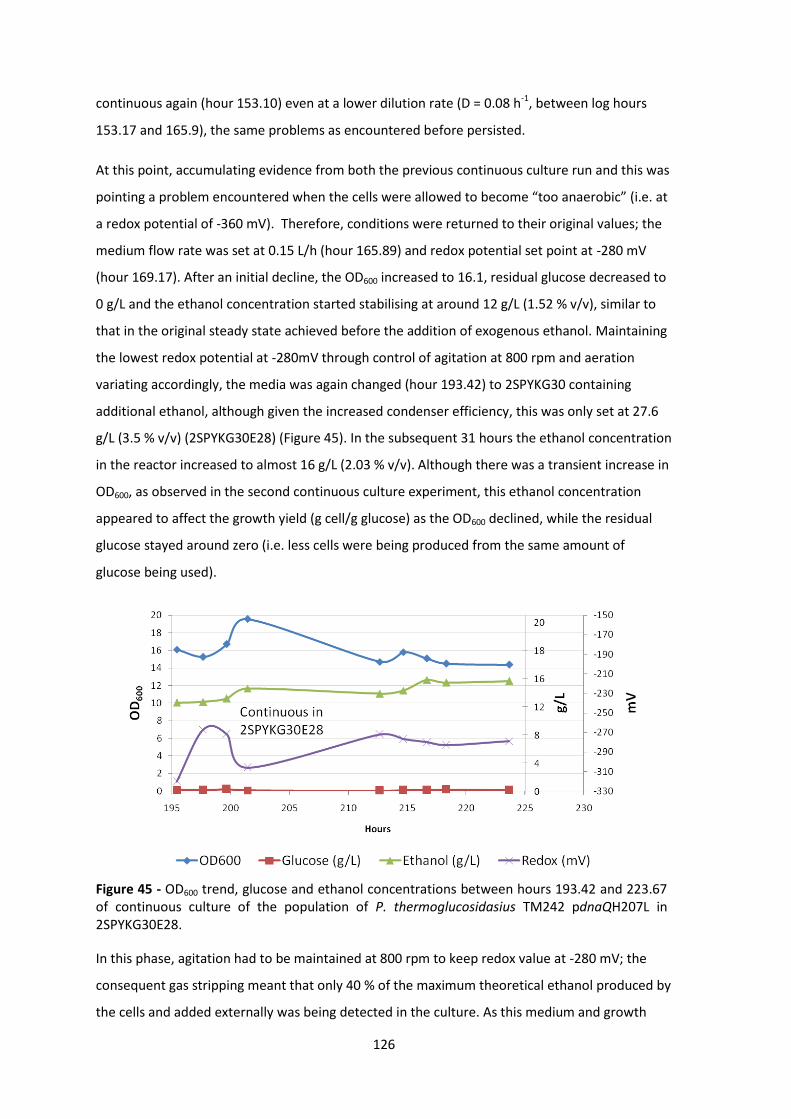
126
continuous again (hour 153.10) even at a lower dilution rate (D = 0.08 h-1, between log hours
153.17 and 165.9), the same problems as encountered before persisted.
At this point, accumulating evidence from both the previous continuous culture run and this was
pointing a problem encountered when the cells were allowed to become “too anaerobic” (i.e. at
a redox potential of -360 mV). Therefore, conditions were returned to their original values; the
medium flow rate was set at 0.15 L/h (hour 165.89) and redox potential set point at -280 mV
(hour 169.17). After an initial decline, the OD600 increased to 16.1, residual glucose decreased to
0 g/L and the ethanol concentration started stabilising at around 12 g/L (1.52 % v/v), similar to
that in the original steady state achieved before the addition of exogenous ethanol. Maintaining
the lowest redox potential at -280mV through control of agitation at 800 rpm and aeration
variating accordingly, the media was again changed (hour 193.42) to 2SPYKG30 containing
additional ethanol, although given the increased condenser efficiency, this was only set at 27.6
g/L (3.5 % v/v) (2SPYKG30E28) (Figure 45). In the subsequent 31 hours the ethanol concentration
in the reactor increased to almost 16 g/L (2.03 % v/v). Although there was a transient increase in
OD600, as observed in the second continuous culture experiment, this ethanol concentration
appeared to affect the growth yield (g cell/g glucose) as the OD600 declined, while the residual
glucose stayed around zero (i.e. less cells were being produced from the same amount of
glucose being used).
Figure 45 - OD600 trend, glucose and ethanol concentrations between hours 193.42 and 223.67 of continuous culture of the population of P. thermoglucosidasius TM242 pdnaQH207L in 2SPYKG30E28.
In this phase, agitation had to be maintained at 800 rpm to keep redox value at -280 mV; the
consequent gas stripping meant that only 40 % of the maximum theoretical ethanol produced by
the cells and added externally was being detected in the culture. As this medium and growth

127
conditions was only starting to show some effects on growth, the ethanol concentration in the
feed was increased to 31.56 g/L (4 % v/v) (2SPYKG30E32) at log hour 225.33 (Figure 46). Redox
value was kept constant at -280 mV. Stirring varied between 800 and 500 rpm and aeration, that
initially was 0.45 Lpm, decreased to 0.05 Lpm after 242.42 log hour. Over the first 22 hours in
these conditions the ethanol concentration in the reactor increased to 23.17 g/L (2.94 % v/v)
while the OD600 decreased from 14.08 to less than 10 (log hour 247.67).
Figure 46 - OD600 trend, glucose and ethanol concentrations between hours 225.67 and 312.67 of continuous culture of the population of P. thermoglucosidasius TM242 pdnaQH207L in 2SPYKG30E32. Sample 96B at hour 296.17 was selected for further analyses.
Up to this point the residual glucose remained at zero, so the reduction in OD600 was clearly a
reduction in growth yield of the cells, probably arising from an increase in maintenance energy.
After this point the residual glucose concentrations started to rise and OD600 continued to fall
until they reached a plateau at around hour 265. At this point, the ethanol concentration had
also stabilised at around 27 g/L (3.47 % v/v) suggesting that a new steady state had been
reached, where the cell concentration and glucose utilisation were dictated by the toxicity of
ethanol in the culture. As this ethanol concentration was now in the range previously recognised
to be toxic this represented ideal conditions for selection of tolerant mutants.
As hoped for, after hour 272.67 the cell concentration started increasing and residual glucose
concentration started decreasing while the ethanol concentration in the culture remained
virtually constant. This suggests that ethanol-tolerant mutants might be starting to dominate the
culture by growing more effectively on the residual glucose than the parent strain. This trend
continued until hour 294 when the ethanol concentration in the culture started to decline. In
fact, to maintain redox values at -280 mV while the cell yield was increasing, the “cascade mode”
automatically increased aeration (from 0.05 to 0.36 Lpm) and stirring (up to 800 rpm), which
probably caused gas stripping. Ethanol decrease would have reduced the selective pressure and,

128
as a consequence, glucose concentrations fell more rapidly to 0 g/L after hour 296.
The reasons for this reduction is ethanol concentration were also ascribable to possible
increasing concentration of acetate and potentially other fermentation products precursors that
started at log time 272.67 and presumably went above ethanol concentration between log times
293.17 and 308.50. Sample 96B (in Figure 46) was selected as representative of population of
cells resistant to 27 g/L (3.47 % v/v) and actively consuming sugar.
Given that the culture appeared to be adapting to the ethanol concentration achieved with
31.56 g/L (4 % v/v) ethanol concentration in the feed, and to counteract whatever factor was
leading to the decline in ethanol concentration in the reactor, the concentration of ethanol in
the feed medium was increased to 35.50 g/L (4.5 % v/v) (2SPYKG30E35) at log hour 316.92
(Figure 47). Over the next 14 hours there was an immediate decline in the OD600 associated with
a relatively small increase in ethanol concentration. As cells were consuming all of the glucose at
this stage, this is reminiscent of the effects on cell yield seen earlier, although at a higher
tolerance threshold of 25.68 g/L (3.25 % v/v) (hour 330.67) than previously (23.17 g/L or 2.94 %
v/v) at hour 242.17. However, as the ethanol concentrations continued to rise from 22.28 to
28.67 g/L (2.82 % v/v to 3.63 % v/v) the cell density dropped from an OD600 of 13 to 3.06 (hour
348.17) with a concomitant increase in residual glucose concentration. By plotting the ln(OD600)
against time profile over this period it was clear that the cells were still growing, but at a rate
less than the dilution rate. Although, these conditions were clearly imposing a strong selective
pressure for directed evolution, this time there was no hint of stabilisation so the culture was
“rescued” at log hour 348.17 by reducing the medium flow rate to 𝐹 = 0.048 L/h (𝐷 = 0.032 h-
1). This allowed the culture to revive to an OD600 of around 8, with all of the glucose consumed.
Over this time the ethanol concentration in the culture declined to around 24 g/L (3 % v/v),
presumably because the balance of stripping rate and addition rate had changed, which would
also have reduced toxicity.
As the cells were able to consume all the glucose supplied under these low growth rate
conditions, the medium flow rate was increased to 𝐹 = 0.075 L/h at hour 383.67, giving a
dilution rate of 𝐷 =0.05 h-1. The OD600 increased significantly while all of the glucose supplied
continued to be used. However, the ethanol concentration decreased slightly to 23.26 g/L (2.95
% v/v) possibly because of the increased agitation required to maintain these higher cell
densities (from 500 to 700 rpm, while aeration remained constant 0.05 Lpm). Ethanol was never
less than 23.26 g/L (2.94 % v/v), while in the first continuous culture experiment this limit was
determined to be 14.94 g/L (1.89 % v/v) of ethanol.
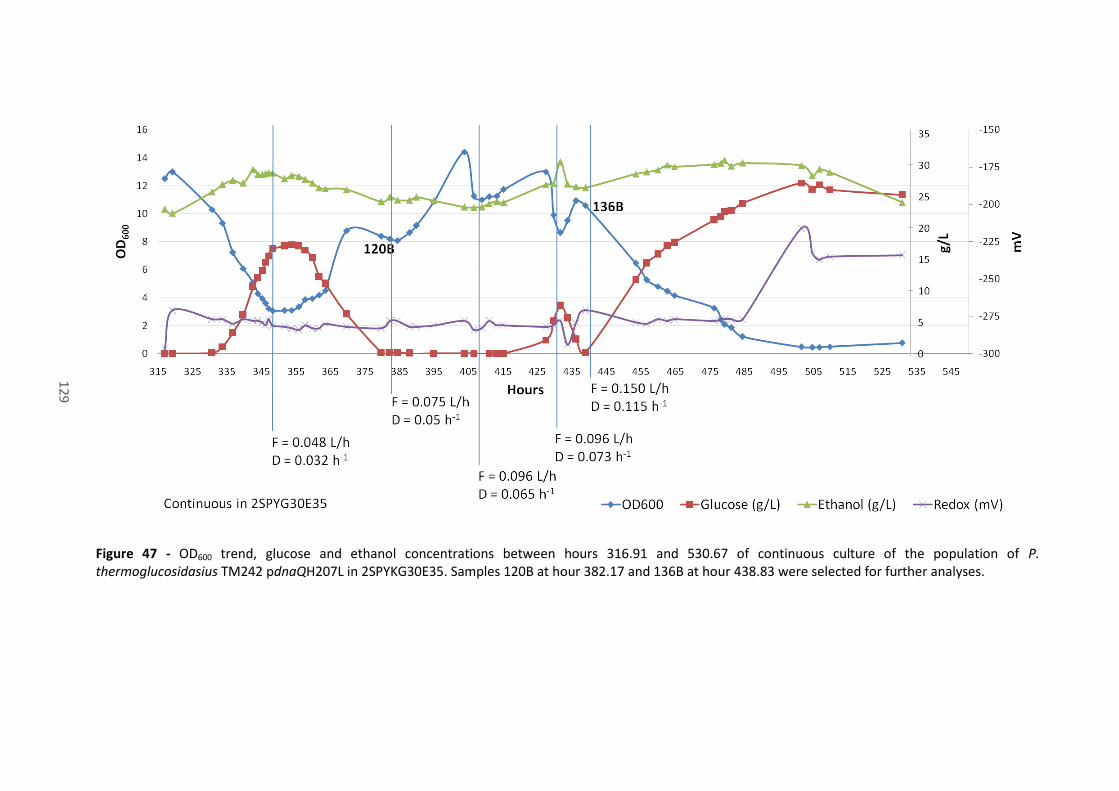
129
Figure 47 - OD600 trend, glucose and ethanol concentrations between hours 316.91 and 530.67 of continuous culture of the population of P. thermoglucosidasius TM242 pdnaQH207L in 2SPYKG30E35. Samples 120B at hour 382.17 and 136B at hour 438.83 were selected for further analyses.
12
9
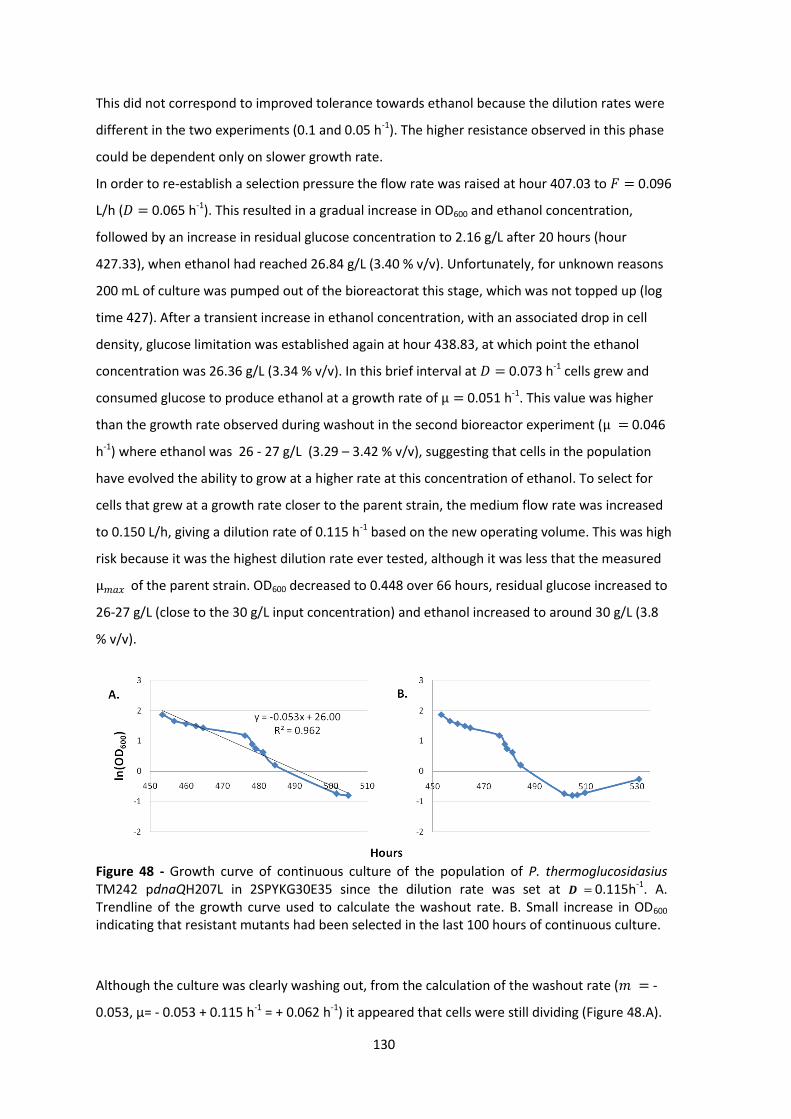
130
This did not correspond to improved tolerance towards ethanol because the dilution rates were
different in the two experiments (0.1 and 0.05 h-1). The higher resistance observed in this phase
could be dependent only on slower growth rate.
In order to re-establish a selection pressure the flow rate was raised at hour 407.03 to 𝐹 = 0.096
L/h (𝐷 = 0.065 h-1). This resulted in a gradual increase in OD600 and ethanol concentration,
followed by an increase in residual glucose concentration to 2.16 g/L after 20 hours (hour
427.33), when ethanol had reached 26.84 g/L (3.40 % v/v). Unfortunately, for unknown reasons
200 mL of culture was pumped out of the bioreactorat this stage, which was not topped up (log
time 427). After a transient increase in ethanol concentration, with an associated drop in cell
density, glucose limitation was established again at hour 438.83, at which point the ethanol
concentration was 26.36 g/L (3.34 % v/v). In this brief interval at 𝐷 = 0.073 h-1 cells grew and
consumed glucose to produce ethanol at a growth rate of µ = 0.051 h-1. This value was higher
than the growth rate observed during washout in the second bioreactor experiment (µ = 0.046
h-1) where ethanol was 26 - 27 g/L (3.29 – 3.42 % v/v), suggesting that cells in the population
have evolved the ability to grow at a higher rate at this concentration of ethanol. To select for
cells that grew at a growth rate closer to the parent strain, the medium flow rate was increased
to 0.150 L/h, giving a dilution rate of 0.115 h-1 based on the new operating volume. This was high
risk because it was the highest dilution rate ever tested, although it was less that the measured
µ𝑚𝑎𝑥 of the parent strain. OD600 decreased to 0.448 over 66 hours, residual glucose increased to
26-27 g/L (close to the 30 g/L input concentration) and ethanol increased to around 30 g/L (3.8
% v/v).
Although the culture was clearly washing out, from the calculation of the washout rate (𝑚 = -
0.053, µ= - 0.053 + 0.115 h-1 = + 0.062 h-1) it appeared that cells were still dividing (Figure 48.A).
Figure 48 - Growth curve of continuous culture of the population of P. thermoglucosidasius TM242 pdnaQH207L in 2SPYKG30E35 since the dilution rate was set at 𝑫 = 0.115h-1. A. Trendline of the growth curve used to calculate the washout rate. B. Small increase in OD600 indicating that resistant mutants had been selected in the last 100 hours of continuous culture.
131
Indeed, in the last three time points registered (between log times 504.67 and 530.67) before
the reactor was shut down, it appeared that the OD600 was gradually increasing and residual
glucose decreasing (Figure 48.B), so despite the dramatic decline, the evolutionary pressure was
having the desired effect.
6.6 Plasmid curing Many samples taken all throughout the three bioreactor runs were conserved as glycerol stocks.
Of these, four particularly interesting samples were picked to cure cells of the plasmid carrying
the in vivo mutator and confirm the retain of resistant phenotype in fermentative conditions of
population derivatives. These samples were 25A, 96B, 120B and 136B, highlighted in Figures 41,
46 and 47. To ensure that evolved strains were not going to be mutated any further by the in
vivo mutator, the four relevant samples (25A, 96B, 120B and 136B) were cured of the plasmid
pG1AK mCherry dnaQH207L. To obtain genetically stable strains and avoid the appearing of new
mutations that could modify the ethanol resistant genomes, cells had to be cured of the vector
pG1AK mCherry carrying dnaQ H207L. Glycerol stocks of samples 25A, 96B, 120B and 136B were
streaked making sure of covering the whole surface of 2TYK plates to initially avoid
contaminants. The cells grown on all the plates surface were scraped with a loop and the cells
masses were used to start liquid cultures in 50 mL of plain 2TY as described for P.
thermoglucosidasius growth in flask at paragraph 2.1.3 of the Methods section. The liquid
cultures were grown at 60°C at 200 rpm for 12 hours and then subcultured in ratio 1/50 in fresh
2TY, in the same conditions. This process was repeated for a total of five subcultures. The fifth
subcultures were used for tenfold serial dilutions up to 10-6, 100 µL of dilutions 10-4, 10-5 and 10-6
were plated on 2TY plates to have separate colonies. Fourty colonies of each sample were picked
to do replicas on 2TY plates with and without kanamycin. All selected colonies from samples
25A, 96B and 136B were kanamycin sensitive (100 % curing efficiency), four colonies from
sample 120B grew also on 2TYK meaning that 1/10 of cells in the culture had not cured the
plasmid.
6.7 Discussion The aim of this experiment was to increase ethanol tolerance of P. thermoglucosidasius by
directed evolution in vivo in a relatively short period of time in a controlled environment. This
needed to be done in the ethanologenic mutant TM242 as the parent strain typically only
produces ethanol as a minor fermentation product (Cripps et al., 2009). To accelerate the
evolutionary process the in vivo mutator dnaQH207L was introduced on a plasmid into TM242
and continuous selection maintained by including kanamycin in the growth media. For simplicity,
it was decided to employ only the strongest mutator available, instead of all the six of them. This
132
was different from the the original work about GREACE by Luan et al. (2013), where the initial
population of plasmids carrying the library was also selected in relationship to the fitness of the
mutators mutation rate (strong, mild or weak).
The principle of directed evolution in continuous culture is to apply a toxic stress to growing
cells, such that parent cells wash out of the culture while resistant mutants take over. Once
mutants have appeared in the culture the active removal of parent strains accelerates the
process in comparison to sequential batch growth experiments. To achieve this, the modified
TM242 had to be grown under conditions where toxic concentrations of ethanol in solution were
maintained for sufficient time for the mutants to take over. Additionally, it was known that
resistance to added (exogenous) ethanol is different from resistance to produced (endogenous)
ethanol. The latter was the target of this experiment, so it was important to keep the cells under
ethanol fermentation conditions throughout. As this had never been attempted before in
Parageobacillus spp., preliminary experiments were necessary to establish the optimum
conditions. Initial parameters were based on information gathered from the literature and
personal communication with colleagues who had experience of fermentation trials in
continuous culture with Parageobacillus spp.. In the second continuous culture experiment a
different strategy was adopted in which some ethanol was introduced with the growth media.
Although this was providing exogenous ethanol, the growth conditions in the bioreactor were
maintained at a redox potential which is known to result in ethanologenic fermentation
observed by HPLC. Strain TM242 is “hard wired” through mutations to produce ethanol as its
sole reduced fermentation product under normal growth conditions. Therefore, the toxicity
observed should still be a reflection of problems encountered with endogenous production at
toxic ethanol concentrations. This strategy proved to be easier to control but still required a
degree of optimisation to work out the optimum balance of ethanol in the medium and
aeration/agitation rate. In the third continuous culture experiment evolutionary pressure was
applied over extended periods. A problem was encountered, which had been hinted at earlier,
when working at very low redox potential, so the most effective strategy for physiological
stability was to maintain the redox potential at -280 mV, despite that fact that the aeration and
agitation conditions stripped more ethanol from the culture than at lower redox potential.
Toxicity was observed in two forms; initially an effect was observed on cell yield, whereby the
cell densities dropped but all of the glucose was being used. This is what would be expected if
the cells were having to expend more ATP in maintaining viability and were therefore using less
for growth. At higher ethanol concentrations the cell density decreased and residual glucose
appeared in the culture. In at least one instance this reached a new steady state, from which
133
cells appeared to evolve to higher tolerance. While this steady state with a high residual glucose
concentration could reflect the fact that ethanol had reduced the µ𝑚𝑎𝑥 to a value just higher
than the dilution rate, it could also reflect the fact that the cells were producing ethanol, so a
lower cell density would mean a lower total ethanol concentration, enabling cells to grow under
these conditions. In other examples the cells appeared to be washing out of the culture as the
result of ethanol toxicity and action needed to be taken to ensure that the culture was not lost
completely. Calculation of the washout rate compared to the imposed growth rate (dilution
rate), showed that cells were still growing under these conditions but at a growth rate that was
less than the dilution rate.
It was hypothesised that endogenous ethanol toxicity derived from accumulation of precursors,
such as acetaldehyde and acetyl-CoA. However it could also be that cells had evolved ethanol
resistance by shifting their anaerobic metabolism to an increased production of acetate instead
of ethanol. This compound was monitored all throughout the three bioreactor experiments.
However it was difficult to unequivocally determine acetate concentration because its
characteristic peak (retention time about 16 minutes) was very often fused with a peak of a
compound of similar affinity to the column adsorbent material, with a lower but very close
retention time. The unknown substance was either present and appeared fused with the acetate
peak or was well separated from the acetate peak, or was not present at all. In the first case, the
calculation of the area of the spectrum used to retrieve mM concentration was not precise. The
nature of this compound was not investigated any further. The maximum ethanol concentration
that TM242 pdnaQH207L population in the bioreactor was able to tolerate while consuming all
the glucose in the media was 26.36 g/L (3.34 % v/v), which was 11.42 g/L (1.45 % v/v) more than
what the parent strain was able to tolerate (i.e 14.94 g/L, 1.89 % v/v). Resistance of TM242
pdnaQH207L at this moment was 1.75 times higher than parental TM242. This result was
achieved after three bioreactor experiments, in 675 hours of culture of which around 600 hours
in continuous, in about 35 days in total. Although it would be have been useful to extend this
exercise further, time was limited, so a decision was made to stop the continuous culture runs
and analyse some of the cells that had been recovered throughout the directed evolution
process.
134
Chapter 7
Analysis and selection of evolved strains
7.1 Introduction on experimental settings Although the chemostat culture selection approach, described in Chapter 6, encountered a
number of technical problems, overall the increasing stringency of selective pressure applied
through increasing the input ethanol concentration was expected to result in a decrease of
population variability, as non-competitive genotypes were washed out of the chemostat. From
the point of view of application, the strains recovered from the highest concentrations of
ethanol were expected to be the most useful. However, given that the principle of GREACE is
one of continuous mutation and selection, the strains which survived at the highest ethanol
concentrations were expected to be complex, containing multiple mutations. An analysis of the
gradual build-up and stabilisation (in the population) of these mutations during selection (i.e. the
evolutionary process) could be informative in understanding the importance of individual
mutations to the ensemble, and also guide attempts to engineer ethanol tolerant strains
through reverse genetics approaches. Therefore, it was decided to analyse populations of cells
taken at various points through the evolutionary process.
Analysing multiple isolates from many stages during the evolutionary process would have been
impossible using bioreactors, so it was necessary to devise a highly-parallel, high-throughput
assay that would help to rank strains and identify those for further analysis. Despite the inherent
limitations associated with the use of tube-cultures, such as the inability to control pH and redox
and the potential build up of toxic products such as acetate, these met the requirements of high
throughput and highly-parallel analyses. In order to limit the effect of pH and build-up of acetate
it was decided to emulate the approach taken in the chemostat by introducing a marginally sub-
toxic concentration of ethanol into the media, meaning that only a small amount of fermentative
growth was required to reach nominally toxic levels of ethanol, so it should be straightforward
to identify resistant strains that grew beyond that point. Limiting the amount of growth also
meant that it was possible to use sub-toxic concentrations of glucose and the continued
utilisation of glucose would also be used as a measure to assess cell viability. In addition to these
steps, the well-established triple-buffer system was used to minimise pH fluctuation.
Firstly, ethanol tolerance range in these experimental settings had to be explored with TM242.
HPLC was used for qualitative and quantitative assessment of samples; valuable isolates were
expected to show a glucose concentration decrease and an ethanol concentration increase over
135
TM242 performance. Isolate ranking by increasing performance was expected to follow the
sample progress order (25A, 96B, 120B and 136B).
7.2 Ethanol tolerance of the parent strain P. thermoglucosidasius
TM242 The parent strain TM242 was tested first to provide a baseline tolerance, against which
resistance could be assessed, and also to devise the most suitable conditions for testing the
evolved strains. Growth and product formation were tested in a rich medium supplemented
with six different concentrations of added ethanol, comprised of: 2SPY containing 30 g/L of
glucose, 40 mM triple buffer, 200 μL antifoam (abbreviated as medium A) and 0 g/L, 7.9 g/L, 15.8
g/L, 23.7 g/L, 31.6 g/L, 39.4 g/L of ethanol (corresponding to 0, 1, 2, 3, 4 and 5 % v/v). To keep
fermentative conditions as far as possible throughout the experiment, each tube was sampled
only once at 24, 48 or 72 hours, which for six conditions meant a total of 18 cultures for each
biological replicate and a total of 54 cultures at the start of the experiment. Some intrinsic error
arising from the possibility that cultures receiving the same inoculum might not retain identical
growth profiles was expected, but considered to cause less variation than the accidental
introduction of air during sampling. Three overnight cultures of TM242 were prepared and sub-
cultured as described in Methods (paragraph 2.1.4).
One mL of inoculum and 200 µL antifoam were added after the medium had been aliquoted into
the glass tubes, diluting the glucose to 26.4 g/L and the ethanol to 6.9 g/L, 13.9 g/L, 20.8 g/L,
27.8 g/L and 34.7 g/L, corresponding to 0.9 % v/v, 1.8 % v/v, 2.6 % v/v, 3.5 % v/v and 4.4 % v/v
(abbreviated as E0, E7, E14, E21, E28, E35). The concentrations of glucose and ethanol in the
liquid phase of each culture were analysed by HPLC after 24, 48 and 72 hours incubation (Figure
49). One set of tubes (medium AE35, 72 hours) was lost in this experiment.
In the control tubes of TM242 grown in AE0 (i.e. no added ethanol), the three replicates
consumed all of the glucose in the media in 24 hours, from which cells were able to produce
12.9 g/L (1.6 % v/v) ethanol. Acetate was detected in two samples out of three only at 24 hour.
No other fermentation products were detected in any other samples. The conversion of glucose
into ethanol corresponded to 0.49 g of ethanol per g of consumed sugar on average, which was
slightly above the yield 0.47 g/g of glucose reported by Cripps et al. (2009) when considering
liquid and gas phases. As the headspace in the test tubes very small, most of the ethanol would
be dissolved in the media, therefore this result was consistent. The similar concentrations of
ethanol detected after 24, 48 and 72 hours suggested that losses to evaporation were minimal.

136
Cultures grown in AE7 fermented the majority of theglucose in the medium. In all replicates the
combined concentration of produced and added ethanol was always above 16 g/L (2 % v/v) but
there was some variability in glucose consumption. One culture out of three consumed all of the
glucose in the media after 24 hour; the resulting ethanol concentration was 19 g/L (2.4 % v/v)
which corresponded to the maximum theoretical concentration from fermentation of 26.4 g/L
glucose together with the added ethanol. In the other two cultures residual glucose was
detected (8.8 g/L and 4.2 g/L) after24 hours, but was all consumed within 48 hours; in the tubes
sampled after 72 hours there still was some glucose left, indicating that cultures had different
consumption rates despite the fact that their seeds came from the same subculture.
The ethanol concentration in cultures grown in AE14 was 19 g/L (2.4 % v/v) after 24 hours and
21.8 g/L (2.8 % v/v) after 48 hours. Again, cultures sampled after 72 hours behaved
inconsistently, compared with the other cultures from the same biological replicate and
registered only 19.8 g/L (2.5 % v/v) of ethanol and glucose consumption was less than after 48
hours. None of the cultures were able to consume all of the glucose in the medium, suggesting
that the ethanol toxicity level had been reached, and the maximum tolerated concentration was
21.8 g/L (2.8 % v/v). As this is close to the concentration of ethanol added to the AE21 tubes, it is
not surprising that samples from cultures in AE21, AE28 and AE35 showed little evidence of
growth; after 48 hours, glucose was never found at concentrations below 22.84 g/L (maximum
concentration consumed 3.56 g/L), only one culture managed to consume 8.2 g/L of glucose
(detected 18.4 g/L) after 72 hours in AE21.
From the analysis of ethanol tolerance in TM242, it was evident that the experiment could be
performed over 48 hours, as little changed in the subsequent 24 hours. Additionally, tubes
Figure 49 - Residual glucose (A) and total ethanol (B) concentrations detected after 24, 48 and 72 hours growth in liquid cultures of P. thermoglucosidasius TM242 under fermentative conditions in 2SPY supplemented with 26.4 g/L of glucose, 40 mM triple buffer, 200 μL antifoam (abbreviated as medium A) and ethanol 0 g/L, 6.9 g/L, 13.9 g/L, 20.8 g/L, 27.8 g/L (abbreviated as E0, E7, E14, E21, E28, E35). Each experiment was done in triplicate.
137
supplemented with 13.9 g/L ethanol were the most likely to reveal variants with increased
ethanol tolerance as these clearly allowed some fermentation at the start, but this reached
inhibitory concentrations over the course of 48 hours.
7.3 Test of acquired ethanol resistance in selected bioreactor samples The populations of cells taken from samples 25A, 96B, 120B and 136B were expected to contain
ethanol tolerant strains, although some phenotypic diversity was expected. Kanamycin sensitive
isolates from the four samples were randomly picked from replica plates (described at Paragraph
6.5) and assessed under the experimental conditions established through the study of TM242.
Cultures were prepared as described for TM242, seed cultures added to 10 mL of AE14 in 15 mL
glass test tubes and incubated under fermentative conditions for 48 hours. Because of the large
number of samples to be analysed, the protocol was varied slightly from that used with TM242.
After 24 hours growth, culture samples were taken using a needle to avoid the introduction of
air, meaning that this time only one culture per isolate was monitored over 48 hours. In a first
screening (exp 1), 12 isolates per bioreactor samples were tested; some that showed interesting
phenotypes and a few more isolates were tested in a second experiment (exp 2), for a total of 71
isolates from all bioreactor samples (i.e. 21 from 25A, 15 from 96B, 14 from 120B and 21 from
136B).
According to the HPLC analysis of media controls, the initial concentrations of glucose and
ethanol were different in the two experiments (27.4 g/L and 16 g/L in experiment 1, 28.9 g/L and
12.2 g/L in experiment 2, respectively). Conditions should therefore have been more stringent in
experiment 1 than in experiment 2; however, the TM242 control consumed more glucose and
produced more ethanol in exp 1. As these differences only became evident during analysis of the
data it was decided that, where isolates were tested in both exp 1 and exp 2 the HPLC results
would be treated as independent data sets and not averaged.
As well as the differences between the media controls, results obtained from the two sets of
samples were assessed separately, the increased possibility of analytical error giving rise to false
positives when no replicates were included was controlled for according to the criteria described
in paragraph 7.1. Samples taken at 24 and/or 48 hours that showed both glucose consumption
and ethanol production with consistent stoichiometry in the same sample were considered to be
isolates of interest (highlighted in yellow in Figures 50, 51, 52, and 53). Thus, samples where a
change in sensitivity of the RI detector either over- or underestimated both glucose and ethanol
concentrations would be eliminated. In some cases, ethanol concentration decreased on the
second day of culture indicating that some ethanol may have been lost during sampling at 24
hours.
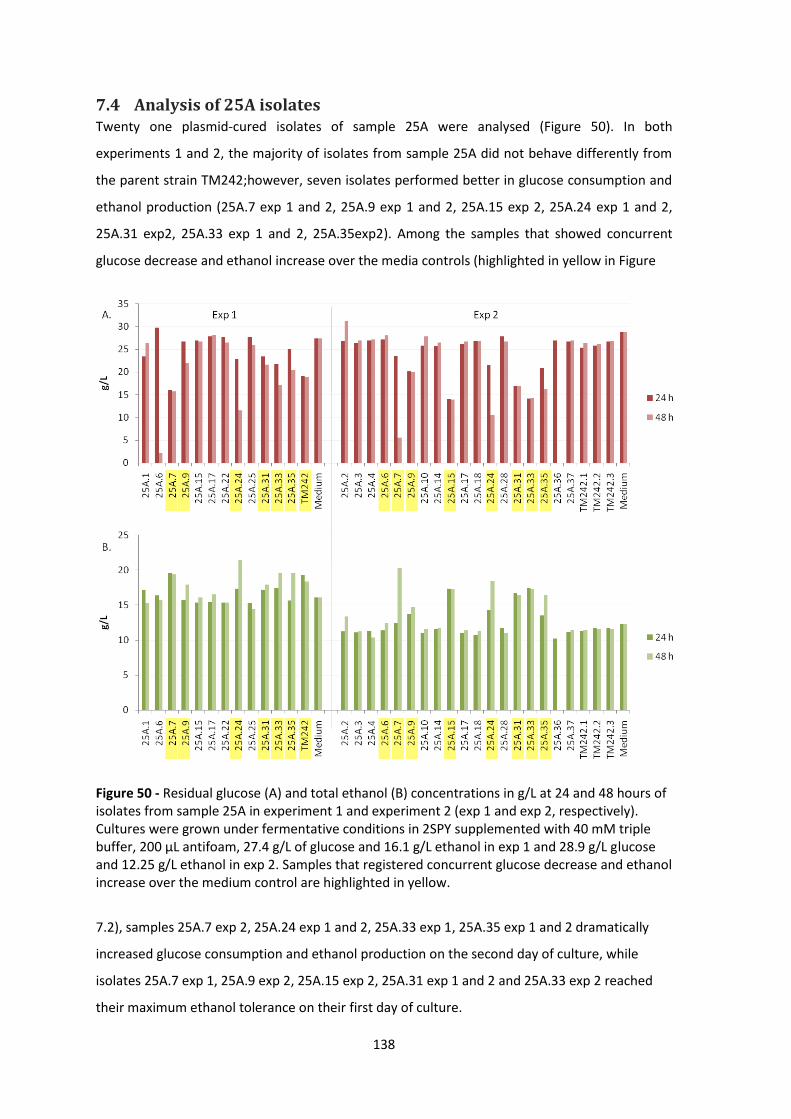
138
7.4 Analysis of 25A isolates Twenty one plasmid-cured isolates of sample 25A were analysed (Figure 50). In both
experiments 1 and 2, the majority of isolates from sample 25A did not behave differently from
the parent strain TM242;however, seven isolates performed better in glucose consumption and
ethanol production (25A.7 exp 1 and 2, 25A.9 exp 1 and 2, 25A.15 exp 2, 25A.24 exp 1 and 2,
25A.31 exp2, 25A.33 exp 1 and 2, 25A.35exp2). Among the samples that showed concurrent
glucose decrease and ethanol increase over the media controls (highlighted in yellow in Figure
7.2), samples 25A.7 exp 2, 25A.24 exp 1 and 2, 25A.33 exp 1, 25A.35 exp 1 and 2 dramatically
increased glucose consumption and ethanol production on the second day of culture, while
isolates 25A.7 exp 1, 25A.9 exp 2, 25A.15 exp 2, 25A.31 exp 1 and 2 and 25A.33 exp 2 reached
their maximum ethanol tolerance on their first day of culture.
Figure 50 - Residual glucose (A) and total ethanol (B) concentrations in g/L at 24 and 48 hours of isolates from sample 25A in experiment 1 and experiment 2 (exp 1 and exp 2, respectively). Cultures were grown under fermentative conditions in 2SPY supplemented with 40 mM triple buffer, 200 μL antifoam, 27.4 g/L of glucose and 16.1 g/L ethanol in exp 1 and 28.9 g/L glucose and 12.25 g/L ethanol in exp 2. Samples that registered concurrent glucose decrease and ethanol increase over the medium control are highlighted in yellow.
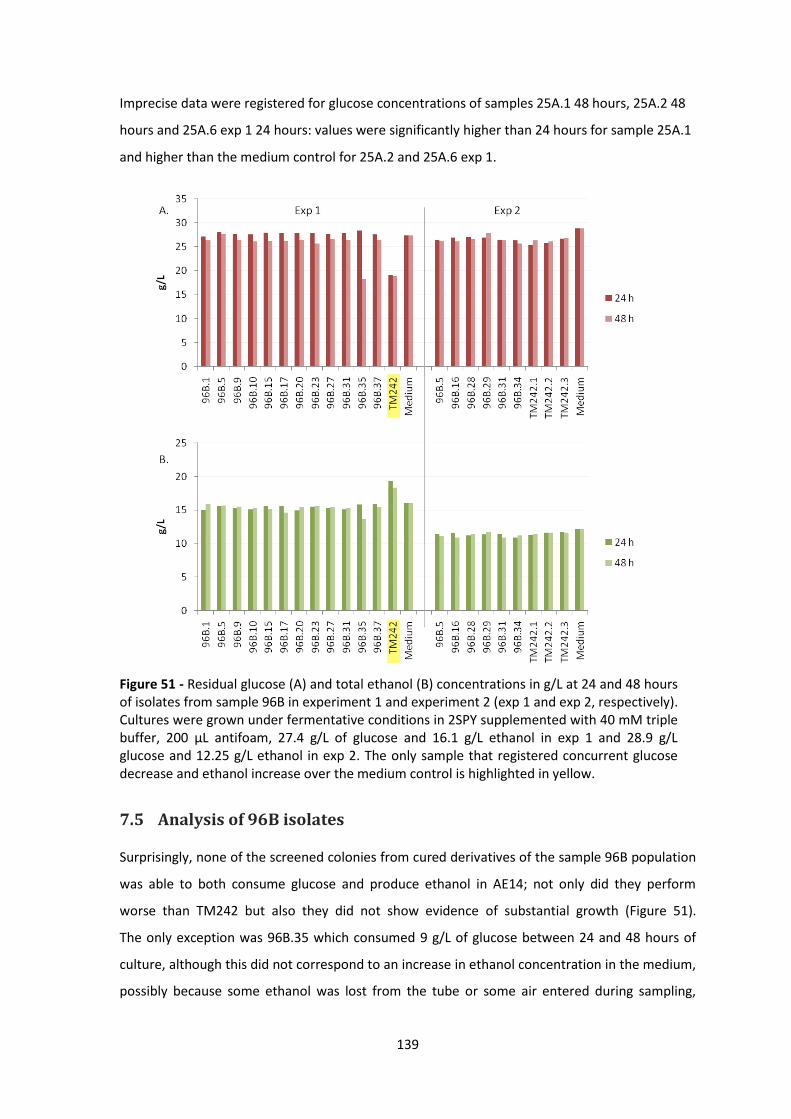
139
Imprecise data were registered for glucose concentrations of samples 25A.1 48 hours, 25A.2 48
hours and 25A.6 exp 1 24 hours: values were significantly higher than 24 hours for sample 25A.1
and higher than the medium control for 25A.2 and 25A.6 exp 1.
Figure 51 - Residual glucose (A) and total ethanol (B) concentrations in g/L at 24 and 48 hours of isolates from sample 96B in experiment 1 and experiment 2 (exp 1 and exp 2, respectively). Cultures were grown under fermentative conditions in 2SPY supplemented with 40 mM triple buffer, 200 μL antifoam, 27.4 g/L of glucose and 16.1 g/L ethanol in exp 1 and 28.9 g/L glucose and 12.25 g/L ethanol in exp 2. The only sample that registered concurrent glucose decrease and ethanol increase over the medium control is highlighted in yellow.
7.5 Analysis of 96B isolates
Surprisingly, none of the screened colonies from cured derivatives of the sample 96B population
was able to both consume glucose and produce ethanol in AE14; not only did they perform
worse than TM242 but also they did not show evidence of substantial growth (Figure 51).
The only exception was 96B.35 which consumed 9 g/L of glucose between 24 and 48 hours of
culture, although this did not correspond to an increase in ethanol concentration in the medium,
possibly because some ethanol was lost from the tube or some air entered during sampling,
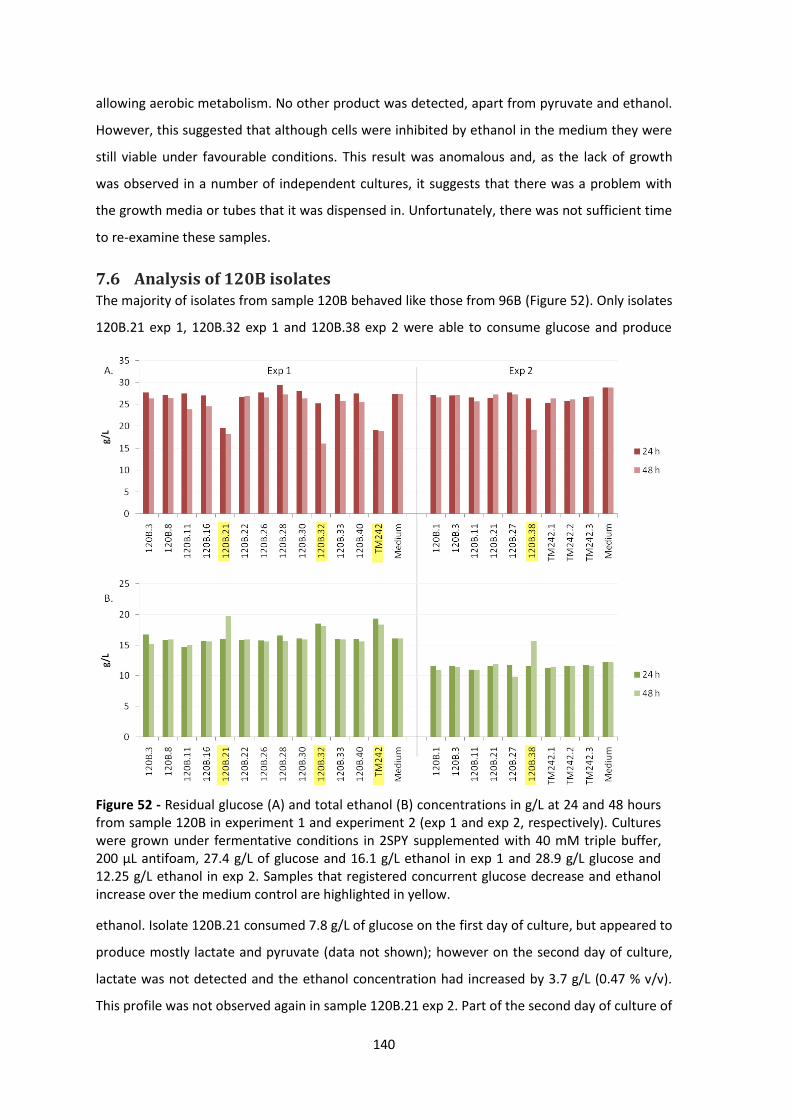
140
allowing aerobic metabolism. No other product was detected, apart from pyruvate and ethanol.
However, this suggested that although cells were inhibited by ethanol in the medium they were
still viable under favourable conditions. This result was anomalous and, as the lack of growth
was observed in a number of independent cultures, it suggests that there was a problem with
the growth media or tubes that it was dispensed in. Unfortunately, there was not sufficient time
to re-examine these samples.
7.6 Analysis of 120B isolates The majority of isolates from sample 120B behaved like those from 96B (Figure 52). Only isolates
120B.21 exp 1, 120B.32 exp 1 and 120B.38 exp 2 were able to consume glucose and produce
ethanol. Isolate 120B.21 consumed 7.8 g/L of glucose on the first day of culture, but appeared to
produce mostly lactate and pyruvate (data not shown); however on the second day of culture,
lactate was not detected and the ethanol concentration had increased by 3.7 g/L (0.47 % v/v).
This profile was not observed again in sample 120B.21 exp 2. Part of the second day of culture of
Figure 52 - Residual glucose (A) and total ethanol (B) concentrations in g/L at 24 and 48 hours from sample 120B in experiment 1 and experiment 2 (exp 1 and exp 2, respectively). Cultures were grown under fermentative conditions in 2SPY supplemented with 40 mM triple buffer, 200 μL antifoam, 27.4 g/L of glucose and 16.1 g/L ethanol in exp 1 and 28.9 g/L glucose and 12.25 g/L ethanol in exp 2. Samples that registered concurrent glucose decrease and ethanol increase over the medium control are highlighted in yellow.
141
isolate 120B.32 was aerobic (i.e. the lid was not properly sealed on the test tube); the glucose
concentration decreased but no additional ethanol or other detectable product was observed.
Isolate 120B.38 exp 2 consumed 9.63 g/L of glucose in the second day of culture and produced
more ethanol than TM242. In samples 120B.1 exp 2, 120B.3 exp 1 and 120B.27 exp 2 the ethanol
concentration gradually reduced from the externally added concentration during cultivation,
suggesting that it was leaking out of the tube; glucose consumption did not increase
significantly, which supports the suggestion that there was some problem with the growth
medium/tube which was inhibiting growth, even with sub-toxic levels of ethanol.
7.7 Analysis of 136B isolates Unlike the strains recovered from 96B and 120B, the set of derivatives from sample 136B were
highly diverse (Figure 53). Half of the strains tested consumed at least 9 g/L of sugar in the first
24 hours (136B.3 exp 2, 136B.10 exp 1 and 2, 136B.13 exp 1 and 2, 136B.16 exp 1 and 2, 136B.18
exp2, 136B.24 exp 2, 136B.27 exp 2, 136B.32 exp 2, 136B.36 exp 2, 136B.39 exp 2), but only four
isolates further increased glucose consumption (136B.10 exp 2, 136B.32, 136B.36 and 136B.39
from exp 2).These isolates, together with 136B.16 exp 2 also increased ethanol production from
24 to 48 hour, while isolates 136B.3 exp 2, 136B.10 exp 1, 136B.13 exp 1 and 2 and 136B.18 did
not. In exp 1, isolate 136B.16 produced ethanol, pyruvate and acetate in the first 24 hours of
culture and pyruvate and lactate on the second day, with the ethanol concentration decreasing
to below the medium control concentration. This possibly indicates a leak or contamination
during sampling at 24 hour. In 136B.16 exp 2, ethanol was produced on the second day of
culture while pyruvate and acetate (but no lactate) were produced on both days; however,
glucose consumption did not appear to increase on the second day of culture. Ethanol, pyruvate
and acetate were also detected with isolate 136B.30 after 48 hours.
Isolates 136B.32, 136B.36, 136B.39 produced significantly more ethanol between 24 and 48
hours of culture, with 136B.32 and 136B.36 producing the highest concentrations, but only by
the second day. 136B.32 showed variability between the two experiments: exp 1 gave 4.3 g/L
(0.54 % v/v) of produced ethanol and exp 2 gave 11.69 g/L (1.48 %v/v), but only the latter
consumed all of the glucose in the medium. Isolate 136B.32 exp 1 also produced acetate after 48
hours, possibly reducing the pH and inhibiting growth, explaining the different profiles between
exp 1 and exp 2. Isolate 136B.36 was tested only once and consumed all of the glucose by the
second day of culture, producing 10.25 g/L of ethanol (1.3 % v/v) in total. Cultures of isolates
136B.1, 136B.7 exp 1 and 2, 136B.9, 136B.1, 136B.17 exp 2, 136B.20, 136B.30 exp 1 and 2,
136B.33 and 136B.38 performed worse than the parent strain TM242 and did not produce any
ethanol. Samples from 48-hour cultures of 136B.17, 136B.24, 136B.27, 136B.28 exp 1 and

142
136B.25 exp 2 were not analysed (i.e. tubes opened and significant culture volume was lost), but
apart from 136B.25 their glucose consumption and ethanol production after 24 hours suggested
a promising trend.
Figure 53 - Residual glucose (A) and total ethanol (B) concentrations in g/L at 24 and 48 hours of isolates from sample 136B in experiment 1 and experiment 2 (exp 1 and exp 2, respectively). Cultures were grown under fermentative conditions in 2SPY supplemented with 40 mM triple buffer, 200 μL antifoam, 27.4 g/L of glucose and16.1 g/L ethanol in exp 1 and 28.9 g/L glucose and 12.25 g/L ethanol in exp 2. Samples that registered concurrent glucose decrease and ethanol increase over the medium control are highlighted in yellow.
7.8 Analysis of 136B.32 Isolate 136B.32 exp 2 produced the highest quantity of ethanol after 48 hours of culture of the
136B group (11.6 g/L, 1.47 % v/v). Despite the differences observed between experiments 1 and
2, 136B.32 showed the potential to consume all of the glucose in the medium. Its ability to grow
and produce ethanol while being able to tolerate an initial inhibitory ethanol concentration was
further investigated. Three colonies from freshly streaked plates of TM242 and isolate 136B.32
were used to start 10 mL liquid cultures in 15 mL glass test tubes under fermentative conditions
in AE14 according to the protocol described in the Methods. This time, samples were taken after
24 and 72 hours of incubation from the same cultures (Figure 54).

143
Figure 54 - Residual glucose (A) and total ethanol (B) concentrations after 24 and 72 hours incubation of P. thermoglucosidasius TM242 and 136B.32 isolates under fermentative conditions in 2SPY supplemented with 26.6 g/L of glucose, 40 mM triple buffer, 200 μL antifoam and ethanol 14 g/L.
As observed with exp 2, the control strain TM242 did not show clear evidence of growth, even at
the initial sub-toxic concentrations of ethanol. However, isolate 136B.32 was clearly able to
consume more glucose than the parent strain TM242. Although there was some variability in the
initial growth of the cultures (consumed glucose 7.2 g/L, 1.2 g/L and 20.7 g/L), after 72 hours
incubation this variation had decreased (consumed glucose 12.7 g/L, 17 g/L and 23 g/L). A similar
profile was observed with ethanol production; concentrations of produced ethanol after 72
hours were 5.5 g/L, 7.5 g/L and 10.1 g/L (corresponding to 0.7 % v/v, 1 % v/v and 1.3 % v/v,
respectively). The two 136B.32 cultures that started growing on the first day also produced some
acetate (replicates 1 and 3); unfortunately UV analytical data was not available for the 72 hour
time points. Given that P. thermoglucosidasius NCIMB 11955 (and, presumably TM242) could
grow at 50 g/L glucose and that, according to the expected stoichiometry of ethanol production
from glucose, complete glucose metabolism would lead to toxic concentrations of ethanol, strain
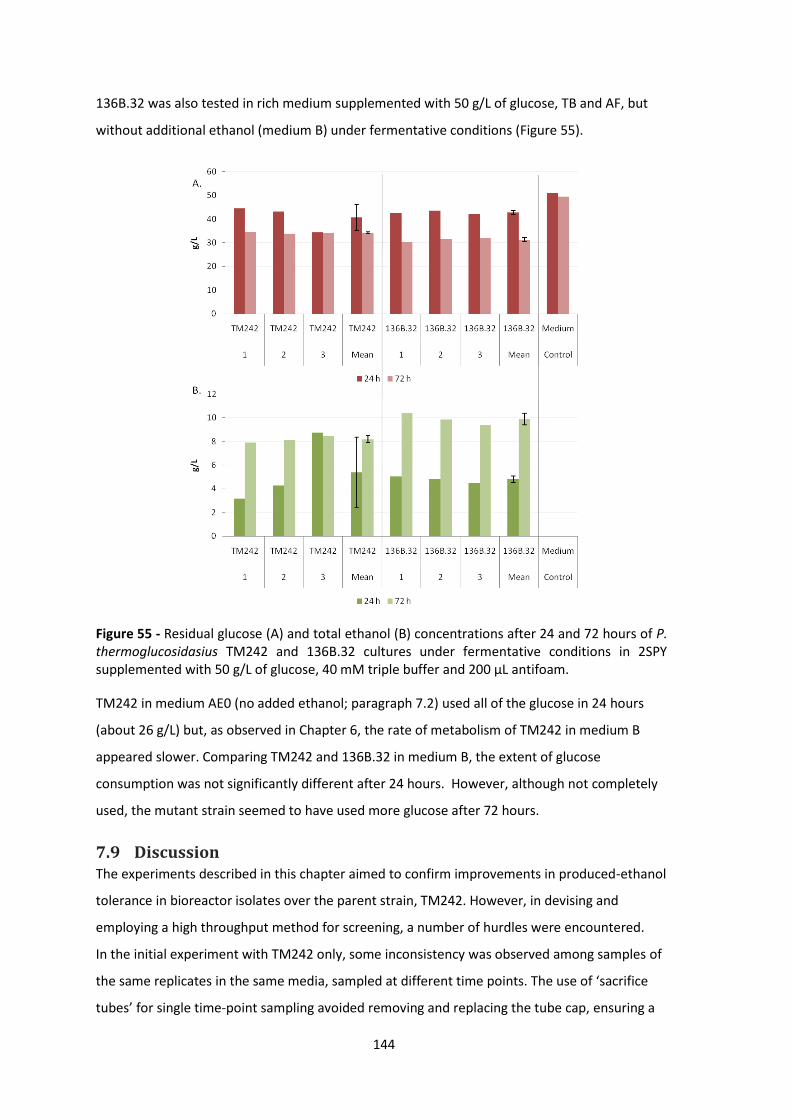
144
136B.32 was also tested in rich medium supplemented with 50 g/L of glucose, TB and AF, but
without additional ethanol (medium B) under fermentative conditions (Figure 55).
Figure 55 - Residual glucose (A) and total ethanol (B) concentrations after 24 and 72 hours of P. thermoglucosidasius TM242 and 136B.32 cultures under fermentative conditions in 2SPY supplemented with 50 g/L of glucose, 40 mM triple buffer and 200 μL antifoam.
TM242 in medium AE0 (no added ethanol; paragraph 7.2) used all of the glucose in 24 hours
(about 26 g/L) but, as observed in Chapter 6, the rate of metabolism of TM242 in medium B
appeared slower. Comparing TM242 and 136B.32 in medium B, the extent of glucose
consumption was not significantly different after 24 hours. However, although not completely
used, the mutant strain seemed to have used more glucose after 72 hours.
7.9 Discussion The experiments described in this chapter aimed to confirm improvements in produced-ethanol
tolerance in bioreactor isolates over the parent strain, TM242. However, in devising and
employing a high throughput method for screening, a number of hurdles were encountered.
In the initial experiment with TM242 only, some inconsistency was observed among samples of
the same replicates in the same media, sampled at different time points. The use of ‘sacrifice
tubes’ for single time-point sampling avoided removing and replacing the tube cap, ensuring a
145
similar low oxygen environment throughout the experiment, but also gave rise to inconsistent
growth rates among replicates, which is characteristic of working with this strain of P.
thermoglucosidasius. Because of the need to screen a large number of potential mutants this
approach was subsequently changed to repeated sampling (with a syringe) of Hungate-type glass
tubes through the rubber septum in the cap. While this was generally reliable, sampling risked
introducing a small amount of air and a small subset of samples showed evidence of this.
However, in the limited time available for screening of isolates at the end of this study, this
system was preferred because it allowed faster sample preparation and simpler management of
test tubes.
Similarly, because of the frequent variation between replicates only a single tube was tested for
each isolate, and potentially interesting strains then retested. Unfortunately (in retrospect)
standards for determining glucose and ethanol concentration were not run on the HPLC with
each set of analyses and, particularly as ethanol and glucose were being detected by RI, which is
known to be less sensitive than UV-absorbance detection (Swartz, 2010), this also led to some
analytical errors. For example, some samples showed an apparent small (25A.3, 25A.4, 25A.6
exp 2, 25A.14, 25A.17 exp 1 and 2, 25A.37, 96B.29, 120B.22, 136B.16 exp 2, 136B.30 exp 2 and
all three TM242 replicates in exp 2) or significant (25A.1, 25A.2 and 25A.10) increase in glucose
concentration after 48 hours, which is not possible. However, by determining the mass-balance
between ethanol produced and glucose used it was usually possible to identify erroneous
analyses. The only other reason for a low mass-balance would be the accidental introduction of
air, stimulating respiration rather than fermentation.
Other profiles were not so easy to interpret. For instance, in 120B.21 exp 1 the cultures
appeared to produce lactate and pyruvate as intermediate products, which were subsequently
converted to ethanol. The accumulation of pyruvate suggests that there may be some reduction
in metabolic flux to ethanol in this mutant, compared to TM242. Although TM242 is an ldh-
mutant it is still feasible to get lactate production through the catabolic lactate dehydrogenase
or the methylglyoxal pathway (Chandrangsu et al., 2014). TM242 has a methylglyoxal synthase
(WP_003249629.1) that synthesises methylglyoxal from dihydroxyacetone phosphate produced
during glycolysis, however only a putative glyoxalase III (WP_013401724.1) required to obtain D-
lactate was identified in the TM242 genome.
Notwithstanding, energetically, it would be surprising to see subsequent lactate conversion to
ethanol, particularly in the presence of glucose, as this conversion is redox neutral; although it
could produce 0.5 ATP for every lactate molecule metabolised. An alternative explanation could
be that the compound produced after 24 hours was in fact another glycolytic intermediate, and
146
not lactate. Given the problems of calibration previously referred to, particularly with reference
to the RI detector, it is possible that the ethanol and glucose concentrations after 48 hours were
over-estimated, meaning that more glucose was consumed and less ethanol was produced
between 24 hours and 48 hours and it is not essential to propose that the ethanol derives from
lactate.
Another example of profiles with difficult interpretation is isolate 120B.32: in this culture no
glucose consumption was observed but ethanol was apparently produced which seemed
contradictory (but could again be an issue with the RI detector). Moreover, on the second day of
incubation the culture was under aerobic conditions for an unknown number of hours, but no
ethanol concentration decrease was observed.
Isolates that showed an interesting phenotype in exp 1 were re-tested in exp 2, however the
same profile was not always observed. Moreover, the HPLC data highlighted that the media
composition differed slightly, with glucose being more concentrated in exp 2, and added ethanol
less concentrated (probably due to media preparation). When observed, dissimilarity between
samples was assessed by considering the best performing phenotype, on the basis that high
ethanol production and tolerance and glucose utilisation was unlikely to arise from physiological
variation.
The best performing mutants were from samples 25A and 136B. If adaptation was additive for
the desired phenotypes, the order of increasing ethanol tolerance of the samples should have
been 25A, 96B, 120B and 136B. However, only strains from samples 25A and 136B showed
appreciable increases in ethanol tolerance, while among all the isolates tested from 96B and
120B, only isolate 120B.38 seemed to show fermentative growth over 48 hours. Therefore, the
reliability of the data for 96B and 120B isolates as a true representation of the mutant
populations is questionable. It could be that the seed cultures from 96B and 120B were allowed
to grow for too long and, as a consequence, the subcultures in medium AE14 did not enter log
phase at all in the 48 hour experiment. Cultures containing antifoam appear cloudy so visual
cross-checking was not possible. However, for this explanation to be true it would have to apply
to all 29 samples across two experiments, which is unlikely.
Despite the acknowledged problems of reproducibility and lack of regular analysis of standards
on the HPLC they do not adequately explain the lack of variation in profiles from cultures 96B
and 120B in exp 1 and 2 (particularly compared to the high variation observed in 25A and 136B)
or the absence of visible TM242 growth in exp 2. Time constraints made retesting unfeasible;
therefore, the data from 96B and 120B and replicates in medium AE14 were not considered
reliable or useful and so were discounted from further analyses. Future studies should reassess

147
these isolates, as the development of mutations during the directed evolution experiment
should be informative. In order to gain a more accurate description of isolates it is suggested
that future studies should also employ replicates.
Results obtained with the bioreactor defined a baseline for TM242 ethanol tolerance that was
broadly confirmed in the initial test with tubes. In the first bioreactor experiment it was shown
that the maximum ethanol concentration that TM242 pdnaQH207L was able to tolerate while
consuming all of the sugar in the medium was 14.94 g/L (1.89 % v/v), while glucose started to
accumulate when ethanol reached 16.28 g/L (2 % v/v). The test of strain TM242 described in this
chapter showed that the presence of ethanol in the medium from the start of the culture
highlighted some phenotypic variability in samples where between 7 g/L and 21 g/L (0.88 % v/v –
2.66 % v/v) ethanol was added. However, in these cultures ethanol toxicity was observed when
ethanol concentration reached about 17.7 g/L (2.24 % v/v) and glucose was no longer
consumed. Above these values a clear toxic effect was generally observed, in fact in cultures
grown in AE21, AE28, AE35 glucose consumption was minimal.
In the third bioreactor experiment it was shown that above 26.5 g/L (3.36 % v/v) of ethanol,
glucose started to accumulate, defining a new toxicity threshold for P. thermoglucosidasius. This
concentration was never reached in the cultures tested in tubes. The maximum concentration of
ethanol recorded was 23.93 g/L (3.03 % v/v) (by isolate 136B.32 exp 2 after 48 hours), for all
other samples, toxicity was reached at lower concentrations. While some of the mutant strains
are clearly more tolerant to ethanol than TM242 when compared under the same conditions,
there is an evident difference in tolerance of strains under the different growth conditions used.
A possible explanation could be that under chemostat growth conditions a fixed redox potential
was maintained and, where the redox dropped, ethanol tolerance appeared to decrease. In test
tubes there was no control over redox values which would have continued dropping as growth
and ethanol production continued. Thus the ethanol tolerance observed in tubes might have
represented the tolerance under the final redox conditions attained.
Excluding 96B and 120B cohorts and following the rule of the best performing phenotype, 25A
and 136B isolates profiles can be divided into four groups (Figure 56). Ethanol and glucose
concentrations of isolates in group 1 were similar to those of the original medium. Group 2
produced more ethanol than the medium control but did not appear to consume more glucose
or produce more ethanol than TM242. Group 3 produced more ethanol than TM242 but seemed
to consume less glucose. Group 4 contained the isolates of most interest for taking forward, that
produced more ethanol and consumed more glucose than TM242 in 48 hours.
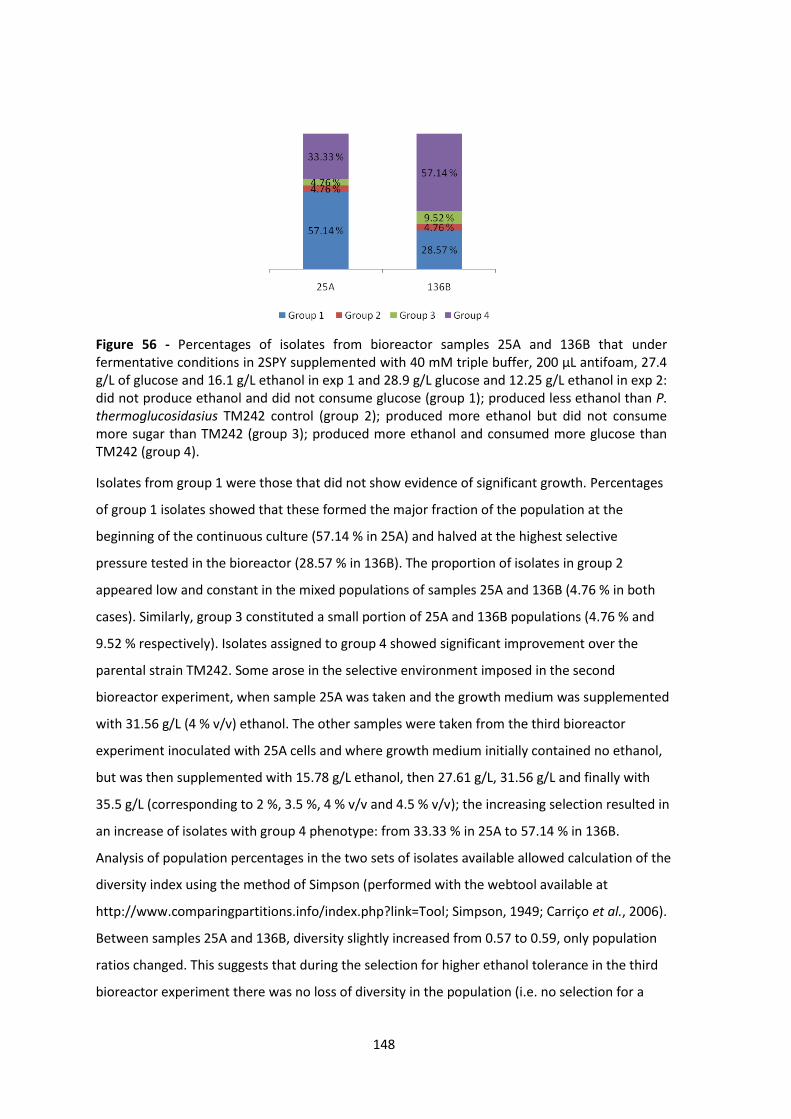
148
Figure 56 - Percentages of isolates from bioreactor samples 25A and 136B that under fermentative conditions in 2SPY supplemented with 40 mM triple buffer, 200 μL antifoam, 27.4 g/L of glucose and 16.1 g/L ethanol in exp 1 and 28.9 g/L glucose and 12.25 g/L ethanol in exp 2: did not produce ethanol and did not consume glucose (group 1); produced less ethanol than P. thermoglucosidasius TM242 control (group 2); produced more ethanol but did not consume more sugar than TM242 (group 3); produced more ethanol and consumed more glucose than TM242 (group 4).
Isolates from group 1 were those that did not show evidence of significant growth. Percentages
of group 1 isolates showed that these formed the major fraction of the population at the
beginning of the continuous culture (57.14 % in 25A) and halved at the highest selective
pressure tested in the bioreactor (28.57 % in 136B). The proportion of isolates in group 2
appeared low and constant in the mixed populations of samples 25A and 136B (4.76 % in both
cases). Similarly, group 3 constituted a small portion of 25A and 136B populations (4.76 % and
9.52 % respectively). Isolates assigned to group 4 showed significant improvement over the
parental strain TM242. Some arose in the selective environment imposed in the second
bioreactor experiment, when sample 25A was taken and the growth medium was supplemented
with 31.56 g/L (4 % v/v) ethanol. The other samples were taken from the third bioreactor
experiment inoculated with 25A cells and where growth medium initially contained no ethanol,
but was then supplemented with 15.78 g/L ethanol, then 27.61 g/L, 31.56 g/L and finally with
35.5 g/L (corresponding to 2 %, 3.5 %, 4 % v/v and 4.5 % v/v); the increasing selection resulted in
an increase of isolates with group 4 phenotype: from 33.33 % in 25A to 57.14 % in 136B.
Analysis of population percentages in the two sets of isolates available allowed calculation of the
diversity index using the method of Simpson (performed with the webtool available at
http://www.comparingpartitions.info/index.php?link=Tool; Simpson, 1949; Carriço et al., 2006).
Between samples 25A and 136B, diversity slightly increased from 0.57 to 0.59, only population
ratios changed. This suggests that during the selection for higher ethanol tolerance in the third
bioreactor experiment there was no loss of diversity in the population (i.e. no selection for a
149
limited number of genotypes) but a significant increase in the proportions of isolates that
performed better than the parent strain TM242.
Among 136B isolates, 136B.32 and 136B.36 performed better than the others. Analysis of
136B.32 in AE14 showed that biological variability was high on the first day of culture in test
tubes, but decreased significantly after three days (i.e. either the lag phase or rate of growth
varied, but the end point did not). In this experimental settings there was an increase of 7.36 g/L
(0.93 % v/v) in ethanol production and a tenfold increase in glucose consumption over TM242
(i.e. 17.59 g/L against 1.73 g/L). This observation suggested that in tubes, cells may be able to
tolerate higher ethanol concentrations by growing more slowly. Therefore, as with the initial test
with TM242 only, the experiment with the isolates from the bioreactor samples should also have
been monitored for 72 hours instead of 48 hours only. Analysis of end-point results would have
allowed a more informative comparison of screened isolates in terms of total glucose
consumption and ethanol production.
Both TM242 and 136B.32 were able to grow in medium B. However, comparison of the
behaviour of TM242 grown in the presence of 26 g/L glucose (described at paragraph 7.2) with
Figure 55, shows that cultures in medium B suffered considerable inhibition. In 24 hours, only 10
g/L of 50 g/L glucose in the medium was fermented into ethanol, while all 30 g/L glucose was
consumed in the experiment with medium A. The cultures in medium B appeared to stop
growing at ethanol concentrations that were lower than the expected toxic value, and
metabolised only 20 g/L of glucose after 72 hours, so the concentration of acetate produced
should be less and therefore less toxic than that normally found in TM242 cultures in medium A.
In fact, in the first 24 hours, acetate was produced in higher quantities in the experiment with
medium A than that with medium B (data not shown), however this did not affect ethanol
production in medium A. Therefore, a factor unrelated to pH drop caused by acetate must have
inhibited cultures in medium B. Although cultures in medium B were clearly suffering from
glucose toxicity, the fact that both TM242 and 136B.32 grew to an equivalent extent in the first
24 hours showed that this, alone, did not result in the cessation of growth. However, as the
remaining glucose on the cessation of growth was bordering on toxicity, it could be that the
combined stress of sub-toxic ethanol and sub-toxic glucose resulted in inhibition. The possibility
of tolerance of these mutants to more than one stress would be interesting to investigate
further.
After a thorough evaluation of available data gathered from the devised high throughput
screening system in the limited time available, the selection of valid data confirmed that many
isolates from the 25A and 136B samples showed improvements over the parent strain TM242.
150
Time constraints limited the amount of problem solving that could be done at this stage in the
project. Nevertheless, the application of GREACE to continuous evolution in chemostat culture
had successfully achieved the primary aim of generating mutants with an improved ethanol
tolerance, a phenotype which was sought but not achieved by TMO Renewables (Ibenegbu,
personal communication). Unfortunately, low reliability of samples 96B and 120B did not permit
capture of the process of increasing resistance throughout the continuous evolution experiment
using GREACE. However, genomes of relevant isolates from samples 25A and 136B were
available for analyses to identify genetic features that potentially contributed to the desired
phenotypes.
151
Chapter 8
Analysis of sequenced genomes of evolved strains
8.1 Introduction The identification of genes or regulatory elements involved in the elicitation of complex
phenotypes has traditionally been limited by prior knowledge based on physiological studies of
stressed strains (e.g. osmoregulation, solvent stress, etc.). Studies on ethanol stressed cells have
repeatedly found that this solvent affects the cell membrane, causing excessive fluidity. The
most commonly observed adaptation was a change in cell membrane lipid composition and
membrane protein organisation (Ingram, 1989; Burdette et al., 2002; Liu and Qureshi, 2009; Luo
et al., 2009). Disruption of cell membranes cause ion leakage and protein denaturation, which
disrupts cell metabolism and homeostasis. Ethanol tolerance has been mainly studied in E. coli
and ethanol producing species (e.g. Z. mobilis and S. cerevisiae) (Ingram, 1989; Luo et al., 2009;
Liu and Qureshi, 2009). Recently, however, knowledge of complex phenotypes such as ethanol
tolerance, has advanced significantly through the unbiased analysis of tolerant strains using
“omic” approaches (e.g. from genome, transcriptome, metabolome or proteome analyses),
providing a system level understanding (Horinouchi et al., 2018).
Characterising genome-wide variants of stress-adapted strains using next generation sequencing
has accelerated the standard workflow making the search for underlying mechanisms less time
consuming and more precise. The genotype-to-phenotype association still needs verification, in
order to discern mutations which contribute to the studied trait or identify mutated genes which
have not previously been characterised (Horinouchi et al., 2018). The variant characterisation is
important for reverse engineering strains in order to obtain robust microbial cell factories.
The mechanism by which P. thermoglucosidasius adapts to high ethanol concentrations has not
previously been reported. As a preliminary study before further “omic” analyses, whole-genome
sequencing of selected ethanol adapted strains (i.e. obtained from the bioreactor experiments
and further tested in separate cultures under fermentative conditions) was performed.
8.2 Analysis of the genomes of ethanol-tolerant 25A and 136B isolates The genomes of isolates from samples 25A and 136B that had shown the ability to ferment
glucose in rich medium under anaerobic conditions in the presence of exogenously added
ethanol (as described in Chapter 7) were sequenced. The aim of the analysis was to retrieve
information about the genetic basis of this complex phenotype of industrial interest, which may
subsequently be used for strain construction.
152
Isolates from samples 96B and 120B were not considered for analysis as, despite the fact that
the associated cultures were growing in the bioreactor in the presence of toxic levels of ethanol
this phenotype could not be demonstrated in the test tube experiments described in Chapter 7.
It is recommended that these test tube experiments are repeated to add to the analyses
presented in this chapter.
Among the 25A and 136B groups, almost all of the isolates that showed a significant increase of
ethanol production and glucose consumption over the TM242 controls were analysed (25A
isolates 7, 9, 15, 24, 31, 33, 35; 136B isolates 3, 10, 13, 16, 18, 24, 27, 28, 30, 32, 36, 39). Isolates
were sequenced alongside the TM242 progenitor strain in a single batch as described in
Methods (paragraph 2.3.2). The NCBI deposited genome sequence for P. thermoglucosidasius
TM242 (the chromosome and the mega-plasmids pNCI001 and pNCI002, accession numbers
NZ_CP016916, NZ_CP016917 and NZ_CP016918, respectively) was used as reference. Analysis of
variants was performed using the genome sequence version with updated annotation
(NZ_CP016916.1, NZ_CP016917.1 and NZ_CP016918.1 from the end of December 2019).
Deletions and base substitutions were observed in the chromosome and in the mega-plasmids,
while insertions were present in the chromosome only. Silent mutations were excluded from
analysis, the remaining positions were divided into two groups: group 1 comprised all the
mutations located in non-CDS sequences (i.e. conveniently flagged by the VarScan analysis
performed by MicrobesNG), the rest were allocated to group 2.
8.3 Analysis of mutations in non-coding sequences To retrieve information about the significance of intergenic mutations (group 1), a customised
computational analysis was performed (script written in Microsoft Visual Foxpro by Marzio
Ortenzi, 2020). The TM242 protein table was downloaded from NCBI (
https://www.ncbi.nlm.nih.gov/genome/browse/#!/proteins/2405/280600%7CParageobacillus%
20thermoglucosidasius/chromosome/). The table contained start and stop positions and strand
orientations of all CDSs, protein names, locus tags and accession numbers of all TM242 proteins.
From the start and stop positions of all genes, all the intervals between genes were retrieved. All
intervals that contained mutations of group 1 were selected and their length calculated.
Genome-wide promoter prediction was impossible to perform in the limited time available,
primarily because of the variable distance of promoters from the start codon. It was, therefore,
decided to look for mutations close to the CDS, which might involve regulating elements such as
RBSs or terminators. It is, therefore, unknown whether selected mutations are also involved
transcription initiation. The relative distances of mutations from the upstream and downstream
genes were calculated. Mutations located in intergenic spaces positioned up to 60 bp before or
153
after genes were selected and information on the flanking genes retrieved; these mutations
could affect translation initiation (in RBSs) or transcription termination, respectively
(Huttenhofer and Noller, 1994; Mitra et al., 2011). Mutations proximal to the start of CDSs were
recognised as putatively involved in the regulation of first genes of operons by the calculation of
the distance from the next in cis gene (maximum distance 50 bp). Intergenic intervals shorter
than 50 bp were analysed as putative RBSs of polycistronic mRNAs. Mutations in putative
terminators were considered to possibly affect RNA polymerase read-through and so to impact
expression of the downstream genes rather than their cognate gene (Wade and Grainger, 2014).
This pervasive transcription can affect many in cis and in trans genes downstream of terminators
(Nicolas et al., 2012), however for simplicity only the first in cis gene after mutations in putative
terminators was considered for analysis.
Considering the mutations in all strains together, 55 mutations accorded to the described
criteria, with 61 located on the chromosome, one on the mega-plasmid pNCI001; 27 were in
putative RBSs of which seven were located in operons, 27 were in putative terminators and one
was in a CRISPR array. Thirteen variants were found in the laboratory strain that differed from
the deposited TM242 sequence, possibly indicating heterogeneity in the parental initial TM242
culture. However the variants found in the sequenced laboratory strain were considered as the
true reference alleles during analyses because sequenced isolates were derivatives of the
laboratory strain. It was noticed that, in some 25A and 136B isolates, some of these alleles
appeared to be the same as the version registered on NCBI. This phenomenon was observed in
the putative RBS of ISL3 transposase (WP_073519223.1), in the sequence between -130 and -62
upstream of a tyrosine-type recombinase/integrase (WP_052518158.1) and in the terminator of
an IS110 family transposase (WP_042383568.1). Despite not fitting the distance criteria for
intergenic sequence analysis described above, the seven mutations upstream of the tyrosine-
type recombinase/integrase (WP_052518158.1) were still considered for analysis, as this site
and others were a mutation hotspot. The putative RBS of ISL3 family transposase showed
mutations in five different positions within the 60 bp upstream of the ATG in the ethanol
tolerant strains. These mutations were more present in 25A isolates in different combinations,
however one 25A strain and three 136B strains showed all five mutations at once. Twenty
mutations in 25A isolates were strain specific, while 18 mutations were found at the same
position in two or more 25A genomes. Of these 18 early mutations, only ten were maintained
and were also found in 136B isolates, however not always mutations were 100 % penetrant. In
136B isolates, eight mutations appeared late and were found in all strains. Only six mutations in
136B isolates were strain specific.
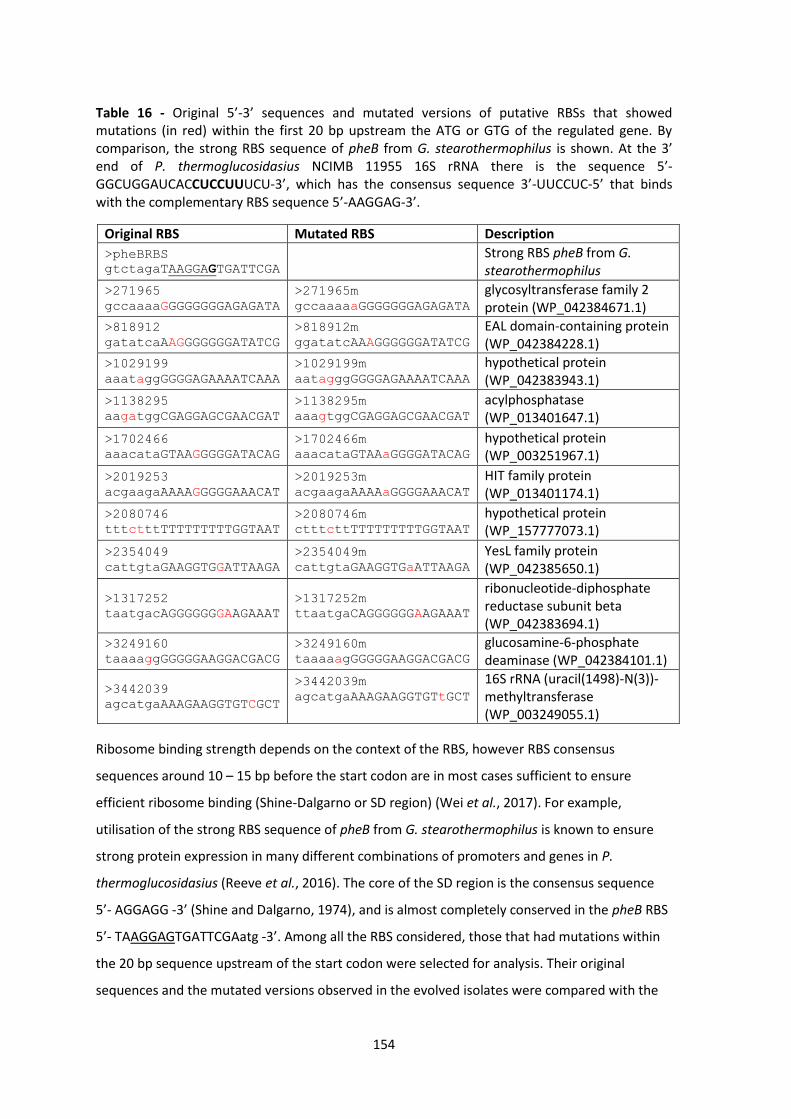
154
Ribosome binding strength depends on the context of the RBS, however RBS consensus
sequences around 10 – 15 bp before the start codon are in most cases sufficient to ensure
efficient ribosome binding (Shine-Dalgarno or SD region) (Wei et al., 2017). For example,
utilisation of the strong RBS sequence of pheB from G. stearothermophilus is known to ensure
strong protein expression in many different combinations of promoters and genes in P.
thermoglucosidasius (Reeve et al., 2016). The core of the SD region is the consensus sequence
5’- AGGAGG -3’ (Shine and Dalgarno, 1974), and is almost completely conserved in the pheB RBS
5’- TAAGGAGTGATTCGAatg -3’. Among all the RBS considered, those that had mutations within
the 20 bp sequence upstream of the start codon were selected for analysis. Their original
sequences and the mutated versions observed in the evolved isolates were compared with the
Table 16 - Original 5’-3’ sequences and mutated versions of putative RBSs that showed mutations (in red) within the first 20 bp upstream the ATG or GTG of the regulated gene. By comparison, the strong RBS sequence of pheB from G. stearothermophilus is shown. At the 3’ end of P. thermoglucosidasius NCIMB 11955 16S rRNA there is the sequence 5’- GGCUGGAUCACCUCCUUUCU-3’, which has the consensus sequence 3’-UUCCUC-5’ that binds with the complementary RBS sequence 5’-AAGGAG-3’.
Original RBS Mutated RBS Description
>pheBRBS
gtctagaTAAGGAGTGATTCGA
Strong RBS pheB from G. stearothermophilus
>271965
gccaaaaGGGGGGGGAGAGATA
>271965m
gccaaaaaGGGGGGGAGAGATA
glycosyltransferase family 2 protein (WP_042384671.1)
>818912
gatatcaAAGGGGGGGATATCG
>818912m
ggatatcAAAGGGGGGATATCG
EAL domain-containing protein (WP_042384228.1)
>1029199
aaataggGGGGAGAAAATCAAA
>1029199m
aatagggGGGGAGAAAATCAAA
hypothetical protein (WP_042383943.1)
>1138295
aagatggCGAGGAGCGAACGAT
>1138295m
aaagtggCGAGGAGCGAACGAT
acylphosphatase (WP_013401647.1)
>1702466
aaacataGTAAGGGGGATACAG
>1702466m
aaacataGTAAaGGGGATACAG
hypothetical protein (WP_003251967.1)
>2019253
acgaagaAAAAGGGGGAAACAT
>2019253m
acgaagaAAAAaGGGGAAACAT
HIT family protein (WP_013401174.1)
>2080746
tttctttTTTTTTTTTGGTAAT
>2080746m
ctttcttTTTTTTTTTGGTAAT
hypothetical protein (WP_157777073.1)
>2354049
cattgtaGAAGGTGGATTAAGA
>2354049m
cattgtaGAAGGTGaATTAAGA
YesL family protein (WP_042385650.1)
>1317252
taatgacAGGGGGGGAAGAAAT
>1317252m
ttaatgaCAGGGGGGAAGAAAT
ribonucleotide-diphosphate reductase subunit beta (WP_042383694.1)
>3249160
taaaaggGGGGGAAGGACGACG
>3249160m
taaaaagGGGGGAAGGACGACG
glucosamine-6-phosphate deaminase (WP_042384101.1)
>3442039
agcatgaAAAGAAGGTGTCGCT
>3442039m
agcatgaAAAGAAGGTGTtGCT
16S rRNA (uracil(1498)-N(3))-methyltransferase (WP_003249055.1)
155
pheB RBS (Table 16). This comparison showed that, apart from a RBS with mutation at position
2080746, the only conserved base in these sequences was a G at position -9 relative to the start
codon and that this base was not changed in the mutated RBSs; none of the mutations increased
similarity to the strong pheB RBS consensus sequence.
The SD sequence in the RBS positions the 16S rRNA of the ribosomal 30S subunit on the mRNA
to initiate translation. Difference from the consensus sequence and variable distance from the
start codon can influence the efficiency of translation intitiation. However, complementarity of
the anti-Shine-Dalgarno (ASD) on the 16S rRNA and SD sequence on the mRNA is not the only
factor ensuring correct positioning on the RBS (Salis, 2011). In some genes, other mRNA features
(i.e. low level of mRNA structures and A-rich sequence enrichment upstream of the start codon)
may compensate for the effect of poor ASD-SD pairing (Saito et al., 2020). Therefore it is likely
that mutations outside of the SD sequences still affect translation initiation. Table 17 shows
mutations that were shared by all or most of the 136B isolates. The mutation at position
2530133 was located in a CRISPR array (CP016916_7, between 2,529,363 bp and 2,531,597 bp,
composed of 33 spacers alternating with a repeat sequence
TTTTATCTTACCTATAAGGAATTGAAAC). However, a nucleotide Blast search of the spacer
AGAACACCAGCAATAAATGATTCCCCCGGCGAACAA where the mutation was located, excluding
the taxonomy ID Parageobacillus (taxid:1906945), did not find any similarities with deposited
sequences. Specific analyses to verify the nature of all regulatory elements were not carried out.
Therefore the effect of mutations found in putative RBSs, terminators, and the CRISPR array on
gene expression regulation is unknown.
The nucleotide FASTA sequences of the genes whose expression was thought to be altered by
mutation were downloaded from NCBI (script written by Marzio Ortenzi, 2020) and uploaded on
the functional annotation webtool EggNOG Mapper (available at http://eggnog-
mapper.embl.de/; Huerta-Cepas et al., 2017). Ortholog annotations were transferred from the
Geobacillus genus (not updated to Parageobacillus). Identical results were obtained using an
enlarged pool comprising all species of the Bacilli class deposited in the EggNog database. Genes
were assigned to COG categories (Clusters of Orthologous Groups; Tatusov et al., 2000).
Hypothetical proteins were not identified at all by EggNog Mapper and were therefore manually
labelled as ‘Hp’; for all other proteins a brief description was given by EggNog, however for a
considerable number of proteins the function was not unequivocally assigned and these were
grouped under category S (unknown function). Protein descriptions generated by EggNOG
Mapper are the result of repeated terminology search among Gene Ontology (GO) terms, KEGG
pathways or Smart or Pfam protein domains of their orthologous groups, however their function

156
is not specified when functional annotation of orthologs is missing (Tatusov et al., 2000; Jensen
et al., 2008). Proteins with mixed function or whose annotation could not be automatically
differentiated were assigned to more than one category (i.e. with multiple-letter abbreviations,
later manually tagged as ‘mixed’). The number of mutations in intragenic regulatory sequences
assigned by the COG categories of different gene products are shown in Figure 57. The number
of mutations in regulatory elements of genes involved in ‘information storage and processing’ (in
blue shades in Figure 57), was biased towards ‘replication, recombination and repair’ (L) that
was higher in 25A isolates than in 136B, while translation remained poorly represented in both
groups. ‘Cellular process and signalling’ and ‘metabolism’ categories (in red and green shades in
Figure 57, respectively) slightly increased in the 136B isolates. ‘Poorly characterised’ and
‘unclassified’ (in purple and orange shades in Figure 57) had a higher number of mutations in
136B strains than in 25A.
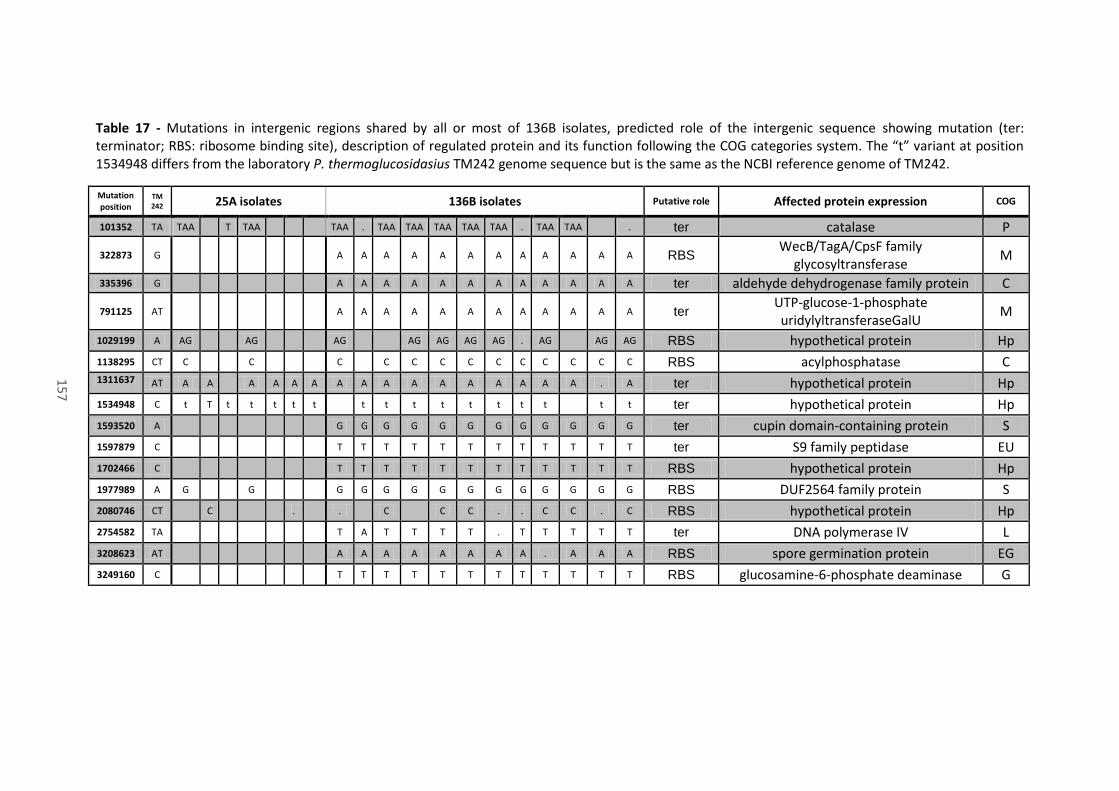
157
Table 17 - Mutations in intergenic regions shared by all or most of 136B isolates, predicted role of the intergenic sequence showing mutation (ter: terminator; RBS: ribosome binding site), description of regulated protein and its function following the COG categories system. The “t” variant at position 1534948 differs from the laboratory P. thermoglucosidasius TM242 genome sequence but is the same as the NCBI reference genome of TM242.
Mutation position
TM242 25A isolates 136B isolates Putative role Affected protein expression COG
101352 TA TAA
T TAA
TAA . TAA TAA TAA TAA TAA . TAA TAA
. ter catalase P
322873 G
A A A A A A A A A A A A RBS WecB/TagA/CpsF family
glycosyltransferase M
335396 G
A A A A A A A A A A A A ter aldehyde dehydrogenase family protein C
791125 AT
A A A A A A A A A A A A ter UTP-glucose-1-phosphate uridylyltransferaseGalU
M
1029199 A AG
AG
AG
AG AG AG AG . AG
AG AG RBS hypothetical protein Hp
1138295 CT C
C
C
C C C C C C C C C C RBS acylphosphatase C 1311637 AT A A
A A A A A A A A A A A A A A . A ter hypothetical protein Hp
1534948 C t T t t t t t
t t t t t t t t
t t ter hypothetical protein Hp
1593520 A
G G G G G G G G G G G G ter cupin domain-containing protein S
1597879 C
T T T T T T T T T T T T ter S9 family peptidase EU
1702466 C
T T T T T T T T T T T T RBS hypothetical protein Hp
1977989 A G
G
G G G G G G G G G G G G RBS DUF2564 family protein S
2080746 CT
C
.
.
C
C C . . C C . C RBS hypothetical protein Hp
2754582 TA
T A T T T T . T T T T T ter DNA polymerase IV L
3208623 AT
A A A A A A A A . A A A RBS spore germination protein EG
3249160 C
T T T T T T T T T T T T RBS glucosamine-6-phosphate deaminase G
15
7
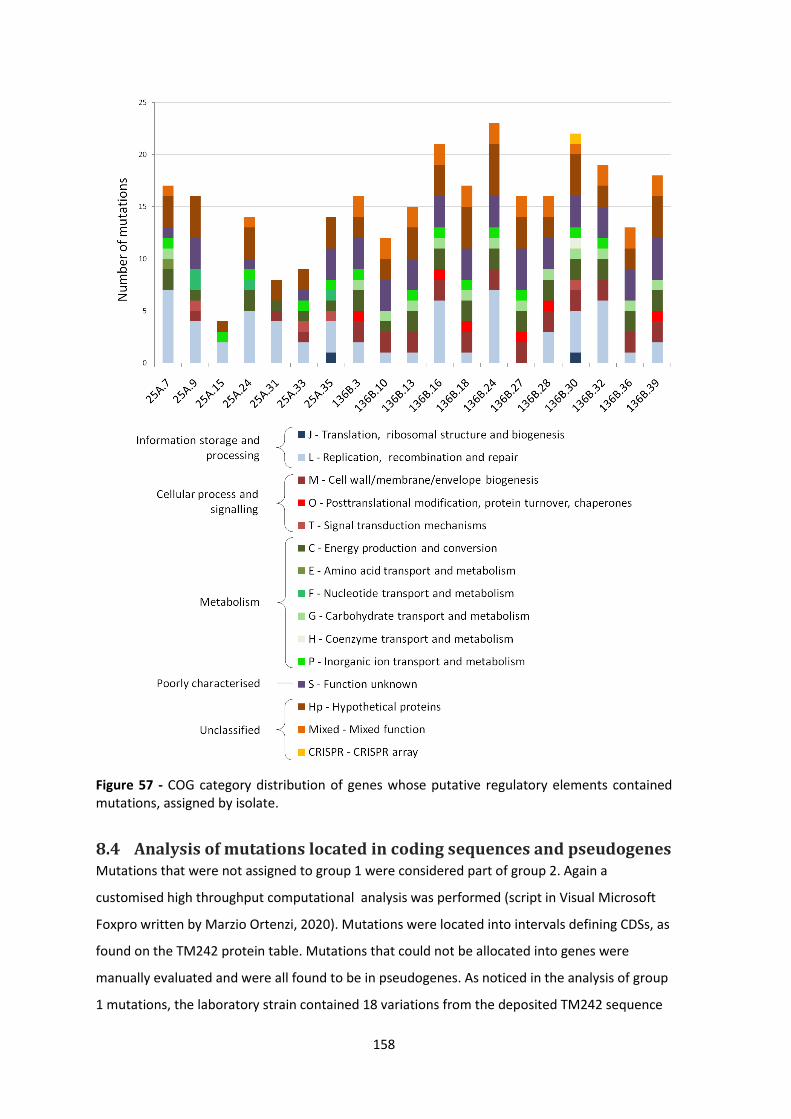
158
Figure 57 - COG category distribution of genes whose putative regulatory elements contained mutations, assigned by isolate.
8.4 Analysis of mutations located in coding sequences and pseudogenes Mutations that were not assigned to group 1 were considered part of group 2. Again a
customised high throughput computational analysis was performed (script in Visual Microsoft
Foxpro written by Marzio Ortenzi, 2020). Mutations were located into intervals defining CDSs, as
found on the TM242 protein table. Mutations that could not be allocated into genes were
manually evaluated and were all found to be in pseudogenes. As noticed in the analysis of group
1 mutations, the laboratory strain contained 18 variations from the deposited TM242 sequence
159
that appeared in two CDSs: two were observed in the ISL3 family transposase
(WP_073519223.1) already mentioned among group 1 hotspots, the other 16 were in a DUF3221
domain-containing protein (WP_073519229.1). It was noticed that these genes were covered by
a low number of reads (< 20), possibly because of interference with similar genes. A BLASTn
search (Gertz et al., 2006) showed that the ISL3 family transposase (WP_073519223.1) shares
99.33 % identity with another ISL3 family transposase (WP_065868237.1) on the chromosome,
and the DUF3221 domain-containing protein (WP_073519229.1) shares 100 % identity with a
DUF3221 domain-containing protein (WP_008881771.1) on pCNI002. However, the fidelity of
sequencing is ensured by reads covering these sequences and the flanking regions. As with the
group 1 mutations, the laboratory strain was considered as the progenitor for assessment of
evolved strains. Sequence analysis showed that some of alleles in the mutant strains had
retained or reverted to the version registered on NCBI.
Excluding silent mutations, a total of 255 mutations were observed in CDS, 15 in pseudogenes,
116 in intergenic regions and one in a CRISPR array. From a total of 270 mutations, only three
were found on pCNI001 and six were on pCNI002, the remaining 261 were on the chromosome.
More than 140 mutations in the 25A genomes were strain specific or shared by two or more
strains but were later lost (either not present or not common in strains selected at increasing
concentrations of ethanol), while only 23 were single representatives in 136B isolates. Twenty-
seven mutations that appeared early (i.e. were found in a few 25A strains) were enriched in
136B isolates, while among mutations that occurred late (i.e. were found exclusively in 136B
isolates), 32 were shared by all 136B isolates and 25 were not 100 % penetrant. Fifteen
mutations were found in pseudogenes. Table 18 shows highly penetrant mutations in CDSs and
pseudogenes that occurred late in continuous culture under ethanol stress or appeared early
and were enriched in all or most of the 136B isolates. Out of 84 mutations, 38 caused a frame
shift, two the gain of a stop codon and 44 were substitutions. CDS nucleotide sequences of all
genes that were mutated were downloaded from NCBI (script written in Bash language by Dr
Andrea Gori, University College London, 2020) and genes in FASTA format uploaded onto
EggNog Mapper for automated functional annotation. The (Para)Geobacillus genus and the
Bacilli class were used as ortholog groups, but the two analyses assigned proteins to the same
functional categories. Again, three undefined categories (i.e. ‘Hp’, ‘Mixed’ and ‘Pseudogene’)
were adopted. Figure 58 shows the COG category distribution of mutations allocated to genes or
pseudogenes assigned to each 136B isolate.
160
Comparing all isolate sequences, it was noticed that some genes had single mutations at
different positions in two or more strains, while in a few cases, multiple mutations were
observed in a single gene in the same genome. These genes (the number of mutations in the
same or different strain and the COG category) were aldehyde dehydrogenase family protein
(two mutations, WP_003247795.1, C), DNA-directed RNA polymerase subunit β' rpoC (two
mutations, WP_013399827.1, K), DHH family phosphoesterase (two mutations,
WP_003253850.1, T), ABC transporter substrate-binding protein (two mutations,
WP_042385428.1, E), YheC/YheD family protein (two mutations, WP_003252573.1, HJ - Mixed),
2'-5' RNA ligase family protein (two mutations, WP_003252271.1, J), carbon-nitrogen hydrolase
family protein (two mutations, WP_013400891.1, S), hypothetical protein (four mutations,
WP_157776780.1, Hp), transcription elongation factor GreA (two mutations, WP_003248973.1,
K), 3-phosphoserine/phosphohydroxythreonine transaminase serC (two mutations,
WP_003252557.1, E), ABC transporter permease (two mutations, WP_003248754.1, P), acetoin
utilization protein AcuC (two mutations, WP_003248593.1, BQ - Mixed), MerR family
transcriptional regulator (three mutations, WP_042385864.1, K) and the hotspots ISL3 family
transposase (six mutations, WP_073519223.1, L), DUF3221 domain-containing protein (18
mutations, WP_073519229.1, S).
The three mutations in the MerR family transcriptional regulator (WP_042385864.1) on plasmid
pCNI002 were observed in all 136B isolates. Acetoin utilization protein AcuC was classified as BQ.
Category B refers to ‘chromatin structure and dynamics’ and is therefore, not likely to be
relevant here. However AcuC has a class I histone deacetylase –like domain and this may have
influenced automatic assignment to category B(Q) by EggNog Mapper (Grundy et al., 1993;
Gardner and Escalante-Semerena, 2009).
The distribution of functional categories of mutated CDSs and pseudogenes followed a different
pattern from that of regulatory elements. ‘Poorly characterised’ or ‘unclassified’ proteins
remained constant between the two sets of isolates, while all the other categories had
increased representation in 136B compared to 25A, in particular ‘information storage and
processing’ and ‘cellular process and signalling’ categories. Overall, COG categories that were
significantly enriched between samples 25A and 136B were K (transcription), E (amino acid
transport and metabolism) and the undefined category of genes with mixed function (mixed).
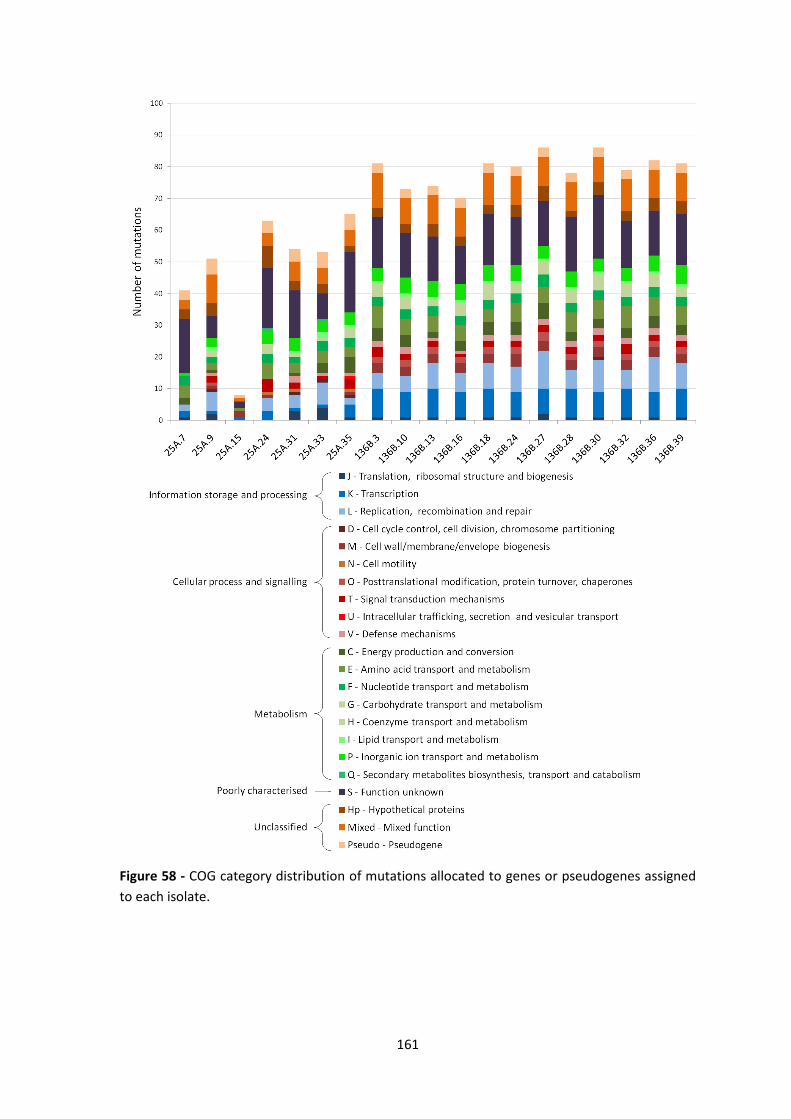
161
Figure 58 - COG category distribution of mutations allocated to genes or pseudogenes assigned
to each isolate.
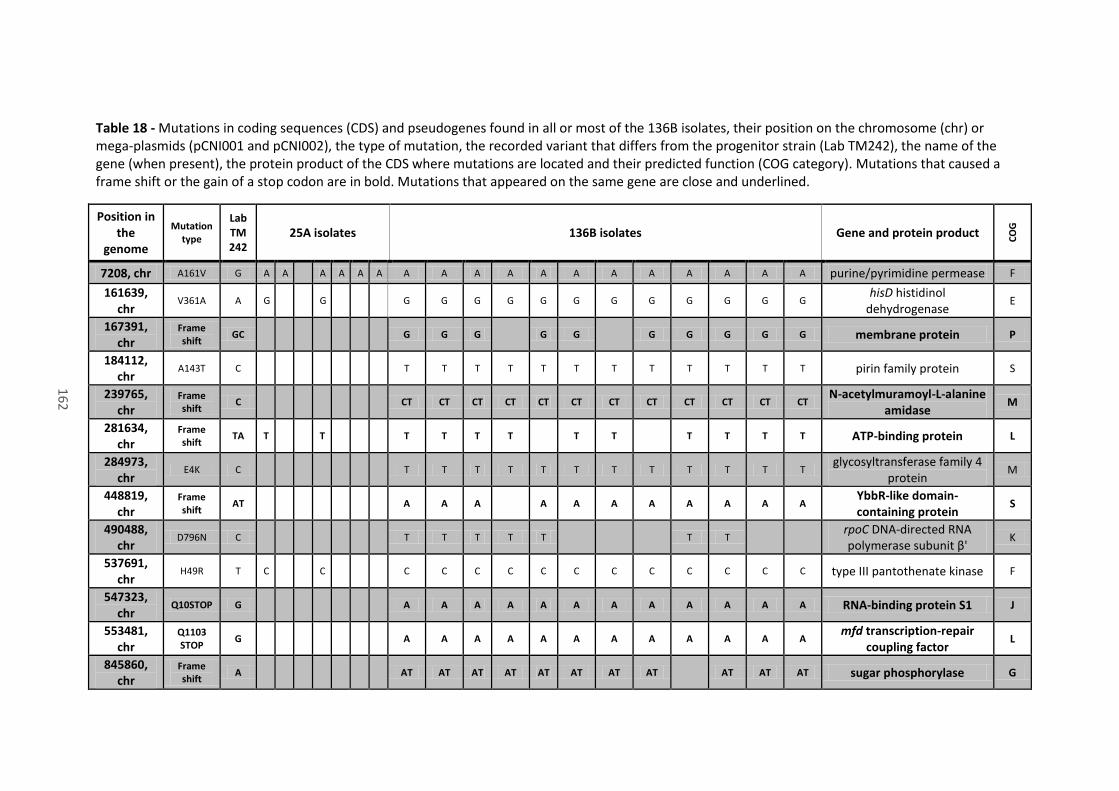
162
Table 18 - Mutations in coding sequences (CDS) and pseudogenes found in all or most of the 136B isolates, their position on the chromosome (chr) or mega-plasmids (pCNI001 and pCNI002), the type of mutation, the recorded variant that differs from the progenitor strain (Lab TM242), the name of the gene (when present), the protein product of the CDS where mutations are located and their predicted function (COG category). Mutations that caused a frame shift or the gain of a stop codon are in bold. Mutations that appeared on the same gene are close and underlined.
Position in the
genome
Mutation type
Lab TM 242
25A isolates
136B isolates Gene and protein product C
OG
7208, chr A161V G A A
A A A A A A A A A A A A A A A A purine/pyrimidine permease F
161639, chr
V361A A G
G
G G G G G G G G G G G G hisD histidinol
dehydrogenase E
167391, chr
Frame shift
GC
G G G
G G
G G G G G membrane protein P
184112, chr
A143T C
T T T T T T T T T T T T pirin family protein S
239765, chr
Frame shift
C
CT CT CT CT CT CT CT CT CT CT CT CT N-acetylmuramoyl-L-alanine
amidase M
281634, chr
Frame shift
TA T
T
T T T T
T T
T T T T ATP-binding protein L
284973, chr
E4K C
T T T T T T T T T T T T glycosyltransferase family 4
protein M
448819, chr
Frame shift
AT
A A A
A A A A A A A A YbbR-like domain-containing protein
S
490488, chr
D796N C
T T T T T
T T
rpoC DNA-directed RNA polymerase subunit β'
K
537691, chr
H49R T C
C
C C C C C C C C C C C C type III pantothenate kinase F
547323, chr
Q10STOP G
A A A A A A A A A A A A RNA-binding protein S1 J
553481, chr
Q1103 STOP
G
A A A A A A A A A A A A mfd transcription-repair
coupling factor L
845860, chr
Frame shift
A
AT AT AT AT AT AT AT AT
AT AT AT sugar phosphorylase G
16
2
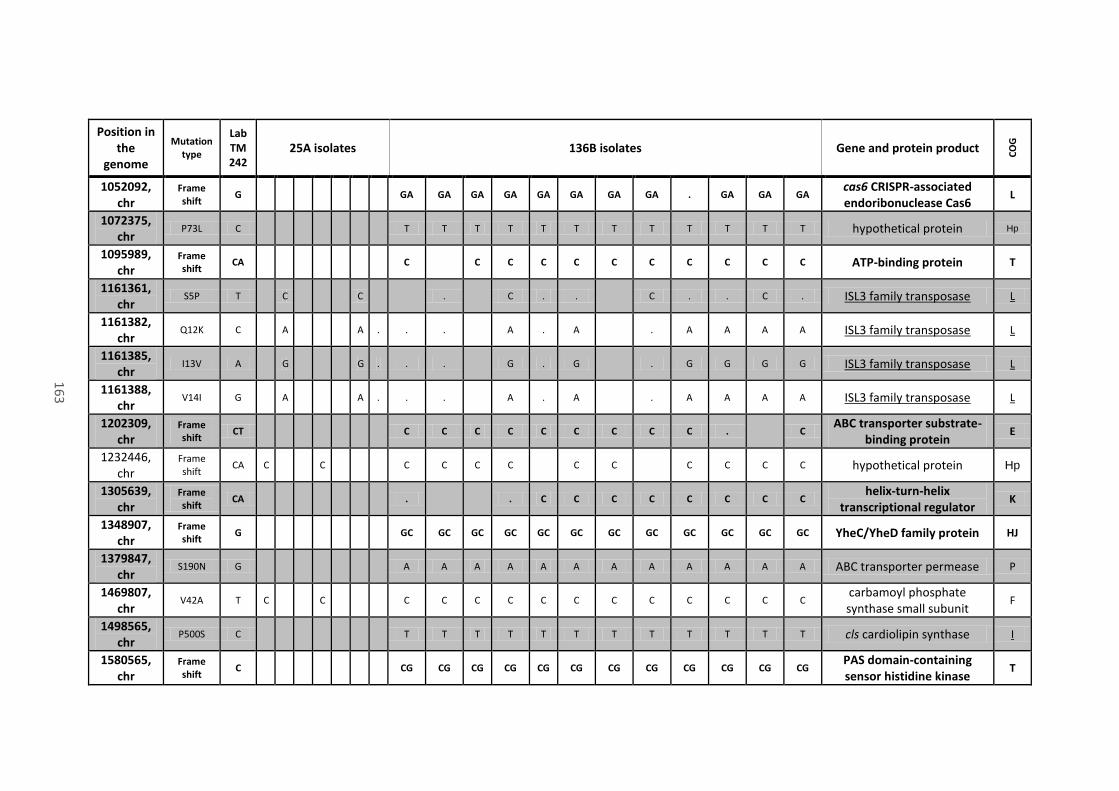
163
Position in the
genome
Mutation type
Lab TM 242
25A isolates
136B isolates Gene and protein product C
OG
1052092, chr
Frame shift
G
GA GA GA GA GA GA GA GA . GA GA GA cas6 CRISPR-associated endoribonuclease Cas6
L
1072375, chr
P73L C
T T T T T T T T T T T T hypothetical protein Hp
1095989, chr
Frame shift
CA
C
C C C C C C C C C C ATP-binding protein T
1161361, chr
S5P T
C
C
.
C . .
C . . C . ISL3 family transposase L
1161382, chr
Q12K C
A
A . . .
A . A
. A A A A ISL3 family transposase L
1161385, chr
I13V A
G
G . . .
G . G
. G G G G ISL3 family transposase L
1161388, chr
V14I G
A
A . . .
A . A
. A A A A ISL3 family transposase L
1202309, chr
Frame shift
CT
C C C C C C C C C .
C ABC transporter substrate-
binding protein E
1232446, chr
Frame shift
CA C
C
C C C C
C C
C C C C hypothetical protein Hp
1305639, chr
Frame shift
CA
.
. C C C C C C C C helix-turn-helix
transcriptional regulator K
1348907, chr
Frame shift
G
GC GC GC GC GC GC GC GC GC GC GC GC YheC/YheD family protein HJ
1379847, chr
S190N G
A A A A A A A A A A A A ABC transporter permease P
1469807, chr
V42A T C
C
C C C C C C C C C C C C carbamoyl phosphate synthase small subunit
F
1498565, chr
P500S C
T T T T T T T T T T T T cls cardiolipin synthase I
1580565, chr
Frame shift
C
CG CG CG CG CG CG CG CG CG CG CG CG PAS domain-containing sensor histidine kinase
T
16
3
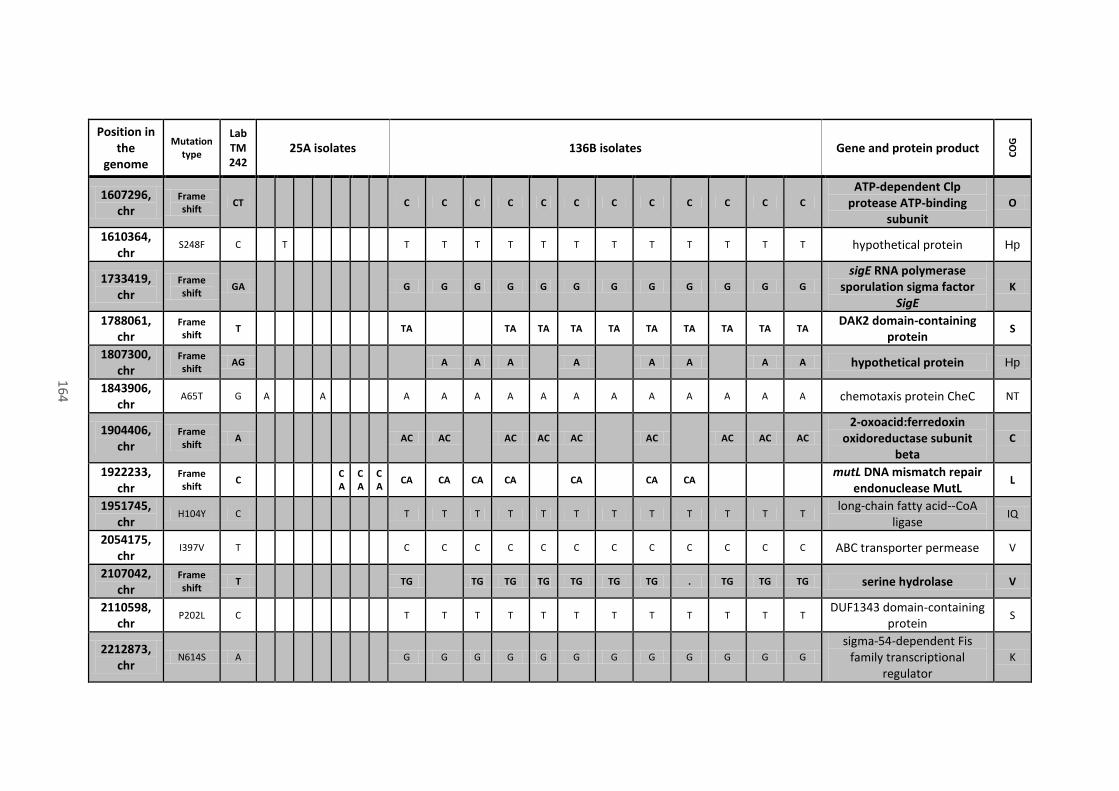
164
Position in the
genome
Mutation type
Lab TM 242
25A isolates
136B isolates Gene and protein product C
OG
1607296, chr
Frame shift
CT
C C C C C C C C C C C C
ATP-dependent Clp protease ATP-binding
subunit
O
1610364, chr
S248F C
T
T T T T T T T T T T T T hypothetical protein Hp
1733419, chr
Frame shift
GA
G G G G G G G G G G G G
sigE RNA polymerase sporulation sigma factor
SigE
K
1788061, chr
Frame shift
T
TA
TA TA TA TA TA TA TA TA TA DAK2 domain-containing
protein S
1807300, chr
Frame shift
AG
A A A
A
A A
A A hypothetical protein Hp
1843906, chr
A65T G A
A
A A A A A A A A A A A A chemotaxis protein CheC NT
1904406, chr
Frame shift
A
AC AC
AC AC AC
AC
AC AC AC
2-oxoacid:ferredoxin oxidoreductase subunit
beta
C
1922233, chr
Frame shift
C
CA
CA
CA
CA CA CA CA
CA
CA CA
mutL DNA mismatch repair endonuclease MutL
L
1951745, chr
H104Y C
T T T T T T T T T T T T long-chain fatty acid--CoA
ligase IQ
2054175, chr
I397V T
C C C C C C C C C C C C ABC transporter permease V
2107042, chr
Frame shift
T
TG
TG TG TG TG TG TG . TG TG TG serine hydrolase V
2110598, chr
P202L C
T T T T T T T T T T T T DUF1343 domain-containing
protein S
2212873, chr
N614S A
G G G G G G G G G G G G
sigma-54-dependent Fis family transcriptional
regulator
K
16
4
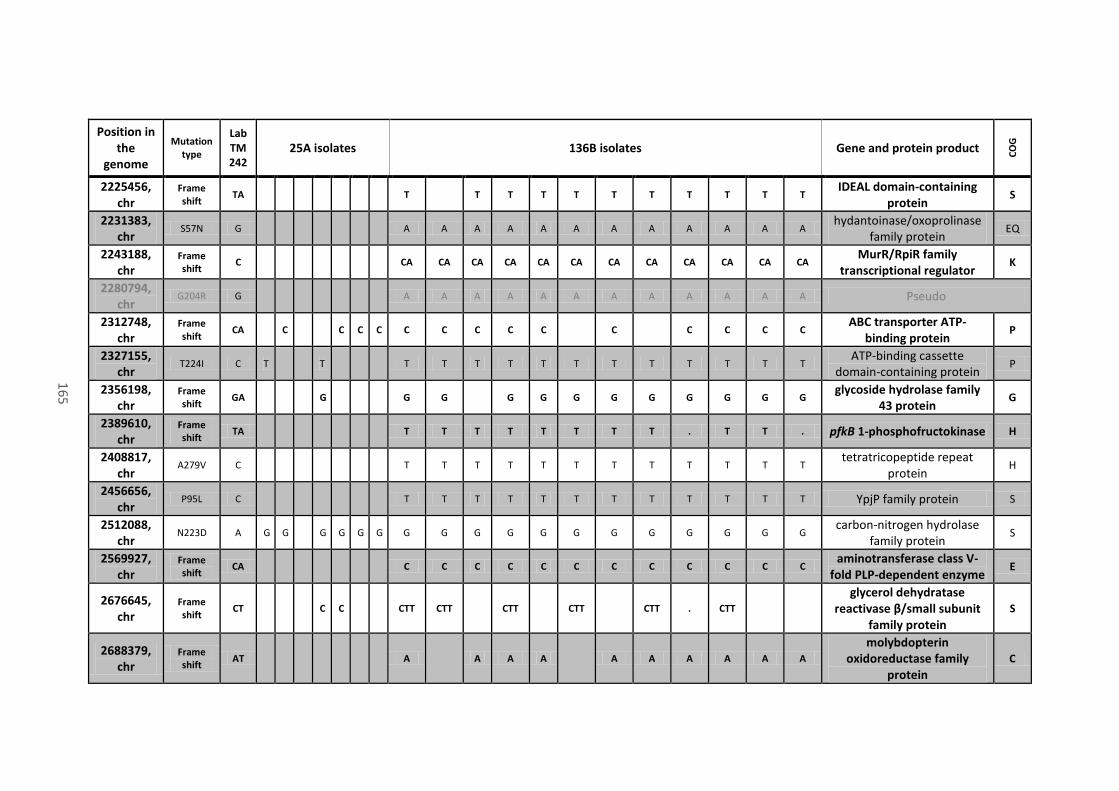
165
Position in the
genome
Mutation type
Lab TM 242
25A isolates
136B isolates Gene and protein product C
OG
2225456, chr
Frame shift
TA
T
T T T T T T T T T T IDEAL domain-containing
protein S
2231383, chr
S57N G
A A A A A A A A A A A A hydantoinase/oxoprolinase
family protein EQ
2243188, chr
Frame shift
C
CA CA CA CA CA CA CA CA CA CA CA CA MurR/RpiR family
transcriptional regulator K
2280794, chr
G204R G
A A A A A A A A A A A A Pseudo
2312748, chr
Frame shift
CA
C
C C C C C C C C
C
C C C C ABC transporter ATP-
binding protein P
2327155, chr
T224I C T
T
T T T T T T T T T T T T ATP-binding cassette
domain-containing protein P
2356198, chr
Frame shift
GA
G
G G
G G G G G G G G G glycoside hydrolase family
43 protein G
2389610, chr
Frame shift
TA
T T T T T T T T . T T . pfkB 1-phosphofructokinase H
2408817, chr
A279V C
T T T T T T T T T T T T tetratricopeptide repeat
protein H
2456656, chr
P95L C
T T T T T T T T T T T T YpjP family protein S
2512088, chr
N223D A G G
G G G G G G G G G G G G G G G G carbon-nitrogen hydrolase
family protein S
2569927, chr
Frame shift
CA
C C C C C C C C C C C C aminotransferase class V-
fold PLP-dependent enzyme E
2676645, chr
Frame shift
CT
C C
CTT CTT
CTT
CTT
CTT . CTT
glycerol dehydratase reactivase β/small subunit
family protein
S
2688379, chr
Frame shift
AT
A
A A A
A A A A A A
molybdopterin oxidoreductase family
protein
C
16
5
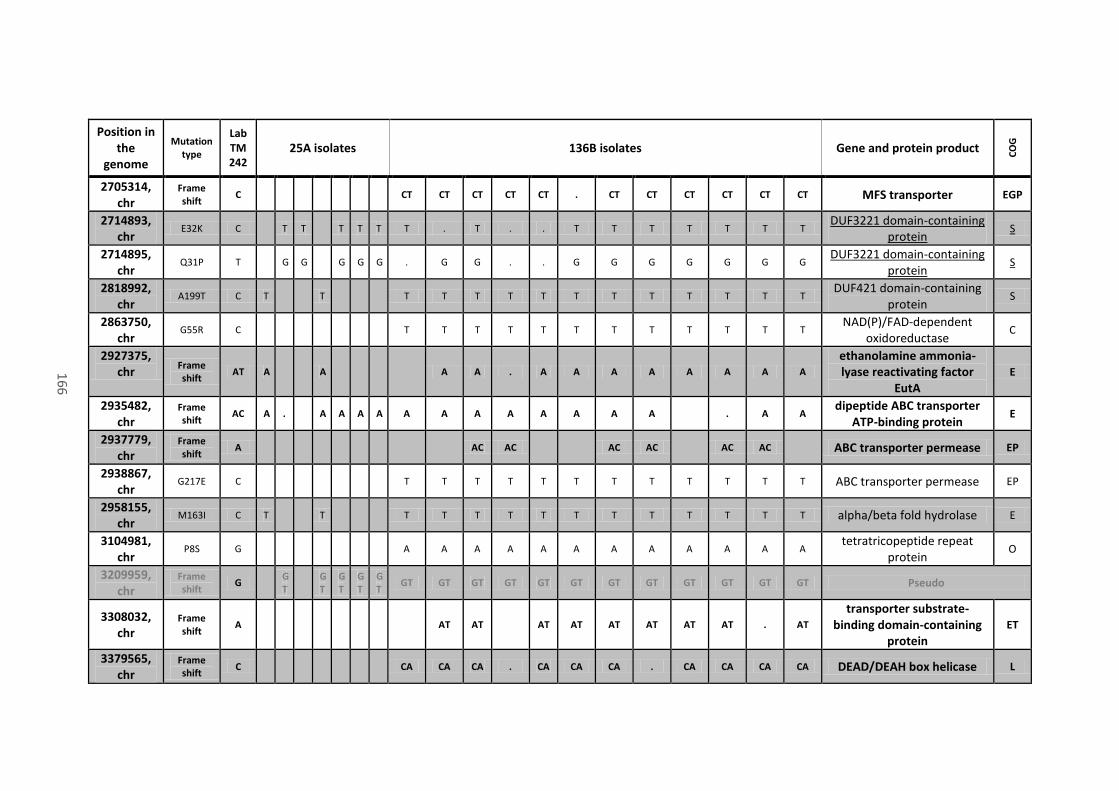
166
Position in the
genome
Mutation type
Lab TM 242
25A isolates
136B isolates Gene and protein product C
OG
2705314, chr
Frame shift
C
CT CT CT CT CT . CT CT CT CT CT CT MFS transporter EGP
2714893, chr
E32K C
T T
T T T T . T . . T T T T T T T DUF3221 domain-containing
protein S
2714895, chr
Q31P T
G G
G G G . G G . . G G G G G G G DUF3221 domain-containing
protein S
2818992, chr
A199T C T
T
T T T T T T T T T T T T DUF421 domain-containing
protein S
2863750, chr
G55R C
T T T T T T T T T T T T NAD(P)/FAD-dependent
oxidoreductase C
2927375, chr
Frame shift
AT A
A
A A . A A A A A A A A
ethanolamine ammonia-lyase reactivating factor
EutA
E
2935482, chr
Frame shift
AC A .
A A A A A A A A A A A A
. A A dipeptide ABC transporter
ATP-binding protein E
2937779, chr
Frame shift
A
AC AC
AC AC
AC AC
ABC transporter permease EP
2938867, chr
G217E C
T T T T T T T T T T T T ABC transporter permease EP
2958155, chr
M163I C T
T
T T T T T T T T T T T T alpha/beta fold hydrolase E
3104981, chr
P8S G
A A A A A A A A A A A A tetratricopeptide repeat
protein O
3209959, chr
Frame shift
G
GT
GT
GT
GT
GT
GT GT GT GT GT GT GT GT GT GT GT GT Pseudo
3308032, chr
Frame shift
A
AT AT
AT AT AT AT AT AT . AT
transporter substrate-binding domain-containing
protein
ET
3379565, chr
Frame shift
C
CA CA CA . CA CA CA . CA CA CA CA DEAD/DEAH box helicase L
16
6

167
Position in the
genome
Mutation type
Lab TM 242
25A isolates
136B isolates Gene and protein product C
OG
3414249, chr
A191T C
T T T T T T T T T T T T metal ABC transporter
permease P
3481608, chr
R64C G
A A A A A A A A A A A A greA transcription
elongation factor GreA K
3562150, chr
M42V A G
G
G G G G G G G G G G G G
prepilin-type N-terminal cleavage/methylation
domain-containing protein
NU
3724862, chr
A273T G
A A A A A A A A A A A A penicillin-binding protein M
3730275, chr
Frame shift
C
CG CG
CG CG CG CG CG CG CG CG CG acetoin utilization protein
AcuC BQ
3782458, chr
Frame shift
C
CT CT CT CT
CT CT CT
CT CT
beta-propeller fold lactonase family protein
C
3795581, chr
L70P T
C C C C C C C C C C C C TIGR00266 family protein S
3864139, chr
A161V G A A
A A A A A A A A A A A A A A A A Pseudo
61502, pCNI001
A226V C T
T
T T T T T T T T T T T T dienelactone hydrolase
family protein S
73599, pCNI001
Frame shift
GA
G G G G G G G G G G G PH domain-containing
protein S
18295, pCNI002
R109Q C
T T T T T T T T T T T T MerR family transcriptional
regulator K
18338, pCNI002
D95N C
T T T T T T T T T T T T MerR family transcriptional
regulator K
18355, pCNI002
E89G T
C C C C C C C C C C C C MerR family transcriptional
regulator K
24761, pCNI002
W149R T C C
C C C C C C C C C C C C C C C C hypothetical protein Hp
32290, pCNI002
Frame shift
CA
C C C C C C C C C C C tyrosine-type
recombinase/integrase L
16
7
168
8.5 Discussion
Excluding silent mutations, a total of 255 mutations were observed in CDS, 15 in pseudogenes,
116 in intergenic regions and one in a CRISPR array. The large amount of data and time
constraints impeded detailed analysis of the effect of these mutations on individual genes. The
contribution of each protein putatively associated with the ethanol tolerant phenotype
observed in both the bioreactor experiment and the test tube assays has not been researched,
but any future search has been facilitated by grouping mutations according to the function of
the genes they were associated with.
The majority of mutations were observed in genes or regulatory sequences of genes assigned
to category S (unknown function). This was predicted because a significant fraction of genes
cannot be identified by automatic annotation (Tatusov et al., 2000; Richardson and Watson,
2013). Although the product name of many of the genes assigned to category S have
informative descriptions, the lack of experimental confirmation of the function of their
orthologs impeded proper categorisation. The search of orthologs of genes of interest was not
expanded to other classes or to all Firmicutes species present on the EggNog database; this
additional search could possibly improve automatic annotation of genes assigned to category S
in this study. Of the 12 hypothetical proteins with mutations in their CDS, six were assigned to
categories that were not ‘poorly characterised’ and were manually corrected to ‘Hp’ to retain
consistency. The reason why these genes functions were automatically assigned to categories
other than S was not investigated. Among the COG categories consistent with function in
bacterial species, i.e. excluding categories Z (cytoskeleton) and B (chromatin structure and
analysis), a few were not populated by EggNog in the automated functional annotation of
mutated genes. No mutations were associated with genes of category A (RNA processing and
modification) and W (extracellular structures).
Considering the analysed variants, the average number of mutations in isolates from
bioreactor sample 25A was about 68, while in isolates from 136B there were 100. Isolate
25A.15 was a significant outlier from this analysis, with a total of 12 mutations in the genome
of this strain (i.e. ten in the chromosome, one in pCNI001 and one in pCNI002). The cellular
processes that are involved in this phenotype are replication, recombination and repair (L),
transcription (K), cell wall/membrane/envelope biogenesis (M), amino acid transport and
metabolism (E) and carbohydrate transport and metabolism (G). As 25A.15 shows an ethanol
tolerance phenotype, these mutations would be an interesting starting point for reverse
genetic studies. Mutations were also found in genes encoding proteins of unknown function
and a pseudogene. In detail, variants were found in glycosyltransferase (WP_003247854.1, M),
DMT (drug/metabolite transporter) family transporter (WP_013877172.1, EG), 4-

169
aminobutyrate-2-oxoglutarate transaminase (WP_003250994.1, E), two in a DUF3221 domain-
containing protein (WP_073519229.1, S), transcription elongation factor GreA
(WP_003248973.1, K), a trypsin-like serine protease (Pseudo), one in the putative terminator
of a LysR family transcriptional regulator probably affecting the downstream catalase
expression (WP_003248176.1, P), two in the putative promoter of an ISL3 family transposase
(WP_073519223.1, L) and one in the putative terminator of an IS110 family transposase
affecting the expression of a hypothetical protein (WP_157777065.1). Apart from mutations in
the gene encoding the DUF3221 domain-containing protein and the regulatory sequences of
transposases of IS110 and ISL3 families (i.e. previously described as hotspots), these
mutations were strain specific and did not appear in any of the other genomes. However greA
appeared to be mutated in all other 136B isolates in a different position. In all 136B isolates a
conserved mutation introduced an additional stop codon in the putative terminator of a LysR
family transcriptional regulator where strain 25A.15 showed a substitution.
The sequencing data obtained from sample 25A isolates were not analysed in depth, because
the mutation patterns of 25A genomes were heterogeneous and therefore difficult to
interpret. It is evident that ethanol tolerance is a complex phenotype that does not respond to
a specific genetic set, but can be achieved in multiple ways. This is in accordance with findings
of a ALE study performed with S. cerevisiae that aimed to develop an ethanol tolerant strain
(Voordeckers et al., 2015) and suggested that mutations in different genes involved in the
same or similar pathways have a similar effect. In principle, information about the process of
emergence of mutations and selection that developed from an initial state of genetic diversity
in 25A sample could be retrieved from isolates of samples 96B and 120B. However, analysis of
ethanol tolerance in these isolates needs repeating to provide clearer results. This could then
be followed up with further genome sequencing.
Because the range of mutations in 25A ethanol tolerant isolates was rather heterogenous, a
greater depth of analyses of mutations in sample 136B isolates is more likely to reveal possible
mechanisms associated with the highest levels of ethanol tolerance. The longer period of
selection and higher ethanol concentrations being used at the end of the ALE experiment was
likely to have reduced the genetic diversity by enriching for a more unique phenotype, as the
analysis in Chapter 7 suggested.
Figure 59, obtained from data previously described in Tables 17 and 18, shows that mutations
that had detrimental effects on expression (i.e. by frame shift or premature termination
caused by newly created stop codons, in black) were in genes of category L (replication,
recombination and repair), followed by S and mixed, then E, K, C, P, V, G, I, T, M, O, J, D and
Pseudo, in decreasing order of abundance. Genes that contained substitutions (in grey) were
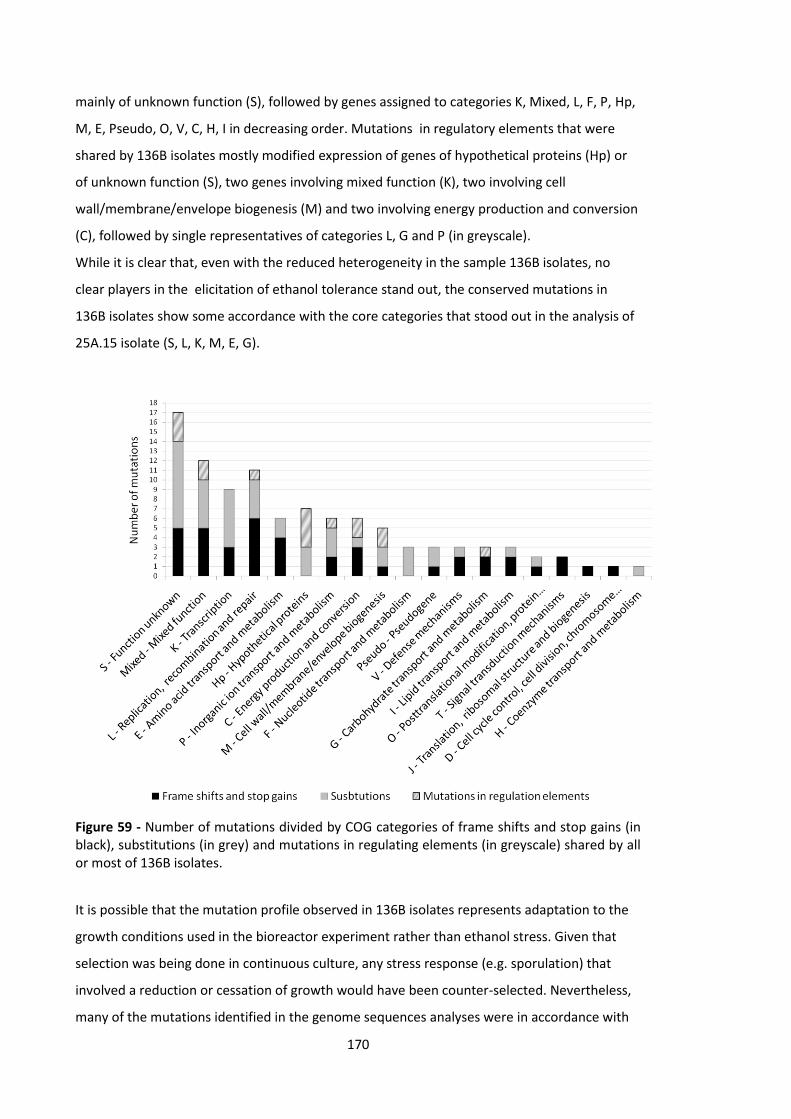
170
mainly of unknown function (S), followed by genes assigned to categories K, Mixed, L, F, P, Hp,
M, E, Pseudo, O, V, C, H, I in decreasing order. Mutations in regulatory elements that were
shared by 136B isolates mostly modified expression of genes of hypothetical proteins (Hp) or
of unknown function (S), two genes involving mixed function (K), two involving cell
wall/membrane/envelope biogenesis (M) and two involving energy production and conversion
(C), followed by single representatives of categories L, G and P (in greyscale).
While it is clear that, even with the reduced heterogeneity in the sample 136B isolates, no
clear players in the elicitation of ethanol tolerance stand out, the conserved mutations in
136B isolates show some accordance with the core categories that stood out in the analysis of
25A.15 isolate (S, L, K, M, E, G).
It is possible that the mutation profile observed in 136B isolates represents adaptation to the
growth conditions used in the bioreactor experiment rather than ethanol stress. Given that
selection was being done in continuous culture, any stress response (e.g. sporulation) that
involved a reduction or cessation of growth would have been counter-selected. Nevertheless,
many of the mutations identified in the genome sequences analyses were in accordance with
Figure 59 - Number of mutations divided by COG categories of frame shifts and stop gains (in black), substitutions (in grey) and mutations in regulating elements (in greyscale) shared by all or most of 136B isolates.
171
previous findings on the topic.
Genotyping E. coli ethanol resistant strains has highlighted that selection during the adaptive
evolution of ethanol tolerant strains favoured mutations in genes involved in transcription and
translation (Haft et al., 2014; Soufi et al., 2015); a metabolome analysis showed that
overproduction of selected amino acids and osmoprotectants were observed in solvent-
stressed E. coli (Wang et al., 2013); in another study, ethanol metabolism (assimilation and
degradation) was observed (Goodarzi et al., 2010).
In this study, frame shift mutations and stop codon gains were observed in genes encoding the
DNA mismatch repair endonuclease MutL (WP_042383267.1, L), an ATP-dependant
DEAD/DEAH box helicase (WP_003249199.1, L), a MurR/RpiR family transcriptional regulator
that represses N-acetylmuramic acid uptake and degradation genes in E.coli
(WP_003251086.1, K), a tyrosine-type recombinase/integrase whose putative promoter was
also found to be a mutation hotspot (WP_052518158.1, L), an ATP-binding protein with a N-
loop conserved domain for NTP hydrolysis (WP_072000118.1, L), a helix-turn-helix
transcriptional regulator whose conserved domain indicates that it is a repressor of genes
involved in metal homeostasis (WP_003252655.1, K), the CRISPR-associated endoribonuclease
Cas6 that cleaves repeated sequences of trans activated RNA in CRISPR/Cas systems
(WP_042383929.1, L), the RNA polymerase sporulation sigma factor SigE responsible for
sporulation genes expression (WP_003251904.1, K) and the transcription-repair coupling
factor Mfd that displaces RNA polymerases stalling at damaged DNA site and recruits
nucleotide excision repair proteins (WP_042385708.1, L). Information about gene function
was retrieved by conserved domain analysis of each protein with NCBI CDD (Marchler-Bauer et
al., 2015). This list suggested that cells were hypermutable, avoided sporulation initiation and
favoured variation of expression by changing transcription control systems induced by DNA
damage.
Changes in transcription (K), DNA replication and recombination and repair (L) were among
those most commonly selected in continuous culture. Mutations in mismatch repair system
genes (e.g. mutS) have been observed in experiments where P. thermoglucosidasius was
grown under different stresses (Liang and van Kranenburg, personal communication),
therefore mutations in ‘recombination and repair’ genes may not be directly linked to the
phenotype under study. The modification of transcription profiles caused by absence of
transcription regulators, changes in promoters and terminators has similar effects of gTME,
but acts selectively on a small subset of genes that may be directly correlated to the observed
phenotype. This is impossible to determine from the available data, but transcriptome analysis
would be more informative.
172
Non synonymous mutations observed in genes of categories L and K were in the DNA-directed
RNA polymerase subunit β' encoded by rpoC (WP_013399827.1, K), the ISL3 family
transposase (WP_073519223.1, L), a sigma-54-dependent Fis family transcriptional regulator
that is similar to an activator of an operon encoding the acetoin dehydrogenase complex for
acetoin/glycerol metabolism (WP_003251142.1, K), the transcription elongation factor GreA
that cleaves the terminal 3’ nucleotides of a transcript during RNA polymerase backtracking
events and misincorporations to enable continuation of transcription (WP_003248973.1, K), a
MerR family transcriptional regulator on pCNI002 that modulates the expression of relevant
transporters and regulons in response to heavy metals, multi-drugs and oxidative stress
(WP_042385864.1, K). The strength of the single effects (if any) of registered substitutions is
unknown.
Ethanol is known to increase membrane fluidity causing ion leakage, alteration of membrane
potential and protein denaturation (Ingram, 1989). P. thermoglucosidasius has been reported
to increase the concentration of saturated lipids, thus maintaining membrane fluidity when
exposed to ethanol, however changes in lipid composition is thought to only partly explain the
ethanol stress response (Huffer et al., 2011). In 136B and 25A.15 isolates, mutations were
observed in genes of categories M (cell wall/membrane/envelope biogenesis) and I (lipid
transport and metabolism). A frame shift mutation inactivates N-acetylmuramoyl-L-alanine
amidase (WP_042384701.1, M), which is involved in peptidoglycan synthesis and
rearrangement, while substitutions are observed in a glycosyltransferase family 4 protein
involved in capsular polysaccharide biosynthesis (WP_003247857.1, M) and a penicillin-binding
protein involved in peptidoglycan synthesis (Sauvage et al., 2008) (WP_042384441.1, M), a
mutation in the putative RBS of a WecB/TagA/CpsF family glycosyltransferase
(WP_003247821.1, M) may also affect peptidoglycan synthesis.
Substitutions were observed in the cardiolipin synthase cls (WP_003252328.1, I) and in a long-
chain fatty acid-CoA ligase (WP_013401215.1, IQ) coding sequences. These enzymes are
associated with an increase in cell membrane rigidity and lipid transport (Hisanaga et al., 2004;
López et al., 2000). Other mutations were observed in genes of categories P (inorganic ion
transport and metabolism) and E (amino acid transport and metabolism), especially in
permeases and ATP-binding cassette (ABC) transporters for amino acid, inorganic ions and
carbohydrate transport, possibly relevant to the role that some molecules play in stress
responses, such as osmotolerance. These results show that, mutations that alter the cell wall
and membrane organisation and turnover are important for ethanol tolerance in P.
thermoglucosidasius, while selective effects on transport processes may affect the ability of
the cells to mount stress responses.
173
The continuous provision of a rich medium containing amino acids and vitamins in the
bioreactor meant that any increased nutrient demand resulting from ethanol toxicity could
have been satisfied by increased transport into the cell. This is useful as it should reduce the
frequency of mutations which increase biosynthetic supply, potentially revealing more
significant mutations that affect the toxicity of intracellular ethanol production directly. This
could even include mutations that divert metabolic flux away from ethanol production
towards other products, but there was no evidence of this in the HPLC traces. These
potentially signature mutations were manually selected from conserved mutations observed in
136B isolates.
Frame shift mutations were observed in two enzymes involved in creation of sugars or
glycolysis intermediates. The first one is the 1-phosphofructokinase (pfkB , WP_042384822.1),
that phosphorylates D-fructose-1-phosphate using ATP giving D-fructose-1,6-bisphosphate for
fructose metabolism and glycolysis. pfkB is part of an operon that resembles the fruR-fruK-
fruA operon in B. subtilis (Reizer et al., 1999), it is between a DeoR/GlpR transcriptional
regulator (WP_003250877.1) and a PTS sugar transporter subunit IIA (WP_003250874.1). The
second one is a sugar phosphorylase (WP_042384192.1) of the α-amylase family (i.e. that
groups many glycoside hydrolases; Van Der Maarel et al., 2002) that reversibly breaks
glycosidic bonds by phosphorylating sugar units. The gene encoding this sugar phosphorylase
is the last of a three-gene operon, the first being a PTS sugar transporter subunit IIA
(WP_097948924.1 ) and the second an α-mannosidase (WP_042384195.1). As fructose was
not present in growth medium, D-fructose-1-phosphate may be generated by a
phosphoglucomutase (WP_013400889.1) from D-glucose-1-phosphate, which could be formed
from glycogen by a sugar phosphorylase, but in most of 136B strains this enzyme is also
inactivated. Selection of mutations in pfkB and the sugar phosphorylase would seem to reflect
the inhibition of glycogen breakdown. Despite growing the cells on glucose, which should
naturally lead to the synthesis of glycogen it may be that the stress responses experienced by
the cells activate the glycogen breakdown pathway, so these mutations would inhibit the
cycle, leaving glycogen as a sink for excess glucose. Moreover, fructose 1,6-bisphosphate is a
direct positive regulator of Hpr kinase (HprK) that phospohorilates Hpr or Crh from ATP. Hpr is
involved in the carbohydrate phosphotransferase system (PTS), described here at Paragraph
5.8. However it is also involved in carbon catabolite repression (CCR) regulation, with which
bacteria, in abundance of saccharides, regulate sugar assimilation and consumption in favour
of a preferred carbon source (e.g. glucose). Phosporilated Hpr and Chr bind to CcpA to form a
complex that interacts with cre sites, inducing (catabolite activation) or inhibiting (catabolite
repression) expression of genes involved in carbon catabolite response (ccr) (Fujita, 2009). In
174
B. subtilis, about 50 genes are regulated with this system, for example ackA and acK are
upregulated, while acsA is downregulated (Fujita, 2009). Mutation in pfkB that blocks fructose
1,6-bisphosphate formation from this pathway inhibits acetate formation from acetyl-CoA
throught the ccr system.
The protein annotated on NCBI as glycerol dehydratase reactivase β encoded by the gene
pduH is actually a propanediol dehydratase reactivase β. This protein dimerises with the large
subunit α, encoded by pduG, to form the complex PduGH (Sampson and Bobik, 2008).
Together with a cob(I)yrinic acid a,c-diamideadenosyltransferase (PduO), PduGH replaces
adenosylcobalamin (AdoCbl, vitamin B12) damaged during enzyme turnover and therefore
restores functionality of propanendiol dehydratase (PduCDE), that converts 1,2-propanediol
(1,2-PD) into propionaldehyde (Liao et al., 2003). This reaction takes place in a proteinaceous
microcompartment for 1,2-PD utilisation encoded by the pdu operon (Bacon et al., 2017), to
prevent damage from the cytotoxic effects of propionaldehyde (i.e. DNA damage); the latter is
converted into 1-propanol and propionyl-CoA that diffuse in the cytoplasm, ultimately
producing propionic acid and ATP (Sampson and Bobik, 2008; Bacon et al., 2017; Wade et al.,
2019). The intermediate propionyl-CoA can be oxidised by the enzymes of the methylcitrate
pathway into succinate or pyruvate (propanoate metabolism on KEGG map00640) (Sampson
and Bobik, 2008). Inactivation of pduH expression may result in block of fermentation products
formation from this pathway.
Intriguingly, the ethanolamine ammonia-lyase reactivating factor EutA plays an identical role in
reactivating the ethanolamine ammonia-lyase (EutBC) in an ATP, AdoCbl and Mg2+ dependent
mechanism (Mori et al., 2004; Huseby and Roth, 2013). Ethanolamine is the headgroup of
phosphatidylethanolamine (PE), the most represented lipid in bacterial membrane (Nickels et
al., 2017), however under ethanol stress the production of PE is inhibited in favour of acidic
phospholipids synthesis (Ingram and Buttke, 1985; Bohin and Lubochinsky, 1982) and
ethanolamine could be generated by the PE turnover. EutBC catalyses the reversible
rearrangement of ethanolamine to an intermediate amino alcohol, which is irreversibly divided
into acetaldehyde and ammonia (Marsh and Meléndez, 2012). Both PduGH and EutA are
essential for removing the damaged AdoCbl from the active site of the cognate eliminases
(PduCDE and EutBC, repectively) that would therefore undergo suicidal inactivation. Although
it is not clear where the initial substrates are arising from, the frameshifts observed in pduH
and eutA in 136B isolates may prevent from the formation of acetaldehyde or other
fermentation products through this pathway.
175
Type III panthotenate kinase shows a conserved H49R substitution in all 136B isolates. This is
the first enzyme of coenzyme A biosynthesis that phosphorylates panthotenate (vitamin B5)
from ATP and could potentially have a strong impact on metabolism given the importance of
coenzyme A for the cell (and as a precursor for ethanol formation in 11955) (Ku et al., 2020).
However the Type III panthotenate kinase model built on CoaX from B. anthracis template with
Swiss Model (Waterhouse et al., 2018) reveals that H49 is not involved in the active site of the
dimeric enzyme (Yang et al., 2006). It would be interesting to investigate the role of this
mutation in regard of coenzyme A production. Cells have a limited pool of coenzyme A, under
fermentative growth conditions they may become Co-A starved as a consequence of the
sequestration of the CoA as acetyl-CoA, that is not converted fast enough by AdhE upon
ethanol accumulation (Chohnan et al., 1997).
A substitution was observed in the gene carA encoding the small subunit of the carbamoyl-
phosphate synthase (V42A). This subunit is a glutamine hydrolase that forms glutamate and
ammonia from glutamine, the subunit encoded by gene carB utilises two ATPs to form
carbamoyl-phosphate from bicarbonate and ammonia in a three-step reaction. Carbamoyl-
phosphate is involved in pyrimidine and arginine biosynthesis (Nicoloff et al., 2001). Deletion
of carA in Pseudomonas syringae caused arginine and uracil auxotrophy (Butcher et al., 2016).
This could create limited growth problems in minimal medium in future studies. However, the
reason why this mutation was selected is unknown.
Acetoin utilization protein AcuC is an enzyme that takes part in one of the two acetoin
utilisation pathways found in B. subtilis. In B. subtilis grown under fermentative conditions,
acetoin is a fermentation product that is catabolised when other carbon sources have been
already metabolised (Yoshida et al., 2000). However, cells were not grown under starvation
stress and acetoin was not present in the medium. More relevantly, AcuC also activates acetyl-
CoA synthetase (AcsA) by deacetylation of inactive AcsA-Ac (Gardner et al., 2006). AcsA
catalises the reaction of acetyl-CoA formation from acetate. Acetate can be formed by the
same enzyme in the reverse reaction, however acetate production is preferably performed by
phosphotransacetylase (PTA) and acetate kinase (AcKA) in B. subtilis (Gardner and Escalante-
Semerena, 2009). Moreover, in 136B strains where pfkB is mutated ccr system is defective,
acetate formation is not induced (ackA and acK are not upregulated), while acsA is not
downregulated, however inactivation of AcuC blocks AcsA activation. Frameshift mutation
observed in acuC of almost all 136B isolates may have a strong impact on acetate and acetyl-
CoA production/utilisation equilibrium.
176
The expression of an aldehyde dehydrogenase family protein (WP_003247795.1) is potentially
altered by a mutation 184 bp upstream the ATG of the gene, in the putative terminator of a
hypothetical protein. Search of putative promoters in the 1000 nucleotides upstream the start
of the CDS with BPROM (available at
http://www.softberry.com/berry.phtml?topic=bprom&group=programs&subgroup=gfindb;
Solovyev et al., 2011) revealed the presence of a putative promoter (i.e. -10 and -35 boxes) in
the sequence between -144 and -174 bp from the ATG. Search of the conserved domains of
the gene product revealed similarity with NAD-dependent aldehyde dehydrogenase ADHII
(cd07116) associated with oxidation of acetaldehyde into acetate during acetoin and ethanol
degradation performed by the enzymes of the aco operon in many bacterial and eukaryotic
organisms (Priefert et al., 1992; Manow et al., 2020). In E. coli, expression of this enzyme,
named AldB, is up-regulated under ethanol stress and is reported to be repressed by the
transcriptional regulator Fis. Curiously, as mentioned before, a conserved substitution was
observed in the sigma-54-dependent Fis family transcriptional regulator (WP_003251142.1) of
all the sequenced 136B isolates. The change in expression profile by these mutations may be
involved in acetaldehyde detoxification, as it is often suggested that the toxicity of ethanol, if
there are non-specific alcohol dehydrogenases operating, is actually due to the build up of
acetaldehyde (Aranda and del Olmo, 2003; Manow et al., 2020; Matsufuji et al., 2008; Roustan
and Sablayrolles, 2002).
177
Chapter 9
General discussion
First generation bioethanol is produced from fermentation of sucrose or glucose derived from
starch. However, use of these substrates creates competition between food and energy
industries for arable land (Hertel et al., 2013). Second generation bioethanol is produced by
fermentation of renewable and sustainable non-food sources of carbohydrates, such as the
inedible lignocellulosic components of plants; however, large-scale production is limited by the
processing costs, making it currently uncompetitive with fossil fuels (Baeyens et al., 2015).
Efficient and cost-effective fermentation of lignocellulosic biomass is not currently achievable
with the most common mesophilic micro-organisms used for first generation bioethanol
production. Therefore, the utilisation of more catabolically versatile thermophiles has been
explored because a growth temperature of 55-60oC is compatible with that of enzyme
pretreatment and the metabolic heat generated through large-scale fermentation, helps avoid
contamination and favours ethanol evaporation. However, they are generally sensitive to low
concentrations of ethanol (2-3 % v/v). It has been calculated that only microbial cell factories
that produce at least 5 % v/v of ethanol and give 90 % of the theoretical yield are able to
generate profit (Scully and Orlygsson, 2015).
Parageobacillus thermoglucosidasius is a thermophile that naturally ferments hexoses,
pentoses and oligosaccharides into lactate, small quantities of ethanol and other fermentation
products. Strain TM242 is a derivative of the wild type NCIMB 11955 which has been
genetically engineered to produce mainly ethanol with a reported 92 % of the maximum
theoretical ethanol yield (Cripps et al., 2009). Its physiology and these modifications
potentially make P. thermoglucosidasius a competitive cell factory for bioethanol production
from lignocellulosic materials. However, it is sensitive to ethanol at more than 16 g/L (2 % v/v)
and its growth is significantly inhibited by concentrations of glucose higher than 50 g/L.
Therefore, P. thermoglucosidasius is unviable at the high substrate concentrations necessary
to produce more than 5 % v/v ethanol, and if process engineering solutions are not adopted,
growth in fermentative conditions is soon arrested by the toxic effects of produced ethanol.
This project aimed to improve both glucose and ethanol tolerance in P. thermoglucosidasius to
increase its competitiveness for second generation bioethanol production.
At the onset of this study, it was decided to attain these complex phenotypes by adaptive
laboratory evolution significantly accelerated by genome-wide mutagenesis (using genome
replication engineering assisted continuous evolution, GREACE) and by perturbation of the

178
whole transcriptome (with global transcription machinery engineering, gTME). Initially, these
two techniques were pursued in parallel. In E. coli, GREACE is based on random mutagenesis
created by inefficient proofreading activity of the 3’-5’ exonuclease subunit of the DNA
polymerase (ε subunit, encoded by dnaQ) coupled with selection (Luan et al., 2013).
Because of the absence of dnaQ in B. subtilis, other possible candidates among elements
involved in DNA replication fidelity were considered. However, presence of a dnaQ-like
transcript in P. thermoglucosidasius TM242 transcriptome suggested that DnaQ variants might
be effective mutators in P. thermoglucosidasius. The availability of a DnaQ homologue meant
that protein modelling based on the E. coli DnaQ structure could be used to identify and target
the equivalent sites as those identified by Luan et al. (2013), rather than creating and
screening a library of dnaQ variants.
Papers adopting gTME for eliciting of complex phenotypes describe the utilisation of low copy
number vectors to carry the library of mutated sigma factors in order not to overwhelm the
native sigma factors present in the cell and to avoid the risk of rewiring essential pathways
(Alper and Stephanopoulos, 2007; Yu et al., 2008; Lanza and Alper, 2012; Tan et al., 2016).
Such a vector was not present in the P. thermoglucosidasius cloning toolkit, with repBST1 and
repB both creating high copy number vectors (Reeve et al., 2016). In the early phase of this
study, when gTME and GREACE were being considered in parallel, two similar low-copy
number vectors were created (data not shown). The next bottleneck in the requirements for
gTME was the ability to introduce a large library of variants in the host cell. Electroporation of
P. thermoglucosidasius was known to give low numbers of transformants. Therefore, a
conjugation protocol was designed based on previous studies (Macklyne, 2017). The origin of
replication oriT was inserted in the modular cloning vectors available (data not shown). Both
bi-parental mating (E. coli S17-1 and P. thermoglucosidasius being the donor and the recipient
strains, respectively) and tri-parental mating (E. coli TOP10 carrying the vector of interest, E.
coli pRK2013 and P. thermoglucosidasius being the donor, the helper and the recipient strains,
respectively) were attempted. They were shown to work effectively with a higher frequency
than electroporation, although still not at a consistent efficiency to transfer a large library. To
this end, more studies are required to find the best conditions to culture donor and helper
strains. However, since preliminary results with DnaQ mutators were promising, it was decided
to focus on GREACE only for the rest of the programme. Therefore, although not all of the
original objectives were attained, the tools are largely in place for future gTME studies in P.
thermoglucosidasius.
The GREACE approach proved to be valuable for the development of glucose resistant strains.
Additionally, this provided an early proof of concept that validated the method. The dnaQ
179
mutants created in this work are valuable tools for future strain improvement studies, not only
for P. thermoglucosidasius, but also for other Geobacillus and Parageobacillus spp. that retain
a 3’-5’ exonuclease with the same domain architecture, as revealed in Chapter 3. Specifically
for P. thermoglucosidasius fermentation processes, DnaQ variants could be used to improve
tolerance towards pre-treatment by-products (Zabed et al., 2016).
Results showed that P. thermoglucosidasius strains able to withstand the osmotic pressure of
150 g/L glucose while still metabolising glucose could be obtained through sequential
evolution at higher concentrations. The information gathered from sequencing the glucose
resistant strains suggested that generation of glucose tolerance does not require a large
number of mutations, and it was interesting to note that mutations did not clearly involve
osmoprotectant uptake proteins, nor compatible solute synthesis pathways. No clear pattern
in the cellular functions affected by mutations was evident, suggesting that glucose tolerance
can arise in different ways. A reverse genetic approach of introducing individual mutations into
a wild-type host would help to unravel their importance for generation of the phenotype,
while detailed study of the transcriptomes or proteomes of wild-type and tolerant strains
would provide further understanding of this complex phenotype. Once a minimal set of
mutations to create the phenotype is established, it would be useful to insert them in an
ethanol resistant strain isolated from the bioreactor experiment. Given the high number of
mutations found in ethanol tolerant strains, this approach would be more efficient than the
inverse experiment (i.e. the modification of a glucose tolerant strain with the conserved traits
found in the ethanol tolerant strains). This reverse engineering would then provide a process
organism that is both glucose tolerant and ethanol tolerant.
In the continuous culture experiment ethanol tolerant strains that could tolerate 26.5 g/L (3.36
% v/v) of ethanol were evolved from TM242 and their genomes analysed. For most of this
experiment exogenous ethanol was added to ensure selective pressure, while maintaining low
redox values ensured fermentative metabolism. This strategy was adopted because production
of toxic concentration of ethanol would have required a high concentration of glucose in the
feed, risking introducing a second toxic component. Ethanol tolerant isolates were obtained
from four key samples of the bioreactor experiments and were tested separately in a parallel
high-throughtput assay to confirm the phenotype of ethanol tolerance in fermentative
conditions. Unfortunately, two sets of samples obtained from the second half of the
chemostat experiment had to be excluded from analyses meaning that information about the
evolution of ethanol tolerance and associated population dynamics could not be retrieved.
Nevertheless, genetic analyses were carried out on isolates from the first and the last samples
taken. Despite the different growth conditions between the bioreactor and the tubes test,
180
results described in Chapter 7 highlighted that isolates had evolved the desired trait.
For the ethanol tolerant isolates, the ability to grow under anaerobic conditions and produce
ethanol to the new toxic threshold only by substrate fermentation (i.e. without added ethanol)
was tested with 136B.32 isolate, but a future study should evaluate this aspect in a controlled
growth environment (i.e. fermentation in a bioreactor). More tests with different carbon
sources other than glucose would further enrich information about ethanol tolerant isolates
(for example xylose and oligosaccharides, to mimic a real feedstock).
Genetic characterisation of isolates from 136B sample was facilitated by the relative
homogeneity of their genetic backgrounds, suggesting that the competitive evolutionary
process offered by continuous culture had succeeded in producing a dominant strain or closely
related family of strains. Unlike the situation with glucose tolerant strains, ethanol tolerance
seemed to be obtained by the accumulation of a large number of mutations. Utilisation of COG
categories facilitated analysis, however this automated functional annotation should be
considered a starting point to skim through data, as in some case it turned out to be
inaccurate. As expected, mutations affecting the cell wall and membrane composition were
observed, in agreement with literature that describes the direct effects of ethanol and cell
response to this stress (Ingram, 1989). Many mutations were observed in expression
regulators which could have a significant global effect, but this will need further investigation
through transcriptome analysis. Of particular interest were mutations that were found to be
related to the regulation of intracellular ratios of acetate, acetyl-CoA and acetaldehyde, and
also the involvement of the carbon catabolite repression system. The target of selected
mutations that affect fermentative pathways could be avoidance of acetaldehyde production
or increased detoxification activity. As acetaldehyde is highly mutagenic, these findings
support the hypothesis formulated by others that acetaldehyde accumulation is a major
underlying cause of intracellular ethanol toxicity (Lovitt et al., 1988; Matsufuji et al., 2008;
Manow et al., 2020).
Ethanol tolerance of 26.5 g/L (3.36 % v/v) is still lower than the 5 % v/v required to consider a
microbial cell factory economically viable. However, this new tolence threshold could
potentiate the value of the recently demonstrated engineering technology of gas stripping
with microbubbles, where it has been demonstrated that cultures can produce the equivalent
of 55.23 g/L (7 % v/v) ethanol with the ethanol concentration being maintained at 15.78 g/L (2
% v/v) in the liquid phase (Ibenegbu et al., in preparation). If cells can now tolerate more than
3 % v/v ethanol, then the productivity can be raised to amounts equivalent to continuous
production of more than 10 % v/v ethanol.
181
As well as generation of the desired glucose tolerant and ethanol tolerant strains, and a
method to rapidly generate other useful phenotypes, this project also revealed a fortuitous yet
fundamental difference between the proofreading mechansims in B. subtilis and P.
thermoglucosidasius. Whereas proofreading in B. subtilis is believed to involve only PolC, the
evidence that mutants of a DnaQ homologue in P. thermoglucosidasius give rise to an
increased mutation rate clearly suggest that this also has a proofreading role. Further studies
on DnaQ are needed to investigate replisome assembly in P. thermoglucosidasius. A 11955
dnaQ knock out strain has been produced (data not shown), but because of time constraints
the effect on growth rate and mutation frequency have not been determined. The generation
of variants in dnaQ was fairly conservative, focusing primarily on regions highlighted from
studies in E. coli. While this showed that differential mutation strength could be achieved,
many other amino acids substitutions could have been tried, possibly increasing the mutation
frequency range.
In conclusion, the results described in this thesis provide the basis for the rapid development
of industrially useful strains of Geobacillus and Parageobacillus spp.. In developing the
necessary tools and analysing the strains produced it also opens the door to a much greater
understanding of the molecular physiology of these organisms which, while having many
features in common with mesophilic Bacillus spp, have a number of distinctive features which
need further elucidation.
182
References
Abdelaal, A.S., Ageez, A.M., Abd El-Hadi, A.E.-H. A. and Abdallah, N. A., (2014) ‘Genetic
improvement of n-butanol tolerance in Escherichia coli by heterologous overexpression of
groESL operon from Clostridium acetobutylicum’, 3 Biotech, pp. 5(4), 401–410. doi:
10.1007/s13205-014-0235-8.
Adam, M., Murali, B., Glenn, N.O. and Potter, S.S., (2008) ‘Epigenetic inheritance based
evolution of antibiotic resistance in bacteria’. BMC Evol Biol. Feb 18;8:52. doi: 10.1186/1471-
2148-8-52.
Aditiya, H.B., Mahlia, T.M.I., Chong, W.T., Nur, H. and Sebayang, A.H., (2016) ‘Second
generation bioethanol production: a critical review’, Renewable and Sustainable Energy Reviews.
Elsevier, 66, pp. 631–653. doi: 10.1016/j.rser.2016.07.015.
Ahmad, S. and Mokaddas, E. (2005) ‘The occurrence of rare rpoB mutations in rifampicin-
resistant clinical Mycobacterium tuberculosis isolates from Kuwait’, International Journal of
Antimicrobial Agents. 26(3), pp. 205–212. doi: 10.1016/j.ijantimicag.2005.06.009.
Akashi, M. and Yoshikawa, H. (2013) ‘Relevance of GC content to the conservation of DNA
polymerase III/mismatch repair system in Gram-positive bacteria’, Frontiers in Microbiology,
4(266). doi: 10.3389/fmicb.2013.00266.
Aliyu, H., Lebre, P., Blom, J., Cowan, D. and De Maayer, P., (2016) ‘Phylogenomic re-assessment
of the thermophilic genus Geobacillus’, Systematic and Applied Microbiology, 39(8), pp. 527–
533. doi: 10.1016/j.syapm.2016.09.004.
Almagro Armenteros, J.J., Tsirigos, K.D., Sønderby, C.K., Petersen, T.N., Winther, O., Brunak, S.,
von Heijne, G. and Nielsen, H., (2019) ‘SignalP 5.0 improves signal peptide predictions using
deep neural networks’, Nature Biotechnology. 37(4), pp. 420–423. doi: 10.1038/s41587-019-
0036-z.
Alovero, F.L., Pan, X.-S., Morris, J.E., Manzo, R.H. and Fisher, L.M., (2000) ‘Engineering the
specificity of antibacterial fluoroquinolones: benzenesulfonamide modifications at C-7 of
ciprofloxacin change its primary target in Streptococcus pneumoniae from topoisomerase IV to
gyrase’, Antimicrobial Agents and Chemotherapy, 44(2), pp. 320–325. doi:
10.1128/AAC.44.2.320-325.2000.
Alper, H. and Stephanopoulos, G. (2007) ‘Global transcription machinery engineering: a new
approach for improving cellular phenotype’, Metabolic Engineering, 9(3), pp. 258–267. doi:
10.1016/j.ymben.2006.12.002.
Alper, H., Moxley, J., Nevoigt, E., Fink, G.R. and Stephanopoulos, G., (2006) ‘Engineering yeast
transcription machinery for improved ethanol tolerance and production’, Science, 314, pp.
1565–1568. doi: 10.1126/science.1131969.
Altschul, S.F., Gish, W., Miller, W., Myers, E.W. and Lipman, D.J., (1990) ‘Basic local alignment
search tool’, Journal of Molecular Biology, 215(3), pp. 403–410. doi: 10.1016/S0022-
2836(05)80360-2.

183
Andrews, J. M. (2001) ‘Determination of minimum inhibitory concentrations’, Journal of
Antimicrobial Chemotherapy, 48, pp. 5–16.
Aranda, A. and del Olmo, M. lí (2003) ‘Response to acetaldehyde stress in the yeast
Saccharomyces cerevisiae involves a strain-dependent regulation of several ALD genes and is
mediated by the general stress response pathway’, Yeast, 20(8), pp. 747–759. doi:
10.1002/yea.991.
Arnold, K., Bordoli, L., Kopp, J. and Schwede, T., (2006) ‘The SWISS-MODEL workspace: a web-
based environment for protein structure homology modelling’, Bioinformatics. 22(2), pp. 195–
201. doi: 10.1093/bioinformatics/bti770.
Bacon, L.F., Hamley-Bennett, C., Danson, M.J. and Leak, D.J., (2017) ‘Development of an efficient
technique for gene deletion and allelic exchange in Geobacillus spp.’, Microbial Cell Factories.
16(1), pp. 1–8. doi: 10.1186/s12934-017-0670-4.
Badran, A. H. and Liu, D. R. (2015) ‘Development of potent in vivo mutagenesis plasmids with
broad mutational spectra’, Nature Communications. 6, pp. 1–10. doi: 10.1038/ncomms9425.
Baeyens, J., Kang, Q., Appels, L., Dewil, R., Lv, Y. and Tan, T., (2015) ‘Challenges and
opportunities in improving the production of bio-ethanol’, Progress in Energy and Combustion
Science. 47, pp. 60–88. doi: 10.1016/j.pecs.2014.10.003.
Bailey, J. E. (1991) ‘Toward a science of metabolic engineering’, Science, 252(5013), pp. 1668–
1675. doi: 10.1126/science.2047876.
Ban, C. and Yang, W. (1998) ‘Crystal structure and ATPase activity of MutL: Implications for DNA
repair and mutagenesis’, Cell. 95(4), pp. 541–552. doi: 10.1016/S0092-8674(00)81621-9.
Banach-Orlowska, M., Fijalkowska, I.J., Schaaper, R.M. and Jonczyk, P., (2005) ‘DNA polymerase
II as a fidelity factor in chromosomal DNA synthesis in Escherichia coli’, Molecular Microbiology,
58(1), pp. 61–70. doi: 10.1111/j.1365-2958.2005.04805.x.
Basak, S., Song, H. and Jiang, R. (2012) ‘Error-prone PCR of global transcription factor cyclic AMP
receptor protein for enhanced organic solvent (toluene) tolerance’, Process Biochemistry,
47(12), pp. 2152–2158. doi: 10.1016/j.procbio.2012.08.006.
Baskaran, S., Ahn, H. ‐Jun and Lynd, L. R. (1995) ‘Investigation of the ethanol tolerance of
Clostridium thermosaccharolyticum in continuous culture’, Biotechnology Progress, 11(3), pp.
276–281. doi: 10.1021/bp00033a006.
Bateman, A. (1997) ‘The structure of a domain common to archaebacteria and the
homocystinuria disease protein’, Trends in Biochemical Sciences. 22(1), pp. 12–13. doi:
10.1016/S0968-0004(96)30046-7.
Beese, L. S. and Steitz, T. A. (1991) 'Structural basis for the 3’-5’ exonuclease activity of
Escherichia coli DNA polymerase I: a two metal ion mechanism', The EMBO Journal. 10(1), pp.
25-33
Béguin, P. and Aubert, J. P. (1994) ‘The biological degradation of cellulose’, FEMS Microbiology
184
Reviews, 13(1), pp. 25–58. doi: 10.1016/0168-6445(94)90099-X.
Bélanger, F., Théberge-Julien, G., Cunningham, P.R. and Brakier-Gingras, L., (2005) ‘A functional
relationship between helix 1 and the 900 tetraloop of 16S ribosomal RNA within the bacterial
ribosome’, RNA, 11(6), pp. 906–913. doi: 10.1261/rna.2160405.
Benkert, P., Biasini, M. and Schwede, T. (2011) ‘Toward the estimation of the absolute quality of
individual protein structure models’, Bioinformatics. 27(3), pp. 343–350. doi:
10.1093/bioinformatics/btq662.
Berkmen, M. B. and Grossman, A. D. (2006) ‘Spatial and temporal organization of the Bacillus
subtilis replication cycle’, Molecular Microbiology, 62(1), pp. 57–71. doi: 10.1111/j.1365-
2958.2006.05356.x.
Bernad, A., Blanco, L., Lázaro, J., Martín, G. and Salas, M., (1989) ‘A conserved 3′→5′
exonuclease active site in prokaryotic and eukaryotic DNA polymerases’, Cell. 59(1), pp. 219–
228. doi: 10.1016/0092-8674(89)90883-0.
Bertani, G. (2004) ‘Lysogeny at mid-twentieth century: P1, P2, and other experimental systems.’,
Journal of Bacteriology. 186(3), pp. 595–600.
Bessman, M.J., Kornberg, A., Lehman, I.R. And Simms, E.S., (1956) ‘Enzymic synthesis of
deoxyribonucleic acid’, Biochimica et biophysica acta, 21(1), pp. 197–198. doi: 10.1016/0006-
3002(56)90127-5.
Bhatia, L., Johri, S. and Ahmad, R. (2012) ‘An economic and ecological perspective of ethanol
production from renewable agro waste: a review.’, AMB Express. 2(1), p. 65. doi: 10.1186/2191-
0855-2-65.
Birben, E., Sahiner, U.M., Sackesen, C., Erzurum, S. and Kalayci, O., (2012) ‘Oxidative stress and
antioxidant defense’, World Allergy Organization Journal. pp. 9–19. doi:
10.1097/WOX.0b013e3182439613.
Blinkowa, A. L. and Walker, J. R. (1990) ‘Programmed ribosomal frameshifting generates the
Escherichia coli DNA polymerase III γ subunit from within the τ subunit reading frame’, Nucleic
Acids Research, 18(7), pp. 1725–1729. doi: 10.1093/nar/18.7.1725.
Bohin, J. P. and Lubochinsky, B. (1982) ‘Alcohol-resistant sporulation mutants of Bacillus subtilis’,
Journal of Bacteriology, 150(2), pp. 944–955. doi: 10.1128/jb.150.2.944-955.1982.
Bornscheuer, U. T., Altenbuchner, J. and Meyer, H. H. (1998) ‘Directed evolution of an esterase
for the stereoselective resolution of a key intermediate in the synthesis of epothilones’,
Biotechnology and Bioengineering. 58(5), pp. 554–559. doi: 10.1002/(SICI)1097-
0290(19980605)58:5<554::AID-BIT12>3.0.CO;2-B.
Borriss, R., Danchin, A., Harwood, C.R., Médigue, C., Rocha, E.P.C., Sekowska, A. and Vallenet, D.,
(2018) ‘Bacillus subtilis, the model Gram-positive bacterium: 20 years of annotation refinement’,
Microbial Biotechnology, 11(1), pp. 3–17. doi: 10.1111/1751-7915.13043.
Branco, R. H. R., Serafim, L. S. and Xavier, A. M. R. B. (2019) ‘Second generation bioethanol
185
production: on the use of pulp and paper industry wastes as feedstock’, Fermentation, 5(1), pp.
1–30. doi: 10.3390/fermentation5010004.
Bremer, E. and Krämer, R. (2019) ‘Responses of microorganisms to osmotic stress’, Annual
Review of Microbiology, 73, pp. 313–334. doi: 10.1146/annurev-micro-020518.
Brickwedde, A., van den Broek, M., Geertman, J.M.A., Magalhães, F., Kuijpers, N.G.A., Gibson, B.,
Pronk, J.T. and Daran, J.M.G., (2017) ‘Evolutionary engineering in chemostat cultures for
improved maltotriose fermentation kinetics in saccharomyces pastorianus lager brewing yeast’,
Frontiers in Microbiology. Frontiers Media S.A., 8(SEP). doi: 10.3389/fmicb.2017.01690.
Bridson, E. Y. and Brecker, A. (1970) ‘Design and formulation of microbial culture media’,
Methods in Microbiology, 3, pp. 229–295. doi: 10.1016/S0580-9517(08)70541-5.
Brouns, S.J.J., Wu, H., Akerboom, J., Turnbull, A.P., De Vos, W.M. and Van Der Oost, J.,(2005)
‘Engineering a selectable marker for hyperthermophiles’, Journal of Biological Chemistry,
280(12), pp. 11422–11431. doi: 10.1074/jbc.M413623200.
Browning, D. F. and Busby, S. J. W. (2004) ‘The regulation of bacterial transcription initiation’,
Nature Reviews Microbiology, pp. 57–65. doi: 10.1038/nrmicro787.
Bruck, I., Goodman, M. F. and O’Donnell, M. (2003) ‘The essential C family DnaE polymerase is
error-prone and efficient at lesion bypass’, Journal of Biological Chemistry, 278(45), pp. 44361–
44368. doi: 10.1074/jbc.M308307200.
Bryant, F. R., Johnson, K. A. and Benkovic, S. J. (1983) ‘Elementary steps in the DNA polymerase I
reaction pathway’, Biochemistry, 22(15), pp. 3537–3546. doi: 10.1021/bi00284a001.
Buck, M., Gallegos, M., Studholme, D.J., Guo, Y., Gralla, J.D., Gallegos, A. and Gralla, J. a
Y.D.,(2000) ‘The bacterial enhancer-dependent ς54(ςN) transcription factor’, Journal of
Bacteriology, 54(15), pp. 4129–4136. doi: 10.1128/JB.182.15.4129-4136.2000.Updated.
Buckstein, M. H., He, J. and Rubin, H. (2008) ‘Characterization of nucleotide pools as a function
of physiological state in Escherichia coli’, Journal of Bacteriology, 190(2), pp. 718–726. doi:
10.1128/JB.01020-07.
Burdette, D.S., Jung, S.H., Shen, G.J., Hollingsworth, R.I. and Zeikus, J.G., (2002) ‘Physiological
function of alcohol dehydrogenases and long-chain (C30) fatty acids in alcohol tolerance of
Thermoanaerobacter ethanolicus’, Applied and Environmental Microbiology, 68(4), pp. 1914–
1918. doi: 10.1128/AEM.68.4.1914-1918.2002.
Butcher, B.G., Chakravarthy, S., D’Amico, K., Stoos, K.B. and Filiatrault, M.J., (2016) ‘Disruption of
the carA gene in Pseudomonas syringae results in reduced fitness and alters motility’, BMC
Microbiology. 16(1), p. 194. doi: 10.1186/s12866-016-0819-z.
Cai, H., Yu, H., McEntee, K., Kunkel, T.A. and Goodman, M.F., (1995) ‘Purification and properties
of wild-type and exonuclease-deficient DNA polymerase II from Escherichia coli’, Journal of
Biological Chemistry, 270(25), pp. 15327–15335. doi: 10.1074/jbc.270.25.15327.
Calamita, G., Bishai, W.R., Preston, G.M., Guggino, W.B. and Agre, P., (1995) ‘Molecular cloning
186
and characterization of AqpZ, a water channel from Escherichia coli’, Journal of Biological
Chemistry, 270(49), pp. 29063–29066. doi: 10.1074/jbc.270.49.29063.
Calero, P., Jensen, S.I., Bojanovič, K., Lennen, R.M., Koza, A. and Nielsen, A.T., (2018) ‘Genome-
wide identification of tolerance mechanisms toward p-coumaric acid in Pseudomonas putida’,
Biotechnology and Bioengineering, 115(3), pp. 762–774. doi: 10.1002/bit.26495.
Campbell, J. L. and Kleckner, N. (1990) 'E. coli oric and the dnaA gene promoter are sequestered
from dam methyltransferase following the passage of the chromosomal replication fork', Cell.
62(5), pp. 967-79. doi: 10.1016/0092-8674(90)90271-f.
Campbell, K., Xia, J. and Nielsen, J. (2017) ‘The impact of systems biology on bioprocessing’,
Trends in Biotechnology, 35(12) pp. 1156–1168. doi: 10.1016/j.tibtech.2017.08.011.
Cao, H., Wei, D., Yang, Y., Shang, Y., Li, G., Zhou, Y., Ma, Q. and Xu, Y., (2017) ‘Systems-level
understanding of ethanol-induced stresses and adaptation in E. coli’, Scientific Reports, 7, 44150.
doi: 10.1038/srep44150.
Carriço, J.A., Silva-Costa, C., Melo-Cristino, J., Pinto, F.R., De Lencastre, H., Almeida, J.S. and
Ramirez, M., (2006) ‘Illustration of a common framework for relating multiple typing methods by
application to macrolide-resistant Streptococcus pyogenes’, Journal of Clinical Microbiology,
44(7), pp. 2524–2532. doi: 10.1128/JCM.02536-05.
Cartwright, C. P., Juroszek, J. R. and Beavan, M. J. (1986) ‘Ethanol dissipates the proton-motive
force across the plasma membrane of Saccharomyces cerevisiae’, Journal of General
Microbiology, 132(2), pp. 369–377. doi: 10.1099/00221287-132-2-369.
Chandrangsu, P., Dusi, R., Hamilton, C.J. and Helmann, J.D., (2014) ‘Methylglyoxal resistance in
Bacillus subtilis: contributions of bacillithiol-dependent and independent pathways’, Molecular
Microbiology, 91(4), pp. 706–715. doi: 10.1111/mmi.12489.
Chen, Q., Wu, W., Qi, D., Ding, Y. and Zhao, Z., (2020) ‘Review on microaeration-based anaerobic
digestion: state of the art, challenges, and prospectives’, Science of the Total Environment. 710,
136388 doi: 10.1016/j.scitotenv.2019.136388.
Chohnan, S., Furukawa, H., Fujio, T., Nishihara, H. and Takamura, Y., (1997) ‘Changes in the size
and composition of intracellular pools of nonesterified coenzyme A and coenzyme A thioesters
in aerobic and facultatively anaerobic bacteria’, Applied and Environmental Microbiology, 63(2),
pp. 553–560. doi: 10.1128/aem.63.2.553-560.1997.
Choi, K.R., Jang, W.D., Yang, D., Cho, J.S., Park, D. and Lee, S.Y., (2019) ‘Systems metabolic
engineering strategies: integrating systems and synthetic biology with metabolic engineering’,
Trends in Biotechnology. 37(8), pp. 817–837. doi: 10.1016/j.tibtech.2019.01.003.
Chong, H., Huang, L., Yeow, J., Wang, I., Zhang, H., Song, H. and Jiang, R., (2013) ‘Improving
ethanol tolerance of Escherichia coli by rewiring its global regulator cAMP receptor protein
(CRP)’, PLoS ONE, 8(2), pp. 1–9. doi: 10.1371/journal.pone.0057628.
Cisneros, G.A., Perera, L., Schaaper, R.M., Pedersen, L.C., London, R.E., Pedersen, L.G. and
Darden, T.A., (2009) ‘Reaction mechanism of the epsilon subunit of E. coli DNA polymerase III:
187
insights into active site metal coordination and catalytically significant residues.’, Journal of the
American Chemical Society. 131(4), pp. 1550–6. doi: 10.1021/ja8082818.
Claverys, J. P. and Lacks, S. A. (1986) ‘Heteroduplex deoxyribonucleic acid base mismatch repair
in bacteria.’, Microbiological reviews, 50(2), pp. 133–65.
Colin, V. L., Rodríguez, A. and Cristbal, H. A. (2011) ‘The role of synthetic biology in the design of
microbial cell factories for biofuel production’, Journal of Biomedicine and Biotechnology, 2011,
601834 doi: 10.1155/2011/601834.
Coorevits, A., Dinsdale, A.E., Halket, G., Lebbe, L., de Vos, P., van Landschoot, A. and Logan, N.A.,
(2012) ‘Taxonomic revision of the genus Geobacillus: emendation of Geobacillus, G.
stearothermophilus, G. jurassicus, G. toebii, G. thermodenitrificans and G. thermoglucosidans
(nom. corrig., formerly ‘thermoglucosidasius’); transfer of Bacillus thermantarcticus to the genus
as G. thermantarcticus comb. nov.; proposal of Caldibacillus debilis gen. nov., comb. nov.;
transfer of G. tepidamans to Anoxybacillus as A. tepidamans comb. nov.; and proposal of
Anoxybacillus caldiproteolyticus sp. nov.’, International Journal of Systematic and Evolutionary
Microbiology, 62(7), pp. 1470–1485. doi: 10.1099/ijs.0.030346-0.
Cox, E. C. and Horner, D. L. (1981) ‘Dominant mutators in Escherichia coli’, Genetics, 100 (11) pp.
7–18.
Cripps, R.E., Eley, K., Leak, D.J., Rudd, B., Taylor, M., Todd, M., Boakes, S., Martin, S. and
Atkinson, (2009) ‘Metabolic engineering of Geobacillus thermoglucosidasius for high yield
ethanol production’, Metabolic Engineering. 11(6), pp. 398–408. doi:
10.1016/j.ymben.2009.08.005.
Csonka, L. N. (1989) ‘Physiological and genetic responses of bacteria to osmotic stress’,
Microbiological Reviews, 53 (1), pp. 121–147.
Czech, L., Poehl, S., Hub, P., Stöveken, N. and Bremer, E., (2018) ‘Tinkering with osmotically
controlled transcription allows enhanced production and excretion of ectoine and
hydroxyectoine from a microbial cell factory’, Applied and Environmental Microbiology. 84(2).
doi: 10.1128/AEM.01772-17.
D’Amore, T. and Stewart, G. G. (1987) ‘Ethanol tolerance of yeast’, Enzyme and Microbial
Technology, 9(6), pp. 322–330. doi: 10.1016/0141-0229(87)90053-6.
Dao, V. and Modrich, P. (1998) ‘Mismatch-, MutS-, MutL-, and helicase II-dependent unwinding
from the single-strand break of an incised heteroduplex’, Journal of Biological Chemistry,
273(15), pp. 9202–9207. doi: 10.1074/jbc.273.15.9202.
Davis, E. O., Dullaghan, E. M. and Rand, L. (2002) ‘Definition of the mycobacterial SOS box and
use to identify LexA-regulated genes in Mycobacterium tuberculosis’, Journal of Bacteriology.
184(12), pp. 3287–3295. doi: 10.1128/JB.184.12.3287-3295.2002.
Davis, M. W. (no date) ApE- A plasmid Editor. Available at:
http://jorgensen.biology.utah.edu/wayned/ape/
Declerck, N., Vincent, F., Hoh, F., Aymerich, S. and Van Tilbeurgh, H., (1999) ‘RNA recognition by
188
transcriptional antiterminators of the BgIG/SacY family: functional and structural comparison of
the CAT domain from SacY and LicT’, Journal of Molecular Biology, 294(2), pp. 389–402. doi:
10.1006/jmbi.1999.3256.
Degnen, G. E. and Cox, E. C. (1974) 'Conditional mutator gene in Escherichia coli: isolation,
mapping, and effector studies', Journal of Bacteriology. 117(2), pp. 477-87. doi:
10.1128/JB.117.2.477-487.1974.
Denamur, E. and Matic, I. (2006) ‘Evolution of mutation rates in bacteria’, Molecular
Microbiology, 60(4), pp. 820–827. doi: 10.1111/j.1365-2958.2006.05150.x.
Dervyn, E., Suski, C., Daniel, R., Bruand, C., Chapuis, J., Errington, J., Jannière, L. and Ehrlich, S.D.,
(2001) ‘Two essential DNA polymerases at the bacterial replication fork’, Science, 294(5547), pp.
1716–1719. doi: 10.1126/science.1066351.
Deutscher, J., Francke, C. and Postma, P. W. (2006) ‘How phosphotransferase system-related
protein phosphorylation regulates carbohydrate metabolism in bacteria’, Microbiology and
Molecular Biology Reviews. , 70(4), pp. 939–1031. doi: 10.1128/mmbr.00024-06.
Devarapalli, M. and Atiyeh, H. K. (2015) ‘A review of conversion processes for bioethanol
production with a focus on syngas fermentation’, Biofuel Research Journal, pp. 268–280. doi:
10.18331/BRJ2015.2.3.5.
Directive (EU) 2018/2001 of the European Parliament and of the Council of 11 December 2018
on the promotion of the use of energy from renewable sources (Text with EEA relevance.)
Directive 2009/28/EC of the European Parliament and of the Council of 23 April 2009 on the
promotion of the use of energy from renewable sources and amending and subsequently
repealing Directives 2001/77/EC and 2003/30/EC (Text with EEA relevance)
Dmytruk, K. V., Kurylenko, O.O., Ruchala, J., Abbas, C.A. and Sibirny, A.A., (2017) ‘Genetic
improvement of conventional and nonconventional yeasts for the production of first- and
second-generation ethanol’, Biotechnology of Yeasts and Filamentous Fungi. Springer
International Publishing, pp. 1–38. doi: 10.1007/978-3-319-58829-2_1.
Dohrmann, P.R., Correa, R., Frisch, R.L., Rosenberg, S.M. and McHenry, C.S., (2016) ‘The DNA
polymerase III holoenzyme contains-and is not a trimeric polymerase’, Nucleic Acids Research.
Oxford University Press, 44(3), pp. 1285–1297. doi: 10.1093/nar/gkv1510.
Dombek, K. M. and Ingram, L. O. (1987) ‘Ethanol production during batch fermentation with
Saccharomyces cerevisiae: changes in glycolytic enzymes and internal pH’, Applied and
Environmental Microbiology, 53(6), pp. 1286–1291. doi: 10.1128/aem.53.6.1286-1291.1987.
Dorman, C. J. and Dorman, M. J. (2016) ‘DNA supercoiling is a fundamental regulatory principle
in the control of bacterial gene expression’, Biophysical Reviews, 8(Suppl 1) pp. 89–100. doi:
10.1007/s12551-016-0238-2.
Doroshenko, V.G., Livshits, V.A., Airich, L.G., Shmagina, I.S., Savrasova, E.A., Ovsienko, M. V. and
Mashko, S. V., (2015) ‘Metabolic engineering of Escherichia coli for the production of
phenylalanine and related compounds’, Applied Biochemistry and Microbiology, 51(7), pp. 733–
189
750. doi: 10.1134/S0003683815070017.
Dosztanyi, Z., Csizmok, V., Tompa, P. and Simon, I., (2005) ‘IUPred: web server for the prediction
of intrinsically unstructured regions of proteins based on estimated energy content’,
Bioinformatics. 21(16), pp. 3433–3434. doi: 10.1093/bioinformatics/bti541.
Drake, J. W. (1991) 'A constant rate of spontaneous mutation in DNA-based microbes', Proc.
Natl. Acad. Sci. USA. 88(16), pp.7160-4. doi: 10.1073/pnas.88.16.7160.
Du, X., Gellerstedt, G. and Li, J. (2013) ‘Universal fractionation of lignin-carbohydrate complexes
(LCCs) from lignocellulosic biomass: an example using spruce wood’, Plant Journal. 74(2), pp.
328–338. doi: 10.1111/tpj.12124.
Duigou, S., Ehrlich, S.D., Noirot, P. and Noirot-Gros, M.F., (2004) ‘Distinctive genetic features
exhibited by the Y-family DNA polymarases in Bacillus subtilis’, Molecular Microbiology. 54(2),
pp. 439–451. doi: 10.1111/j.1365-2958.2004.04259.x.
Dutta, S. and Wu, K. C. (2014) ‘Enzymatic breakdown of biomass: enzyme active sites,
immobilization, and biofuel production’, Green Chemistry, 11, pp. 4615–4626. doi:
10.1039/c4gc01405g.
Echols, H. and Goodman, M. F. (1991) ‘Fidelity mechanisms in DNA replication’, Annual Review
of Biochemistry, 60, pp. 477–511.
Echols, H., Lu, C. and Burgers, P. M. (1983) ‘Mutator strains of Escherichia coli, mutD and dnaQ,
with defective exonucleolytic editing by DNA polymerase III holoenzyme.’, Proceedings of the
National Academy of Sciences, 80(8), pp. 2189–2192. doi: 10.1073/pnas.80.8.2189.
Edgar, R. C. (2004) ‘MUSCLE: multiple sequence alignment with high accuracy and high
throughput.’, Nucleic Acids Research. 32(5), pp. 1792–7. doi: 10.1093/nar/gkh340.
Ellis, L.D., Holwerda, E.K., Hogsett, D., Rogers, S., Shao, X., Tschaplinski, T., Thorne, P. and Lynd,
L.R., (2012) ‘Closing the carbon balance for fermentation by Clostridium thermocellum (ATCC
27405)’, Bioresource Technology, 103(1), pp. 293–299. doi: 10.1016/j.biortech.2011.09.128.
Erickson, K. E., Otoupal, P. B. and Chatterjee, A. (2017) ‘Transcriptome-level signatures in gene
expression and gene expression variability during bacterial adaptive evolution’, mSphere, 2(1)
e00009-17. doi: 10.1128/msphere.00009-17.
Ertesvåg, H., Sletta, H., Senneset, M., Sun, Y.Q., Klinkenberg, G., Konradsen, T.A., Ellingsen, T.E.
and Valla, S., (2017) ‘Identification of genes affecting alginate biosynthesis in Pseudomonas
fluorescens by screening a transposon insertion library’, BMC Genomics. 18(1), 11. doi:
10.1186/s12864-016-3467-7.
Evans, R.J., Davies, D.R., Bullard, J.M., Christensen, J., Green, L.S., Guiles, J.W., Pata, J.D., Ribble,
W.K., Janjic, N. and Jarvis, T.C., (2008) ‘Structure of PolC reveals unique DNA binding and fidelity
determinants’, Proceedings of the National Academy of Sciences, 105(52), pp. 20695–20700. doi:
10.1073/pnas.0809989106.
Extance, J. (2012) 'Bioethanol production: characterisation of a bifunctional alcohol

190
dehydrogenase from Geobacillus thermoglucosidasius'. University of Bath.
Extance, J., Danson, M. J. and Crennell, S. J. (2016) ‘Structure of an acetylating aldehyde
dehydrogenase from the thermophilic ethanologen Geobacillus thermoglucosidasius’, Protein
Science, 25(11), pp. 2045–2053. doi: 10.1002/pro.3027.
Ezraty, B., Gennaris, A., Barras, F. and Collet, J.F., (2017) ‘Oxidative stress, protein damage and
repair in bacteria’, Nature Reviews Microbiology, pp. 385–396. doi: 10.1038/nrmicro.2017.26.
Farinas, C.S., Loyo, M.M., Baraldo, A., Tardioli, P.W., Neto, V.B. and Couri, S., (2010) ‘Finding
stable cellulase and xylanase: evaluation of the synergistic effect of pH and temperature’, New
Biotechnology, 27(6), pp. 810–815. doi: 10.1016/j.nbt.2010.10.001.
Fatma, S., Hameed, A., Noman, M., Ahmed, T., Sohail, I., Shahid, M., Tariq, M. and Tabassum, R.,
(2018) ‘Lignocellulosic biomass: a sustainable bioenergy source for future’, Protein & Peptide
Letters, 25, pp. 148–163. doi: 10.2174/0929866525666180122144504.
Favaro, L., Jansen, T. and van Zyl, W. H. (2019) ‘Exploring industrial and natural Saccharomyces
cerevisiae strains for the bio-based economy from biomass: the case of bioethanol’, Critical
Reviews in Biotechnology, 39(6), pp. 800–816. doi: 10.1080/07388551.2019.1619157.
Fay, P., Johanson, K., McHenry, C. and Bambara, R., (1981) ‘Size classes of products synthesized
processively by DNA polymerase III and DNA polymerase III holoenzyme of Escherichia coli’, J
Biol Chem, 256(2), pp. 976–983.
Fernández-Cabezón, L., Cros, A. and Nikel, P. I. (2019) ‘Evolutionary approaches for engineering
industrially relevant phenotypes in bacterial cell factories’, Biotechnology Journal. 14(9)
e1800439 doi: 10.1002/biot.201800439.
Fernandez-Leiro, R., Conrad, J., Scheres, S.H. and Lamers, M.H., (2015) ‘Cryo-EM structures of
the E. coli replicative DNA polymerase reveal its dynamic interactions with the DNA sliding
clamp, exonuclease and τ’, eLife, 4, e11134. doi: 10.7554/eLife.11134.
Fijalkowska, I. J. and Schaaper, R. M. (1993) ‘Antimutator mutations in the alpha subunit of
Escherichia coli DNA polymerase III: identification of the responsible mutations and alignment
with other DNA polymerases.’, Genetics, 134(4), pp. 1039–44.
Fijalkowska, I. J. and Schaaper, R. M. (1996) ‘Mutants in the Exo I motif of Escherichia coli dnaQ:
defective proofreading and inviability due to error catastrophe.’, Proceedings of the National
Academy of Sciences, 93(7), pp. 2856–2861. doi: 10.1073/pnas.93.7.2856.
Fijalkowska, I. J., Dunn, R. L. and Schaaper, R. M. (1993) ‘Mutants of Escherichia coli with
increased fidelity of DNA replication.’, Genetics, 134(4), pp. 1023–30.
Fijalkowska, I. J., Schaaper, R. M. and Jonczyk, P. (2012) ‘DNA replication fidelity in Escherichia
coli: a multi-DNA polymerase affair’, FEMS Microbiology Reviews, pp. 1105–1121. doi:
10.1111/j.1574-6976.2012.00338.x.
Fijalkowska, I.J., Jonczyk, P., Tkaczyk, M.M., Bialoskorska, M. and Schaaper, R.M., (1998)
'Unequal fidelity of leading strand and lagging strand DNA replication on the Escherichia coli
191
chromosome', Proceedings of the National Academy of Sciences of the United States of America,
95 (17), pp. 10020-10025, doi:10.1073/pnas.95.17.10020
Filée, J., Forterre, P., Sen-Lin, T. and Laurent, J., (2002) ‘Evolution of DNA polymerase families:
evidences for multiple gene exchange between cellular and viral proteins’, Journal of Molecular
Evolution, 54(6), pp. 763–773. doi: 10.1007/s00239-001-0078-x.
Fodor, K. and Alfoldi, L. (1976) ‘Fusion of protoplasts of Bacillus megaterium’, Proceedings of the
National Academy of Sciences of the United States of America. 73(6), pp. 2147–2150. doi:
10.1073/pnas.73.6.2147.
Foster, P. L. (2006) ‘Methods for determining spontaneous mutation rates’, Methods in
Enzymology, 409, pp. 195–213. doi: 10.1016/S0076-6879(05)09012-9.
Fowler, R. G. and Schaaper, R. M. (1997) ‘The role of the mutT gene of Escherichia coli in
maintaining replication fidelity’, FEMS Microbiology Reviews, 21(1), pp. 43–54. doi:
10.1111/j.1574-6976.1997.tb00344.x.
Fowler, R.G., White, S.J., Koyama, C., Moore, S.C., Dunn, R.L. and Schaaper, R.M., (2003)
‘Interactions among the Escherichia coli mutT, mutM, and mutY damage prevention pathways’,
in DNA Repair, 2(2), pp. 159–173. doi: 10.1016/S1568-7864(02)00193-3.
Franchini, A. G., Ihssen, J. and Egli, T. (2015) ‘Effect of global regulators RpoS and cyclic-
AMP/CRP on the catabolome and transcriptome of Escherichia coli K12 during carbon-and
energy-limited growth’. PLoS One, 10(7), e0133793. doi: 10.1371/journal.pone.0133793.
Freed, E., Fenster, J., Smolinski, S.L., Walker, J., Henard, C.A., Gill, R. and Eckert, C.A., (2018)
‘Building a genome engineering toolbox in nonmodel prokaryotic microbes’, Biotechnology and
Bioengineering, 115(9), pp. 2120–2138. doi: 10.1002/bit.26727.
Fridjonsson, O., Watzlawick, H. and Mattes, R. (2002) ‘Thermoadaptation of α-galactosidase
AgaB1 in Thermus thermophilus’, Journal of Bacteriology, 184(12), pp. 3385–3391. doi:
10.1128/JB.184.12.3385-3391.2002.
Fujita, Y. (2009) ‘Carbon catabolite control of the metabolic network in Bacillus subtilis’,
Bioscience, Biotechnology and Biochemistry, 73(2), pp. 245–259. doi: 10.1271/bbb.80479.
Fukushima, S., Itaya, M., Kato, H., Ogasawara, N. and Yoshikawa, H., (2007) ‘Reassessment of the
in vivo functions of DNA Polymerase I and RNase H in bacterial cell growth’, Journal of
Bacteriology, 189(23), pp. 8575–8583. doi: 10.1128/JB.00653-07.
Gabrovsky, V., Yamamoto, M. L. and Miller, J. H. (2005) ‘Mutator effects in Escherichia coli
caused by the expression of specific foreign genes.’, Journal of Bacteriology, 187(14), pp. 5044–
8. doi: 10.1128/JB.187.14.5044-5048.2005.
Galinski, E. A. and Trüper, H. G. (1994) ‘Microbial behaviour in salt-stressed ecosystems’, FEMS
Microbiology Reviews, 15(2–3), pp. 95–108. doi: 10.1111/j.1574-6976.1994.tb00128.x.
Galletto, R., Jezewska, M. J. and Bujalowski, W. (2004) ‘Unzipping mechanism of the double-
stranded DNA unwinding by a hexameric helicase: quantitative analysis of the rate of the dsDNA
192
unwinding, processivity and kinetic step-size of the Escherichia coli DnaB helicase using rapid
quench-flow method’, Journal of Molecular Biology, 343(1), pp. 83–99. doi:
10.1016/j.jmb.2004.07.055.
Gao, D. and McHenry, C. S. (2001a) ‘τ binds and organizes Escherichia coli replication proteins
through distinct domains. Domain IV, located within the unique C terminus of τ, binds the
replication fork helicase, DnaB’, Journal of Biological Chemistry, 276(6), pp. 4441–4446. doi:
10.1074/jbc.M009830200.
Gao, D. and McHenry, C. S. (2001b) ‘τ binds and organizes Escherichia coli replication proteins
through distinct domains. Partial proteolysis of terminally tagged τ to determine candidate
domains and to assign domain V as the α binding domain’, Journal of Biological Chemistry,
276(6), pp. 4433–4440. doi: 10.1074/jbc.M009828200.
Gao, X., Jiang, L., Zhu, L., Xu, Q., Xu, X. and Huang, H., (2016) ‘Tailoring of global transcription
sigma D factor by random mutagenesis to improve Escherichia coli tolerance towards low-pHs’,
Journal of Biotechnology. 224, pp. 55–63. doi: 10.1016/j.jbiotec.2016.03.012.
Gardner, J.G., Grundy, F.J., Henkin, T.M., Escalante-Semerena, J.C., (2006) ‘Control of acetyl-
coenzyme A synthetase (AcsA) activity by acetylation/deacetylation without NAD+ involvement
in Bacillus subtilis’, Journal of Bacteriology, 188(15), pp. 5460–5468. doi: 10.1128/JB.00215-06.
Gardner, Jeffrey G and Escalante-Semerena, J. C. (2009) ‘In Bacillus subtilis, the sirtuin protein
deacetylase, encoded by the srtN gene (formerly yhdZ), and functions encoded by the acuABC
genes control the activity of acetyl coenzyme a synthetase’, Journal of Bacteriology, 191(6), pp.
1749–1755. doi: 10.1128/JB.01674-08.
Garvey, N., St John, A. and Witkin, E. (1985) ‘Evidence for RecA protein association with the cell
membrane and for changes in the levels of major outer membrane proteins in SOS-induced
Escherichia coli cells’, Journal of Bacteriology, 163(3), pp. 870–876.
Gawel, D., Maliszewska-Tkaczyk, M., Jonczyk, P., Schaaper, R.M. and Fijalkowska, I.J., (2002)
‘Lack of strand bias in UV-induced mutagenesis in Escherichia coli’, Journal of Bacteriology,
184(16), pp. 4449–4454. doi: 10.1128/JB.184.16.4449-4454.2002.
Geer, L.Y., Domrachev, M., Lipman, D.J. and Bryant, S.H., (2002) ‘CDART: Protein homology by
domain architecture’, Genome Research. 12(10), pp. 1619–1623. doi: 10.1101/gr.278202.
Gertz, E.M., Yu, Y.-K., Agarwala, R., Schäffer, A.A. and Altschul, S.F., (2006) ‘Composition-based
statistics and translated nucleotide searches: improving the TBLASTN module of BLAST.’, BMC
biology. 4, p. 41. doi: 10.1186/1741-7007-4-41.
Ghosh, D., Veeraraghavan, B., Elangovan, R. and Vivekanandan, P., (2020) ‘Antibiotic resistance
and epigenetics: more to it than meets the eye’. Antimicrobial Agents and Chemotherapy.
64(2):e02225-19 doi: 10.1128/AAC.02225-19.
Ginetti, F., Perego, M., Albertini, A.M. and Galizzi, A., (1996) ‘Bacillus subtilis mutS mutL operon:
identification, nucleotide sequence and mutagenesis’, Microbiology, 142(8), pp. 2021–2029. doi:
10.1099/13500872-142-8-2021.

193
Goodarzi, H., Bennett, B.D., Amini, S., Reaves, M.L., Hottes, A.K., Rabinowitz, J.D. and Tavazoie,
S., (2010) ‘Regulatory and metabolic rewiring during laboratory evolution of ethanol tolerance in
E. coli.’, Molecular systems biology. 6(1), p. 378. doi: 10.1038/msb.2010.33.
Gourdon, P., Raherimandimby, M., Dominguez, H., Cocaign-Bousquet, M. and Lindley, N.D.,
(2003). Osmotic stress, glucose transport capacity and consequences for glutamate
overproduction in Corynebacterium glutamicum. Journal of Biotechnology, 104(1–3), pp.77–85.
doi: 10.1016/S0168-1656(03)00165-2.
Gouy, M., Guindon, S. and Gascuel, O. (2010) ‘SeaView Version 4: a multiplatform graphical user
interface for sequence alignment and phylogenetic tree building’, Mol. Biol. Evol, 27(2), pp. 221–
224. doi: 10.1093/molbev/msp259.
Greener, A., Callahan, M. and Jerpseth, B. (1997) ‘An efficient random mutagenesis technique
using an E. coli mutator strain’, Molecular Biotechnology. 7(2), pp. 189–195. doi:
10.1007/BF02761755.
Gresham, D. and Dunham, M.J., (2014). The enduring utility of continuous culturing in
experimental evolution. Genomics, 104(6), pp.399–405. doi: 10.1016/j.ygeno.2014.09.015
Grollman, A. P. and Moriya, M. (1993) ‘Mutagenesis by 8-oxoguanine: an enemy within’, Trends
in Genetics, 9(7) pp. 246–249. doi: 10.1016/0168-9525(93)90089-Z.
Grundy, F.J., Waters, D.A., Takova, T.Y. and Henkin, T.M., (1993) ‘Identification of genes involved
in utilization of acetate and acetoin in Bacillus subtilis’, Molecular Microbiology, 10(2), pp. 259–
271. doi: 10.1111/j.1365-2958.1993.tb01952.x.
Haft, R.J.F., Keating, D.H., Schwaegler, T., Schwalbach, M.S., Vinokur, J., Tremaine, M., Peters,
J.M., Kotlajich, M. V., Pohlmann, E.L., Ong, I.M., Grass, J. a., Kiley, P.J. and Landick, R., (2014)
‘Correcting direct effects of ethanol on translation and transcription machinery confers ethanol
tolerance in bacteria’, Proceedings of the National Academy of Sciences, 111(25), pp. E2576–
E2585. doi: 10.1073/pnas.1401853111.
Haldenwang, W. G. (1995) 'The sigma factors of Bacillus subtilis', Microbiological Reviews. 59(1),
pp. 1–30.
Hamdan, S., Carr, P.D., Brown, S.E., Ollis, D.L. and Dixon, N.E., (2002) ‘Structural basis for
proofreading during replication of the Escherichia coli chromosome’, Structure, 10(4), pp. 535–
546. doi: 10.1016/S0969-2126(02)00738-4.
Henke, E. and Bornscheuer, U. T. (1999) ‘Directed evolution of an esterase from Pseudomonas
fluorescens. Random mutagenesis by error-prone PCR or a mutator strain and identification of
mutants showing enhanced enantioselectivity by a resorufin-based fluorescence assay’,
Biological Chemistry, 380(7–8), pp. 1029–1033. doi: 10.1515/BC.1999.128.
Herrero, A. A. and Gomez, R. F. (1980) ‘Development of ethanol tolerance in Clostridium
thermocellum: effect of growth temperature’, Applied and Environmental Microbiology, 40(3),
pp. 571–577. doi: 10.1128/aem.40.3.571-577.1980.
Herrero, A. A., Gomez, R. F. and Roberts, M. F. (1985) ‘31P NMR studies of Clostridium

194
thermocellum. Mechanism of end product inhibition by ethanol’, Journal of Biological Chemistry,
260(12), pp. 7442–7451.
Hertel, T., Steinbuks, J. and Baldos, U. (2013) ‘Competition for land in the global bioeconomy’,
Agricultural Economics, 44(s1), pp. 129–138. doi: 10.1111/agec.12057.
Hida, H., Yamada, T. and Yamada, Y. (2007) ‘Genome shuffling of Streptomyces sp. U121 for
improved production of hydroxycitric acid’, Applied Microbiology and Biotechnology, 73(6), pp.
1387–1393. doi: 10.1007/s00253-006-0613-1.
Hills, C. A. (2014) 'Acetate metabolism in Geobacillus thermoglucosidasius and strain engineering
for enhanced bioethanol production' University of Bath
Hisanaga, Y., Ago, H., Nakagawa, N., Hamada, K., Ida, K., Yamamoto, M., Hori, T., Arii, Y.,
Sugahara, M., Kuramitsu, S., Yokoyama, S. and Miyano, M., (2004) ‘Structural basis of the
substrate-specific two-step catalysis of long chain fatty acyl-CoA synthetase dimer’, Journal of
Biological Chemistry, 279(30), pp. 31717–31726. doi: 10.1074/jbc.M400100200.
Hoffmann, T., Troup, B., Szabo, A., Hungerer, C. and Jahn, D., (1995) ‘The anaerobic life of
Bacillus subtilis: cloning of the genes encoding the respiratory nitrate reductase system’, FEMS
Microbiology Letters, 131(2), pp. 219–225. doi: 10.1016/0378-1097(95)00262-4.
Hoffmann, T., Wensing, A., Brosius, M., Steil, L., Völker, U. and Bremer, E., (2013) ‘Osmotic
control of opuA expression in Bacillus subtilis and its modulation in response to intracellular
glycine betaine and proline pools’, Journal of Bacteriology, 195(3), pp. 510–522. doi:
10.1128/JB.01505-12.
Hohmann, S. (2009) ‘Control of high osmolarity signalling in the yeast Saccharomyces cerevisiae’,
FEBS Letters, 583(24), pp. 4025–4029. doi: 10.1016/j.febslet.2009.10.069.
Hooper, D. C. (2001) ‘Emerging mechanisms of fluoroquinolone resistance’, Emerging Infectious
Diseases, 7(2), pp. 337–341.
Horinouchi, T., Maeda, T. and Furusawa, C. (2018) ‘Understanding and engineering alcohol-
tolerant bacteria using OMICS technology’, World Journal of Microbiology and Biotechnology,
34(11), p. 157. doi: 10.1007/s11274-018-2542-4.
Horinouchi, T., Maeda, T. and Furusawa, C., (2015) ‘Phenotypic convergence in bacterial
adaptive evolution to ethanol stress.’, BMC evolutionary biology. 15(1), p. 180. doi:
10.1186/s12862-015-0454-6.
Horiuchi, T., Maki, H. and Sekiguchi, M. (1978) ‘A new conditional lethal mutator (dnaQ49) in
Escherichia coli K12’, MGG Molecular & General Genetics. 163(3), pp. 277–283. doi:
10.1007/BF00271956.
Horn, S.J., Vaaje-Kolstad, G., Westereng, B. and Eijsink, V.G., (2012) ‘Novel enzymes for the
degradation of cellulose’, Biotechnology for Biofuels, p. 1. doi: 10.1186/1754-6834-5-45.
Hoseki, J., Yano, T., Koyama, Y., Kuramitsu, S. and Kagamiyama, H., (1999) ‘Directed evolution of
thermostable kanamycin-resistance gene: a convenient selection marker for Thermus
195
thermophilus’, Journal of Biochemistry, 126(5), pp. 951–956. doi:
10.1093/oxfordjournals.jbchem.a022539.
Hossain, G.S., Nadarajan, S.P., Zhang, L., Ng, T.K., Foo, J.L., Ling, H., Choi, W.J. and Chang, M.W.,
(2018) ‘Rewriting the metabolic blueprint: Advances in pathway diversification in
microorganisms’, Frontiers in Microbiology, pp. 1–10. doi: 10.3389/fmicb.2018.00155.
Hsu, G.W., Ober, M., Carell, T. and Beese, L.S., (2004) ‘Error-prone replication of oxidatively
damaged DNA by a high-fidelity DNA polymerase.’, Nature, 431(7005), pp. 217–21. doi:
10.1038/nature02908.
Hu, Jiajun, Xue, Y., Guo, H., Gao, M. tian, Li, J., Zhang, S. and Tsang, Y.F., (2017) ‘Molecular
mechanisms and genomic maps of DNA excision repair in Escherichia coli and humans’, Journal
of Biological Chemistry, pp. 15588–15597. doi: 10.1074/jbc.R117.807453.
Hu, Jinchuan, Selby, C.P., Adar, S., Adebali, O. and Sancar, A., (2017) ‘Design and composition of
synthetic fungal-bacterial microbial consortia that improve lignocellulolytic enzyme activity’,
Bioresource Technology, 227, pp. 247–255. doi: 10.1016/j.biortech.2016.12.058.
Huerta-Cepas, J., Forslund, K., Coelho, L.P., Szklarczyk, D., Jensen, L.J., Von Mering, C. and Bork,
P., (2017) ‘Fast genome-wide functional annotation through orthology assignment by eggNOG-
mapper’, Molecular Biology and Evolution, 34(8), pp. 2115–2122. doi: 10.1093/molbev/msx148.
Huffer, S., Clark, M.E., Ning, J.C., Blanch, H.W. and Clark, D.S., (2011) ‘Role of alcohols in growth,
lipid composition, and membrane fluidity of yeasts, bacteria, and archaea’, Applied and
Environmental Microbiology, 77(18), pp. 6400–6408. doi: 10.1128/AEM.00694-11.
Husain, I., van Houten, B., Thomas, D.C., Abdel-Monem, M. and Sancar, A., (1985) ‘Effect of DNA
polymerase I and DNA helicase II on the turnover rate of UvrABC excision nuclease’, Proceedings
of the National Academy of Sciences of the United States of America, 82(20), pp. 6774–6778. doi:
10.1073/pnas.82.20.6774.
Huseby, D. L. and Roth, J. R. (2013) ‘Evidence that a metabolic microcompartment contains and
recycles private cofactor pools’. Journal of Bacteriology. 195(12), pp. 2864-79, doi:
10.1128/JB.02179-12.
Hussein, A. H., Lisowska, B. K. and Leak, D. J. (2015) ‘The genus Geobacillus and their
biotechnological potential’, Advances in Applied Microbiology. 92, pp. 1–48. doi:
10.1016/bs.aambs.2015.03.001.
Huttenhofer, A. and Noller, H. F. (1994) ‘Footprinting mRNA-ribosome complexes with chemical
probes’, EMBO Journal. 13(16), pp. 3892–3901. doi: 10.1002/j.1460-2075.1994.tb06700.x.
Ingram, L. O. (1976) ‘Adaptation of membrane lipids to alcohols’, Journal of Bacteriology, 125(2),
pp. 670–678. doi: 10.1128/jb.125.2.670-678.1976.
Ingram, L. O. (1989) ‘Ethanol tolerance in bacteria’, Critical Reviews in Biotechnology, 9(4), pp.
305–319. doi: 10.3109/07388558909036741.
Ingram, L. O. and Vreeland, N. S. (1980) ‘Differential effects of ethanol and hexanol on the
196
Escherichia coli cell envelope’, Journal of Bacteriology, 144(2), pp. 481–488. doi:
10.1128/jb.144.2.481-488.1980.
Ingram, L. O. N. and Buttke, T. M. (1985) ‘Effects of alcohols on micro-organisms’, Advances in
Microbial Physiology, 25(C), pp. 253–300. doi: 10.1016/S0065-2911(08)60294-5.
Inoue, R., Kaito, C., Tanabe, M., Kamura, K., Akimitsu, N. and Sekimizu, K., (2001) ‘Genetic
identification of two distinct DNA polymerases, DnaE and PolC, that are essential for
chromosomal DNA replication in Staphylococcus aureus’, Molecular Genetics and Genomics,
266(4), pp. 564–571. doi: 10.1007/s004380100564.
IPCC (2014) 'Summary for Policymakers, In: Climate Change 2014, Mitigation of Climate Change'.
Contribution of Working Group III to the Fifth Assessment Report of the Intergovernmental
Panel on Climate Change. Edited by O. Edenhofer, R. Pichs-Madruga, Y. Sokona, E. Farahani, S. S.
Kadner, K. Seyboth, A. Adler, I. Baum, S. Brunner, P. Eickemeier, B. Kriemann, J. Savolainen, S.
Schlömer, C. von Stechow, T. Zwickel and J.C. Minx, Cambridge, United Kingdom and New York,
NY, USA: Cambridge University Press. doi: 10.1017/CBO9781107415324.
Ito, J. and Braithwaite, D. K. (1991) ‘Compilation and alignment of DNA polymerase sequences’,
Nucleic Acids Research, 19(15), pp. 4045–4057. doi: 10.1093/nar/19.15.4045.
Iwasaki,’, H., Nakata, A., Walker, G.C. and Shinagawa1, H., (1990) 'The Escherichia coli polB gene,
which encodes DNA Polymerase II, is regulated by the SOS system', Journal of Bacteriology.
172(11), pp. 6268-73. doi: 10.1128/jb.172.11.6268-6273.1990.
Jahreis, K., Pimentel-Schmitt, E.F., Brückner, R. and Titgemeyer, F., (2008) ‘Ins and outs of
glucose transport systems in eubacteria’, FEMS Microbiology Reviews, pp. 891–907. doi:
10.1111/j.1574-6976.2008.00125.x.
Janion, C. (2008) ‘Inducible SOS response system of DNA repair and mutagenesis in Escherichia
coli’, International Journal of Biological Sciences. 4(6) pp. 338–344. doi: 10.7150/ijbs.4.338.
Jayaraman, R. (2010) ‘Mutators and hypermutability in bacteria: the Escherichia coli paradigm’,
Journal of Genetics, 88(3) pp. 379–391. doi: 10.1007/s12041-009-0058-2.
Jedrey, H., Lilley, K. S. and Welch, M. (2018) ‘Ciprofloxacin binding to GyrA causes global changes
in the proteome of Pseudomonas aeruginosa’, FEMS Microbiology Letters, 365(13) p. 134. doi:
10.1093/femsle/fny134.
Jensen, L.J., Julien, P., Kuhn, M., von Mering, C., Muller, J., Doerks, T. and Bork, P., (2008)
‘eggNOG: automated construction and annotation of orthologous groups of genes’, Nucleic
Acids Research, 36(SUPPL. 1). doi: 10.1093/nar/gkm796.
Jeruzalmi, D., O’Donnell, M. and Kuriyan, J. (2001) ‘Crystal structure of the processivity clamp
loader gamma (γ) complex of E. coli DNA polymerase III’, Cell. 106(4), pp. 429–441. doi:
10.1016/S0092-8674(01)00463-9.
Johanson, K. O. and McHenry, C. S. (1980) ‘Purification and characterization of the beta subunit
of the DNA polymerase III holoenzyme of Escherichia coli.’, The Journal of Biological Chemistry,
197
255(22), pp. 10984–90.
Johnson, A. and O’donnell, M. (2005) ‘Cellular DNA replicases: components and dynamics at the
replication fork’, Annual Review of Biochemistry, 74, pp. 283–315. doi:
10.1146/annurev.biochem.73.011303.073859.
Johnson, S. K., Bhattacharyya, S. and Griep, M. A. (2000) ‘DnaB helicase stimulates primer
synthesis activity on short oligonucleotide templates’, Biochemistry, 39(4), pp. 736–744. doi:
10.1021/bi991554l.
Jones, R. P. (1990) ‘Roles for replicative deactivation in yeast-ethanol fermentations’, Critical
Reviews in Biotechnology, 10(3), pp. 205–222. doi: 10.3109/07388559009038208.
Jönsson, L. J. and Martín, C. (2016) ‘Pretreatment of lignocellulose: formation of inhibitory by-
products and strategies for minimizing their effects’, Bioresource Technology, pp. 103–112. doi:
10.1016/j.biortech.2015.10.009.
Junop, M.S., Obmolova, G., Rausch, K., Hsieh, P. and Yang, W. (2001) ‘Composite active site of an
ABC ATPase: MutS uses ATP to verify mismatch recognition and authorize DNA repair.’,
Molecular cell, 7(1), pp. 1–12. doi: 10.1016/s1097-2765(01)00149-6.
Junop, M.S., Yang, W., Funchain, P., Clendenin, W. and Miller, J.H.,(2003) ‘In vitro and in vivo
studies of MutS, MutL and MutH mutants: correlation of mismatch repair and DNA
recombination’, DNA Repair. 2(4), pp. 387–405. doi: 10.1016/S1568-7864(02)00245-8.
Kadyrov, F.A., Holmes, S.F., Arana, M.E., Lukianova, O.A., O’Donnell, M., Kunkel, T.A. and
Modrich, P., (2007) ‘Saccharomyces cerevisiae MutLα is a mismatch repair endonuclease’,
Journal of Biological Chemistry, 282(51), pp. 37181–37190. doi: 10.1074/jbc.M707617200.
Kananavičiute, R. and Čitavičius, D. (2015) ‘Genetic engineering of Geobacillus spp.’, Journal of
Microbiological Methods, 111, pp. 31–39. doi: 10.1016/j.mimet.2015.02.002.
Kapfhammer, D., Karatan, E., Pflughoeft, K.J. and Watnick, P.I., (2005) ‘Role for glycine betaine
transport in Vibrio cholerae osmoadaptation and biofilm formation within microbial
communities’, Applied and Environmental Microbiology, 71(7), pp. 3840–3847. doi:
10.1128/AEM.71.7.3840-3847.2005.
Karimova, G., Ladant, D. and Ullmann, A. (2004) ‘Relief of catabolite repression in a cAMP-
independent catabolite gene activator mutant of Escherichia coli’, Research in Microbiology.
155(2), pp.76-79 doi: 10.1016/j.resmic.2003.11.002.
Karlin, S. and Altschul, S. F. (1990) ‘Methods for assessing the statistical significance of molecular
sequence features by using general scoring schemes’, Proceedings of the National Academy of
Sciences of the United States of America. 87(6), pp. 2264–2268. doi: 10.1073/pnas.87.6.2264.
Keasling, J. D. (2012) ‘Synthetic biology and the development of tools for metabolic engineering’,
Metabolic Engineering. 14(3), pp. 189–195. doi: 10.1016/j.ymben.2012.01.004.
Kelman, Z. and O’donnell, M. (1995) 'DNA polymerase III holoenzyme: structure and function of
a chromosomal replicating machine', Annual Review of Biochemistry. 64, pp.171-200. doi:
198
10.1146/annurev.bi.64.070195.001131.
Kelpšas, V. and Wachenfeldt, C. von (2019) ‘Strain improvement of Escherichia coli K-12 for
recombinant production of deuterated proteins’, Scientific Reports, 9(1). doi: 10.1038/s41598-
019-54196-w.
Kempf, B. and Bremer, E. (1998) ‘Uptake and synthesis of compatible solutes as microbial stress
responses to high-osmolality environments’, Archives of Microbiology, 170, pp. 319–330.
Kenna, D.T., Doherty, C.J., Foweraker, J., Macaskill, L., Barcus, V.A. and Govan, J.R.W., (2007)
‘Hypermutability in environmental Pseudomonas aeruginosa and in populations causing
pulmonary infection in individuals with cystic fibrosis’, Microbiology, 153(6), pp. 1852–1859. doi:
10.1099/mic.0.2006/005082-0.
Keseler, I.M., Collado-Vides, J., Santos-Zavaleta, A., Peralta-Gil, M., Gama-Castro, S., Muniz-
Rascado, L., Bonavides-Martinez, C., Paley, S., Krummenacker, M., Altman, T., Kaipa, P.,
Spaulding, A., Pacheco, J., Latendresse, M., Fulcher, C., Sarker, M., Shearer, A.G., Mackie, A.,
Paulsen, I., Gunsalus, R.P. and Karp, P.D., (2011) ‘EcoCyc: a comprehensive database of
Escherichia coli biology’, Nucleic Acids Research, 39(Database), pp. D583–D590. doi:
10.1093/nar/gkq1143.
Khare, S. K., Pandey, A. and Larroche, C. (2015) ‘Current perspectives in enzymatic
saccharification of lignocellulosic biomass’, Biochemical Engineering Journal. Elsevier B.V., 102,
pp. 38–44. doi: 10.1016/j.bej.2015.02.033.
Kim, S.R., Matsui, K., Yamada, M., Gruz, P. and Nohmi, T., (2001) ‘Roles of chromosomal and
episomal dinB genes encoding DNA pol IV in targeted and untargeted mutagenesis in Escherichia
coli’, Molecular Genetics and Genomics, 266(2), pp. 207–215. doi: 10.1007/s004380100541.
Kim, Y., Ingram, L. O. and Shanmugam, K. T. (2008) ‘Dihydrolipoamide dehydrogenase mutation
alters the NADH sensitivity of pyruvate dehydrogenase complex of Escherichia coli K-12’, Journal
of Bacteriology.190(11), pp. 3851–3858. doi: 10.1128/JB.00104-08.
Kisker, C., Kuper, J. and Van Houten, B. (2013) ‘Prokaryotic nucleotide excision repair’, Cold
Spring Harbor Perspectives in Biology, 5(3). doi: 10.1101/cshperspect.a012591.
Klein-Marcuschamer, D. and Stephanopoulos, G. (2008) ‘Assessing the potential of mutational
strategies to elicit new phenotypes in industrial strains’, Proceedings of the National Academy of
Sciences of the United States of America, 105(7), pp. 2319–2324. doi:
10.1073/pnas.0712177105.
Klett, R. P., Cerami, A. and Reich, E. (1968) ‘Exonuclease VI, a new nuclease activity associated
with E. coli DNA polymerase.’, Proceedings of the National Academy of Sciences of the United
States of America, 60(3), pp. 943–950. doi: 10.1073/pnas.60.3.943.
Klocko, A.D., Schroeder, J.W., Walsh, B.W., Lenhart, J.S., Evans, M.L. and Simmons, L.A., (2011)
‘Mismatch repair causes the dynamic release of an essential DNA polymerase from the
replication fork’, Molecular Microbiology, 82(3), pp. 648–663. doi: 10.1111/j.1365-
2958.2011.07841.x.
199
Kobayashi, J., Furukawa, M., Ohshiro, T. and Suzuki, H., (2015) ‘Thermoadaptation-directed
evolution of chloramphenicol acetyltransferase in an error-prone thermophile using improved
procedures’, Applied Microbiology and Biotechnology, 99(13), pp. 5563–5572. doi:
10.1007/s00253-015-6522-4.
Koboldt, D.C., Chen, K., Wylie, T., Larson, D.E., Mclellan, M.D., Mardis, E.R., Weinstock, G.M.,
Wilson, R.K. and Ding, L., (2009) ‘VarScan: variant detection in massively parallel sequencing of
individual and pooled samples’, Bioinformatics Applications Note, 25(17), pp. 2283–2285. doi:
10.1093/bioinformatics/btp373.
Kodym, A. and Afza, R. (2003) ‘Physical and chemical mutagenesis.’, Methods in Molecular
Biology, 236, pp. 189–204. doi: 10.1385/1-59259-413-1:189.
Koehler, N., Chairman, R., Mccaherty, J., Charles, W. and Cooper, G., (2019) 2019 Ethanol
Industry Outlook - Powered with renewed energy. Available at: www.eenergyadams.com
Konrad, E. B. (1978) ‘Isolation of an Escherichia coli K-12 dnaE mutation as a mutator.’, Journal
of Bacteriology, 133(3), pp. 1197–202.
Koppram, R., Tomás-Pejó, E., Xiros, C. and Olsson, L., (2014) ‘Lignocellulosic ethanol production
at high-gravity: challenges and perspectives’, Trends in Biotechnology, 32(1), pp. 46–53. doi:
10.1016/j.tibtech.2013.10.003.
Koprivnjak, T., Zhang, D., Ernst, C.M., Peschel, A., Nauseef, W.M. and Weiss, J.P., (2011)
‘Characterization of Staphylococcus aureus cardiolipin synthases 1 and 2 and their contribution
to accumulation of cardiolipin in stationary phase and within phagocytes’, Journal of
Bacteriology, 193(16), pp. 4134–4142. doi: 10.1128/JB.00288-11.
Kotrba, P., Inui, M. and Yukawa, H. (2001) ‘Bacterial phosphotransferase system (PTS) in
carbohydrate uptake and control of carbon metabolism’, Journal of Bioscience and
Bioengineering. 92(6), pp. 502–517. doi: 10.1016/S1389-1723(01)80308-X.
Krylova, A. Y., Kozyukov, E. A. and Lapidus, A. L. (2008) ‘Ethanol and diesel fuel from plant raw
materials: a review’, Solid Fuel Chemistry, 42(6), pp. 358–364. doi:
10.3103/S0361521908060062.
Ku, J. T., Chen, A. Y. and Lan, E. I. (2020) ‘Metabolic engineering design strategies for increasing
acetyl-CoA flux’, Metabolites, 10(4), p. 166. doi: 10.3390/metabo10040166.
Kuban, W., Banach-Orlowska, M., Bialoskorska, M., Lipowska, A., Schaaper, R.M., Jonczyk, P. and
Fijalkowska, I.J., (2005) ‘Mutator phenotype resulting from DNA polymerase IV overproduction
in Escherichia coli: preferential mutagenesis on the lagging strand’, Journal of Bacteriology,
187(19), pp. 6862–6866. doi: 10.1128/JB.187.19.6862-6866.2005.
Kuban, W., Jonczyk, P., Gawel, D., Malanowska, K., Schaaper, R.M. and Fijalkowska, I.J., (2004)
‘Role of Escherichia coli DNA polymerase IV in in vivo replication fidelity’, Journal of Bacteriology,
186(14), pp. 4802–4807. doi: 10.1128/JB.186.14.4802-4807.2004.
Kumar, R., Tabatabaei, M., Karimi, K. and Sárvári Horváth, I., (2016) ‘Recent updates on
lignocellulosic biomass derived ethanol - a review’, Biofuel Research Journal, 3(1), pp. 347–356.
200
doi: 10.18331/BRJ2016.3.1.4.
Kunkel, T. A. and Burgers, P. M. (2008) ‘Dividing the workload at a eukaryotic replication fork’,
Trends in Cell Biology, 18(11) pp. 521–527. doi: 10.1016/j.tcb.2008.08.005.
Kurosawa, K., Hosaka, T., Tamehiro, N., Inaoka, T. and Ochi, K., (2006) ‘Improvement of α-
amylase production by modulation of ribosomal component protein S12 in Bacillus subtilis 168’,
Applied and Environmental Microbiology, 72(1), pp. 71–77. doi: 10.1128/AEM.72.1.71-77.2006.
Lacks, S. A., Dunn, J. J. and Greenberg, B. (1982) ‘Identification of base mismatches recognized
by the heteroduplex-DNA-repair system of Streptococcus pneumoniae’, Cell, 31(2 PART 1), pp.
327–336. doi: 10.1016/0092-8674(82)90126-X.
Lada, A.G., Krick, C.F., Kozmin, S.G., Mayorov, V.I., Karpova, T.S., Rogozin, I.B. and Pavlov, Y.I.,
(2011) ‘Mutator effects and mutation signatures of editing deaminases produced in bacteria and
yeast.’, Biochemistry. 76(1), pp. 131–46. doi: 10.1134/s0006297911010135.
Lanza, Amanda M and Alper, H. S. (2012) ‘Using transcription machinery engineering to elicit
complex cellular phenotypes’, Methods in Molecular Biology, 813, pp. 229–248. doi:
10.1007/978-1-61779-412-4_14.
Larkin, M.A., Blackshields, G., Brown, N.P., Chenna, R., McGettigan, P.A., McWilliam, H.,
Valentin, F., Wallace, I.M., Wilm, A., Lopez, R., Thompson, J.D., Gibson, T.J. and Higgins, D.G.,
(2007) ‘Clustal W and Clustal X version 2.0.’, Bioinformatics, 23(21), pp. 2947–8. doi:
10.1093/bioinformatics/btm404.
Le Chatelier, E., Bécherel, O.J., D’Alençon, E., Canceill, D., Ehrlich, S.D., Fuchs, R.P.P. and
Jannière, L., (2004) ‘Involvement of DnaE, the second replicative DNA polymerase from Bacillus
subtilis, in DNA mutagenesis’, Journal of Biological Chemistry. 279(3), pp. 1757–1767. doi:
10.1074/jbc.M310719200.
Lee, J.Y., Seo, J., Kim, E.S., Lee, H.S. and Kim, P., (2013) ‘Adaptive evolution of Corynebacterium
glutamicum resistant to oxidative stress and its global gene expression profiling’, Biotechnology
Letters, 35(5), pp. 709–717. doi: 10.1007/s10529-012-1135-9.
Leimkühler, S. and Iobbi-Nivol, C. (2015) ‘Bacterial molybdoenzymes: old enzymes for new
purposes’, FEMS Microbiology Reviews, 0(1) pp. 1–18. doi: 10.1093/femsre/fuv043.
Lemon, K. P. and Grossman, A. D. (1998) ‘Localization of bacterial DNA polymerase: evidence for
a factory model of replication’, Science. 282(5393), pp. 1516–1519. doi:
10.1126/science.282.5393.1516.
Lenhart, J.S., Pillon, M.C., Guarné, A., Biteen, J.S. and Simmons, L.A., (2016) ‘Mismatch repair in
Gram-positive bacteria’, Research in Microbiology, 167(1) pp. 4–12. doi:
10.1016/j.resmic.2015.08.006.
Lenhart, J.S., Schroeder, J.W., Walsh, B.W. and Simmons, L.A., (2012) ‘DNA repair and genome
maintenance in Bacillus subtilis’, Microbiology and Molecular Biology Reviews, 76(3), pp. 530–
564. doi: 10.1128/mmbr.05020-11.
201
Lenhart, J.S., Sharma, A., Hingorani, M.M. and Simmons, L.A., (2013) ‘DnaN clamp zones provide
a platform for spatiotemporal coupling of mismatch detection to DNA replication’, Molecular
Microbiology, 87(3), pp. 553–568. doi: 10.1111/mmi.12115.
Lewis, J. S., Jergic, S. and Dixon, N. E. (2016) ‘The E. coli DNA replication fork’, in Enzymes, 39 pp.
31–88. doi: 10.1016/bs.enz.2016.04.001.
Li, F., Liu, Q., Chen, Y.Y., Yu, Z.N., Zhang, Z.P., Zhou, Y.F., Deng, J.Y., Bi, L.J. and Zhang, X.E., (2008)
‘Escherichia coli mismatch repair protein MutL interacts with the clamp loader subunits of DNA
polymerase III’, Mutation Research - Fundamental and Molecular Mechanisms of Mutagenesis,
637(1–2), pp. 101–110. doi: 10.1016/j.mrfmmm.2007.07.008.
Li, G. M. (2008) ‘Mechanisms and functions of DNA mismatch repair’, Cell Research, pp. 85–98.
doi: 10.1038/cr.2007.115.
Li, Y., Schroeder, J.W., Simmons, L.A. and Biteen, J.S., (2018) ‘Visualizing bacterial DNA
replication and repair with molecular resolution’, Current Opinion in Microbiology, 43, pp. 38–
45. doi: 10.1016/j.mib.2017.11.009.
Liao, D.I., Reiss, L., Turner, I. and Dotson, G., (2003) ‘Structure of glycerol dehydratase
reactivase: a new type of molecular chaperone’, Structure. 11(1), pp. 109–119. doi:
10.1016/S0969-2126(02)00935-8.
Liao, H., McKenzie, T. and Hageman, R. (1986) ‘Isolation of a thermostable enzyme variant by
cloning and selection in a thermophile.’, Proceedings of the National Academy of Sciences of the
United States of America, 83(3), pp. 576–80. doi: 10.1073/pnas.83.3.576.
Liao, J.C., Mi, L., Pontrelli, S. and Luo, S., (2016) ‘Fuelling the future: Microbial engineering for
the production of sustainable biofuels’, Nature Reviews Microbiology, 14(5), pp. 288–304. doi:
10.1038/nrmicro.2016.32.
Liao, Y., Schroeder, J.W., Gao, B., Simmons, L.A. and Biteen, J.S., (2015) ‘Single-molecule motions
and interactions in live cells reveal target search dynamics in mismatch repair’, Proceedings of
the National Academy of Sciences of the United States of America. 112(50), pp. E6898–E6906.
doi: 10.1073/pnas.1507386112.
Liu, L., Pan, A., Spofford, C., Zhou, N. and Alper, H.S., (2015) ‘An evolutionary metabolic
engineering approach for enhancing lipogenesis in Yarrowia lipolytica’, Metabolic Engineering.
29, pp. 36–45. doi: 10.1016/j.ymben.2015.02.003.
Liu, S. and Qureshi, N. (2009) ‘How microbes tolerate ethanol and butanol’, New Biotechnology,
26(3-4), pp. 117–121. doi: 10.1016/j.nbt.2009.06.984.
Lo, J., Zheng, T., Hon, S., Olson, D.G. and Lynd, L.R., (2015) ‘The bifunctional alcohol and
aldehyde dehydrogenase gene, adhE, is necessary for ethanol production in Clostridium
thermocellum and Thermoanaerobacterium saccharolyticum’, Journal of Bacteriology, 197(8),
pp. 1386–1393. doi: 10.1128/JB.02450-14.
Løbner-Olesen, A., Skovgaard, O. and Marinus, M. G. (2005) ‘Dam methylation: coordinating
cellular processes’, Current Opinion in Microbiology. 8(2) pp. 154–160. doi:
202
10.1016/j.mib.2005.02.009.
López De Saro, F.J., Marinus, M.G., Modrich, P. and O’Donnell, M., (2006) ‘The β sliding clamp
binds to multiple sites within MutL and MutS’, Journal of Biological Chemistry, 281(20), pp.
14340–14349. doi: 10.1074/jbc.M601264200.
López, C.S., Alice, A.F., Heras, H., Rivas, E.A. and Sánchez-Rivas, C., (2006) ‘Role of anionic
phospholipids in the adaptation of Bacillus subtilis to high salinity’, Microbiology, 152(3), pp.
605–616. doi: 10.1099/mic.0.28345-0.
López, C.S., Heras, H., Garda, H., Ruzal, S., Sánchez-Rivas, C. and Rivas, E.,(2000) ‘Biochemical
and biophysical studies of Bacillus subtilis envelopes under hyperosmotic stress’, International
Journal of Food Microbiology. 55(1-3), pp. 137–142. doi: 10.1016/S0168-1605(00)00171-9.
Lovett, S. T. (2011) ‘The DNA exonucleases of Escherichia coli’, EcoSal Plus. 4(2).
10.1128/ecosalplus.4.4.7. doi: 10.1128/ecosalplus.4.4.7.
Lovitt, R. W., Shen, G. J. and Zeikus, J. G. (1988) ‘Ethanol production by thermophilic bacteria:
biochemical basis for ethanol and hydrogen tolerance in Clostridium thermohydrosulfuricum.’,
Journal of Bacteriology, 170(6), pp. 2809–2815. doi: 10.1128/jb.170.6.2809-2815.1988.
Low, R. L., Rashbaum, S. A. and Cozzarelli, N. R. (1976) ‘Purification and characterization of DNA
polymerase III from Bacillus subtilis’, Journal of Biological Chemistry, 251(5), pp. 1311–1325.
Löwe, H., Schmauder, L., Hobmeier, K., Kremling, A. and Pflüger-Grau, K., (2017) ‘Metabolic
engineering to expand the substrate spectrum of Pseudomonas putida toward sucrose’,
MicrobiologyOpen, 6(4), p. e00473. doi: 10.1002/mbo3.473.
Lu, X., Hirata, H., Yamaji, Y., Ugaki, M. and Namba, S., (2001) ‘Random mutagenesis in a plant
viral genome using a DNA repair-deficient mutator Escherichia coli strain’, Journal of Virological
Methods, 94(1–2), pp. 37–43. doi: 10.1016/S0166-0934(01)00270-1.
Luan, G., Bao, G., Lin, Z., Li, Yang, Chen, Z., Li, Yin and Cai, Z., (2015) ‘Comparative genome
analysis of a thermotolerant Escherichia coli obtained by Genome Replication Engineering
Assisted Continuous Evolution (GREACE) and its parent strain provides new understanding of
microbial heat tolerance’, New Biotechnology. 32(6), pp. 732–738. doi:
10.1016/j.nbt.2015.01.013.
Luan, G., Cai, Z., Li, Y. and Ma, Y., (2013) ‘Genome replication engineering assisted continuous
evolution (GREACE) to improve microbial tolerance for biofuels production.’, Biotechnology for
biofuels. 6(1), p. 137. doi: 10.1186/1754-6834-6-137.
Luan, G., Dong, H., Zhang, T., Lin, Z., Zhang, Y., Li, Y. and Cai, Z., (2014) ‘Engineering cellular
robustness of microbes by introducing the GroESL chaperonins from extremophilic bacteria’,
Journal of Biotechnology. 178(1), pp. 38–40. doi: 10.1016/j.jbiotec.2014.03.010.
Lujan, S.A., Williams, J.S., Clausen, A.R., Clark, A.B. and Kunkel, T.A., (2013) ‘Ribonucleotides are
signals for mismatch repair of leading-strand replication errors’, Molecular Cell, 50(3), pp. 437–
443. doi: 10.1016/j.molcel.2013.03.017.

203
Lujan, S.A., Williams, J.S., Pursell, Z.F., Abdulovic-Cui, A.A., Clark, A.B., Nick McElhinny, S.A. and
Kunkel, T.A., (2012) ‘Mismatch repair balances leading and lagging strand DNA Replication
fidelity’, PLoS Genetics. 8(10), p. e1003016. doi: 10.1371/journal.pgen.1003016.
Lundquist, R. C. and Olivera, B. M. (1982) ‘Transient generation of displaced single-stranded DNA
during nick translation’, Cell, 31(1), pp. 53–60. doi: 10.1016/0092-8674(82)90404-4.
Luo, L.H., Seo, P.S., Seo, J.W., Heo, S.Y., Kim, D.H. and Kim, C.H., (2009) ‘Improved ethanol
tolerance in Escherichia coli by changing the cellular fatty acids composition through genetic
manipulation’, Biotechnology Letters, 31(12), pp. 1867–1871. doi: 10.1007/s10529-009-0092-4.
Luria, S. E. and Delbrück, M. (1943) ‘Mutations of bacteria from virus sensitivity to virus
resistance’, Genetics (28), pp. 491–511.
Lynd, L. R. (2005) ‘Production of ethanol from lignocellulosic materialsc using thermophilic
bacteria: critical evaluation of potential and review’, Lignocellulosic Materials, 38, pp. 1–52. doi:
10.1007/bfb0007858.
Lynd, L. R., Baskaran, S. and Casten, S. (2001) ‘Salt accumulation resulting from base added for
pH control, and not ethanol, limits growth of Thermoanaerobacterium thermosaccharolyticum
HG-8 at elevated feed xylose concentrations in continuous culture’, Biotechnology Progress,
17(1), pp. 118–125. doi: 10.1021/bp000158n.
Macklyne, H.-R. V. (2017) 'Engineering bacteria for drug production' University of Sussex.
Madeira, F., Park, Y.M., Lee, J., Buso, N., Gur, T., Madhusoodanan, N., Basutkar, P., Tivey, A.R.N.,
Potter, S.C., Finn, R.D. and Lopez, R., (2019) ‘The EMBL-EBI search and sequence analysis tools
APIs in 2019.’, Nucleic Acids Research. 47(W1), pp. W636–W641. doi: 10.1093/nar/gkz268.
Maeda, H., Fujita, N. and Ishihama, A. (2000) ‘Competition among seven Escherichia coli sigma
subunits: relative binding affinities to the core RNA polymerase’, Nucleic Acids Research, 28(18),
pp. 3497–3503. doi: 10.1093/nar/28.18.3497.
Majewski, J. and Cohan, F. M. (1998) ‘The effect of mismatch repair and heteroduplex formation
on sexual isolation in Bacillus’, Genetics, 148(1).
Maki, H., Mo, J.-Y. and Sekiguchi, M. (1991) ‘A strong mutator effect caused by an amino acid
change in the alfa subunit of DNA polymerase III of Escherichia coli’, The Journal of Biological
Chemistry, 266, pp. 5055–5061.
Makiela-Dzbenska, K., Jonczyk, P., Schaaper, R.M. and Fijalkowska, I.J., (2011) ‘Proofreading
deficiency of Pol I increases the levels of spontaneous rpoB mutations in E. coli’, Mutation
Research - Fundamental and Molecular Mechanisms of Mutagenesis, 712(1–2), pp. 28–32. doi:
10.1016/j.mrfmmm.2011.03.011.
Makiela-Dzbenska, K., Maslowska, K.H., Kuban, W., Gawel, D., Jonczyk, P., Schaaper, R.M. and
Fijalkowska, I.J., (2019) ‘Replication fidelity in E. coli: differential leading and lagging strand
effects for dnaE antimutator alleles’, DNA Repair, 83. P.102643 doi:
10.1016/j.dnarep.2019.102643.
204
Manché, K., Notley-McRobb, L. and Ferenci, T. (1999) ‘Mutational adaptation of Escherichia coli
to glucose limitation involves distinct evolutionary pathways in aerobic and oxygen-limited
environments’, Genetics, 153(1), pp. 5–12.
Manow, R., Wang, C., Garza, E., Zhao, X., Wang, J., Grayburn, S. and Zhou, S., (2020) ‘Expression
of acetaldehyde dehydrogenase (aldB) improved ethanol production from xylose by the
ethanologenic Escherichia coli RM10’, World Journal of Microbiology and Biotechnology, 36(4),
p. 59. doi: 10.1007/s11274-020-2797-4.
Marc, J., Grousseau, E., Lombard, E., Sinskey, A.J., Gorret, N. and Guillouet, S.E., ‘Over expression
of GroESL in Cupriavidus necator for heterotrophic and autotrophic isopropanol production’,
Metabolic Engineering. 42, pp. 74–84. doi: 10.1016/j.ymben.2017.05.007.
Marchler-Bauer, A., Derbyshire, M.K., Gonzales, N.R., Lu, S., Chitsaz, F., Geer, L.Y., Geer, R.C., He,
J., Gwadz, M., Hurwitz, D.I., Lanczycki, C.J., Lu, F., Marchler, G.H., Song, J.S., Thanki, N., Wang, Z.,
Yamashita, R.A., Zhang, D., Zheng, C. and Bryant, S.H., (2015) ‘CDD: NCBI’s conserved domain
database’, Nucleic Acids Research. 43(D1), pp. D222–D226. doi: 10.1093/nar/gku1221.
Marciniak, B.C., Pabijaniak, M., de Jong, A., Duhring, R., Seidel, G., Hillen, W. and Kuipers, O.P.,
(2012) ‘High- and low-affinity cre boxes for CcpA binding in Bacillus subtilis revealed by genome-
wide analysis’, BMC Genomics, 13(1). doi: 10.1186/1471-2164-13-401.
Margulies, C. and Kaguni, J. M. (1996) ‘Ordered and sequential binding of DnaA protein to oriC,
the chromosomal origin of Escherichia coli’, Journal of Biological Chemistry, 271(29), pp. 17035–
17040. doi: 10.1074/jbc.271.29.17035.
Marinus, M. G. and Morris, N. R. (1973) ‘Isolation of deoxyribonucleic acid methylase mutants of
Escherichia coli K-12’, Journal of Bacteriology, 114(3), pp. 1143–1150.
Marsh, E. N. G. and Meléndez, G. D. R. (2012) ‘Adenosylcobalamin enzymes: theory and
experiment begin to converge’, Biochimica et Biophysica Acta - Proteins and Proteomics,
1824(11), pp. 1154–1164. doi: 10.1016/j.bbapap.2012.03.012.
Martinelli, L. and Nikel, P. I. (2019) ‘Breaking the state-of-the-art in the chemical industry with
new-to-nature products via synthetic microbiology’, Microbial Biotechnology, 12(2), pp. 187–
190. doi: 10.1111/1751-7915.13372.
Martínez-García, E., Aparicio, T., De Lorenzo, V. and Nikel, P.I., (2017) ‘Engineering gram-
negative microbial cell factories using transposon vectors’, Methods in Molecular Biology, 1498,
pp. 273–293. doi: 10.1007/978-1-4939-6472-7_18.
Maslowska, K.H., Makiela-Dzbenska, K., Mo, J.Y., Fijalkowska, I.J. and Schaaper, R.M., (2018)
‘High-accuracy lagging-strand DNA replication mediated by DNA polymerase dissociation’,
Proceedings of the National Academy of Sciences of the United States of America, 115(16), pp.
4212–4217. doi: 10.1073/pnas.1720353115.
Matsufuji, Y., Fujimura, S., Ito, T., Nishizawa, M., Miyaji, T., Nakagawa, J., Ohyama, T., Tomizuka,
N. and Nakagawa, T., (2008) ‘Acetaldehyde tolerance in Saccharomyces cerevisiae involves the
pentose phosphate pathway and oleic acid biosynthesis’, Yeast, 25(11), pp. 825–833. doi:

205
10.1002/yea.1637.
McDonald, J.P., Frank, E.G., Levine, A.S. and Woodgate, R., (1998) ‘Intermolecular cleavage by
UmuD-like mutagenesis proteins’, Proceedings of the National Academy of Sciences of the
United States of America, 95(4), pp. 1478–1483. doi: 10.1073/pnas.95.4.1478.
McKenzie, G.J., Magner, D.B., Lee, P.L. and Rosenberg, S.M., (2003) ‘The dinB operon and
spontaneous mutation in Escherichia coli’, Journal of Bacteriology, 185(13), pp. 3972–3977. doi:
10.1128/JB.185.13.3972-3977.2003.
Meadows, J. A. and Wargo, M. J. (2015) ‘Carnitine in bacterial physiology and metabolism’,
Microbiology (United Kingdom). 161(6) pp. 1161–1174. doi: 10.1099/mic.0.000080.
Mészáros, B., Simon, I. and Dosztányi, Z. (2009) ‘Prediction of protein binding regions in
disordered proteins’, PLoS Computational Biology. 5(5), e1000376. doi:
10.1371/journal.pcbi.1000376.
Mezzina, M.P., Álvarez, D.S., Egoburo, D.E., Peña, R.D., Nikel, P.I. and Pettinari, M.J., (2017) ‘A
new player in the biorefineries field: Phasin PhaP enhances tolerance to solvents and boosts
ethanol and 1,3-propanediol synthesis in Escherichia coli’, Applied and Environmental
Microbiology. 83(14). doi: 10.1128/AEM.00662-17.
Michaels, M. L. and Miller, J. H. (1992) ‘The GO system protects organisms from the mutagenic
effect of the spontaneous lesion 8-hydroxyguanine (7,8-dihydro-8-oxoguanine)’, Journal of
Bacteriology, pp. 6321–6325. doi: 10.1128/jb.174.20.6321-6325.1992.
Michel, B. (2005) ‘After 30 years of study, the bacterial SOS response still surprises us’, PLoS
Biology, pp. 1174–1176. doi: 10.1371/journal.pbio.0030255.
Mitra, A., Kesarwani, A.K., Pal, D. and Nagaraja, V., (2011) ‘WebGeSTer DB-A transcription
terminator database’, Nucleic Acids Research, 39(SUPPL. 1). doi: 10.1093/nar/gkq971.
Modrich, P. and Lahue, R. (1996) ‘Mismatch repair in replication fidelity, genetic recombination,
and cancer biology’, Annual Review of Biochemistry. 65(1), pp. 101–133. doi:
10.1146/annurev.bi.65.070196.000533.
Mol, C. D., Hosfield, D. J. and Tainer, J. A. (2000) ‘Abasic site recognition by two
apurinic/apyrimidinic endonuclease families in DNA base excision repair: the 3’ ends justify the
means’, Mutation Research - DNA Repair. 460(3-4), pp.211-29 doi: 10.1016/S0921-
8777(00)00028-8.
Mori, K., Bando, R., Hieda, N. and Toraya, T., (2004) ‘Identification of a reactivating factor for
adenosylcobalamin-dependent ethanolamine ammonia lyase’, Journal of Bacteriology, 186(20),
pp. 6845–6854. doi: 10.1128/JB.186.20.6845-6854.2004.
Mott, M. L. and Berger, J. M. (2007) ‘DNA replication initiation: mechanisms and regulation in
bacteria’, Nature Reviews Microbiology, 5(5) pp. 343–354. doi: 10.1038/nrmicro1640.
Mott, M.L., Erzberger, J.P., Coons, M.M. and Berger, J.M., (2008) ‘Structural synergy and
molecular crosstalk between bacterial helicase loaders and replication initiators’, Cell, 135(4),
206
pp. 623–634. doi: 10.1016/j.cell.2008.09.058.
Mukhopadhyay, A. (2015) ‘Tolerance engineering in bacteria for the production of advanced
biofuels and chemicals’, Trends in Microbiology. Elsevier Ltd, 23(8), pp. 498–508. doi:
10.1016/j.tim.2015.04.008.
Nagata, Y., Mashimo, K., Kawata, M. and Yamamoto, K., (2002) ‘The roles of Klenow processing
and flap processing activities of DNA polymerase I in chromosome instability in Escherichia coli
K12 strains.’, Genetics, 160(1), pp. 13–23.
Napolitano, R., Janel-Bintz, R., Wagner, J. and Fuchs, R.P.P., (2000) ‘All three SOS-inducible DNA
polymerases (Pol II, Pol IV and Pol V) are involved in induced mutagenesis’, The EMBO Journal,
19(22), pp. 6259–6265.
Nazina, T.N., Tourova, T.P., Poltaraus, A.B., Novikova, E. V., Grigoryan, A.A., Ivanova, A.E.,
Lysenko, A.M., Petrunyaka, V. V., Osipov, G.A., Belyaev, S.S. and Ivanov, M. V., (2001)
‘Taxonomic study of aerobic thermophilic bacilli: descriptions of Geobacillus subterraneus gen.
nov., sp. nov. and Geobacillus uzenensis sp. nov. from petroleum reservoirs and transfer of
Bacillus stearothermophilus, Bacillus thermo- catenulatus, Bacillus thermoleovorans, Bacillus
kaustophilus, Bacillus thermoglucosidasius and Bacillus thermodenitrificans to Geobacillus as the
new combinations G. stearothermophilus, G. thermocatenulatus, G. thermoleovorans, G.
kaustophilus, G. thermoglucosidasius and G. thermodenitrificans’, International Journal of
Systematic and Evolutionary Microbiology, 51(2), pp. 433–446. doi: 10.1099/00207713-51-2-
433.
Neidhardt, F. C., VanBogelen, R. A. and Vaughn, V. (1984) ‘The genetics and regulation of heat-
shock proteins.’, Annual review of genetics, 18, pp. 295–329. doi:
10.1146/annurev.ge.18.120184.001455.
Nguyen, D. and Khanal, S. K. (2018) ‘A little breath of fresh air into an anaerobic system: how
microaeration facilitates anaerobic digestion process’, Biotechnology Advances. 36(7) pp. 1971–
1983. doi: 10.1016/j.biotechadv.2018.08.007.
Nickels, J.D., Chatterjee, S., Mostofian, B., Stanley, C.B., Ohl, M., Zolnierczuk, P., Schulz, R.,
Myles, D.A.A., Standaert, R.F., Elkins, J.G., Cheng, X. and Katsaras, J., (2017) ‘Bacillus subtilis lipid
extract, a branched-chain fatty acid model membrane’, Journal of Physical Chemistry Letters,
8(17), pp. 4214–4217. doi: 10.1021/acs.jpclett.7b01877.
Nicolas, P., Mäder, U., Dervyn, E., Rochat, T., Leduc, A., Pigeonneau, N., Bidnenko, E.,
Marchadier, E., Hoebeke, M., Aymerich, S., Becher, D., Bisicchia, P., Botella, E., Delumeau, O.,
Doherty, G., Denham, E.L., Fogg, M.J., Fromion, V., Goelzer, A., Hansen, A., Härtig, E., Harwood,
C.R., Homuth, G. and Jarmer, H., (2012) ‘Condition-dependent transcriptome architecture in
Bacillus subtilis’, Science, 335(6072) pp. 1103–1106. doi: 10.1126/science.1206848.
Nicoloff, H., Hubert, J. C. and Bringel, F. (2001) ‘Carbamoyl-phosphate synthetases (CPS) in lactic
acid bacteria and other Gram-positive bacteria’, Lait, 81(1–2), pp. 151–159. doi:
10.1051/lait:2001119.
Ochi, K., Okamoto, S., Tozawa, Y., Inaoka, T., Hosaka, T., Xu, J. and Kurosawa, K., (2004)
207
‘Ribosome engineering and secondary metabolite production’, Advances in Applied
Microbiology. 56, pp. 155–184. doi: 10.1016/S0065-2164(04)56005-7.
Ohmori, H., Friedberg, E.C., Fuchs, R.P.P., Goodman, M.F., Hanaoka, F., Hinkle, D., Kunkel, T.A.,
Lawrence, C.W., Livneh, Z., Nohmi, T., Prakash, L., Prakash, S., Todo, T., Walker, G.C., Wang, Z.
and Woodgate, R., (2001) ‘The Y-family of DNA Polymerases’, Molecular Cell, 8(1) pp. 7–8. doi:
10.1016/S1097-2765(01)00278-7.
Oller, A. R. and Schaaper, R. M. (1994) ‘Spontaneous mutation in Escherichia coli containing the
dnaE911 DNA polymerase antimutator allele.’, Genetics, 138(2), pp. 263–70.
Olson, D. G., Sparling, R. and Lynd, L. R. (2015) ‘Ethanol production by engineered thermophiles’,
Current Opinion in Biotechnology. 33, pp. 130–141. doi: 10.1016/j.copbio.2015.02.006.
Onrust, R., Finkelstein, J., Turner, J., Naktinis, V. and O’Donnell, M., (1995) ‘Assembly of a
chromosomal replication machine: two DNA polymerases, a clamp loader, and sliding clamps in
one holoenzyme particle. III. Interface between two polymerases and the clamp loader’, Journal
of Biological Chemistry, 270(22), pp. 13366–13377. doi: 10.1074/jbc.270.22.13366.
Oram, M. and Fisher, L. M. (1991) ‘4-Quinolone resistance mutations in the DNA gyrase of
Escherichia coli clinical isolates identified by using the polymerase chain reaction.’, Antimicrobial
Agents and Chemotherapy, 35(2), pp. 387–389. doi: 10.1128/AAC.35.2.387.
Paschalis, V., Chatelier, E. Le, Green, M., Képès, F., Soultanas, P. and Janniere, L., (2017)
‘Interactions of the Bacillus subtilis DnaE polymerase with replisomal proteins modulate its
activity and fidelity’, Open Biology, 7(170146). doi: 10.1098/rsob.170146.
Patnaik, R., Louie, S., Gavrilovic, V., Perry, K., Stemmer, W.P.C., Ryan, C.M. and Del Cardayré, S.,
(2002) ‘Genome shuffling of Lactobacillus for improved acid tolerance’, Nature Biotechnology,
20(7), pp. 707–712. doi: 10.1038/nbt0702-707.
Pearson, W. R. (2013) ‘An introduction to sequence similarity (“homology”) searching’, Current
Protocols in Bioinformatics. Chapter 3, Unit3.1. doi: 10.1002/0471250953.bi0301s42.
Peng, X. “Nick”, Gilmore, S. P. and O’Malley, M. A. (2016) ‘Microbial communities for
bioprocessing: lessons learned from nature’, Current Opinion in Chemical Engineering, 14, pp.
103–109. doi: 10.1016/j.coche.2016.09.003.
Pillon, M.C., Lorenowicz, J.J., Uckelmann, M., Klocko, A.D., Mitchell, R.R., Chung, Y.S., Modrich,
P., Walker, G.C., Simmons, L.A., Friedhoff, P. and Guarné, A., (2010) ‘Structure of the
endonuclease domain of MutL: unlicensed to cut’, Molecular Cell, 39(1), pp. 145–151. doi:
10.1016/j.molcel.2010.06.027.
Pluciennik, A., Burdett, V., Lukianova, O., O’Donnell, M. and Modrich, P., (2009) ‘Involvement of
the β clamp in methyl-directed mismatch repair in vitro’, Journal of Biological Chemistry,
284(47), pp. 32782–32791. doi: 10.1074/jbc.M109.054528.
Pluciennik, A., Dzantiev, L., Iyer, R.R., Constantin, N., Kadyrov, F.A. and Modrich, P., (2010) ‘PCNA
function in the activation and strand direction of MutLα endonuclease in mismatch repair’,
Proceedings of the National Academy of Sciences of the United States of America. 107(37), pp.
208
16066–16071. doi: 10.1073/pnas.1010662107.
Pope, C.F., O’Sullivan, D.M., McHugh, T.D. and Gillespie, S.H., (2008) ‘A practical guide to
measuring mutation rates in antibiotic resistance’, Antimicrobial Agents and Chemotherapy,
52(4), pp. 1209–1214. doi: 10.1128/AAC.01152-07.
Porfírio, Z., Prado, S.M., Vancetto, M.D.C., Fratelli, F., Alves, E.W., Raw, I., Fernandes, B.L.,
Camargo, A.C.M. and Lebrun, I., (1997) ‘Specific peptides of casein pancreatic digestion enhance
the production of tetanus toxin’, Journal of Applied Microbiology, 83(6), pp. 678–684. doi:
10.1046/j.1365-2672.1997.00299.x.
Postow, L., Crisona, N.J., Peter, B.J., Hardy, C.D. and Cozzarelli, N.R., (2001) ‘Topological
challenges to DNA replication: conformations at the fork’, Proceedings of the National Academy
of Sciences of the United States of America, 98(15), pp. 8219–8226. doi:
10.1073/pnas.111006998.
Priefert, H., Kruger, N., Jendrossek, D., Schmidt, B. and Steinbuchel, A., (1992) ‘Identification and
molecular characterization of the gene coding for acetaldehyde dehydrogenase II (acoD) of
Alcaligenes eutrophus’, Journal of Bacteriology, 174(3), pp. 899–907. doi: 10.1128/jb.174.3.899-
907.1992.
Prunier, A. L. and Leclercq, R. (2005) ‘Role of mutS and mutL genes in hypermutability and
recombination in Staphylococcus aureus’, Journal of Bacteriology, 187(10), pp. 3455–3464. doi:
10.1128/JB.187.10.3455-3464.2005.
Pu, J., Disare, M. and Dickinson, B. C. (2019) ‘Evolution of C-terminal modification tolerance in
full-length and split T7 RNA polymerase biosensors’, ChemBioChem, 20(12), pp. 1547–1553. doi:
10.1002/cbic.201800707.
Puentes-Téllez, P. E. and Falcao Salles, J. (2018) ‘Construction of effective minimal active
microbial consortia for lignocellulose degradation’, Microbial Ecology, 76(2), pp. 419–429. doi:
10.1007/s00248-017-1141-5.
Puligundla, P., Smogrovicova, D., Obulam, V.S.R. and Ko, S., (2011) ‘Very high gravity (VHG)
ethanolic brewing and fermentation: a research update’, Journal of Industrial Microbiology and
Biotechnology, 38(9), pp. 1133–1144. doi: 10.1007/s10295-011-0999-3.
Pursell, Z.F., Isoz, I., Lundström, E.B., Johansson, E. and Kunkel, T.A., (2007) ‘Yeast DNA
polymerase ε participates in leading-strand DNA replication’, Science, 317(5834), pp. 127–130.
doi: 10.1126/science.1144067.
Qin, W., Zhao, J., Yu, X., Liu, X., Chu, X., Tian, J. and Wu, N., (2019) ‘Improving cadmium
resistance in Escherichia coli through continuous genome evolution’, Frontiers in Microbiology.
10, p.278 doi: 10.3389/fmicb.2019.00278.
Qiu, Z. and Goodman, M. F. (1997) ‘The Escherichia coli polB locus is identical to dinA, the
structural gene for DNA polymerase II: characterization of pol II purified from a polB mutant’,
Journal of Biological Chemistry, 272(13), pp. 8611–8617. doi: 10.1074/jbc.272.13.8611.
Raia, P., Delarue, M. and Sauguet, L. (2019) ‘An updated structural classification of replicative
209
DNA polymerases’, Biochemical Society Transactions, 47(1), pp. 239–249. doi:
10.1042/bst20180579.
Rajaraman, E., Agarwal, A., Crigler, J., Seipelt-Thiemann, R., Altman, E. and Eiteman, M.A., (2016)
‘Transcriptional analysis and adaptive evolution of Escherichia coli strains growing on acetate’,
Applied Microbiology and Biotechnology, 100(17), pp. 7777–7785. doi: 10.1007/s00253-016-
7724-0.
Rangarajan, S., Gudmundsson, G., Qiu, Z., Foster, P.L. and Goodman, M.F., (1997) ‘Escherichia
coli DNA polymerase II catalyzes chromosomal and episomal DNA synthesis in vivo’, Proceedings
of the National Academy of Sciences of the United States of America, 94(3), pp. 946–951. doi:
10.1073/pnas.94.3.946.
Ratnaparkhe, S., B. Ratnaparkhe, M., Kumar Jaiswal, A. and Kumar, A., (2015) ‘Strain engineering
for improved bio-fuel production’, Current Metabolomics, 4(1), pp. 38–48. doi:
10.2174/2213235x03666150818222343.
Rattray, A. J. and Strathern, J. N. (2003) ‘Error-prone DNA polymerases: when making a mistake
is the only way to get ahead’, Annu. Rev. Genet, 37, pp. 31–66. doi:
10.1146/annurev.genet.37.042203.132748.
Reeve, B., Martinez-Klimova, E., De Jonghe, J., Leak, D.J. and Ellis, T., (2016) ‘The Geobacillus
plasmid set: a modular toolkit for thermophile engineering’, ACS Synthetic Biology, 5(12), pp.
1342-1347. doi: 10.1021/acssynbio.5b00298.
Reha-Krantz, L. J. (1995) ‘Learning about DNA polymerase function by studying antimutator DNA
polymerase’, Trends in Biochemical Sciences, 20(4), pp. 136–140. doi: 10.1016/S0968-
0004(00)88987-2.
Reha-Krantzs, L. J. and Nonay, R. L. (1993) 'Genetic and biochemical studies of bacteriophage T4
DNA polymerase 3’-5’-exonuclease activity', The Journal of Biological Chemistry. 268(36), pp.
27100-8
Reizer, J., Bachem, S., Reizer, A., Arnaud, M., Saier, M.H. and Stülke, J., (1999) ‘Novel
phosphotransferase system genes revealed by genome analysis - the complete complement of
PTS proteins encoded within the genome of Bacillus subtilis’, Microbiology. 145(12), pp. 3419–
3429. doi: 10.1099/00221287-145-12-3419.
Ren, C., Gu, Y., Hu, S., Wu, Y., Wang, P., Yang, Y., Yang, C., Yang, S. and Jiang, W., (2010)
‘Identification and inactivation of pleiotropic regulator CcpA to eliminate glucose repression of
xylose utilization in Clostridium acetobutylicum’, Metabolic Engineering. 12(5), pp. 446–454. doi:
10.1016/j.ymben.2010.05.002.
Reuven, N.B., Arad, G., Maor-Shoshani, A. and Livneh, Z., (1999) ‘The mutagenesis protein UmuC
is a DNA polymerase activated by UmuD’, RecA, and SSB and is specialized for translesion
replication’, Journal of Biological Chemistry, 274(45), pp. 31763–31766. doi:
10.1074/jbc.274.45.31763.
Reyes-Lamothe, R., Sherratt, D. J. and Leake, M. C. (2010) 'Stoichiometry and architecture of
210
active DNA replication machinery in Escherichia coli'. Science, 328(5977), pp.498-501. doi:
10.1126/science.1185757.
Ricchetti, M. and Buc, H. (1993) ‘E. coli DNA polymerase I as a reverse transcriptase.’, The EMBO
Journal. 12(2), pp. 387–396. doi: 10.1002/j.1460-2075.1993.tb05670.x.
Richardson, E. J. and Watson, M. (2013) ‘The automatic annotation of bacterial genomes’,
Briefings in Bioinformatics, 14(1), pp. 1–12. doi: 10.1093/bib/bbs007.
Robinson, A., Brzoska, A.J., Turner, K.M., Withers, R., Harry, E.J., Lewis, P.J. and Dixon, N.E.,
(2010) ‘Essential biological processes of an emerging pathogen: DNA replication, transcription,
and cell division in acinetobacter spp’, Microbiology and Molecular Biology Reviews, 74(2), pp.
1092–2172. doi: 10.1128/MMBR.00048-09.
Robinson, J.T., Thorvaldsdóttir, H., Winckler, W., Guttman, M., Lander, E.S., Getz, G. and
Mesirov, J.P., (2011) ‘Integrative genomics viewer’, Nature Biotechnology, 29(1), pp. 24–26. doi:
10.1038/nbt.1754.
Roca, M., Castillo, M., Marti, P., Althaus, R.L. and Molina, M.P., (2010) ‘Effect of heating on the
stability of quinolones in milk’, Journal of Agricultural and Food Chemistry, 58(9), pp. 5427–5431.
doi: 10.1021/jf9040518.
Romantsov, T., Guan, Z. and Wood, J. M. (2009) ‘Cardiolipin and the osmotic stress responses of
bacteria’, Biochimica et Biophysica Acta - Biomembranes. 1788(10), pp. 2092–2100. doi:
10.1016/j.bbamem.2009.06.010.
Roustan, J. L. and Sablayrolles, J. M. (2002) ‘Modification of the acetaldehyde concentration
during alcoholic fermentation and effects on fermentation kinetics’, Journal of Bioscience and
Bioengineering, 93(4), pp. 367–375. doi: 10.1016/S1389-1723(02)80069-X.
Sabourin, D. and Beckwith, J. (1975) 'Deletion of the Escherichia coli crp gene', Journal of
Bacteriology. 122(1), pp.338-40. doi: 10.1128/JB.122.1.338-340.1975.
Saier, M.H., Chauvaux, S., Deutscher, J., Reizer, J. and Ye, J., (1995) ‘Protein phosphorylation and
regulation of carbon metabolism in Gram-negative versus Gram-positive bacteria’, Trends in
Biochemical Sciences, 20(7), pp. 267–271. doi: https://doi.org/10.1016/S0968-0004(00)89041-6.
Saito, K., Green, R. and Buskirk, A. R. (2020) ‘Translational initiation in E. coli occurs at the
correct sites genome-wide in the absence of mRNA-rRNA base-pairing’, eLife, 9, pp. 1–19. doi:
10.7554/eLife.55002.
Salis, H. M. (2011) ‘The ribosome binding site calculator’, in Methods in Enzymology, 498, pp.
19–42. doi: 10.1016/B978-0-12-385120-8.00002-4.
Sampson, E. M. and Bobik, T. A. (2008) ‘Microcompartments for B12-dependent 1,2-propanediol
degradation provide protection from DNA and cellular damage by a reactive metabolic
intermediate’, Journal of Bacteriology, 190(8), pp. 2966–2971. doi: 10.1128/JB.01925-07.
Sandberg, T.E., Salazar, M.J., Weng, L.L., Palsson, B.O. and Feist, A.M., (2019). The emergence of
adaptive laboratory evolution as an efficient tool for biological discovery and industrial
211
biotechnology. Metabolic Engineering, 56, pp.1–16. doi.org/10.1016/j.ymben.2019.08.004.
Sanders, C. C. (1988) ‘Ciprofloxacin: in vitro activity, mechanism of action, and resistance’,
Reviews of Infectious Diseases, 10(3), pp. 516–527. doi: 10.1093/clinids/10.3.516.
Sanders, G. M., Dallmann, H. G. and McHenry, C. S. (2010) ‘Reconstitution of the B. subtilis
replisome with 13 proteins including two distinct replicases’, Molecular Cell, 37(2), pp. 273–281.
doi: 10.1016/j.molcel.2009.12.025.
Sasaki, M., Yonemura, Y. and Kurusu, Y. (2000) ‘Genetic analysis of Bacillus subtilis mutator
genes’, J. Gen. Appl. Microbiol., 46, pp. 183–187.
Sauvage, E., Kerff, F., Terrak, M., Ayala, J.A. and Charlier, P., (2008) ‘The penicillin-binding
proteins: structure and role in peptidoglycan biosynthesis’, FEMS Microbiology Reviews. pp.
234–258. doi: 10.1111/j.1574-6976.2008.00105.x.
Schaaper, R M (1993) ‘The mutational specificity of two Escherichia coli dnaE antimutator alleles
as determined from lacI mutation spectra.’, Genetics, 134(4), pp. 1031–8.
Schaaper, R. M. (1996) ‘Suppressors of Escherichia coli mutT: antimutators for DNA replication
errors’, in Mutation Research - Fundamental and Molecular Mechanisms of Mutagenesis. pp.
17–23. doi: 10.1016/0027-5107(95)00086-0.
Schaaper, R. M. (1998) ‘Antimutator mutants in bacteriophage T4 and Escherichia coli’, Genetics,
148(4), pp. 1579–1585.
Schaaper, R. M. and Cornacchio, R. (1992) ‘An Escherichia coli dnaE mutation with suppressor
activity toward mutator mutD5’, Journal of Bacteriology, 174(6), pp. 1974–1982. doi:
10.1128/jb.174.6.1974-1982.1992.
Schaaper, R. M. and Dunn, R. L. (1987) ‘Spectra of spontaneous mutations in Escherichia coli
strains defective in mismatch correction: the nature of in vivo DNA replication errors.’,
Proceedings of the National Academy of Sciences of the United States of America, 84(17), pp.
6220–6224. doi: 10.1073/pnas.84.17.6220.
Schaaper, Roel M (1993) ‘Base selection, proofreading, and mismatch repair during DNA
replication in Escherichia coli’, Journal of Biological Chemistry, 268(32), pp. 23762–23765.
Scheller, H. V. and Ulvskov, P. (2010) ‘Hemicelluloses’, Annual Review of Plant Biology, 61(1), pp.
263–289. doi: 10.1146/annurev-arplant-042809-112315.
Schmied, W.H., Tnimov, Z., Uttamapinant, C., Rae, C.D., Fried, S.D. and Chin, J.W., (2018)
‘Controlling orthogonal ribosome subunit interactions enables evolution of new function’,
Nature. 564(7736), pp. 444–448. doi: 10.1038/s41586-018-0773-z.
Schwarz, G., Mendel, R. R. and Ribbe, M. W. (2009) ‘Molybdenum cofactors, enzymes and
pathways’, Nature, 460(7257), pp. 839–847. doi: 10.1038/nature08302.
Scully, S. M. and Orlygsson, J. (2015) ‘Recent advances in second generation ethanol production
by thermophilic bacteria’, Energies, 8(1), pp. 1–30. doi: 10.3390/en8010001.
212
Serowy, S., Saparov, S.M., Antonenko, Y.N., Kozlovsky, W., Hagen, V. and Pohl, P., (2003)
‘Structural proton diffusion along lipid bilayers’, Biophysical Journal. 84(2 I), pp. 1031–1037. doi:
10.1016/S0006-3495(03)74919-4.
Serricchio, M. and Bütikofer, P. (2012) ‘An essential bacterial-type cardiolipin synthase mediates
cardiolipin formation in a eukaryote’, Proceedings of the National Academy of Sciences of the
United States of America. 109(16), pp. E954–E961. doi: 10.1073/pnas.1121528109.
Sevastopoulos, C. G. and Glaser, D. A. (1977) ‘Mutator action by Escherichia coli strains carrying
dnaE mutations’, Proceedings of the National Academy of Sciences of the United States of
America, 74(9), pp. 3947–3950. doi: 10.1073/pnas.74.9.3947.
Shahbaaz, M., Ahmad, F. and Imtaiyaz Hassan, M. (2015) ‘Structure-based functional annotation
of putative conserved proteins having lyase activity from Haemophilus influenzae’, 3 Biotech,
5(3), pp. 317–336. doi: 10.1007/s13205-014-0231-z.
Shea, M. E. and Hiasa, H. (1999) ‘Interactions between DNA helicases and frozen topoisomerase
IV-quinolone-DNA ternary complexes’. The Journal of Biological Chemistry. 274(32), PP.22747-
54. doi: 10.1074/jbc.274.32.22747.
Shereda, R.D., Kozlov, A.G., Lohman, T.M., Cox, M.M. and Keck, J.L., (2008) ‘SSB as an
organizer/mobilizer of genome maintenance complexes’, Critical Reviews in Biochemistry and
Molecular Biology, 43(5) pp. 289–318. doi: 10.1080/10409230802341296.
Shibai, A., Takahashi, Y., Ishizawa, Y., Motooka, D., Nakamura, S., Ying, B.W. and Tsuru, S., (2017)
‘Mutation accumulation under UV radiation in Escherichia coli’, Scientific Reports, 7(1), p. 14531
doi: 10.1038/s41598-017-15008-1.
Shibutani, S., Takeshita, M. and Grollman, A. P. (1991) ‘Insertion of specific bases during DNA
synthesis past the oxidation-damaged base 8-oxodG’, Nature, 349(6308), pp. 431–434. doi:
10.1038/349431a0.
Shine, J. and Dalgarno, L. (1974) ‘The 3'-terminal sequence of Escherichia coli 16S ribosomal
RNA: complementarity to nonsense triplets and ribosome binding sites’. Proceedings of the
National Academy of Sciences of the United States of America. 71(4), pp. 1342-6. doi:
10.1073/pnas.71.4.1342.
Simpson, E. H. (1949) ‘Measurement of diversity’, Nature. 163, p. 688. doi: 10.1038/163688a0.
Singh Nee Nigam, P. and Pandey, A. (2009) ‘Biotechnology for agro-industrial residues
utilisation’, Springer Netherlands, First edition, doi: 10.1007/978-1-4020-9942-7.
Slupska, M.M., King, A.G., Lu, L.I., Lin, R.H., Mao, E.F., Lackey, C.A., Chiang, J.-H., Baikalov, C. and
Miller, J.H., (1998) 'Examination of the role of DNA polymerase proofreading in the mutator
effect of miscoding tRNAs', Journal of Bacteriology. 180(21), pp. 5712-7, doi:
10.1128/JB.180.21.5712-5717.1998
Smith, B. T., Grossman, A. D. and Walker, G. C. (2001) ‘Visualization of mismatch repair in
bacterial cells.’, Molecular Cell, 8(6), pp. 1197–206. doi: 10.1016/s1097-2765(01)00402-6.
213
Solovyev, V., Salamov, A., Seledtsov, I., Vorobyev, D. and Bachinsky, A., (2011) ‘Automatic
annotation of bacterial community sequences and application to infections diagnostic’, in
Bioinformatics 2011 - Proceedings of the International Conference on Bioinformatics Models,
Methods and Algorithms, pp. 346–353.
Somoskovi, A., Parsons, L. M. and Salfinger, M. (2001) ‘The molecular basis of resistance to
isoniazid, rifampin, and pyrazinamide in Mycobacterium tuberculosis.’, Respiratory research.
BioMed Central, 2(3), pp. 164–8. doi: 10.1186/RR54.
Soufi, B., Krug, K., Harst, A. and Macek, B., (2015) ‘Characterization of the E. coli proteome and
its modifications during growth and ethanol stress’, Frontiers in Microbiology, 6(103), pp. 1–11.
doi: 10.3389/fmicb.2015.00103.
Soultanas, P. (2005) ‘The bacterial helicase-primase interaction: a common structural/functional
module’, Structure, 13(6) pp. 839–844. doi: 10.1016/j.str.2005.04.006.
Steitz, T. A. and Steitz, J. A. (1993) ‘A general two-metal-ion mechanism for catalytic RNA.’,
Proceedings of the National Academy of Sciences of the United States of America. 90(14), pp.
6498–502. doi: 10.1073/pnas.90.14.6498.
Stratmann, S. A. and Van Oijen, A. M. (2014) ‘DNA replication at the single-molecule level’,
Chemical Society Review. 43(4), p. 1201-1220. doi: 10.1039/c3cs60391a.
Su, H. F., Lin, J. F. and Tan, F. R. (2017) ‘Progress and perspective of biosynthetic platform for
higher-order biofuels’, Renewable and Sustainable Energy Reviews, 80, pp. 801–826. doi:
10.1016/j.rser.2017.05.158.
Suzuki, H. (2018) ‘Peculiarities and biotechnological potential of environmental adaptation by
Geobacillus species’, Applied Microbiology and Biotechnology, 102(24), pp. 10425–10437. doi:
10.1007/s00253-018-9422-6.
Suzuki, H., Kobayashi, J., Wada, K., Furukawa, M. and Doi, K., (2015) ‘Thermoadaptation-directed
enzyme evolution in an error-prone thermophile derived from Geobacillus kaustophilus
HTA426’, Applied and Environmental Microbiology, 81(1), pp. 149–158. doi:
10.1128/AEM.02577-14.
Suzuki, T., Seta, K., Nishikawa, C., Hara, E., Shigeno, T. and Nakajima-Kambe, T., (2015)
‘Improved ethanol tolerance and ethanol production from glycerol in a streptomycin-resistant
Klebsiella variicola mutant obtained by ribosome engineering’, Bioresource Technology. 176, pp.
156–162. doi: 10.1016/j.biortech.2014.10.153.
Suzuki, Y., Kishigami, T., Inoue, K., Mizoguchi, Y., Eto, N., Takagi, M. and Abe, S., (1983) ‘Bacillus
thermoglucosidasius sp. nov., a new species of obligately thermophilic Bacilli’, Systematic and
Applied Microbiology. 4(4), pp. 487–495. doi: 10.1016/S0723-2020(83)80006-X.
Swartz, M. (2010) ‘HPLC detectors: a brief review’, Journal of Liquid Chromatography & Related
Technologies, 33, pp. 1130–1150. doi: 10.1080/10826076.2010.484356.
Taddei, F., Radman, M., Maynard-Smith, J., Toupance, B., Gouyon, P.H. and Godelle, B., (1997)
‘Role of mutator alleles in adaptive evolution’. Nature, 387(6634), pp.700-702. doi:
214
10.1038/42696.
Taft-Benz, S. A. and Schaaper, R. M. (1998) ‘Mutational analysis of the 3’→5’ proofreading
exonuclease of Escherichia coli DNA polymerase III’, Nucleic Acids Research, 26(17), pp. 4005–
4011. doi: 10.1093/nar/26.17.4005.
Taft-Benz, S. A. and Schaaper, R. M. (1999) ‘The C-terminal domain of DnaQ contains the
polymerase binding site’, Journal of Bacteriology. 181(9), pp. 2963–2965.
Taft-Benz, S. A. and Schaaper, R. M. (2004) ‘The θ Subunit of Escherichia coli DNA Polymerase III:
a role in stabilizing the ε proofreading subunit’, Journal of Bacteriology, 186(9), pp. 2774–2780.
doi: 10.1128/JB.186.9.2774-2780.2004.
Taherzadeh, M. J. and Karimi, K. (2007) 'Enzyme-based hydrolysis processes for ethanol from
lignocellulosic materials: a review', BioResources. 2(4), pp. 707-738
Tamakoshi, M., Nakano, Y., Kakizawa, S., Yamagishi, A. and Oshima, T., (2001) ‘Selection of
stabilized 3-isopropylmalate dehydrogenase of Saccharomyces cerevisiae using the host-vector
system of an extreme thermophile, Thermus thermophilus’, Extremophiles, 5(1), pp. 17–22. doi:
10.1007/s007920000168.
Tan, B.K., Bogdanov, M., Zhao, J., Dowhan, W., Raetz, C.R.H. and Guan, Z., (2012) ‘Discovery of a
cardiolipin synthase utilizing phosphatidylethanolamine and phosphatidylglycerol as substrates’,
Proceedings of the National Academy of Sciences of the United States of America, 109(41), pp.
16504–16509. doi: 10.1073/pnas.1212797109.
Tan, F., Wu, B., Dai, L., Qin, H., Shui, Z., Wang, J., Zhu, Q., Hu, G. and He, M., (2016) ‘Using global
transcription machinery engineering (gTME) to improve ethanol tolerance of Zymomonas
mobilis’, Microbial Cell Factories, 15(1), p. 4. doi: 10.1186/s12934-015-0398-y.
Tanaka, Y., Kasahara, K., Hirose, Y., Murakami, K., Kugimiya, R. and Ochi, K., (2013) ‘Activation
and products of the cryptic secondary metabolite biosynthetic gene clusters by rifampin
resistance (rpoB) mutations in actinomycetes’, Journal of Bacteriology, 195(13), pp. 2959–2970.
doi: 10.1128/JB.00147-13.
Tang, M., Shen, X., Frank, E.G., O’Donnell, M., Woodgate, R. and Goodman, M.F., (1999)
‘UmuD′2C is an error-prone DNA polymerase, Escherichia coli pol V’, Proceedings of the National
Academy of Sciences of the United States of America. 96(16), pp. 8919–8924. doi:
10.1073/pnas.96.16.8919.
Tanghe, A., Van Dijck, P. and Thevelein, J. M. (2006) ‘Why do microorganisms have aquaporins?’,
Trends in Microbiology, 14(2), pp. 78–85. doi: 10.1016/j.tim.2005.12.001.
Tanner, N. A. et al. (2008) ‘Single-molecule studies of fork dynamics of Escherichia coli DNA
replication’, Nature Structural & Molecular Biology, 15(2), pp. 170–176. doi:
10.1038/nsmb.1381.
Tanner, N.A., Khan Tolun, G., Loparo, J.J., Jergic, S., Griffith, J.D., Dixon, N.E. and Van Oijen, A.M.,
(2011) ‘E. coli DNA replication in the absence of free beta clamps’, The EMBO Journal, 30, pp.
215
1830–1840. doi: 10.1038/emboj.2011.84.
Tanner, N.A., Loparo, J.J., Hamdan, S.M., Jergic, S., Dixon, N.E. and van Oijen, A.M., (2009) ‘Real-
time single-molecule observation of rolling-circle DNA replication’, Nucleic Acids Research, 37(4).
doi: 10.1093/nar/gkp006.
Tatusov, R.L., Galperin, M.Y., Natale, D.A. and Koonin, E. V, (2000) ‘The COG database: a tool for
genome-scale analysis of protein functions and evolution’, Nucleic Acids Research, 28(1), pp. 33–
36. doi: 10.1093/nar/28.1.33.
Taylor, M.P., Eley, K.L., Martin, S., Tuffin, M.I., Burton, S.G. and Cowan, D.A., (2009)
‘Thermophilic ethanologenesis: future prospects for second-generation bioethanol production’,
Trends in Biotechnology, 27(7), pp. 398–405. doi: 10.1016/j.tibtech.2009.03.006.
Tessman, E. S. and Peterson, P. (1985) ‘Plaque color method for rapid isolation of novel recA
mutants of Escherichia coli K-12: new classes of protease-constitutive recA mutants.’, Journal of
Bacteriology, 163(2), pp. 677–87.
Tessman, I. and Kennedy, M. A. (1994) ‘DNA Polymerase II of Escherichia coli in the bypass of
abasic sites in vivo’, Genetics. Genetics Society of America, 136(2), p. 439.
Timinskas, K., Balvociute, M., Timinskas, A. and Venclovas, C., (2013) ‘Comprehensive analysis of
DNA polymerase III α subunits and their homologs in bacterial genomes’, Nucleic Acids Research,
42(3), pp. 1393–1413. doi: 10.1093/nar/gkt900.
Tippin, B., Pham, P. and Goodman, M. F. (2004) ‘Error-prone replication for better or worse’,
Trends in Microbiology, 12(6), pp. 288–295. doi: 10.1016/j.tim.2004.04.004.
Trieu-Cuot, P., Carlier, C., Martin, P. and Courvalin, P., (1987) ‘Plasmid transfer by conjugation
from Escherichia coli to Gram-positive bacteria’, FEMS Microbiology Letters, 48(1–2), pp. 289–
294. doi: 10.1111/j.1574-6968.1987.tb02558.x.
Turner, J., Hingorani, M.M., Kelman, Z. and O’Donnell, M., (1999) ‘The internal workings of a
DNA polymerase clamp-loading machine’, EMBO Journal, 18(3), pp. 771–783. doi:
10.1093/emboj/18.3.771.
Turner, P., Mamo, G. and Karlsson, E. N. (2007) ‘Potential and utilization of thermophiles and
thermostable enzymes in biorefining’, Microbial Cell Factories, 6, p. 9, doi: 10.1186/1475-2859-
6-9.
UNFCCC (2015) Paris Agreement – Decision 1/CP.21 – Report of the Conference of the Parties on
its twenty-first session, held in Paris from 30 November to 13 December 2015 Addendum Part
two: Action taken by the Conference of the Parties at its twenty-first session. Available at:
http://unfccc.int/resource/docs/2015/cop21/eng/10a01.pdf
Van Der Maarel, M.J.E.C., Van Der Veen, B., Uitdehaag, J.C.M., Leemhuis, H. and Dijkhuizen, L.,
(2002) ‘Properties and applications of starch-converting enzymes of the α-amylase family’,
Journal of Biotechnology, 94(2), pp. 137–155. doi: 10.1016/S0168-1656(01)00407-2.
Vandewiele, D., Fernández de Henestrosa, A.R., Timms, A.R., Bridges, B.A. and Woodgate, R.,
216
(2002) ‘Sequence analysis and phenotypes of five temperature sensitive mutator alleles of dnaE,
encoding modified α-catalytic subunits of Escherichia coli DNA polymerase III holoenzyme’,
Mutation Research, 499(1), pp. 85–95. doi: 10.1016/S0027-5107(01)00268-8.
Verma, N. and Kumar, V. (2000) ‘Protoplast fusion technology and its biotechnological
application’, Industrial Biotechnology International Conference.
http://www.aidic.it/IBIC2008/webpapers/96Verma.pdf
Vermaas, J. V, Kont, R., Beckham, G.T., Crowley, M.F., Gudmundsson, M., Sandgren, M.,
Ståhlberg, J., Väljamäe, P. and Knott, B.C., (2019) ‘The dissociation mechanism of processive
cellulases’, Proceedings of the National Academy of Sciences of the United States of America,
116(46), pp. 23061–23067. doi: 10.1073/pnas.1913398116.
Viguera, E., Petranovic, M., Zahradka, D., Germain, K., Ehrlich, D.S. and Michel, B., (2003)
‘Lethality of bypass polymerases in Escherichia coli cells with a defective clamp loader complex
of DNA polymerase III’, Molecular Microbiology, 50(1), pp. 193–204. doi: 10.1046/j.1365-
2958.2003.03658.x.
Voordeckers, K., Kominek, J., Das, A., Espinosa-Cantú, A., De Maeyer, D., Arslan, A., Van Pee, M.,
van der Zande, E., Meert, W., Yang, Y., Zhu, B., Marchal, K., DeLuna, A., Van Noort, V., Jelier, R.
and Verstrepen, K.J., (2015) ‘Adaptation to high ethanol reveals complex evolutionary
pathways’, PLoS Genetics, 11(11), pp. 1–31. doi: 10.1371/journal.pgen.1005635.
Wade, J. T. and Grainger, D. C. (2014) ‘Pervasive transcription: illuminating the dark matter of
bacterial transcriptomes’, Nature Reviews Microbiology, 12(9) pp. 647–653. doi:
10.1038/nrmicro3316.
Wade, Y., Daniel, R. A. and Leak, D. J. (2019) ‘Heterologous microcompartment assembly in
Bacillaceae: establishing the components necessary for scaffold formation’, ACS Synthetic
Biology, 8(7), pp. 1642–1654. doi: 10.1021/acssynbio.9b00155.
Wagner, J., Etienne, H., Janel-Bintz, R. and Fuchs, R.P.P., (2002) ‘Genetics of mutagenesis in E.
coli: various combinations of translesion polymerases (Pol II, IV and V) deal with lesion/sequence
context diversity’, DNA Repair, 1(2), pp. 159–167. doi: 10.1016/S1568-7864(01)00012-X.
Wagner, J., Gruz, P., Kim, S.R., Yamada, M., Matsui, K., Fuchs, R.P. and Nohmi, T., (1999) ‘The
dinB gene encodes a novel E. coli DNA polymerase, DNA pol IV, involved in mutagenesis.’,
Molecular Cell, 4(2), pp. 281–6. doi: 10.1016/s1097-2765(00)80376-7.
Waldminghaus, T., Weigel, C. and Skarstad, K. (2012) ‘Replication fork movement and
methylation govern SeqA binding to the Escherichia coli chromosome’, Nucleic Acids Research,
40(12), pp. 5465–5476. doi: 10.1093/nar/gks187.
Walsh, B.W., Bolz, S.A., Wessel, S.R., Schroeder, J.W., Keck, J.L. and Simmons, L.A., (2014) ‘RecD2
helicase limits replication fork stress in Bacillus subtilis’, Journal of Bacteriology. 196(7), pp.
1359–1368. doi: 10.1128/JB.01475-13.
Walsh, I., Martin, A.J.M., Di Domenico, T. and Tosatto, S.C.E., (2012) ‘ESpritz: accurate and fast
prediction of protein disorder’, Bioinformatics. 28(4), pp. 503–509. doi:
217
10.1093/bioinformatics/btr682.
Wang, G., Shi, T., Chen, T., Wang, X., Wang, Y., Liu, D., Guo, J., Fu, J., Feng, L., Wang, Z. and Zhao,
X., (2018) ‘Integrated whole-genome and transcriptome sequence analysis reveals the genetic
characteristics of a riboflavin-overproducing Bacillus subtilis’, Metabolic Engineering. 48, pp.
138–149. doi: 10.1016/j.ymben.2018.05.022.
Wang, J., Chen, L., Tian, X., Gao, L., Niu, X., Shi, M. and Zhang, W., (2013) ‘Global metabolomic
and network analysis of Escherichia coli responses to exogenous biofuels’, Journal of Proteome
Research, 12(11), pp. 5302–5312. doi: 10.1021/pr400640u.
Warsi, O. M., Andersson, D. I. and Dykhuizen, D. E. (2018) ‘Different adaptive strategies in E. coli
populations evolving under macronutrient limitation and metal ion limitation’, BMC Evolutionary
Biology, 18(1). doi: 10.1186/s12862-018-1191-4.
Watanabe, K., Iha, H., Ohashi, A. and Suzuki, Y., (1989) ‘Cloning and expression in Escherichia coli
of an extremely thermostable oligo-1,6-glucosidase gene from Bacillus thermoglucosidasius’,
Journal of Bacteriology, 171(2), pp. 1219–1222. doi: 10.1128/jb.171.2.1219-1222.1989.
Watanabe, T., Srichuwong, S., Arakane, M., Tamiya, S., Yoshinaga, M., Watanabe, I., Yamamoto,
M., Ando, A., Tokuyasu, K. and Nakamura, T., (2010) ‘Selection of stress-tolerant yeasts for
simultaneous saccharification and fermentation (SSF) of very high gravity (VHG) potato mash to
ethanol’, Bioresource Technology, 101(24), pp. 9710–9714. doi: 10.1016/j.biortech.2010.07.079.
Waterhouse, A., Bertoni, M., Bienert, S., Studer, G., Tauriello, G., Gumienny, R., Heer, F.T.,
de Beer, T.A.P., Rempfer, C., Bordoli, L., Lepore, R. and Schwede, T., (2018) ‘SWISS-MODEL:
homology modelling of protein structures and complexes’, Nucleic Acids Research. 46(W1), pp.
W296–W303. doi: 10.1093/nar/gky427.
Wechsler, J. A. and Gross, J. D. (1971) ‘Escherichia coli mutants temperature-sensitive for DNA
synthesis’, MGG Molecular & General Genetics, 113(3), pp. 273–284. doi: 10.1007/BF00339547.
Wechsler, J.A., Nüsslein, V., Otto, B., Klein, A., Bonhoeffer, F., Herrmann, R., Gloger, L. and
Schaller, H., (1973) ‘Isolation and characterization of thermosensitive Escherichia coli mutants
defective in deoxyribonucleic acid replication.’, Journal of Bacteriology, 113(3), pp. 1381–8.
Wei, Y., Silke, J. R. and Xia, X. (2017) ‘Elucidating the 16S rRNA 3′ boundaries and defining
optimal SD/aSD pairing in Escherichia coli and Bacillus subtilis using RNA-Seq data’, Scientific
Reports, 7(1). doi: 10.1038/s41598-017-17918-6.
Whatley, Z. and Kreuzer, K. N. (2015) ‘Mutations that separate the functions of the proofreading
subunit of the Escherichia coli replicase.’, G3 (Bethesda, Md.), 5(6), pp. 1301–11. doi:
10.1534/g3.115.017285.
Whatmore, A. M. and Reed, R. H. (1990) ‘Determination of turgor pressure in Bacillus subtilis: a
possible role for K+ in turgor regulation’, Journal of General Microbiology, 136(12), pp. 2521–
2526. doi: 10.1099/00221287-136-12-2521.
Whatmore, A. M., Chudek, J. A. and Reed, R. H. (1990) ‘The effects of osmotic upshock on the
intracellular solute pools of Bacillus subtilis’, Journal of General Microbiology, 136(12), pp. 2527–
218
2535. doi: 10.1099/00221287-136-12-2527.
Williams, T.I., Combs, J.C., Lynn, B.C. and Strobel, H.J., (2007) ‘Proteomic profile changes in
membranes of ethanol-tolerant Clostridium thermocellum’, Applied Microbiology and
Biotechnology, 74(2), pp. 422–432. doi: 10.1007/s00253-006-0689-7.
Winder, C. L. and Lanthaler, K. (2011) ‘The use of continuous culture in systems biology
investigations’, in Methods in Enzymology, 500, pp. 261–275. doi: 10.1016/B978-0-12-385118-
5.00014-1.
Witkin, E.M., McCall, J.O., Volkert, M.R. and Wermundsen, I.E., (1982) ‘Constitutive expression
of SOS functions and modulation of mutagenesis resulting from resolution of genetic instability
at or near the recA locus of Escherichia coli.’, Molecular & general genetics, 185(1), pp. 43–50.
doi: 10.1007/bf00333788.
Wolff, E., Kim, M., Hu, K., Yang, H. and Miller, J.H., (2004) ‘Polymerases leave fingerprints:
analysis of the mutational spectrum in Escherichia coli rpoB to assess the role of polymerase IV
in spontaneous mutation’, Journal of Bacteriology, 186(9), pp. 2900–2905. doi:
10.1128/JB.186.9.2900-2905.2004.
Wood, J. M. (2018) ‘Perspective: challenges and opportunities for the study of cardiolipin, a key
player in bacterial cell structure and function’, Current Genetics, 64(4), pp. 795–798. doi:
10.1007/s00294-018-0811-2.
Wood, J.M., Bremer, E., Csonka, L.N., Kraemer, R., Poolman, B., Van der Heide, T. and Smith, L.T.,
(2001) ‘Osmosensing and osmoregulatory compatible solute accumulation by bacteria’,
Comparative Biochemistry and Physiology - A Molecular and Integrative Physiology, 130(3) pp.
437–460. doi: 10.1016/S1095-6433(01)00442-1.
Woodgate, R. and Ennis, D. G. (1991) ‘Levels of chromosomally encoded Umu proteins and
requirements for in vivo UmuD cleavage’, MGG Molecular & General Genetics. 229(1), pp. 10–
16. doi: 10.1007/BF00264207.
Wootton, J. C. and Drummond, M. H. (1989) ‘The Q-linker: a class of interdomain sequences
found in bacterial multidomain regulatory proteins’, Protein Engineering, 2(7), pp. 535–543.
Wu, C.A., Zechner, E.L., Reems, J.A., McHenry, C.S. and Marians, K.J., (1992) ‘Coordinated
leading- and lagging-strand synthesis at the Escherichia coli DNA replication fork: primase action
regulates the cycle of Okazaki fragment synthesis.’, The Journal of Biological Chemistry, 267(6),
pp. 4074–83.
Wu, X., Strome, E.D., Meng, Q., Hastings, P.J., Plon, S.E. and Kimmel, M., (2009) ‘A robust
estimator of mutation rates’, Mutation Research - Fundamental and Molecular Mechanisms of
Mutagenesis, 661(1–2), pp. 101–109. doi: 10.1016/j.mrfmmm.2008.11.015.
Wu, Y., Yang, Y., Ren, C., Yang, C., Yang, S., Gu, Y. and Jiang, W., (2015) ‘Molecular modulation of
pleiotropic regulator CcpA for glucose and xylose coutilization by solvent-producing Clostridium
acetobutylicum’, Metabolic Engineering. Academic Press Inc., 28, pp. 169–179. doi:
10.1016/j.ymben.2015.01.006.
219
Wuebbens, M.M., Liu, M.T.W., Rajagopalan, K. V. and Schindelin, H., (2000) ‘Insight into
molybdenum cofactor deficiency provided by the crystal structure of the molybdenum cofactor
biosynthesis protein MoaC’, Structure. 8(7), pp. 709–718. doi: 10.1016/S0969-2126(00)00157-X.
Xu, G., Wu, A., Xiao, L., Han, R. and Ni, Y., (2019) ‘Enhancing butanol tolerance of Escherichia coli
reveals hydrophobic interaction of multi-tasking chaperone SecB’, Biotechnology for Biofuels.
12(1). doi: 10.1186/s13068-019-1507-7.
Xu, X., Liu, C., Niu, C., Wang, J., Zheng, F., Li, Y. and Li, Q., (2018) ‘Rationally designed
perturbation factor drives evolution in Saccharomyces cerevisiae for industrial application’,
Journal of Industrial Microbiology and Biotechnology. 45(10), pp. 869–880. doi: 10.1007/s10295-
018-2057-x.
Xu, Z. and Huang, F. (2014) ‘Pretreatment methods for bioethanol production’, Applied
biochemistry and biotechnology, 174(1), pp. 43–62. doi: 10.1007/s12010-014-1015-y.
Yamtich, J. and Sweasy, J. B. (2010) ‘DNA polymerase family X: function, structure, and cellular
roles’, Biochimica et Biophysica Acta - Proteins and Proteomics, 1804(5), pp. 1136–1150. doi:
10.1016/j.bbapap.2009.07.008.
Yang, H., Yung, M., Sikavi, C. and Miller, J.H., (2011) ‘The role of Bacillus anthracis RecD2 helicase
in DNA mismatch repair’, DNA Repair, 10(11), pp. 1121–1130. doi:
10.1016/j.dnarep.2011.08.009.
Yang, J., Kim, B., Kim, G.Y., Jung, G.Y. and Seo, S.W., (2019) ‘Synthetic biology for evolutionary
engineering: from perturbation of genotype to acquisition of desired phenotype’, Biotechnology
for Biofuels, 12, p. 113. doi: 10.1186/s13068-019-1460-5.
Yang, K., Eyobo, Y., Brand, L.A., Martynowski, D., Tomchick, D., Strauss, E. and Zhang, H., (2006)
‘Crystal structure of a type III pantothenate kinase: insight into the mechanism of an essential
coenzyme A biosynthetic enzyme universally distributed in bacteria’, Journal of Bacteriology,
188(15), pp. 5532–5540. doi: 10.1128/JB.00469-06.
Yao, N.Y., Schroeder, J.W., Yurieva, O., Simmons, L.A. and O’Donnell, M.E., (2013) ‘Cost of
rNTP/dNTP pool imbalance at the replication fork’, Proceedings of the National Academy of
Sciences of the United States of America, 110(32), pp. 12942–12947. doi:
10.1073/pnas.1309506110.
Yoshida, H., Bogaki, M., Nakamura, M. and Nakamura, S., (1990) ‘Quinolone resistance-
determining region in the DNA gyrase gyrA gene of Escherichia coli’, Antimicrobial Agents and
Chemotherapy. 34(6), pp. 1271–1272. doi: 10.1128/AAC.34.6.1271.
Yoshida, K. I., Fujita, Y. and Ehrlich, S. D. (2000) ‘An operon for a putative ATP-binding cassette
transport system involved in acetoin utilization of Bacillus subtilis’, Journal of Bacteriology,
182(19), pp. 5454–5461. doi: 10.1128/JB.182.19.5454-5461.2000.
Yu, H., Tyo, K., Alper, H., Klein-Marcuschamer, D. and Stephanopoulos, G., (2008) ‘A high-
throughput screen for hyaluronic acid accumulation in recombinant Escherichia coli transformed
by libraries of engineered sigma factors’, Biotechnology and Bioengineering, 101(4), pp. 788–
220
796. doi: 10.1002/bit.21947.
Yu, L. P., Wu, F. Q. and Chen, G. Q. (2019) ‘Next-generation industrial biotechnology-
transforming the current industrial biotechnology into competitive processes’, Biotechnology
Journal. 14(9), pp. 1–9. doi: 10.1002/biot.201800437.
Yu, X., Jiang, G., Li, H., Zhao, Y., Zhang, H., Zhao, L., Ma, Y., Coulter, C. and Huang, H., (2011)
‘Rifampin stability in 7H9 broth and Löwenstein-Jensen medium’, Journal of Clinical
Microbiology, 49(3), pp. 784–789. doi: 10.1128/JCM.01951-10.
Yuan, Q. and McHenry, C. S. (2014) ‘Cycling of the E. coli lagging strand polymerase is triggered
exclusively by the availability of a new primer at the replication fork’, Nucleic Acids Research,
42(3), pp. 1747–1756. doi: 10.1093/nar/gkt1098.
Yuzhakov, A., Kelman, Z. and O’Donnell, M. (1999) ‘Trading places on DNA-A three-point switch
underlies primer handoff from primase to the replicative DNA polymerase’, Cell. 96(1), pp. 153–
163. doi: 10.1016/S0092-8674(00)80968-X.
Zabed, H., Sahu, J.N., Boyce, A.N. and Faruq, G., (2016) ‘Fuel ethanol production from
lignocellulosic biomass: an overview on feedstocks and technological approaches’, Renewable
and Sustainable Energy Reviews. 66, pp. 751–774. doi: 10.1016/j.rser.2016.08.038.
Zaprasis, A., Hoffmann, T., Stannek, L., Gunka, K., Commichau, F.M. and Bremer, E., (2014) ‘The
γ-aminobutyrate permease Gabp serves as the third proline transporter of Bacillus subtilis’.
196(3), pp. 515-26 doi: 10.1128/JB.01128-13.
Zeikus JG (1979) ‘Thermophilic bacteria: ecology, physiology and technology’, Enzyme and
Microbial Technology, 4(1), pp. 243–52.
Zhang, H., Chong, H., Ching, C.B., Song, H. and Jiang, R., (2012) ‘Engineering global transcription
factor cyclic AMP receptor protein of Escherichia coli for improved 1-butanol tolerance’, Applied
Microbiology and Biotechnology, 94(4), pp. 1107–1117. doi: 10.1007/s00253-012-4012-5.
Zhang, M., Eddy, C., Deanda, K., Finkelstein, M. and Picataggio, S., (1995) ‘Metabolic engineering
of a pentose metabolism pathway in ethanologenic Zymomonas mobilis’, Science, 267(5195),
pp. 240–243. doi: 10.1126/science.267.5195.240.
Zhang, R., Cao, Y., Liu, W., Xian, M. and Liu, H., (2017) ‘Improving phloroglucinol tolerance and
production in Escherichia coli by GroESL overexpression’, Microbial Cell Factories. 16(1). doi:
10.1186/s12934-017-0839-x.
Zhang, Y.-X., Perry, K., Vinci, V. a, Powell, K., Stemmer, W.P.C. and del Cardayré, S.B., (2002)
‘Genome shuffling leads to rapid phenotypic improvement in bacteria.’, Nature, 415(6872), pp.
644–646. doi: 10.1038/415644a.
Zhou, J., Wu, K. and Rao, C. V. (2016) ‘Evolutionary engineering of Geobacillus
thermoglucosidasius for improved ethanol production’, Biotechnology and Bioengineering.
113(10), pp. 2156–2167. doi: 10.1002/bit.25983.
Zingaro, K. A., Terry Papoutsakis, E. and Sang Lee, E. (2012) ‘Toward a semisynthetic stress

221
response system to engineer microbial solvent tolerance’. 3(5), e00308-12 doi:
10.1128/mBio.00308-12.
Zuo, Y. (2001) ‘Exoribonuclease superfamilies: structural analysis and phylogenetic distribution’,
Nucleic Acids Research, 29(5), pp. 1017–1026. doi: 10.1093/nar/29.5.1017.


![A Study of the Effect of Soil Improvement Based on the ...file.scirp.org/pdf/OJCE_2016032816084808.pdf[13] investigated bearing capacity improvement using micropiles as plane strain](https://static.fdocuments.us/doc/165x107/5ae4b8767f8b9a5d648fbaae/a-study-of-the-effect-of-soil-improvement-based-on-the-filescirporgpdfojce.jpg)