Storytelling with InfoVis - Georgia Institute of Technologystasko/7450/Notes/storytelling.pdf ·...
29
1 Storytelling with InfoVis CS 7450 - Information Visualization October 12, 2016 John Stasko Learning Objectives • Define narrative visualization (vis for storytelling) and explain how it differs from analytic/exploratory visualization • Name and describe different genres and approaches to narrative visualization • Explain the style, content, and significance of Rosling's GapMinder video • View and learn from designs of examples Mariano Rivera, What's Warming World?, Home and Away, Bubble Bust to Recovery, Fallen of WWII, … Fall 2016 CS 7450 2
Transcript of Storytelling with InfoVis - Georgia Institute of Technologystasko/7450/Notes/storytelling.pdf ·...
1
Storytelling with InfoVis
CS 7450 - Information Visualization
October 12, 2016
John Stasko
Learning Objectives
• Define narrative visualization (vis for storytelling) and explain how it differs from analytic/exploratory visualization
• Name and describe different genres and approaches to narrative visualization
• Explain the style, content, and significance of Rosling's GapMinder video
• View and learn from designs of examples
Mariano Rivera, What's Warming World?, Home and Away, Bubble Bust to Recovery, Fallen of WWII, …
Fall 2016 CS 7450 2
2
Purpose
• Two main uses of infovis
Analysis – Understand your data better and act upon that understanding
Presentation – Communicate and inform others more effectively
• Today we look at that second one more
Fall 2016 CS 7450
Review
3
Telling Stories
• Data visualization can help to communicate ideas, summarize, influence, unite, explain, persuade
• Visuals can serve as evidence or support
Fall 2016 CS 7450 4
3
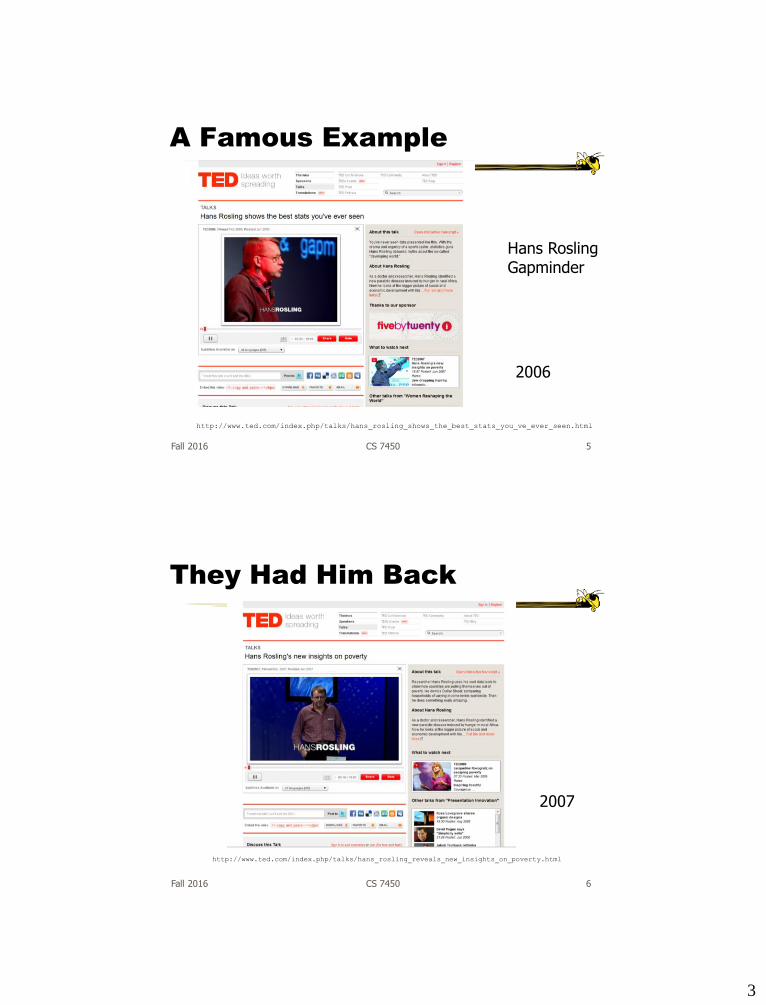
A Famous Example
Fall 2016 CS 7450
http://www.ted.com/index.php/talks/hans_rosling_shows_the_best_stats_you_ve_ever_seen.html
Hans RoslingGapminder
2006
5
They Had Him Back
Fall 2016 CS 7450
http://www.ted.com/index.php/talks/hans_rosling_reveals_new_insights_on_poverty.html
2007
6
4
Discuss
• Why has this had such a big impact?
Fall 2016 CS 7450 7
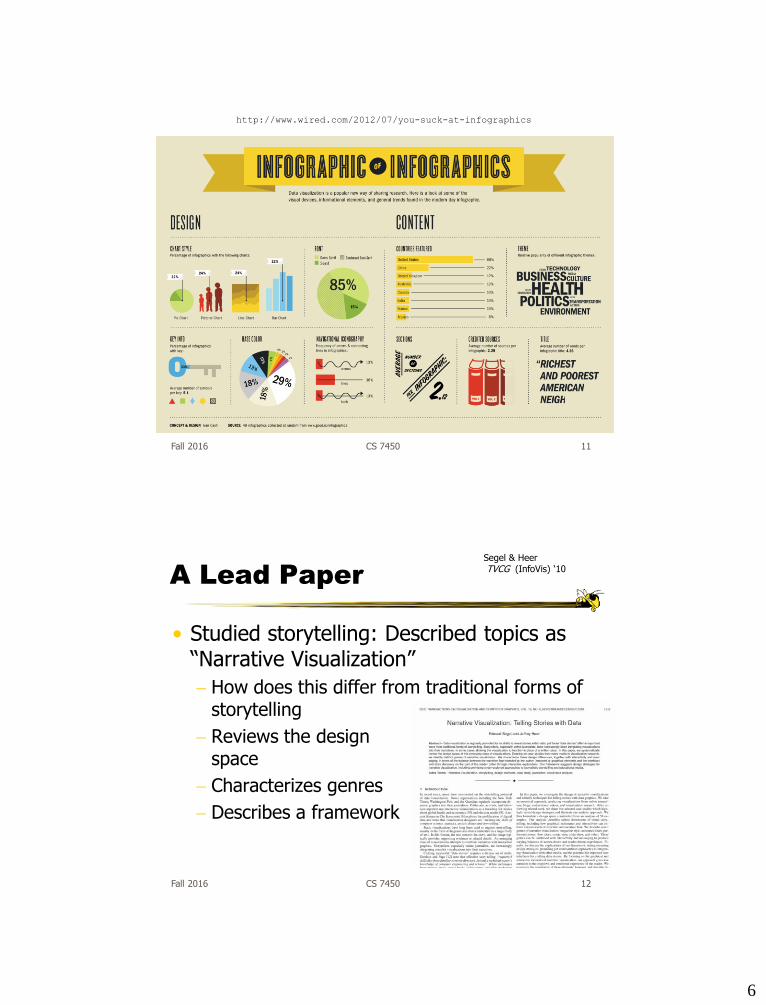
InfoGraphics
• See them everywhere today
• Perhaps a good example of infovis for presentation purposes
Typically not interactive though
Fall 2016 CS 7450 8
5
Fall 2016 CS 7450
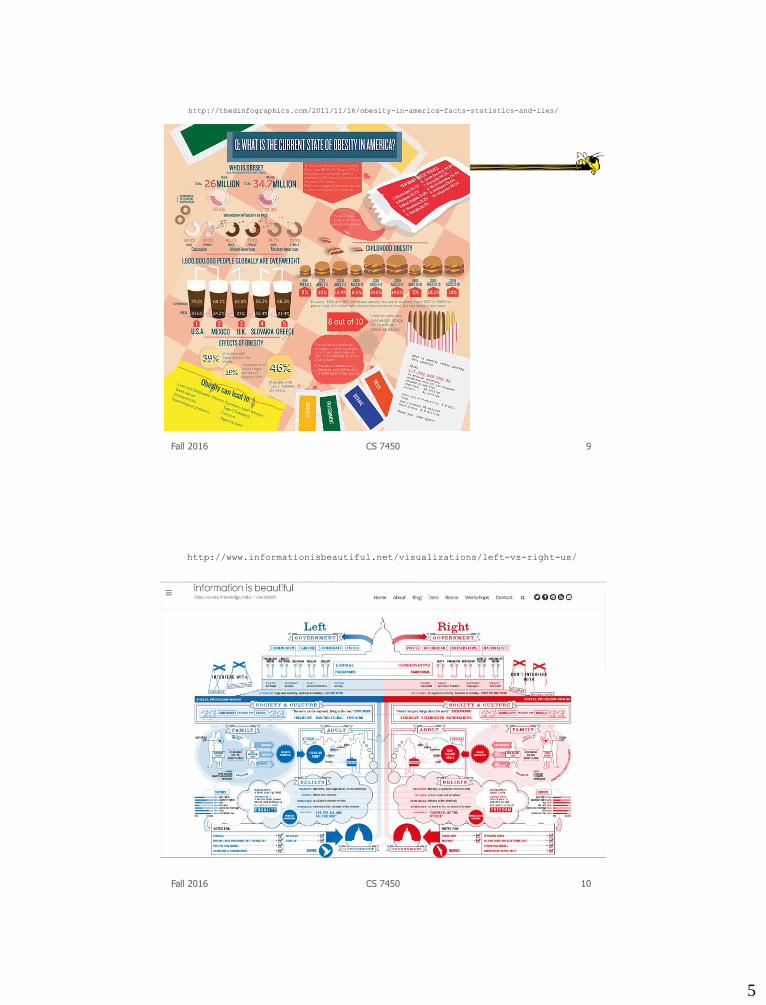
http://thedinfographics.com/2011/11/16/obesity-in-america-facts-statistics-and-lies/
9
Fall 2016 CS 7450
http://www.informationisbeautiful.net/visualizations/left-vs-right-us/
10
6
Fall 2016 CS 7450
http://www.wired.com/2012/07/you-suck-at-infographics
11
A Lead Paper
• Studied storytelling: Described topics as “Narrative Visualization”
How does this differ from traditional forms of storytelling
Reviews the designspace
Characterizes genres
Describes a framework
Fall 2016 CS 7450
Segel & HeerTVCG (InfoVis) ‘10
12
7
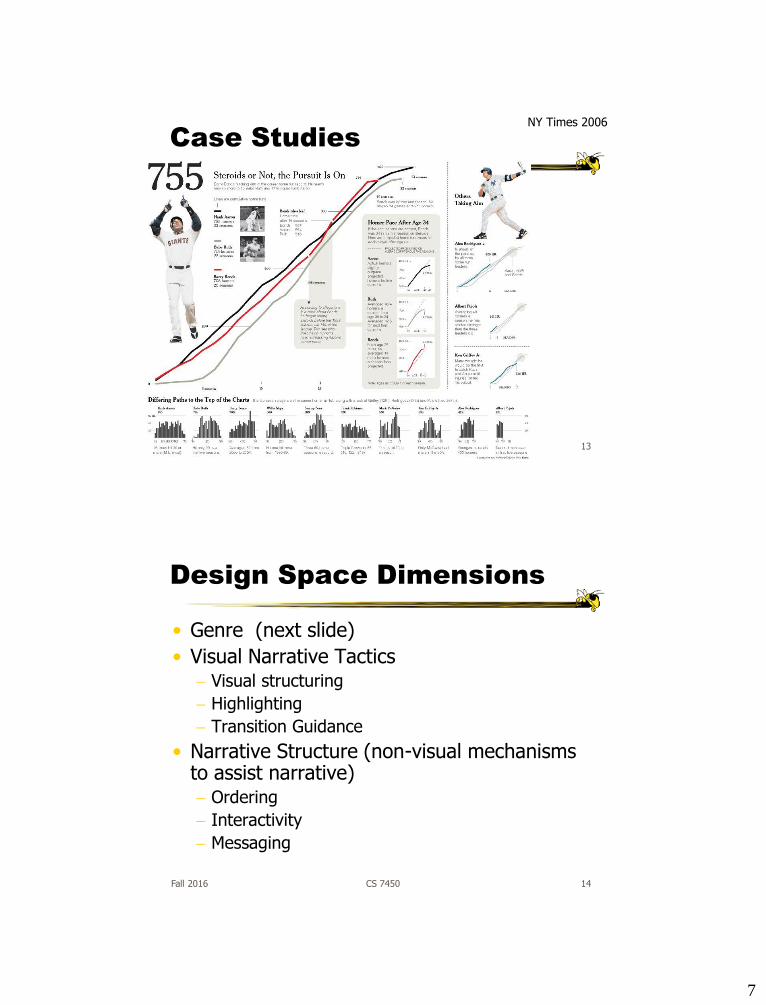
Case Studies
Fall 2016 CS 7450
NY Times 2006
13
Design Space Dimensions
• Genre (next slide)
• Visual Narrative Tactics Visual structuring
Highlighting
Transition Guidance
• Narrative Structure (non-visual mechanisms to assist narrative) Ordering
Interactivity
Messaging
Fall 2016 CS 7450 14
8
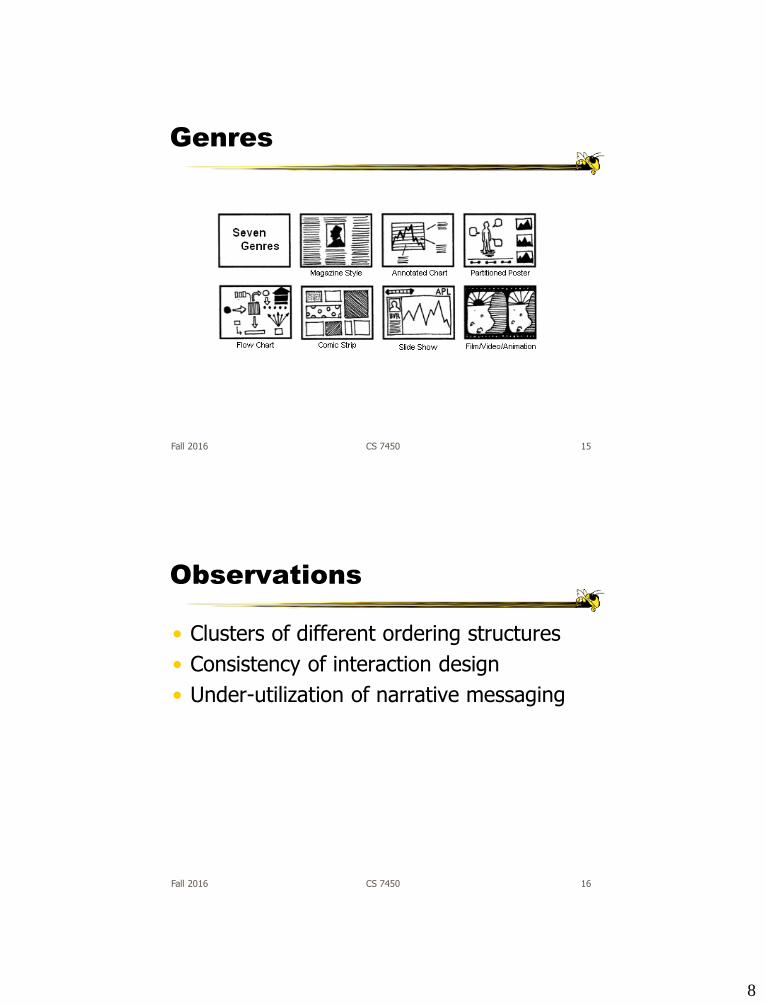
Genres
Fall 2016 CS 7450 15
Observations
• Clusters of different ordering structures
• Consistency of interaction design
• Under-utilization of narrative messaging
Fall 2016 CS 7450 16
9
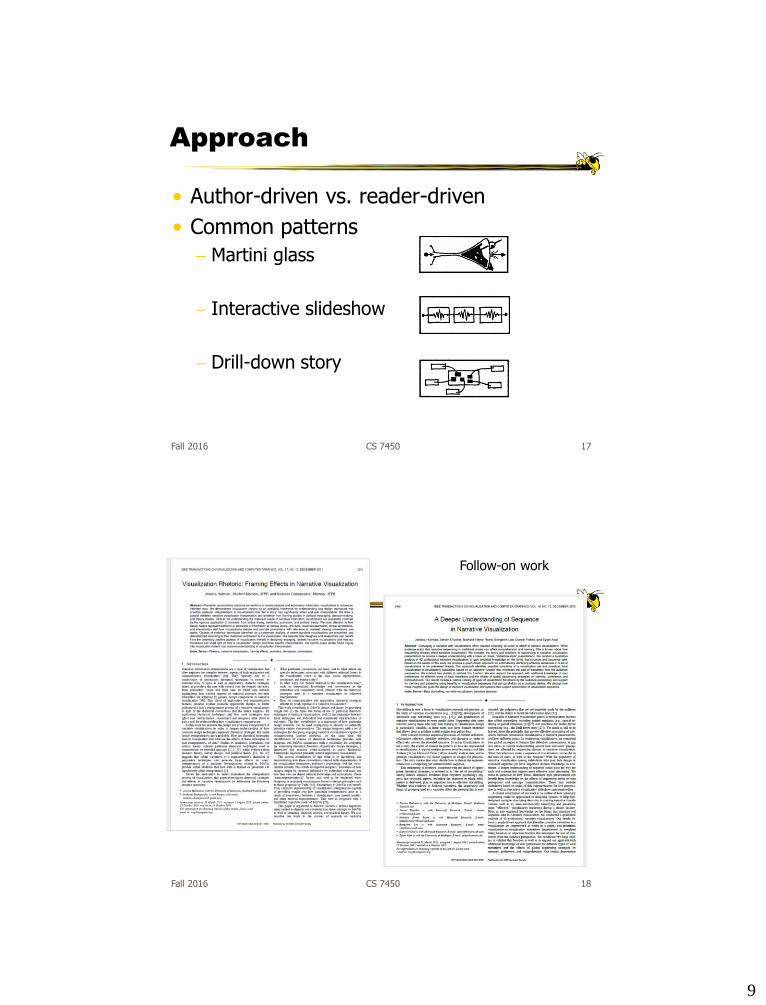
Approach
• Author-driven vs. reader-driven
• Common patterns
Martini glass
Interactive slideshow
Drill-down story
Fall 2016 CS 7450 17
Fall 2016 CS 7450
Follow-on work
18
10
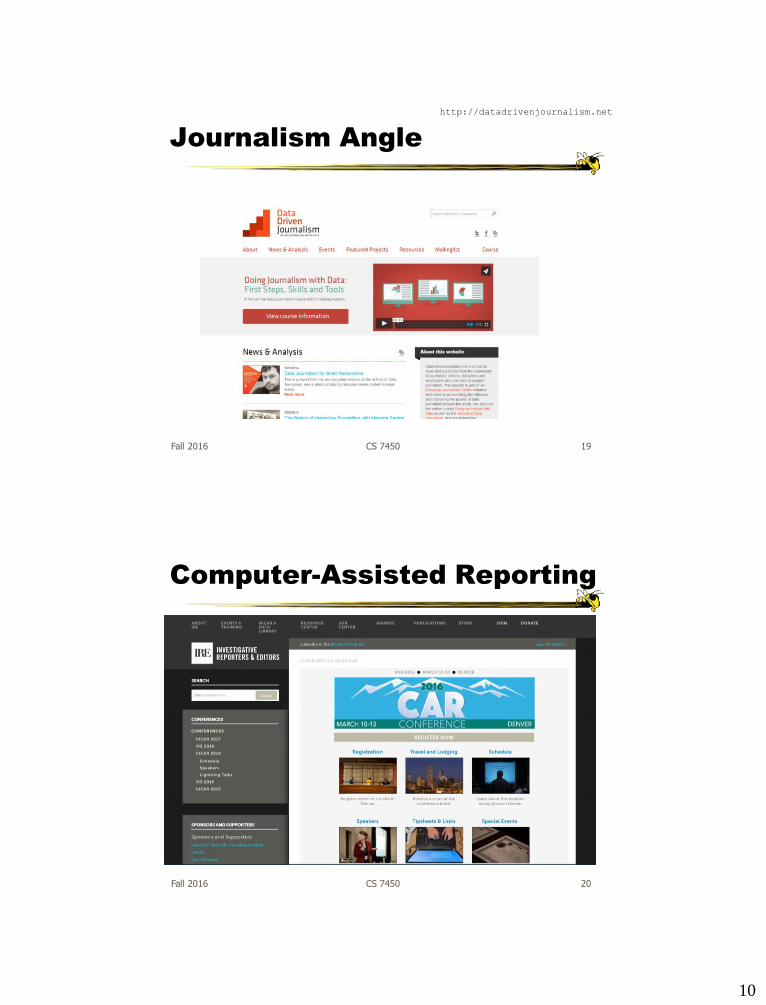
Journalism Angle
Fall 2016 CS 7450
http://datadrivenjournalism.net
19
Computer-Assisted Reporting
Fall 2016 CS 7450 20
11
Some Examples
Fall 2016 CS 7450 21
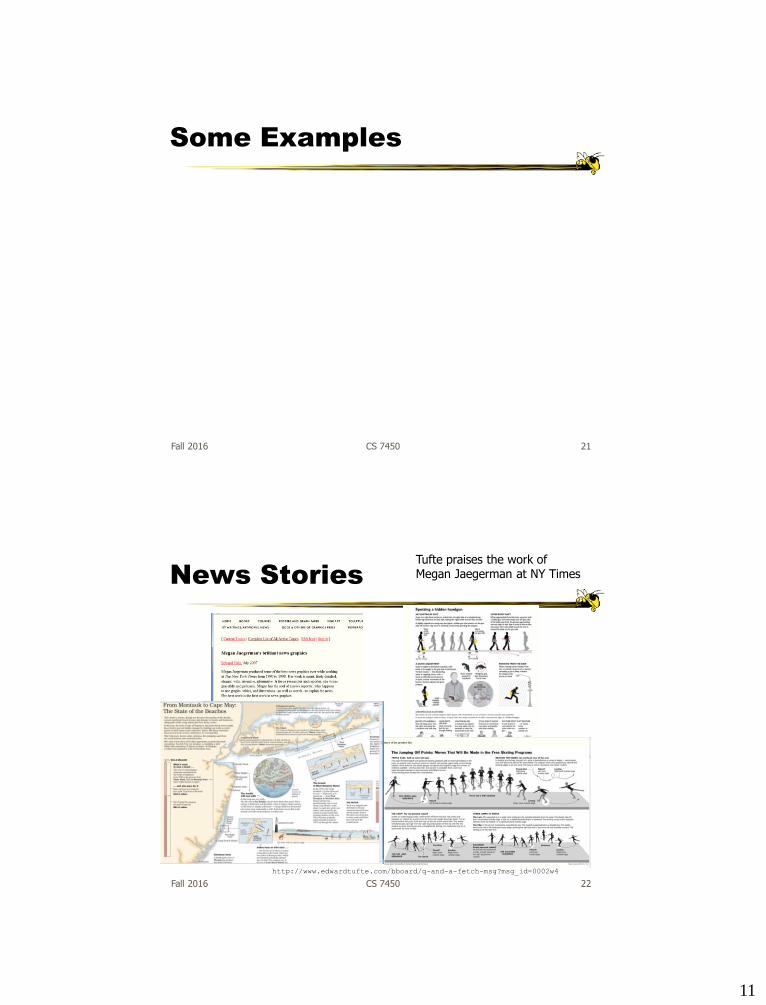
News Stories
Fall 2016 CS 7450
Tufte praises the work ofMegan Jaegerman at NY Times
http://www.edwardtufte.com/bboard/q-and-a-fetch-msg?msg_id=0002w4
22
12
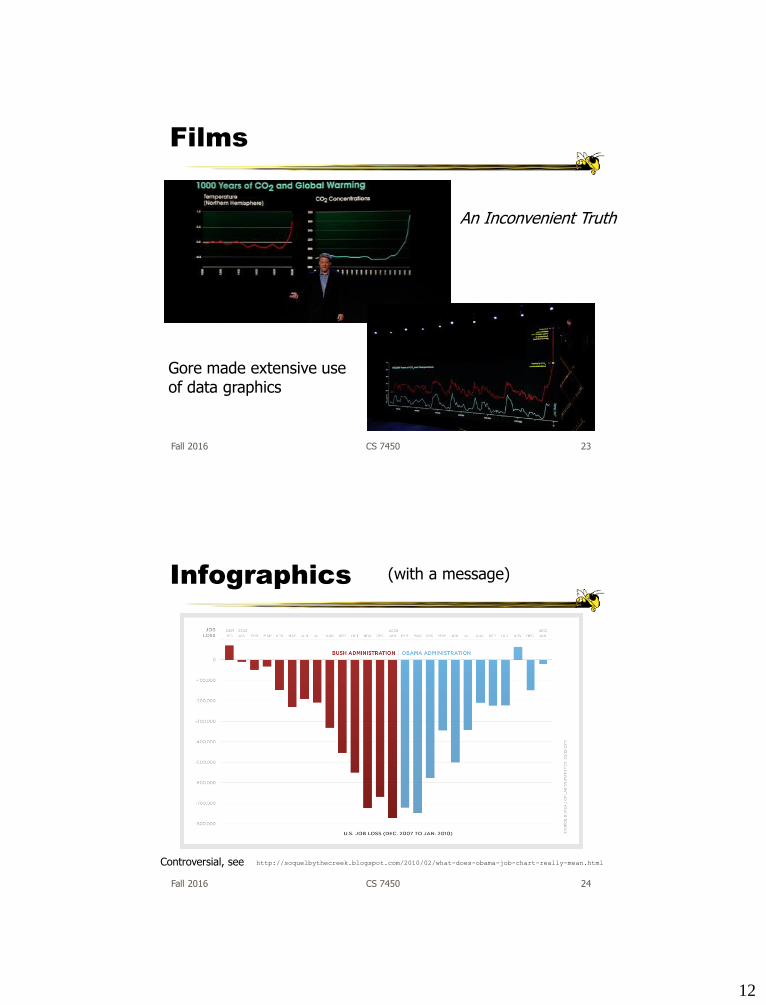
Films
Fall 2016 CS 7450
Gore made extensive useof data graphics
An Inconvenient Truth
23
Infographics
Fall 2016 CS 7450
Controversial, see http://soquelbythecreek.blogspot.com/2010/02/what-does-obama-job-chart-really-mean.html
(with a message)
24
13
Fall 2016 CS 7450
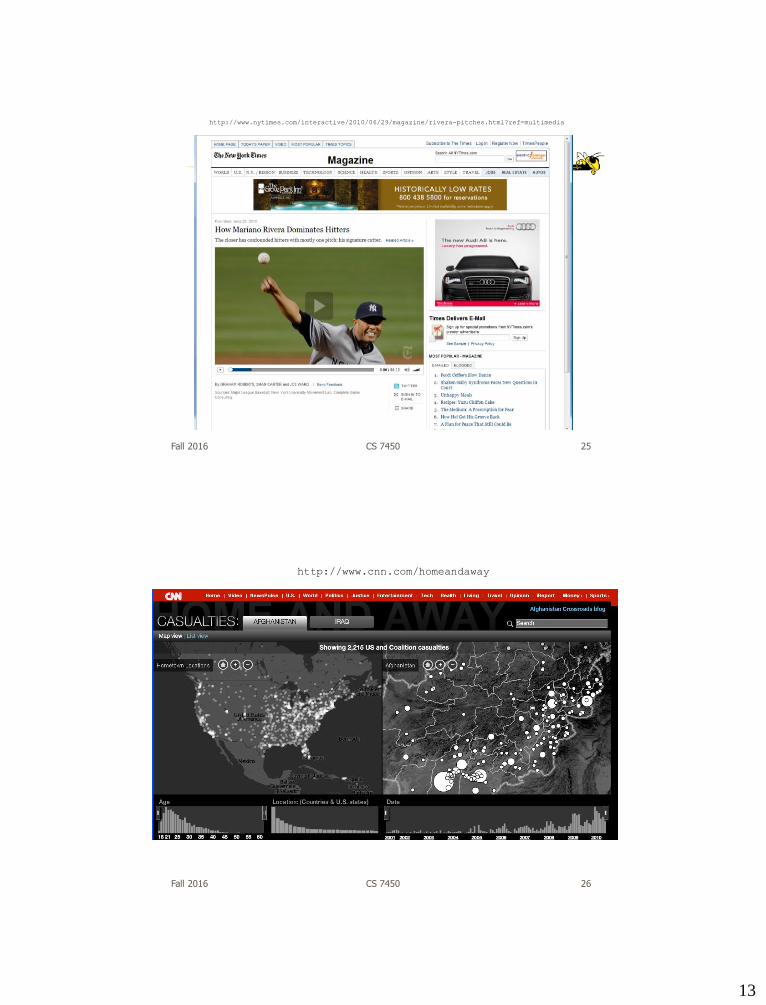
http://www.nytimes.com/interactive/2010/06/29/magazine/rivera-pitches.html?ref=multimedia
25
Fall 2016 CS 7450
http://www.cnn.com/homeandaway
26
14
Fall 2016 CS 7450
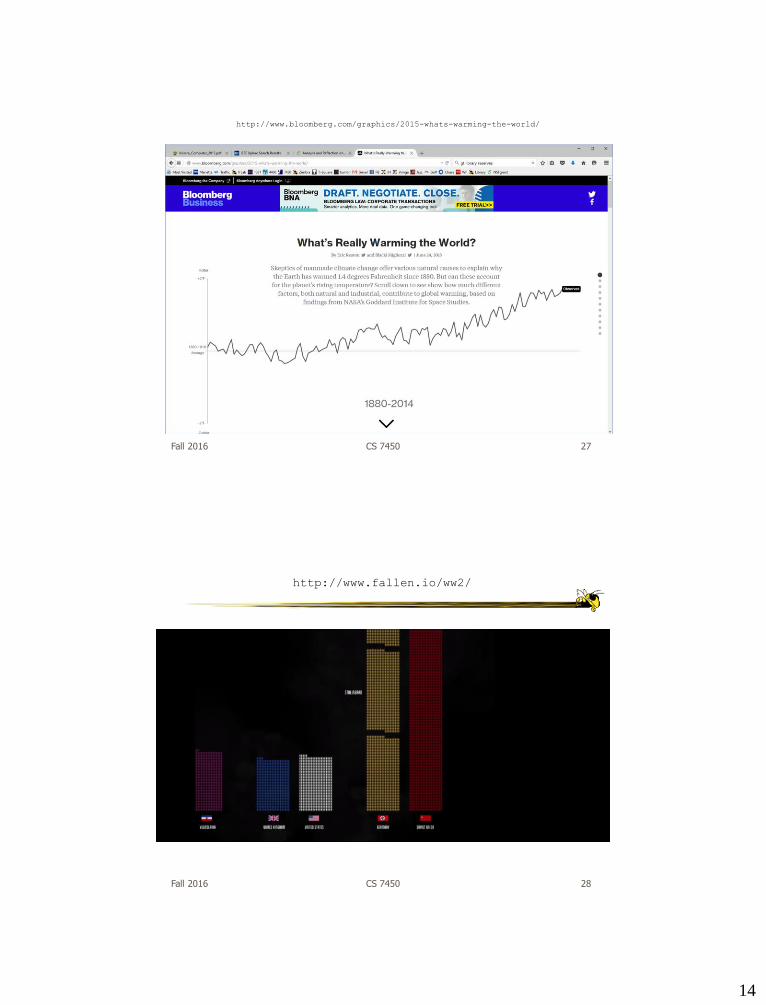
http://www.bloomberg.com/graphics/2015-whats-warming-the-world/
27
http://www.fallen.io/ww2/
Fall 2016 CS 7450 28
15
Fall 2016 CS 7450
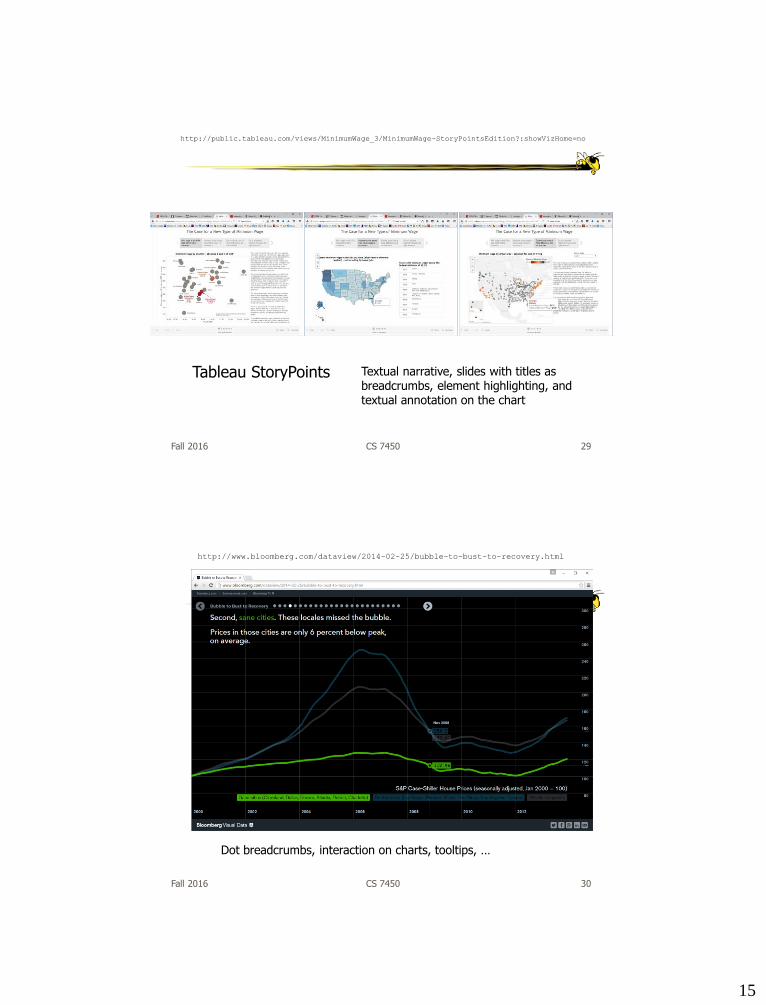
http://public.tableau.com/views/MinimumWage_3/MinimumWage-StoryPointsEdition?:showVizHome=no
Tableau StoryPoints Textual narrative, slides with titles as breadcrumbs, element highlighting, and textual annotation on the chart
29
Fall 2016 CS 7450
http://www.bloomberg.com/dataview/2014-02-25/bubble-to-bust-to-recovery.html
Dot breadcrumbs, interaction on charts, tooltips, …
30
16
Fall 2016 CS 7450
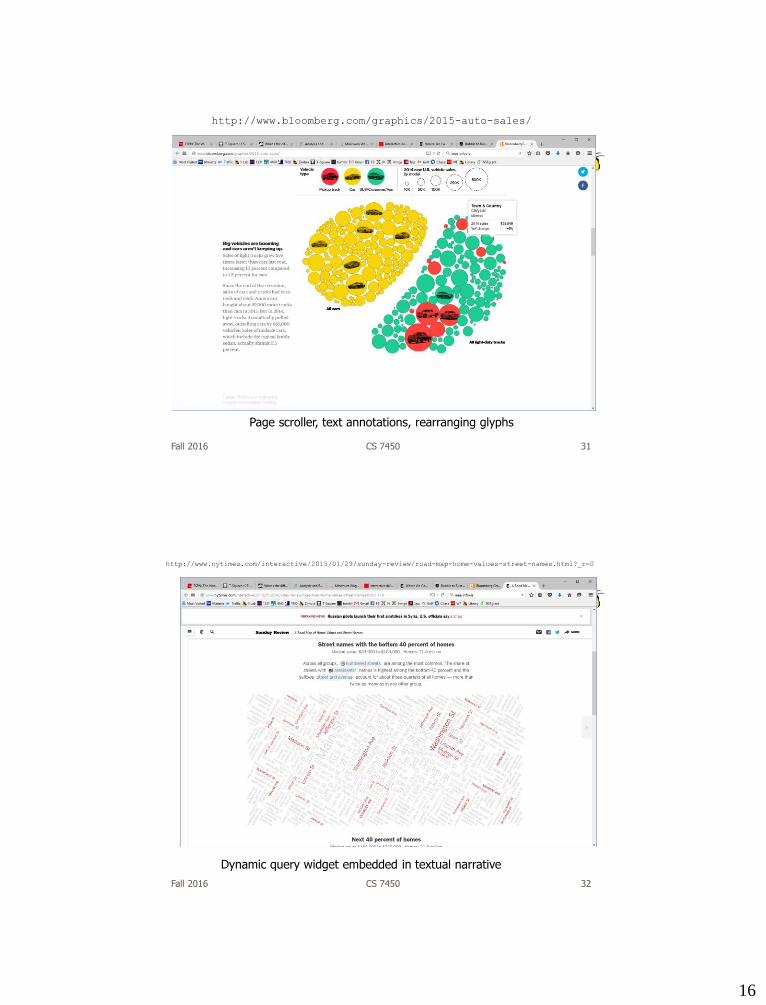
http://www.bloomberg.com/graphics/2015-auto-sales/
Page scroller, text annotations, rearranging glyphs
31
Fall 2016 CS 7450
http://www.nytimes.com/interactive/2015/01/29/sunday-review/road-map-home-values-street-names.html?_r=0
Dynamic query widget embedded in textual narrative
32
17
Fall 2016 CS 7450
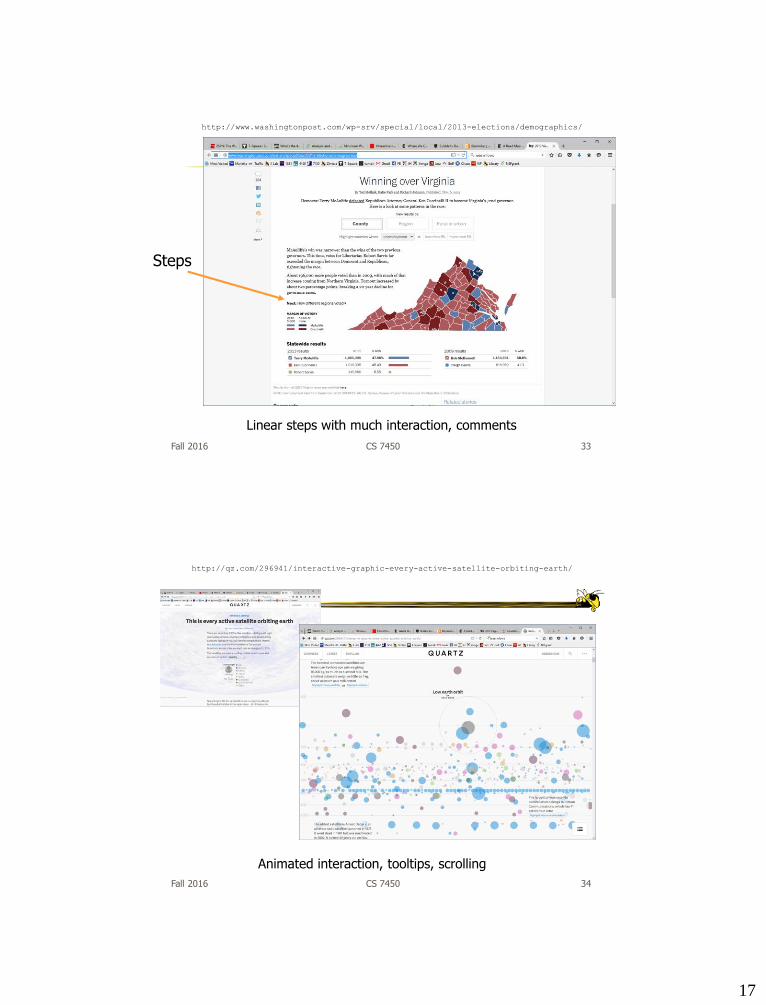
http://www.washingtonpost.com/wp-srv/special/local/2013-elections/demographics/
Steps
Linear steps with much interaction, comments
33
Fall 2016 CS 7450
Animated interaction, tooltips, scrolling
http://qz.com/296941/interactive-graphic-every-active-satellite-orbiting-earth/
34
18
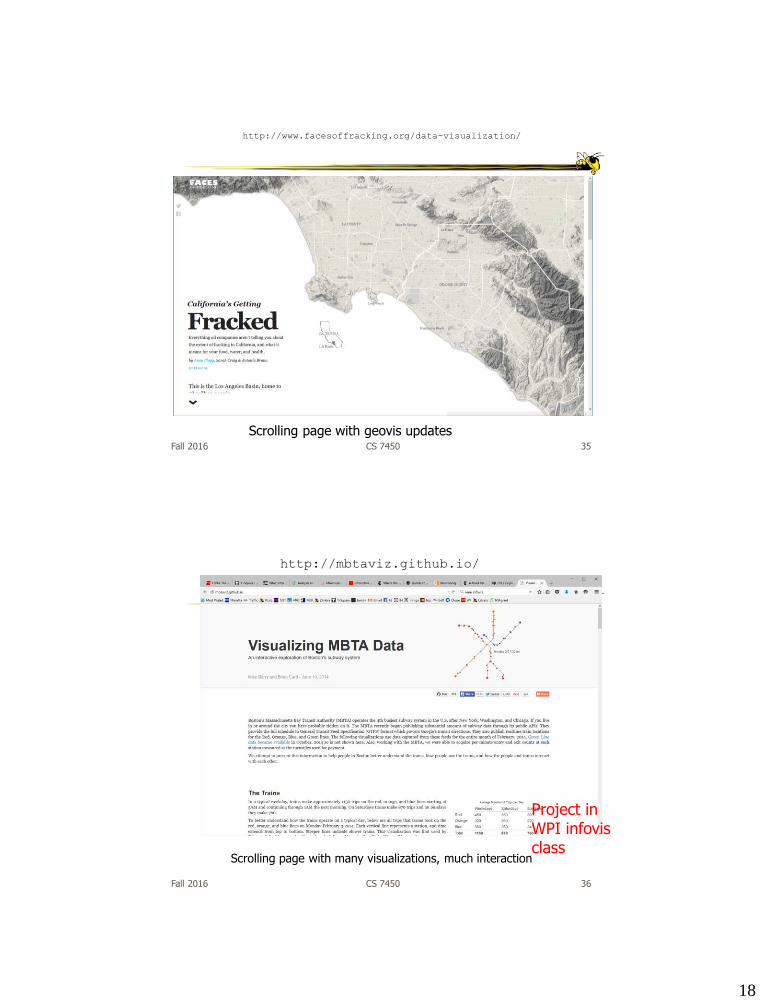
Fall 2016 CS 7450 35
http://www.facesoffracking.org/data-visualization/
Scrolling page with geovis updates
Fall 2016 CS 7450
http://mbtaviz.github.io/
Scrolling page with many visualizations, much interaction
Project inWPI infovisclass
36
19
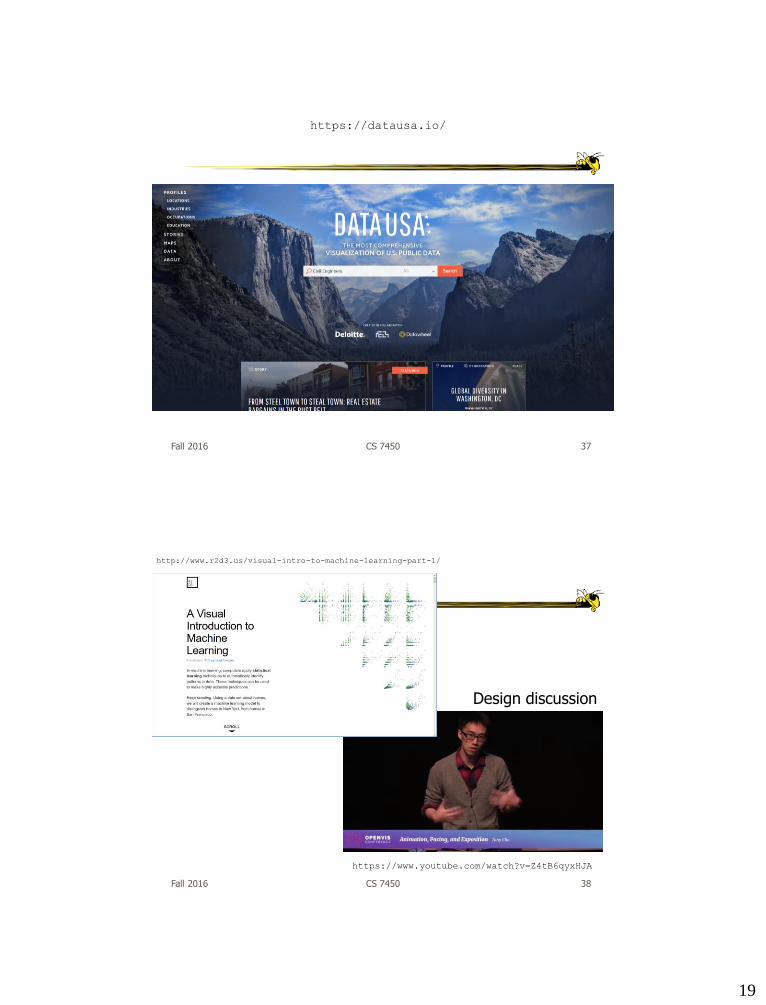
Fall 2016 CS 7450 37
https://datausa.io/
Fall 2016 CS 7450 38
http://www.r2d3.us/visual-intro-to-machine-learning-part-1/
https://www.youtube.com/watch?v=Z4tB6qyxHJA
Design discussion
20
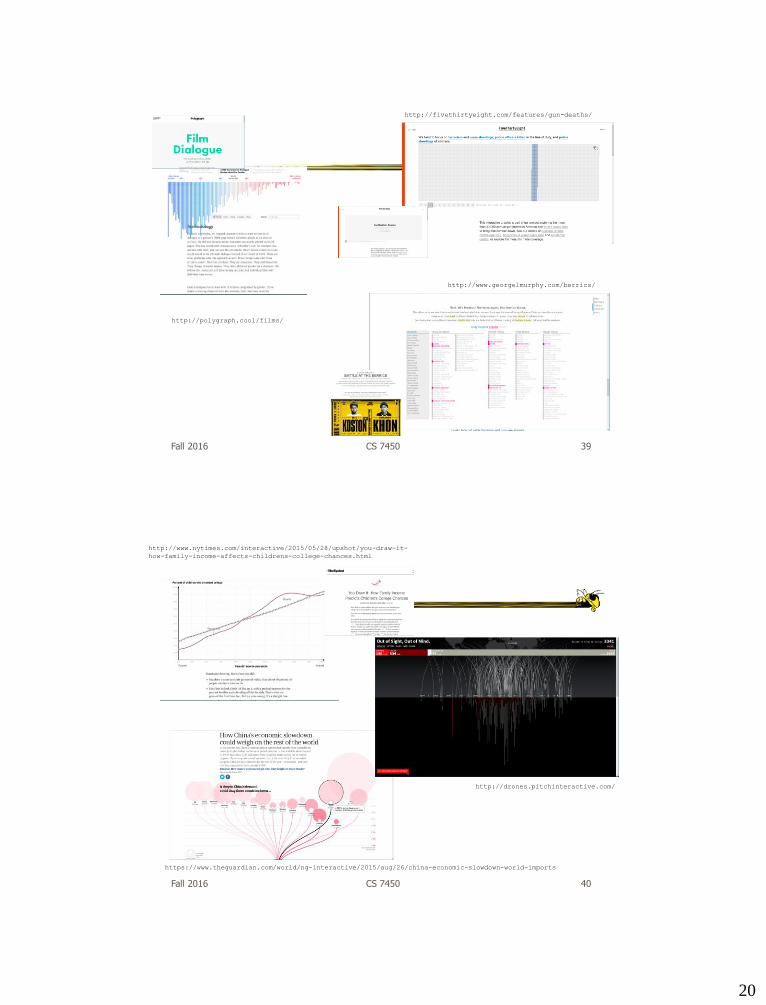
Fall 2016 CS 7450 39
http://polygraph.cool/films/
http://fivethirtyeight.com/features/gun-deaths/
http://www.georgelmurphy.com/berrics/
Fall 2016 CS 7450 40
https://www.theguardian.com/world/ng-interactive/2015/aug/26/china-economic-slowdown-world-imports
http://www.nytimes.com/interactive/2015/05/28/upshot/you-draw-it-
how-family-income-affects-childrens-college-chances.html
http://drones.pitchinteractive.com/
21
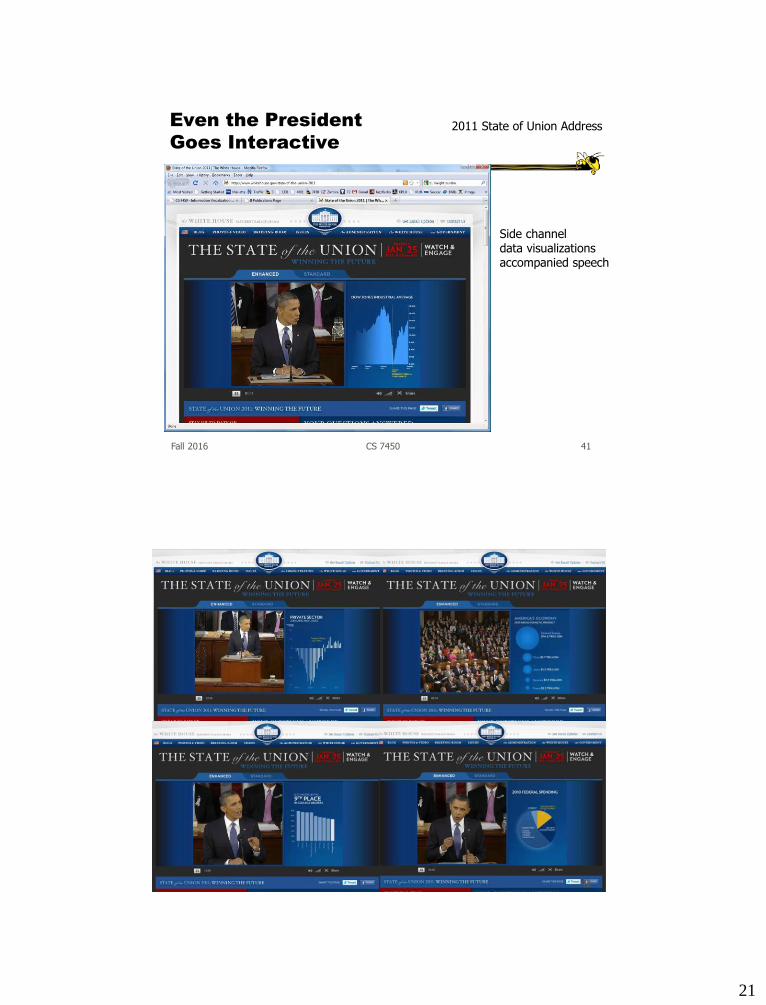
Even the President
Goes Interactive
Fall 2016 CS 7450
2011 State of Union Address
Side channeldata visualizationsaccompanied speech
41
Fall 2016 CS 7450 42
22
Fall 2016 CS 7450
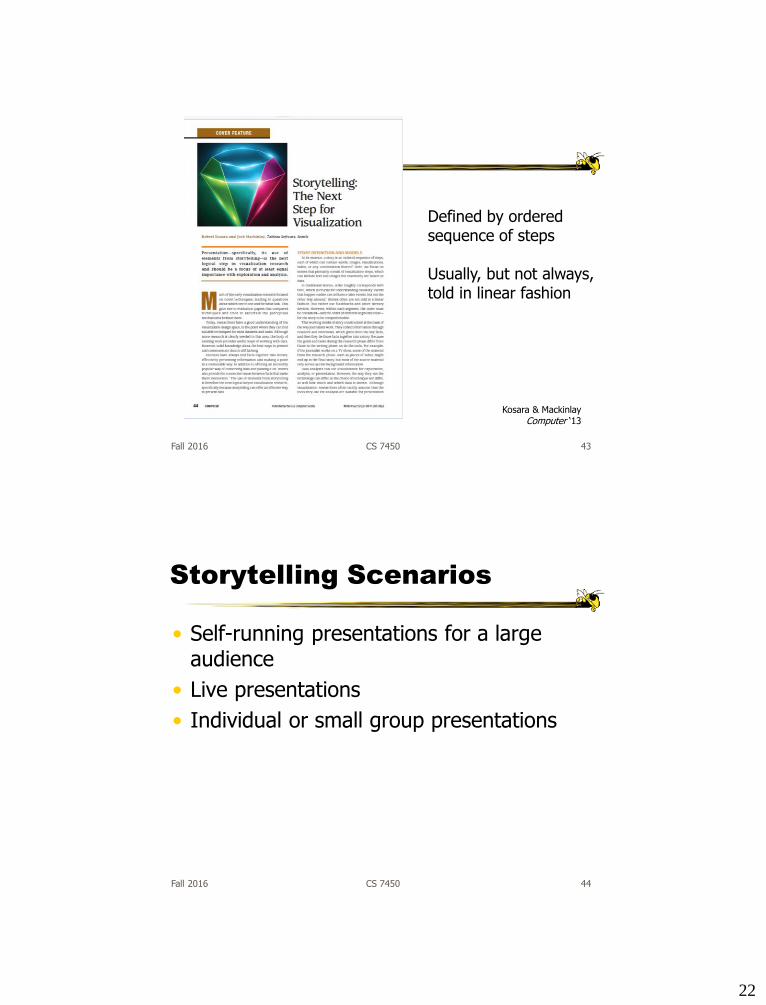
Defined by ordered sequence of steps
Usually, but not always,told in linear fashion
Kosara & MackinlayComputer ‘13
43
Storytelling Scenarios
• Self-running presentations for a large audience
• Live presentations
• Individual or small group presentations
Fall 2016 CS 7450 44
23
Research Directions
• Storytelling approaches and affordances What vis affordances can help guide reader through story?
• Evaluation How to measure effectiveness?
• Memory, context, & embellishments What makes one memorable, and is that good?
• Interaction How to allow without interfering with story?
• Annotations & highlights How to balance text and visualization?
• Learning from other disciplines What can we learn from journalism, choreography, directing, etc.?
• Techniques specific to storytelling Which vis techniques are good matches?
• Stories & collaboration How to facilitate more collaboration?
Fall 2016 CS 7450 45
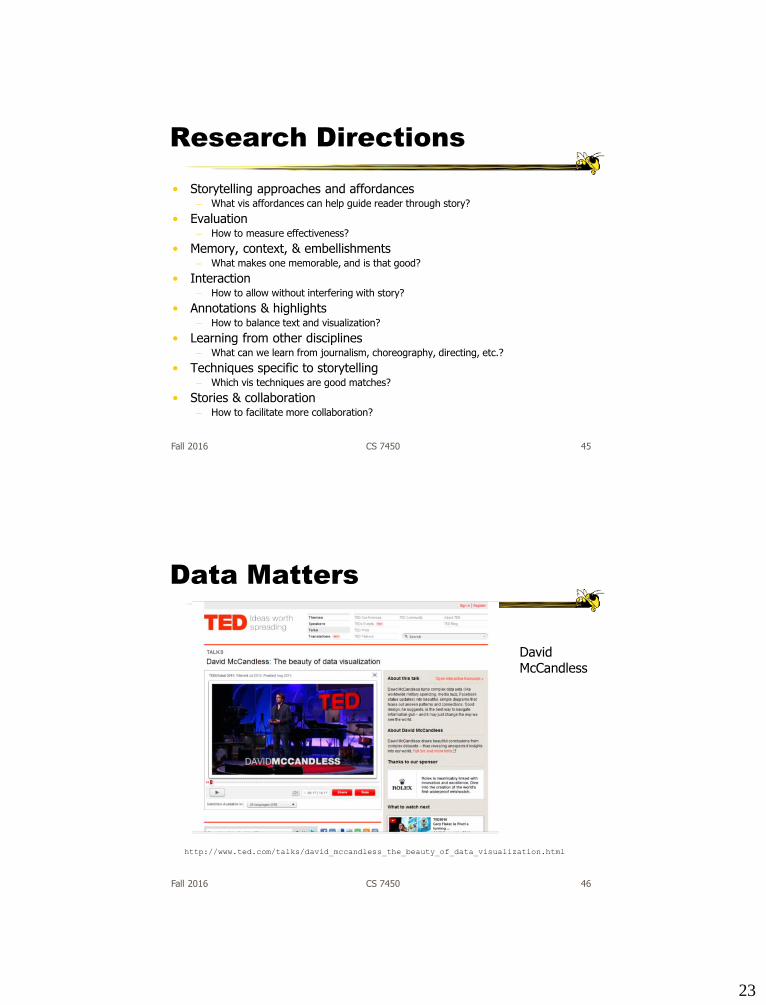
Data Matters
Fall 2016 CS 7450
http://www.ted.com/talks/david_mccandless_the_beauty_of_data_visualization.html
DavidMcCandless
46
24
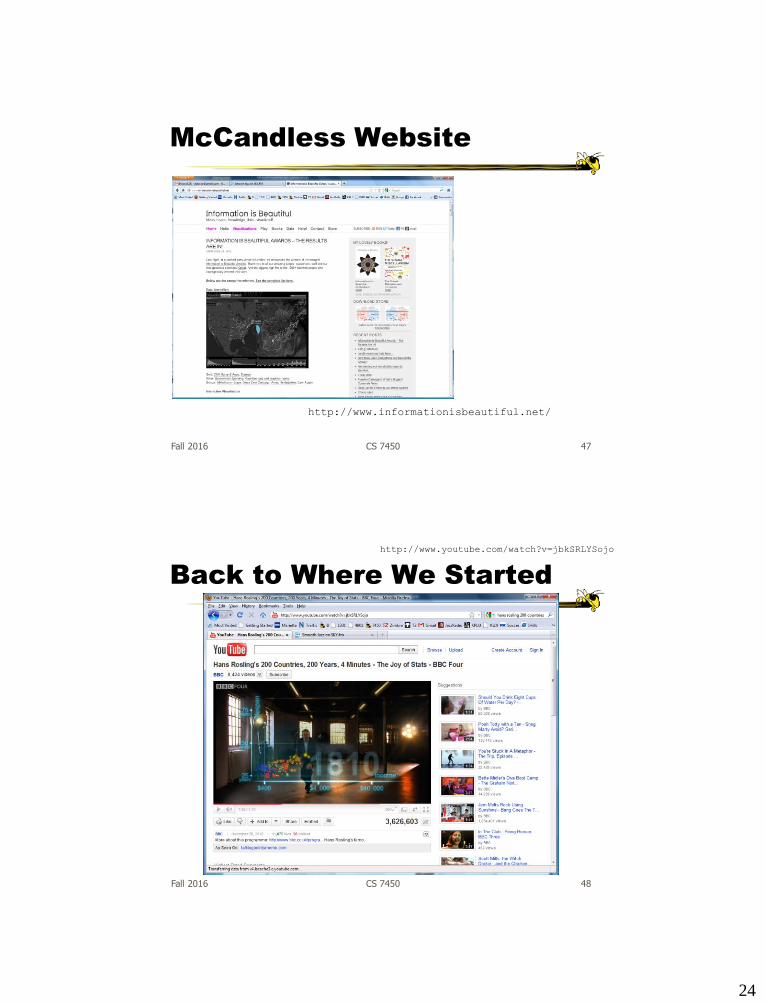
McCandless Website
Fall 2016 CS 7450
http://www.informationisbeautiful.net/
47
Back to Where We Started
Fall 2016 CS 7450
http://www.youtube.com/watch?v=jbkSRLYSojo
48
25
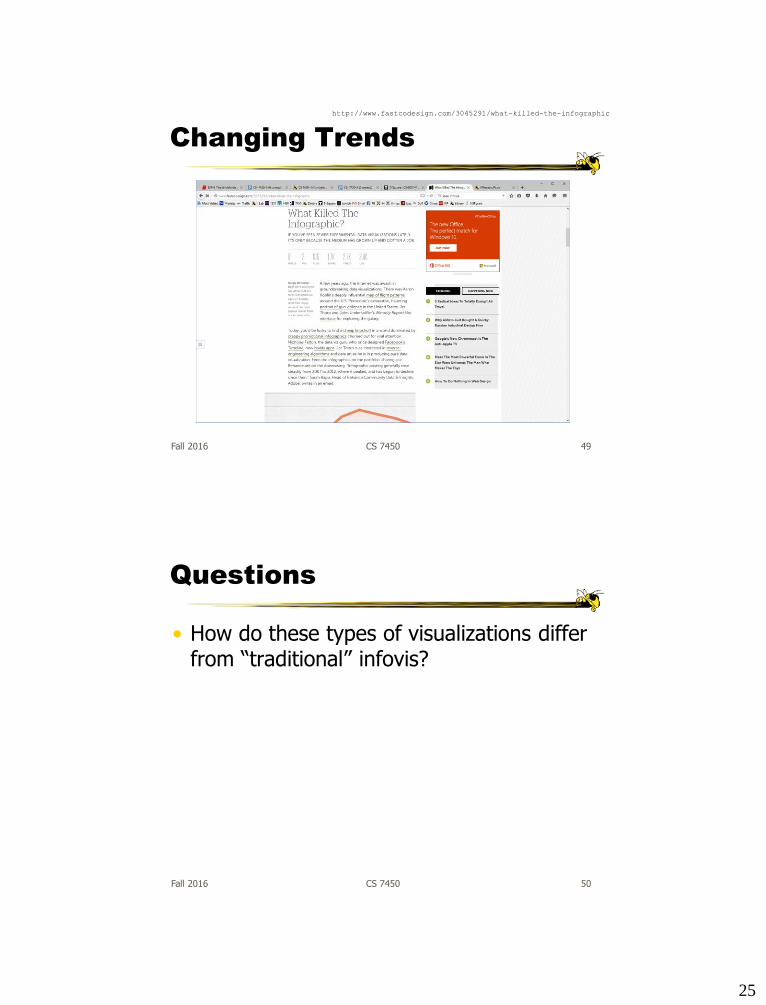
Changing Trends
Fall 2016 CS 7450
http://www.fastcodesign.com/3045291/what-killed-the-infographic
49
Questions
• How do these types of visualizations differ from “traditional” infovis?
Fall 2016 CS 7450 50
26
Questions
• Would you characterize all of these as information visualizations?
Consider some of the different examples
Fall 2016 CS 7450 51
My Reflections
• InfoVis for analysis and presentation are different
Apples & oranges (both fruit though)
• How?
Fall 2016 CS 7450 52
27
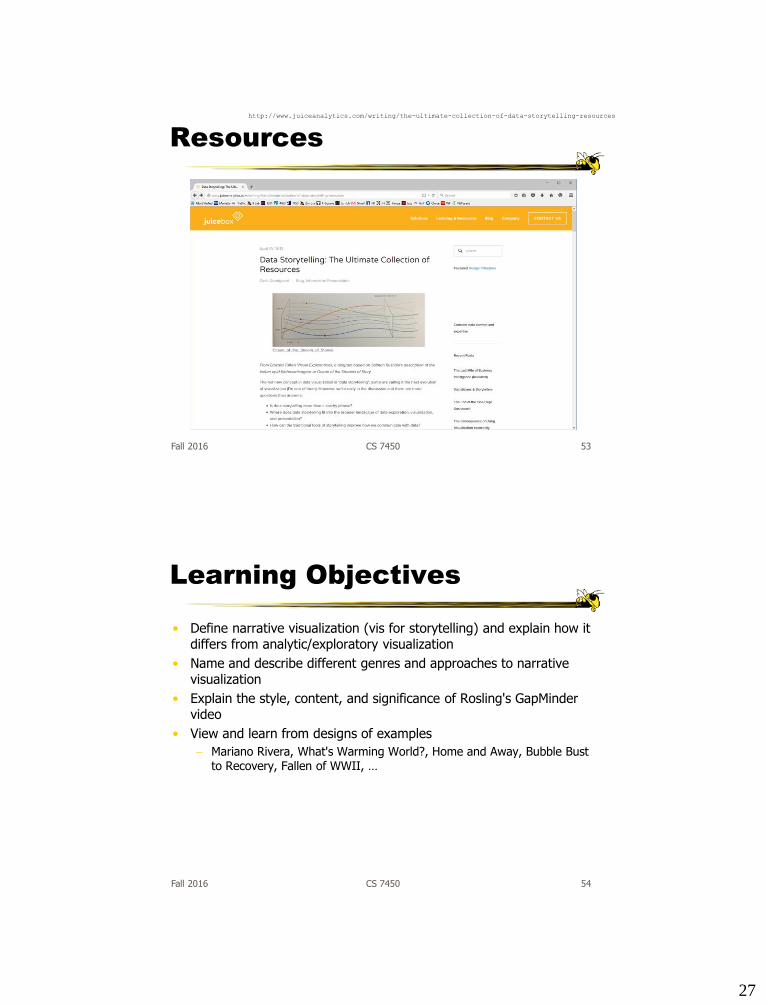
Resources
Fall 2016 CS 7450
http://www.juiceanalytics.com/writing/the-ultimate-collection-of-data-storytelling-resources
53
Learning Objectives
• Define narrative visualization (vis for storytelling) and explain how it differs from analytic/exploratory visualization
• Name and describe different genres and approaches to narrative visualization
• Explain the style, content, and significance of Rosling's GapMinder video
• View and learn from designs of examples
Mariano Rivera, What's Warming World?, Home and Away, Bubble Bust to Recovery, Fallen of WWII, …
Fall 2016 CS 7450 54
28
Project Design Document
• Ingredients
Clarify the data
Objectives, user tasks & queries, …
Designs from your poster and more
A suggested design to implement
• Bring 3 copies
Fall 2016 CS 7450 55
Reading
• Explore the data-driven storytelling websites not shown in class
• Watch the videos we didn't show
Fall 2016 CS 7450 56
29
Fall 2016 CS 7450
Upcoming
• Tufte's design principles
• Geospatial visualization
57