PROMOTIONS EXERCISE 2016 HR Partners Trade Union Representatives / Role Analysts.
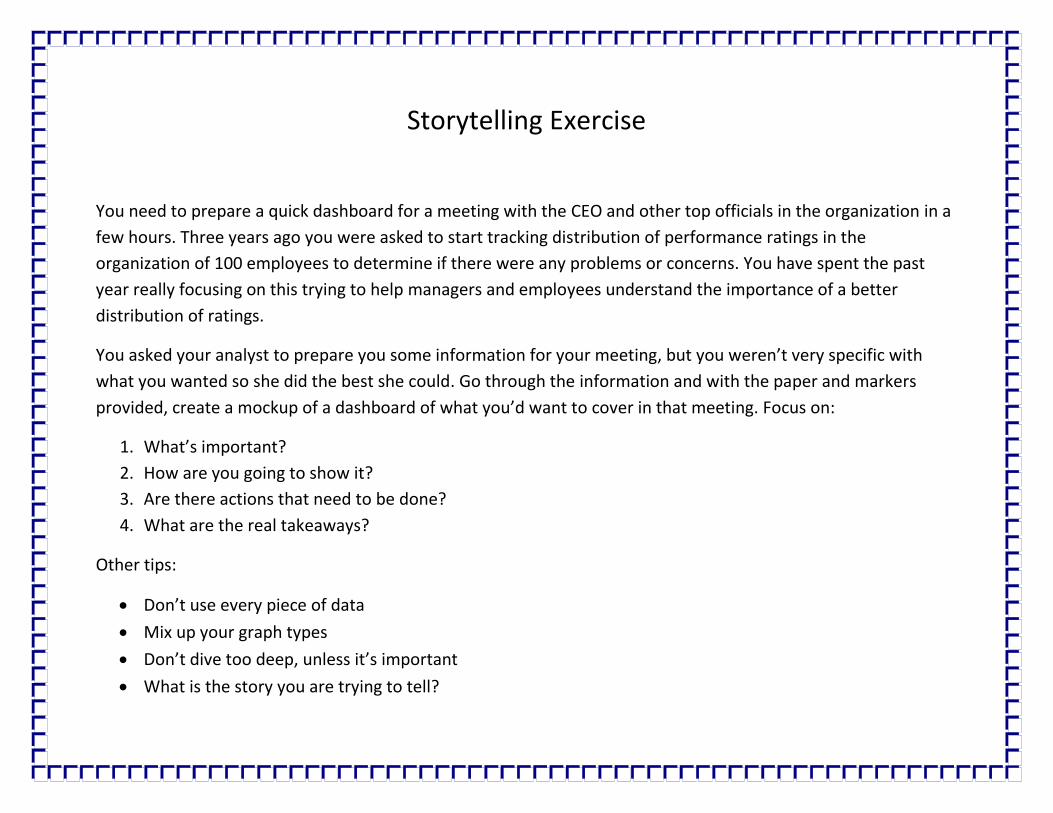
Storytelling Exercise
You need to prepare a quick dashboard for a meeting with the CEO and other top officials in the organization in a
few hours. Three years ago you were asked to start tracking distribution of performance ratings in the
organization of 100 employees to determine if there were any problems or concerns. You have spent the past
year really focusing on this trying to help managers and employees understand the importance of a better
distribution of ratings.
You asked your analyst to prepare you some information for your meeting, but you weren’t very specific with
what you wanted so she did the best she could. Go through the information and with the paper and markers
provided, create a mockup of a dashboard of what you’d want to cover in that meeting. Focus on:
1. What’s important?
2. How are you going to show it?
3. Are there actions that need to be done?
4. What are the real takeaways?
Other tips:
Don’t use every piece of data
Mix up your graph types
Don’t dive too deep, unless it’s important
What is the story you are trying to tell?
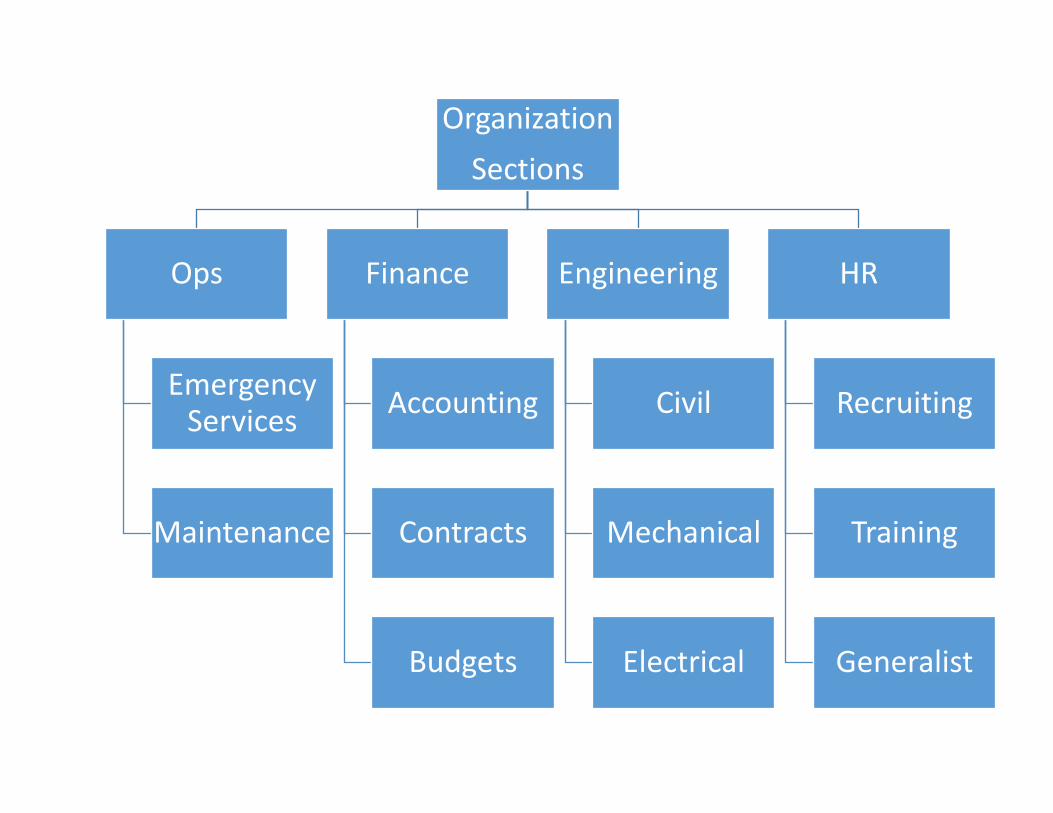
Organization
Sections
Ops
Emergency Services
Maintenance
Finance
Accounting
Contracts
Budgets
Engineering
Civil
Mechanical
Electrical
HR
Recruiting
Training
Generalist
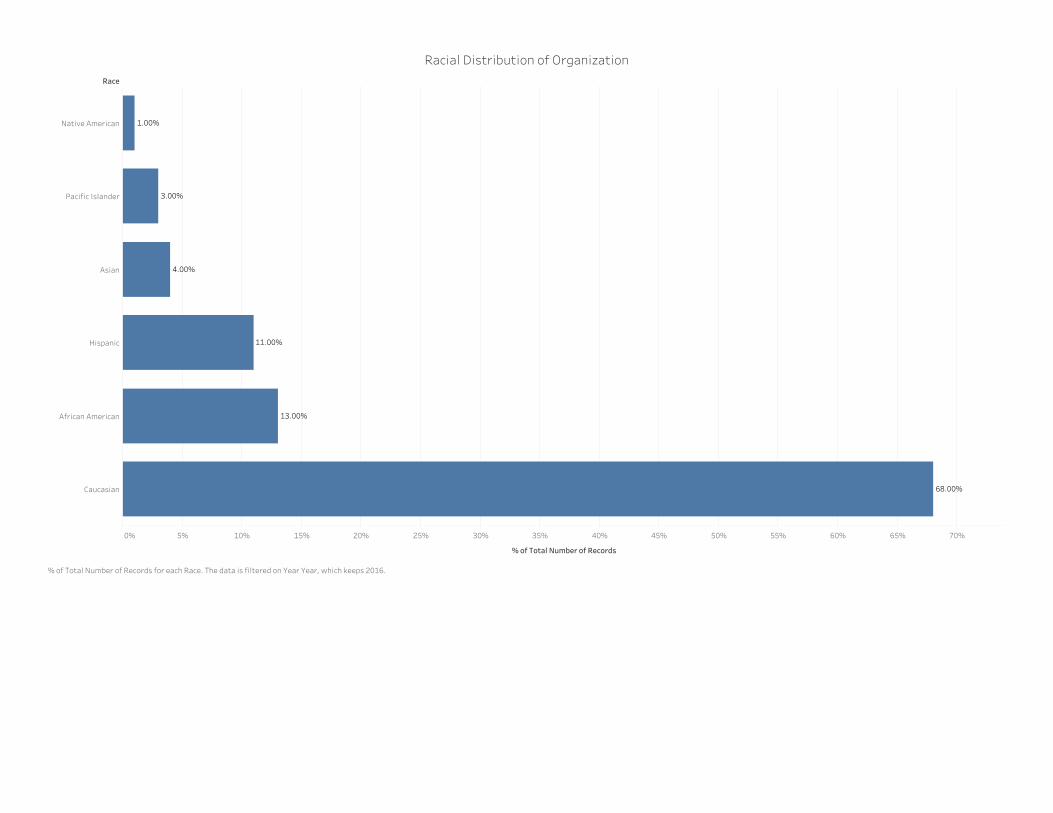
Race
0% 5% 10% 15% 20% 25% 30% 35% 40% 45% 50% 55% 60% 65% 70%
% of Total Number of Records
Native American
Pacific Islander
Asian
Hispanic
African American
Caucasian
11.00%
13.00%
68.00%
1.00%
3.00%
4.00%
Racial Distribution of Organization
% of Total Number of Records for each Race. The data is filtered on Year Year, which keeps 2016.
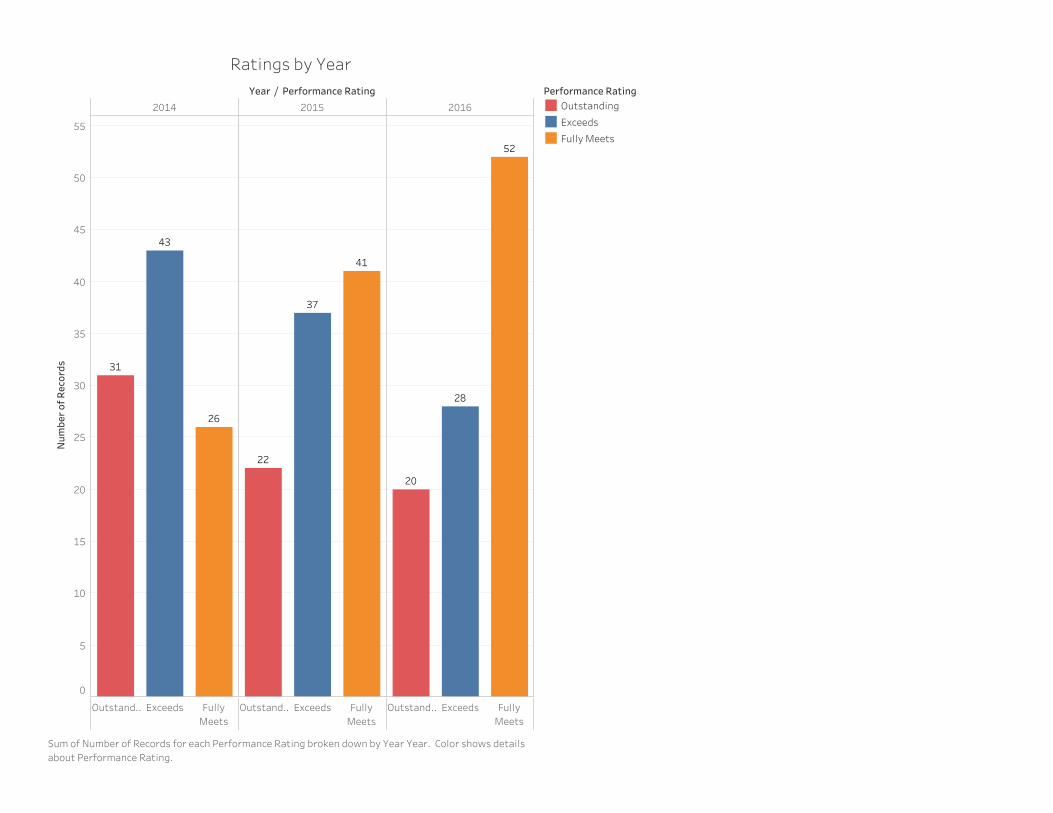
Year / Performance Rating
2014 2015 2016
Outstand..Exceeds FullyMeets
Outstand..Exceeds FullyMeets
Outstand..Exceeds FullyMeets
0
5
10
15
20
25
30
35
40
45
50
55
Number of Records 31
26
43
41
37
22
28
20
52
Ratings by YearPerformance RatingOutstanding
Exceeds
Fully Meets
Sum of Number of Records for each Performance Rating broken down by Year Year. Color shows detailsabout Performance Rating.
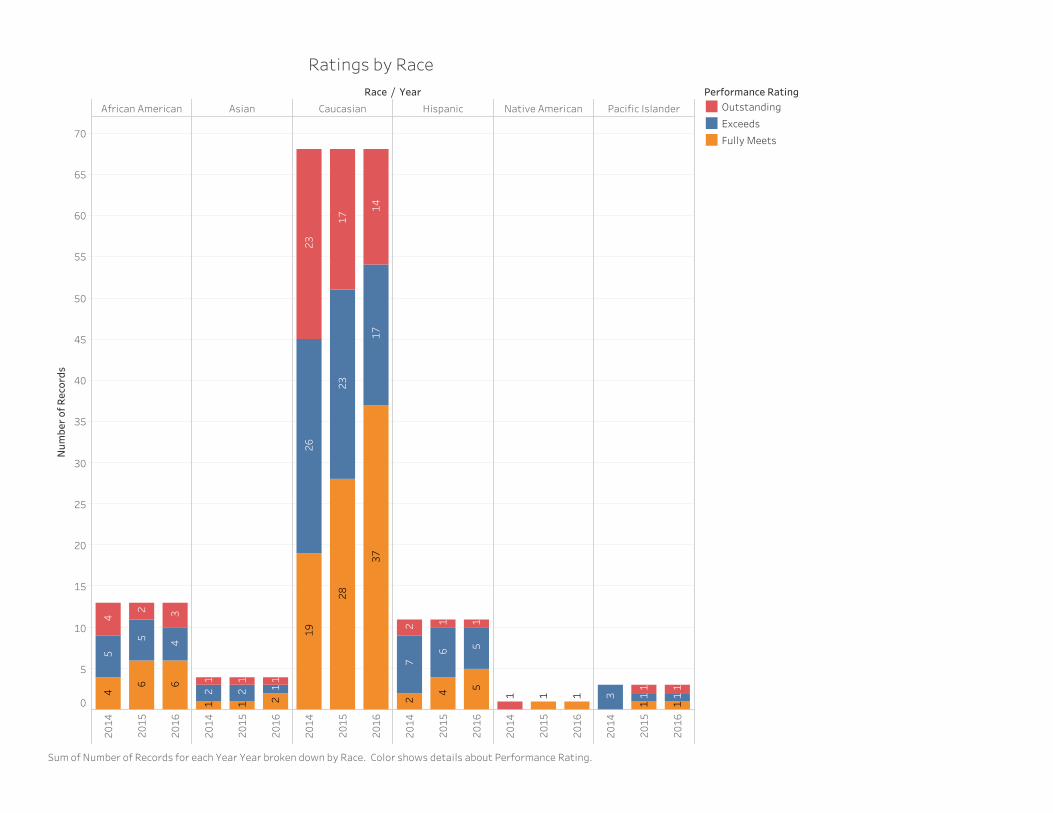
Race / Year
African American Asian Caucasian Hispanic Native American Pacific Islander2014
2015
2016
2014
2015
2016
2014
2015
2016
2014
2015
2016
2014
2015
2016
2014
2015
2016
0
5
10
15
20
25
30
35
40
45
50
55
60
65
70
Number of Records
4
4
4
6 632
5
5
1 1 11
1 1
2 2
2
14
26
28
23
2317
1737
19
41 1
6
72
2
55
1 1 1
1 1
1 1
1 1
3
Ratings by RacePerformance RatingOutstanding
Exceeds
Fully Meets
Sum of Number of Records for each Year Year broken down by Race. Color shows details about Performance Rating.
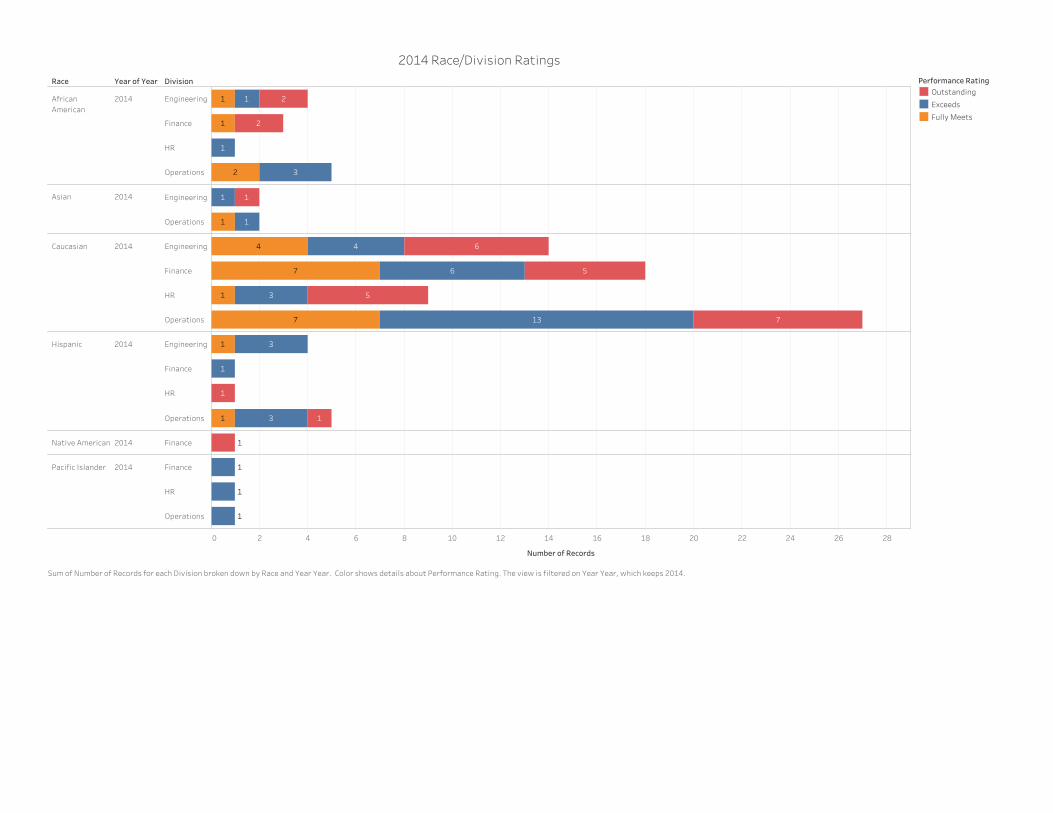
Race Year of Year Division
0 2 4 6 8 10 12 14 16 18 20 22 24 26 28
Number of Records
AfricanAmerican
2014 Engineering
Finance
HR
Operations
Asian 2014 Engineering
Operations
Caucasian 2014 Engineering
Finance
HR
Operations
Hispanic 2014 Engineering
Finance
HR
Operations
Native American2014 Finance
Pacific Islander 2014 Finance
HR
Operations
1
1
1
1
3
2
2
2
11
11
13
44
1
6
6
3
7
7
7
5
5
1
1
1
1
1
3
3
1
1
1
1
2014 Race/Division RatingsPerformance RatingOutstanding
Exceeds
Fully Meets
Sum of Number of Records for each Division broken down by Race and Year Year. Color shows details about Performance Rating. The view is filtered on Year Year, which keeps 2014.
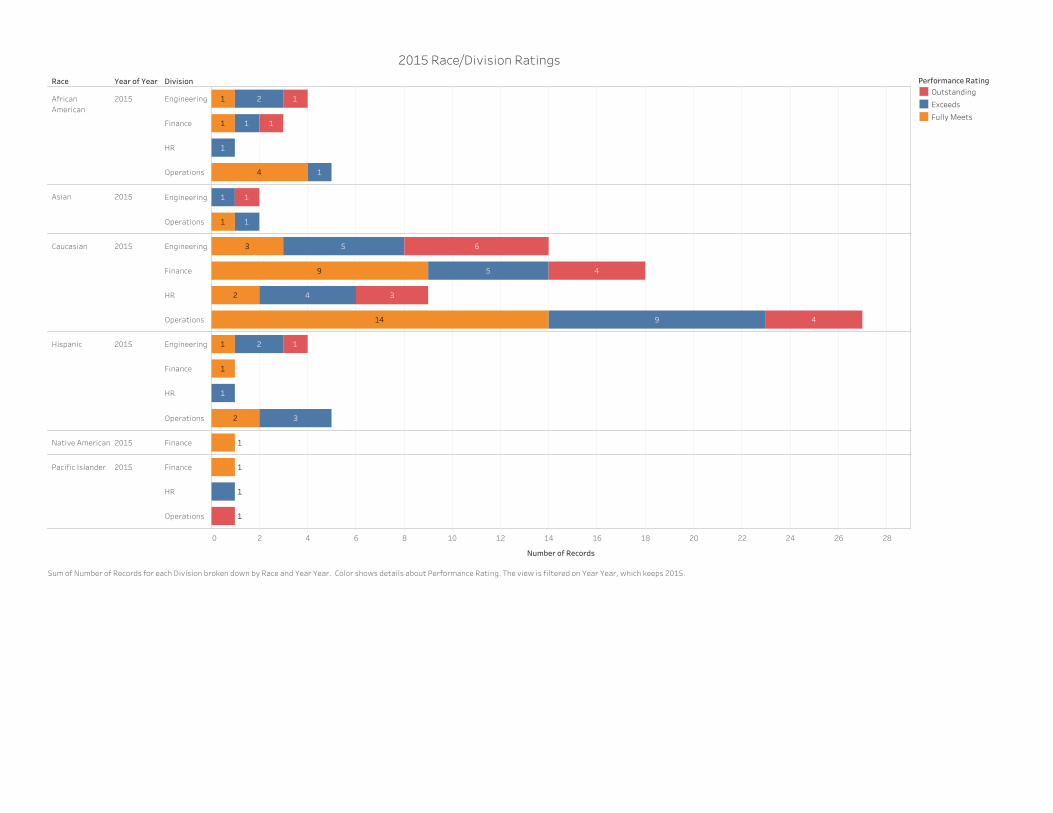
Race Year of Year Division
0 2 4 6 8 10 12 14 16 18 20 22 24 26 28
Number of Records
AfricanAmerican
2015 Engineering
Finance
HR
Operations
Asian 2015 Engineering
Operations
Caucasian 2015 Engineering
Finance
HR
Operations
Hispanic 2015 Engineering
Finance
HR
Operations
Native American2015 Finance
Pacific Islander 2015 Finance
HR
Operations
4
1
11
1
1
1
1
2
11
11
14
4
4
4
6
3
3
2
5
5
9
9
1
1
1
1
3
2
2
1
1
1
1
2015 Race/Division RatingsPerformance RatingOutstanding
Exceeds
Fully Meets
Sum of Number of Records for each Division broken down by Race and Year Year. Color shows details about Performance Rating. The view is filtered on Year Year, which keeps 2015.
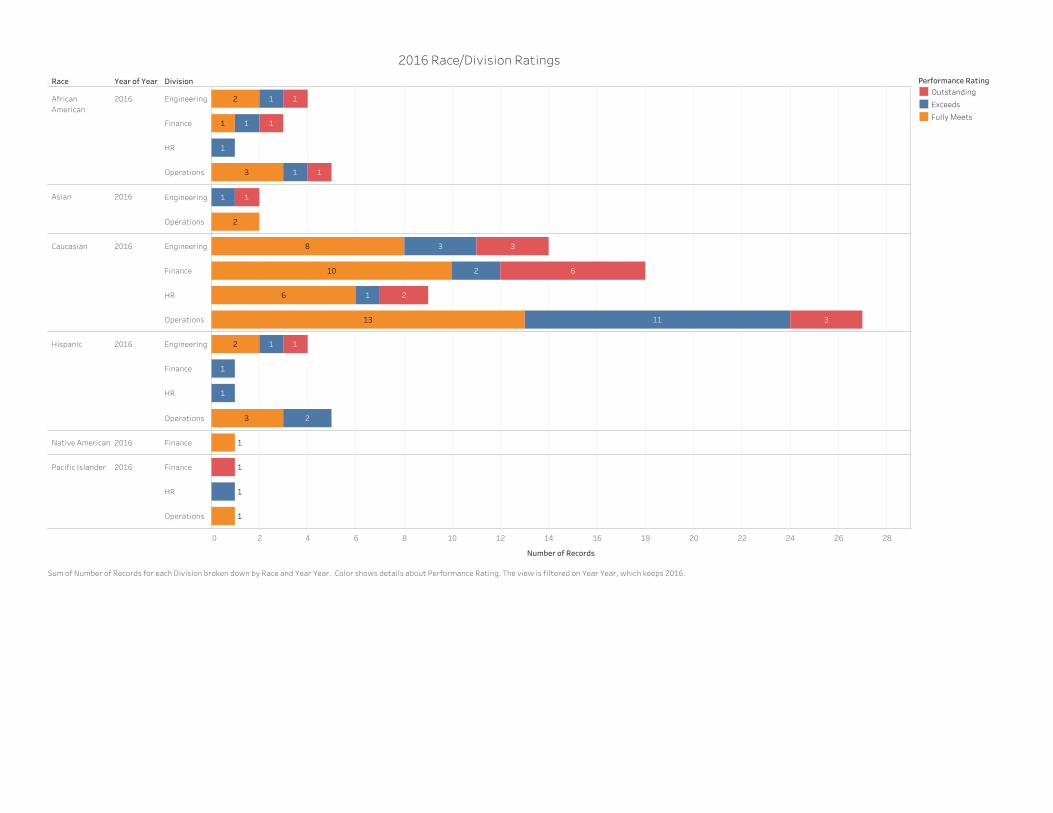
Race Year of Year Division
0 2 4 6 8 10 12 14 16 18 20 22 24 26 28
Number of Records
AfricanAmerican
2016 Engineering
Finance
HR
Operations
Asian 2016 Engineering
Operations
Caucasian 2016 Engineering
Finance
HR
Operations
Hispanic 2016 Engineering
Finance
HR
Operations
Native American2016 Finance
Pacific Islander 2016 Finance
HR
Operations
1
1
1
1
1
1
1
1
3
2
11
2
1113
10
1
6
6
8 3
3
3
2
2
11
1
1
3 2
2
1
1
1
1
2016 Race/Division RatingsPerformance RatingOutstanding
Exceeds
Fully Meets
Sum of Number of Records for each Division broken down by Race and Year Year. Color shows details about Performance Rating. The view is filtered on Year Year, which keeps 2016.
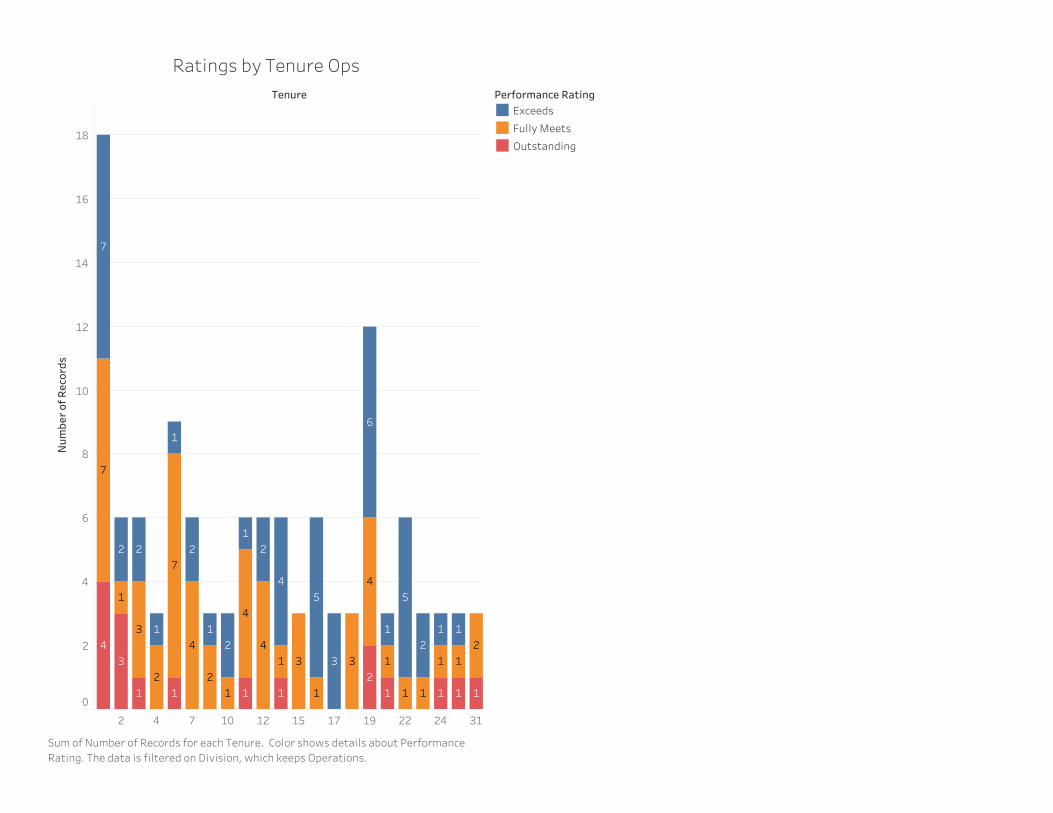
Tenure
2 4 7 10 12 15 17 19 22 24 31
0
2
4
6
8
10
12
14
16
18
Number of Records
4
4 4
44
41
1
1
1
1
1 1
1
1
1
1
1
1 1
1
1
11 1 1 1 1 1 1
6
3 33
3
3
7
7
7
2
22
2
2
2
2 22
2
55
Ratings by Tenure OpsPerformance RatingExceeds
Fully Meets
Outstanding
Sum of Number of Records for each Tenure. Color shows details about PerformanceRating. The data is filtered on Division, which keeps Operations.
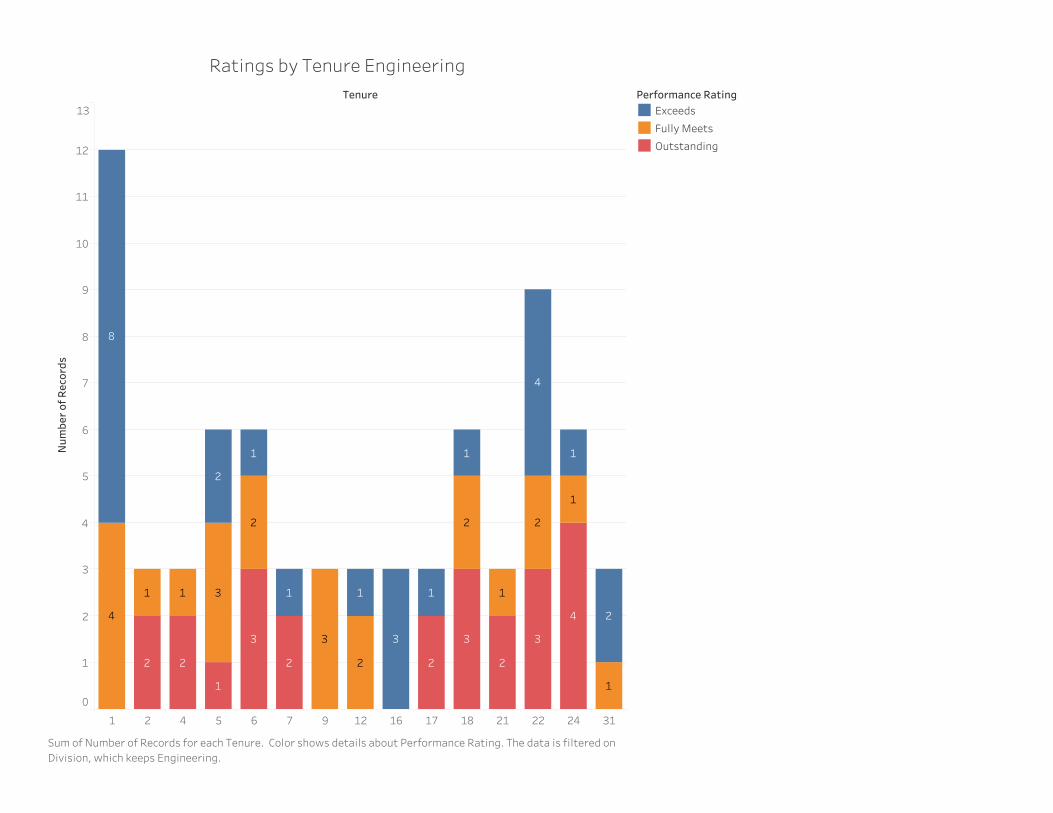
Tenure
1 2 4 5 6 7 9 12 16 17 18 21 22 24 31
0
1
2
3
4
5
6
7
8
9
10
11
12
13
Number of Records
4
4
4
1
1
1 1
1
1
1 1
1
1 1
1
8
3
33 3 33
2
2
22 2
2
2 2 2 2 2
Ratings by Tenure EngineeringPerformance RatingExceeds
Fully Meets
Outstanding
Sum of Number of Records for each Tenure. Color shows details about Performance Rating. The data is filtered onDivision, which keeps Engineering.
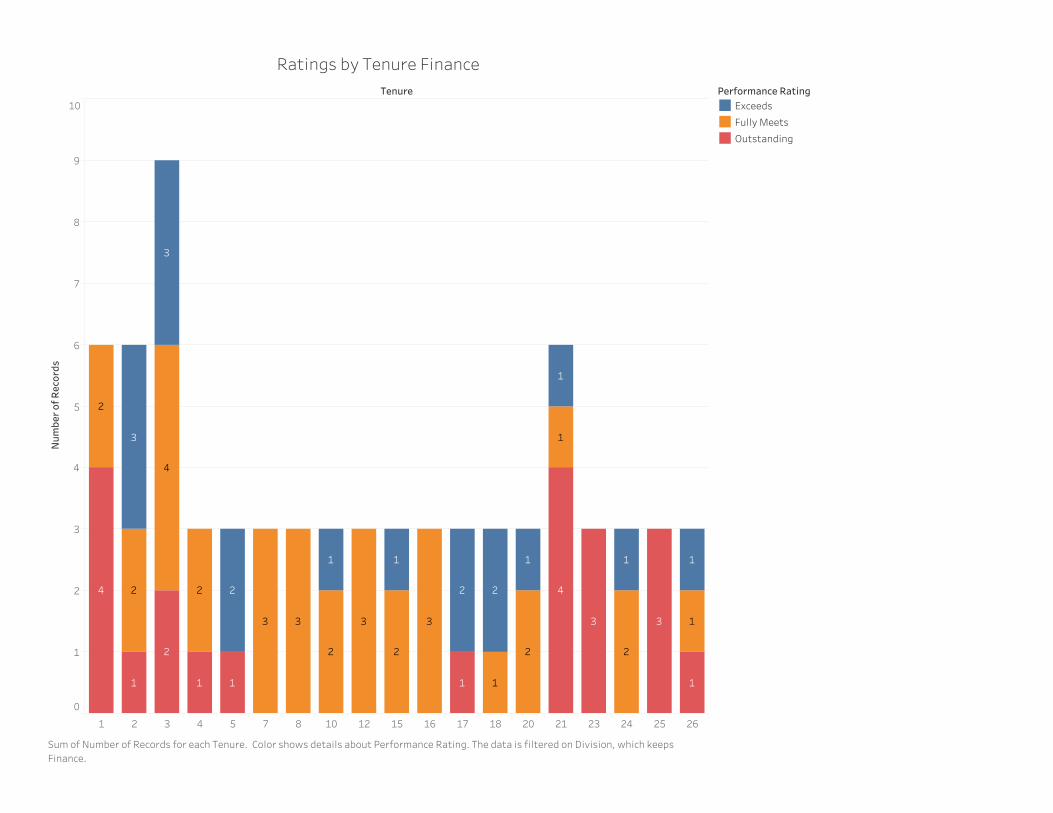
Tenure
1 2 3 4 5 7 8 10 12 15 16 17 18 20 21 23 24 25 26
0
1
2
3
4
5
6
7
8
9
10
Number of Records
4
4
4
111
1 1
1
1
1
1 1
1
1
1 1
3
3 3
3
3 3 3 3
2
22
2
2
2
2
2
2
22
Ratings by Tenure FinancePerformance RatingExceeds
Fully Meets
Outstanding
Sum of Number of Records for each Tenure. Color shows details about Performance Rating. The data is filtered on Division, which keepsFinance.
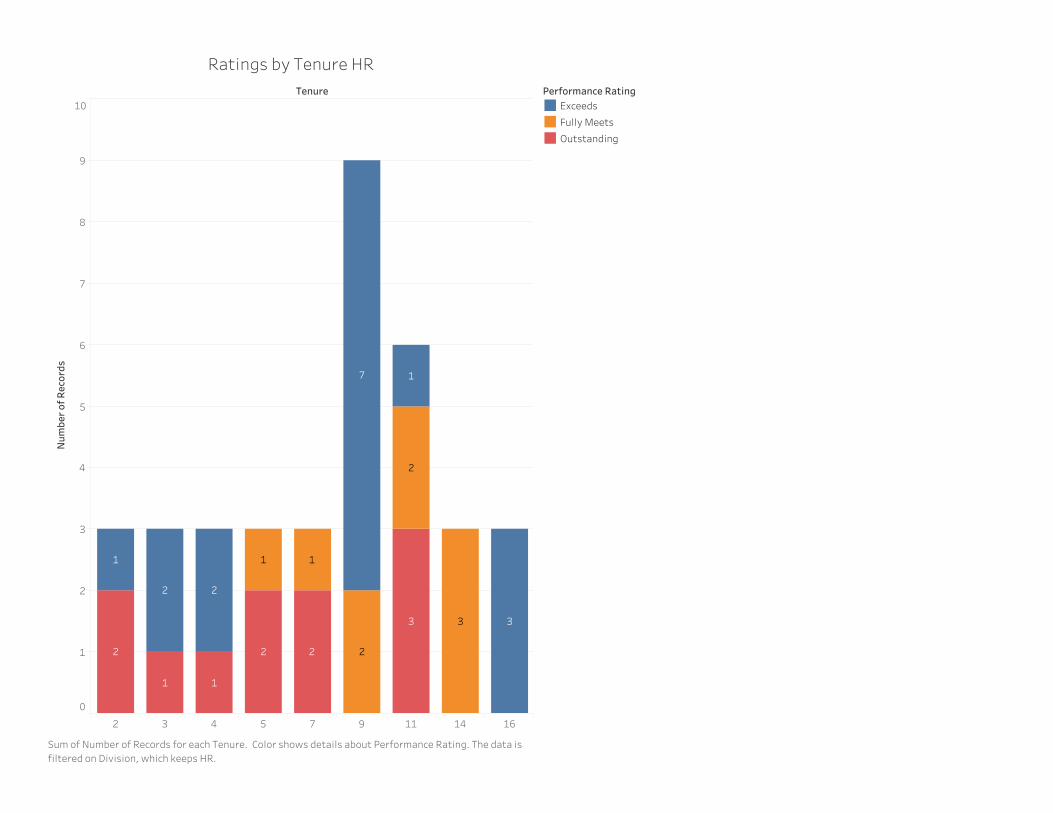
Tenure
2 3 4 5 7 9 11 14 16
0
1
2
3
4
5
6
7
8
9
10
Number of Records
1
1
1 1
1 1
333
7
2 2
2
2
2 2 2
Ratings by Tenure HRPerformance RatingExceeds
Fully Meets
Outstanding
Sum of Number of Records for each Tenure. Color shows details about Performance Rating. The data isfiltered on Division, which keeps HR.
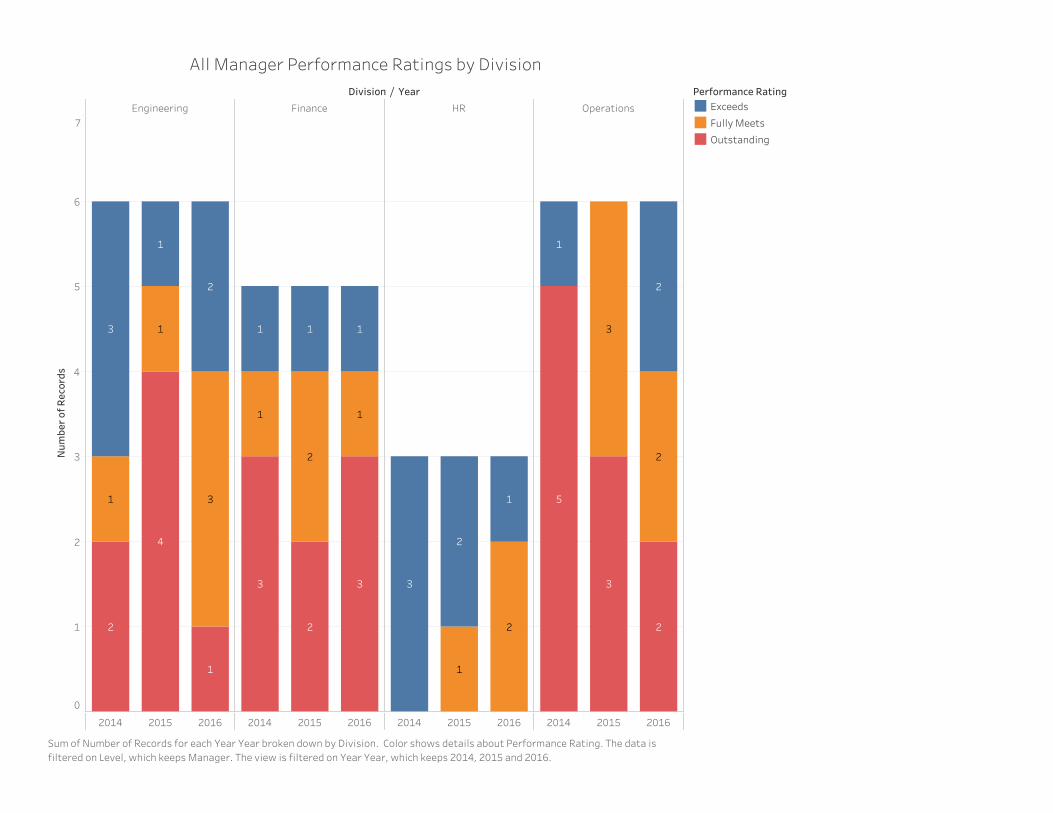
Division / Year
Engineering Finance HR Operations
2014 2015 2016 2014 2015 2016 2014 2015 2016 2014 2015 2016
0
1
2
3
4
5
6
7
Number of Records
4
1
1
1
1
3
3
2
2
1 1 1
1 1
3 3
2
2
1
1
3
2
2
1
3
3
2
2
2
5
All Manager Performance Ratings by DivisionPerformance RatingExceeds
Fully Meets
Outstanding
Sum of Number of Records for each Year Year broken down by Division. Color shows details about Performance Rating. The data isfiltered on Level, which keeps Manager. The view is filtered on Year Year, which keeps 2014, 2015 and 2016.
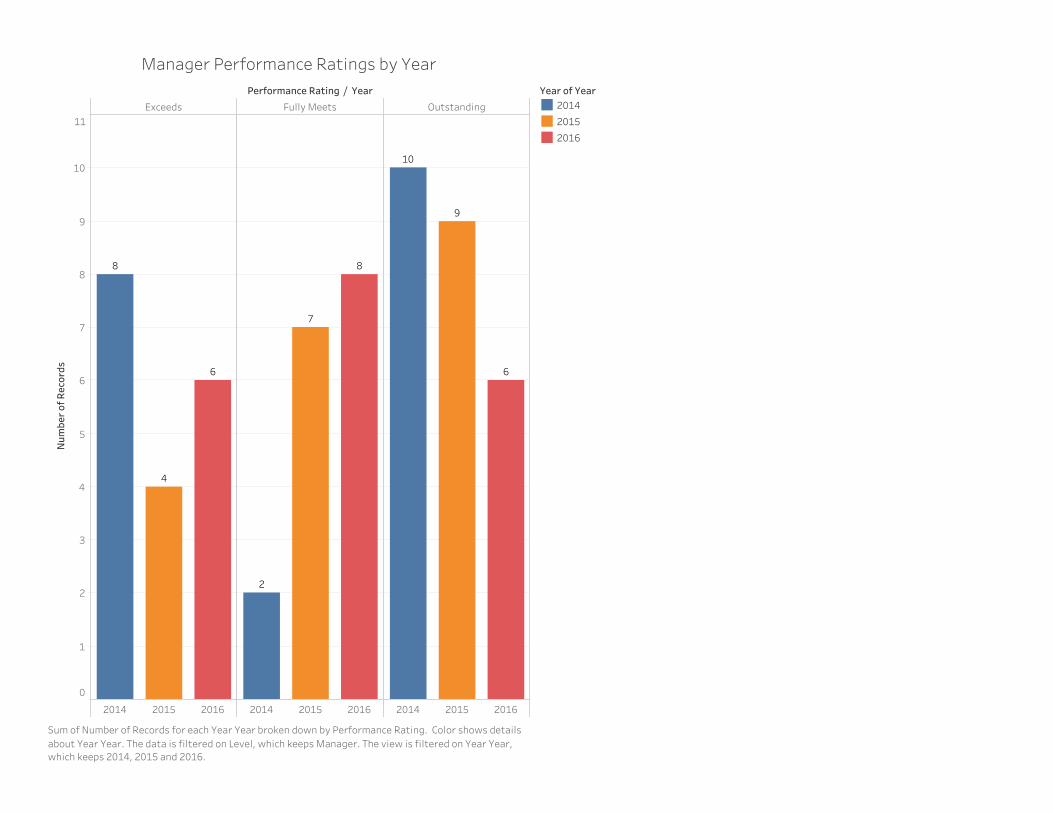
Performance Rating / Year
Exceeds Fully Meets Outstanding
2014 2015 2016 2014 2015 2016 2014 2015 2016
0
1
2
3
4
5
6
7
8
9
10
11
Number of Records
4
6
8 8
7
2
10
6
9
Manager Performance Ratings by YearYear of Year2014
2015
2016
Sum of Number of Records for each Year Year broken down by Performance Rating. Color shows detailsabout Year Year. The data is filtered on Level, which keeps Manager. The view is filtered on Year Year,which keeps 2014, 2015 and 2016.
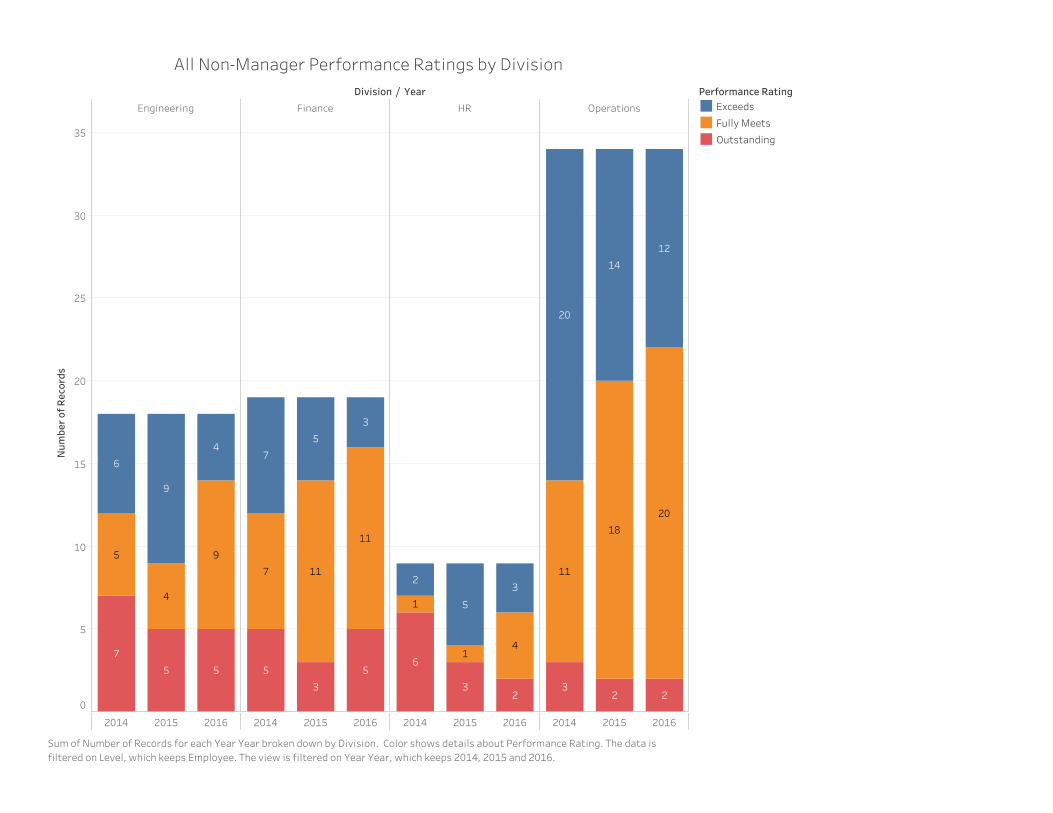
Division / Year
Engineering Finance HR Operations
2014 2015 2016 2014 2015 2016 2014 2015 2016 2014 2015 2016
0
5
10
15
20
25
30
35
Number of Records
4
4
6
7
5
5 5
9
9
11
11
3
3
7
7
5
5 5
4
1
16
3
3
2
2
5
14
11
18
20
20
12
32 2
All Non-Manager Performance Ratings by DivisionPerformance RatingExceeds
Fully Meets
Outstanding
Sum of Number of Records for each Year Year broken down by Division. Color shows details about Performance Rating. The data isfiltered on Level, which keeps Employee. The view is filtered on Year Year, which keeps 2014, 2015 and 2016.
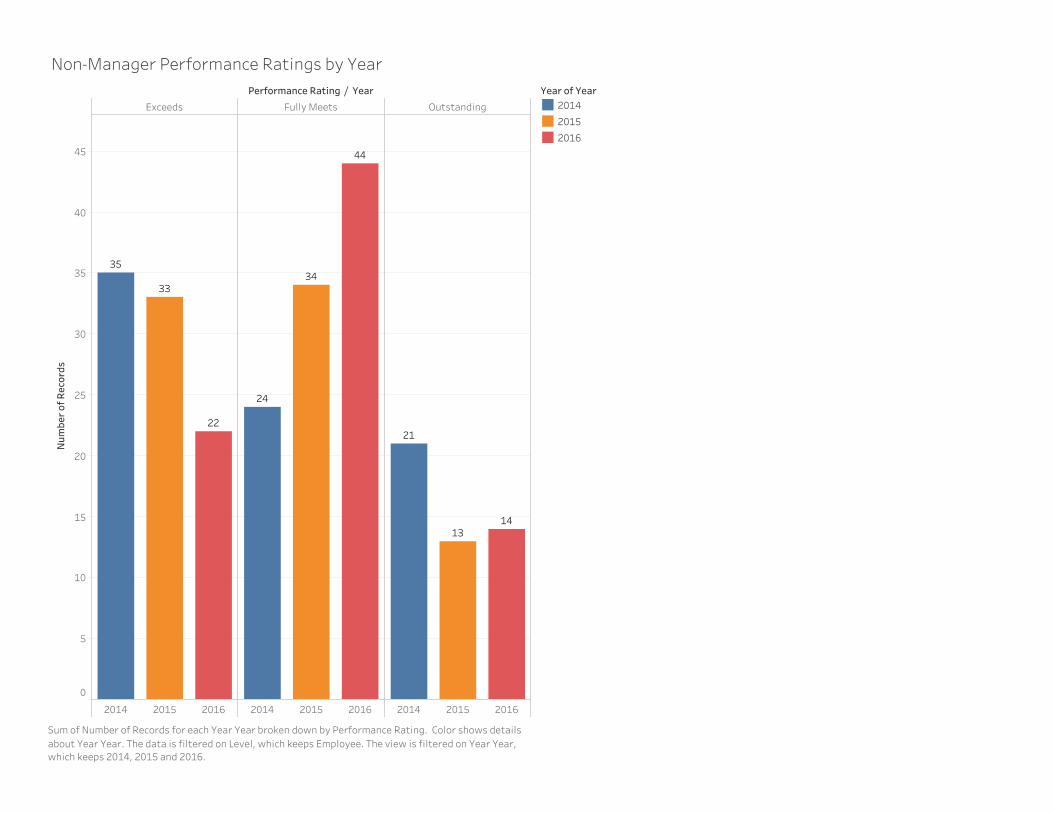
Performance Rating / Year
Exceeds Fully Meets Outstanding
2014 2015 2016 2014 2015 2016 2014 2015 2016
0
5
10
15
20
25
30
35
40
45
Number of Records
33
22
35
24
34
44
14
21
13
Non-Manager Performance Ratings by YearYear of Year2014
2015
2016
Sum of Number of Records for each Year Year broken down by Performance Rating. Color shows detailsabout Year Year. The data is filtered on Level, which keeps Employee. The view is filtered on Year Year,which keeps 2014, 2015 and 2016.
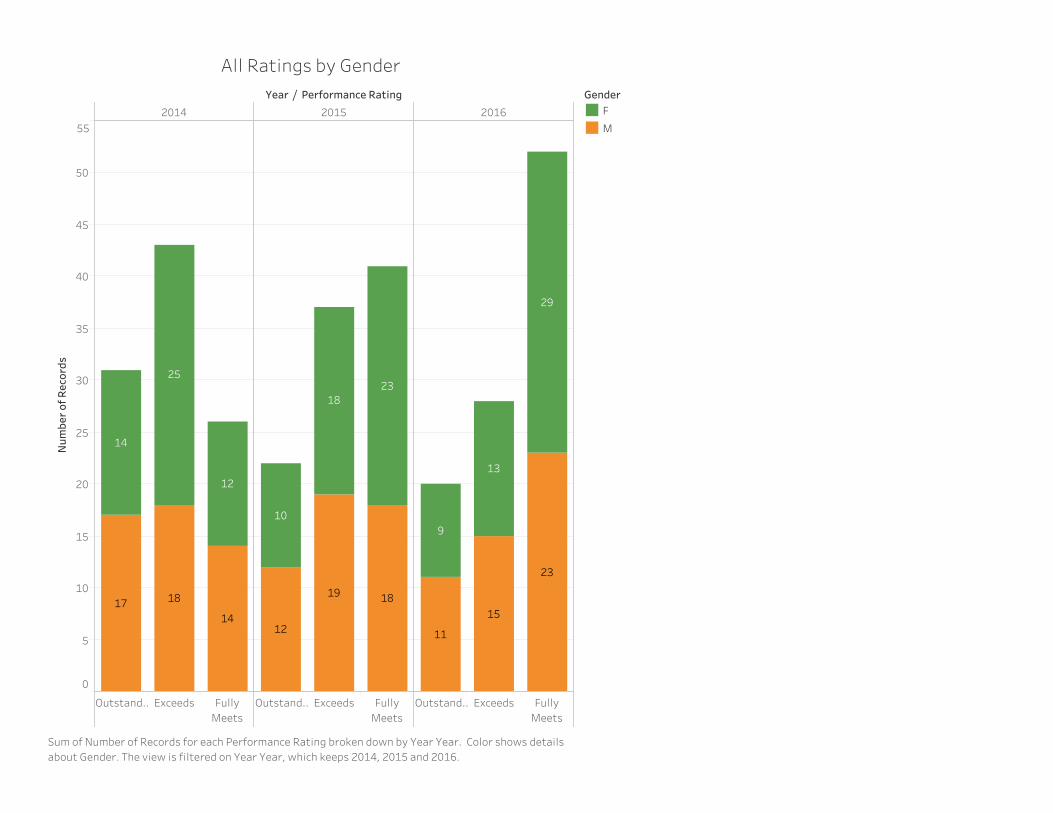
Year / Performance Rating
2014 2015 2016
Outstand..Exceeds FullyMeets
Outstand..Exceeds FullyMeets
Outstand..Exceeds FullyMeets
0
5
10
15
20
25
30
35
40
45
50
55
Number of Records
14
14
1817
12
25
18
18
23
10
12
19
11
13
23
15
29
9
All Ratings by GenderGenderF
M
Sum of Number of Records for each Performance Rating broken down by Year Year. Color shows detailsabout Gender. The view is filtered on Year Year, which keeps 2014, 2015 and 2016.
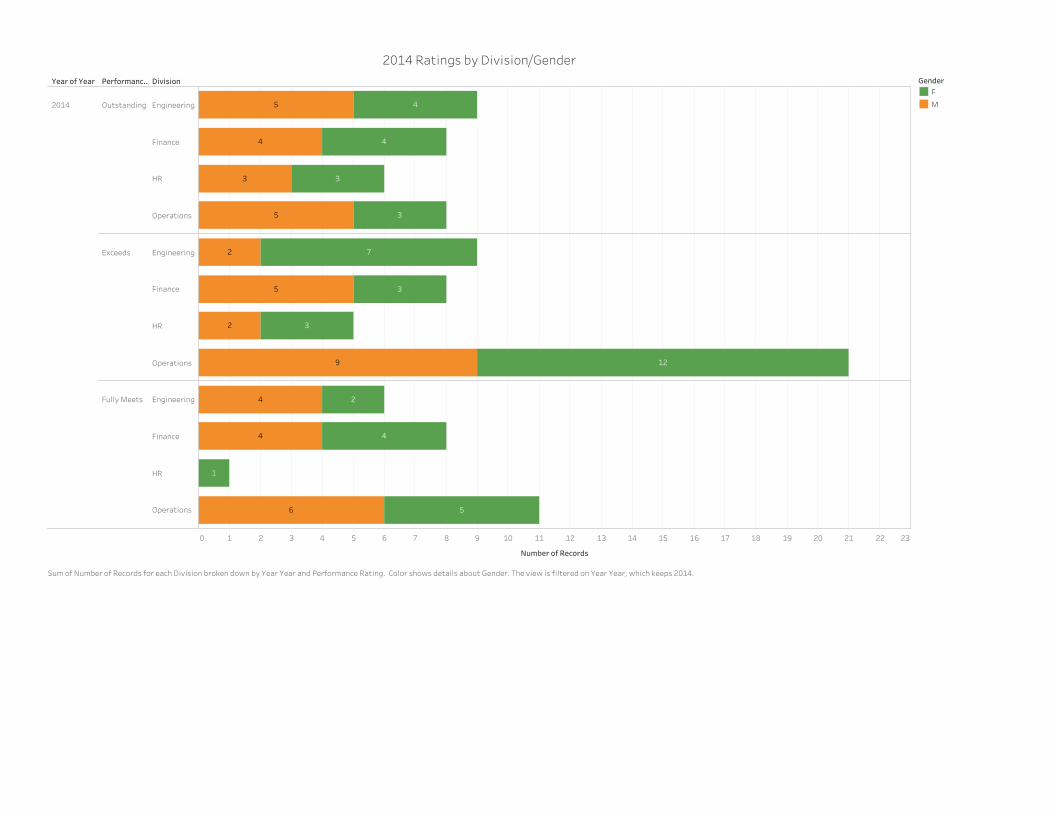
Year of Year Performanc..Division
0 1 2 3 4 5 6 7 8 9 10 11 12 13 14 15 16 17 18 19 20 21 22 23
Number of Records
2014 Outstanding Engineering
Finance
HR
Operations
Exceeds Engineering
Finance
HR
Operations
Fully Meets Engineering
Finance
HR
Operations
4
44
3
3
3
5
5
12
3
3
72
2
5
9
4
4
4
1
6
2
5
2014 Ratings by Division/GenderGenderF
M
Sum of Number of Records for each Division broken down by Year Year and Performance Rating. Color shows details about Gender. The view is filtered on Year Year, which keeps 2014.
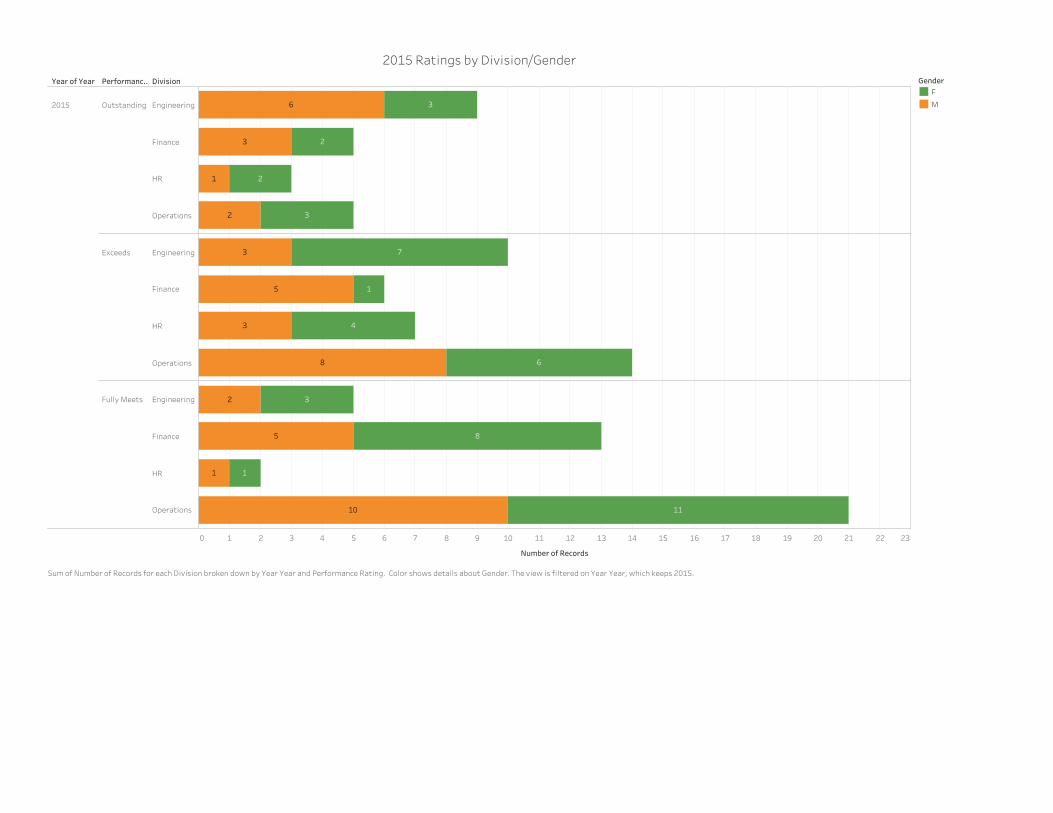
Year of Year Performanc..Division
0 1 2 3 4 5 6 7 8 9 10 11 12 13 14 15 16 17 18 19 20 21 22 23
Number of Records
2015 Outstanding Engineering
Finance
HR
Operations
Exceeds Engineering
Finance
HR
Operations
Fully Meets Engineering
Finance
HR
Operations
1
6 3
3
3 2
2
2
4
1
68
3
3
7
5
1110
11
8
32
5
2015 Ratings by Division/GenderGenderF
M
Sum of Number of Records for each Division broken down by Year Year and Performance Rating. Color shows details about Gender. The view is filtered on Year Year, which keeps 2015.
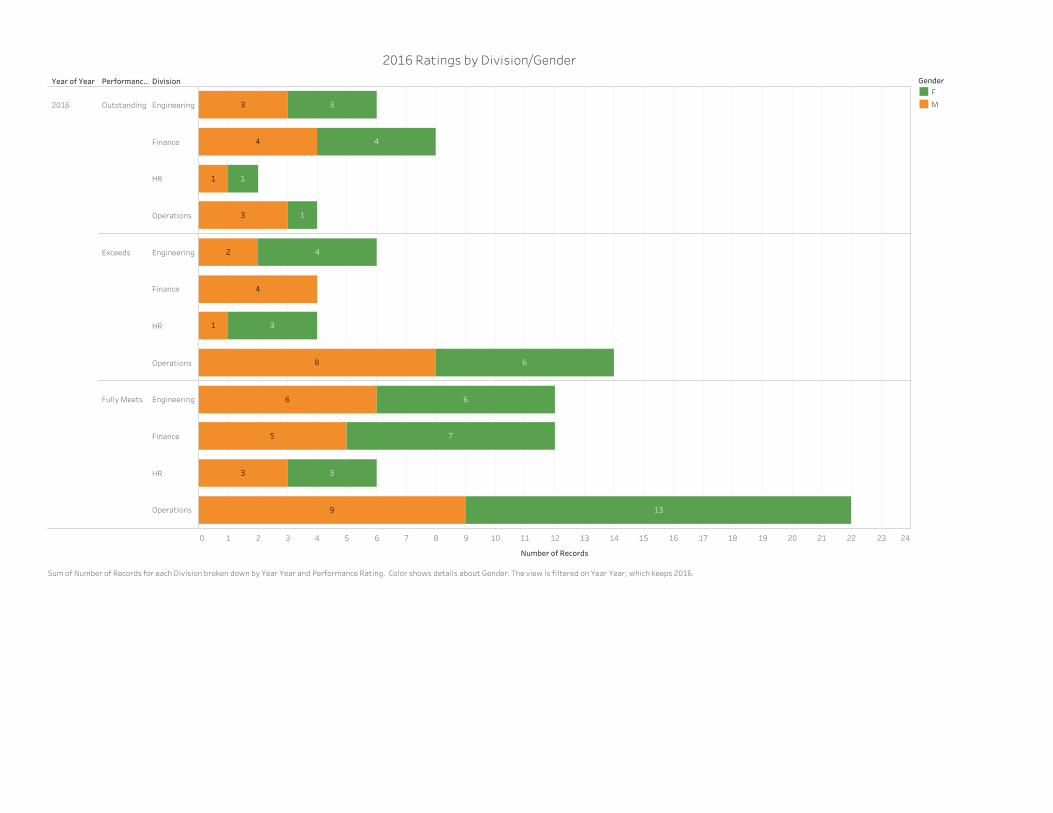
Year of Year Performanc..Division
0 1 2 3 4 5 6 7 8 9 10 11 12 13 14 15 16 17 18 19 20 21 22 23 24
Number of Records
2016 Outstanding Engineering
Finance
HR
Operations
Exceeds Engineering
Finance
HR
Operations
Fully Meets Engineering
Finance
HR
Operations
44
1
1
1
33
3
4
4
1
68
3
2
13
66
33
75
9
2016 Ratings by Division/GenderGenderF
M
Sum of Number of Records for each Division broken down by Year Year and Performance Rating. Color shows details about Gender. The view is filtered on Year Year, which keeps 2016.
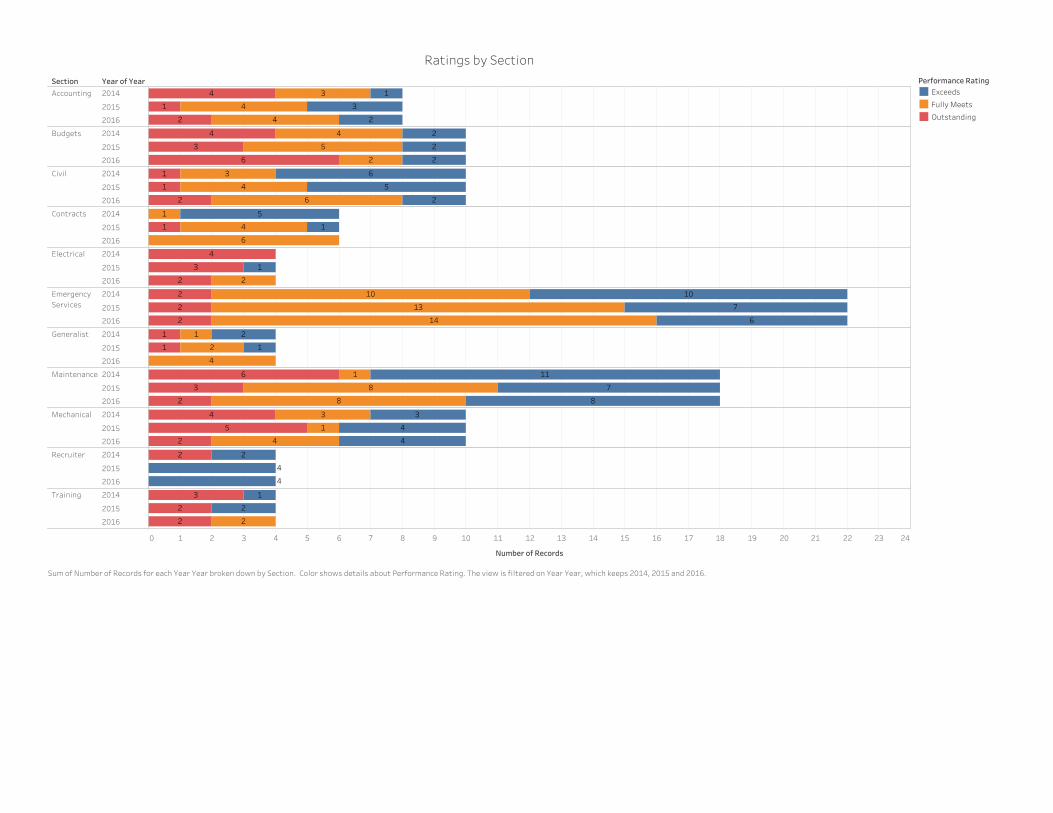
Section Year of Year
0 1 2 3 4 5 6 7 8 9 10 11 12 13 14 15 16 17 18 19 20 21 22 23 24
Number of Records
Accounting 2014
2015
2016
Budgets 2014
2015
2016
Civil 2014
2015
2016
Contracts 2014
2015
2016
Electrical 2014
2015
2016
EmergencyServices
2014
2015
2016
Generalist 2014
2015
2016
Maintenance2014
2015
2016
Mechanical 2014
2015
2016
Recruiter 2014
2015
2016
Training 2014
2015
2016
4
4
4 1
1 3
3
22
44
6
3
2
2
22
5
4
1
1
6
6
3
22
5
4 1
1
1
6
5
4
13
22
14
13
1010
6
7
2
2
2
4
1
11
1
2
2
1116
8
8
8
3 7
2
4
44
4
1
33
2
5
4
4
22
13
2
2
2
2
Ratings by SectionPerformance RatingExceeds
Fully Meets
Outstanding
Sum of Number of Records for each Year Year broken down by Section. Color shows details about Performance Rating. The view is filtered on Year Year, which keeps 2014, 2015 and 2016.