Storyboarding for Data Visualization Design
59
by Frederico Freitas, Spatial History Project What is Storyboarding? Storyboarding is an exercise that helps you organize a visual argument and define the important user interactions that will enhance the user experience and impact.
-
Upload
spatialhistory -
Category
Education
-
view
892 -
download
8
description
This is derived from a lecture given by Frederico Freitas at the Spatial History Project / Center for Spatial and Textual Analysis at Stanford University. It describes how the process of storyboarding helps clarify design intent and facilitates design decision-making.
Transcript of Storyboarding for Data Visualization Design

by Frederico Freitas, Spatial History Project What is Storyboarding?
Storyboarding is an exercise that helps you organize a visual argument and define the important user interactions that will enhance the user experience and impact.

Generally, a storyboard can be used to:
Set the parameters of the argument being made,

define the key visual and statistical dimensions, identify what user interactions are critical to the argument,

make a “to do” list for preparing the assets of the visualization,

and provide designers and developers with a clear sense of direction.

The Final product could look like this

Which is a storyboard done for this visualization:http://sanfrancisco.crimespotting.org/map/
Because most dynamic visualizations are not presented in a linear fashion, it is helpful to think of the final product as a combination
of functional or visual parts (e.g the layer panel, or the search function).
These parts may lead to sequences of interaction that can also be modeled using storyboards.

Combining these sequences into a coherent application involves careful consideration of user expectations and behavior while using your tool. The storyboard helps in this process.It may be useful to begin by asking some basic questions, and return to these again and again throughout the process.
Who needs to be involved?Who is the project’s lead researcher? Research assistants? Staff? Other collaborators?

When does the final visualization need to be completed?Is the deadline hard or soft?What is the desired follow up frequency?

What format will the visualization take?Dynamic or Static ?Final, published formats include: website, PowerPoint presentation, printed poster, online publication/paper, print publication (book or journal)

What data do you have to work with?Identify relevant file names, formats, sources, and locations.For GIS data, also include attribute informationWhat are the relevant attributes for this visualization?List names, data types, and descriptions.
If working with point data, what is the approximate maximum number of points you want to show? (< 25? 100+?)Which attributes are you planning to use for the visualization (include actual name and alias, if any)?

What story are you trying to tell?

Why create a visualization? What makes this story worth showing instead of just telling?

What insights would you like your user to take away from your visualization?

What is the utility of your visualization?

What are the key dimensions of your argument and how do those dimensions relate to user functionality?


On the Spatial History website, there are two options:Visualizations embedded in our online publications system: 650 by 650 pixels. Visualizations appearing in an expanded window (pop-up): 650 x 975 pixels.

Example embedded visualization

Example pop-up visualization

Why use a grid?Grids provide a well-balanced design, which leads to:Better user experienceBetter visual impression
Additionally, a grid facilitates the production of visualizationand makes it easy to update the layout.

How to use:First divide the canvas into regular columns and roles (3x3, 4x3, etc.).Group cells according to your needs; they don’t need to be symetrical.


Put your elements in your cells, and use the grid to align and scale things.
Define the visual elements that are part of the visualization, including the title.

Several design choices must be made for map elements:Location, Projection, Scale. Are you showing a metro area? Country? Region?Does there need to be an inset for context?
Types of Data Models: Point, Line, PolygonBase Map Elements: roads, bodies of water, terrain (is elevation important?), boundaries (parcel outlines, study boundaries, watersheds, etc.)

Labeling:What are important places to include labels for?Which labels are always visible?Are there labels that only appear when you rollover a point on the map?
Where does that label appear when you do rollover?Analysis/Cartographic SymbolizationLegendCategoriesQuantities: Graduated color, Graduated symbols, Proportional symbols

Chart elements: Pie, Bar/Column, StackedExample Chart Types: PieBar chart (horizontal or vertical? stacked?)

Chart types continued:LineAreaScatterplotHistogram

Diagram Types:FlowNetworkVenn

Diagram types continued:CycleTimeline

Does there need to be a title or explanation with the visualization?What should be included in the footer? Authors, sources, etc.Do you want blocks of text in your visualization?If so, how much text? 2-3 sentences or a paragraph?


Are there any photos you want in the visualization?Are they high resolution?What role do they play in the visualization?The focus (ex. Hart Photo Project)?Minor way of providing context?


Interactivity is tied to the desired functionality.Are your users actively or passively interacting?

Are your users creating or receiving content? What is the key benefit of including interactivity? (To allow users to explore, search, build scenarios, filter, compare, digest large datasets, see change over time, etc.?)

What choices should be left up to the user vs. decided by the author? How do these choices lead to possible new insights on the data you are presenting? What is the ideal sequence of functions that a user would explore?

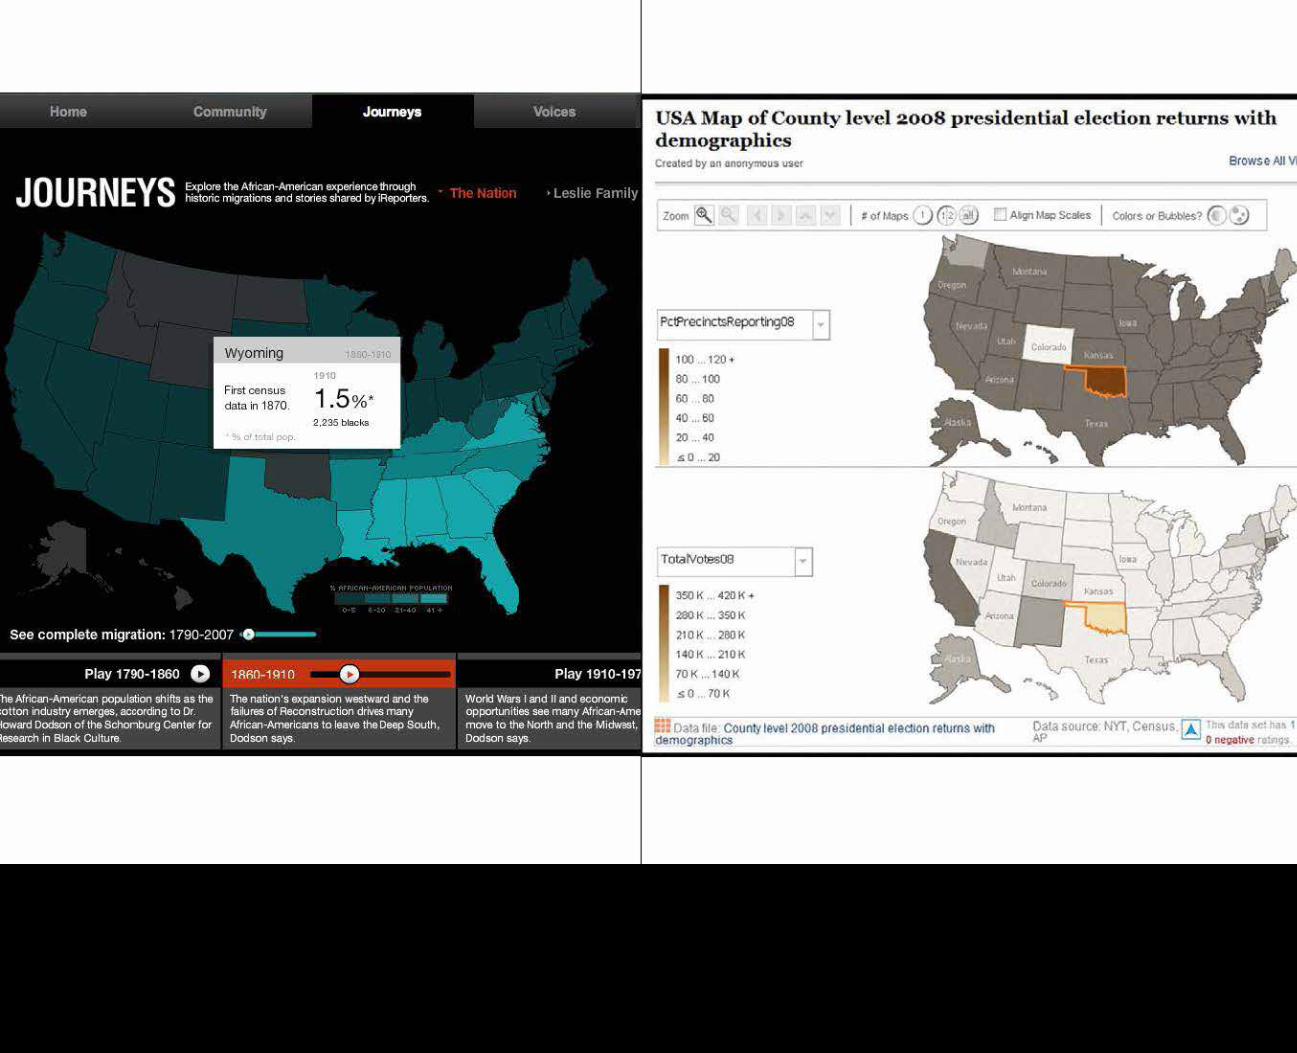
Low level over interactivity: http://www.povertyover.com/
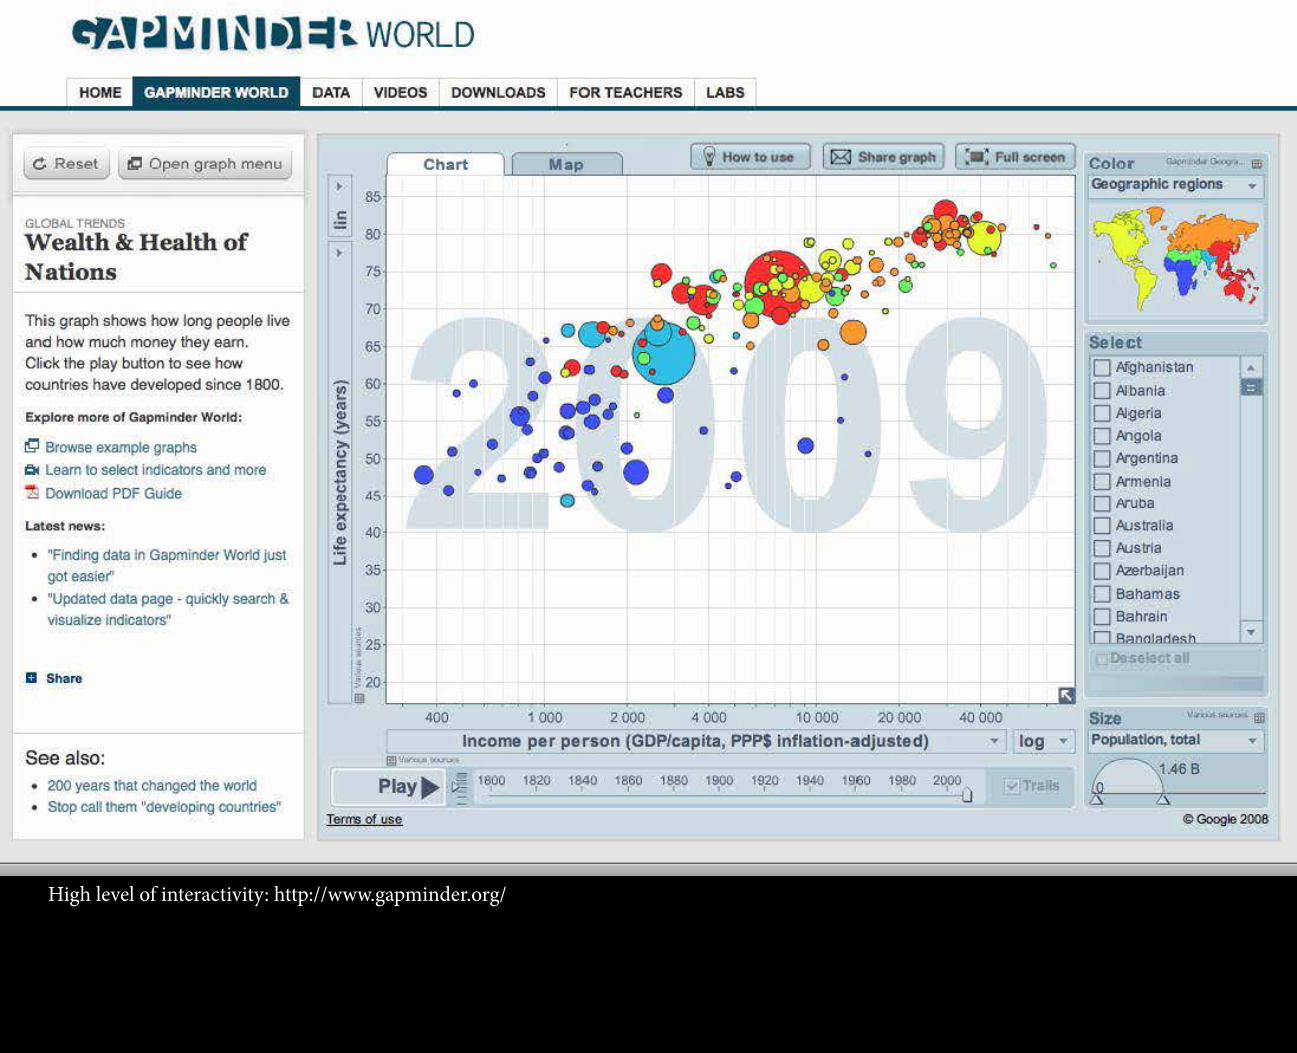
High level of interactivity: http://www.gapminder.org/

Sketching a layout:Use arrows or instructions to indicate movement.
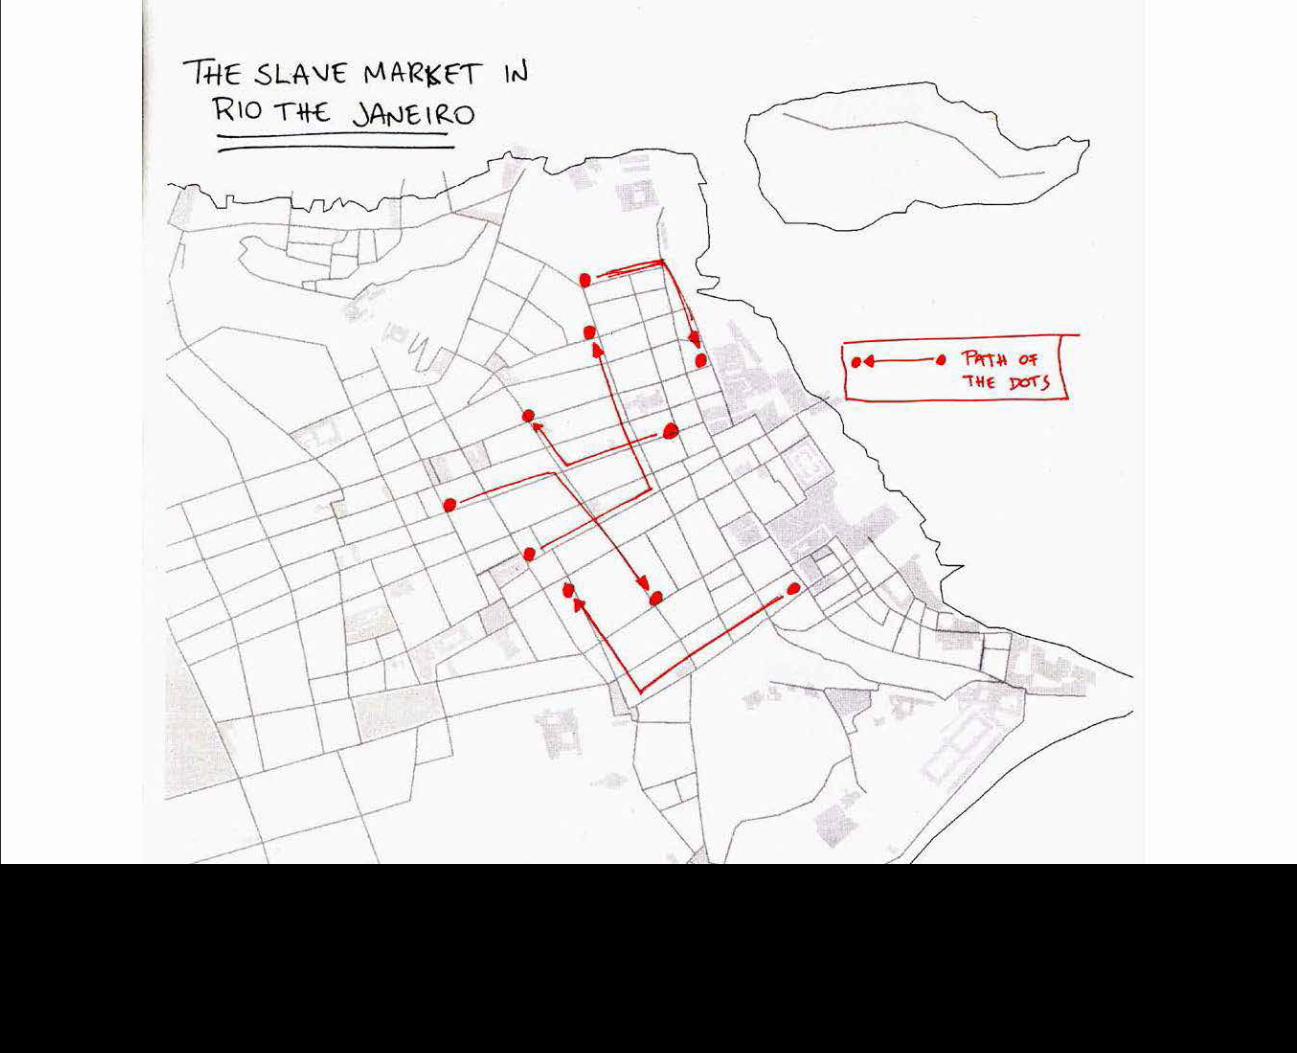

Show the sequence of what the user/viewer sees


Indicate where interactivity occurs and highlight buttons or other controls


Suggest connections between interactive elements by drawing arrows.


Use multiple colors to differentiate between notes (like comments, movement arrows, etc.) and actual elements of the visualization (like the map, the chart, the slider, the title, etc.)


Accompany the sketch with written explanation of how it is organized.


There are different tools that you can use for doing a storyboard; I am going to show you some of these tools.
This diagrams show different rhetorical arrangements that you can use to explain your approach.


Put yourself in the user’s shoes. Does everything works well? Is the visualization too complex? Does it have an intuitive operation? How does the ease of use of your visualization enhance or detract from
your argument? How can you maximize the effectiveness of your visualization with the limited amount of attention that you can draw from your user?

Reorder and Repeat steps until satisfied.

Begin working with Designer/Developer to implement the visualization.