Stormwater Quality Monitoring Report Permeable...
52
Stormwater Quality Monitoring Report Permeable Interlocking Concrete Pavement (PICP) at Denver Wastewater Management Building Denver, Colorado 2008-2010 October 2011 Prepared by Holly Piza, P.E., and Claire Eisel Urban Drainage and Flood Control District 2480 W 26 th Avenue, Suite 156-B Denver, Colorado 80211
Transcript of Stormwater Quality Monitoring Report Permeable...
Stormwater Quality Monitoring Report
Permeable Interlocking Concrete Pavement (PICP) at Denver Wastewater Management Building
Denver, Colorado 2008-2010
October 2011
Prepared by Holly Piza, P.E., and Claire Eisel
Urban Drainage and Flood Control District
2480 W 26th Avenue, Suite 156-B
Denver, Colorado 80211
Table of Contents
I. INTRODUCTION ........................................................................................................................ 1
UDFCD AND STORMWATER QUALITY ............................................................................ 1
PICP AT DENVER WASTEWATER ..................................................................................... 1
II. SITE DESCRIPTION................................................................................................................. 2
STUDY AREA ................................................................................................................... 2
WATERSHED .................................................................................................................... 4
III. METHODS AND MATERIALS ............................................................................................. 4
PICP COMPONENTS ......................................................................................................... 4
DATA COLLECTION .......................................................................................................... 7
PICP MONITORING AND SAMPLING ................................................................................. 7
REFERENCE SITE MONITORING AND SAMPLING ............................................................. 10
MAINTAINING INFILTRATION ......................................................................................... 11
IV. RESULTS AND DISCUSSION .............................................................................................. 12
OUTFLOW VOLUME REDUCTION .................................................................................... 12
IMPACT ON WATER QUALITY ......................................................................................... 15
V. CONCLUSION.......................................................................................................................... 47
VI. REFERENCES ........................................................................................................................ 50

1
I. Introduction
UDFCD and Stormwater Quality The Urban Drainage and Flood Control District (UDFCD) was established by the Colorado legislature in 1969 for the purpose of assisting local governments in the Denver metropolitan area with multi-jurisdictional drainage and flood control problems. UDFCD monitors a number of stormwater Best Management Practice (BMP) sites in the Denver metropolitan area and plays a large role in stormwater quality improvement by way of research and promulgation of criteria. UDFCD samples inflow and outflow and collects data on rainfall and runoff at several BMP sites. UCFCD’s primary objectives are to:
• Determine the Event Mean Concentration (EMC) of different constituents that affect stormwater runoff.
• Assess the longer term performance of each BMP with regard to stormwater quality and runoff volume reduction.
PICP at Denver Wastewater At the City and County Denver Wastewater Management Building, UDFCD is monitoring Permeable Interlocking Concrete Pavement (PICP). PICP is one of several different types of permeable pavement systems that are designed to infiltrate stormwater through the pavement surface. Permeable pavements are a common and important practice of Low Impact Development (LID). The PICP wearing course consists of concrete blocks that are spaced so that runoff can enter the pavement. The blocks contain ridges along the sides to create the spacing and ensure that the blocks are installed correctly. The UDFCD section, which contains a filter layer, is designed to improve water quality. A street view of the PICP at Denver Waste Water is shown in Photograph 1.
Photograph 1. PICP with sampler box and rain gauge shown in background.

2
II. Site Description
Photograph 2. Denver Public Works Building (Left of island: porous asphalt, right of island: PICP).
Study Area The PICP and a reference (control) site are located at the Denver Wastewater Management building at 2000 West 3rd Avenue in Denver. The PICP was placed in May 2008 by Rocky Mountain Hardscapes, and is located in the turn-around area of the main entrance on the south side of the island (see Photograph 2). The PICP is in the drive adjacent to a short-term parking area. The reference site is located in the employee parking area a few hundred feet northeast of the BMP. The reference site is used to compare water quality and flow of treated effluent to untreated, direct runoff. The general vicinity and location of the site are shown in Figures 1 and 2, respectively, with the PICP circled in red and the reference site indicted by a red arrow in Figure 2.

3
Figure 1. Vicinity Map
Figure 2. Location Map
N
Reference Site
BMP Site

4
Watershed Permeable pavement is an appropriate BMP for this watershed because the tributary area is impervious and stable. The watershed consists of pavement and concrete walkways. It is 5,300 square feet, of which 3,590 square feet is impervious tributary to the PICP. A plan view of the watershed for the PICP is shown in Figure 3. Because it is located in the turn-around in front of the building, the watershed receives heavy traffic during business hours. The run-on ratio of the tributary impervious area to the permeable pavement is 2.1:1 (3,590/1,710), which is in general conformance with the Urban Storm Drainage Criteria Manual (USDCM), Volume 3 criteria. The watershed for the reference site is 8,400 square feet. It is located in a portion of the employee lot. Traffic patterns in this area differ from those of the BMP site. Traffic counts are assumed to be much lower.
Figure 3. Plan View of the Area of the PICP Watershed
III. Methods and Materials
PICP Components The PICP section is shown in Figure 4. The primary components include the wearing course, a reservoir layer and a filter layer. The wearing course consists of 3 1/8-inch concrete pavers on an aggregate leveling course with small aggregate (less than ½-inch) placed between the pavers.

5
The reservoir layer consists of larger aggregate providing structural support as well as storage volume. The filter layer, not typically included in the sections provided by the manufacturer, consists of sand and provides improved water quality. Filtered stormwater is collected in the underdrain layer and conveyed to the catch basin for sample collection and flow measurement. An impermeable plastic liner separates the underdrain layer from the subgrade. This no-infiltration section is used to ensure that outflow samples can be collected and will not be lost through infiltration into the subgrade.
Photograph 3. Concrete block pavers prior to placement.

6
Figure 4. Cross Section of the PICP at the Monitoring Site The PICP at this site was installed based on previous criteria that were updated in 2010 in Volume 3 of the USDCM (see Figure 4). The newer criteria, shown in Figure 5, serves to simplify the section by making use of materials that are compatible with each other eliminating the need for separation fabric.
Figure 5. Current UDFCD Criteria for PICP Section

7
Data Collection All samples are tested for the following: Category Constituent Units Detection Limit Metal: Dissolved Calcium mg/L 1 Dissolved Iron mg/L 0.05 Dissolved Magnesium mg/L 0.1 Dissolved Sodium mg/L 1 Dissolved Chromium µg/L 1 Dissolved Manganese µg/L 1 Dissolved Nickel µg/L 1 Dissolved Copper µg/L 2 Dissolved Zinc µg/L 5 Dissolved Selenium µg/L 1 Dissolved Silver µg/L 0.2 Dissolved Cadmium µg/L 0.1 Dissolved Lead µg/L 1 Total Beryllium µg/L 1 Total Chromium µg/L 5 Total Manganese µg/L 1 Total Nickel µg/L 1 Total Copper µg/L 2 Total Zinc µg/L 20 Total Arsenic µg/L 5 Total Selenium µg/L 1 Total Molybdenum µg/L 5 Total Silver µg/L 0.2 Total Cadmium µg/L 0.5 Total Antimony µg/L 5 Total Lead µg/L 5 Chemical: Chloride mg/L 5 Chemical Oxygen Demand mg/L 20 Nutrients: Nitrite+Nitrate mg/L 0.02 Dissolved Phosphorus mg/L 0.01 Dissolved Potassium mg/L 1 Total Phosphorus mg/L 0.01 Total Kjeldahl Nitrogen mg/L 0.3 Physical: Total Suspended Solids mg/L 1 UDFCD has been collecting water quality and flow data from this site since 2008. Automatic samplers (ISCO Model 6712) are used to collect flow data from the PICP and the reference site throughout the runoff event. The sampling equipment is stored in a metal job box located in the landscaped island of the turn-around. Rainfall is measured to 0.01 inches by an ISCO 674 tipping bucket rain gauge (see Photograph 4) on a post near the storage box. When the rain

8
gauge detects over 0.08 inches in two hours and the pressure transducer measures a difference in head, the ISCO sampler begins to take samples. As of the 2011 sampling season, the sampler draws a sample (500 mL) after a designated volume of five cubic feet has passed, and continues to draw samples at intervals of five cubic feet thereafter. For the time period of the data provided in this report, the rain gauge took samples after 0.01 inches of rain had fallen in 6 hours. It was modified in 2011 to avoid sampling runoff from very small events.
Photograph 4. The tipping bucket of the rain gauge assembly (cover and funnel assembly removed)
PICP Monitoring and Sampling The monitoring station at the PICP consists of an ISCO 6712 sampler which is connected to a rain gauge and a bubbler module. The bubbler module is connected to the end of the underdrain through ¼-inch tubing, and measures flow entering the catch basin through a ¾-inch orifice. The orifice at the reference site is also ¾ inches. The tubing is attached to the sampler and passes through a conduit into the catch basin, where it is connected to a copper pipe that goes into the underdrain. The difference in head across the orifice is used to calculate flow. Water quality samples of 500 mL are collected into a single 10 L bottle from an aluminum box in the catch basin. An orifice in the bottom of the box serves to drain any residual stormwater. A plan of the site with sampling equipment and inlets is provided below in Figure 7.
9
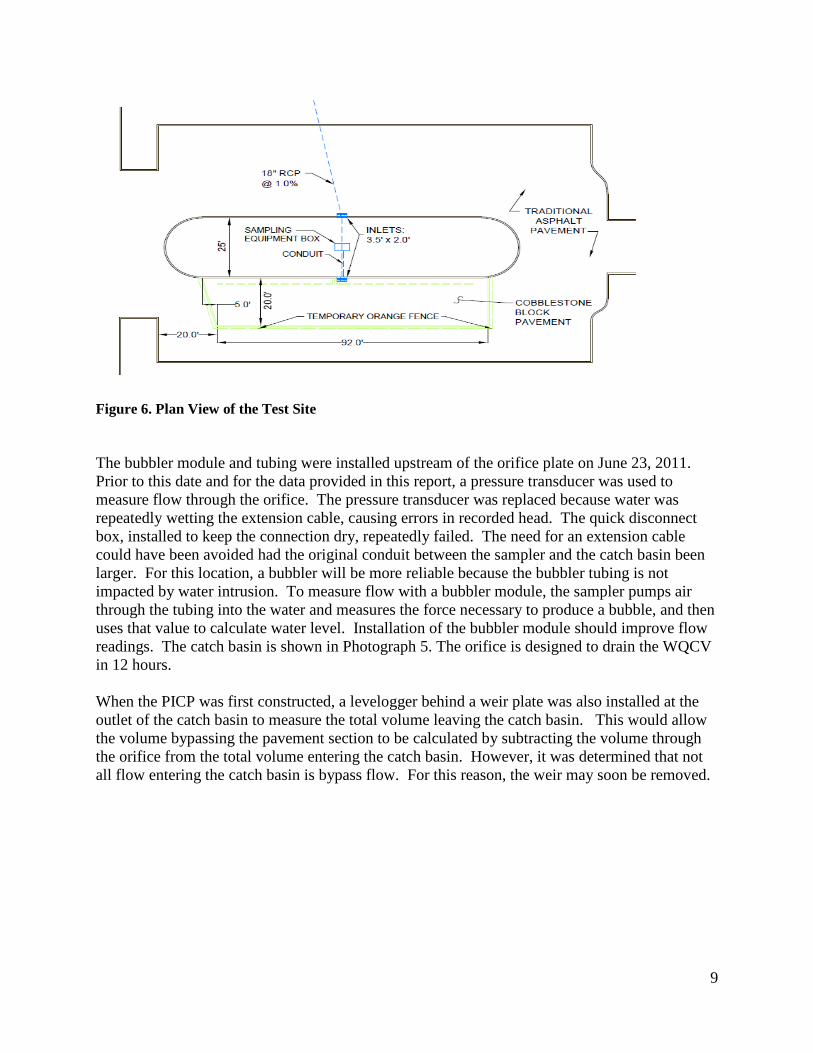
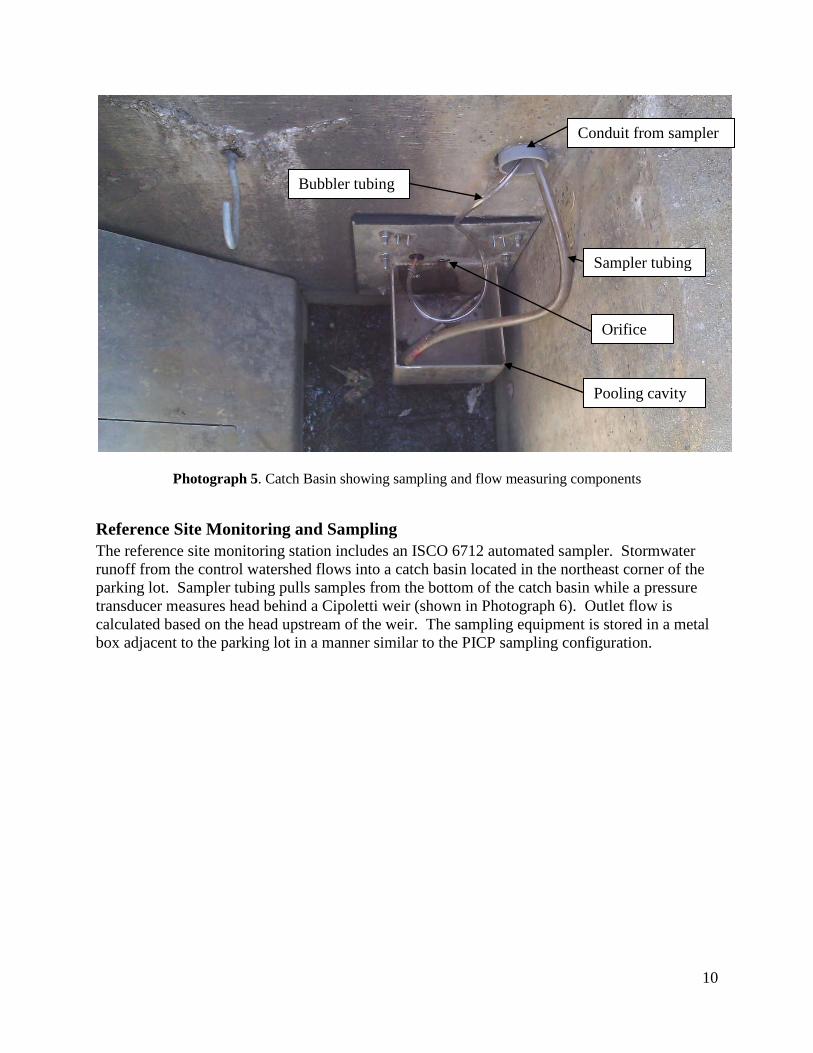
Figure 6. Plan View of the Test Site The bubbler module and tubing were installed upstream of the orifice plate on June 23, 2011. Prior to this date and for the data provided in this report, a pressure transducer was used to measure flow through the orifice. The pressure transducer was replaced because water was repeatedly wetting the extension cable, causing errors in recorded head. The quick disconnect box, installed to keep the connection dry, repeatedly failed. The need for an extension cable could have been avoided had the original conduit between the sampler and the catch basin been larger. For this location, a bubbler will be more reliable because the bubbler tubing is not impacted by water intrusion. To measure flow with a bubbler module, the sampler pumps air through the tubing into the water and measures the force necessary to produce a bubble, and then uses that value to calculate water level. Installation of the bubbler module should improve flow readings. The catch basin is shown in Photograph 5. The orifice is designed to drain the WQCV in 12 hours. When the PICP was first constructed, a levelogger behind a weir plate was also installed at the outlet of the catch basin to measure the total volume leaving the catch basin. This would allow the volume bypassing the pavement section to be calculated by subtracting the volume through the orifice from the total volume entering the catch basin. However, it was determined that not all flow entering the catch basin is bypass flow. For this reason, the weir may soon be removed.
10
Photograph 5. Catch Basin showing sampling and flow measuring components
Reference Site Monitoring and Sampling The reference site monitoring station includes an ISCO 6712 automated sampler. Stormwater runoff from the control watershed flows into a catch basin located in the northeast corner of the parking lot. Sampler tubing pulls samples from the bottom of the catch basin while a pressure transducer measures head behind a Cipoletti weir (shown in Photograph 6). Outlet flow is calculated based on the head upstream of the weir. The sampling equipment is stored in a metal box adjacent to the parking lot in a manner similar to the PICP sampling configuration.
Conduit from sampler
Sampler tubing
Bubbler tubing
Orifice
Pooling cavity

11
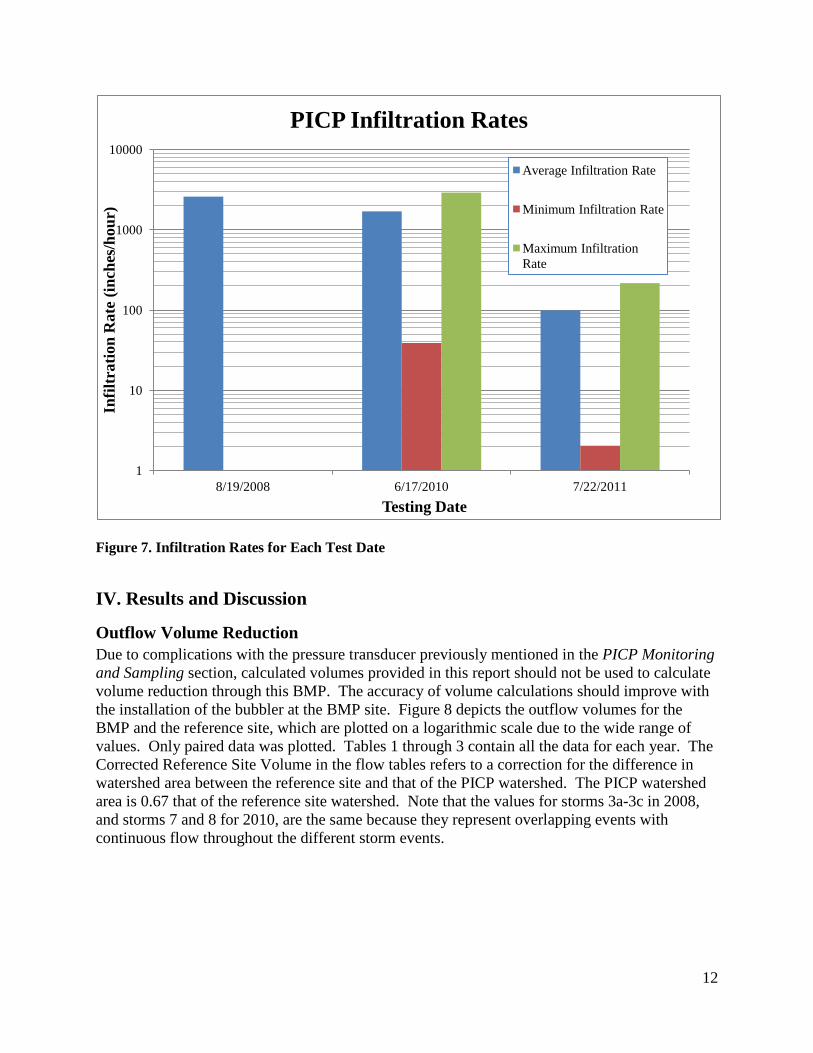
Photograph 6. The inlet of the reference site, shown with Cipoletti weir Maintaining Infiltration This pavement has been allowed to partially clog over the course of three years. Tests show good results in 2008 and 2010. In May of 2011, based on visual observation, the pavement appeared to be somewhat clogged particularly at locations where runoff from the impervious areas first enters the PICP. Early in the 2011 sampling season the PICP was swept with a vacuum sweeper. Conditions during sweeping were wet and therefore not ideal. The sweeper removed much of the small aggregate between pavers but failed to do so in areas where the PICP appeared to be especially clogged. Aggregate was added where needed early the following morning. Subsequent infiltration tests were conducted on July 22, 2011 and are provided in Figure 7. Beginning in 2010, UDFCD started using a modified version of ASTM method C 1701 for determining the infiltration rate (see photo 7). For each test, water is poured into a 12-inch PVC pipe section held firm to the pavement by the weight of 4 buckets of concrete placed on the framework shown in the photo. A ½-inch neoprene gasket is between the pipe section and the pavement. This weight compresses the neoprene gasket to form a tight seal so that water is not lost at the surface. This is a constant head test. A finite volume of water (3600 mL) is poured into the pipe at a rate to maintain a level of 10-15mm over the area of the pipe. Figure 7 shows rates of filtration in inches per hour for each testing date, plotted on a logarithmic scale. Note that for the first test, only one section of pavement was tested, therefore there are no minimum or maximum values.
12
Figure 7. Infiltration Rates for Each Test Date
IV. Results and Discussion
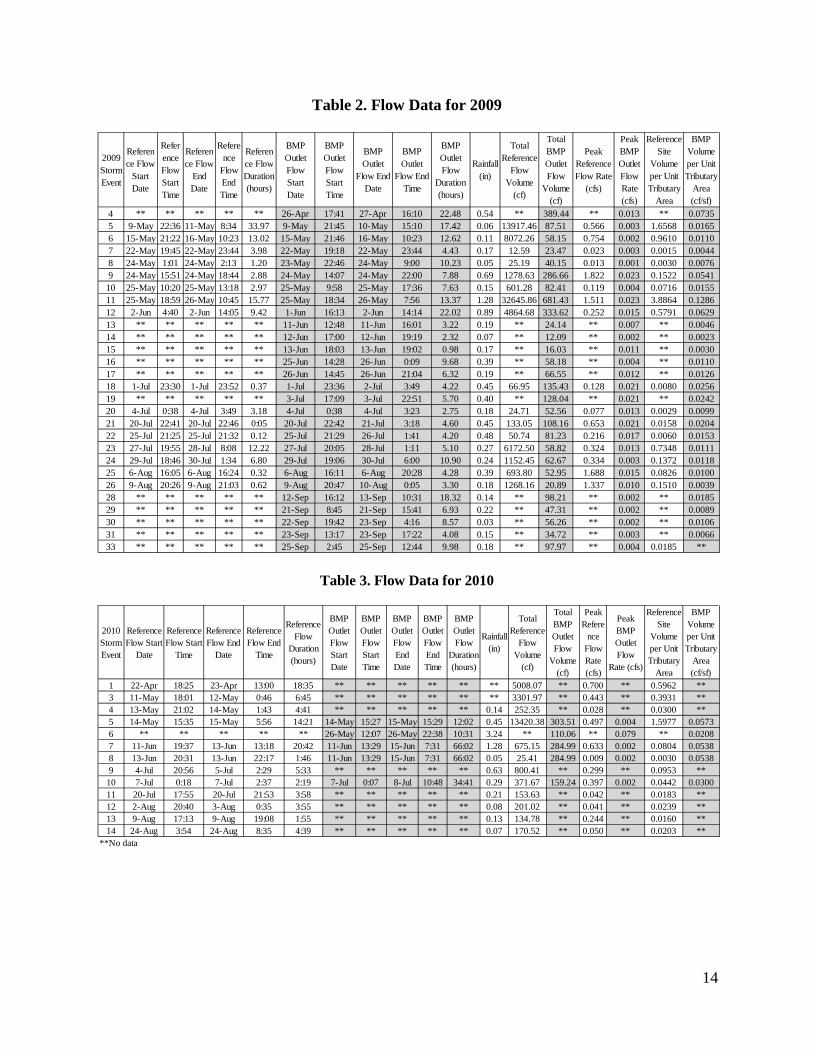
Outflow Volume Reduction Due to complications with the pressure transducer previously mentioned in the PICP Monitoring and Sampling section, calculated volumes provided in this report should not be used to calculate volume reduction through this BMP. The accuracy of volume calculations should improve with the installation of the bubbler at the BMP site. Figure 8 depicts the outflow volumes for the BMP and the reference site, which are plotted on a logarithmic scale due to the wide range of values. Only paired data was plotted. Tables 1 through 3 contain all the data for each year. The Corrected Reference Site Volume in the flow tables refers to a correction for the difference in watershed area between the reference site and that of the PICP watershed. The PICP watershed area is 0.67 that of the reference site watershed. Note that the values for storms 3a-3c in 2008, and storms 7 and 8 for 2010, are the same because they represent overlapping events with continuous flow throughout the different storm events.
1
10
100
1000
10000
8/19/2008 6/17/2010 7/22/2011
Infil
trat
ion
Rat
e (in
ches
/hou
r)
Testing Date
PICP Infiltration Rates
Average Infiltration Rate
Minimum Infiltration Rate
Maximum Infiltration Rate

13
Figure 8. Comparison of Reference and PICP Flow Volumes
Table 1. Flow Data for 2008
2008 Storm Event
Reference Flow Start Date
Reference Flow Start Time
Reference Flow End
Date
Reference Flow End
Time
Reference Flow
Duration (hours)
BMP Outlet Flow Start Date
BMP Outlet Flow Start Time
BMP Outlet Flow End Date
BMP Outlet Flow End Time
BMP Outlet Flow
Duration (hours)
Rainfall (in)
Total Reference
Flow Volume
(cf)
Total BMP Outlet Flow
Volume (cf)
Peak Reference
Flow Rate (cfs)
Peak BMP Outlet Flow Rate (cfs)
Reference Site
Volume per Unit Tributary
Area (cf/sf)
BMP Volume per Unit Tributary
Area (cf/sf)
2 8-Aug 19:37 8-Aug 19:51 0:14 8-Aug 19:36 9-Aug 5:37 10:01 1.15 5.88 11.44 0.747 0.030 0.0007 0.00223a 15-Aug 3:17 16-Aug 21:34 42:17 15-Aug 2:59 17-Aug 12:00 9:01 0.69 1109.39 16.98 1.533 0.020 0.1321 0.00323b 15-Aug 3:17 16-Aug 21:34 42:17 15-Aug 2:59 17-Aug 12:00 9:01 1.37 1109.39 16.98 1.533 0.020 0.1321 0.00323c 17-Aug 1:33 17-Aug 8:40 7:07 15-Aug 2:59 17-Aug 12:00 9:01 0.10 122.03 16.98 0.725 0.020 0.0145 0.00324 11-Sep 19:44 12-Sep 12:34 16:50 11-Sep 19:47 12-Sep 18:44 22:57 1.19 109.14 7.466 0.380 0.015 0.0130 0.0014
14
Table 2. Flow Data for 2009
Table 3. Flow Data for 2010
2009 Storm Event
Reference Flow
Start Date
Reference Flow Start Time
Reference Flow
End Date
Reference
Flow End Time
Reference Flow Duration (hours)
BMP Outlet Flow Start Date
BMP Outlet Flow Start Time
BMP Outlet
Flow End Date
BMP Outlet
Flow End Time
BMP Outlet Flow
Duration (hours)
Rainfall (in)
Total Reference
Flow Volume
(cf)
Total BMP Outlet Flow
Volume (cf)
Peak Reference Flow Rate
(cfs)
Peak BMP Outlet Flow Rate (cfs)
Reference Site
Volume per Unit Tributary
Area
BMP Volume per Unit Tributary
Area (cf/sf)
4 ** ** ** ** ** 26-Apr 17:41 27-Apr 16:10 22.48 0.54 ** 389.44 ** 0.013 ** 0.07355 9-May 22:36 11-May 8:34 33.97 9-May 21:45 10-May 15:10 17.42 0.06 13917.46 87.51 0.566 0.003 1.6568 0.01656 15-May 21:22 16-May 10:23 13.02 15-May 21:46 16-May 10:23 12.62 0.11 8072.26 58.15 0.754 0.002 0.9610 0.01107 22-May 19:45 22-May 23:44 3.98 22-May 19:18 22-May 23:44 4.43 0.17 12.59 23.47 0.023 0.003 0.0015 0.00448 24-May 1:01 24-May 2:13 1.20 23-May 22:46 24-May 9:00 10.23 0.05 25.19 40.15 0.013 0.001 0.0030 0.00769 24-May 15:51 24-May 18:44 2.88 24-May 14:07 24-May 22:00 7.88 0.69 1278.63 286.66 1.822 0.023 0.1522 0.0541
10 25-May 10:20 25-May 13:18 2.97 25-May 9:58 25-May 17:36 7.63 0.15 601.28 82.41 0.119 0.004 0.0716 0.015511 25-May 18:59 26-May 10:45 15.77 25-May 18:34 26-May 7:56 13.37 1.28 32645.86 681.43 1.511 0.023 3.8864 0.128612 2-Jun 4:40 2-Jun 14:05 9.42 1-Jun 16:13 2-Jun 14:14 22.02 0.89 4864.68 333.62 0.252 0.015 0.5791 0.062913 ** ** ** ** ** 11-Jun 12:48 11-Jun 16:01 3.22 0.19 ** 24.14 ** 0.007 ** 0.004614 ** ** ** ** ** 12-Jun 17:00 12-Jun 19:19 2.32 0.07 ** 12.09 ** 0.002 ** 0.002315 ** ** ** ** ** 13-Jun 18:03 13-Jun 19:02 0.98 0.17 ** 16.03 ** 0.011 ** 0.003016 ** ** ** ** ** 25-Jun 14:28 26-Jun 0:09 9.68 0.39 ** 58.18 ** 0.004 ** 0.011017 ** ** ** ** ** 26-Jun 14:45 26-Jun 21:04 6.32 0.19 ** 66.55 ** 0.012 ** 0.012618 1-Jul 23:30 1-Jul 23:52 0.37 1-Jul 23:36 2-Jul 3:49 4.22 0.45 66.95 135.43 0.128 0.021 0.0080 0.025619 ** ** ** ** ** 3-Jul 17:09 3-Jul 22:51 5.70 0.40 ** 128.04 ** 0.021 ** 0.024220 4-Jul 0:38 4-Jul 3:49 3.18 4-Jul 0:38 4-Jul 3:23 2.75 0.18 24.71 52.56 0.077 0.013 0.0029 0.009921 20-Jul 22:41 20-Jul 22:46 0:05 20-Jul 22:42 21-Jul 3:18 4.60 0.45 133.05 108.16 0.653 0.021 0.0158 0.020422 25-Jul 21:25 25-Jul 21:32 0.12 25-Jul 21:29 26-Jul 1:41 4.20 0.48 50.74 81.23 0.216 0.017 0.0060 0.015323 27-Jul 19:55 28-Jul 8:08 12.22 27-Jul 20:05 28-Jul 1:11 5.10 0.27 6172.50 58.82 0.324 0.013 0.7348 0.011124 29-Jul 18:46 30-Jul 1:34 6.80 29-Jul 19:06 30-Jul 6:00 10.90 0.24 1152.45 62.67 0.334 0.003 0.1372 0.011825 6-Aug 16:05 6-Aug 16:24 0.32 6-Aug 16:11 6-Aug 20:28 4.28 0.39 693.80 52.95 1.688 0.015 0.0826 0.010026 9-Aug 20:26 9-Aug 21:03 0.62 9-Aug 20:47 10-Aug 0:05 3.30 0.18 1268.16 20.89 1.337 0.010 0.1510 0.003928 ** ** ** ** ** 12-Sep 16:12 13-Sep 10:31 18.32 0.14 ** 98.21 ** 0.002 ** 0.018529 ** ** ** ** ** 21-Sep 8:45 21-Sep 15:41 6.93 0.22 ** 47.31 ** 0.002 ** 0.008930 ** ** ** ** ** 22-Sep 19:42 23-Sep 4:16 8.57 0.03 ** 56.26 ** 0.002 ** 0.010631 ** ** ** ** ** 23-Sep 13:17 23-Sep 17:22 4.08 0.15 ** 34.72 ** 0.003 ** 0.006633 ** ** ** ** ** 25-Sep 2:45 25-Sep 12:44 9.98 0.18 ** 97.97 ** 0.004 0.0185 **
2010 Storm Event
Reference Flow Start
Date
Reference Flow Start
Time
Reference Flow End
Date
Reference Flow End
Time
Reference Flow
Duration (hours)
BMP Outlet Flow Start Date
BMP Outlet Flow Start Time
BMP Outlet Flow End Date
BMP Outlet Flow End Time
BMP Outlet Flow
Duration (hours)
Rainfall (in)
Total Reference
Flow Volume
(cf)
Total BMP Outlet Flow
Volume (cf)
Peak Refere
nce Flow Rate (cfs)
Peak BMP Outlet Flow
Rate (cfs)
Reference Site
Volume per Unit Tributary
Area
BMP Volume per Unit Tributary
Area (cf/sf)
1 22-Apr 18:25 23-Apr 13:00 18:35 ** ** ** ** ** ** 5008.07 ** 0.700 ** 0.5962 **3 11-May 18:01 12-May 0:46 6:45 ** ** ** ** ** ** 3301.97 ** 0.443 ** 0.3931 **4 13-May 21:02 14-May 1:43 4:41 ** ** ** ** ** 0.14 252.35 ** 0.028 ** 0.0300 **5 14-May 15:35 15-May 5:56 14:21 14-May 15:27 15-May 15:29 12:02 0.45 13420.38 303.51 0.497 0.004 1.5977 0.05736 ** ** ** ** ** 26-May 12:07 26-May 22:38 10:31 3.24 ** 110.06 ** 0.079 ** 0.02087 11-Jun 19:37 13-Jun 13:18 20:42 11-Jun 13:29 15-Jun 7:31 66:02 1.28 675.15 284.99 0.633 0.002 0.0804 0.05388 13-Jun 20:31 13-Jun 22:17 1:46 11-Jun 13:29 15-Jun 7:31 66:02 0.05 25.41 284.99 0.009 0.002 0.0030 0.05389 4-Jul 20:56 5-Jul 2:29 5:33 ** ** ** ** ** 0.63 800.41 ** 0.299 ** 0.0953 **10 7-Jul 0:18 7-Jul 2:37 2:19 7-Jul 0:07 8-Jul 10:48 34:41 0.29 371.67 159.24 0.397 0.002 0.0442 0.030011 20-Jul 17:55 20-Jul 21:53 3:58 ** ** ** ** ** 0.21 153.63 ** 0.042 ** 0.0183 **12 2-Aug 20:40 3-Aug 0:35 3:55 ** ** ** ** ** 0.08 201.02 ** 0.041 ** 0.0239 **13 9-Aug 17:13 9-Aug 19:08 1:55 ** ** ** ** ** 0.13 134.78 ** 0.244 ** 0.0160 **14 24-Aug 3:54 24-Aug 8:35 4:39 ** ** ** ** ** 0.07 170.52 ** 0.050 ** 0.0203 **
**No data

15
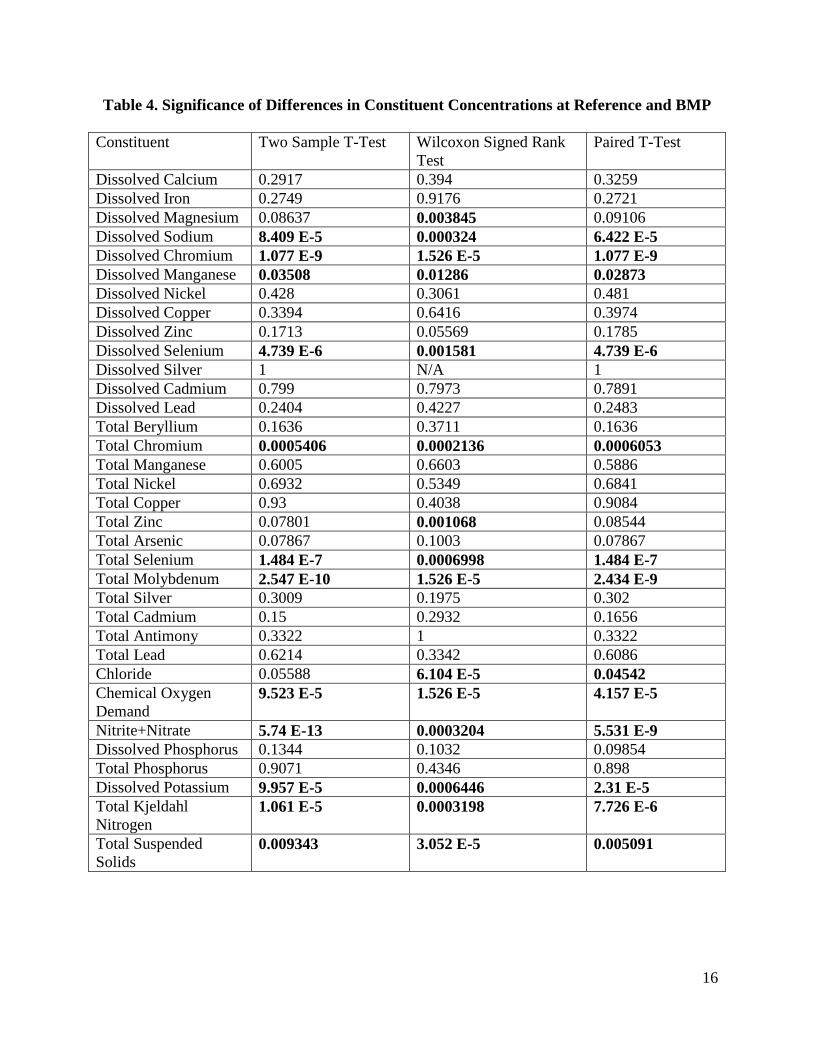
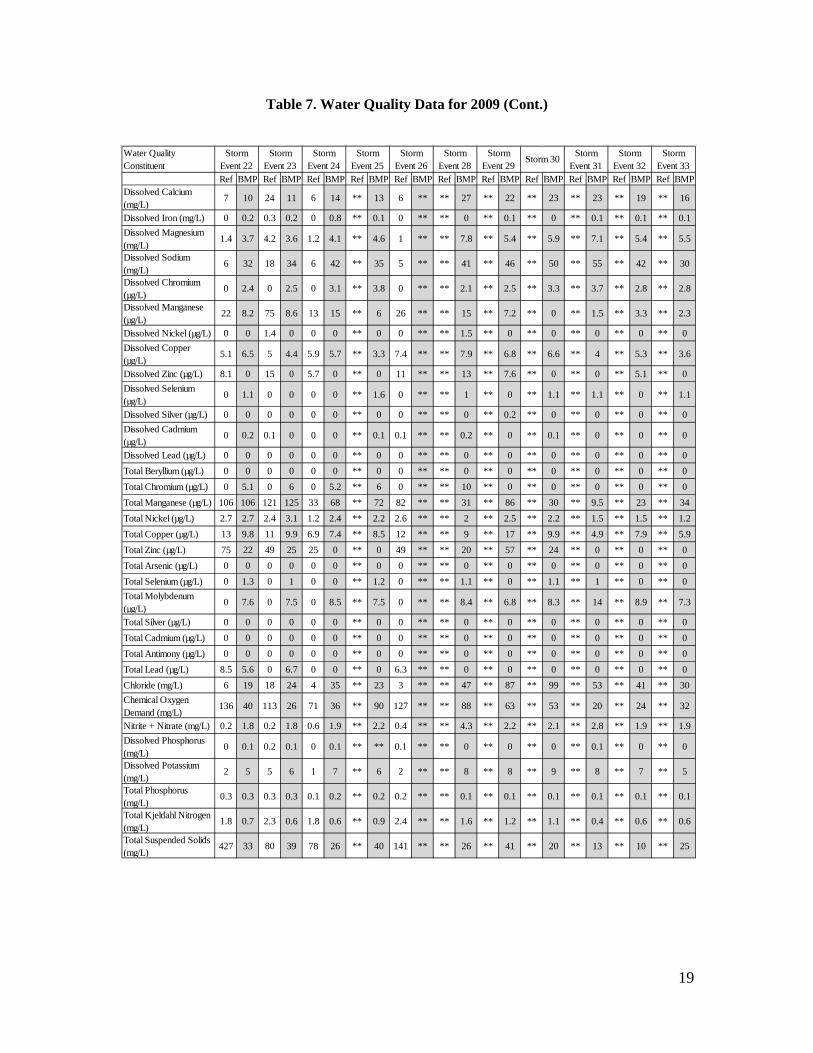
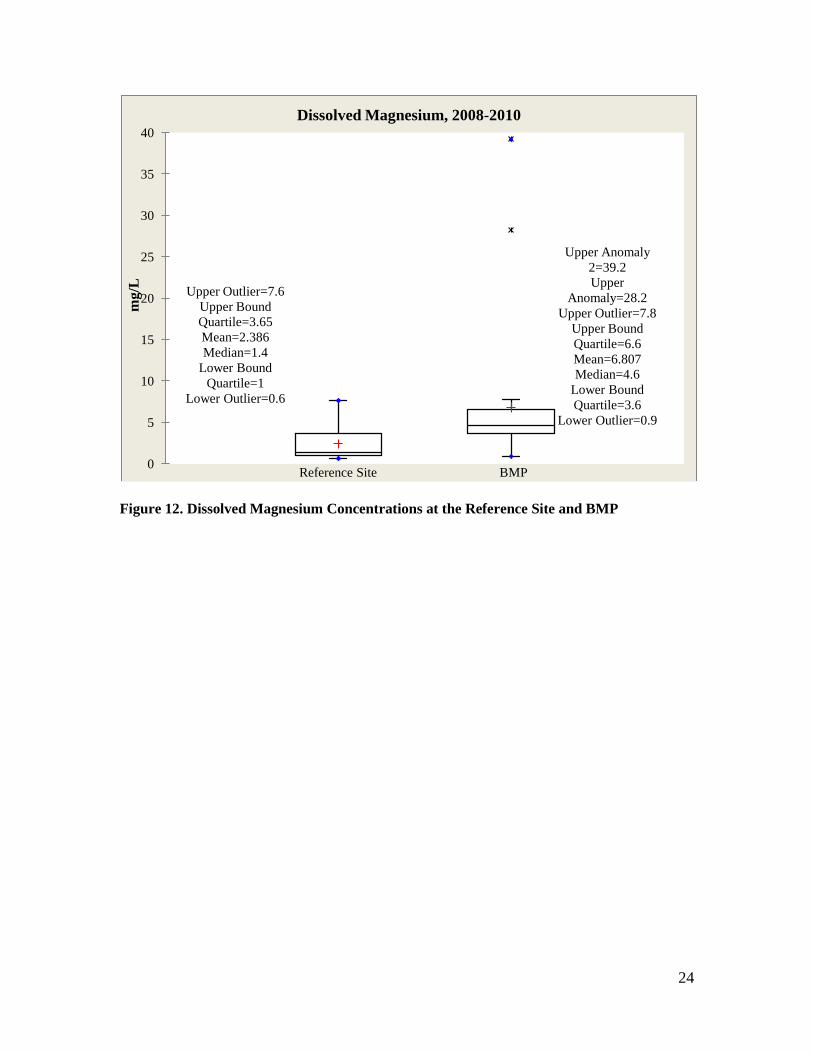
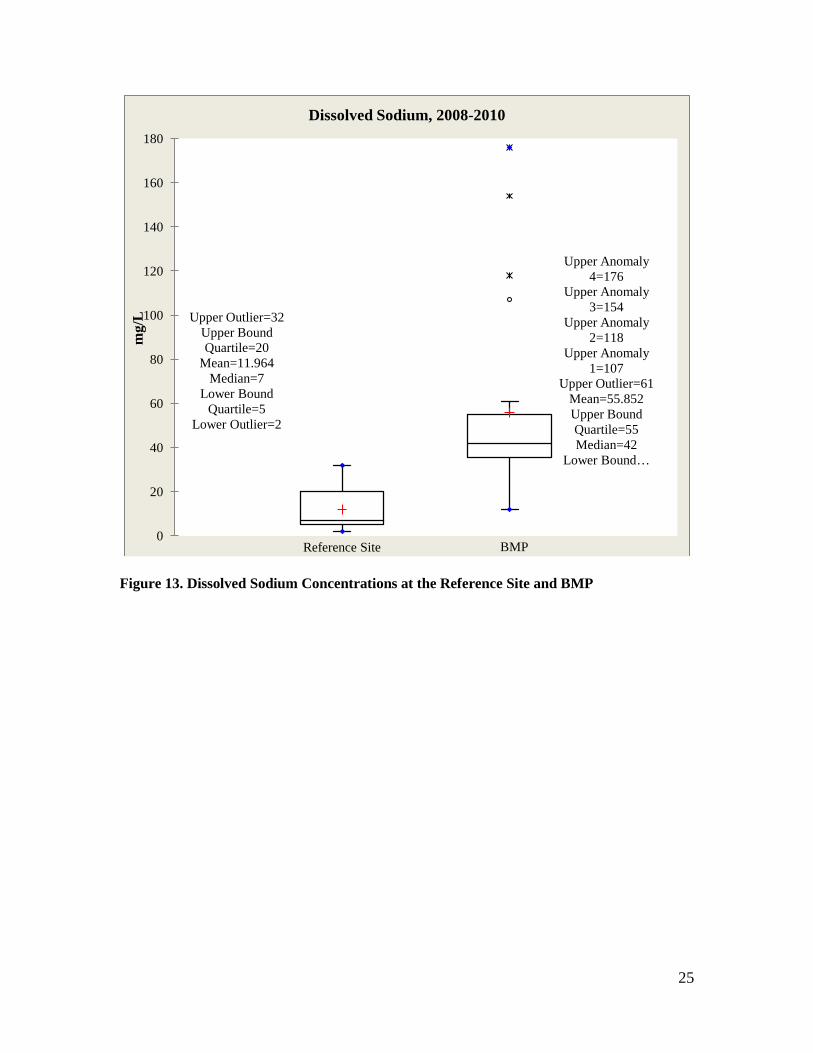
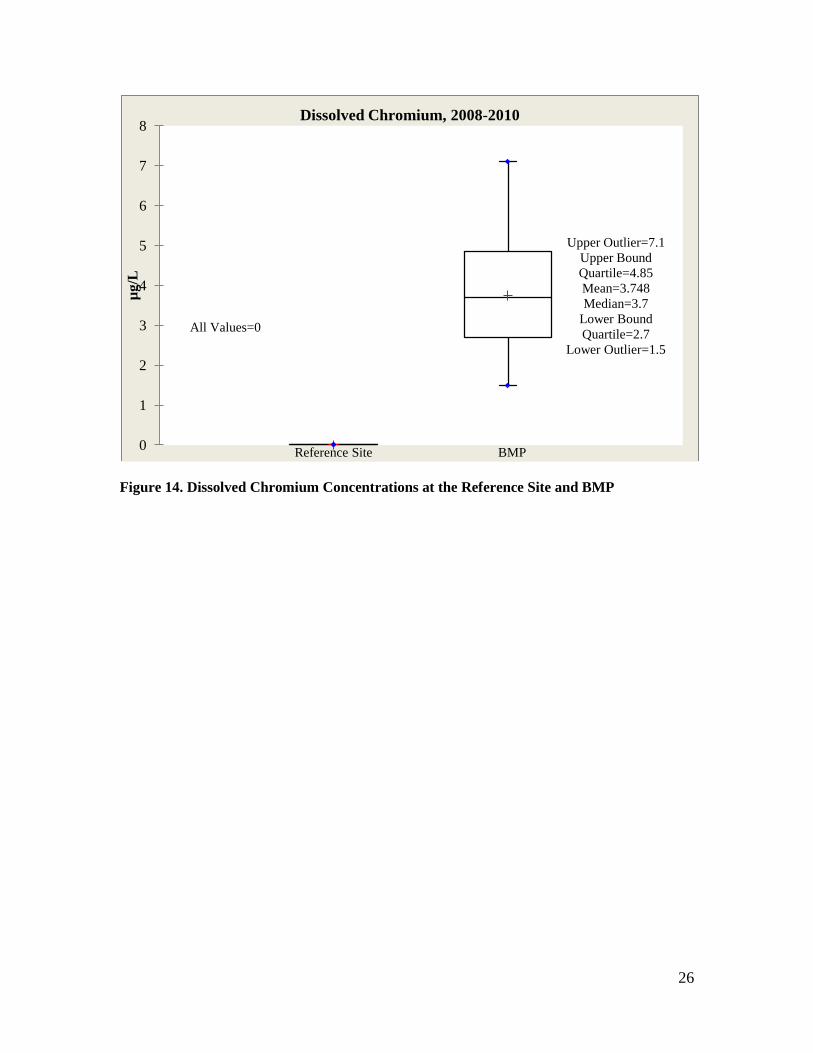
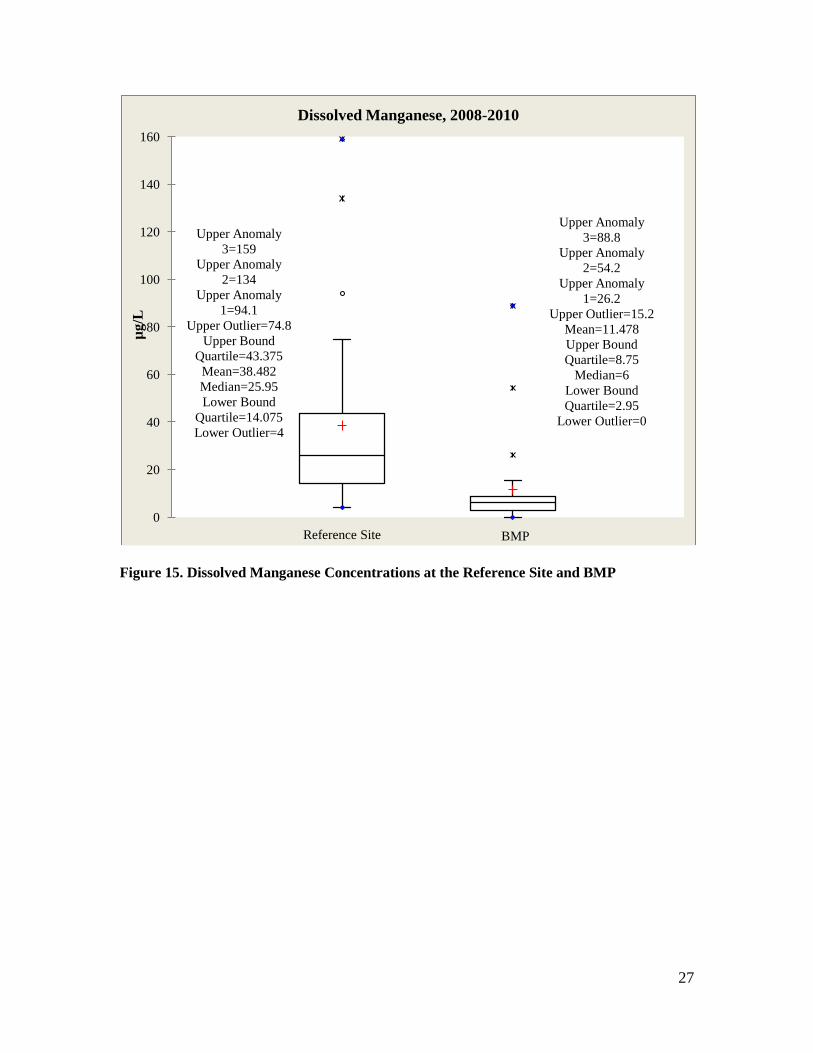
Impact on Water Quality To conduct the water quality analysis, t-tests were performed to compare the arithmetic means for the reference site and the BMP for each constituent. Since the sample sizes for 2008 and 2010 were too small to analyze the data by year, the reference site and PICP data for all years was combined and then analyzed. In some cases, the data did not seem to fit a normal distribution, which is not unusual for a sample size under 30, so a non-parametric Wilcoxon signed-rank test was performed in addition to parametric paired t-tests and two sample t-tests. The p-values generated for each of the constituents (alpha=0.05) is shown in Table 4. The values that were significant, below the alpha level of 0.05, are highlighted in bold. It is also important to note that in cases where certain constituents were not detected in a sample, we used 0 as a number for our analysis. Unexpectedly, some of the constituents at the BMP were in significantly higher concentrations than at the reference site. One possible explanation for some of the higher constituent concentrations at the BMP may be the differences in traffic load between the BMP and the reference site. While the current reference site is as close as possible to the PICP, it is an employee parking lot that receives much less traffic. The PICP, on the other hand, experiences heavy traffic during business hours. Only 11 of the 29 constituents showed statistically significant differences between reference site and the PICP. Out of the 11, five showed a significant decrease from the reference site to the PICP. These included Dissolved Manganese, Toal Zinc, Chemical Oxygen Demand, Total Kjeldahl Nitrogen, and Total Suspended Solids. All water quality data is provided in Tables 5-7. Note that in these tables, Reference was abbreviated to Ref. Box-and-whisker plots comparing inflows and outflows for each constituent are shown in Figures 10 through 43. A legend for the box-and-whisker plots is provided in Figure 9. The constituents that were significantly lower in the reference site outflows were Dissolved Magnesium (according to one test), Dissolved Sodium, Dissolved Chromium, Dissolved Selenium, Total Chromium, Total Selenium, Total Molybdenum, Chloride (according to two tests), and Nitrite+Nitrate. The constituents that were significantly lower in the PICP outflows were Dissolved Manganese, Total Zinc (according to one test), Chemical Oxygen Demand, Total Kjeldahl Nitrogen, and Total Suspended Solids.
16
Table 4. Significance of Differences in Constituent Concentrations at Reference and BMP Constituent Two Sample T-Test Wilcoxon Signed Rank
Test Paired T-Test
Dissolved Calcium 0.2917 0.394 0.3259 Dissolved Iron 0.2749 0.9176 0.2721 Dissolved Magnesium 0.08637 0.003845 0.09106 Dissolved Sodium 8.409 E-5 0.000324 6.422 E-5 Dissolved Chromium 1.077 E-9 1.526 E-5 1.077 E-9 Dissolved Manganese 0.03508 0.01286 0.02873 Dissolved Nickel 0.428 0.3061 0.481 Dissolved Copper 0.3394 0.6416 0.3974 Dissolved Zinc 0.1713 0.05569 0.1785 Dissolved Selenium 4.739 E-6 0.001581 4.739 E-6 Dissolved Silver 1 N/A 1 Dissolved Cadmium 0.799 0.7973 0.7891 Dissolved Lead 0.2404 0.4227 0.2483 Total Beryllium 0.1636 0.3711 0.1636 Total Chromium 0.0005406 0.0002136 0.0006053 Total Manganese 0.6005 0.6603 0.5886 Total Nickel 0.6932 0.5349 0.6841 Total Copper 0.93 0.4038 0.9084 Total Zinc 0.07801 0.001068 0.08544 Total Arsenic 0.07867 0.1003 0.07867 Total Selenium 1.484 E-7 0.0006998 1.484 E-7 Total Molybdenum 2.547 E-10 1.526 E-5 2.434 E-9 Total Silver 0.3009 0.1975 0.302 Total Cadmium 0.15 0.2932 0.1656 Total Antimony 0.3322 1 0.3322 Total Lead 0.6214 0.3342 0.6086 Chloride 0.05588 6.104 E-5 0.04542 Chemical Oxygen Demand
9.523 E-5 1.526 E-5 4.157 E-5
Nitrite+Nitrate 5.74 E-13 0.0003204 5.531 E-9 Dissolved Phosphorus 0.1344 0.1032 0.09854 Total Phosphorus 0.9071 0.4346 0.898 Dissolved Potassium 9.957 E-5 0.0006446 2.31 E-5 Total Kjeldahl Nitrogen
1.061 E-5 0.0003198 7.726 E-6
Total Suspended Solids
0.009343 3.052 E-5 0.005091

17
Table 5. Water Quality Data for 2008
Water Quality ConstituentRef BMP Ref BMP Ref BMP Ref BMP Ref BMP
Dissolved Calcium (mg/L) ** 12 11 18 6 22 13 25 9 **Dissolved Iron (mg/L) ** 0 0.15 0 0.1 0 0.08 0 0.08 **Dissolved Magnesium (mg/L) ** 2 1.7 2.8 1 4.3 2 4.6 1.6 **Dissolved Sodium (mg/L) ** 12 6 21 5 34 13 38 7 **Dissolved Chromium (µg/L) ** 1.6 0 1.5 0 4.9 0 4 0 **Dissolved Manganese (µg/L) ** 26.2 94.1 5.4 5.7 1.8 34.2 1.1 30.2 **Dissolved Nickel (µg/L) ** 0 1.3 0 0 0 1.5 0 0 **Dissolved Copper (µg/L) ** 5.4 5.5 8.2 7.8 8.3 7.8 8.7 17.3 **Dissolved Zinc (µg/L) ** 83 13 12 12.4 7.9 33.3 18 25.8 **Dissolved Selenium (µg/L) ** 0 0 0 0 1.3 0 1.2 0 **Dissolved Silver (µg/L) ** 0 0 0 0 0 0 0 0 **Dissolved Cadmium (µg/L) ** 0 0.1 0.1 0 0 0.1 0 0.3 **Dissolved Lead (µg/L) ** 0 0 0 0 0 0 0 0 **Total Beryllium (µg/L) ** 0 0 0 0 0 0 0 0 **Total Chromium (µg/L) ** 0 8.2 8.3 0 7.3 9.4 6.2 0 **Total Manganese (µg/L) ** 32.1 254 72.8 74.5 31 232 42.9 124 **Total Nickel (µg/L) ** 1.1 7.4 5.2 2.8 1.7 8.7 1.6 4.4 **Total Copper (µg/L) ** 5.8 31.7 21 15.3 8 43.6 77.6 36.4 **Total Zinc (µg/L) ** 97.6 188 67.4 67.1 22.6 245 36.6 147 **Total Arsenic (µg/L) ** 0 0 0 0 0 0 0 0 **Total Selenium (µg/L) ** 0 0 0 0 1.3 0 1.3 0 **Total Molybdenum (µg/L) ** 0 0 13.6 0 16.6 0 16.4 0 **Total Silver (µg/L) ** 0 0 0 0 0 0.4 0.2 0 **Total Cadmium (µg/L) ** 0 1 0 0 0 1 0 0.9 **Total Antimony (µg/L) ** 0 0 0 0 0 0 0 0 **Total Lead (µg/L) ** 0 28.3 12.7 9 0 27.7 0 15.2 **Chloride (mg/L) ** 9 6 23 ** ** ** ** ** **Chemical Oxygen Demand (mg/L)
** 82 418 65 48 25 252 58 174 **
Nitrite+Nitrate (mg/L) ** 1 0.19 1.76 0.27 1.74 0.69 1.27 0.28 **Dissolved Phosphorus (mg/L) ** 0.13 0.04 0.06 0.04 0.08 0.02 0.05 0.1 **Dissolved Potassium (mg/L) ** 3 2 3 1 4 2 5 3 **Total Phosphorus (mg/L) ** 0.21 0.9 0.3 0.13 0.12 0.46 0.18 0.33 **Total Kjeldahl Nitrogen ** 2.8 4.5 2.2 1.2 0 4.2 1.1 2 **Total Suspended Solids ** 11 1360 188 131 35 508 45 154 **
Note: 0 values indicate a level below the detection limit.**No Data
Storm Event 1 Storm Event 2 Storm Event 3 Storm Event 4 Storm Event 5

18
Table 6. Water Quality Data for 2009
Water Quality Constituent
Ref BMP Ref BMP Ref BMP Ref BMP Ref BMP Ref BMP Ref BMP Ref BMP Ref BMP Ref BMP Ref BMP Ref BMPDissolved Calcium (mg/L)
5 81 ** 70 ** 14 16 ** 6 14 3 12 19 21 7 21 41 17 8 9 23 9 21 10
Dissolved Iron (mg/L) 0.2 0 ** 0 ** 0.1 0.1 ** 0.1 0.2 0.1 0.1 0.1 0 0.1 0 0.5 0 0 0.1 0.1 0.2 0.3 0.1Dissolved Magnesium (mg/L)
1.4 39 ** 28 ** 6.2 3.6 ** 1.1 4.4 0.6 4.3 3.8 7.2 1 7.2 7.6 7 1.4 3.5 4.6 3.3 3.4 3.6
Dissolved Sodium (mg/L)
29 154 ** 176 ** 49 20 ** 7 61 5 44 21 60 8 55 32 54 7 42 20 40 15 36
Dissolved Chromium (µg/L)
0 5 ** 7.1 ** 3.4 0 ** 0 4.3 0 4.1 0 5.2 0 4.8 0 6 0 3.7 0 2.6 0 3
Dissolved Manganese (µg/L)
33 8.4 ** 5.3 ** 5.1 12 ** 34 3.4 17 6.1 12 8.5 14 5.4 14 2.6 28 9 4 2.5 134 8.9
Dissolved Nickel (µg/L) 1.5 0 ** 0 ** 0 1.9 ** 0 0 0 0 2.1 1.9 2.4 0 2.6 0 0 0 1.3 0 2.3 0Dissolved Copper (µg/L)
17 6.4 ** 6.6 ** 4.2 11 ** 5.6 6.4 3 4.7 15 4.6 16 5.6 8.6 4.1 6.1 6.1 8.1 4.2 7.5 5.8
Dissolved Zinc (µg/L) 21 6.4 ** 0 ** 6 23 ** 35 0 11 0 13 0 354 0 13 6.5 9.2 0 9 0 20 8.4Dissolved Selenium (µg/L)
0 1.4 ** 2.2 ** 0 0 ** 0 1.6 0 1.1 0 0 0 1.2 0 1.4 0 2 0 1.2 0 1.4
Dissolved Silver (µg/L) 0 0 ** 0 ** 0 0 ** 0 0 0 0 0 0 0 0 0 0 0 0 0 0 0 0Dissolved Cadmium (µg/L)
0.2 0.9 ** 0.3 ** 0 0.1 ** 0.3 0.2 0 0 0 0 0.7 0 0 0 0.1 0 0.2 0.2 0.3 0.1
Dissolved Lead (µg/L) 0 0 ** 0 ** 0 0 ** 0 0 0 0 0 0 0 0 0 0 0 0 0 0 1.1 0Total Beryllium (µg/L) 0 0 ** 0 ** 0 0 ** 0 0 0 0 0 0 0 0 0 0 0 0 0 0 0 0Total Chromium (µg/L) 0 8.9 ** 11 ** 5.8 5.3 ** 6.3 7.4 0 6.8 0 10 5.8 11 0 8.4 0 9.1 0 6.4 5.8 5.6Total Manganese (µg/L) 110 54 ** 68 ** 79 164 ** 176 103 62 72 63 67 92 39 239 39 48 109 61 145 257 121Total Nickel (µg/L) 5 3 ** 2.3 ** 2.3 5.9 ** 5.8 2.4 2.1 2.2 3 4 6.4 2.5 4.3 1.7 1.5 3.5 2.1 3.3 5.7 2.6Total Copper (µg/L) 33 14 ** 14 ** 12 31 ** 23 15 13 8.7 19 8.2 31 7.9 19 7.4 8.7 13 11 13 24 12Total Zinc (µg/L) 129 37 ** 30 ** 24 163 ** 149 25 59 0 41 21 ### 0 66 0 30 26 30 32 138 25Total Arsenic (µg/L) 0 0 ** 0 ** 0 0 ** 0 5.4 0 0 0 0 0 0 0 0 0 0 0 0 0 3.8Total Selenium (µg/L) 0 1.5 ** 2.1 ** 1 0 ** 0 1.7 0 1.1 0 1 0 1.7 0 1.6 0 1.7 0 1.2 0 1.4Total Molybdenum (µg/L)
0 6.4 ** 12 ** 10 0 ** 0 11 0 8.9 0 9.5 0 11 6.2 13 0 8.4 0 6.5 0 8
Total Silver (µg/L) 0 6.3 ** 0 ** 0 0 ** 0 0 0 0 0 0 0 0 0 0 0 0 0 0 0 0Total Cadmium (µg/L) 0 1.2 ** 0 ** 0 0.8 ** 0.6 0 0 0 0 0 3.6 0 0 0 0 0 0 0 0.9 0Total Antimony (µg/L) 0 0 ** 0 ** 0 0 ** 0 0 0 0 0 0 23 0 0 0 0 0 0 0 0 0Total Lead (µg/L) 17 5.9 ** 5.7 ** 0 18 ** 21 6.1 5.9 0 0 0 9.4 0 6.6 0 0 5.9 0 7.8 14 5.9Chloride (mg/L) 34 464 ** 461 ** 79 ** ** 4 55 3 41 23 64 6 60 35 60 6 29 21 24 16 23Chemical Oxygen Demand (mg/L)
194 54 ** 46 ** 54 184 ** 172 40 39 26 151 31 129 24 146 0 106 35 122 29 230 53
Nitrite + Nitrate (mg/L) 1 1.5 ** 1.1 ** 1.1 0.7 ** 0.2 1.8 0.1 1.4 0.6 2 0.3 2.4 0.1 2.4 0.5 1.4 0.3 1.1 0.2 2Dissolved Phosphorus (mg/L)
0.1 0.1 ** 0.1 ** 0.1 0.1 ** 0.1 0.2 0 0.1 0 0 0 0.1 0.1 0.1 0.1 0.1 0.1 0.1 0.2 0.1
Dissolved Potassium (mg/L)
2 8 ** 6 ** 4 4 ** 2 4 0 5 4 8 6 8 7 7 2 5 3 5 6 5
Total Phosphorus (mg/L)
0.3 0.2 ** 0.2 ** 0.2 0.5 ** 0.4 0.3 0.2 0.2 0.1 0.1 0.3 0.1 0.4 0.1 0.2 0.3 0.1 0.3 0.7 0.2
Total Kjeldahl Nitrogen (mg/L)
3 1 ** 1.1 ** 1.6 4.7 ** 2.5 0.8 1.1 0.8 2.2 0.6 4.5 0.6 4.1 0.5 1.8 1 2 1.2 4.2 1
Total Suspended Solids (mg/L)
129 75 ** 99 ** 41 198 ** 436 53 116 38 104 39 235 33 230 19 91 64 55 75 481 49
**No Data
Storm Event 14
Storm Event 16
Storm Event 17
Storm Event 18
Storm Event 20
Storm Event 21
Storm Event 12
Storm Event 1
Storm Event 3
Storm Event 4
Storm Event 7
Storm Event 11
Note: 0 values indicate a level below the detection limit.
19
Table 7. Water Quality Data for 2009 (Cont.)
Water Quality Constituent
Ref BMP Ref BMP Ref BMP Ref BMP Ref BMP Ref BMP Ref BMP Ref BMP Ref BMP Ref BMP Ref BMPDissolved Calcium (mg/L)
7 10 24 11 6 14 ** 13 6 ** ** 27 ** 22 ** 23 ** 23 ** 19 ** 16
Dissolved Iron (mg/L) 0 0.2 0.3 0.2 0 0.8 ** 0.1 0 ** ** 0 ** 0.1 ** 0 ** 0.1 ** 0.1 ** 0.1Dissolved Magnesium (mg/L)
1.4 3.7 4.2 3.6 1.2 4.1 ** 4.6 1 ** ** 7.8 ** 5.4 ** 5.9 ** 7.1 ** 5.4 ** 5.5
Dissolved Sodium (mg/L)
6 32 18 34 6 42 ** 35 5 ** ** 41 ** 46 ** 50 ** 55 ** 42 ** 30
Dissolved Chromium (µg/L)
0 2.4 0 2.5 0 3.1 ** 3.8 0 ** ** 2.1 ** 2.5 ** 3.3 ** 3.7 ** 2.8 ** 2.8
Dissolved Manganese (µg/L)
22 8.2 75 8.6 13 15 ** 6 26 ** ** 15 ** 7.2 ** 0 ** 1.5 ** 3.3 ** 2.3
Dissolved Nickel (µg/L) 0 0 1.4 0 0 0 ** 0 0 ** ** 1.5 ** 0 ** 0 ** 0 ** 0 ** 0Dissolved Copper (µg/L)
5.1 6.5 5 4.4 5.9 5.7 ** 3.3 7.4 ** ** 7.9 ** 6.8 ** 6.6 ** 4 ** 5.3 ** 3.6
Dissolved Zinc (µg/L) 8.1 0 15 0 5.7 0 ** 0 11 ** ** 13 ** 7.6 ** 0 ** 0 ** 5.1 ** 0Dissolved Selenium (µg/L)
0 1.1 0 0 0 0 ** 1.6 0 ** ** 1 ** 0 ** 1.1 ** 1.1 ** 0 ** 1.1
Dissolved Silver (µg/L) 0 0 0 0 0 0 ** 0 0 ** ** 0 ** 0.2 ** 0 ** 0 ** 0 ** 0Dissolved Cadmium (µg/L)
0 0.2 0.1 0 0 0 ** 0.1 0.1 ** ** 0.2 ** 0 ** 0.1 ** 0 ** 0 ** 0
Dissolved Lead (µg/L) 0 0 0 0 0 0 ** 0 0 ** ** 0 ** 0 ** 0 ** 0 ** 0 ** 0Total Beryllium (µg/L) 0 0 0 0 0 0 ** 0 0 ** ** 0 ** 0 ** 0 ** 0 ** 0 ** 0Total Chromium (µg/L) 0 5.1 0 6 0 5.2 ** 6 0 ** ** 10 ** 0 ** 0 ** 0 ** 0 ** 0Total Manganese (µg/L) 106 106 121 125 33 68 ** 72 82 ** ** 31 ** 86 ** 30 ** 9.5 ** 23 ** 34Total Nickel (µg/L) 2.7 2.7 2.4 3.1 1.2 2.4 ** 2.2 2.6 ** ** 2 ** 2.5 ** 2.2 ** 1.5 ** 1.5 ** 1.2Total Copper (µg/L) 13 9.8 11 9.9 6.9 7.4 ** 8.5 12 ** ** 9 ** 17 ** 9.9 ** 4.9 ** 7.9 ** 5.9Total Zinc (µg/L) 75 22 49 25 25 0 ** 0 49 ** ** 20 ** 57 ** 24 ** 0 ** 0 ** 0Total Arsenic (µg/L) 0 0 0 0 0 0 ** 0 0 ** ** 0 ** 0 ** 0 ** 0 ** 0 ** 0Total Selenium (µg/L) 0 1.3 0 1 0 0 ** 1.2 0 ** ** 1.1 ** 0 ** 1.1 ** 1 ** 0 ** 0Total Molybdenum (µg/L)
0 7.6 0 7.5 0 8.5 ** 7.5 0 ** ** 8.4 ** 6.8 ** 8.3 ** 14 ** 8.9 ** 7.3
Total Silver (µg/L) 0 0 0 0 0 0 ** 0 0 ** ** 0 ** 0 ** 0 ** 0 ** 0 ** 0Total Cadmium (µg/L) 0 0 0 0 0 0 ** 0 0 ** ** 0 ** 0 ** 0 ** 0 ** 0 ** 0Total Antimony (µg/L) 0 0 0 0 0 0 ** 0 0 ** ** 0 ** 0 ** 0 ** 0 ** 0 ** 0Total Lead (µg/L) 8.5 5.6 0 6.7 0 0 ** 0 6.3 ** ** 0 ** 0 ** 0 ** 0 ** 0 ** 0Chloride (mg/L) 6 19 18 24 4 35 ** 23 3 ** ** 47 ** 87 ** 99 ** 53 ** 41 ** 30Chemical Oxygen Demand (mg/L)
136 40 113 26 71 36 ** 90 127 ** ** 88 ** 63 ** 53 ** 20 ** 24 ** 32
Nitrite + Nitrate (mg/L) 0.2 1.8 0.2 1.8 0.6 1.9 ** 2.2 0.4 ** ** 4.3 ** 2.2 ** 2.1 ** 2.8 ** 1.9 ** 1.9Dissolved Phosphorus (mg/L)
0 0.1 0.2 0.1 0 0.1 ** ** 0.1 ** ** 0 ** 0 ** 0 ** 0.1 ** 0 ** 0
Dissolved Potassium (mg/L)
2 5 5 6 1 7 ** 6 2 ** ** 8 ** 8 ** 9 ** 8 ** 7 ** 5
Total Phosphorus (mg/L)
0.3 0.3 0.3 0.3 0.1 0.2 ** 0.2 0.2 ** ** 0.1 ** 0.1 ** 0.1 ** 0.1 ** 0.1 ** 0.1
Total Kjeldahl Nitrogen (mg/L)
1.8 0.7 2.3 0.6 1.8 0.6 ** 0.9 2.4 ** ** 1.6 ** 1.2 ** 1.1 ** 0.4 ** 0.6 ** 0.6
Total Suspended Solids (mg/L)
427 33 80 39 78 26 ** 40 141 ** ** 26 ** 41 ** 20 ** 13 ** 10 ** 25
Storm Event 29
Storm 30 Storm Event 31
Storm Event 32
Storm Event 33
Storm Event 28
Storm Event 22
Storm Event 23
Storm Event 24
Storm Event 25
Storm Event 26

20
Table 8. Water Quality Data for 2010
Water Quality Constituent
Ref BMP Ref BMP Ref BMP Ref BMP Ref BMP Ref BMP Ref BMP Ref BMP Ref BMP Ref BMPDissolved Calcium (µg/L) 4 ** 2 ** 4 ** 4 ** 10 6 5 ** 4 3 25 ** 21 ** 22 **Dissolved Iron (mg/L) 0.11 ** 0 ** 0.1 ** 0 ** 0.22 2.65 0.12 ** 0.07 0.96 0.58 ** 0.16 ** 0.2 **Dissolved Magnesium (mg/L)
1.3 ** 0.6 ** 1 ** 1.1 ** 2.1 2 0.9 ** 0.8 0.9 5.6 ** 5.2 ** 5.6 **
Dissolved Sodium (mg/L) 14 ** 2 ** 5 ** 4 ** 6 118 3 ** 3 107 24 ** 20 ** 24 **Dissolved Chromium (µg/L)
0 ** 0 ** 0 ** 0 ** 0 5.9 0 ** 0 5.1 0 ** 0 ** 0 **
Dissolved Manganese (µg/L)
24.7 ** 10.7 ** 24.9 ** 20.5 ** 64.1 88.8 46 ** 25.6 54.2 159 ** 58.3 ** 42.5 **
Dissolved Nickel (µg/L) 1.3 ** 0 ** 0 ** 0 ** 0 4.7 0 ** 0 3.9 4.5 ** 2.2 ** 2.9 **Dissolved Copper (µg/L) 5.6 ** 0 ** 4.6 ** 3.7 ** 3.6 12.1 0 ** 5.2 11.3 14 ** 9.6 ** 18.2 **Dissolved Zinc (µg/L) 9.8 ** 9 ** 10.5 ** 15.9 ** 10.4 17.6 0 ** 8.7 24.6 33.9 ** 16 ** 30.5 **Dissolved Selenium (µg/L) 0 ** 0 ** 0 ** 0 ** 0 1.2 0 ** 0 1.7 0 ** 0 ** 1.1 **Dissolved Silver (µg/L) 0 ** 0 ** 0 ** 0 ** 0 0 0 ** 0 0 0 ** 0 ** 0 **Dissolved Cadmium 0 ** 0 ** 0 ** 0 ** 0.2 0.1 0 ** 0 0.2 0 ** 0 ** 0 **Dissolved Lead (µg/L) 0 ** 0 ** 0 ** 0 ** 0 5.4 0 ** 0 3.3 1 ** 0 ** 0 **Total Beryllium (µg/L) 0 ** 0 ** 0 ** 0 ** 0 1.9 0 ** 0 2 0 ** 0 ** 0 **Total Chromium (µg/L) 14.9 ** 6.9 ** 0 ** 0 ** 0 26.4 11.4 ** 8.2 25.7 7.2 ** 8.4 ** 0 **Total Manganese (µg/L) 273 ** 150 ** 71.9 ** 91 ** 111 750 249 ** 201 855 277 ** 222 ** 111 **Total Nickel (µg/L) 11.2 ** 5.2 ** 2.2 ** 3 ** 2.4 18.9 8.6 ** 7 19.6 9.5 ** 7.4 ** 5.2 **Total Copper (µg/L) 48.1 ** 20.2 ** 10.4 ** 12.4 ** 9.9 47.6 34.4 ** 28.4 52.9 45.2 ** 33.5 ** 28.4 **Total Zinc (µg/L) 288 ** 135 ** 50.5 ** 72 ** 56.9 144 213 ** 162 156 169 ** 142 ** 82.1 **Total Arsenic (µg/L) 0 ** 0 ** 0 ** 0 ** 0 13.9 0 ** 0 16.7 0 ** 0 ** 0 **Total Selenium (µg/L) 0 ** 0 ** 0 ** 0 ** 0 1.7 0 ** 0 2.5 1 ** 0 ** 0 **Total Molybdenum (µg/L) 0 ** 0 ** 0 ** 0 ** 0 7 0 ** 0 6.9 0 ** 5.9 ** 5 **Total Silver (µg/L) 0 ** 0 ** 0 ** 0 ** 0 0.3 34.8 ** 0 0.3 0 ** 0 ** 0 **Total Cadmium (µg/L) 1.6 ** 0 ** 0 ** 0 ** 0 0 0.6 ** 0.6 0.6 0.8 ** 0.6 ** 0 **Total Antimony (µg/L) 0 ** 0 ** 0 ** 0 ** 0 0 0 ** 0 0 0 ** 0 ** 0 **Total Lead (µg/L) 34.8 ** 16.4 ** 0 ** 7.7 ** 0 38 28.8 ** 19.5 39.3 14.3 ** 14.3 ** 7.2 **Chloride (mg/L) 13 ** 2 ** 4 ** 2 ** 4 101 3 ** 2 63 27.8 ** 18.1 ** 25.1 **Chemical Oxygen Demand (mg/L)
320 ** 109 ** 85 ** 79 ** 91 88 184 ** 187 68 417 ** 181 ** 247 **
Nitrite+Nitrate (mg/L) 0.29 ** 0.05 ** 0.33 ** 0.55 ** 0.11 1.63 0.09 ** 0.31 1.26 0.08 ** 0.68 ** 0.81 **Dissolved Phosphorus (mg/L)
0.09 ** 0.03 ** 0.2 ** 0.01 ** 0.06 0.52 0.04 ** 0.17 0.62 0.47 ** 0.17 ** 0.18 **
Dissolved Potassium (mg/L) 2 ** 0 ** 2 ** 1 ** 3 6 2 ** 2 5 13 ** 5 ** 5 **
Total Phosphorus (mg/L) 0.72 ** 0.28 ** 0.34 ** 0.17 ** 0.28 1.11 0.48 ** 0.49 1.23 1.32 ** 0.59 ** 0.37 **Total Kjeldahl Nitrogen (mg/L)
3.7 ** 1.4 ** 2.1 ** 1.6 ** 2 1.7 2.8 ** 2.8 1.8 6.7 ** 3.3 ** 3.1 **
Total Suspended Solids (mg/L)
886 ** 301 ** 91 ** 202 ** 147 122 427 ** 384 179 414 ** ** ** 102 **
**No Data
Storm Event 6
Storm Event 7
Storm Event 8
Storm Event 9
Storm Event1
Storm Event 2
Storm Event 3
Storm Event 5
Storm Event 7
Storm Event 9
Note: 0 values indicate a level below the detection limit.

21
Figure 9. Legend for Box-and-Whisker Plots
Upper Bound Quartile 1
Lower Bound Quartile 1
Median 1
Upper Bound Quartile 2
Lower Bound Quartile 2
Median 2
Mean 1 Mean 2
Lower Outlier 1
Upper Outlier 1
Lower Outlier 2
Upper Outlier 2
Data Set 1 Data Set 2 0
200
400
600
800
1000
1200
1400 U
nits
Legend

22
Figure 10. Dissolved Calcium Concentrations at the Reference Site and BMP
Upper Outlier=41 Upper Bound Quartile=19.5 Mean=11.857 Median=7.5
Lower Bound Quartile=5
Lower Outlier=0
Upper Anomaly 2=81
Upper Anomaly 1=70
Upper Outlier=27 Upper Bound Quartile=22
Mean=20.074 Median=16
Lower Bound Quartile=11.5
Lower Outlier=3 Lower Anomaly=0
Reference Site BMP 0
10
20
30
40
50
60
70
80
90 m
g/L
Dissolved Calcium, 2008-2010

23
Figure 11. Dissolved Iron Concentrations at the Reference Site and BMP
Upper Anomaly 2=0.58
Upper Anomaly 1=0.47
Upper Outlier=0.32 Upper Bound
Quartile=0.165 Mean=0.134 Median=0.1
Lower Bound Quartile=0.058
Lower Outlier=0
Upper Anomaly 3=2.65
Upper Anomaly 2=0.96
Upper Anomaly 1=0.81
Upper Outlier=0.23 Upper Bound
Quartile=0.145 Mean=0.217 Median=0.05 Lower Bound
Quartile=0
Reference Site BMP 0
0.5
1
1.5
2
2.5
3 m
g/L
Dissolved Iron, 2008-2010
24
Figure 12. Dissolved Magnesium Concentrations at the Reference Site and BMP
Upper Outlier=7.6 Upper Bound Quartile=3.65 Mean=2.386 Median=1.4
Lower Bound Quartile=1
Lower Outlier=0.6
Upper Anomaly 2=39.2 Upper
Anomaly=28.2 Upper Outlier=7.8
Upper Bound Quartile=6.6 Mean=6.807 Median=4.6
Lower Bound Quartile=3.6
Lower Outlier=0.9
Reference Site BMP 0
5
10
15
20
25
30
35
40 m
g/L
Dissolved Magnesium, 2008-2010
25
Figure 13. Dissolved Sodium Concentrations at the Reference Site and BMP
Upper Outlier=32 Upper Bound Quartile=20
Mean=11.964 Median=7
Lower Bound Quartile=5
Lower Outlier=2
Upper Anomaly 4=176
Upper Anomaly 3=154
Upper Anomaly 2=118
Upper Anomaly 1=107
Upper Outlier=61 Mean=55.852 Upper Bound Quartile=55 Median=42
Lower Bound …
Reference Site BMP 0
20
40
60
80
100
120
140
160
180 m
g/L
Dissolved Sodium, 2008-2010
26
Figure 14. Dissolved Chromium Concentrations at the Reference Site and BMP
All Values=0
Upper Outlier=7.1 Upper Bound Quartile=4.85 Mean=3.748 Median=3.7
Lower Bound Quartile=2.7
Lower Outlier=1.5
Reference Site BMP 0
1
2
3
4
5
6
7
8 µg
/L
Dissolved Chromium, 2008-2010
27
Figure 15. Dissolved Manganese Concentrations at the Reference Site and BMP
Upper Anomaly 3=159
Upper Anomaly 2=134
Upper Anomaly 1=94.1
Upper Outlier=74.8 Upper Bound
Quartile=43.375 Mean=38.482 Median=25.95 Lower Bound
Quartile=14.075 Lower Outlier=4
Upper Anomaly 3=88.8
Upper Anomaly 2=54.2
Upper Anomaly 1=26.2
Upper Outlier=15.2 Mean=11.478 Upper Bound Quartile=8.75
Median=6 Lower Bound Quartile=2.95
Lower Outlier=0
Reference Site BMP 0
20
40
60
80
100
120
140
160 µg
/L
Dissolved Manganese, 2008-2010

28
Figure 16. Dissolved Nickel Concentrations at the Reference Site and BMP
Upper Outlier=4.5 Upper Bound Quartile=1.95 Mean=1.043 Median=0.65 Lower Bound
Quartile=0
Upper Anomaly 4=4.7
Upper Anomaly 3=3.9
Upper Anomaly 2=1.9
Upper Anomaly 1=1.5
Mean=0.444 Median=0
Reference Site BMP 0
0.5
1
1.5
2
2.5
3
3.5
4
4.5
5 µg
/L
Dissolved Nickel, 2008-2010

29
Figure 17. Dissolved Copper Concentrations at the Reference Site and BMP
Figure 18. Dissolved Zinc Concentrations at the Reference Site and BMP
Upper Anomaly=18.2
Upper Outlier=17.3 Upper Bound
Quartile=10.025 Mean=8
Median=6.75 Lower Bound
Quartile=5.075 Lower Outlier=0
Upper Anomaly 2=12.1
Upper Anomaly 1=11.3
Upper Outlier=8.7 Upper Bound Quartile=6.7 Mean=6.178 Median=5.8
Lower Bound Quartile=4.5
Lower Outlier=3.3
Reference Site BMP 0
2
4
6
8
10
12
14
16
18
20 µg
/L
Dissolved Copper, 2008-2010
Upper Anomaly=354
Upper Outlier=34.7 Mean=27.46 Upper Bound
Quartile=21.35 Median=12.85 Lower Bound Quartile=9.65
Lower Outlier=0
Upper Anomaly 2=83
Upper Anomaly 1=24.6
Upper Outlier=18 Upper Bound Quartile=8.15 Mean=8.011 Median=0
Reference Site BMP 0
50
100
150
200
250
300
350
400
µg/L
Dissolved Zinc, 2008-2010

30
Figure 19. Dissolved Selenium Concentrations at the Reference Site and BMP
Figure 20. Dissolved Silver Concentrations at the Reference Site and BMP
Upper Anomaly=1.1 Mean=0.039 Median=0
Upper Outlier=2.2 Upper Bound Quartile=1.4 Mean=0.959 Median=1.1
Lower Bound Quartile=0
Reference Site BMP 0
0.5
1
1.5
2
2.5 µg
/L
Dissolved Selenium, 2008-2010
All Values=0
Upper Anomaly=0.2 Mean=0.007 Median=0
Reference Site BMP 0
0.05
0.1
0.15
0.2
0.25
µg/L
Dissolved Silver, 2008-2010

31
Figure 21. Dissolved Cadmium Concentrations at the Reference Site and BMP
Upper Anomaly=0.7
Upper Outlier=0.3 Upper Bound
Quartile=0.125 Mean=0.1 Median=0
Upper Anomaly=0.9
Upper Outlier=0.3 Upper Bound Quartile=0.15
Mean=0.1 Median=0
Reference Site BMP 0
0.1
0.2
0.3
0.4
0.5
0.6
0.7
0.8
0.9 µg
/L
Dissolved Cadmium, 2008-2010
32
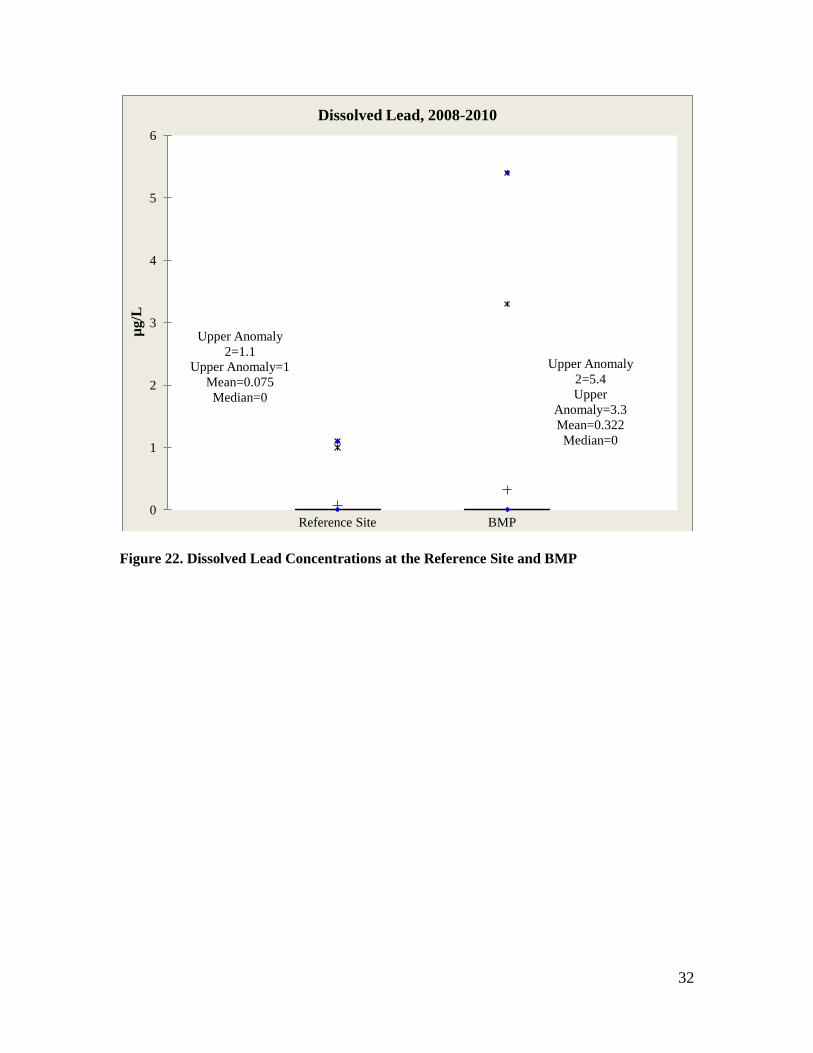
Figure 22. Dissolved Lead Concentrations at the Reference Site and BMP
Upper Anomaly 2=1.1
Upper Anomaly=1 Mean=0.075 Median=0
Upper Anomaly 2=5.4 Upper
Anomaly=3.3 Mean=0.322 Median=0
Reference Site BMP 0
1
2
3
4
5
6 µg
/L
Dissolved Lead, 2008-2010

33
Figure 23. Total Beryllium Concentrations at the Reference Site and BMP
All Values=0
Upper Anomaly 2=2
Upper Anomaly 1=1.9
Mean=0.144 Median=0
Reference Site BMP 0
0.5
1
1.5
2
2.5 µg
/L
Total Beryllium, 2008-2010

34
Figure 24. Total Chromium Concentrations at the Reference Site and BMP
Upper Outlier=14.9 Upper Bound
Quartile=6.975 Mean=3.493 Median=0
Upper Anomaly 2=26.4
Upper Outlier=25.7 Upper Bound Quartile=11.3 Mean=7.304 Median=6.4
Lower Bound Quartile=5.15
Lower Outlier=0
Reference Site BMP 0
5
10
15
20
25
30 µg
/L
Total Chromium, 2008-2010

35
Figure 25. Total Manganese Concentrations at the Reference Site and BMP
Upper Outlier=277 Upper Bound
Quartile=224.5 Mean=144.836 Median=116 Lower Bound
Quartile=80.425 Lower
Outlier=32.9
Upper Anomaly 2=855
Upper Anomaly 1= 750
Upper Outlier=145 Upper Bound
Quartile=104.5 Mean=120.9 Median=67.9 Lower Bound Quartile=36.6
Lower Outlier=9.5
Reference Site BMP 0
100
200
300
400
500
600
700
800
900 µg
/L
Total Manganese, 2008-2010

36
Figure 26. Total Nickel Concentrations at the Reference Site and BMP
Upper Outlier=11.2 Upper Bound Quartile=6.55 Mean=4.864 Median=4.7
Lower Bound Quartile=2.55
Lower Outlier=1.2
Upper Anomaly 3=19.6
Upper Anomaly 2=18.9
Upper Anomaly 1=5.2
Upper Outlier=4 Upper Bound Quartile=3.05 Mean=3.674 Median=2.4
Lower Bound Quartile=1.85
Lower Outlier=1.1
Reference Site BMP 0
2
4
6
8
10
12
14
16
18
20 µg
/L
Total Nickel, 2008-2010

37
Figure 27. Total Copper Concentrations at the Reference Site and BMP
Upper Outlier=48.1 Upper Bound
Quartile=31.925 Mean=23.346 Median=21.75 Lower Bound Quartile=12.4
Lower Outlier=6.9
Upper Anomaly 3=77.6
Upper Anomaly 2=52.9
Upper Anomaly 1=47.6
Upper Outlier=21 Upper Bound Quartile=13.9 Mean=15.837 Median=9.9
Lower Bound Quartile=7.95
Lower Outlier=4.9
Reference Site BMP 0
10
20
30
40
50
60
70
80 µg
/L
Total Copper, 2008-2010

38
Figure 28. Total Zinc Concentrations at the Reference Site and BMP
Upper Anomaly=1090
Upper Outlier=288 Upper Bound
Quartile=162.25 Mean=146.846 Median=105.55 Lower Bound Quartile=55.3
Lower Outlier=25.2
Upper Anomaly 3=156
Upper Anomaly 2=144
Upper Anomaly 1=97.6
Upper Outlier=67.4 Upper Bound
Quartile=34.15 Mean=32.963 Median=23.7 Lower Bound
Quartile=0
Reference Site BMP 0
200
400
600
800
1000
1200 µg
/L
Total Zinc, 2008-2010

39
Figure 29. Total Arsenic Concentrations at the Reference Site and BMP
Figure 30. Total Selenium Concentrations at the Reference Site and BMP
All Values=0
Upper Anomaly 4=16.7
Upper Anomaly 3=13.9
Upper Anomaly 2=5.4
Upper Anomaly 1=3.8
Mean=1.474
Reference Site BMP 0
2
4
6
8
10
12
14
16
18 µg
/L
Total Arsenic, 2008-2010
Upper Anomaly=1 Mean=0.36 Median=0
Upper Anomaly=2.5
Upper Outlier=2.1 Upper Bound Quartile=1.55 Mean=1.093 Median=1.2
Lower Bound Quartile=1
Lower Outlier=0
Reference Site BMP 0
0.5
1
1.5
2
2.5
3
µg/L
Total Selenium, 2008-2010
40
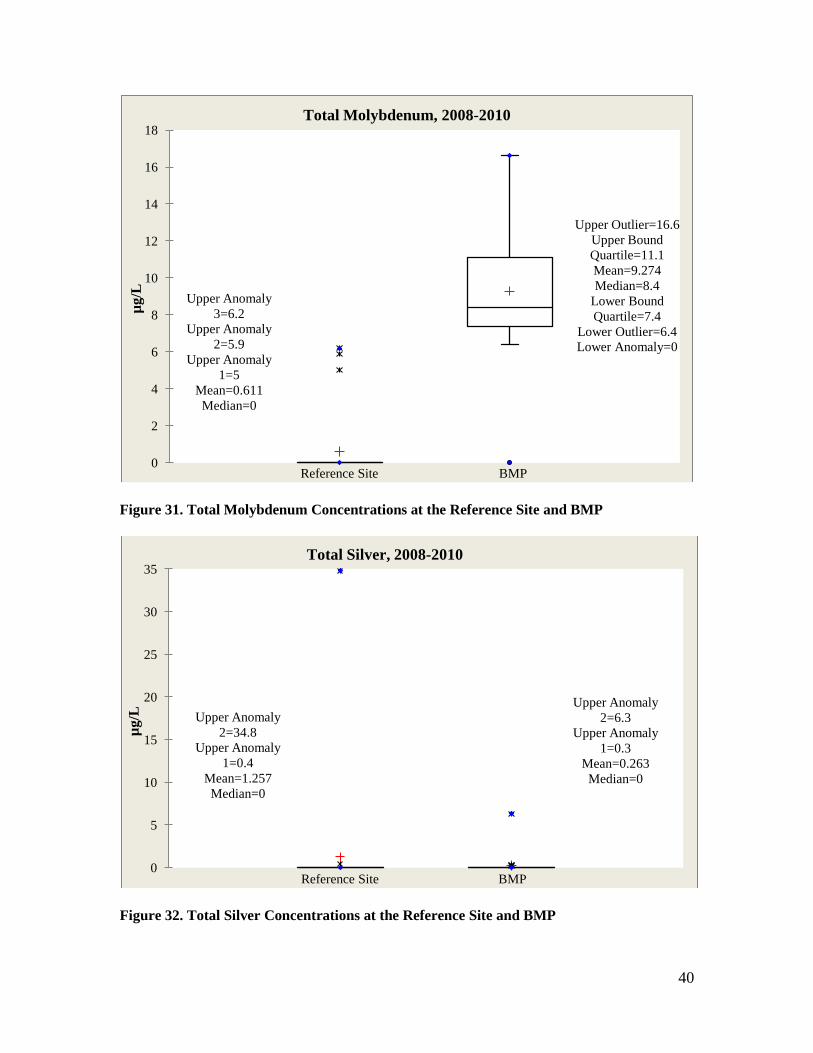
Figure 31. Total Molybdenum Concentrations at the Reference Site and BMP
Figure 32. Total Silver Concentrations at the Reference Site and BMP
Upper Anomaly 3=6.2
Upper Anomaly 2=5.9
Upper Anomaly 1=5
Mean=0.611 Median=0
Upper Outlier=16.6 Upper Bound Quartile=11.1 Mean=9.274 Median=8.4
Lower Bound Quartile=7.4
Lower Outlier=6.4 Lower Anomaly=0
Reference Site BMP 0
2
4
6
8
10
12
14
16
18 µg
/L
Total Molybdenum, 2008-2010
Upper Anomaly 2=34.8
Upper Anomaly 1=0.4
Mean=1.257 Median=0
Upper Anomaly 2=6.3
Upper Anomaly 1=0.3
Mean=0.263 Median=0
Reference Site BMP 0
5
10
15
20
25
30
35
µg/L
Total Silver, 2008-2010

41
Figure 33. Total Cadmium Concentrations at the Reference Site and BMP
Figure 34. Total Antimony Concentrations at the Reference Site and BMP
Upper Anomaly=3.6
Upper Outlier=1.6 Upper Bound Quartile=0.8 Mean=0.464 Median=0
Upper Anomaly 2=1.2
Upper Anomaly 1=0.6
Mean=0.067 Median=0
Reference Site BMP 0
0.5
1
1.5
2
2.5
3
3.5
4 µg
/L
Total Cadmium, 2008-2010
Upper Anomaly=23.3 Mean=0.832 Median=0
All Values=0
Reference Site BMP 0
5
10
15
20
25
µg/L
Total Antimony, 2008-2010

42
Figure 35. Total Lead Concentrations at the Reference Site and BMP
Figure 36. Chloride Concentrations at the Reference Site and BMP
Upper Outlier=34.8 Upper Bound
Quartile=17.05 Mean=11.757 Median=9.2
Lower Bound Quartile=4.425
Lower Outlier=0
Upper Anomaly 2=39.3
Upper Anomaly 1=38
Upper Outlier=12.7 Upper Bound Quartile=5.9 Mean=5.17 Median=0
Reference Site BMP 0
5
10
15
20
25
30
35
40 µg
/L
Total Lead, 2008-2010
Upper Outlier=35 Upper Bound
Quartile=18.825 Mean=11.917
Median=6 Lower Bound Quartile=3.75
Lower Outlier=2
Upper Anomaly 2=464
Upper Anomaly 1=461
Upper Outlier=101 Upper Bound Quartile=64 Mean=80.56 Median=47
Lower Bound Quartile=24
Lower Outlier=9
Reference Site BMP 0
50
100
150
200
250
300
350
400
450
500
mg/
L
Chloride, 2008-2010
43
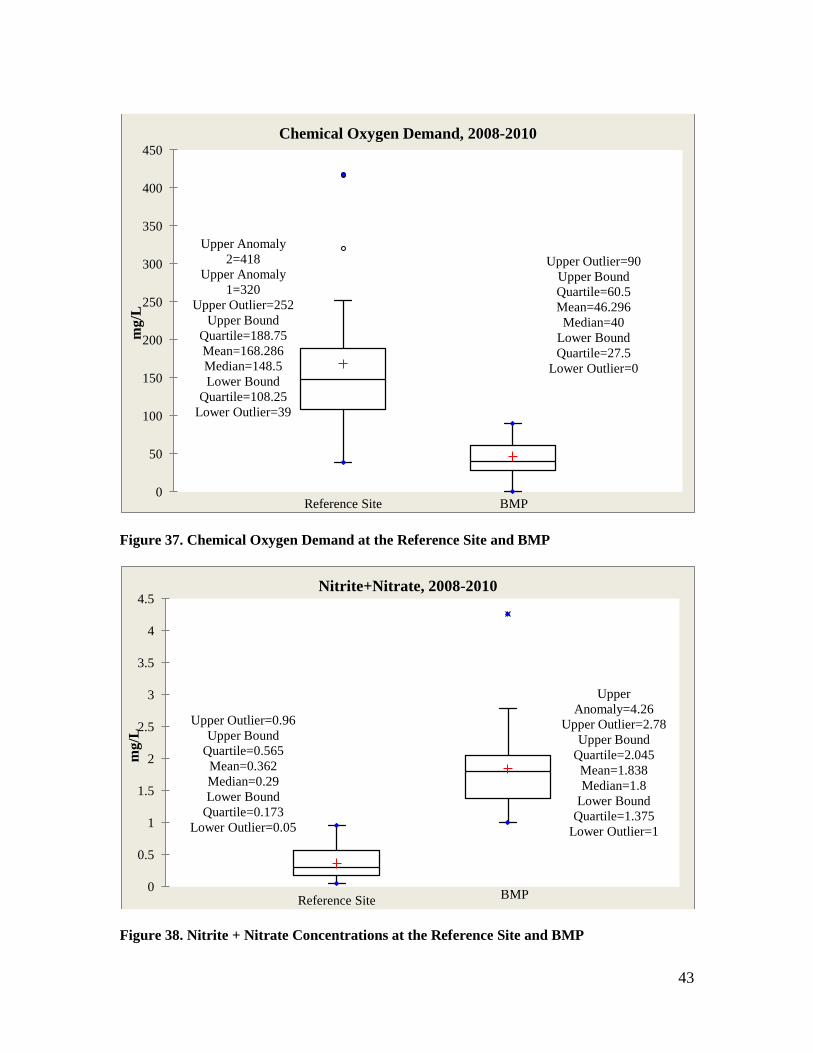
Figure 37. Chemical Oxygen Demand at the Reference Site and BMP
Figure 38. Nitrite + Nitrate Concentrations at the Reference Site and BMP
Upper Anomaly 2=418
Upper Anomaly 1=320
Upper Outlier=252 Upper Bound
Quartile=188.75 Mean=168.286 Median=148.5 Lower Bound
Quartile=108.25 Lower Outlier=39
Upper Outlier=90 Upper Bound Quartile=60.5 Mean=46.296 Median=40
Lower Bound Quartile=27.5
Lower Outlier=0
Reference Site BMP 0
50
100
150
200
250
300
350
400
450 m
g/L
Chemical Oxygen Demand, 2008-2010
Upper Outlier=0.96 Upper Bound
Quartile=0.565 Mean=0.362 Median=0.29 Lower Bound
Quartile=0.173 Lower Outlier=0.05
Upper Anomaly=4.26
Upper Outlier=2.78 Upper Bound
Quartile=2.045 Mean=1.838 Median=1.8
Lower Bound Quartile=1.375
Lower Outlier=1
Reference Site BMP 0
0.5
1
1.5
2
2.5
3
3.5
4
4.5
mg/
L
Nitrite+Nitrate, 2008-2010

44
Figure 39. Dissolved Phosphorus at the Reference Site and BMP
Figure 40. Dissolved Potassium Concentrations at the Reference Site and BMP
Upper Anomaly=0.47
Upper Outlier=0.2 Upper Bound
Quartile=0.143 Mean=0.098
Median=0.065 Lower Bound
Quartile=0.038 Lower Outlier=0.01
Upper Anomaly 2=0.62
Upper Anomaly 1=0.52
Upper Outlier=0.18 Upper Bound Quartile=0.11 Mean=0.112
Median=0.065 Lower Bound Quartile=0.05
Lower Outlier=0.03
Reference Site BMP 0
0.1
0.2
0.3
0.4
0.5
0.6
0.7 m
g/L
Dissolved Phosphorus, 2008-2010
Upper Anomaly=13 Upper Outlier=7
Upper Bound Quartile=4.25 Mean=3.179 Median=2
Lower Bound Quartile=2
Lower Outlier=0
Upper Outlier=9 Upper Bound Quartile=7.5 Mean=5.926 Median=6
Lower Bound Quartile=5
Lower Outlier=3
Reference Site BMP 0
2
4
6
8
10
12
14
mg/
L
Dissolved Potassium, 2008-2010

45
Figure 41. Total Phosphorus at the Reference Site and BMP
Upper Anomaly=1.32
Upper Outlier=0.9 Upper Bound Quartile=0.48 Mean=0.386
Median=0.325 Lower Bound Quartile=0.19
Lower Outlier=0.1
Upper Anomaly 2=1.23
Upper Anomaly 1=1.11
Upper Outlier=0.3 Upper Bound
Quartile=0.255 Mean=0.244 Median=0.17 Lower Bound
Quartile=0.105 Lower …
Reference Site BMP 0
0.2
0.4
0.6
0.8
1
1.2
1.4 m
g/L
Total Phosphorus, 2008-2010

46
Figure 42. Total Kjeldahl Nitrogen at the Reference Site and BMP
Upper Anomaly=6.7
Upper Outlier=4.7 Upper Bound= Quartile=3.8 Mean=2.85
Median=2.45 Lower Bound Quartile=1.95
Lower Outlier=1.1
Upper Anomaly 2=2.8
Upper Anomaly 1=2.2
Upper Outlier=1.8 Upper Bound Quartile=1.2 Mean=1.041 Median=1
Lower Bound Quartile=0.6
Lower Outlier=0
Reference Site BMP 0
1
2
3
4
5
6
7 m
g/L
Total Kjeldahl Nitrogen, 2008-2010

47
Figure 43. Total Suspended Solids at the Reference Site and BMP
V. Conclusion Assessment of flow reduction and water quality has been difficult at the PICP site. Water intrusion to the pressure transducer extension cable at the quick disconnect box has complicated flow measurement at the PICP site. The installation of the bubbler module should improve future flow measurements. While methods for sample collection have been successful, it is hard to discern how the PICP has impacted water quality since the runoff it receives may not be comparable to the reference site. Only 11 of the 29 constituents showed statistically significant differences between reference site and the PICP. Out of the 11, five showed a significant decrease from the reference site to the PICP. These included:
• Dissolved Manganese, • Total Zinc, • Chemical Oxygen Demand, • Total Kjeldahl Nitrogen, and • Total Suspended Solids.
Upper Anomaly=1360
Upper Outlier=886 Upper Bound
Quartile=420.5 Mean=292.889 Median=198 Lower Bound Quartile=110
Lower Outlier=55
Upper Anomaly 3=188
Upper Anomaly 2=179
Upper Anomaly 1=122
Upper Outlier=99 Upper Bound Quartile=58.5 Mean=53.259 Median=39
Lower Bound Quartile=26
Lower Outlier=10
Reference Site BMP 0
200
400
600
800
1000
1200
1400 m
g/L
Total Suspended Solids, 2008-2010

48
Water quality constituent concentrations can be compared with other permeable pavement studies found in the International Stormwater BMP database, as summarized in Table 8, which is adapted from Table 2-2 in Volume 3 of the USDCM. The database outlet values are relatively consistent with BMP data produced by this study.
Table 9. Comparison of Median Constituents for the PICP at Denver Waste Water and International Stormwater BMP Database
Data from PICP Data from
International BMP Database
Water Quality Constituent
Reference Median Value
BMP Median Value
Inlet Median Value
Outlet Median Value
Total Phosphorus (mg/L) 0.325 0.17 0.12 0.13
Total Suspended Solids (mg/L) 198 39 23.5 29.1
Total Kjeldahl Nitrogen (mg/L) 2.45 1 2.4 1.05
Total Cadmium (µg/L) 0 0 NA 0.3
Dissolved Copper (µg/L) 6.75 5.8 5.0 6.2
Total Copper (µg/L) 21.75 9.9 7.0 9.0
Dissolved Lead (µg/L) 0 0 0.1 0.3
Total Lead (µg/L) 9.2 0 2.5 2.5 Dissolved Zinc (µg/L) 12.85 0 25 14.6
Total Zinc (µg/L) 105.55 23.7 50 22 NA=Not Analyzed

49
The runoff data for the reference site and BMP can also be compared to runoff data from the Denver Regional Urban Runoff Program (DRURP), as summarized in Table 9. This provides another way to compare the data from this study to an outside source. Table 10. Event Mean Concentration of Constituent Runoff Values: Commercial DRURP, the Reference Site and the BMP Site
Constituent EMC Denver Commercial
Concentration
EMC Reference
Site Concentration
EMC BMP Concentration
Total Phosphorus (mg/L)
0.42 0.39 0.244
Total Kjeldahl Nitrogen (mg/L) 2.30 2.85 1.041
Nitrate+Nitrite (mg/L) 0.96 0.36 1.838
Total Lead (µg/L) 0.06 11.76 5.17
Total Zinc (µg/L) 0.24 146.85 32.963
Total Copper (µg/L) 0.04 23.35 15.837
Total Cadmium (µg/L) 0.00 0.46 0.067
Chemical Oxygen Demand (mg/L)
173.00 168.29 46.296
Total Suspended Solids (mg/L)
225.00 292.89 53.259

50
VI. References
Geosyntec Consultants, Inc., and Wright Water Engineers, Inc. 2010. International Stormwater Best Management Practices (BMP) Database Pollutant Category Summary: Nutrients. http://bmpdatabase.org/Docs/BMP%20Database%20Nutrients%20Paper%20December%202010%20Final.pdf. (June 14, 2011). International Stormwater Best Management Practices (BMP) data base: www.bmpdatabase.org. (June 14, 2011). Urban Drainage and Flood Control District (UDFCD). 2001. Urban Storm Drainage Criteria Manual – Volume 1 and 2. Updated and maintained by UDFCD. Denver, Colorado Urban Drainage and Flood Control District (UDFCD). 2010. Urban Storm Drainage Criteria Manual – Volume 3. Updated and maintained by UDFCD. Denver, Colorado