
STORMWATER MANAGEMENT REPORT - New Jersey Documents/Attch 4... · The proposed stormwater...
110
STORMWATER MANAGEMENT REPORT South Jersey Gas Interconnect Station Mount Pleasant- Tuckahoe Road Upper Township, NJ 24” Natural Gas Pipeline for System Reinforcement and to Supply the BL England Power Plant 225616 South Jersey Gas June 2014 woodardcurran.com COMMITMENT & INTEGRITY DRIVE RESULTS
Transcript of STORMWATER MANAGEMENT REPORT - New Jersey Documents/Attch 4... · The proposed stormwater...

STORMWATERMANAGEMENTREPORT
South Jersey GasInterconnect StationMount Pleasant-Tuckahoe RoadUpper Township, NJ
24” Natural GasPipeline for SystemReinforcement and toSupply the BL EnglandPower Plant
225616South Jersey GasJune 2014woodardcurran.com
COMMITMENT & INTEGRITY DRIVE RESULTS
SJG – BL England (225616) Woodard & CurranUpper Township, NJ June 2014
STORMWATER MANAGEMENT REPORT
SOUTH JERSEY GASINTERCONNECT STATION
MOUNT PLEASANT-TUCKAHOE ROADUPPER TOWNSHIP, NEW JERSEY
Applicant:
SOUTH JERSEY GASONE SOUTH JERSEY PLAZAFOLSOM, NEW JERSEY 08037
Prepared By:
WOODARD & CURRAN50 MILLSTONE ROAD, BUILDING 300EAST WINDSOR, NEW JERSEY 08520877-786-8881
Submitted:
JUNE 2014
Prepared By: Paul Jacques
Reviewed By: Mark Pereira
Dennis M. Walsh, P.E.
NJ Lic. No. GE46534

SJG – BL England (225616) i Woodard & CurranUpper Township, New Jersey June 2014
TABLE OF CONTENTS
SECTION PAGE NO.
1. INTRODUCTION ................................................................................................................................ 1-1
2. PROJECT DESCRIPTION ................................................................................................................. 2-1
2.1 Existing Conditions.........................................................................................................................2-12.2 Proposed Development..................................................................................................................2-12.3 Proposed Stormwater BMP’s .........................................................................................................2-2
3. STORMWATER MANAGEMENT SYSTEM ANALYSIS.................................................................... 3-1
3.1 Methodology...................................................................................................................................3-13.2 Pre-Development Hydrologic Analysis ...........................................................................................3-23.3 Post-Development Hydrologic Analysis..........................................................................................3-23.4 Hydrologic Analysis Results ...........................................................................................................3-3
4. SOIL EROSION AND SEDIMENTATION CONTROL........................................................................ 4-1
5. STORMWATER MANAGEMENT STANDARDS COMPLIANCE ...................................................... 5-1
LIST OF FIGURES
FIGURE
Figure 1: Site Locus Map
Figure 2: Pre-Development Watershed Map
Figure 3: Post-Development Watershed Map
Figure 4: FEMA FIRMETTE
APPENDICES
APPENDIX
Appendix A : Pinelands Commission Stormwater Checklist
Appendix B: Drawings
Appendix C: Test Pit Data and Soils Information
Appendix D: Pre-Development Analysis
Appendix E: Post-Development Analysis
Appendix F : Groundwater Mounding Analysis and System Drawdown Time Calculation
Appendix G : NOAA 24 Hour Rainfall Depths
Appendix H : Stormwater Management System Operations and Maintenance Plan

SJG – BL England (225616) 1-1 Woodard & CurranUpper Township, New Jersey June 2014
1. INTRODUCTION
This report describes the Stormwater Management Plan for the proposed South Jersey Gas (the“applicant”) Interconnect Station Site located on the eastern side of Mount Pleasant Road, approximately900 feet north of the intersection between Mount Pleasant-Tuckahoe Road and Marshall Avenue in UpperTownship, New Jersey (the “Site”). The Interconnect Station is part of the applicant’s 24 Inch NaturalGas Pipeline project for system reinforcement and to supply the B.L. England Power Plant. This reporthas been prepared for the Interconnect Station Site only.
The overall project includes the installation of a new 24 inch diameter steel pipeline to supply natural gasto the existing Beesleys Point coal-fired electric generating plant located in Upper Township, Cape MayCounty, commonly known as the B.L. England Generating Station. The project is necessary to convert thefacility from a coal to natural gas fueled generating plant per a State mandated requirement of BLEngland to discontinue using coal as the primary fuel source for the production of electricity.
The Stormwater Management Plan for the Interconnect Station Site has been developed to demonstratecompliance with the Pinelands Comprehensive Management Plan, Part VIII, Water Quality (the “CMP”),the Upper Township Land Subdivision and Site Plan Regulations, Section 19-7.7, Stormwater Control(the “Municipality Regulations”), the New Jersey Administrative Code, Title 7, Chapter 8 (N.J.A.C. 7:8)and the New Jersey Stormwater Best Management Practices Manual (the “BMP Manual”). The plandescribes the existing and proposed conditions at the Site, the stormwater management design and detailscompliance with the above referenced regulations.

SJG – BL England (225616) 2-1 Woodard & CurranUpper Township, New Jersey June 2014
2. PROJECT DESCRIPTION
2.1 EXISTING CONDITIONS
The Site is identified as Lot 12 on Assessor’s Block 350 and is located on the eastern side of MountPleasant-Tuckahoe Road, approximately 900 feet north of the intersection between Mount Pleasant-Tuckahoe Road and Marshall Avenue in Upper Township, New Jersey as indicated on Figure 1. The Sitearea is approximately 6.10 acres and is located within the State Pinelands Area. The property abutsMount Pleasant-Tuckahoe Road to the west and residential properties to the north, south, and east. TheSite consists of the Upper Township Department of Public Works Facility, South Jersey RailroadMuseum and two T-ball fields. The proposed Interconnect Station will be located within the existing T-ball field area as shown on Figure A. An easement will be obtained for the Station. Grades on Site slopein a southwesterly direction towards Mount Pleasant Road.
According to the United States Department of Agriculture (USDA) Natural Resources ConservationService (NRCS) Soil Survey of New Jersey, Site soils consist of Berryland and Mullica soils, 0 to 2percent slopes, occasionally flooded and are classified as hydrologic soil groups (HSG) B and D.
Soil evaluations were performed at the Site in March of 2014 by Woodard & Curran, in accordance withItem Nos. 3 and 5 of the Pineland Commission Stormwater Checklist and Reference Guide. Theevaluations were performed in order to determine the existing soil conditions throughout the Site, watertable elevations and the permeability rates to be used to design the proposed stormwater BMP’s. Theevaluations comprised three test holes and permeability tests as depicted on Figure A. The soil evaluationlog forms and permeability test results are provided in Appendix C.
The FEMA Flood Insurance Rate Map (FIRM) for Cape May County, New Jersey, Panel 6 of 20 datedJune 1, 1984 indicates that the Site is located within a Zone C flood area. A Zone C flood area is definedby FEMA as “areas of minimal flooding.” The FEMA FIRM is included as Figure 4. As of this Plan, theFIRM’s for this area have not been updated due to Superstorm Sandy.
2.2 PROPOSED DEVELOPMENT
The interconnect station will be located at approximately the mid-way point of the new pipeline and willhouse below ground piping (24 inch), above ground piping (4, 8, 12 and 24 inch), regulators, controlvalves and a catalytic heater. The station is being constructed for the following reasons:
To connect the new proposed 24” - 435 psi gas main to the existing 16” - 250 psi, 8” – 250 psiand 4” - 60 psi gas systems in order to provide reinforcement supply for the existing lines;
To allow the existing 250 psi system to temporarily provide gas to the BL England service ifthere is a disruption to the proposed 24” gas main upstream of the station; and
To locate a heater within the system to prevent the buildup of condensation as the pressure isreduced from 250 psi to 60 psi.
The proposed development associated with the interconnect station consists of the installation of a 21,930square foot crushed stone area and six foot high fence and gate for security purposes. No new impervioussurfaces are proposed with the exception of a bituminous asphalt apron for access purposes along Mount

SJG – BL England (225616) 2-2 Woodard & CurranUpper Township, New Jersey June 2014
Pleasant-Tuckahoe Road. The proposed aboveground sections of pipe will be supported by small piers.Stormwater generated from the aboveground piping will runoff directly to the crushed stone below.
2.3 PROPOSED STORMWATER BMP’S
The proposed stormwater management system includes a 6 inch crushed stone infiltration area, whichpromotes infiltration. The proposed system has been designed in accordance with the requirements of theNew Jersey BMP Manual to the extent practicable.
The 6 inches of crushed stone will function as an infiltration BMP; collecting and storing stormwaterrunoff for the majority of the Site prior to infiltration. Given that vehicular access to the Site will beminimal, an asphalt or concrete surface course is not needed.
Based upon the soil evaluation, the majority of soils beneath the infiltration area are classified as loamysand. The upper topsoil layer will be removed for the installation of the crushed stone. The total depth ofthe soil evaluations were approximately 7 to 8 feet. The soil evaluations identified a seasonal highgroundwater table (SHGWT) at a depth of 52” from existing grade. In general, the top of the infiltrationarea will be installed at existing grade; therefore the separation distance between the bottom of crushedstone and the SHGWT will be approximately 3.80 feet.
Six permeability tests were performed in accordance with Item No. 5 of the Pineland Commission’sStormwater Checklist and Reference Guide and are provided in Appendix C. The permeability testsresulted in rates ranging from 1.43 to 8.98 inches per hour. The lower permeability rates (1.43 and 1.94inches per hour) were found within Test Pit No. 2 and appear to be isolated to this area of the system.1.43 inches per hour was used as the design infiltration rate; however it is anticipated that the netpermeability rate for the entire system will be greater than that used for the design.
The proposed BMP is not required to provide stormwater quality and groundwater recharge since no newimpervious surfaces are proposed on-Site. Even though it is not required, the crushed stone infiltrationarea will provide stormwater quality and groundwater recharge benefits.
An Operation and Maintenance Plan has been developed for the proposed stormwater managementsystem. The Operation and Maintenance Plan describes the long term operation and maintenance of theproposed stormwater management system and is included as Appendix F.

SJG – BL England (225616) 3-1 Woodard & CurranUpper Township, New Jersey June 2014
3. STORMWATER MANAGEMENT SYSTEM ANALYSIS
3.1 METHODOLOGY
A pre- and post-development hydrologic analysis was performed to calculate and compare the peak rateof runoff of the existing and proposed conditions. The analysis was performed using HydroCAD®modeling software, developed by HydroCAD® Software Solutions LLC. The HydroCAD® software isbased upon the Soil Conservation Service’s (SCS), Technical Release 20 – Urban Hydrology for SmallWatersheds (TR-20), which is an industry accepted standard. The HydroCAD® model calculates peakrates of runoff by considering various hydrologic parameters and the stormwater structural measures thatdirectly influence the rate at which runoff is conveyed from a watershed. The hydrologic parameters thatwere applied to perform these calculations are as follows:
Design Event: The project was evaluated under the 2-, 10-, and 100-year 24-hour SCS Type IIIRainfall Events. Rainfall depths associated with each event were obtained from the NationalOceanic and Atmospheric Administration (NOAA) (Appendix G) in accordance with thePinelands Commission CMP and are presented in Table 1.
Table 1: Rainfall Depths
Rainfall Event Rainfall Depth(inches)
2-year 3.35
10-year 5.21
100-year 9.00
Curve Number: Curve numbers are specific to each watershed and are a function of theperviousness of the watershed cover, the underlying soil type, and antecedent moistureconditions. Cover types for existing and proposed conditions were found using the Existing andProposed Conditions Watershed Maps (Figures 2 and 3, respectively). Underlying soil types wereidentified using the soil data presented in Section 2.1, and an antecedent moisture condition of“2” was assumed. Curve number calculations for each watershed are presented in Appendix Dand Appendix E.
Time of Concentration: The time of concentration represents the time for runoff from the mosthydrologically distant point of the watershed to reach the discharge location. They are specific toeach watershed and are a function of the slope, length, and surface roughness of the flow path.Flow paths for existing and proposed conditions were delineated using the Existing and ProposedConditions Watershed Maps (Figures 2 and 3, respectively). Calculations for the time ofconcentration for each watershed are presented in Appendix D and Appendix E.
Watershed Area: Watershed areas were obtained using the watershed boundaries that weredelineated using the Existing Conditions Survey and Proposed Site Plan. Watershed boundariesare illustrated on Figure 2 and Figure 3 for existing and proposed conditions, respectively. Areasare included with the hydrologic calculations in Appendix D and Appendix E.

SJG – BL England (225616) 3-2 Woodard & CurranUpper Township, New Jersey June 2014
Pre- and post-development peak rates of runoff and volumes were calculated and compared for the Site byconsidering the aforementioned hydrologic parameters and stormwater measures for each contributingwatershed.
3.2 PRE-DEVELOPMENT HYDROLOGIC ANALYSIS
The pre- development hydrologic model consists of one watershed area (Watershed A). The Watershed Apoint of analysis is the westerly property line along Mount Pleasant-Tuckahoe Road. The existingwatershed area is shown on Figure 2 and described as follows.
Existing Watershed A: Existing Watershed A is approximately 1.55 acres. Runoff from thiswatershed is conveyed via overland flow to Mount Pleasant-Tuckahoe Road. The watershedconsists of woodlands, the T-ball fields and grassed areas.
The results of the pre-development analysis are provided in Section 3.4.
3.3 POST-DEVELOPMENT HYDROLOGIC ANALYSIS
The post-development hydrologic model divides the Site into two watershed areas based on the proposedtopography and the location of the on-site crushed stone infiltration area. Watershed A is divided intotwo sub-watershed areas, A-1 and A-2. The watersheds are depicted in Figure 3 and described as follows.
Proposed Watershed A-1: Proposed Watershed A-1 consists of the proposed crushed stone area aswell as adjacent upland area and is approximately 0.79 acres. Runoff from this watershed willflow directly into the crushed stone infiltration area and infiltrate into the underlying soils. Thecrushed stone infiltration area will store and infiltrate runoff for the 2-, 10- and 100-year stormevents; therefore Proposed Watershed A-1 will not contribute to off-Site runoff under post-development conditions. For Watershed A-1, the crushed stone area is considered impervious.This approach is conservative.
Proposed Watershed A-2: Proposed Watershed A-2 consists of the areas surrounding the crushedstone pad draining directly to Mount Pleasant Road and is approximately 0.76 acres. Runoff fromthis watershed is conveyed via overland flow to Mount Pleasant Road. The Proposed WatershedA-2 area consists of grass and woodlands.
The results of the post-development analysis are provided in Section 3.4.

SJG – BL England (225616) 3-3 Woodard & CurranUpper Township, New Jersey June 2014
3.4 HYDROLOGIC ANALYSIS RESULTS
The proposed drainage system has been designed such that there will be no increase in pre-developmentstormwater peak discharge rates and volumes for the 2-, 10- and 100-year storm events at the point ofanalysis. The HydroCAD® analyses for existing and proposed conditions are included in Appendix Dand E, respectively. The net peak discharge rates and volumes are summarized in the tables below.
Table 2: Watershed A – Peak Flow Rate of Runoff
Condition
Peak Flow Rate of Runoff (cfs)
2-year 10-year 100-year
Existing Conditions 0.54 2.01 6.00
Proposed Conditions 0.28 0.99 4.15
Difference -0.26 -1.02 -1.85
Table 3: Watershed A – Stormwater Volume
Condition
Stormwater Volume (ac-ft)
2-year 10-year 100-year
Existing Conditions 0.071 0.203 0.561
Proposed Conditions 0.037 0.104 0.317
Difference -0.034 -0.099 -0.244
The tables above demonstrate that the post-development stormwater peak flow rates and volumes are lessthan existing conditions for the 2-, 10- and 100- year storm events.

SJG – BL England (225616) 4-1 Woodard & CurranUpper Township, New Jersey June 2014
4. SOIL EROSION AND SEDIMENTATION CONTROL
Soil erosion and sedimentation control measures will be installed, inspected and maintained at the Site inaccordance with the standards set forth in the Soil Erosion and Sediment Control Act, N.J.S.A. 4:24-39.An Application for Soil Erosion and Sediment Control Plan Certification will be prepared and submittedto the Cape Atlantic Soil Conservation District for approval prior to the start of construction.
Prior to and during construction, the following temporary soil erosion and sedimentation control measureswill be constructed and maintained:
Perimeter Controls: A siltation barrier consisting of a filter fabric silt fence will be installed inadvance of construction along the perimeter of the Site in locations shown on the Site LayoutPlan (Appendix B). During construction, the barrier should be inspected weekly, immediatelyafter each runoff-producing rainfall event and at least daily during prolonged rainfall. Sedimentdeposits must be removed when the depth of sediment reaches approximately one-half the heightof the barrier.
Construction Entrance: A temporary construction entrance is proposed to prevent the tracking ofsediment off-Site. The entrance should be maintained in a condition that will prevent the trackingof sediment onto Mt. Pleasant-Tuckahoe Road right-of-way. The entrance should be inspectedweekly and after heavy rainfall events or use.

SJG – BL England (225616) 5-1 Woodard & CurranUpper Township, New Jersey June 2014
5. STORMWATER MANAGEMENT STANDARDS COMPLIANCE
This section discusses the project’s compliance with the 16 Items set forth in the Pinelands StormwaterChecklist. A summary of each Item is provided below (in italics) for reference purposes, and a descriptionregarding the project’s compliance with the standard is also provided in bold.
Item No 1: Calculations demonstrating that the proposed development meets one of the following threestormwater runoff rate standards:
Post-development hydrographs for the 2, 10 and 100-year storms of 24-hour duration will notexceed the predevelopment runoff hydrographs at any point in time [N.J.A.C. 7:50-6.84(a)6ii(1)].
Any increased stormwater runoff volume or change in stormwater runoff timing for the two (2),ten (10), and one hundred (100)-year storms will not increase flood damage at or downstream ofthe project Site.
The peak post-development runoff from the 2, 10 and 100-year storms will be 50%, 75% and 80%respectively of the pre-development peak rates for the same storms [N.J.A.C. 7:50- 6.84(a)6ii(3)].
The proposed drainage system has been designed such that there will be no increase in pre-development peak discharge rates and stormwater volumes for the 2, 10 and 100 year stormevents at the points of analysis.
Item No. 2: Calculations demonstrating that the total runoff volume generated from the net increase inimpervious surfaces by a 10-year storm of 24-hour duration will be retained and infiltrated on Site.
No new impervious surfaces are proposed; therefore calculations demonstrating that the totalrunoff volume generated from the net increase in impervious surfaces by a 10-year storm of 24-hour duration will be retained and infiltrated on Site are not required.
Item No. 3: Information (soil logs) demonstrating that the lowest point of infiltration of each structuralstormwater management measure (e.g. swales, basins, drywells) will meet the two foot separation to theseasonal high groundwater table (SHWT) standard.
Three soil evaluations were performed within the crushed stone infiltration area footprint inaccordance with Item No. 3 of the Pineland Commission’s Stormwater Checklist ReferenceGuide and are provided in Appendix C. The soil evaluation locations are depicted on Figure A.The separation distance between the bottom of crushed stone and the SHGWT will beapproximately 3.80 feet
Item No. 4: Information demonstrating that the proposed stormwater design will meet the wetland,required buffer to wetlands and surface water protection standards.
No wetlands or associated buffers are located on-Site.
SJG – BL England (225616) 5-2 Woodard & CurranUpper Township, New Jersey June 2014
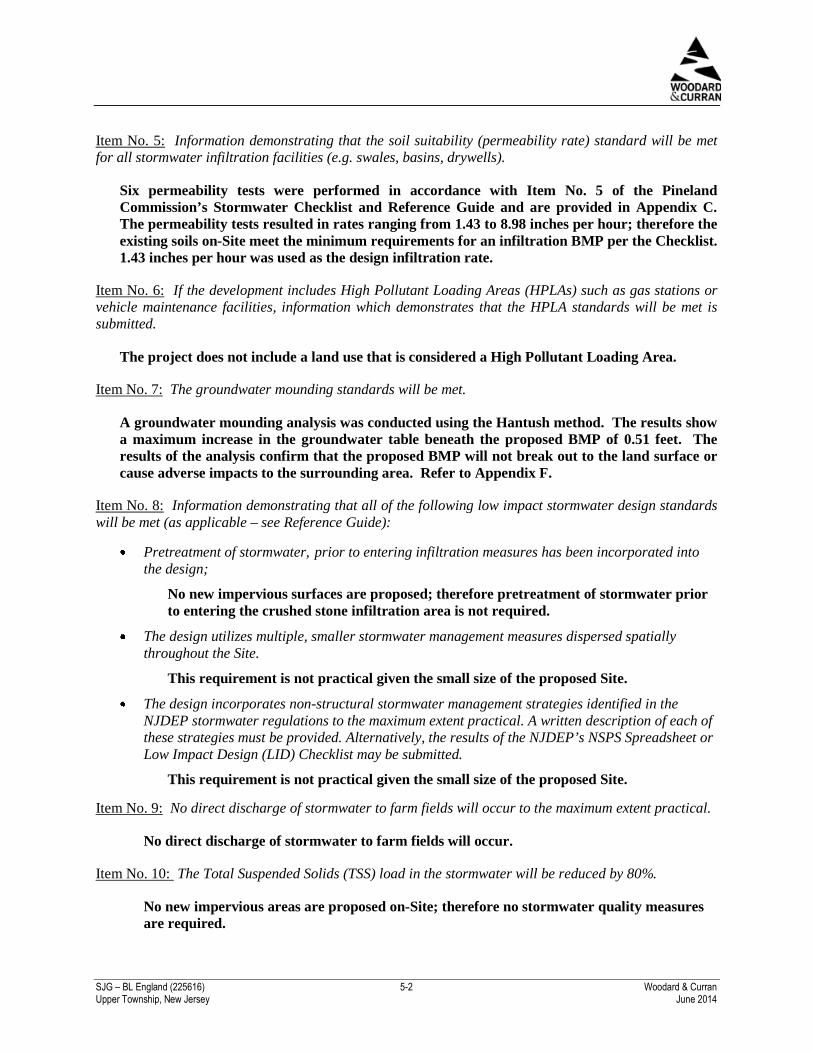
Item No. 5: Information demonstrating that the soil suitability (permeability rate) standard will be metfor all stormwater infiltration facilities (e.g. swales, basins, drywells).
Six permeability tests were performed in accordance with Item No. 5 of the PinelandCommission’s Stormwater Checklist and Reference Guide and are provided in Appendix C.The permeability tests resulted in rates ranging from 1.43 to 8.98 inches per hour; therefore theexisting soils on-Site meet the minimum requirements for an infiltration BMP per the Checklist.1.43 inches per hour was used as the design infiltration rate.
Item No. 6: If the development includes High Pollutant Loading Areas (HPLAs) such as gas stations orvehicle maintenance facilities, information which demonstrates that the HPLA standards will be met issubmitted.
The project does not include a land use that is considered a High Pollutant Loading Area.
Item No. 7: The groundwater mounding standards will be met.
A groundwater mounding analysis was conducted using the Hantush method. The results showa maximum increase in the groundwater table beneath the proposed BMP of 0.51 feet. Theresults of the analysis confirm that the proposed BMP will not break out to the land surface orcause adverse impacts to the surrounding area. Refer to Appendix F.
Item No. 8: Information demonstrating that all of the following low impact stormwater design standardswill be met (as applicable – see Reference Guide):
Pretreatment of stormwater, prior to entering infiltration measures has been incorporated intothe design;
No new impervious surfaces are proposed; therefore pretreatment of stormwater priorto entering the crushed stone infiltration area is not required.
The design utilizes multiple, smaller stormwater management measures dispersed spatiallythroughout the Site.
This requirement is not practical given the small size of the proposed Site.
The design incorporates non-structural stormwater management strategies identified in theNJDEP stormwater regulations to the maximum extent practical. A written description of each ofthese strategies must be provided. Alternatively, the results of the NJDEP’s NSPS Spreadsheet orLow Impact Design (LID) Checklist may be submitted.
This requirement is not practical given the small size of the proposed Site.
Item No. 9: No direct discharge of stormwater to farm fields will occur to the maximum extent practical.
No direct discharge of stormwater to farm fields will occur.
Item No. 10: The Total Suspended Solids (TSS) load in the stormwater will be reduced by 80%.
No new impervious areas are proposed on-Site; therefore no stormwater quality measuresare required.

SJG – BL England (225616) 5-3 Woodard & CurranUpper Township, New Jersey June 2014
Item No. 11: Stormwater management measures have been designed to reduce the nutrient load in thestormwater runoff from the post-developed Site to the maximum extent practical.
The majority of stormwater runoff from the Site will be stored within the crushed stoneinfiltration area prior to infiltration. Runoff from the western most portions of the Site tothe Mount Pleasant-Tuckahoe Road right-of-way will be from the perimeter grassed areas.The crushed stone infiltration area will function as a pervious pavement. Per Table 4.2 ofthe New Jersey BMP Manual, pervious paving provides a Total Phosphorous Removal Rateof 60% and a Total Nitrogen Removal Rate of 50%.
Item No. 12: The development will meet the groundwater recharge standards
No new impervious areas are proposed on-Site; therefore groundwater recharge measuresare not required.
Item No. 13: The stormwater management plan addresses stormwater facilities construction and as-builtrequirement standards.
A sequence of construction and as-built requirements are outlined on the Site Plans. Referto Appendix B.
Item No. 14: The proposed stormwater management measures meet structural design standards.
The proposed BMP has been designed in accordance with the New Jersey DEP BMPManual to the extent practicable. The crushed stone infiltration area is designed to drainthe total runoff volume generated by the systems maximum design storm within 72 hours.Refer to Appendix F for the system drawdown calculations.
Item No. 15: The development meets stormwater facility safety standards.
Stormwater facility safety standards are not applicable to the proposed BMP.
Item No. 16: A stormwater facilities maintenance plan is provided.
A Stormwater Management System Operation & Maintenance Plan is provided inAppendix H.

SJG – BL England (225616) Woodard & CurranUpper Township, New Jersey June 2014
Figure 1: Site Locus Map

SITE
WOODARDCURRAN COMMITMENT & INTEGRITY DRIVE RESULTS
| www.woodardcurran.com877.786.8881EAST WINDSOR, NEW JERSEY 0852050 MILLSTONE ROAD

SJG – BL England (225616) Woodard & CurranUpper Township, New Jersey June 2014
Figure 2: Pre-Development Watershed Map

FIGURE 2
NOT FOR CONSTRUCTION
PLAN ISSUED FOR PERMITTING ONLY
WOO
DARD
CURR
ANCO
MMIT
MENT
& IN
TEGR
ITY
DRIV
E RE
SULT
S
50 M
illsto
ne R
oad,
Bui
ldin
g 30
0Ea
st W
inds
or, N
ew Je
rsey
0852
087
7.786
.8881
| w
ww.w
ooda
rdcu
rran.
com

SJG – BL England (225616) Woodard & CurranUpper Township, New Jersey June 2014
Figure 3: Post-Development Watershed Map
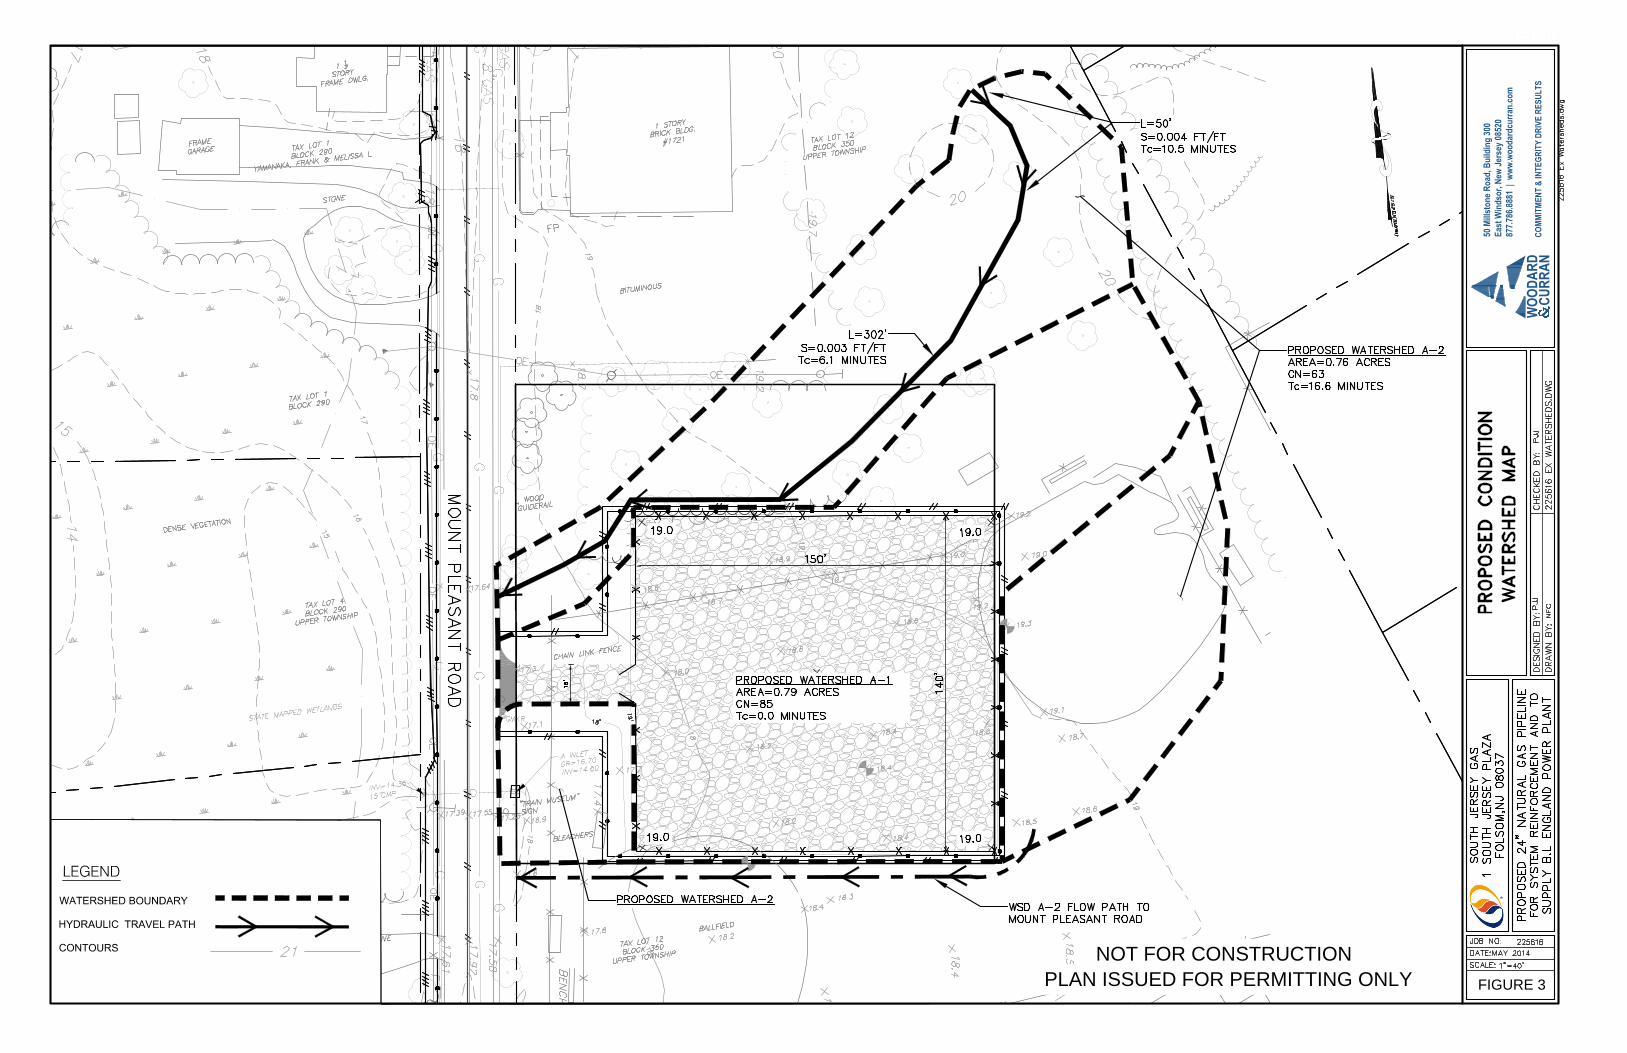
FIGURE 3
NOT FOR CONSTRUCTION
PLAN ISSUED FOR PERMITTING ONLY
WOO
DARD
CURR
ANCO
MMIT
MENT
& IN
TEGR
ITY
DRIV
E RE
SULT
S
50 M
illsto
ne R
oad,
Bui
ldin
g 30
0Ea
st W
inds
or, N
ew Je
rsey
0852
087
7.786
.8881
| w
ww.w
ooda
rdcu
rran.
com

SJG – BL England (225616) Woodard & CurranUpper Township, New Jersey June 2014
Figure 4: FEMA FIRMETTE


SJG – BL England (225616) Woodard & CurranUpper Township, New Jersey June 2014
APPENDIX A : PINELANDS COMMISSION STORMWATERCHECKLIST

STORMWATER CHECKLIST
1 6/26/09
(Part 1)
Stormwater Management Information Required to Be Submitted toCommission and Municipality for Review
The following checklist identifies the stormwater management standards that an applicantmust address to complete an application with the Pinelands Commission and theconcerned municipality (each “Item #” is cross-referenced in the attached ReferenceGuide).
Note that the stormwater management standards need not be addressed if either:
The proposed development is minor residential development, resulting in lessthan five lots or dwelling units, and the development does not involve theconstruction of any new roads; OR
The development proposed is minor non-residential development, and thedevelopment does not involve the grading, clearing or disturbance of an area inexcess of 5,000 square feet within any five-year period.
Item Addressed Description#
1. Calculations demonstrating that the proposed development meetsone of the following three stormwater runoff rate standards:
Post-development hydrographs for the 2, 10 and 100-yearstorms of 24-hour duration will not exceed the predevelopmentrunoff hydrographs at any point in time [N.J.A.C. 7:50-6.84(a)6ii(1)].No increase in pre-development rates from the 2, 10 and 100year storms will occur. In addition, any increase in stormwatervolume for these storms will not increase flood damage at ordownstream of the parcel [N.J.A.C. 7:50-6.84(a)6ii(2)].The peak post-development runoff from the 2, 10 and 100-yearstorms will be 50%, 75% and 80% respectively of the pre-development peak rates for the same storms [N.J.A.C. 7:50-6.84(a)6ii(3)].
2. NA Calculations demonstrating that the total runoff volume generatedfrom the net increase in impervious surfaces by a 10-year storm of24-hour duration will be retained and infiltrated on site.
NA (No new impervious surfaces are proposed)3. Information (soil logs) demonstrating that the lowest point of
infiltration of each structural stormwater management measure(e.g. swales, basins, drywells) will meet the two foot separation to

2 6/26/09
Item Addressed Description#
the seasonal high water table (SHWT) standard.4. NA Information demonstrating that the proposed stormwater design
will meet the wetland, required buffer to wetlands and surfacewater protection standards.
NA (No wetlands or setbacks located on site)5. Information demonstrating that the soil suitability (permeability
rate) standard will be met for all stormwater infiltration facilities(e.g. swales, basins, drywells).
6. NA If the development includes High Pollutant Loading Areas(HPLAs) such as gas stations or vehicle maintenance facilities,information which demonstrates that the HPLA standards will bemet is submitted.
7. The groundwater mounding standards will be met.
8. NA Information demonstrating that all of the following low impactstormwater design standards will be met (as applicable – seeReference Guide):
NA Pretreatment of stormwater, prior to entering infiltrationmeasures, has been incorporated into the design.
NA The design utilizes multiple, smaller stormwater managementmeasures dispersed spatially throughout the site.
NA The design incorporates non-structural stormwater managementstrategies identified in the NJDEP stormwater regulations to themaximum extent practical. A written description of each ofthese strategies must be provided. Alternatively, the results ofthe NJDEP’s NSPS Spreadsheet or Low Impact Design (LID)Checklist may be submitted.

3 6/26/09
(PART 2)
Additional Stormwater Management Information Required to Be
Submitted to Municipality for Review
The following checklist identifies certain stormwater management standards that anapplicant must address with the municipality (each “Item #” is cross-referenced in theattached Reference Guide). Note that there may be additional information that is requiredby a municipal ordinance that is not identified in this Pinelands Commission Checklistand Reference Guide.
Item Addressed Description#
9. NA No direct discharge of stormwater to farm fields will occur to themaximum extent practical.
10. NA The Total Suspended Solids (TSS) load in the stormwater will bereduced by 80%.
NA (No new impervious surfaces are proposed)11. NA Stormwater management measures have been designed to reduce
the nutrient load in the stormwater runoff from the post-developedsite to the maximum extent practical.
NA (No new impervious surfaces are proposed)12. NA The development will meet the groundwater recharge standards.
NA (No new impervious surfaces are proposed)13. The stormwater management plan addresses stormwater facilities
construction and as-built requirement standards.
14. The proposed stormwater management measures meet structuraldesign standards.
15. NA The development meets stormwater facility safety standards.
16. A stormwater facilities maintenance plan is provided.

4 6/26/09
REFERENCE GUIDE
Each Item # identified in Part 1 and Part 2 (the Checklists) corresponds to the Item # inthis Reference Guide.
Item #1. The CMP [NJAC 7:50-6.84(a)6ii] provides that stormwater managementrunoff rate standards may be met through one of the following three options:
I. Demonstrate that the post-developed stormwater runoff hydrographs from theproject site for the 2, 10, and 100-year storms do not exceed, at any point intime, the site’s pre-developed runoff hydrographs for the same storms [(NJAC7:50-6.84(a)6ii(1)]; orII. Demonstrate that under post-developed site conditions [(NJAC 7:50-6.84(a)6ii(2)]:
a. There is no increase in pre-developed stormwater runoff ratesfrom the project site for the two (2), ten (10), and one hundred(100)-year storms; and
b. Any increased stormwater runoff volume or change instormwater runoff timing for the two (2), ten (10), and onehundred (100)-year storms will not increase flood damage ator downstream of the project site; or
III. Demonstrate that the peak post-developed stormwater runoff rates from theproject site for the two (2), ten (10) and one hundred (100) year storms are fifty,seventy-five and eighty percent (50%, 75% and 80%), respectively, of the site’speak pre-developed stormwater runoff rates for the same storms [(NJAC 7:50-6.84(a)6ii(3)]. Peak outflow rates from onsite stormwater measures for thesestorms shall be adjusted where necessary to account for the discharge ofincreased stormwater runoff rates and/or volumes from project site areas notcontrolled by the onsite measures. These percentages do not have to be appliedto those portions of the parcel where development is not currently proposed,provided that such areas:
a. Are protected from future development by imposition of aconservation easement, deed restriction, or other acceptablelegal measures; or
b. Are subject to review under these standards if they areproposed for any degree of development in the future.
WHAT TO SUBMIT TO THE COMMISSION AND MUNICIPALITY:
___ A stormwater management plan prepared as follows:a. Runoff rates and volumes calculated in accordance with TR-
55 and which utilizes an appropriate hydrograph. Analternative method may be utilized, provided that

5 6/26/09
information is submitted which demonstrates that themethods of the alternative method are at least as protectiveas the NRCS methodology.
b. Stormwater runoff calculated by separately calculating thencombining runoff from pervious and directly connectedimpervious areas within each drainage area.
c. Calculations of runoff from unconnected impervioussurfaces, based on the Two-Step Method described in theNJDEP’s BMP Manual.
d. Rainfall data in the stormwater calculations shall useappropriate 24-hour rainfall depths as developed for theproject site by the National Oceanic and AtmosphericAdministration, available online at:http://hdsc.nws.noaa.gov/hdsc/pfds/index.html.
e. Pre-development runoff CN values have been assumed to bewoods in good condition, or follow standard criteria notedin the NJDEP Stormwater Regulations (N.J.A.C. 7:85.6(a)2) as follows:
When selecting or calculating Runoff Curve Numbers (CNs) forpre-developed project site conditions, the project site’s landcover shall be assumed to be woods in good condition. Anotherland cover may be used to calculate runoff coefficients if suchland cover has existed at the site or portion thereof withoutinterruption for at least five (5) years immediately prior to thetime of application and the design engineer can document thecharacter and extent of such land cover through the use ofphotographs, affidavits, and/or other acceptable land userecords. If more than one land cover has existed on the siteduring the five (5) years immediately prior to the time ofapplication, the land cover with the lowest runoff potential shallbe used for the computations. All pre-developed land coversshall be assumed to be in good hydrologic condition and, ifcultivated, shall be assumed to have conservation treatment.
Where tailwater will affect the hydraulic performance of astormwater management measure, the design engineer shallinclude such effects in the measure’s design.
f. In calculating pre-developed site stormwater runoff, thedesign engineer shall include the effects of all land featuresand structures such as ponds, wetlands, depressions,hedgerows, and culverts that affect pre-developed sitestormwater runoff rates and/or volumes.
g. Calculations submitted for the purposes of demonstratingconsistency with the stormwater volume and rate standardsof the CMP shall not include any credit for infiltration inany stormwater BMP during the 2, 10 or 100–year stormevents.

6 6/26/09
h. Pre and post-development drainage areas maps have beenprovided which identify the concentration pathways. Themaps and calculations include all applicable off-site and on-site areas.
i. Tc and CN calculat ions have been provided.j. Information is provided for each stormwater management
measure which demonstrates how each was designed inaccordance with the guidance provided by the NJDEP’sBMP Manual.
___ Identify which of the three above noted stormwater rate provisions is beingaddressed to meet the stormwater runoff standards [NJAC 7:50-6.84(a)6ii(1, 2or 3)].
___ A written narrative to accompany the above calculations describing themethod that was utilized to complete the calculations and that includes the sizeof each drainage area, the pre-development runoff rates of each drainage area,the post-development runoff rates and volumes generated, the routed rates andvolume of runoff for each storm event.
___ If proposing to demonstrate compliance utilizing NJAC 7:50-6.84(a)6ii(1),applicants must provide copies of all pre- and post-development hydrographs.NA If proposing to demonstrate compliance utilizing NJAC 7:50-6.84(a)6ii(2),applicants must provide a build-out analysis for each of the affected drainageareas. When performing this analysis for pre-developed site conditions, all off-site development levels must reflect existing conditions. When performing thisanalysis for post-developed site conditions, all off-site development levels mustreflect full development of the affected drainage area in accordance with currentzoning and land use ordinances.NA If proposing to address the stormwater runoff rate standards utilizing NJAC7:50-6.84(a)6ii(3), applicants must provide the post development runoff ratereductions for the 2, 10 and 100 year storms (minimum reductions of 50%, 75%and 80%, respectively). If portions of the parcel are not included in the ratecalculations because they will remain vacant, the applicant must either:
a. Indicate whether a recorded deed restriction will be imposedon that portion of the site not to be developed, or
b. Provide a note on the plans indicating that any developmentproposed in these areas in the future must meet thestormwater standards in place at that time.
Item#2. The total runoff volume generated from the net increase in impervioussurfaces by a ten (10) year, twenty-four (24) hour storm shall be retained and infiltratedonsite [NJAC 7:50-6.84(a)6iii(1)].
WHAT TO SUBMIT TO THE COMMISSION AND MUNICIPALITY:
NA A written description of the amount of pre-and post developmentimpervious area as defined by Table 2-2a in TR-55 within each drainage area
7 6/26/09
along with a calculation of the required volume of stormwater that must beretained to meet this standard.NA Volume tables for each stormwater management measure that includes thevolume retained to the elevation of the lowest outlet.NA Information which demonstrates compliance with volume infiltration andretention standard. The submitted report must demonstrate that the proposedretention/infiltration facilities can retain and infiltrate the volume generatedfrom the net increase in impervious surfaces by a ten (10) year, twenty-four (24)hour storm.
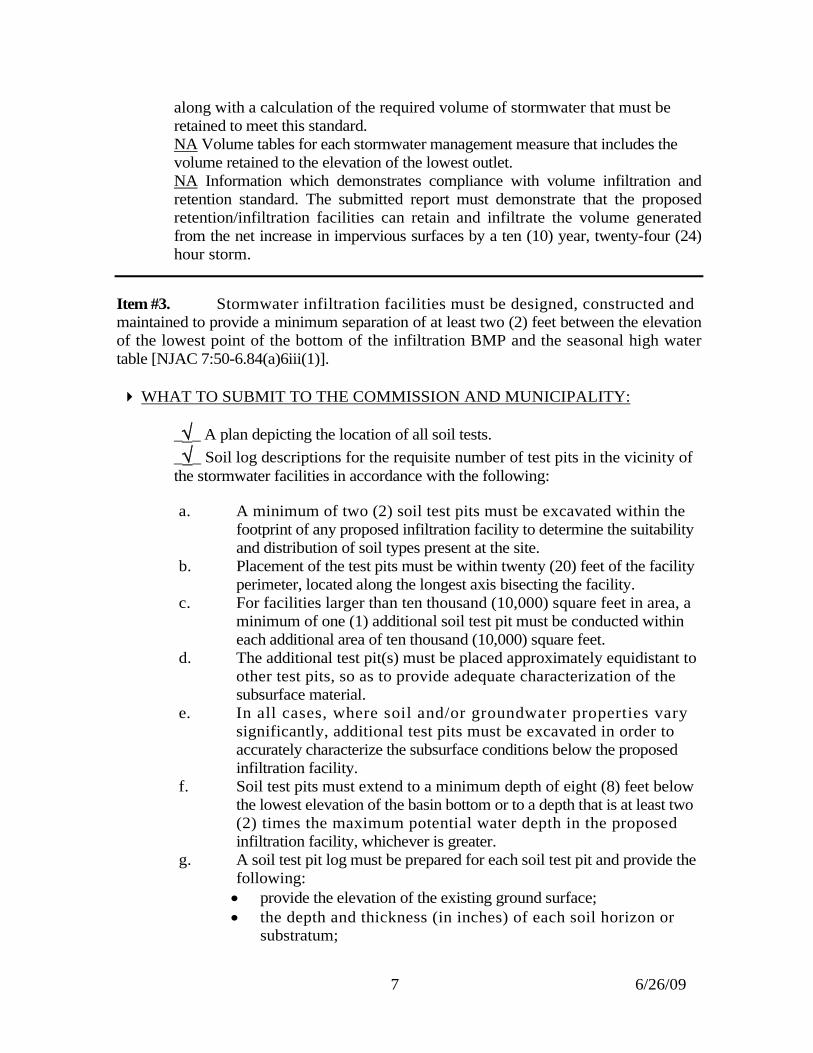
Item #3. Stormwater infiltration facilities must be designed, constructed andmaintained to provide a minimum separation of at least two (2) feet between the elevationof the lowest point of the bottom of the infiltration BMP and the seasonal high watertable [NJAC 7:50-6.84(a)6iii(1)].
WHAT TO SUBMIT TO THE COMMISSION AND MUNICIPALITY:
__ A plan depicting the location of all soil tests.
__ Soil log descriptions for the requisite number of test pits in the vicinity ofthe stormwater facilities in accordance with the following:
a. A minimum of two (2) soil test pits must be excavated within thefootprint of any proposed infiltration facility to determine the suitabilityand distribution of soil types present at the site.
b. Placement of the test pits must be within twenty (20) feet of the facilityperimeter, located along the longest axis bisecting the facility.
c. For facilities larger than ten thousand (10,000) square feet in area, aminimum of one (1) additional soil test pit must be conducted withineach additional area of ten thousand (10,000) square feet.
d. The additional test pit(s) must be placed approximately equidistant toother test pits, so as to provide adequate characterization of thesubsurface material.
e. In all cases, where soil and/or groundwater properties varysignificantly, additional test pits must be excavated in order toaccurately characterize the subsurface conditions below the proposedinfiltration facility.
f. Soil test pits must extend to a minimum depth of eight (8) feet belowthe lowest elevation of the basin bottom or to a depth that is at least two(2) times the maximum potential water depth in the proposedinfiltration facility, whichever is greater.
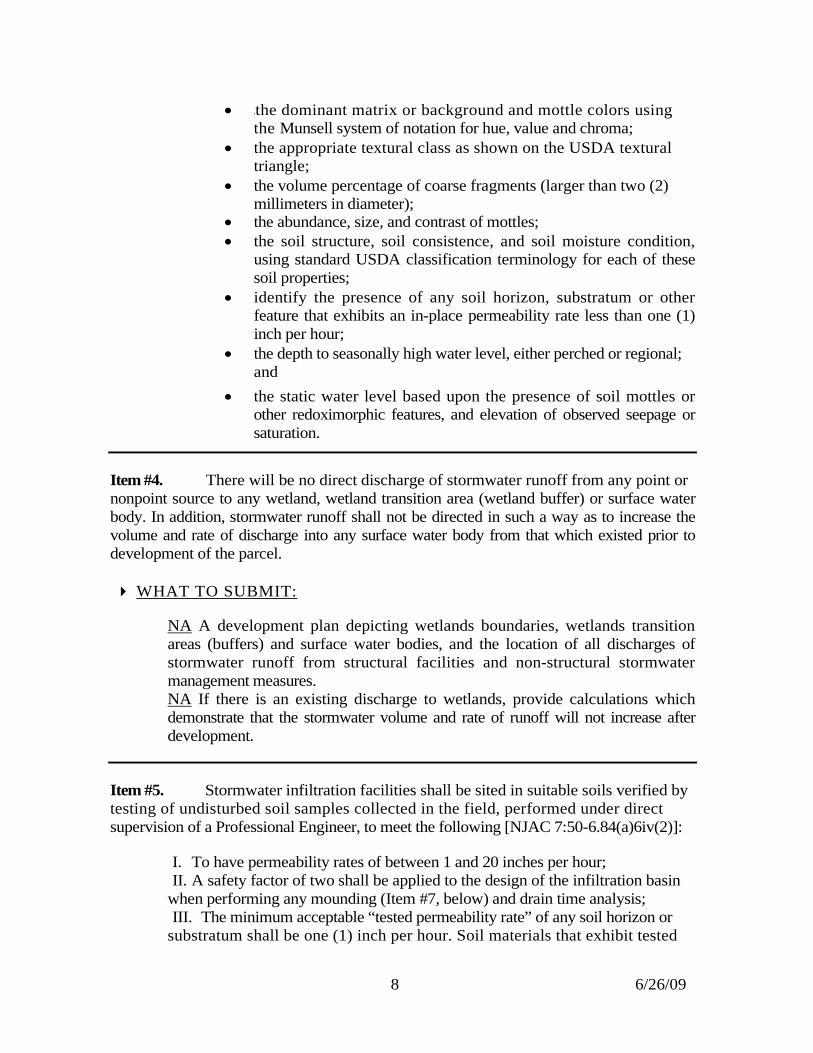
g. A soil test pit log must be prepared for each soil test pit and provide thefollowing: provide the elevation of the existing ground surface; the depth and thickness (in inches) of each soil horizon or
substratum;
8 6/26/09
•the dominant matrix or background and mottle colors usingthe Munsell system of notation for hue, value and chroma;
the appropriate textural class as shown on the USDA texturaltriangle;
the volume percentage of coarse fragments (larger than two (2)millimeters in diameter);
the abundance, size, and contrast of mottles; the soil structure, soil consistence, and soil moisture condition,
using standard USDA classification terminology for each of thesesoil properties;
identify the presence of any soil horizon, substratum or otherfeature that exhibits an in-place permeability rate less than one (1)inch per hour;
the depth to seasonally high water level, either perched or regional;and
the static water level based upon the presence of soil mottles orother redoximorphic features, and elevation of observed seepage orsaturation.
Item #4. There will be no direct discharge of stormwater runoff from any point ornonpoint source to any wetland, wetland transition area (wetland buffer) or surface waterbody. In addition, stormwater runoff shall not be directed in such a way as to increase thevolume and rate of discharge into any surface water body from that which existed prior todevelopment of the parcel.
WHAT TO SUBMIT:
NA A development plan depicting wetlands boundaries, wetlands transitionareas (buffers) and surface water bodies, and the location of all discharges ofstormwater runoff from structural facilities and non-structural stormwatermanagement measures.NA If there is an existing discharge to wetlands, provide calculations whichdemonstrate that the stormwater volume and rate of runoff will not increase afterdevelopment.
Item #5. Stormwater infiltration facilities shall be sited in suitable soils verified bytesting of undisturbed soil samples collected in the field, performed under directsupervision of a Professional Engineer, to meet the following [NJAC 7:50-6.84(a)6iv(2)]:
I. To have permeability rates of between 1 and 20 inches per hour;II. A safety factor of two shall be applied to the design of the infiltration basin
when performing any mounding (Item #7, below) and drain time analysis;III. The minimum acceptable “tested permeability rate” of any soil horizon or
substratum shall be one (1) inch per hour. Soil materials that exhibit tested

9 6/26/09
permeability rates slower than one (1) inch per hour shall be consideredunsuitable for stormwater infiltration. The maximum reportable “testedpermeability rate” of any soil horizon or substratum shall be no greater thantwenty (20) inches per hour regardless of the rate attained in the test procedure;IV. If the maximum permeability rate of 20 inches per hour cannot be met but
will be exceeded, stormwater must first be routed through a bioretention systemprior to infiltration or soil replacement may be proposed; andV. If the soils are slower than one (1) inch per hour and the soils cannot be
replaced with suitable soils, the infiltration facility may be required to berelocated.
WHAT TO SUBMIT TO THE COMMISSION AND MUNICIPALITY:
___ Results of permeability testing of undisturbed soil samples from the fieldtaken below the bottom elevation of each stormwater management measure.Permeability tests must follow the methodologies outlined in the municipal landuse ordinances.
___ A minimum of one (1) permeability test shall be performed at each soiltest pit location. The soil permeability rate shall be determined using testmethodology as prescribed in NJAC 7:9A-6.2 (Tube Permeameter Test), 6.5 (PitBailing Test) or 6.6 (Piezometer Test). When the tube permeameter test is used,a minimum of two replicate samples shall be taken and tested. Alternativepermeability test procedures may be accepted by the approving authorityprovided the test procedure attains saturation of surrounding soils, accounts forhydraulic head effects on infiltration rates, provides a permeability rate withunits expressed in inches per hour and is accompanied by a published sourcereference.
___ A plan containing cross section detail(s) of all stormwater BMPs alongsidesoil profile descriptions (to scale).
Item #6. The High Pollutant Loading Area (HPLA) standards apply where theproposed development includes areas that are defined as HPLAs in NJDEP stormwaterregulations (NJAC 7:8-5.4(a)2iii(1)). HPLAs include areas in industrial and commercialdevelopment where solvents, and/or petroleum products are loaded, unloaded, stored orapplied; areas where pesticides are loaded, unloaded, or stored; areas where hazardousmaterials are expected to be present in greater than ‘reportable quantities’ as defined bythe USEPA at CFR 302.4; areas where recharge would be inconsistent with NJDEPapproved remedial action work plan or landfill closure plan; areas of high risk for spillsof toxic materials such as gas stations and vehicle maintenance facilities and areas ofindustrial stormwater exposed to “source material.”
Where stormwater runoff is exposed to high pollutant source material, the stormwatermanagement plan shall demonstrate the following design criteria are met [NJAC 7:50-6.84(a)6iii(2)]:

10 6/26/09
I. The extent of the areas described as HPLAs have been minimized on thedevelopment site to the maximum extent practicable;II. The stormwater runoff from the areas described as HPLAs are segregated tothe maximum extent practicable from the stormwater runoff generated from theremainder of the site such that co-mingling of the stormwater runoff from theareas described as HPLAs and the remainder of the site will be minimized;III. The amount of precipitation falling directly on the areas described asHPLAs are minimized to the maximum extent practicable by means of a canopy,roof or other similar structure that reduces the generation of stormwater runoff;IV. The stormwater runoff from, or co-mingled with, the areas described asHPLAs for the Water Quality Design Storm, shall be subject to pretreatment byone or more of the following stormwater BMPs, designed in accordance with theNew Jersey BMP Manual to provide 90 % TSS removal:
a. Bioretention system;b. Sand filter;c. Wet ponds which shall be hydraulically disconnected by a
minimum of 2 feet of vertical separation from the seasonal highwater table and shall be designed to achieve a minimum 80% TSSremoval rate;
d. Constructed stormwater wetlands; and/orc. Media filtration system manufactured treatment device with a
minimum 80% TSS removal as verified by the New JerseyCorporation for Advanced Technology and as certified by NJDEP.
V. If the potential for contamination of stormwater runoff by petroleum productsexists onsite, prior to being conveyed to the pretreatment BMP required in IV.above, the stormwater runoff from the areas described in I. and II. above shall beconveyed through an oil/grease separator or other equivalent manufacturedfiltering device to remove the petroleum hydrocarbons. The applicant mustprovide the Commission with sufficient data to demonstrate acceptableperformance of the device.
WHAT TO SUBMIT TO THE COMMISSION AND MUNICIPALITY:
NA A plan clearly identifying the areas on-site that are HPLAs.NA A description in writing or on the plans that identifies the actions taken tominimize these areas.NA Documentation that demonstrates how the stormwater from the HPLA onthe site will meet the 90% TSS removal standard (refer to Item #10, below andAppendix 1).
Item#7. Groundwater mounds resulting from the infiltration of stormwater shallnot cause stormwater or groundwater to breakout to the land surface or cause adverseimpacts to adjacent water bodies, wetlands or subsurface structures including, but notlimited to, basements and septic systems [NJAC 7:50-6.84(a)6iv(3)].

11 6/26/09
AT A MINIMUM, SUBMIT THE FOLLOWING TO THE MUNICIPALITY:
___ A groundwater mounding analysis which considers the maximum designstorm and, if the stormwater recharge facility is located near wetlands, theeffects of any Radius of Influence (ROI) of the recharge facility on the wetlands.The analysis must provide specific conclusions as to whether each proposedrecharge facility will cause stormwater or groundwater to breakout to the landsurface or cause adverse impacts to adjacent water bodies, wetlands orsubsurface structures including, but not limited to, basements and septicsystems. The Professional Engineer’s Groundwater Mounding AnalysisCertification found in Appendix 2 may be utilized. Please note that if anapplicant elects to submit the Certification, the municipality may require a moredetailed analysis.
Item #8. To the maximize extent practical, stormwater management measures shallbe designed to limit site disturbance, maximize stormwater management efficiencies,maintain or improve aesthetic conditions and incorporate pretreatment as a means ofextending the functional life and increasing pollutant removal capacity of structuralmanagement facilities. The use of stormwater management measures that are usingnatural, non-wetland wooded depressions, or multiple infiltration facilities that aresmaller in size, and distributed spatially throughout a parcel, rather than the use of asingle larger structural stormwater management measure, shall be required to themaximum extent practical [NJAC 7:50-6.84(a)6iv(4)].
For all major development greater than one acre of disturbance or new impervioussurface exceeding 1/4 acre, the following nine (9) nonstructural NJDEP BMPs forstormwater management must be addressed to the maximum extent practical [NJAC 7:8-5.3]:
I. Protect areas that provide water quality benefits or areas particularlysusceptible to erosion and sediment loss;II. Minimize impervious surfaces and break up or disconnect the flow of runoff
over impervious surfaces;III. Maximize the protection of natural drainage features and vegetation;IV.Minimize the decrease in the pre-development time of concentration;V. Minimize land disturbance including clearing and grading;VI.Minimize soil compaction and all other soil disturbance;VII. Provide low-maintenance landscaping that provides for the retention and
planting of native plants and minimizes the use of lawns, fertilizers andpesticides, in accordance with NJAC 7:50-6.24;VIII. Provide vegetated open-channel conveyance systems discharging into and
through stable vegetated areas; andIX. Provide other source controls to prevent or minimize the use or exposure of
pollutants at the site in order to prevent or minimize the release of those
12 6/26/09
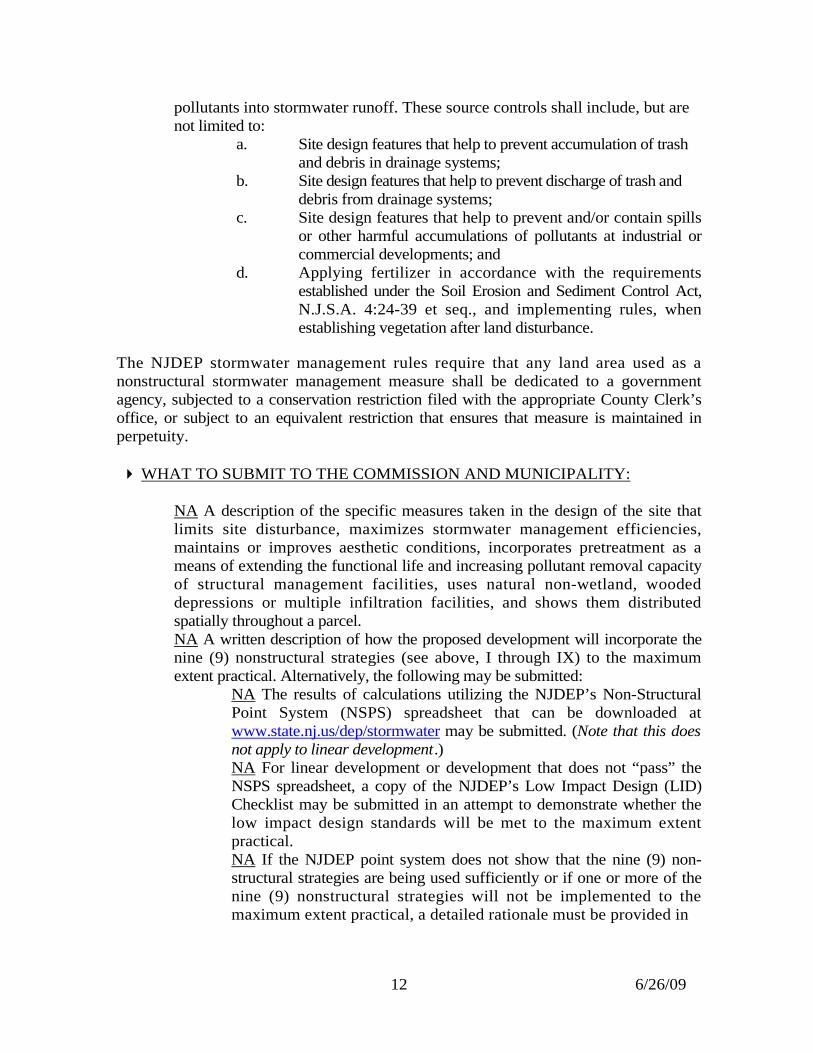
pollutants into stormwater runoff. These source controls shall include, but arenot limited to:
a. Site design features that help to prevent accumulation of trashand debris in drainage systems;
b. Site design features that help to prevent discharge of trash anddebris from drainage systems;
c. Site design features that help to prevent and/or contain spillsor other harmful accumulations of pollutants at industrial orcommercial developments; and
d. Applying fertilizer in accordance with the requirementsestablished under the Soil Erosion and Sediment Control Act,N.J.S.A. 4:24-39 et seq., and implementing rules, whenestablishing vegetation after land disturbance.
The NJDEP stormwater management rules require that any land area used as anonstructural stormwater management measure shall be dedicated to a governmentagency, subjected to a conservation restriction filed with the appropriate County Clerk’soffice, or subject to an equivalent restriction that ensures that measure is maintained inperpetuity.
WHAT TO SUBMIT TO THE COMMISSION AND MUNICIPALITY:
NA A description of the specific measures taken in the design of the site thatlimits site disturbance, maximizes stormwater management efficiencies,maintains or improves aesthetic conditions, incorporates pretreatment as ameans of extending the functional life and increasing pollutant removal capacityof structural management facilities, uses natural non-wetland, woodeddepressions or multiple infiltration facilities, and shows them distributedspatially throughout a parcel.NA A written description of how the proposed development will incorporate thenine (9) nonstructural strategies (see above, I through IX) to the maximumextent practical. Alternatively, the following may be submitted:
NA The results of calculations utilizing the NJDEP’s Non-StructuralPoint System (NSPS) spreadsheet that can be downloaded atwww.state.nj.us/dep/stormwater may be submitted. (Note that this doesnot apply to linear development.)NA For linear development or development that does not “pass” theNSPS spreadsheet, a copy of the NJDEP’s Low Impact Design (LID)Checklist may be submitted in an attempt to demonstrate whether thelow impact design standards will be met to the maximum extentpractical.NA If the NJDEP point system does not show that the nine (9) non-structural strategies are being used sufficiently or if one or more of thenine (9) nonstructural strategies will not be implemented to themaximum extent practical, a detailed rationale must be provided in

13 6/26/09
writing which establishes a basis for the contention that maximal use ofthe strategy is not practicable on the site.
NA A plan which specifically identifies all proposed LID strategies including allareas of vegetated conveyance.NA A description of how all non-structural strategies will be preserved andmaintained in perpetuity pursuant to N.J.A.C. 7:8-5.3(c).
Note: One of the techniques that has been advocated to meet the low impact stormwaterdesign standards is to reduce the number of units. The Pinelands Commission does notadvocate this approach.
Item #9. There will be no direct discharge of stormwater to farmland to themaximum extent practical [NJAC 7:50-6.84(a)6ii(5)].
AT A MINIMUM, SUBMIT THE FOLLOWING TO THE MUNICIPALITY:
NA A development plan which identifies any agricultural uses present on adjacentparcels, and includes the location of all discharges of stormwater runoff from structuralfacilities and non-structural measures. The plan must demonstrate that no direct dischargeof stormwater is occurring onto farmland to the maximum extent practical.
Item #10. Stormwater management measures shall be designed to reduce the totalsuspended solids (TSS) load in the stormwater runoff from the post-developed site byeighty percent (80%) expressed as an annual average [NJAC 7:8-5.5].
AT A MINIMUM, SUBMIT THE FOLLOWING TO THE MUNICIPALITY:
NA If NJDEP BMPs are utilized in the following calculations (“a” or “b”) forthe accepted TSS removal, refer to Appendix 1 of this reference guide.NA If the BMP measures utilized are not those noted in Appendix 1, refer to (c)below.NA Total Suspended Solids (TSS) Reduction Calculations: Total SuspendedSolids (TSS) Reduction Calculations for the parcel are to be completed asfollows:a. If more than one stormwater BMP in series is necessary to achieve the
required eighty percent (80%) TSS reduction for a site, the applicant shallutilize the following formula to calculate TSS reduction:
R = A + B – (A x B) / 100, where:R = total TSS percent load removal from application of both BMPs;A = the TSS percent removal rate applicable to the first BMP; andB = the TSS percent removal rate applicable to the second BMP.

14 6/26/09
b. If there is more than one onsite drainage area, the eighty percent (80%)TSS removal rate shall apply to each drainage area, unless the runofffrom the subareas converge on site, in which case the removal rate canbe demonstrated through a calculation using a weighted average.
c. Alternative stormwater management measures, removal ratesand methods of calculating removal rates may be used if thedesign engineer provides documentation acceptable to the municipalitywhich demonstrates the suitability of these alternate measures, methodsand rates. Any alternative stormwater management measure, removalrate or method of calculating the removal rate shall be subject to approvalin writing by municipality and a copy shall be provided to the following:
The Division of Watershed Management, New Jersey Departmentof Environmental Protection, PO Box 418 Trenton, NJ, 08625-0418; and
The New Jersey Pinelands Commission, PO Box 7, New Lisbon,NJ, 08064.
Item #11. Stormwater management measures shall also be designed to reduce thenutrient load in the stormwater runoff from the post-developed site by the maximumextent practicable [NJAC 7:8-5.5(e)].
AT A MINIMUM, SUBMIT THE FOLLOWING TO THE MUNICIPALITY:
NA A written description of how this standard will be met (refer to Table 4.2 inthe NJDEP BMP Manual for guidance).
Item #12. Retain and recharge 100% of sites’ average annual groundwater rechargevolume [NJAC 7:8-5.4(a)2].
AT A MINIMUM, SUBMIT THE FOLLOWING TO THE MUNICIPALITY:
NA One of the following must be provided:a. Calculations using the NJDEP Groundwater Recharge Spreadsheet
(NJGRS), available in the NJ BMP Manual, Chapter 6 athttp://www.njstormwater.org/bmp_manual2.htm;
b. Calculations using the New Jersey Geological Survey Report GSR-32: Amethod for evaluating Groundwater Recharge Areas in New Jersey.Available at http://www.njgeology.org/geodata/dgs99-2.htm;
c. Calculate and recharge the difference in runoff volume between 2 yrstorms, pre and post development; and
d. An alternate method, if approved by the municipal engineer.
15 6/26/09
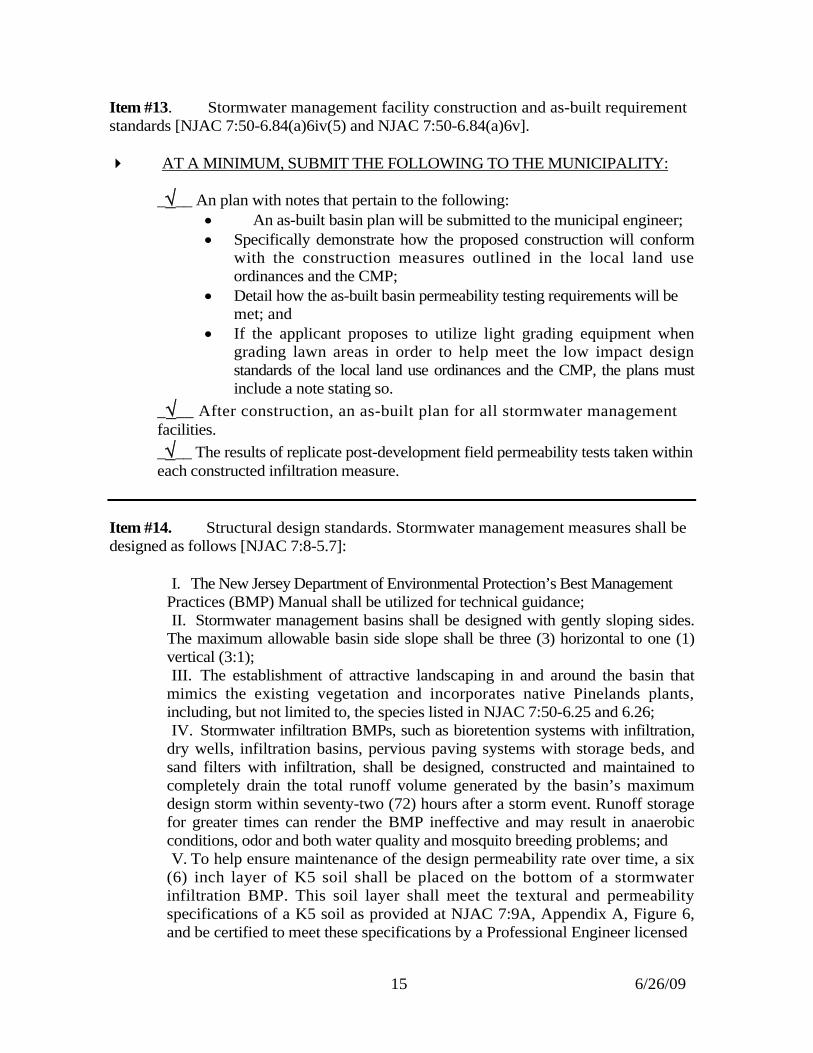
Item #13. Stormwater management facility construction and as-built requirementstandards [NJAC 7:50-6.84(a)6iv(5) and NJAC 7:50-6.84(a)6v].
AT A MINIMUM, SUBMIT THE FOLLOWING TO THE MUNICIPALITY:
___ An plan with notes that pertain to the following: An as-built basin plan will be submitted to the municipal engineer; Specifically demonstrate how the proposed construction will conform
with the construction measures outlined in the local land useordinances and the CMP;
Detail how the as-built basin permeability testing requirements will bemet; and
If the applicant proposes to utilize light grading equipment whengrading lawn areas in order to help meet the low impact designstandards of the local land use ordinances and the CMP, the plans mustinclude a note stating so.
___ After construction, an as-built plan for all stormwater managementfacilities.
___ The results of replicate post-development field permeability tests taken withineach constructed infiltration measure.
Item #14. Structural design standards. Stormwater management measures shall bedesigned as follows [NJAC 7:8-5.7]:
I. The New Jersey Department of Environmental Protection’s Best ManagementPractices (BMP) Manual shall be utilized for technical guidance;II. Stormwater management basins shall be designed with gently sloping sides.
The maximum allowable basin side slope shall be three (3) horizontal to one (1)vertical (3:1);III. The establishment of attractive landscaping in and around the basin that
mimics the existing vegetation and incorporates native Pinelands plants,including, but not limited to, the species listed in NJAC 7:50-6.25 and 6.26;IV. Stormwater infiltration BMPs, such as bioretention systems with infiltration,
dry wells, infiltration basins, pervious paving systems with storage beds, andsand filters with infiltration, shall be designed, constructed and maintained tocompletely drain the total runoff volume generated by the basin’s maximumdesign storm within seventy-two (72) hours after a storm event. Runoff storagefor greater times can render the BMP ineffective and may result in anaerobicconditions, odor and both water quality and mosquito breeding problems; andV. To help ensure maintenance of the design permeability rate over time, a six
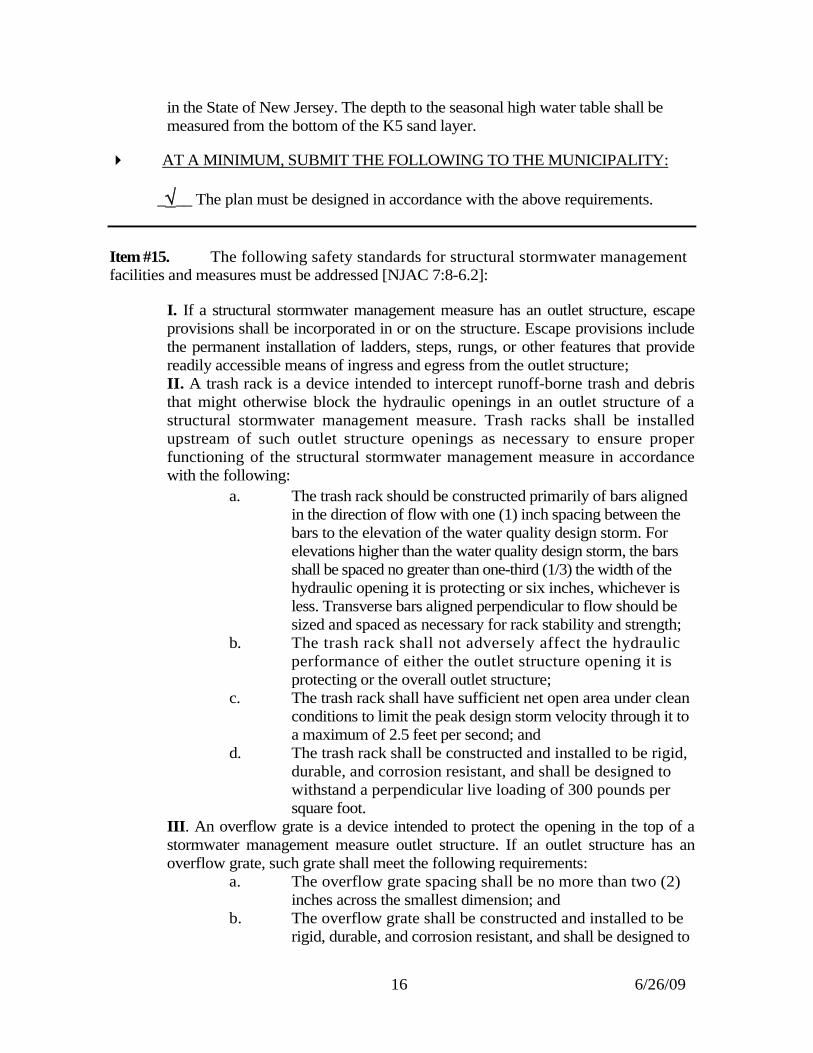
(6) inch layer of K5 soil shall be placed on the bottom of a stormwaterinfiltration BMP. This soil layer shall meet the textural and permeabilityspecifications of a K5 soil as provided at NJAC 7:9A, Appendix A, Figure 6,and be certified to meet these specifications by a Professional Engineer licensed
16 6/26/09
in the State of New Jersey. The depth to the seasonal high water table shall bemeasured from the bottom of the K5 sand layer.
AT A MINIMUM, SUBMIT THE FOLLOWING TO THE MUNICIPALITY:
___ The plan must be designed in accordance with the above requirements.
Item #15. The following safety standards for structural stormwater managementfacilities and measures must be addressed [NJAC 7:8-6.2]:
I. If a structural stormwater management measure has an outlet structure, escapeprovisions shall be incorporated in or on the structure. Escape provisions includethe permanent installation of ladders, steps, rungs, or other features that providereadily accessible means of ingress and egress from the outlet structure;II. A trash rack is a device intended to intercept runoff-borne trash and debristhat might otherwise block the hydraulic openings in an outlet structure of astructural stormwater management measure. Trash racks shall be installedupstream of such outlet structure openings as necessary to ensure properfunctioning of the structural stormwater management measure in accordancewith the following:
a. The trash rack should be constructed primarily of bars alignedin the direction of flow with one (1) inch spacing between thebars to the elevation of the water quality design storm. Forelevations higher than the water quality design storm, the barsshall be spaced no greater than one-third (1/3) the width of thehydraulic opening it is protecting or six inches, whichever isless. Transverse bars aligned perpendicular to flow should besized and spaced as necessary for rack stability and strength;
b. The trash rack shall not adversely affect the hydraulicperformance of either the outlet structure opening it isprotecting or the overall outlet structure;
c. The trash rack shall have sufficient net open area under cleanconditions to limit the peak design storm velocity through it toa maximum of 2.5 feet per second; and
d. The trash rack shall be constructed and installed to be rigid,durable, and corrosion resistant, and shall be designed towithstand a perpendicular live loading of 300 pounds persquare foot.
III. An overflow grate is a device intended to protect the opening in the top of astormwater management measure outlet structure. If an outlet structure has anoverflow grate, such grate shall meet the following requirements:
a. The overflow grate spacing shall be no more than two (2)inches across the smallest dimension; and
b. The overflow grate shall be constructed and installed to berigid, durable, and corrosion resistant, and shall be designed to

17 6/26/09
withstand a perpendicular live loading of three hundred (300)pounds per square foot.
IV. The maximum side slope for an earthen dam, embankment, or berm shallnot be steeper than three (3) horizontal to one (1) vertical (3:1); andV. Safety ledges shall be constructed on the slopes of all new structural
stormwater management measures having a permanent pool of water deeperthan two and one-half (2.5) feet. Such safety ledges shall be comprised of twosteps. Each step shall be four (4) to six (6) feet in width. One step shall belocated approximately two and one-half (21/2) feet below the permanent watersurface, and the second step shall be located one (1) to one and one-half (11/2)feet above the permanent water surface.
AT A MINIMUM, SUBMIT THE FOLLOWING TO THE MUNICIPALITY:
NA The plan must be designed in accordance with NJAC 7:8-6.2.
Item #16. The General Inspection, Maintenance and Repair Plan shall contain thefollowing [NJAC 7:50-6.84(a)6vii]:
I. Accurate and comprehensive drawings of the site’s stormwater managementmeasures;II. Specific locations of each stormwater management measure identified by
means of longitude and latitude as well as block and lot number;III. Specific preventative and corrective maintenance tasks and schedules for
such tasks for each stormwater BMP;IV. Cost estimates, including estimated cost of sediment, debris or trash
removal;
V. The name, address and telephone number of the person or personsresponsible for regular inspections and preventative and corrective maintenanceincluding repair and replacement;VI. Reporting records for maintenance;VII. A description of the financing that will ensure the inspection, maintenance
and repair of all stormwater management BMPs;VIII. The plan must address existing tree and vegetation protection during
construction;IX. A statement that an inspection, maintenance and repair report will be
updated and submitted annually to the municipality;X. A description of all preservation measures and maintenance procedures for
all non-structural stormwater management measures; andXI. A description of all stormwater management measure easements designed to
facilitate inspections and maintenance as necessary.
Nonstructural stormwater management strategies protection - The local land useordinances and the CMP provide that development be designed to meet the nonstructuralstormwater management strategy standards of N.J.A.C. 7:8-5.3. These standards require

18 6/26/09
that any land area used as a nonstructural stormwater management measure shall bededicated to a government agency, subjected to a conservation restriction filed with theappropriate County Clerk’s office, or equivalent restriction that ensures that measure ismaintained in perpetuity. Any maintenance plan must specify which of these methodswill be employed, and how the protection will be implemented [NJAC 7:8-5.3(c)].
Maintenance requirements - The NJDEP regulations provide that the responsibility formaintenance of stormwater management measures shall not be assigned or transferred tothe owner or tenant of an individual property in a residential development or project,unless such owner or tenant owns or leases the entire residential development or project[NJAC 7:8-5.8].
AT A MINIMUM, SUBMIT THE FOLLOWING TO THE MUNICIPALITY:
___ A maintenance plan that contains all of the above required information.NA Copies of all proposed deed restrictions for any land area used as anonstructural stormwater management measure.NA Copies of all proposed easements.

SJG – BL England (225616) Woodard & CurranUpper Township, New Jersey June 2014
APPENDIX B: DRAWINGS
DRAWINGS
FIGURE A SITE LAYOUT PLAN
FIGURE B CRUSHED STONE INFILTRATION AREA DETAIL
FIGURE C MISCELLANEOUS DETAILS PLAN
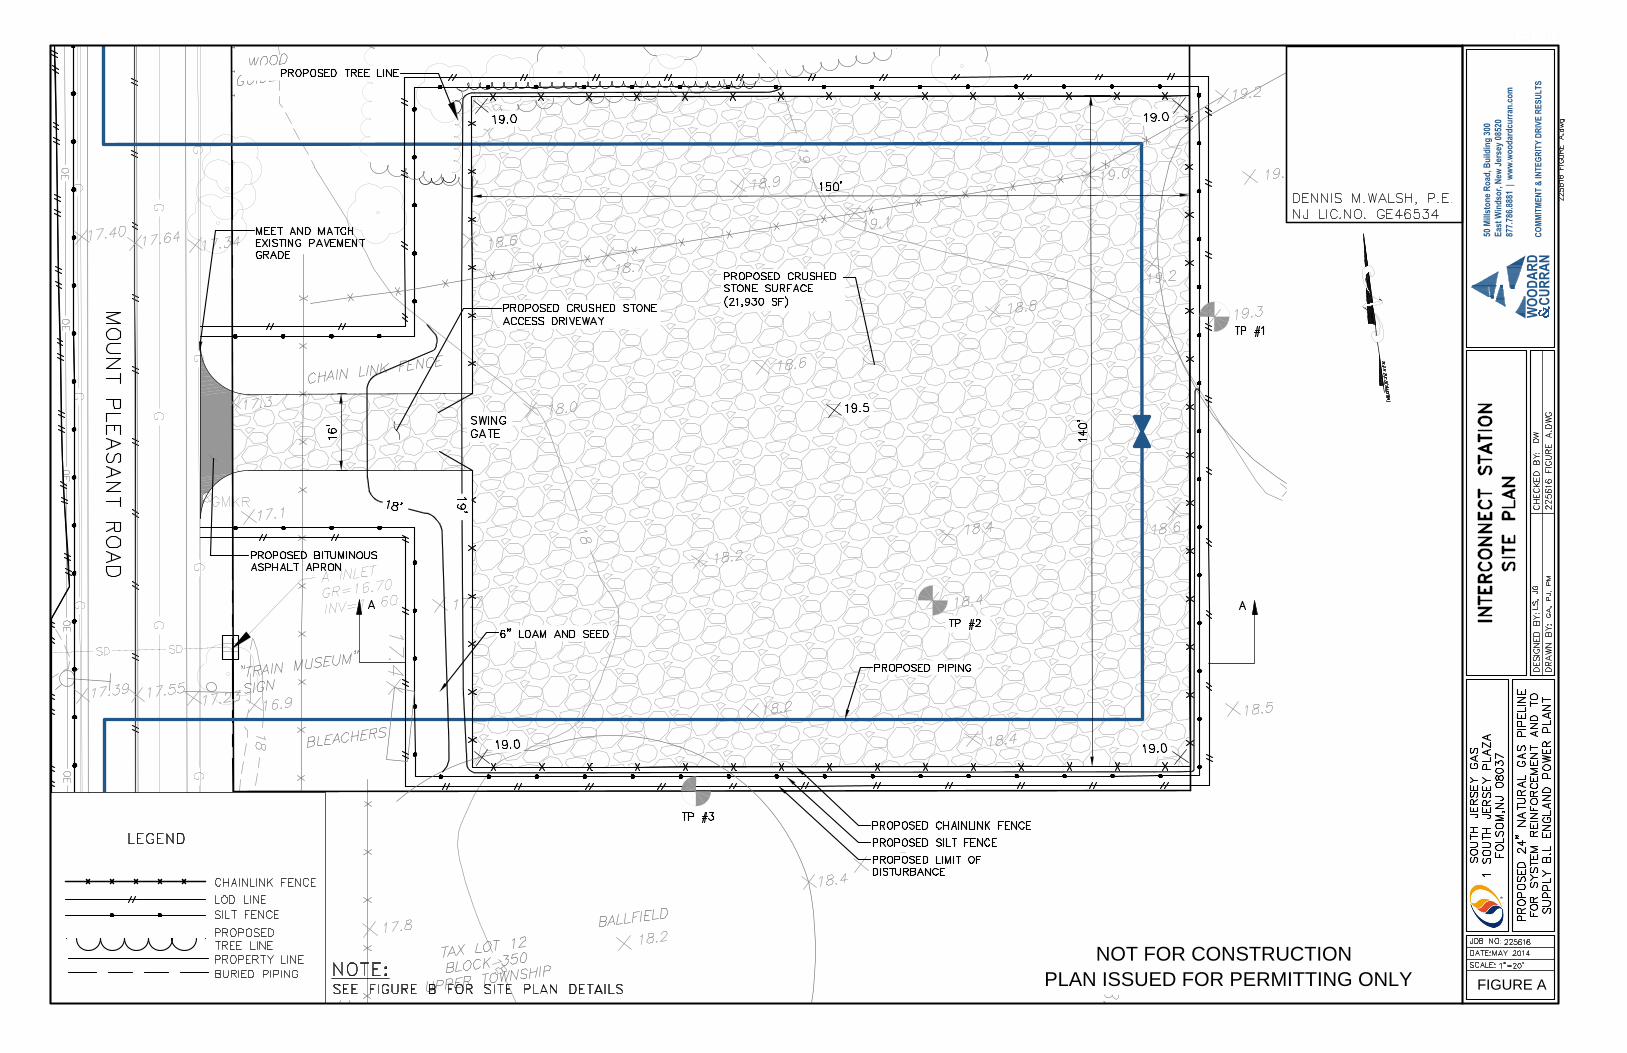
FIGURE A
NOT FOR CONSTRUCTION
PLAN ISSUED FOR PERMITTING ONLY
WOO
DARD
CURR
ANCO
MMIT
MENT
& IN
TEGR
ITY
DRIV
E RE
SULT
S
50 M
illsto
ne R
oad,
Bui
ldin
g 30
0Ea
st W
inds
or, N
ew Je
rsey
0852
087
7.786
.8881
| w
ww.w
ooda
rdcu
rran.
com
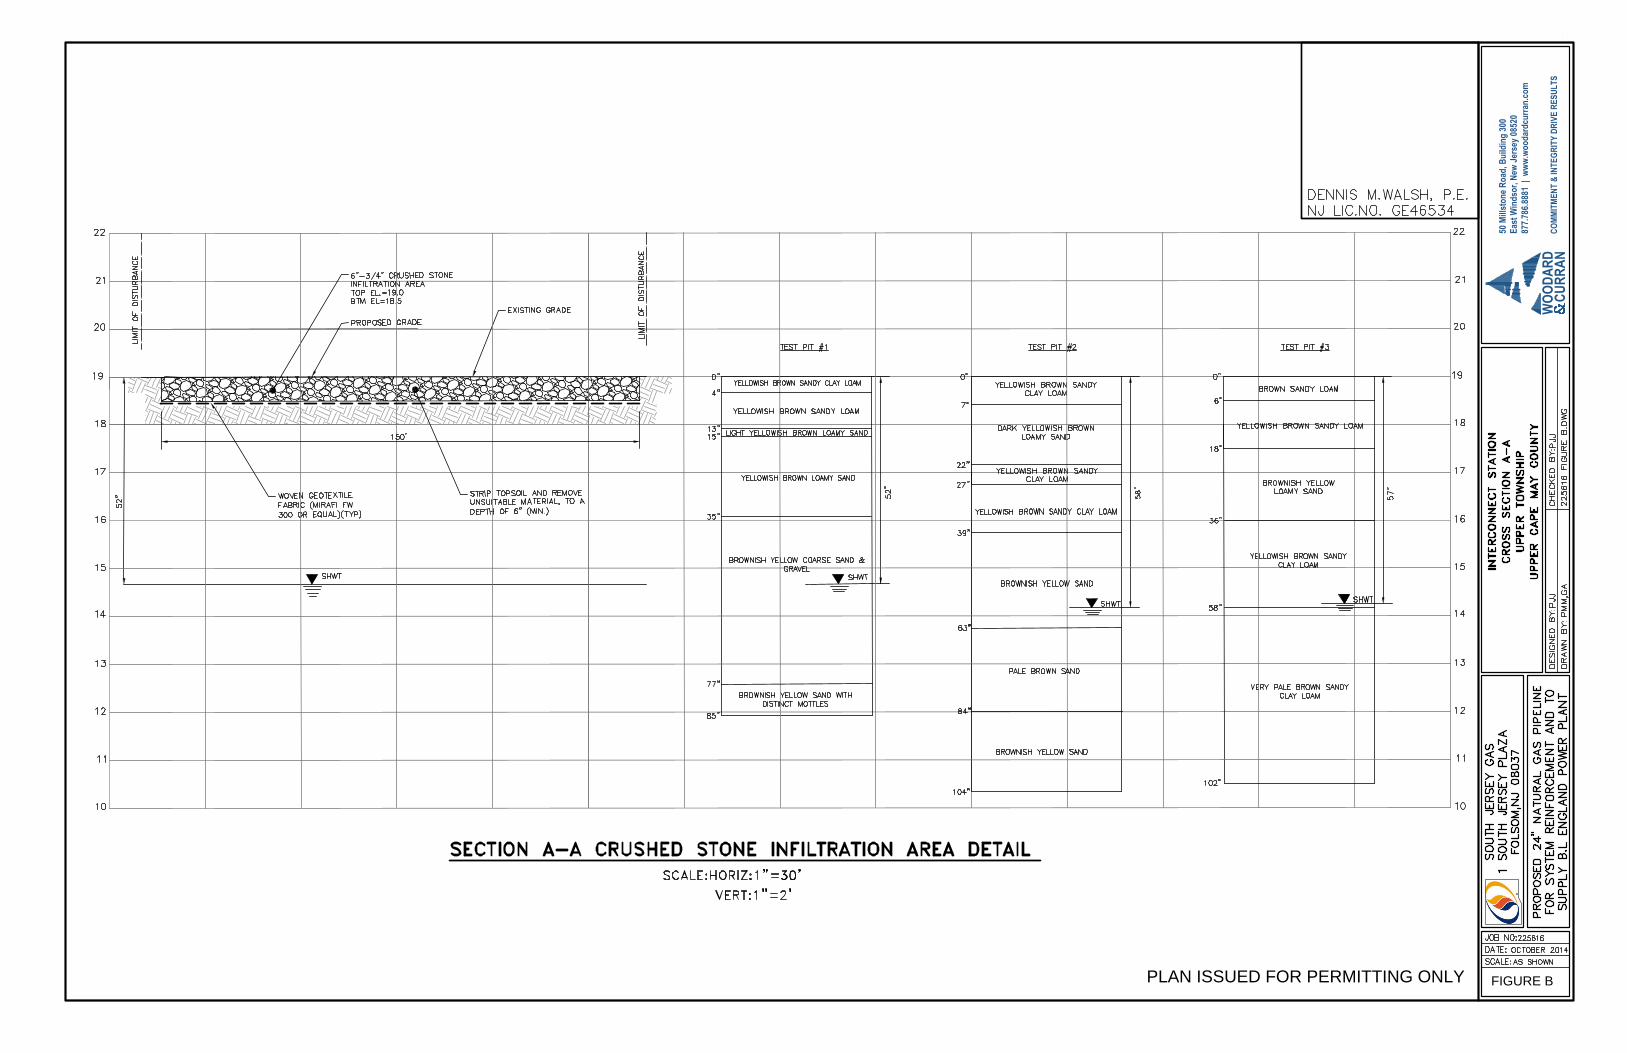
FIGURE B
WOO
DARD
CURR
ANCO
MMIT
MENT
& IN
TEGR
ITY
DRIV
E RE
SULT
S
50 M
illsto
ne R
oad,
Bui
ldin
g 30
0Ea
st W
inds
or, N
ew Je
rsey
0852
087
7.786
.8881
| w
ww.w
ooda
rdcu
rran.
com
PLAN ISSUED FOR PERMITTING ONLY

FIGURE C
WOO
DARD
CURR
ANCO
MMIT
MENT
& IN
TEGR
ITY
DRIV
E RE
SULT
S
50 M
illsto
ne R
oad,
Bui
ldin
g 30
0Ea
st W
inds
or, N
ew Je
rsey
0852
087
7.786
.8881
| w
ww.w
ooda
rdcu
rran.
com
PLAN ISSUED FOR PERMITTING ONLY

SJG – BL England (225616) Woodard & CurranUpper Township, New Jersey June 2014
APPENDIX C: TEST PIT DATA AND SOILS INFORMATION

Soil Map—Cape May County, New Jersey
Natural ResourcesConservation Service
Web Soil SurveyNational Cooperative Soil Survey
5/7/2014Page 1 of 3
4348
570
4348
580
4348
590
4348
600
4348
610
4348
620
4348
630
4348
640
4348
650
4348
660
4348
570
4348
580
4348
590
4348
600
4348
610
4348
620
4348
630
4348
640
4348
650
4348
660521150 521160 521170 521180 521190 521200 521210 521220 521230 521240 521250 521260 521270 521280 521290
521150 521160 521170 521180 521190 521200 521210 521220 521230 521240 521250 521260 521270 521280 521290
39° 17' 13'' N74
° 4
5' 1
7'' W
39° 17' 13'' N
74° 4
5' 1
1'' W
39° 17' 10'' N
74° 4
5' 1
7'' W
39° 17' 10'' N
74° 4
5' 1
1'' W
N
Map projection: Web Mercator Corner coordinates: WGS84 Edge tics: UTM Zone 18N WGS840 30 60 120 180
Feet0 10 20 40 60
MetersMap Scale: 1:675 if printed on A landscape (11" x 8.5") sheet.

MAP LEGEND MAP INFORMATION
Area of Interest (AOI)Area of Interest (AOI)
SoilsSoil Map Unit Polygons
Soil Map Unit Lines
Soil Map Unit Points
Special Point FeaturesBlowout
Borrow Pit
Clay Spot
Closed Depression
Gravel Pit
Gravelly Spot
Landfill
Lava Flow
Marsh or swamp
Mine or Quarry
Miscellaneous Water
Perennial Water
Rock Outcrop
Saline Spot
Sandy Spot
Severely Eroded Spot
Sinkhole
Slide or Slip
Sodic Spot
Spoil Area
Stony Spot
Very Stony Spot
Wet Spot
Other
Special Line Features
Water FeaturesStreams and Canals
TransportationRails
Interstate Highways
US Routes
Major Roads
Local Roads
BackgroundAerial Photography
The soil surveys that comprise your AOI were mapped at 1:24,000.
Warning: Soil Map may not be valid at this scale.
Enlargement of maps beyond the scale of mapping can causemisunderstanding of the detail of mapping and accuracy of soil lineplacement. The maps do not show the small areas of contrastingsoils that could have been shown at a more detailed scale.
Please rely on the bar scale on each map sheet for mapmeasurements.
Source of Map: Natural Resources Conservation ServiceWeb Soil Survey URL: http://websoilsurvey.nrcs.usda.govCoordinate System: Web Mercator (EPSG:3857)
Maps from the Web Soil Survey are based on the Web Mercatorprojection, which preserves direction and shape but distortsdistance and area. A projection that preserves area, such as theAlbers equal-area conic projection, should be used if more accuratecalculations of distance or area are required.
This product is generated from the USDA-NRCS certified data as ofthe version date(s) listed below.
Soil Survey Area: Cape May County, New JerseySurvey Area Data: Version 9, Dec 19, 2013
Soil map units are labeled (as space allows) for map scales 1:50,000or larger.
Date(s) aerial images were photographed: Mar 19, 2011—May 7,2011
The orthophoto or other base map on which the soil lines werecompiled and digitized probably differs from the backgroundimagery displayed on these maps. As a result, some minor shiftingof map unit boundaries may be evident.
Soil Map—Cape May County, New Jersey
Natural ResourcesConservation Service
Web Soil SurveyNational Cooperative Soil Survey
5/7/2014Page 2 of 3

Map Unit Legend
Cape May County, New Jersey (NJ009)
Map Unit Symbol Map Unit Name Acres in AOI Percent of AOI
BEXAS Berryland and Mullica soils, 0 to2 percent slopes,occasionally flooded
0.0 2.4%
HbmB Hammonton loamy sand, 0 to 5percent slopes
1.6 97.6%
Totals for Area of Interest 1.6 100.0%
Soil Map—Cape May County, New Jersey
Natural ResourcesConservation Service
Web Soil SurveyNational Cooperative Soil Survey
5/7/2014Page 3 of 3

Map Unit Description
The map units delineated on the detailed soil maps in a soil survey represent thesoils or miscellaneous areas in the survey area. The map unit descriptions in thisreport, along with the maps, can be used to determine the composition andproperties of a unit.
A map unit delineation on a soil map represents an area dominated by one or moremajor kinds of soil or miscellaneous areas. A map unit is identified and namedaccording to the taxonomic classification of the dominant soils. Within a taxonomicclass there are precisely defined limits for the properties of the soils. On thelandscape, however, the soils are natural phenomena, and they have thecharacteristic variability of all natural phenomena. Thus, the range of someobserved properties may extend beyond the limits defined for a taxonomic class.Areas of soils of a single taxonomic class rarely, if ever, can be mapped withoutincluding areas of other taxonomic classes. Consequently, every map unit is madeup of the soils or miscellaneous areas for which it is named and some minorcomponents that belong to taxonomic classes other than those of the major soils.
Most minor soils have properties similar to those of the dominant soil or soils in themap unit, and thus they do not affect use and management. These are callednoncontrasting, or similar, components. They may or may not be mentioned in aparticular map unit description. Other minor components, however, have propertiesand behavioral characteristics divergent enough to affect use or to require differentmanagement. These are called contrasting, or dissimilar, components. Theygenerally are in small areas and could not be mapped separately because of thescale used. Some small areas of strongly contrasting soils or miscellaneous areasare identified by a special symbol on the maps. If included in the database for agiven area, the contrasting minor components are identified in the map unitdescriptions along with some characteristics of each. A few areas of minorcomponents may not have been observed, and consequently they are notmentioned in the descriptions, especially where the pattern was so complex that itwas impractical to make enough observations to identify all the soils andmiscellaneous areas on the landscape.
The presence of minor components in a map unit in no way diminishes theusefulness or accuracy of the data. The objective of mapping is not to delineatepure taxonomic classes but rather to separate the landscape into landforms orlandform segments that have similar use and management requirements. Thedelineation of such segments on the map provides sufficient information for thedevelopment of resource plans. If intensive use of small areas is planned, however,onsite investigation is needed to define and locate the soils and miscellaneousareas.
An identifying symbol precedes the map unit name in the map unit descriptions.Each description includes general facts about the unit and gives important soilproperties and qualities.
Map Unit Description---Cape May County, New Jersey
Natural ResourcesConservation Service
Web Soil SurveyNational Cooperative Soil Survey
5/7/2014Page 1 of 6

Soils that have profiles that are almost alike make up a soil series. All the soils ofa series have major horizons that are similar in composition, thickness, andarrangement. Soils of a given series can differ in texture of the surface layer, slope,stoniness, salinity, degree of erosion, and other characteristics that affect their use.On the basis of such differences, a soil series is divided into soil phases. Most ofthe areas shown on the detailed soil maps are phases of soil series. The name ofa soil phase commonly indicates a feature that affects use or management. Forexample, Alpha silt loam, 0 to 2 percent slopes, is a phase of the Alpha series.
Some map units are made up of two or more major soils or miscellaneous areas.These map units are complexes, associations, or undifferentiated groups.
A complex consists of two or more soils or miscellaneous areas in such an intricatepattern or in such small areas that they cannot be shown separately on the maps.The pattern and proportion of the soils or miscellaneous areas are somewhat similarin all areas. Alpha-Beta complex, 0 to 6 percent slopes, is an example.
An association is made up of two or more geographically associated soils ormiscellaneous areas that are shown as one unit on the maps. Because of presentor anticipated uses of the map units in the survey area, it was not consideredpractical or necessary to map the soils or miscellaneous areas separately. Thepattern and relative proportion of the soils or miscellaneous areas are somewhatsimilar. Alpha-Beta association, 0 to 2 percent slopes, is an example.
An undifferentiated group is made up of two or more soils or miscellaneous areasthat could be mapped individually but are mapped as one unit because similarinterpretations can be made for use and management. The pattern and proportionof the soils or miscellaneous areas in a mapped area are not uniform. An area canbe made up of only one of the major soils or miscellaneous areas, or it can be madeup of all of them. Alpha and Beta soils, 0 to 2 percent slopes, is an example.
Some surveys include miscellaneous areas. Such areas have little or no soilmaterial and support little or no vegetation. Rock outcrop is an example.
Additional information about the map units described in this report is available inother soil reports, which give properties of the soils and the limitations, capabilities,and potentials for many uses. Also, the narratives that accompany the soil reportsdefine some of the properties included in the map unit descriptions.
Report—Map Unit Description
Cape May County, New Jersey
BEXAS—Berryland and Mullica soils, 0 to 2 percent slopes,occasionally flooded
Map Unit SettingElevation: 0 to 140 feetMean annual precipitation: 28 to 59 inchesMean annual air temperature: 46 to 79 degrees FFrost-free period: 161 to 231 days
Map Unit Description---Cape May County, New Jersey
Natural ResourcesConservation Service
Web Soil SurveyNational Cooperative Soil Survey
5/7/2014Page 2 of 6

Map Unit CompositionBerryland, occasionally flooded, and similar soils: 50 percentMullica, occasionally flooded, and similar soils: 40 percentMinor components: 10 percent
Description of Berryland, Occasionally Flooded
SettingLandform: Depressions, flats, drainagewaysLandform position (two-dimensional): ToeslopeLandform position (three-dimensional): Base slopeDown-slope shape: Concave, linearAcross-slope shape: ConcaveParent material: Sandy fluviomarine deposits
Properties and qualitiesSlope: 0 to 2 percentDepth to restrictive feature: More than 80 inchesDrainage class: Very poorly drainedCapacity of the most limiting layer to transmit water (Ksat): High to
very high (2.00 to 20.00 in/hr)Depth to water table: About 0 to 6 inchesFrequency of flooding: OccasionalFrequency of ponding: OccasionalAvailable water capacity: Low (about 3.7 inches)
Interpretive groupsFarmland classification: Farmland of unique importanceLand capability (nonirrigated): 5wHydrologic Soil Group: B/D
Typical profile0 to 11 inches: Sand11 to 19 inches: Sand19 to 32 inches: Sand32 to 40 inches: Sand40 to 44 inches: Sand44 to 80 inches: Stratified sand to sandy loam
Description of Mullica, Occasionally Flooded
SettingLandform: Depressions, flood plains, drainagewaysLandform position (two-dimensional): ToeslopeLandform position (three-dimensional): Base slopeDown-slope shape: Concave, linearAcross-slope shape: Concave, linearParent material: Sandy fluviomarine deposits and/or loamy
fluviomarine deposits
Properties and qualitiesSlope: 0 to 2 percentDepth to restrictive feature: More than 80 inches
Map Unit Description---Cape May County, New Jersey
Natural ResourcesConservation Service
Web Soil SurveyNational Cooperative Soil Survey
5/7/2014Page 3 of 6

Drainage class: Very poorly drainedCapacity of the most limiting layer to transmit water
(Ksat): Moderately high to high (0.60 to 5.95 in/hr)Depth to water table: About 0 to 6 inchesFrequency of flooding: OccasionalFrequency of ponding: OccasionalAvailable water capacity: Moderate (about 6.0 inches)
Interpretive groupsFarmland classification: Farmland of unique importanceLand capability (nonirrigated): 4wHydrologic Soil Group: D
Typical profile0 to 2 inches: Mucky peat2 to 9 inches: Sandy loam9 to 14 inches: Sandy loam14 to 28 inches: Sandy loam28 to 31 inches: Loamy sand31 to 40 inches: Sand40 to 80 inches: Gravelly loamy sand
Minor Components
Manahawkin, frequently floodedPercent of map unit: 5 percentLandform: Flood plainsDown-slope shape: LinearAcross-slope shape: Linear
AtsionPercent of map unit: 5 percentLandform: FlatsLandform position (two-dimensional): FootslopeLandform position (three-dimensional): Dip, talfDown-slope shape: LinearAcross-slope shape: Linear
HbmB—Hammonton loamy sand, 0 to 5 percent slopes
Map Unit SettingElevation: 0 to 120 feetMean annual precipitation: 28 to 59 inchesMean annual air temperature: 46 to 79 degrees FFrost-free period: 161 to 231 days
Map Unit CompositionHammonton and similar soils: 80 percentMinor components: 20 percent
Map Unit Description---Cape May County, New Jersey
Natural ResourcesConservation Service
Web Soil SurveyNational Cooperative Soil Survey
5/7/2014Page 4 of 6

Description of Hammonton
SettingLandform: Depressions, flatsLandform position (two-dimensional): ToeslopeLandform position (three-dimensional): Base slopeDown-slope shape: Concave, linearAcross-slope shape: Concave, linearParent material: Coarse-loamy fluviomarine deposits
Properties and qualitiesSlope: 0 to 5 percentDepth to restrictive feature: More than 80 inchesDrainage class: Moderately well drainedCapacity of the most limiting layer to transmit water (Ksat): High (2.00
to 6.00 in/hr)Depth to water table: About 18 to 42 inchesFrequency of flooding: NoneFrequency of ponding: NoneAvailable water capacity: Moderate (about 6.9 inches)
Interpretive groupsFarmland classification: Farmland of statewide importanceLand capability (nonirrigated): 2wHydrologic Soil Group: B
Typical profile0 to 8 inches: Loamy sand8 to 18 inches: Loamy sand18 to 36 inches: Sandy loam36 to 80 inches: Sand
Minor Components
FallsingtonPercent of map unit: 5 percentLandform: Depressions, flatsLandform position (two-dimensional): ToeslopeLandform position (three-dimensional): Base slopeDown-slope shape: Concave, linearAcross-slope shape: Concave, linear
GlassboroPercent of map unit: 5 percentLandform: Flats, drainagewaysLandform position (two-dimensional): ToeslopeLandform position (three-dimensional): Base slopeDown-slope shape: LinearAcross-slope shape: Linear, concave
Mullica, rarely floodedPercent of map unit: 5 percentLandform: Depressions, flood plains, drainagewaysLandform position (two-dimensional): Toeslope
Map Unit Description---Cape May County, New Jersey
Natural ResourcesConservation Service
Web Soil SurveyNational Cooperative Soil Survey
5/7/2014Page 5 of 6

Landform position (three-dimensional): Base slopeDown-slope shape: Concave, linearAcross-slope shape: Concave, linear
AtsionPercent of map unit: 5 percentLandform: DepressionsLandform position (two-dimensional): ToeslopeLandform position (three-dimensional): Base slopeDown-slope shape: ConcaveAcross-slope shape: Concave
Data Source Information
Soil Survey Area: Cape May County, New JerseySurvey Area Data: Version 9, Dec 19, 2013
Map Unit Description---Cape May County, New Jersey
Natural ResourcesConservation Service
Web Soil SurveyNational Cooperative Soil Survey
5/7/2014Page 6 of 6
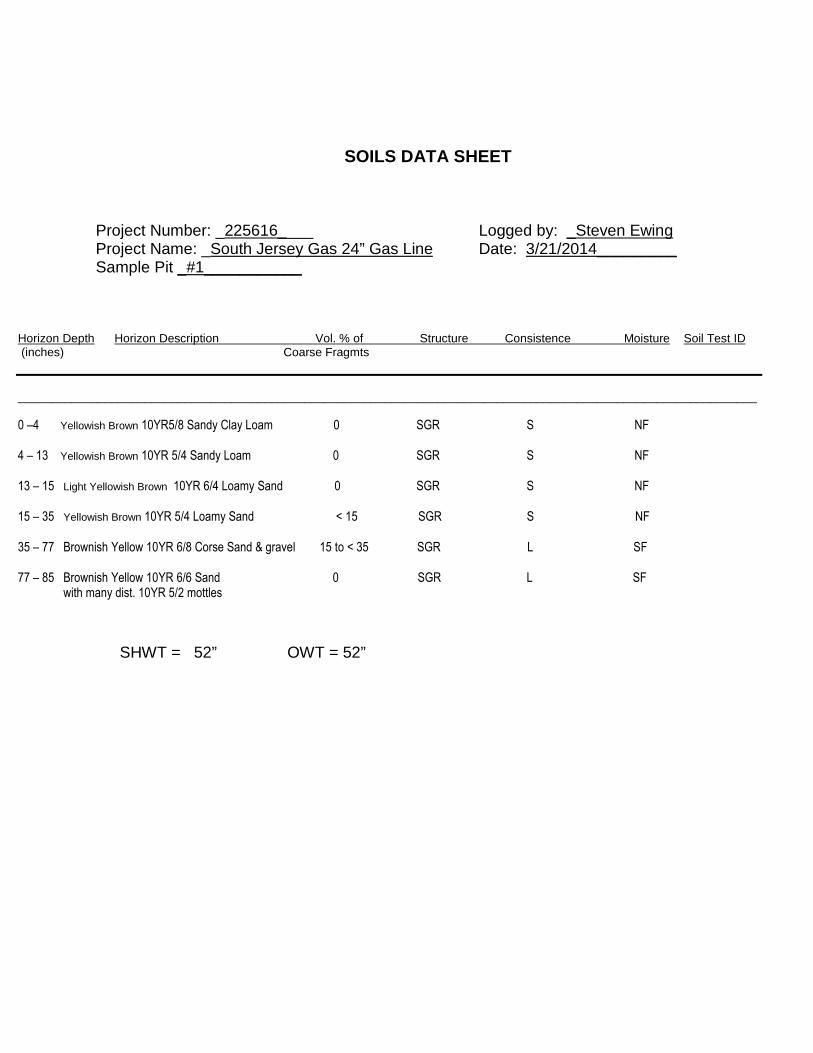
SOILS DATA SHEET
Project Number: _225616____ Logged by: _Steven EwingProject Name: _South Jersey Gas 24” Gas Line Date: 3/21/2014_________Sample Pit _#1___________
Horizon Depth Horizon Description Vol. % of Structure Consistence Moisture Soil Test ID(inches) Coarse Fragmts
_______________________________________________________________________________________________________________
0 –4 Yellowish Brown 10YR5/8 Sandy Clay Loam 0 SGR S NF
4 – 13 Yellowish Brown 10YR 5/4 Sandy Loam 0 SGR S NF
13 – 15 Light Yellowish Brown 10YR 6/4 Loamy Sand 0 SGR S NF
15 – 35 Yellowish Brown 10YR 5/4 Loamy Sand < 15 SGR S NF
35 – 77 Brownish Yellow 10YR 6/8 Corse Sand & gravel 15 to < 35 SGR L SF
77 – 85 Brownish Yellow 10YR 6/6 Sand 0 SGR L SFwith many dist. 10YR 5/2 mottles
SHWT = 52” OWT = 52”

SOILS DATA SHEET
Project Number: _225616____ Logged by: _Steven EwingProject Name: _South Jersey Gas 24” Gas Line Date:_/21/2014_________Sample Pit _#2____________
Horizon Depth Horizon Description Vol. % of Structure Consistence Moisture Soil Test ID(inches) Coarse Fragmts
_______________________________________________________________________________________________________________
0 – 7 Yellowish Brown 10YR 5/8 Sandy Clay Loam 0 SGR S NF
7 – 22 Dark Yellowish Brown 10YR 4/6 Loamy Sand 0 SGR S NF
22 –27 Yellowish Brown 10YR 5/4 Sandy Clay Loam 0 SGR S NF
27 – 39 Yellowish Brown 10YR 5/6 Sandy Clay Loam 0 SGR S NF
39 – 63 Brownish Yellow 10YR 6/8 Sand <15 SGR L SF
63 – 84 Pale Brown 10YR 6/3 Sand 0 SGR L SF
84 – 104 Brownish Yellow 10YR 6/6 Sand 0 SGR L SF
SHWT = 58” OWT = 58”

Project Number: _225616____ Logged by: _Steven EwingProject Name: _South Jersey Gas 24” Gas Line Date:_/21/2014_________Sample Pit _#3____________
Horizon Depth Horizon Description Vol. % of Structure Consistence Moisture Soil Test ID(inches) Coarse Fragmts
_______________________________________________________________________________________________________________
0 – 6 Brown 10YR 4/3 Sandy Loam 0 SGR S NF
6 – 18 Yellowish Brown 10YR 5/6 Sandy Loam < 15 SGR S NF
18 – 36 Brownish Yellow 10YR 6/6 Loamy Sand 0 SGR S NF
36 – 58 Yellowish Brown 10YR 5/6 Sandy Clay Loam 0 SGR L SF
58 – 102 Very Pale Brown 10YR 7/3 Sandy Clay Loam 0 SGR L SF
SHWT = 57” OWT = 57”

CLIENT:
ATTN:
PROJECT:
CTL No.: 411040
Date:Sample(s) Received:Sample(s) Tested:Technician: C. Howell, J. Veach
TP-1A 5.79 K3 117.3TP-1B 3.00 K3 113.8TP-2A 1.94 K2 123.6TP-2B 1.43 K2 116.7TP-3A 3.74 K3 114.6TP-3B 8.98 K4 119.0
* Permeability corrected to 200C+ Dry density of tested sample as received in sampling tube
Summary of Laboratory Testing:Total No.
Tube Permeameter Test (NJAC 7:9A-6.2) - Undisturbed 6
Sample No.Dry
Density+ Soil Permeability
Class
April 1, 2014March 21, 2014
LABORATORY TEST RESULTS
Permeability* k20 (in/hr)
March 26 to 30, 2014
Woodard & Curran
Building 300, Suite 100
50 Millstone RoadEast Windsor, New Jersey 08520
Mr. Steven R. Ewing
Proposed Recharge Basin
Mt. Pleasant Tuckahoe Road
Tuckahoe, New Jersey

Client: CTL #:
Project: Date:
Boring/Sample # or Descrip./Location: Depth:
Description of Soil:
Technician: Proctor Data:
Initial Specimen Data:Sample Type:UndisturbedRe-Compacted 9.3
Radius of Burette, r: 0.3141 in Radius of Soil Specimen, R: 1.4375 in
1 2 3 6 8
h1 (cm) h2 (cm) Sec Min
1 90.0 80.0 16.88 0.281 19.4 1.015
2 90.0 80.0 17.75 0.296 19.4 1.015
3 90.0 80.0 18.13 0.302 19.4 1.015
4 80.0 70.0 20.06 0.334 19.4 1.015
5 80.0 70.0 20.35 0.339 19.4 1.015
6 80.0 70.0 21.31 0.355 19.4 1.015
7 70.0 60.0 23.19 0.387 19.4 1.015
8 70.0 60.0 24.34 0.406 19.4 1.015
9 70.0 60.0 24.81 0.414 19.4 1.015
10 60.0 50.0 27.34 0.456 19.4 1.015
11 60.0 50.0 28.16 0.469 19.4 1.015
12 60.0 50.0 29.09 0.485 19.4 1.015
13 50.0 40.0 33.56 0.559 19.4 1.015
14 50.0 40.0 34.78 0.580 19.4 1.015
15 50.0 40.0 35.94 0.599 19.4 1.015
Perm, kT (7) = 60 * L/t * r2/R2* ln(h1/h2) = 60* L/(5) * r2/R2 * ln((2)/(3))
Head, h (4) = (2) - (3); Perm, k20 (9) = (7)*(8)
Soil Permeability Classes> 20 inches per hour (in/hr) K56 - 20 in/hr K42 - 6 in/hr K30.6 - 2 in/hr K20.2 - 0.6 in/hr K1< 0.2 in/hr K0Remarks
Plate No.:
5.68
5.63
10.0 5.45
5.50
5.53
AVERAGE k20 (in/hr):
10.0
10.0
10.0
10.0
10.0
10.0
10.0
5.84
5.58
5.92
5.79
5.64
5.54
5.94
5.77
5.58
5.92
5.72
5.91
5.79
5.93
5.85
5.85
5.83
5.82
5.70
5.84
5.76
Temp Correc.
5.50
5.56
5.45
Trial No.Burette Readings Head, h
(cm)Temp, T
(oC)
--% of Max Dry Density
6.12
Dry Density (pcf)
7Permeability at
ToC, kT
9Permeability at
20oC, k20
6.22
10.0
10.0
10.0
10.0
10.0
March 28, 2014
Light Brown silty SAND
Opt. Moisture (%)
TUBE PERMEAMETER TEST(N.J.A.C. 7:9A - Standards for Individual Subsurface Sewage Disposal Systems; Subchapter 6, Section 6.2, page 39, Modified)
Woodard Curran 411040
Max Dry Density (pcf)
Proposed Recharge Basin-Tuchahoe, NJ
117.3
Wet Density (pcf)
128.2
C. Howell, J. Veach
Diameter (in)
2.875
Length, L (in)5.11
-
Water Content (%)
SOIL PERMEABILITY CLASS: K3
TP-1A -
TEST DATA
10.0
10.0
54Time, t
CRAIG TESTING LABORATORIES, INC.

Client: CTL #:
Project: Date:
Boring/Sample # or Descrip./Location: Depth:
Description of Soil:
Technician: Proctor Data:
Initial Specimen Data:Sample Type:UndisturbedRe-Compacted 11.8
Radius of Burette, r: 0.3141 in Radius of Soil Specimen, R: 1.4375 in
1 2 3 6 8
h1 (cm) h2 (cm) Sec Min
1 90.0 80.0 34.31 0.572 19.4 1.015
2 90.0 80.0 37.97 0.633 19.4 1.015
3 90.0 80.0 34.10 0.568 19.4 1.015
4 80.0 70.0 38.53 0.642 19.4 1.015
5 80.0 70.0 41.53 0.692 19.4 1.015
6 80.0 70.0 38.97 0.650 19.4 1.015
7 70.0 60.0 46.28 0.771 19.4 1.015
8 70.0 60.0 48.94 0.816 19.4 1.015
9 70.0 60.0 46.40 0.773 19.4 1.015
10 60.0 50.0 56.65 0.944 19.4 1.015
11 60.0 50.0 60.63 1.011 19.4 1.015
12 60.0 50.0 58.16 0.969 19.4 1.015
13 50.0 40.0 71.63 1.194 19.4 1.015
14 50.0 40.0 75.03 1.251 19.4 1.015
15 50.0 40.0 70.56 1.176 19.4 1.015
Perm, kT (7) = 60 * L/t * r2/R2* ln(h1/h2) = 60* L/(5) * r2/R2 * ln((2)/(3))
Head, h (4) = (2) - (3); Perm, k20 (9) = (7)*(8)
Soil Permeability Classes> 20 inches per hour (in/hr) K56 - 20 in/hr K42 - 6 in/hr K30.6 - 2 in/hr K20.2 - 0.6 in/hr K1< 0.2 in/hr K0Remarks
Plate No.:
SOIL PERMEABILITY CLASS: K3
TP-1B -
TEST DATA
10.0
10.0
54Time, t
113.8
Wet Density (pcf)
127.2
C. Howell, J. Veach
Diameter (in)
2.875
Length, L (in)5.31
-
Water Content (%)
March 28, 2014
Light Brown silty SAND
Opt. Moisture (%)
TUBE PERMEAMETER TEST(N.J.A.C. 7:9A - Standards for Individual Subsurface Sewage Disposal Systems; Subchapter 6, Section 6.2, page 39, Modified)
Woodard Curran 411040
Max Dry Density (pcf)
Proposed Recharge Basin-Tuchahoe, NJ
10.0
10.0
10.0
10.0
10.0
--% of Max Dry Density
3.13
Dry Density (pcf)
7Permeability at
ToC, kT
9Permeability at
20oC, k20
3.18
Trial No.Burette Readings Head, h
(cm)Temp, T
(oC)Temp
Correc.
3.13
2.87
3.03
2.94
3.04
2.83
3.15
3.16
2.93
2.87
3.20
3.21
2.98
3.17
3.09
3.00
2.92
3.08
2.98
2.79
2.90
2.89
2.76
2.93
AVERAGE k20 (in/hr):
10.0
10.0
10.0
10.0
10.0
10.0
10.0
2.84
2.74
2.71
10.0 2.89
2.86
CRAIG TESTING LABORATORIES, INC.
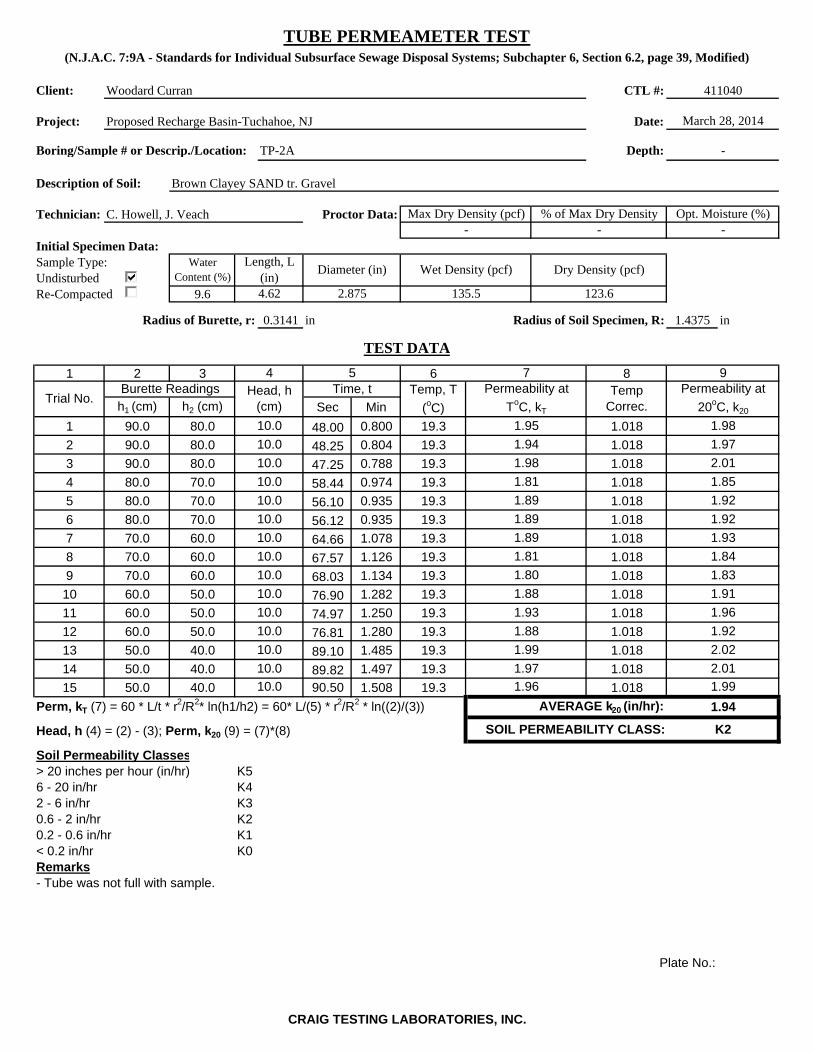
Client: CTL #:
Project: Date:
Boring/Sample # or Descrip./Location: Depth:
Description of Soil:
Technician: Proctor Data:
Initial Specimen Data:Sample Type:UndisturbedRe-Compacted 9.6
Radius of Burette, r: 0.3141 in Radius of Soil Specimen, R: 1.4375 in
1 2 3 6 8
h1 (cm) h2 (cm) Sec Min
1 90.0 80.0 48.00 0.800 19.3 1.018
2 90.0 80.0 48.25 0.804 19.3 1.018
3 90.0 80.0 47.25 0.788 19.3 1.018
4 80.0 70.0 58.44 0.974 19.3 1.018
5 80.0 70.0 56.10 0.935 19.3 1.018
6 80.0 70.0 56.12 0.935 19.3 1.018
7 70.0 60.0 64.66 1.078 19.3 1.018
8 70.0 60.0 67.57 1.126 19.3 1.018
9 70.0 60.0 68.03 1.134 19.3 1.018
10 60.0 50.0 76.90 1.282 19.3 1.018
11 60.0 50.0 74.97 1.250 19.3 1.018
12 60.0 50.0 76.81 1.280 19.3 1.018
13 50.0 40.0 89.10 1.485 19.3 1.018
14 50.0 40.0 89.82 1.497 19.3 1.018
15 50.0 40.0 90.50 1.508 19.3 1.018
Perm, kT (7) = 60 * L/t * r2/R2* ln(h1/h2) = 60* L/(5) * r2/R2 * ln((2)/(3))
Head, h (4) = (2) - (3); Perm, k20 (9) = (7)*(8)
Soil Permeability Classes> 20 inches per hour (in/hr) K56 - 20 in/hr K42 - 6 in/hr K30.6 - 2 in/hr K20.2 - 0.6 in/hr K1< 0.2 in/hr K0Remarks- Tube was not full with sample.
Plate No.:
1.93
1.97
10.0 1.96
1.88
1.99
AVERAGE k20 (in/hr):
10.0
10.0
10.0
10.0
10.0
10.0
10.0
1.99
1.92
1.93
1.94
1.84
1.83
1.91
1.96
1.92
2.02
2.01
1.97
2.01
1.85
1.92
1.88
1.89
1.94
1.98
1.81
1.89
Temp Correc.
1.89
1.81
1.80
Trial No.Burette Readings Head, h
(cm)Temp, T
(oC)
--% of Max Dry Density
1.95
Dry Density (pcf)
7Permeability at
ToC, kT
9Permeability at
20oC, k20
1.98
10.0
10.0
10.0
10.0
10.0
March 28, 2014
Brown Clayey SAND tr. Gravel
Opt. Moisture (%)
TUBE PERMEAMETER TEST(N.J.A.C. 7:9A - Standards for Individual Subsurface Sewage Disposal Systems; Subchapter 6, Section 6.2, page 39, Modified)
Woodard Curran 411040
Max Dry Density (pcf)
Proposed Recharge Basin-Tuchahoe, NJ
123.6
Wet Density (pcf)
135.5
C. Howell, J. Veach
Diameter (in)
2.875
Length, L (in)4.62
-
Water Content (%)
SOIL PERMEABILITY CLASS: K2
TP-2A -
TEST DATA
10.0
10.0
54Time, t
CRAIG TESTING LABORATORIES, INC.

Client: CTL #:
Project: Date:
Boring/Sample # or Descrip./Location: Depth:
Description of Soil:
Technician: Proctor Data:
Initial Specimen Data:Sample Type:UndisturbedRe-Compacted 10.4
Radius of Burette, r: 0.3141 in Radius of Soil Specimen, R: 1.4375 in
1 2 3 6 8
h1 (cm) h2 (cm) Sec Min
1 90.0 80.0 63.47 1.058 19.6 1.010
2 90.0 80.0 67.78 1.130 19.6 1.010
3 90.0 80.0 59.07 0.985 19.6 1.010
4 80.0 70.0 74.69 1.245 19.6 1.010
5 80.0 70.0 77.80 1.297 19.6 1.010
6 80.0 70.0 81.81 1.364 19.6 1.010
7 70.0 60.0 91.79 1.530 19.6 1.010
8 70.0 60.0 98.81 1.647 19.6 1.010
9 70.0 60.0 102.90 1.715 19.6 1.010
10 60.0 50.0 110.38 1.840 19.6 1.010
11 60.0 50.0 116.07 1.935 19.6 1.010
12 60.0 50.0 113.08 1.885 19.6 1.010
13 50.0 40.0 125.16 2.086 19.6 1.010
14 50.0 40.0 123.16 2.053 19.6 1.010
15 50.0 40.0 136.69 2.278 19.6 1.010
Perm, kT (7) = 60 * L/t * r2/R2* ln(h1/h2) = 60* L/(5) * r2/R2 * ln((2)/(3))
Head, h (4) = (2) - (3); Perm, k20 (9) = (7)*(8)
Soil Permeability Classes> 20 inches per hour (in/hr) K56 - 20 in/hr K42 - 6 in/hr K30.6 - 2 in/hr K20.2 - 0.6 in/hr K1< 0.2 in/hr K0Remarks
Plate No.:
SOIL PERMEABILITY CLASS: K2
TP-2B -
TEST DATA
10.0
10.0
54Time, t
116.7
Wet Density (pcf)
128.9
C. Howell, J. Veach
Diameter (in)
2.875
Length, L (in)4.83
-
Water Content (%)
March 28, 2014
Brown Clayey SAND
Opt. Moisture (%)
TUBE PERMEAMETER TEST(N.J.A.C. 7:9A - Standards for Individual Subsurface Sewage Disposal Systems; Subchapter 6, Section 6.2, page 39, Modified)
Woodard Curran 411040
Max Dry Density (pcf)
Proposed Recharge Basin-Tuchahoe, NJ
10.0
10.0
10.0
10.0
10.0
--% of Max Dry Density
1.54
Dry Density (pcf)
7Permeability at
ToC, kT
9Permeability at
20oC, k20
1.56
Trial No.Burette Readings Head, h
(cm)Temp, T
(oC)Temp
Correc.
1.35
1.29
1.24
1.37
1.39
1.44
1.65
1.48
1.42
1.46
1.67
1.50
1.44
1.37
1.41
1.43
1.31
1.26
1.38
1.32
1.35
1.49
1.52
1.37
AVERAGE k20 (in/hr):
10.0
10.0
10.0
10.0
10.0
10.0
10.0
1.48
1.30
1.50
10.0 1.35
1.34
CRAIG TESTING LABORATORIES, INC.
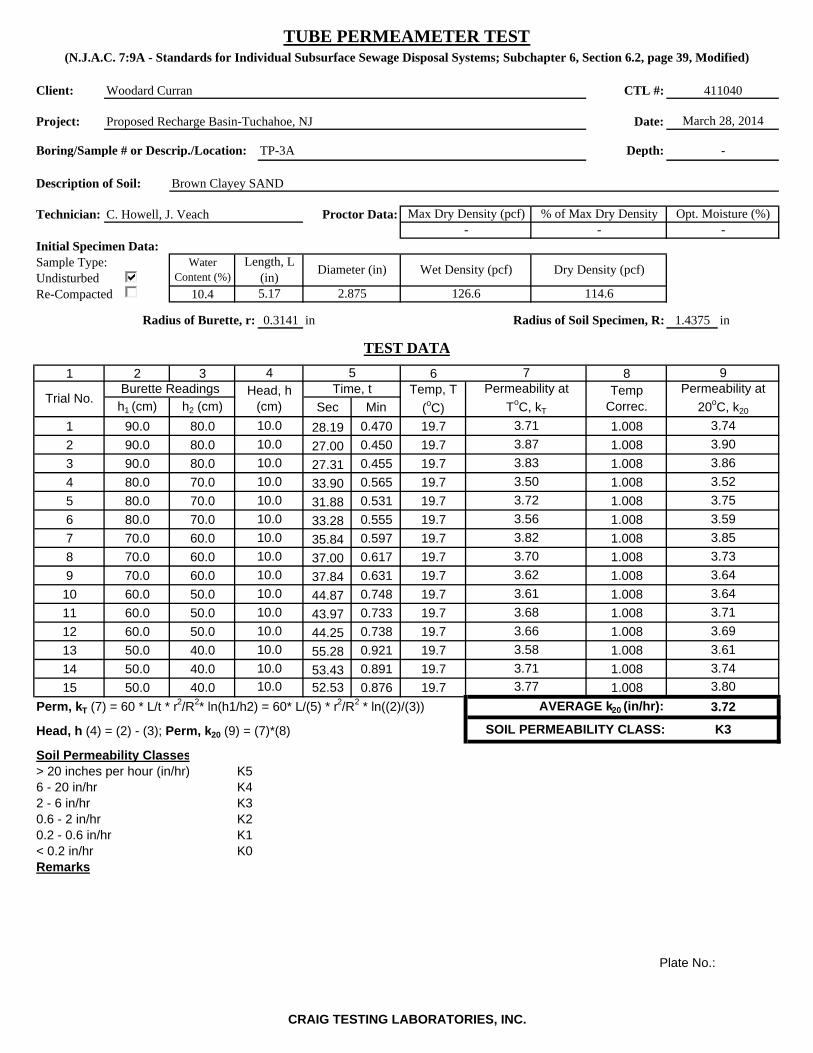
Client: CTL #:
Project: Date:
Boring/Sample # or Descrip./Location: Depth:
Description of Soil:
Technician: Proctor Data:
Initial Specimen Data:Sample Type:UndisturbedRe-Compacted 10.4
Radius of Burette, r: 0.3141 in Radius of Soil Specimen, R: 1.4375 in
1 2 3 6 8
h1 (cm) h2 (cm) Sec Min
1 90.0 80.0 28.19 0.470 19.7 1.008
2 90.0 80.0 27.00 0.450 19.7 1.008
3 90.0 80.0 27.31 0.455 19.7 1.008
4 80.0 70.0 33.90 0.565 19.7 1.008
5 80.0 70.0 31.88 0.531 19.7 1.008
6 80.0 70.0 33.28 0.555 19.7 1.008
7 70.0 60.0 35.84 0.597 19.7 1.008
8 70.0 60.0 37.00 0.617 19.7 1.008
9 70.0 60.0 37.84 0.631 19.7 1.008
10 60.0 50.0 44.87 0.748 19.7 1.008
11 60.0 50.0 43.97 0.733 19.7 1.008
12 60.0 50.0 44.25 0.738 19.7 1.008
13 50.0 40.0 55.28 0.921 19.7 1.008
14 50.0 40.0 53.43 0.891 19.7 1.008
15 50.0 40.0 52.53 0.876 19.7 1.008
Perm, kT (7) = 60 * L/t * r2/R2* ln(h1/h2) = 60* L/(5) * r2/R2 * ln((2)/(3))
Head, h (4) = (2) - (3); Perm, k20 (9) = (7)*(8)
Soil Permeability Classes> 20 inches per hour (in/hr) K56 - 20 in/hr K42 - 6 in/hr K30.6 - 2 in/hr K20.2 - 0.6 in/hr K1< 0.2 in/hr K0Remarks
Plate No.:
3.68
3.71
10.0 3.77
3.66
3.80
AVERAGE k20 (in/hr):
10.0
10.0
10.0
10.0
10.0
10.0
10.0
3.58
3.59
3.85
3.72
3.73
3.64
3.64
3.71
3.69
3.61
3.74
3.90
3.86
3.52
3.75
3.61
3.82
3.87
3.83
3.50
3.72
Temp Correc.
3.56
3.70
3.62
Trial No.Burette Readings Head, h
(cm)Temp, T
(oC)
--% of Max Dry Density
3.71
Dry Density (pcf)
7Permeability at
ToC, kT
9Permeability at
20oC, k20
3.74
10.0
10.0
10.0
10.0
10.0
March 28, 2014
Brown Clayey SAND
Opt. Moisture (%)
TUBE PERMEAMETER TEST(N.J.A.C. 7:9A - Standards for Individual Subsurface Sewage Disposal Systems; Subchapter 6, Section 6.2, page 39, Modified)
Woodard Curran 411040
Max Dry Density (pcf)
Proposed Recharge Basin-Tuchahoe, NJ
114.6
Wet Density (pcf)
126.6
C. Howell, J. Veach
Diameter (in)
2.875
Length, L (in)5.17
-
Water Content (%)
SOIL PERMEABILITY CLASS: K3
TP-3A -
TEST DATA
10.0
10.0
54Time, t
CRAIG TESTING LABORATORIES, INC.
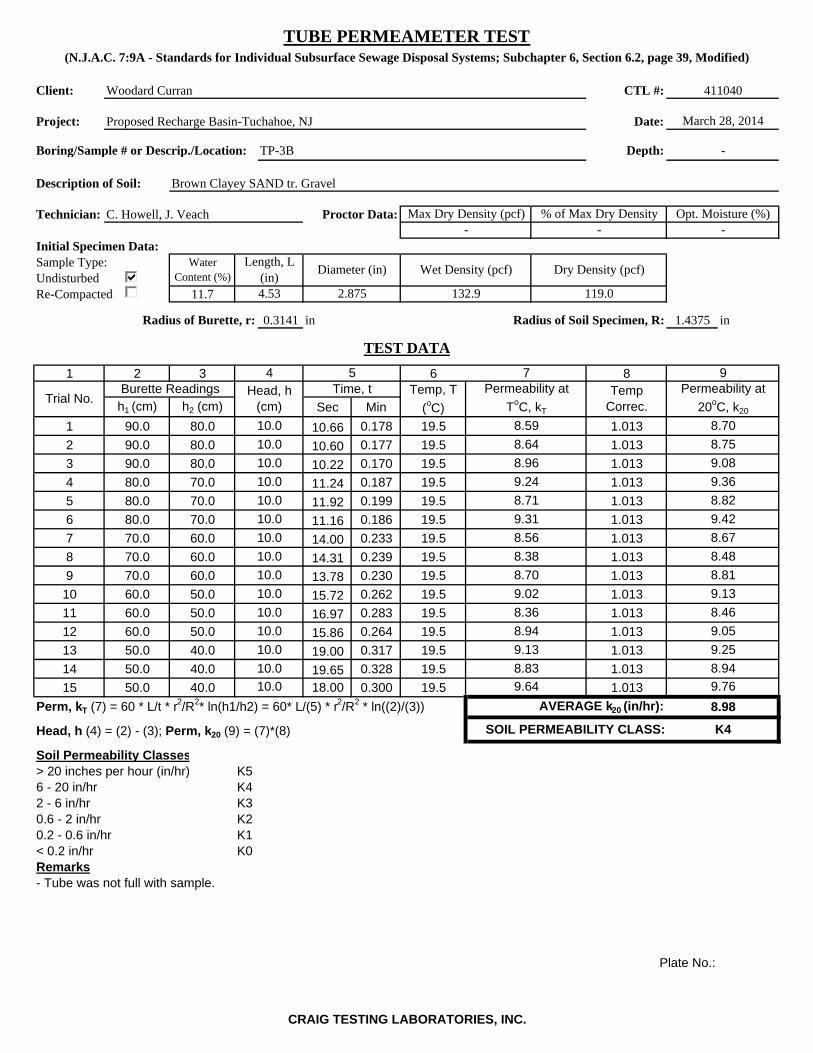
Client: CTL #:
Project: Date:
Boring/Sample # or Descrip./Location: Depth:
Description of Soil:
Technician: Proctor Data:
Initial Specimen Data:Sample Type:UndisturbedRe-Compacted 11.7
Radius of Burette, r: 0.3141 in Radius of Soil Specimen, R: 1.4375 in
1 2 3 6 8
h1 (cm) h2 (cm) Sec Min
1 90.0 80.0 10.66 0.178 19.5 1.013
2 90.0 80.0 10.60 0.177 19.5 1.013
3 90.0 80.0 10.22 0.170 19.5 1.013
4 80.0 70.0 11.24 0.187 19.5 1.013
5 80.0 70.0 11.92 0.199 19.5 1.013
6 80.0 70.0 11.16 0.186 19.5 1.013
7 70.0 60.0 14.00 0.233 19.5 1.013
8 70.0 60.0 14.31 0.239 19.5 1.013
9 70.0 60.0 13.78 0.230 19.5 1.013
10 60.0 50.0 15.72 0.262 19.5 1.013
11 60.0 50.0 16.97 0.283 19.5 1.013
12 60.0 50.0 15.86 0.264 19.5 1.013
13 50.0 40.0 19.00 0.317 19.5 1.013
14 50.0 40.0 19.65 0.328 19.5 1.013
15 50.0 40.0 18.00 0.300 19.5 1.013
Perm, kT (7) = 60 * L/t * r2/R2* ln(h1/h2) = 60* L/(5) * r2/R2 * ln((2)/(3))
Head, h (4) = (2) - (3); Perm, k20 (9) = (7)*(8)
Soil Permeability Classes> 20 inches per hour (in/hr) K56 - 20 in/hr K42 - 6 in/hr K30.6 - 2 in/hr K20.2 - 0.6 in/hr K1< 0.2 in/hr K0Remarks- Tube was not full with sample.
Plate No.:
SOIL PERMEABILITY CLASS: K4
TP-3B -
TEST DATA
10.0
10.0
54Time, t
119.0
Wet Density (pcf)
132.9
C. Howell, J. Veach
Diameter (in)
2.875
Length, L (in)4.53
-
Water Content (%)
March 28, 2014
Brown Clayey SAND tr. Gravel
Opt. Moisture (%)
TUBE PERMEAMETER TEST(N.J.A.C. 7:9A - Standards for Individual Subsurface Sewage Disposal Systems; Subchapter 6, Section 6.2, page 39, Modified)
Woodard Curran 411040
Max Dry Density (pcf)
Proposed Recharge Basin-Tuchahoe, NJ
10.0
10.0
10.0
10.0
10.0
--% of Max Dry Density
8.59
Dry Density (pcf)
7Permeability at
ToC, kT
9Permeability at
20oC, k20
8.70
Trial No.Burette Readings Head, h
(cm)Temp, T
(oC)Temp
Correc.
9.31
8.38
8.70
9.02
8.56
8.64
8.96
9.24
8.71
8.75
9.08
9.36
8.82
9.42
8.67
8.98
8.48
8.81
9.13
8.46
9.05
9.25
8.94
9.76
AVERAGE k20 (in/hr):
10.0
10.0
10.0
10.0
10.0
10.0
10.0
9.13
8.36
8.83
10.0 9.64
8.94
CRAIG TESTING LABORATORIES, INC.

SJG – BL England (225616) Woodard & CurranUpper Township, New Jersey June 2014
APPENDIX D: PRE-DEVELOPMENT ANALYSIS

1S
Existing WSD A - ToMount Pleasant Road
Routing Diagram for 2014.10.17 HydroCADPrepared by W&C, Printed 10/17/2014
HydroCAD® 10.00 s/n 01204 © 2012 HydroCAD Software Solutions LLC
Subcat Reach Pond Link

Type III 24-hr 2 Year Rainfall=3.35"2014.10.17 HydroCADPrinted 10/17/2014Prepared by W&C
HydroCAD® 10.00 s/n 01204 © 2012 HydroCAD Software Solutions LLC
Time span=0.00-72.00 hrs, dt=0.01 hrs, 7201 pointsRunoff by SCS TR-20 method, UH=SCS
Reach routing by Stor-Ind+Trans method - Pond routing by Stor-Ind method
Runoff Area=1.550 ac 0.00% Impervious Runoff Depth=0.55"Subcatchment 1S: Existing WSD A - ToFlow Length=387' Tc=14.7 min CN=62 Runoff=0.54 cfs 0.071 af
Total Runoff Area = 1.550 ac Runoff Volume = 0.071 af Average Runoff Depth = 0.55"100.00% Pervious = 1.550 ac 0.00% Impervious = 0.000 ac

Type III 24-hr 2 Year Rainfall=3.35"2014.10.17 HydroCADPrinted 10/17/2014Prepared by W&C
HydroCAD® 10.00 s/n 01204 © 2012 HydroCAD Software Solutions LLC
Summary for Subcatchment 1S: Existing WSD A - To Mount Pleasant Road
Runoff = 0.54 cfs @ 12.26 hrs, Volume= 0.071 af, Depth= 0.55"
Runoff by SCS TR-20 method, UH=SCS, Time Span= 0.00-72.00 hrs, dt= 0.01 hrsType III 24-hr 2 Year Rainfall=3.35"
Area (ac) CN Description
0.440 58 Woods/grass comb., Good, HSG B* 0.170 82 Baseball Field, HSG B
0.940 61 >75% Grass cover, Good, HSG B
1.550 62 Weighted Average1.550 100.00% Pervious Area
Tc Length Slope Velocity Capacity Description(min) (feet) (ft/ft) (ft/sec) (cfs)
10.5 50 0.0040 0.08 Sheet Flow, ABGrass: Short n= 0.150 P2= 3.35"
4.2 337 0.0080 1.34 Shallow Concentrated Flow, BCGrassed Waterway Kv= 15.0 fps
14.7 387 Total

Type III 24-hr 10 Year Rainfall=5.21"2014.10.17 HydroCADPrinted 10/17/2014Prepared by W&C
HydroCAD® 10.00 s/n 01204 © 2012 HydroCAD Software Solutions LLC
Time span=0.00-72.00 hrs, dt=0.01 hrs, 7201 pointsRunoff by SCS TR-20 method, UH=SCS
Reach routing by Stor-Ind+Trans method - Pond routing by Stor-Ind method
Runoff Area=1.550 ac 0.00% Impervious Runoff Depth=1.57"Subcatchment 1S: Existing WSD A - ToFlow Length=387' Tc=14.7 min CN=62 Runoff=2.01 cfs 0.203 af
Total Runoff Area = 1.550 ac Runoff Volume = 0.203 af Average Runoff Depth = 1.57"100.00% Pervious = 1.550 ac 0.00% Impervious = 0.000 ac

Type III 24-hr 10 Year Rainfall=5.21"2014.10.17 HydroCADPrinted 10/17/2014Prepared by W&C
HydroCAD® 10.00 s/n 01204 © 2012 HydroCAD Software Solutions LLC
Summary for Subcatchment 1S: Existing WSD A - To Mount Pleasant Road
Runoff = 2.01 cfs @ 12.22 hrs, Volume= 0.203 af, Depth= 1.57"
Runoff by SCS TR-20 method, UH=SCS, Time Span= 0.00-72.00 hrs, dt= 0.01 hrsType III 24-hr 10 Year Rainfall=5.21"
Area (ac) CN Description
0.440 58 Woods/grass comb., Good, HSG B* 0.170 82 Baseball Field, HSG B
0.940 61 >75% Grass cover, Good, HSG B
1.550 62 Weighted Average1.550 100.00% Pervious Area
Tc Length Slope Velocity Capacity Description(min) (feet) (ft/ft) (ft/sec) (cfs)
10.5 50 0.0040 0.08 Sheet Flow, ABGrass: Short n= 0.150 P2= 3.35"
4.2 337 0.0080 1.34 Shallow Concentrated Flow, BCGrassed Waterway Kv= 15.0 fps
14.7 387 Total

Type III 24-hr 100 Year Rainfall=9.00"2014.10.17 HydroCADPrinted 10/17/2014Prepared by W&C
HydroCAD® 10.00 s/n 01204 © 2012 HydroCAD Software Solutions LLC
Time span=0.00-72.00 hrs, dt=0.01 hrs, 7201 pointsRunoff by SCS TR-20 method, UH=SCS
Reach routing by Stor-Ind+Trans method - Pond routing by Stor-Ind method
Runoff Area=1.550 ac 0.00% Impervious Runoff Depth=4.35"Subcatchment 1S: Existing WSD A - ToFlow Length=387' Tc=14.7 min CN=62 Runoff=6.00 cfs 0.561 af
Total Runoff Area = 1.550 ac Runoff Volume = 0.561 af Average Runoff Depth = 4.35"100.00% Pervious = 1.550 ac 0.00% Impervious = 0.000 ac

Type III 24-hr 100 Year Rainfall=9.00"2014.10.17 HydroCADPrinted 10/17/2014Prepared by W&C
HydroCAD® 10.00 s/n 01204 © 2012 HydroCAD Software Solutions LLC
Summary for Subcatchment 1S: Existing WSD A - To Mount Pleasant Road
Runoff = 6.00 cfs @ 12.20 hrs, Volume= 0.561 af, Depth= 4.35"
Runoff by SCS TR-20 method, UH=SCS, Time Span= 0.00-72.00 hrs, dt= 0.01 hrsType III 24-hr 100 Year Rainfall=9.00"
Area (ac) CN Description
0.440 58 Woods/grass comb., Good, HSG B* 0.170 82 Baseball Field, HSG B
0.940 61 >75% Grass cover, Good, HSG B
1.550 62 Weighted Average1.550 100.00% Pervious Area
Tc Length Slope Velocity Capacity Description(min) (feet) (ft/ft) (ft/sec) (cfs)
10.5 50 0.0040 0.08 Sheet Flow, ABGrass: Short n= 0.150 P2= 3.35"
4.2 337 0.0080 1.34 Shallow Concentrated Flow, BCGrassed Waterway Kv= 15.0 fps
14.7 387 Total

SJG – BL England (225616) Woodard & CurranUpper Township, New Jersey June 2014
APPENDIX E: POST-DEVELOPMENT ANALYSIS

2S
Proposed WSD A-1 - ToProposed Infiltration
Area
3S
Proposed WSD A-2 -Direct to MountPleasant Road
4P
Crushed StoneInfiltration Area 5L
Proposed WSD A - ToMount Pleasant Road
Routing Diagram for 2014.10.17 HydroCADPrepared by W&C, Printed 10/17/2014
HydroCAD® 10.00 s/n 01204 © 2012 HydroCAD Software Solutions LLC
Subcat Reach Pond Link

Type III 24-hr 2 Year Rainfall=3.35"2014.10.17 HydroCADPrinted 10/17/2014Prepared by W&C
HydroCAD® 10.00 s/n 01204 © 2012 HydroCAD Software Solutions LLC
Time span=0.00-72.00 hrs, dt=0.01 hrs, 7201 pointsRunoff by SCS TR-20 method, UH=SCS
Reach routing by Stor-Ind+Trans method - Pond routing by Stor-Ind method
Runoff Area=0.790 ac 63.29% Impervious Runoff Depth=1.89"Subcatchment 2S: Proposed WSD A-1 - ToTc=0.0 min CN=85 Runoff=2.14 cfs 0.124 af
Runoff Area=0.760 ac 0.00% Impervious Runoff Depth=0.59"Subcatchment 3S: Proposed WSD A-2 -Flow Length=352' Tc=16.6 min CN=63 Runoff=0.28 cfs 0.037 af
Peak Elev=18.58' Storage=679 cf Inflow=2.14 cfs 0.124 afPond 4P: Crushed Stone Infiltration AreaDiscarded=0.71 cfs 0.124 af Primary=0.00 cfs 0.000 af Outflow=0.71 cfs 0.124 af
Inflow=0.28 cfs 0.037 afLink 5L: Proposed WSD A - To Mount Pleasant RoadPrimary=0.28 cfs 0.037 af
Total Runoff Area = 1.550 ac Runoff Volume = 0.161 af Average Runoff Depth = 1.25"67.74% Pervious = 1.050 ac 32.26% Impervious = 0.500 ac

Type III 24-hr 2 Year Rainfall=3.35"2014.10.17 HydroCADPrinted 10/17/2014Prepared by W&C
HydroCAD® 10.00 s/n 01204 © 2012 HydroCAD Software Solutions LLC
Summary for Subcatchment 2S: Proposed WSD A-1 - To Proposed Infiltration Area
Runoff = 2.14 cfs @ 12.00 hrs, Volume= 0.124 af, Depth= 1.89"
Runoff by SCS TR-20 method, UH=SCS, Time Span= 0.00-72.00 hrs, dt= 0.01 hrsType III 24-hr 2 Year Rainfall=3.35"
Area (ac) CN Description
* 0.500 98 Crushed stone, HSG B0.190 61 >75% Grass cover, Good, HSG B
* 0.030 82 Baseball Field, HSG B0.070 58 Woods/grass comb., Good, HSG B
0.790 85 Weighted Average0.290 36.71% Pervious Area0.500 63.29% Impervious Area
Tc Length Slope Velocity Capacity Description(min) (feet) (ft/ft) (ft/sec) (cfs)
0.0 Direct Entry, Direct to Crushed Stone
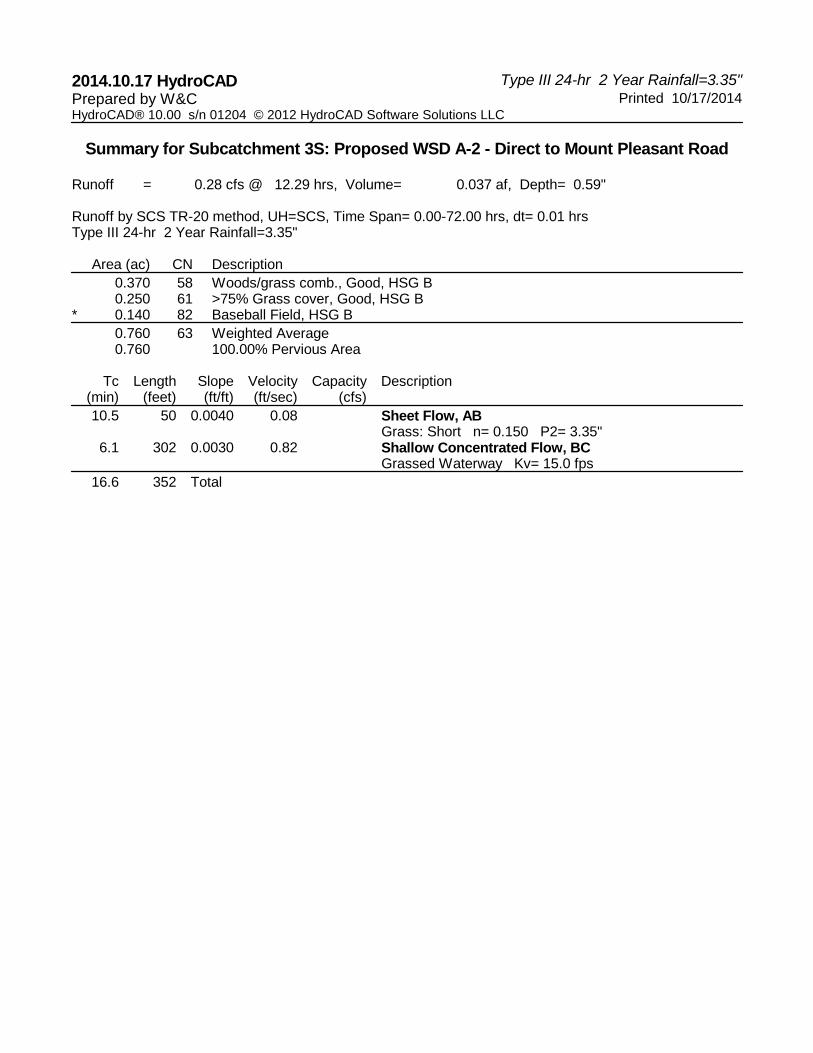
Type III 24-hr 2 Year Rainfall=3.35"2014.10.17 HydroCADPrinted 10/17/2014Prepared by W&C
HydroCAD® 10.00 s/n 01204 © 2012 HydroCAD Software Solutions LLC
Summary for Subcatchment 3S: Proposed WSD A-2 - Direct to Mount Pleasant Road
Runoff = 0.28 cfs @ 12.29 hrs, Volume= 0.037 af, Depth= 0.59"
Runoff by SCS TR-20 method, UH=SCS, Time Span= 0.00-72.00 hrs, dt= 0.01 hrsType III 24-hr 2 Year Rainfall=3.35"
Area (ac) CN Description
0.370 58 Woods/grass comb., Good, HSG B0.250 61 >75% Grass cover, Good, HSG B
* 0.140 82 Baseball Field, HSG B
0.760 63 Weighted Average0.760 100.00% Pervious Area
Tc Length Slope Velocity Capacity Description(min) (feet) (ft/ft) (ft/sec) (cfs)
10.5 50 0.0040 0.08 Sheet Flow, ABGrass: Short n= 0.150 P2= 3.35"
6.1 302 0.0030 0.82 Shallow Concentrated Flow, BCGrassed Waterway Kv= 15.0 fps
16.6 352 Total

Type III 24-hr 2 Year Rainfall=3.35"2014.10.17 HydroCADPrinted 10/17/2014Prepared by W&C
HydroCAD® 10.00 s/n 01204 © 2012 HydroCAD Software Solutions LLC
Summary for Pond 4P: Crushed Stone Infiltration Area
Inflow Area = 0.790 ac, 63.29% Impervious, Inflow Depth = 1.89" for 2 Year eventInflow = 2.14 cfs @ 12.00 hrs, Volume= 0.124 afOutflow = 0.71 cfs @ 12.23 hrs, Volume= 0.124 af, Atten= 67%, Lag= 14.0 minDiscarded = 0.71 cfs @ 12.23 hrs, Volume= 0.124 afPrimary = 0.00 cfs @ 0.00 hrs, Volume= 0.000 af
Routing by Stor-Ind method, Time Span= 0.00-72.00 hrs, dt= 0.01 hrsPeak Elev= 18.58' @ 12.23 hrs Surf.Area= 21,000 sf Storage= 679 cf
Plug-Flow detention time= 4.9 min calculated for 0.124 af (100% of inflow)Center-of-Mass det. time= 4.9 min ( 823.4 - 818.5 )
Volume Invert Avail.Storage Storage Description
#1 19.00' 2,100 cf 150.00'W x 140.00'L x 0.10'H Crushed Stone Surface#2 18.50' 4,200 cf 150.00'W x 140.00'L x 0.50'H Crushed Stone Infiltration Area
10,500 cf Overall x 40.0% Voids
6,300 cf Total Available Storage
Device Routing Invert Outlet Devices
#1 Discarded 18.50' 1.430 in/hr Exfiltration over Surface areaConductivity to Groundwater Elevation = 14.67'
#2 Primary 19.00' 290.0' long Sharp-Crested Vee/Trap Weir Cv= 2.62 (C= 3.28)
Discarded OutFlow Max=0.71 cfs @ 12.23 hrs HW=18.58' (Free Discharge)1=Exfiltration ( Controls 0.71 cfs)
Primary OutFlow Max=0.00 cfs @ 0.00 hrs HW=18.50' (Free Discharge)2=Sharp-Crested Vee/Trap Weir ( Controls 0.00 cfs)

Type III 24-hr 2 Year Rainfall=3.35"2014.10.17 HydroCADPrinted 10/17/2014Prepared by W&C
HydroCAD® 10.00 s/n 01204 © 2012 HydroCAD Software Solutions LLC
Stage-Area-Storage for Pond 4P: Crushed Stone Infiltration Area
Elevation(feet)
Surface(sq-ft)
Storage(cubic-feet)
18.50 21,000 018.51 21,000 8418.52 21,000 16818.53 21,000 25218.54 21,000 33618.55 21,000 42018.56 21,000 50418.57 21,000 58818.58 21,000 67218.59 21,000 75618.60 21,000 84018.61 21,000 92418.62 21,000 1,00818.63 21,000 1,09218.64 21,000 1,17618.65 21,000 1,26018.66 21,000 1,34418.67 21,000 1,42818.68 21,000 1,51218.69 21,000 1,59618.70 21,000 1,68018.71 21,000 1,76418.72 21,000 1,84818.73 21,000 1,93218.74 21,000 2,01618.75 21,000 2,10018.76 21,000 2,18418.77 21,000 2,26818.78 21,000 2,35218.79 21,000 2,43618.80 21,000 2,52018.81 21,000 2,60418.82 21,000 2,68818.83 21,000 2,77218.84 21,000 2,85618.85 21,000 2,94018.86 21,000 3,02418.87 21,000 3,10818.88 21,000 3,19218.89 21,000 3,27618.90 21,000 3,36018.91 21,000 3,44418.92 21,000 3,52818.93 21,000 3,61218.94 21,000 3,69618.95 21,000 3,78018.96 21,000 3,86418.97 21,000 3,94818.98 21,000 4,03218.99 21,000 4,11619.00 42,000 4,20019.01 42,000 4,410
Elevation(feet)
Surface(sq-ft)
Storage(cubic-feet)
19.02 42,000 4,62019.03 42,000 4,83019.04 42,000 5,04019.05 42,000 5,25019.06 42,000 5,46019.07 42,000 5,67019.08 42,000 5,88019.09 42,000 6,09019.10 42,000 6,300

Type III 24-hr 2 Year Rainfall=3.35"2014.10.17 HydroCADPrinted 10/17/2014Prepared by W&C
HydroCAD® 10.00 s/n 01204 © 2012 HydroCAD Software Solutions LLC
Summary for Link 5L: Proposed WSD A - To Mount Pleasant Road
Inflow Area = 1.550 ac, 32.26% Impervious, Inflow Depth = 0.29" for 2 Year eventInflow = 0.28 cfs @ 12.29 hrs, Volume= 0.037 afPrimary = 0.28 cfs @ 12.29 hrs, Volume= 0.037 af, Atten= 0%, Lag= 0.0 min
Primary outflow = Inflow, Time Span= 0.00-72.00 hrs, dt= 0.01 hrs
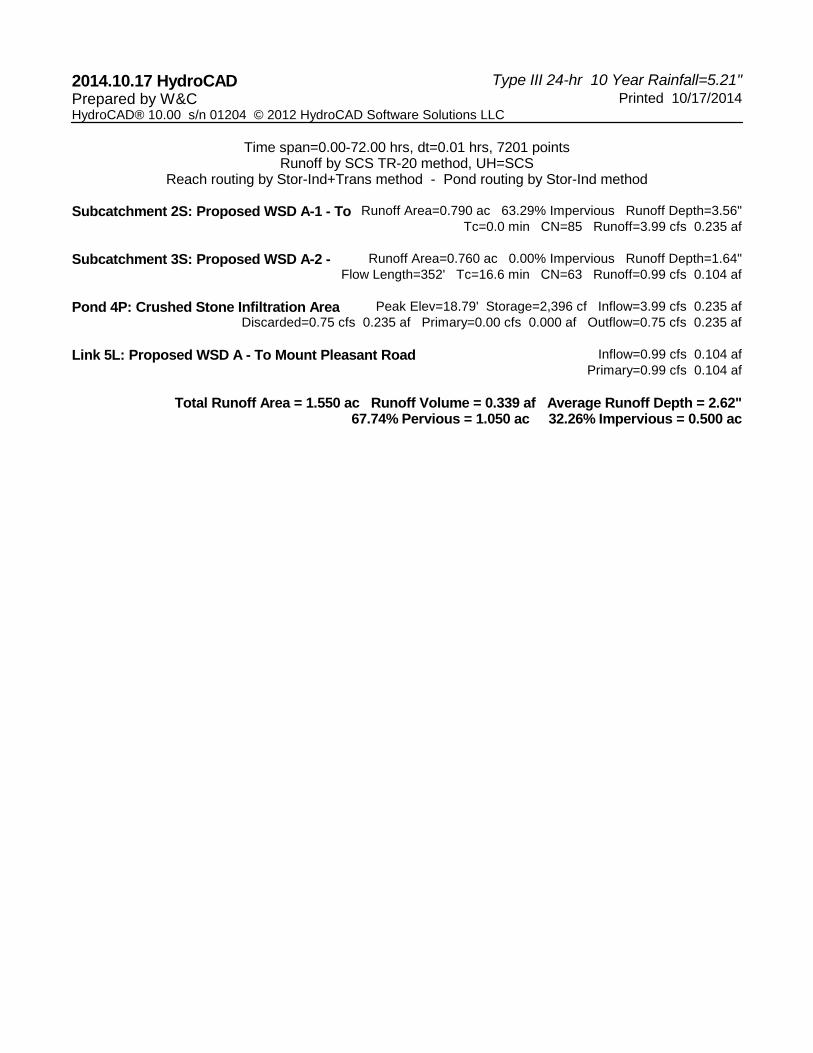
Type III 24-hr 10 Year Rainfall=5.21"2014.10.17 HydroCADPrinted 10/17/2014Prepared by W&C
HydroCAD® 10.00 s/n 01204 © 2012 HydroCAD Software Solutions LLC
Time span=0.00-72.00 hrs, dt=0.01 hrs, 7201 pointsRunoff by SCS TR-20 method, UH=SCS
Reach routing by Stor-Ind+Trans method - Pond routing by Stor-Ind method
Runoff Area=0.790 ac 63.29% Impervious Runoff Depth=3.56"Subcatchment 2S: Proposed WSD A-1 - ToTc=0.0 min CN=85 Runoff=3.99 cfs 0.235 af
Runoff Area=0.760 ac 0.00% Impervious Runoff Depth=1.64"Subcatchment 3S: Proposed WSD A-2 -Flow Length=352' Tc=16.6 min CN=63 Runoff=0.99 cfs 0.104 af
Peak Elev=18.79' Storage=2,396 cf Inflow=3.99 cfs 0.235 afPond 4P: Crushed Stone Infiltration AreaDiscarded=0.75 cfs 0.235 af Primary=0.00 cfs 0.000 af Outflow=0.75 cfs 0.235 af
Inflow=0.99 cfs 0.104 afLink 5L: Proposed WSD A - To Mount Pleasant RoadPrimary=0.99 cfs 0.104 af
Total Runoff Area = 1.550 ac Runoff Volume = 0.339 af Average Runoff Depth = 2.62"67.74% Pervious = 1.050 ac 32.26% Impervious = 0.500 ac

Type III 24-hr 10 Year Rainfall=5.21"2014.10.17 HydroCADPrinted 10/17/2014Prepared by W&C
HydroCAD® 10.00 s/n 01204 © 2012 HydroCAD Software Solutions LLC
Summary for Subcatchment 2S: Proposed WSD A-1 - To Proposed Infiltration Area
Runoff = 3.99 cfs @ 12.00 hrs, Volume= 0.235 af, Depth= 3.56"
Runoff by SCS TR-20 method, UH=SCS, Time Span= 0.00-72.00 hrs, dt= 0.01 hrsType III 24-hr 10 Year Rainfall=5.21"
Area (ac) CN Description
* 0.500 98 Crushed stone, HSG B0.190 61 >75% Grass cover, Good, HSG B
* 0.030 82 Baseball Field, HSG B0.070 58 Woods/grass comb., Good, HSG B
0.790 85 Weighted Average0.290 36.71% Pervious Area0.500 63.29% Impervious Area
Tc Length Slope Velocity Capacity Description(min) (feet) (ft/ft) (ft/sec) (cfs)
0.0 Direct Entry, Direct to Crushed Stone

Type III 24-hr 10 Year Rainfall=5.21"2014.10.17 HydroCADPrinted 10/17/2014Prepared by W&C
HydroCAD® 10.00 s/n 01204 © 2012 HydroCAD Software Solutions LLC
Summary for Subcatchment 3S: Proposed WSD A-2 - Direct to Mount Pleasant Road
Runoff = 0.99 cfs @ 12.25 hrs, Volume= 0.104 af, Depth= 1.64"
Runoff by SCS TR-20 method, UH=SCS, Time Span= 0.00-72.00 hrs, dt= 0.01 hrsType III 24-hr 10 Year Rainfall=5.21"
Area (ac) CN Description
0.370 58 Woods/grass comb., Good, HSG B0.250 61 >75% Grass cover, Good, HSG B
* 0.140 82 Baseball Field, HSG B
0.760 63 Weighted Average0.760 100.00% Pervious Area
Tc Length Slope Velocity Capacity Description(min) (feet) (ft/ft) (ft/sec) (cfs)
10.5 50 0.0040 0.08 Sheet Flow, ABGrass: Short n= 0.150 P2= 3.35"
6.1 302 0.0030 0.82 Shallow Concentrated Flow, BCGrassed Waterway Kv= 15.0 fps
16.6 352 Total

Type III 24-hr 10 Year Rainfall=5.21"2014.10.17 HydroCADPrinted 10/17/2014Prepared by W&C
HydroCAD® 10.00 s/n 01204 © 2012 HydroCAD Software Solutions LLC
Summary for Pond 4P: Crushed Stone Infiltration Area
Inflow Area = 0.790 ac, 63.29% Impervious, Inflow Depth = 3.56" for 10 Year eventInflow = 3.99 cfs @ 12.00 hrs, Volume= 0.235 afOutflow = 0.75 cfs @ 12.40 hrs, Volume= 0.235 af, Atten= 81%, Lag= 24.0 minDiscarded = 0.75 cfs @ 12.40 hrs, Volume= 0.235 afPrimary = 0.00 cfs @ 0.00 hrs, Volume= 0.000 af
Routing by Stor-Ind method, Time Span= 0.00-72.00 hrs, dt= 0.01 hrsPeak Elev= 18.79' @ 12.40 hrs Surf.Area= 21,000 sf Storage= 2,396 cf
Plug-Flow detention time= 17.9 min calculated for 0.235 af (100% of inflow)Center-of-Mass det. time= 17.9 min ( 818.3 - 800.4 )
Volume Invert Avail.Storage Storage Description
#1 19.00' 2,100 cf 150.00'W x 140.00'L x 0.10'H Crushed Stone Surface#2 18.50' 4,200 cf 150.00'W x 140.00'L x 0.50'H Crushed Stone Infiltration Area
10,500 cf Overall x 40.0% Voids
6,300 cf Total Available Storage
Device Routing Invert Outlet Devices
#1 Discarded 18.50' 1.430 in/hr Exfiltration over Surface areaConductivity to Groundwater Elevation = 14.67'
#2 Primary 19.00' 290.0' long Sharp-Crested Vee/Trap Weir Cv= 2.62 (C= 3.28)
Discarded OutFlow Max=0.75 cfs @ 12.40 hrs HW=18.79' (Free Discharge)1=Exfiltration ( Controls 0.75 cfs)
Primary OutFlow Max=0.00 cfs @ 0.00 hrs HW=18.50' (Free Discharge)2=Sharp-Crested Vee/Trap Weir ( Controls 0.00 cfs)

Type III 24-hr 10 Year Rainfall=5.21"2014.10.17 HydroCADPrinted 10/17/2014Prepared by W&C
HydroCAD® 10.00 s/n 01204 © 2012 HydroCAD Software Solutions LLC
Stage-Area-Storage for Pond 4P: Crushed Stone Infiltration Area
Elevation(feet)
Surface(sq-ft)
Storage(cubic-feet)
18.50 21,000 018.51 21,000 8418.52 21,000 16818.53 21,000 25218.54 21,000 33618.55 21,000 42018.56 21,000 50418.57 21,000 58818.58 21,000 67218.59 21,000 75618.60 21,000 84018.61 21,000 92418.62 21,000 1,00818.63 21,000 1,09218.64 21,000 1,17618.65 21,000 1,26018.66 21,000 1,34418.67 21,000 1,42818.68 21,000 1,51218.69 21,000 1,59618.70 21,000 1,68018.71 21,000 1,76418.72 21,000 1,84818.73 21,000 1,93218.74 21,000 2,01618.75 21,000 2,10018.76 21,000 2,18418.77 21,000 2,26818.78 21,000 2,35218.79 21,000 2,43618.80 21,000 2,52018.81 21,000 2,60418.82 21,000 2,68818.83 21,000 2,77218.84 21,000 2,85618.85 21,000 2,94018.86 21,000 3,02418.87 21,000 3,10818.88 21,000 3,19218.89 21,000 3,27618.90 21,000 3,36018.91 21,000 3,44418.92 21,000 3,52818.93 21,000 3,61218.94 21,000 3,69618.95 21,000 3,78018.96 21,000 3,86418.97 21,000 3,94818.98 21,000 4,03218.99 21,000 4,11619.00 42,000 4,20019.01 42,000 4,410
Elevation(feet)
Surface(sq-ft)
Storage(cubic-feet)
19.02 42,000 4,62019.03 42,000 4,83019.04 42,000 5,04019.05 42,000 5,25019.06 42,000 5,46019.07 42,000 5,67019.08 42,000 5,88019.09 42,000 6,09019.10 42,000 6,300

Type III 24-hr 10 Year Rainfall=5.21"2014.10.17 HydroCADPrinted 10/17/2014Prepared by W&C
HydroCAD® 10.00 s/n 01204 © 2012 HydroCAD Software Solutions LLC
Summary for Link 5L: Proposed WSD A - To Mount Pleasant Road
Inflow Area = 1.550 ac, 32.26% Impervious, Inflow Depth = 0.81" for 10 Year eventInflow = 0.99 cfs @ 12.25 hrs, Volume= 0.104 afPrimary = 0.99 cfs @ 12.25 hrs, Volume= 0.104 af, Atten= 0%, Lag= 0.0 min
Primary outflow = Inflow, Time Span= 0.00-72.00 hrs, dt= 0.01 hrs

Type III 24-hr 100 Year Rainfall=9.00"2014.10.17 HydroCADPrinted 10/17/2014Prepared by W&C
HydroCAD® 10.00 s/n 01204 © 2012 HydroCAD Software Solutions LLC
Time span=0.00-72.00 hrs, dt=0.01 hrs, 7201 pointsRunoff by SCS TR-20 method, UH=SCS
Reach routing by Stor-Ind+Trans method - Pond routing by Stor-Ind method
Runoff Area=0.790 ac 63.29% Impervious Runoff Depth=7.18"Subcatchment 2S: Proposed WSD A-1 - ToTc=0.0 min CN=85 Runoff=7.78 cfs 0.473 af
Runoff Area=0.760 ac 0.00% Impervious Runoff Depth=4.47"Subcatchment 3S: Proposed WSD A-2 -Flow Length=352' Tc=16.6 min CN=63 Runoff=2.89 cfs 0.283 af
Peak Elev=19.02' Storage=4,560 cf Inflow=7.78 cfs 0.473 afPond 4P: Crushed Stone Infiltration AreaDiscarded=1.49 cfs 0.439 af Primary=2.15 cfs 0.034 af Outflow=3.63 cfs 0.473 af
Inflow=4.15 cfs 0.317 afLink 5L: Proposed WSD A - To Mount Pleasant RoadPrimary=4.15 cfs 0.317 af
Total Runoff Area = 1.550 ac Runoff Volume = 0.756 af Average Runoff Depth = 5.85"67.74% Pervious = 1.050 ac 32.26% Impervious = 0.500 ac
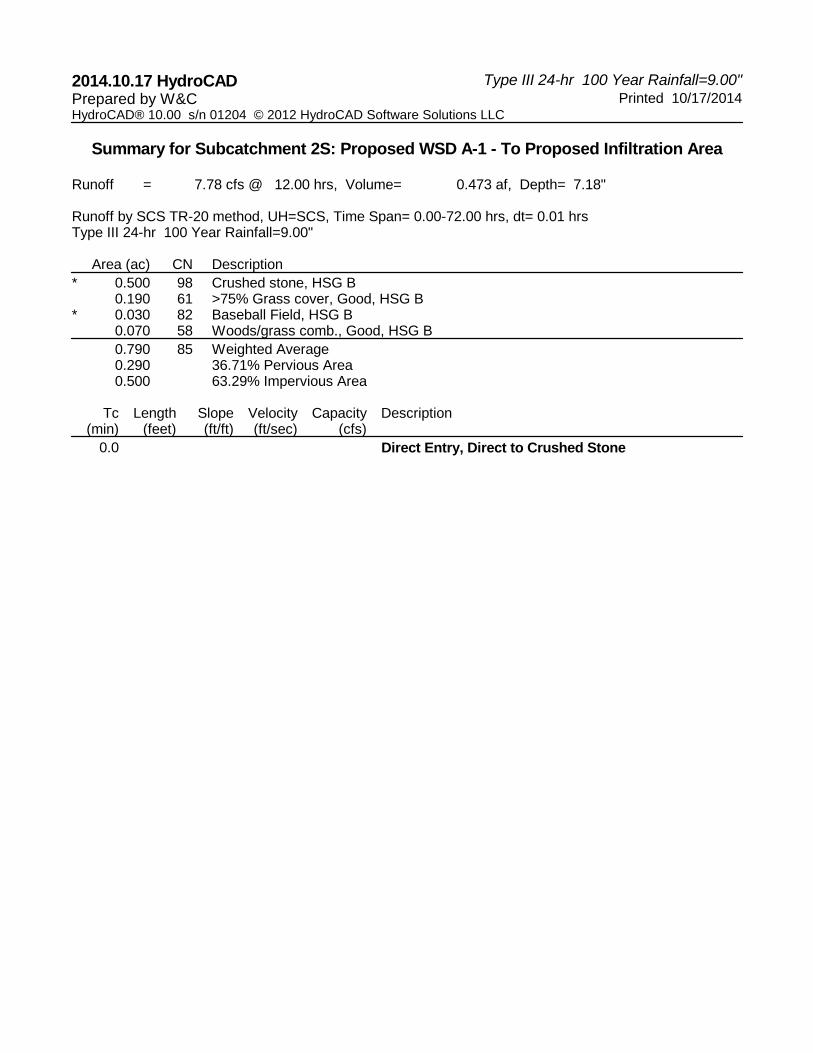
Type III 24-hr 100 Year Rainfall=9.00"2014.10.17 HydroCADPrinted 10/17/2014Prepared by W&C
HydroCAD® 10.00 s/n 01204 © 2012 HydroCAD Software Solutions LLC
Summary for Subcatchment 2S: Proposed WSD A-1 - To Proposed Infiltration Area
Runoff = 7.78 cfs @ 12.00 hrs, Volume= 0.473 af, Depth= 7.18"
Runoff by SCS TR-20 method, UH=SCS, Time Span= 0.00-72.00 hrs, dt= 0.01 hrsType III 24-hr 100 Year Rainfall=9.00"
Area (ac) CN Description
* 0.500 98 Crushed stone, HSG B0.190 61 >75% Grass cover, Good, HSG B
* 0.030 82 Baseball Field, HSG B0.070 58 Woods/grass comb., Good, HSG B
0.790 85 Weighted Average0.290 36.71% Pervious Area0.500 63.29% Impervious Area
Tc Length Slope Velocity Capacity Description(min) (feet) (ft/ft) (ft/sec) (cfs)
0.0 Direct Entry, Direct to Crushed Stone

Type III 24-hr 100 Year Rainfall=9.00"2014.10.17 HydroCADPrinted 10/17/2014Prepared by W&C
HydroCAD® 10.00 s/n 01204 © 2012 HydroCAD Software Solutions LLC
Summary for Subcatchment 3S: Proposed WSD A-2 - Direct to Mount Pleasant Road
Runoff = 2.89 cfs @ 12.23 hrs, Volume= 0.283 af, Depth= 4.47"
Runoff by SCS TR-20 method, UH=SCS, Time Span= 0.00-72.00 hrs, dt= 0.01 hrsType III 24-hr 100 Year Rainfall=9.00"
Area (ac) CN Description
0.370 58 Woods/grass comb., Good, HSG B0.250 61 >75% Grass cover, Good, HSG B
* 0.140 82 Baseball Field, HSG B
0.760 63 Weighted Average0.760 100.00% Pervious Area
Tc Length Slope Velocity Capacity Description(min) (feet) (ft/ft) (ft/sec) (cfs)
10.5 50 0.0040 0.08 Sheet Flow, ABGrass: Short n= 0.150 P2= 3.35"
6.1 302 0.0030 0.82 Shallow Concentrated Flow, BCGrassed Waterway Kv= 15.0 fps
16.6 352 Total
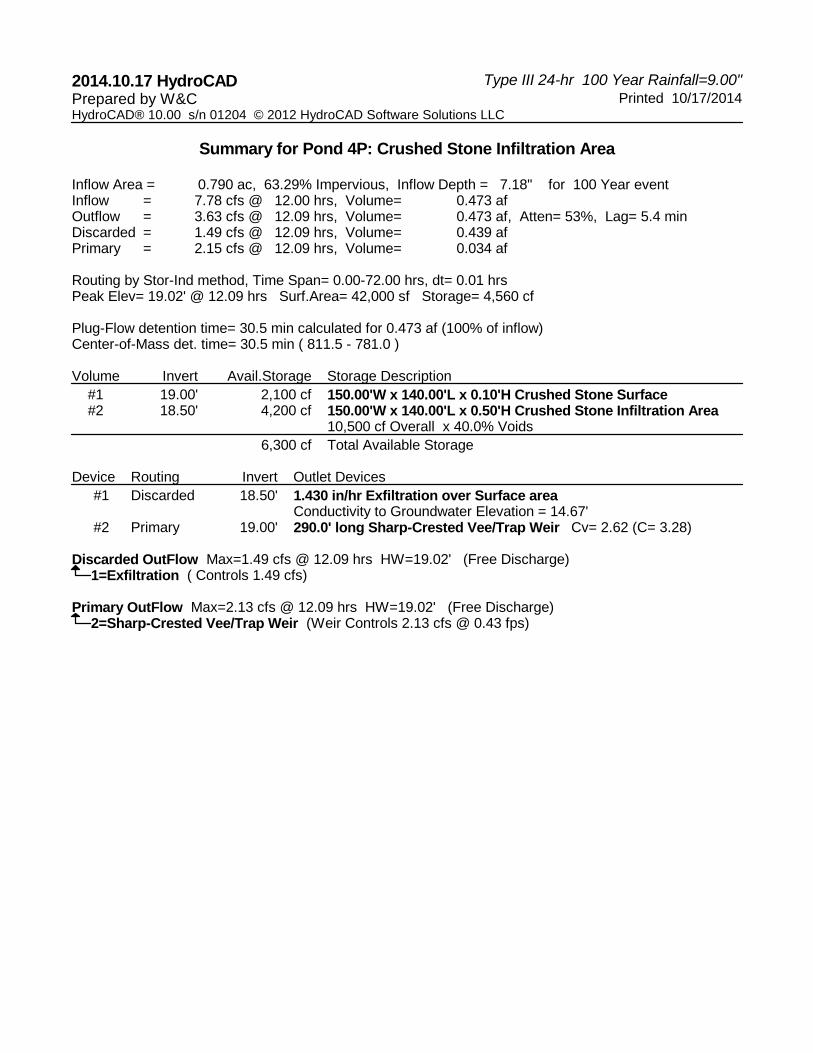
Type III 24-hr 100 Year Rainfall=9.00"2014.10.17 HydroCADPrinted 10/17/2014Prepared by W&C
HydroCAD® 10.00 s/n 01204 © 2012 HydroCAD Software Solutions LLC
Summary for Pond 4P: Crushed Stone Infiltration Area
Inflow Area = 0.790 ac, 63.29% Impervious, Inflow Depth = 7.18" for 100 Year eventInflow = 7.78 cfs @ 12.00 hrs, Volume= 0.473 afOutflow = 3.63 cfs @ 12.09 hrs, Volume= 0.473 af, Atten= 53%, Lag= 5.4 minDiscarded = 1.49 cfs @ 12.09 hrs, Volume= 0.439 afPrimary = 2.15 cfs @ 12.09 hrs, Volume= 0.034 af
Routing by Stor-Ind method, Time Span= 0.00-72.00 hrs, dt= 0.01 hrsPeak Elev= 19.02' @ 12.09 hrs Surf.Area= 42,000 sf Storage= 4,560 cf
Plug-Flow detention time= 30.5 min calculated for 0.473 af (100% of inflow)Center-of-Mass det. time= 30.5 min ( 811.5 - 781.0 )
Volume Invert Avail.Storage Storage Description
#1 19.00' 2,100 cf 150.00'W x 140.00'L x 0.10'H Crushed Stone Surface#2 18.50' 4,200 cf 150.00'W x 140.00'L x 0.50'H Crushed Stone Infiltration Area
10,500 cf Overall x 40.0% Voids
6,300 cf Total Available Storage
Device Routing Invert Outlet Devices
#1 Discarded 18.50' 1.430 in/hr Exfiltration over Surface areaConductivity to Groundwater Elevation = 14.67'
#2 Primary 19.00' 290.0' long Sharp-Crested Vee/Trap Weir Cv= 2.62 (C= 3.28)
Discarded OutFlow Max=1.49 cfs @ 12.09 hrs HW=19.02' (Free Discharge)1=Exfiltration ( Controls 1.49 cfs)
Primary OutFlow Max=2.13 cfs @ 12.09 hrs HW=19.02' (Free Discharge)2=Sharp-Crested Vee/Trap Weir (Weir Controls 2.13 cfs @ 0.43 fps)

Type III 24-hr 100 Year Rainfall=9.00"2014.10.17 HydroCADPrinted 10/17/2014Prepared by W&C
HydroCAD® 10.00 s/n 01204 © 2012 HydroCAD Software Solutions LLC
Stage-Area-Storage for Pond 4P: Crushed Stone Infiltration Area
Elevation(feet)
Surface(sq-ft)
Storage(cubic-feet)
18.50 21,000 018.51 21,000 8418.52 21,000 16818.53 21,000 25218.54 21,000 33618.55 21,000 42018.56 21,000 50418.57 21,000 58818.58 21,000 67218.59 21,000 75618.60 21,000 84018.61 21,000 92418.62 21,000 1,00818.63 21,000 1,09218.64 21,000 1,17618.65 21,000 1,26018.66 21,000 1,34418.67 21,000 1,42818.68 21,000 1,51218.69 21,000 1,59618.70 21,000 1,68018.71 21,000 1,76418.72 21,000 1,84818.73 21,000 1,93218.74 21,000 2,01618.75 21,000 2,10018.76 21,000 2,18418.77 21,000 2,26818.78 21,000 2,35218.79 21,000 2,43618.80 21,000 2,52018.81 21,000 2,60418.82 21,000 2,68818.83 21,000 2,77218.84 21,000 2,85618.85 21,000 2,94018.86 21,000 3,02418.87 21,000 3,10818.88 21,000 3,19218.89 21,000 3,27618.90 21,000 3,36018.91 21,000 3,44418.92 21,000 3,52818.93 21,000 3,61218.94 21,000 3,69618.95 21,000 3,78018.96 21,000 3,86418.97 21,000 3,94818.98 21,000 4,03218.99 21,000 4,11619.00 42,000 4,20019.01 42,000 4,410
Elevation(feet)
Surface(sq-ft)
Storage(cubic-feet)
19.02 42,000 4,62019.03 42,000 4,83019.04 42,000 5,04019.05 42,000 5,25019.06 42,000 5,46019.07 42,000 5,67019.08 42,000 5,88019.09 42,000 6,09019.10 42,000 6,300

Type III 24-hr 100 Year Rainfall=9.00"2014.10.17 HydroCADPrinted 10/17/2014Prepared by W&C
HydroCAD® 10.00 s/n 01204 © 2012 HydroCAD Software Solutions LLC
Summary for Link 5L: Proposed WSD A - To Mount Pleasant Road
Inflow Area = 1.550 ac, 32.26% Impervious, Inflow Depth = 2.45" for 100 Year eventInflow = 4.15 cfs @ 12.19 hrs, Volume= 0.317 afPrimary = 4.15 cfs @ 12.19 hrs, Volume= 0.317 af, Atten= 0%, Lag= 0.0 min
Primary outflow = Inflow, Time Span= 0.00-72.00 hrs, dt= 0.01 hrs

SJG – BL England (225616) Woodard & CurranUpper Township, New Jersey June 2014
APPENDIX F : GROUNDWATER MOUNDING ANALYSIS ANDSYSTEM DRAWDOWN TIME CALCULATION

Designed By: PJ Date: 10-17-2014Checked By: Date: _________
6 Inch Crushed Stone Infiltration Area
Volume calculations for the proposed 6 Inch Crushed Stone Infiltration Area are provided in Appendix E.
The System drawdown time is calculated below. The calculations represent the drawdown time for the
full storage volume provided, which exceeds the volume associated with the 100 year storm event.
Drawdown within 72 hours:
Stormwater within the System will infiltrate (drawdown) into the underlying soil. A permeability rate of
1.43 inches per hour was used based upon the soil permeability test results in Appendix C. A factor of
safety of 2 was used per the Pinelands Commission CMP resulting in a drawdown time design
permeability rate of 0.72 inches per hour.
Drawdown calculations are provided below.
TD = Rv/(k x bottom area)
Where: TD = Drawdown Time
Rv = Storage Volume = 4,200 cf (Stone Volume)
K = 0.72 in/hr
Bottom Area = Bottom Area of Crushed Stone = 140’ x 150’ = 21,000 sf
Infiltration Basin:
TD = (4,200 cf)/[(0.72 in/hr) (1’/12”) (21,000 sf)]
TD = 3.33 Hours (3 Hours, 20 Minutes)

Designed By: PJ Date: 10-17-2014Checked By: Date: _________
Groundwater Mounding Analysis Input Data
Recharge Rate: 100 Year Storm, 24 Hour Exfiltration Volume = 0.439 ac-ft = 19,123 cf
= (19,123 cf/day)/(150’x140’) = 0.91 ft/day
Specific Yield: 0.25 (K3 Permeability Type Soil – Use Specific Yield for Sand)
Horizontal Hydraulic Conductivity: Average Permeability Rate = 1x10⁻⁴ m/sec (Fine to Coarse Sand)
= 28.3 ft/day
½ Length of System = 75 ft
½ Width of System = 70 ft
Duration of Infiltration Time = Drawdown Time = 3.33 hours = 0.14 days
Initial Thickness of Saturated Zone = 25 ft - (28”x (1’/12”)) = 23 ft +/- (From Boring BS-3A)
Note: See attached sheets for mounding calculation and reference material.
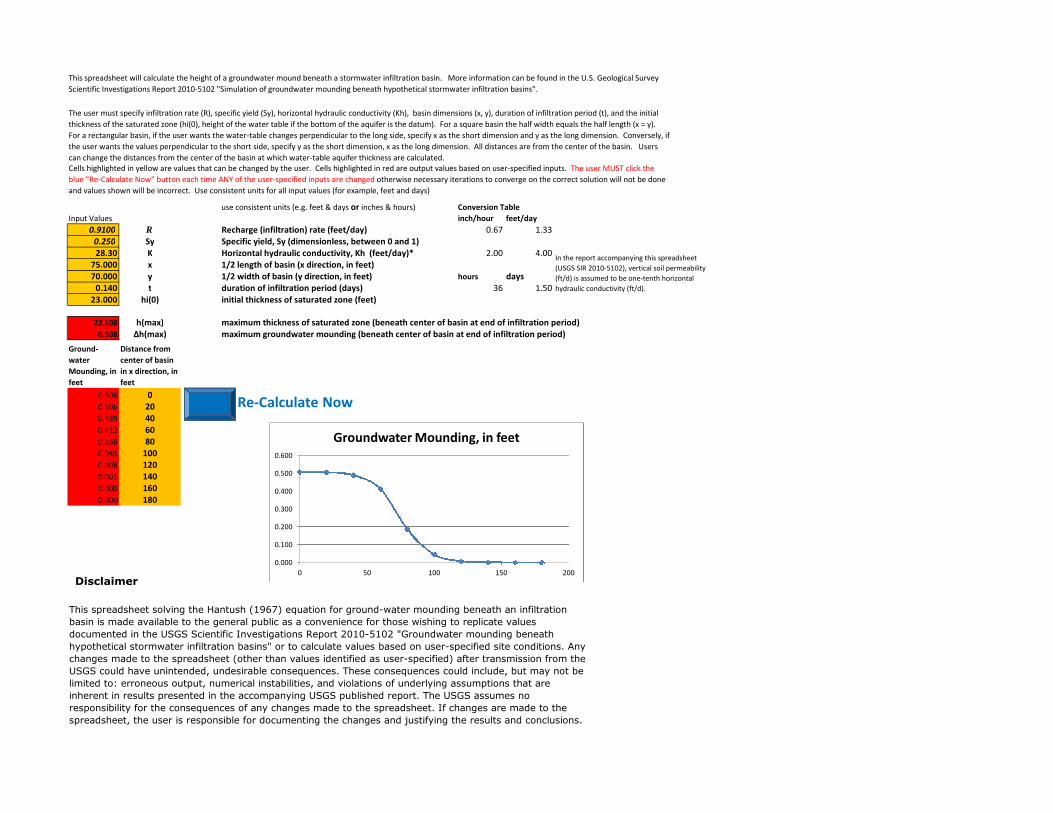
use consistent units (e.g. feet & days or inches & hours) Conversion Table
Input Values inch/hour feet/day
0.9100 R Recharge (infiltration) rate (feet/day) 0.67 1.330.250 Sy Specific yield, Sy (dimensionless, between 0 and 1)28.30 K Horizontal hydraulic conductivity, Kh (feet/day)* 2.00 4.00
75.000 x 1/2 length of basin (x direction, in feet)70.000 y 1/2 width of basin (y direction, in feet) hours days
0.140 t duration of infiltration period (days) 36 1.5023.000 hi(0) initial thickness of saturated zone (feet)
23.508 h(max) maximum thickness of saturated zone (beneath center of basin at end of infiltration period)0.508 Δh(max) maximum groundwater mounding (beneath center of basin at end of infiltration period)
Ground-
water
Mounding, in
feet
Distance from
center of basin
in x direction, in
feet
0.508 00.506 200.489 400.412 600.188 800.045 1000.008 1200.001 1400.000 1600.000 180
Disclaimer
This spreadsheet solving the Hantush (1967) equation for ground-water mounding beneath an infiltration
basin is made available to the general public as a convenience for those wishing to replicate values
documented in the USGS Scientific Investigations Report 2010-5102 "Groundwater mounding beneath
hypothetical stormwater infiltration basins" or to calculate values based on user-specified site conditions. Any
changes made to the spreadsheet (other than values identified as user-specified) after transmission from the
USGS could have unintended, undesirable consequences. These consequences could include, but may not be
limited to: erroneous output, numerical instabilities, and violations of underlying assumptions that are
inherent in results presented in the accompanying USGS published report. The USGS assumes no
responsibility for the consequences of any changes made to the spreadsheet. If changes are made to the
spreadsheet, the user is responsible for documenting the changes and justifying the results and conclusions.
This spreadsheet will calculate the height of a groundwater mound beneath a stormwater infiltration basin. More information can be found in the U.S. Geological Survey
Scientific Investigations Report 2010-5102 "Simulation of groundwater mounding beneath hypothetical stormwater infiltration basins".
The user must specify infiltration rate (R), specific yield (Sy), horizontal hydraulic conductivity (Kh), basin dimensions (x, y), duration of infiltration period (t), and the initial
thickness of the saturated zone (hi(0), height of the water table if the bottom of the aquifer is the datum). For a square basin the half width equals the half length (x = y).
For a rectangular basin, if the user wants the water-table changes perpendicular to the long side, specify x as the short dimension and y as the long dimension. Conversely, if
the user wants the values perpendicular to the short side, specify y as the short dimension, x as the long dimension. All distances are from the center of the basin. Users
can change the distances from the center of the basin at which water-table aquifer thickness are calculated.Cells highlighted in yellow are values that can be changed by the user. Cells highlighted in red are output values based on user-specified inputs. The user MUST click the
blue "Re-Calculate Now" button each time ANY of the user-specified inputs are changed otherwise necessary iterations to converge on the correct solution will not be done
and values shown will be incorrect. Use consistent units for all input values (for example, feet and days)
In the report accompanying this spreadsheet
(USGS SIR 2010-5102), vertical soil permeability
(ft/d) is assumed to be one-tenth horizontal
hydraulic conductivity (ft/d).
Re-Calculate Now
0.000
0.100
0.200
0.300
0.400
0.500
0.600
0 50 100 150 200
Groundwater Mounding, in feet
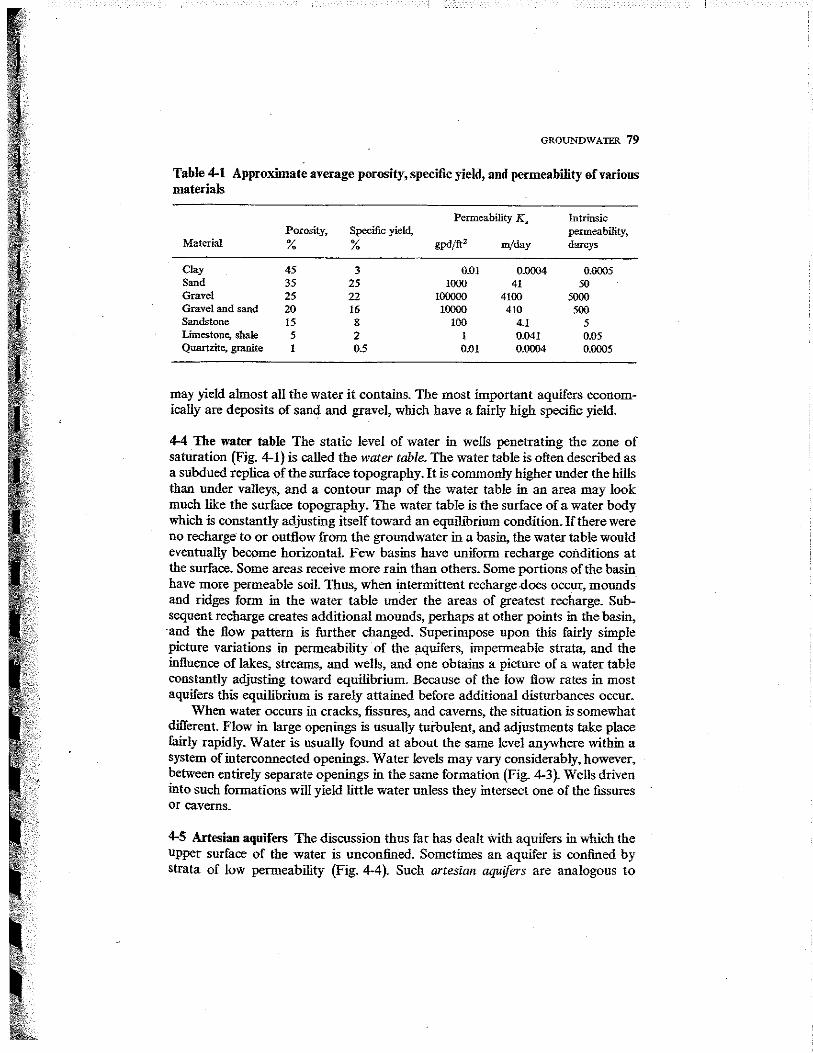


ݱ¸¿²»§ Ú±®³¿¬·±²
Íï
Íî
Íí
Íì
Íë
Íê
Íé
Íè
ðòè
ðòè
ðòé
ïòë
ïòë
ïòê
ïòè
ïòè
ïóîóïóï
ÉÑØñîìþ
îóîóïóî
îóéóéóïî
èóïîóïïóïê
ëóïïóïéóïë
ïðóïîóçóé
íóìóìóé
í
ÉÑØ
í
ïì
îí
îè
îï
è
Þ
ê ·²½¸» ÌÑÐÍÑ×ÔòÞ®±©² ³»¼·«³ ¬± º·²» ÍßÒÜô ¬®¿½» º·²» Ù®¿ª»´ô ¬®¿½» Í·´¬ò øÍÐ÷
Í¿³»ò
Ñ®¿²¹» ¾®±©² ½±¿®» ¬± º·²» ÍßÒÜô ¬®¿½» º·²» Ù®¿ª»´ô ¬®¿½»Í·´¬ò øÍÐ÷
Ô·¹¸¬ ¾®±©² ³»¼·«³ ¬± º·²» ÍßÒÜô ¬®¿½» Í·´¬ò øÍÐ÷
Í¿³»ò
Í¿³»ò
Í¿³»ò
Í¿³»ò
Þ±¬¬±³ ±º Þ±®·²¹ ¿¬ îëù
Þ±®·²¹ ý ÞÍóíß Ð¿¹» ï ±º ï
ÞÑÎ×ÒÙ ÔÑÙ
îì ر«® λ¿¼·²¹æݱ³°´»¬·±²æ
Û²½±«²¬»®»¼æ ïîñîðñîðïî
Ý¿·²¹ Í·¦»ņ̃°»æ ñ
Ù®±«²¼ Í«®º¿½» Û´»ª¿¬·±² øº¬÷æ o îðòî
ݱ³°´»¬»¼æ ïîñîðñîðïî
Ý¿°» Ó¿§ ݱ«²¬·»ô ÒÖ
ÜÛÐÌØ øÚÛÛÌ÷ì
Ü®·´´·²¹ η¹ Ñ°»®¿¬±®æ Öò ܱ¬¦»®
Þ±®·²¹ Ô±½¿¬·±²æ Í»» Ì»¬ Þ±®·²¹ Ô±½¿¬·±² д¿²
Ю±¶»½¬ Ô±½¿¬·±²æ Ý«³¾»®´¿²¼ô ߬´¿²¬·½ô ¿²¼
Ю±¶»½¬ Ò«³¾»®æ ÒÖóÈóÈÈóïîì
Ю±¶»½¬æ îìþ ÞÔ Ð·°»´·²» Í«°°´§ Ю±¶»½¬
Ü¿¬»æ ͬ¿®¬»¼æ ïîñîðñîðïî
Ü®·´´·²¹ Û¯«·°³»²¬æ ß½µ»® ßÌÊ Î·¹
Ü®·´´·²¹ Ó»¬¸±¼æ í ïñì ·²½¸ ØÍß
Ü®·´´·²¹ ݱ²¬®¿½¬±®æ ÌÎÝ Í±´«¬·±²ô ײ½ò
ÙÎÑËÒÜÉßÌÛÎ ÑÞÍÛÎÊßÌ×ÑÒÍ
п¹» ï ±º ï
Þ±®·²¹ ý ÞÍóíß
ÝÉ Î»°®»»²¬¿¬·ª»æ Ôò Ý´»ª»²¹»®
ÎÛÓßÎÕÍ
ÚæÄÐÎÑÖÛÝÌÍÄÒÖóÈóÈÈóïîìÄÞÑÎ×ÒÙÍÄîìó×ÒÝØ ÞÔ Ð×ÐÛÔ×ÒÛòÙÐÖ
ͱ·´ Í¿³°´» α½µ ݱ®»
ïð
îð
íð
ìð
ëð
ÓßÌÛÎ×ßÔ ÜÛÍÝÎ×ÐÌ×ÑÒ
ïð
ð
óïð
óîð
óíð


SJG – BL England (225616) Woodard & CurranUpper Township, New Jersey June 2014
APPENDIX G : NOAA 24 HOUR RAINFALL DEPTHS

NOAA Atlas 14, Volume 2, Version 3Location name: Woodbine, New Jersey, US*
Coordinates: 39.2739, -74.7523Elevation: 26ft*
* source: Google Maps
POINT PRECIPITATION FREQUENCY ESTIMATES
G.M. Bonnin, D. Martin, B. Lin, T. Parzybok, M.Yekta, and D. Riley
NOAA, National Weather Service, Silver Spring, Maryland
PF_tabular | PF_graphical | Maps_&_aerials
PF tabular
PDS-based point precipitation frequency estimates with 90% confidence intervals (in inches)1
DurationAverage recurrence interval(years)
1 2 5 10 25 50 100 200 500 1000
5-min 0.350(0.314! 0.390)
0.405(0.363! 0.449)
0.455(0.407! 0.505)
0.533(0.477! 0.591)
0.599(0.535! 0.666)
0.664(0.590! 0.739)
0.718(0.635! 0.799)
0.769(0.675! 0.858)
0.823(0.716! 0.925)
0.882(0.759! 0.996)
10-min 0.559(0.501! 0.622)
0.647(0.581! 0.717)
0.729(0.652! 0.809)
0.852(0.763! 0.946)
0.955(0.852! 1.06)
1.06(0.940! 1.18)
1.14(1.01! 1.27)
1.22(1.07! 1.36)
1.30(1.13! 1.46)
1.39(1.20! 1.57)
15-min0.699
(0.626! 0.778)0.814
(0.730! 0.902)0.922
(0.825! 1.02)1.08
(0.965! 1.20)1.21
(1.08! 1.35)1.34
(1.19! 1.49)1.44
(1.28! 1.60)1.54
(1.35! 1.72)1.64
(1.43! 1.84)1.74
(1.50! 1.97)
30-min 0.958(0.858! 1.07)
1.12(1.01! 1.25)
1.31(1.17! 1.45)
1.56(1.40! 1.73)
1.79(1.60! 1.99)
2.02(1.79! 2.24)
2.21(1.95! 2.46)
2.39(2.10! 2.67)
2.61(2.27! 2.93)
2.82(2.43! 3.19)
60-min1.20
(1.07! 1.33)1.41
(1.27! 1.56)1.68
(1.50! 1.86)2.03
(1.82! 2.26)2.39
(2.13! 2.66)2.73
(2.43! 3.04)3.04
(2.69! 3.39)3.36
(2.95! 3.75)3.74
(3.25! 4.20)4.12
(3.55! 4.65)
2-hr 1.47(1.30! 1.66)
1.73(1.53! 1.96)
2.08(1.83! 2.34)
2.53(2.23! 2.86)
3.00(2.63! 3.39)
3.45(3.02! 3.91)
3.88(3.37! 4.39)
4.31(3.72! 4.91)
4.86(4.14! 5.56)
5.39(4.55! 6.20)
3-hr 1.61(1.42! 1.82)
1.89(1.68! 2.14)
2.27(2.00! 2.57)
2.78(2.44! 3.15)
3.31(2.90! 3.75)
3.84(3.34! 4.35)
4.34(3.74! 4.92)
4.86(4.15! 5.53)
5.52(4.66! 6.32)
6.18(5.15! 7.11)
6-hr 1.98(1.76! 2.27)
2.33(2.07! 2.66)
2.78(2.46! 3.17)
3.40(3.00! 3.88)
4.09(3.58! 4.66)
4.79(4.17! 5.46)
5.47(4.72! 6.24)
6.19(5.28! 7.09)
7.15(5.99! 8.22)
8.12(6.70! 9.39)
12-hr2.38
(2.12! 2.72)2.79
(2.48! 3.18)3.35
(2.96! 3.80)4.13
(3.65! 4.69)5.04
(4.42! 5.72)5.99
(5.21! 6.81)6.94
(5.97! 7.91)8.00
(6.78! 9.15)9.43
(7.81! 10.8)10.9
(8.88! 12.6)
24-hr 2.75(2.49! 3.06)
3.35(3.03! 3.72)
4.35(3.93! 4.83)
5.21(4.70! 5.78)
6.53(5.84! 7.21)
7.69(6.83! 8.46)
9.00(7.92! 9.88)
10.5(9.12! 11.5)
12.7(10.9! 13.9)
14.7(12.4! 16.1)
2-day 3.16(2.85! 3.52)
3.85(3.47! 4.29)
5.00(4.51! 5.56)
5.99(5.38! 6.65)
7.48(6.68! 8.28)
8.79(7.79! 9.72)
10.3(9.02! 11.3)
11.9(10.4! 13.1)
14.4(12.4! 15.9)
16.6(14.1! 18.3)
3-day 3.33(3.03! 3.67)
4.04(3.68! 4.47)
5.23(4.76! 5.77)
6.24(5.66! 6.87)
7.77(7.00! 8.53)
9.09(8.14! 9.97)
10.6(9.39! 11.6)
12.2(10.8! 13.4)
14.7(12.8! 16.1)
16.9(14.5! 18.5)
4-day 3.49(3.21! 3.82)
4.24(3.90! 4.64)
5.46(5.01! 5.97)
6.50(5.94! 7.10)
8.05(7.32! 8.77)
9.39(8.49! 10.2)
10.9(9.76! 11.8)
12.5(11.1! 13.6)
15.0(13.2! 16.3)
17.2(14.9! 18.7)
7-day4.04
(3.73! 4.40)4.88
(4.51! 5.31)6.18
(5.70! 6.73)7.29
(6.70! 7.92)8.92
(8.16! 9.67)10.3
(9.39! 11.2)11.9
(10.7! 12.8)13.6
(12.1! 14.7)16.1
(14.2! 17.4)18.2
(15.9! 19.7)
10-day 4.53(4.21! 4.89)
5.44(5.05! 5.88)
6.78(6.29! 7.32)
7.89(7.30! 8.52)
9.49(8.74! 10.2)
10.8(9.94! 11.7)
12.3(11.2! 13.2)
13.8(12.5! 14.9)
16.2(14.5! 17.5)
18.3(16.3! 19.7)
20-day 6.06(5.69! 6.46)
7.20(6.78! 7.68)
8.71(8.18! 9.29)
9.94(9.32! 10.6)
11.6(10.9! 12.4)
13.0(12.1! 13.9)
14.4(13.4! 15.4)
15.9(14.7! 17.0)
18.0(16.5! 19.2)
19.7(17.9! 21.0)
30-day 7.55(7.11! 8.01)
8.94(8.42! 9.49)
10.7(10.0! 11.3)
12.0(11.3! 12.7)
13.9(13.0! 14.7)
15.3(14.4! 16.3)
16.8(15.7! 17.8)
18.4(17.1! 19.5)
20.4(18.9! 21.7)
22.0(20.2! 23.4)
45-day 9.56(9.08! 10.1)
11.3(10.7! 11.9)
13.2(12.5! 13.9)
14.7(13.9! 15.5)
16.6(15.7! 17.5)
18.1(17.1! 19.1)
19.6(18.4! 20.6)
21.0(19.7! 22.1)
22.8(21.3! 24.1)
24.2(22.5! 25.6)
60-day 11.4(10.8! 11.9)
13.4(12.7! 14.0)
15.5(14.7! 16.2)
17.0(16.2! 17.9)
19.0(18.0! 20.0)
20.5(19.4! 21.5)
21.9(20.7! 23.0)
23.2(21.9! 24.4)
24.9(23.4! 26.2)
26.1(24.4! 27.5)
1 Precipitation frequency (PF) estimates in this table are based on frequency analysis of partial duration series (PDS).
Numbers in parenthesis are PF estimates at lower and upper bounds of the 90% confidence interval. The probability that precipitation frequency estimates (for a givenduration and average recurrence interval) will be greater than the upper bound (or less than the lower bound) is 5%. Estimates at upper bounds are not checked againstprobable maximum precipitation (PMP) estimates and may be higher than currently valid PMP values.
Please refer to NOAA Atlas 14 document for more information.
Back to Top
Page 1 of 4Precipitation Frequency Data Server
2/20/2013http://hdsc.nws.noaa.gov/hdsc/pfds/pfds_printpage.html?lat=39.2739&lon=-74.7523&data...

SJG – BL England (225616) Woodard & CurranUpper Township, New Jersey June 2014
APPENDIX H : STORMWATER MANAGEMENT SYSTEMOPERATIONS AND MAINTENANCE PLAN

SJG – BL England (225616) June 2014Upper Township, New Jersey
STORMWATER MANAGEMENT SYSTEMOPERATION & MAINTENANCE PLAN
This Stormwater Management System Operations & Maintenance Plan (the Plan) outlines measures thatare essential for maintaining an effective stormwater management system at the following:
South Jersey GasInterconnect Station
Mount Pleasant RoadUpper Township, New Jersey
herein referred to as “the Site”. Periodic and scheduled inspection and maintenance measures arerecommended to prevent deficiencies and to promote proper performance of the stormwater managementsystem. Failure to implement these measures can reduce the hydraulic capacity of stormwater measures.
RESPONSIBLE PARTY
The party responsible for implementing this Plan and identifying the source of necessary funds is asfollows:
South Jersey GasOne South Jersey Plaza
Folsom, New Jersey 08037
INSPECTIONS & MAINTENANCE MEASURES
The stormwater management system at the Site consists of a 6 inch crushed stone infiltration area.Attachment A provides the Inspection Form that is recommended for use during routine inspections of thecrushed stone infiltration area. The form includes a table that outlines specific inspection and maintenancemeasures, in addition to the following information:
Name of inspector
Name of the site and its location
Date and time of inspection
Weather conditions during inspection
Outline of items inspected
Condition of the stormwater management measures, including corrective measures taken tomaintain the system
Completed Inspections Forms should be kept on file to enable both facility managers and regulatoryagencies to ensure that operation of the system is in compliance with permit requirements.

SJG – BL England (225616) June 2014Upper Township, New Jersey
ATTACHMENT A – INSPECTION FORM

SJG – BL England (225616) June 2014Upper Township, New Jersey
STORMWATER MANAGEMENT SYSTEM INSPECTION FORMSouth Jersey Gas
Interconnect StationMount Pleasant Road
Upper Township, New Jersey
Name of Inspector:
Date/Time:
Weather:
Date of Last Inspection:
Items Inspected (Refer to Table 1. Provide additional sheets if necessary.):
Comments & Corrective Actions Taken (Provide additional sheets if necessary.):

SJG – BL England (225616) June 2014Upper Township, New Jersey
Table 1 – Operations & Maintenance Measures
Crushed Stone Infiltration Area
Objective: Maintain the infiltration capacity of the crushed stone infiltration area
Frequency Measure
Annually Remove and dispose any sediment and debris from crushed stone surface andcontributing areas in accordance with all Federal, State and local regulations
Inspect surrounding areas for stabilization; contributing areas should be stabilized
Inspect crushed stone infiltration area for signs of clogging
Remove and replace areas of crushed stone as required
Inspect crushed stone infiltration area to verify that system dewaters between stormevents
All repaired areas shall be restored according to original design specifications.