STORMWATER DRAINAGE REPORT - Dublin,...
95
STORMWATER DRAINAGE REPORT For Carmen Michael Villopoto Located At 7679-7685 Plain City – Dublin Rd Dublin, OH 43064 Prepared by: Osborn Engineering 990 West Third Ave. #200 Columbus, OH 43212 614.556.4272 October 23, 2017
-
Upload
truongtruc -
Category
Documents
-
view
218 -
download
1
Transcript of STORMWATER DRAINAGE REPORT - Dublin,...

STORMWATER DRAINAGE REPORT
For
Carmen Michael Villopoto
Located At
7679-7685 Plain City – Dublin Rd Dublin, OH 43064
Prepared by:
Osborn Engineering
990 West Third Ave. #200 Columbus, OH 43212
614.556.4272
October 23, 2017

TABLE OF CONTENTS
STORMWATER MANAGEMENT NARRATIVE .................................................................................................
I. Project Narrative ...................................................................................................................................
II. Existing Drainage Conditions .................................................................................................................
III. Stormwater Quantity Runoff Summary ...............................................................................................
IV. Stormwater Conveyance System Summary ..........................................................................................
V. Stormwater Quality Runoff Summary ...................................................................................................
APPENDICES
A. Pre- and Post-Developed Drainage Plans
B. Critical Storm Calculations
C. Hydrographs, Reservoirs, and Routing Calculations
C.1 Hydrograph Reports
C.2 Pond Report
D. Storm Sewer Calculations
E. Water Quality Calculations
F. Site Soils

I. Project Narrative The project site is located at 7679-7685 Plain City – Dublin Rd (SR 161), west of the Cosgray and SR 161 intersection. Carmen Michael Villopoto is proposing a 4.89 acre development across 2 parcels, consisting of (2) 20,000 sq.ft. Recreational buildings with asphalt pavement area for parking and traffic circulation. Project also includes improvements to the roadway, this improvements includes widening the road along the property frontage to create a let turn lane into site. The total disturbed area for the project will be 6.24 acres; this includes project site and ROW improvements.
II. Existing Drainage Conditions
The existing site is currently a vacant lot, consisting of greenspace. The site currently sheet flows runoff from west to east and discharges to the northeast ditch along the public ROW and southeast corner of the lot. Refer to Appendix A for Pre- and Post-Developed Drainage Plans.
III. Stormwater Quantity Runoff Summary
City of Dublin has adopted a Stormwater Management Design Manual. This manual dictates that critical storm method where Post-Pre/Pre*100 = Critical Storm. This method is to be used to calculate allowable release for post development conditions. Using the TR-55 method, the runoff for the 1-year, 24-hour storm was calculated for the pre- and post-developed conditions of the site. The critical storm shall then be determined by the percentage increase in volume of runoff from the pre-developed condition. Pre- and post- site perviousness and imperviousness used in these calculations are as follows: Table 3.1 Site Imperviousness
Pervious Area (Sq. Ft.)
Impervious Area (Sq. Ft.)
Total Area (Sq. Ft.)
% Increase in Imperviousness
Pre-Developed 212,861 0 212,861 53% Post-Developed 98,702 114,122 212,861
Using this information, the runoff coefficients for the pre- and post- developed conditions were calculated as follows: Table 3.2 Pre-Developed Runoff Coefficients
Soil Name & Group Cover Description CN Area (acres) CN x Area
CrA – Crosby Silt Loam Grass – Fair 80 1.88 150.61
Ko – Kokomo Silty Clay Loam Grass – Fair 80 1.87 150.22
LeB – Lewisburg-Crosby Grass – Fair 80 1.12 89.97
Impervious 98 0
Totals 4.89 390.81
𝐶𝑁𝑢𝑠𝑒𝑑 =𝑡𝑜𝑡𝑎𝑙 𝑝𝑟𝑜𝑑𝑢𝑐𝑡
𝑡𝑜𝑡𝑎𝑙 𝑎𝑟𝑒𝑎=
390.81
4.89= 80

Table 3.3 Post-Developed Runoff Coefficients
Soil Name & Group Cover Description CN Area (acres) CN x Area
CrA – Crosby Silt Loam Grass – Fair 80 0.87 69.91
Ko – Kokomo Silty Clay Loam Grass – Fair 80 0.87 69.73
LeB – Lewisburg-Crosby Grass – Fair 80 0.52 41.76
Impervious 98 2.62 256.76
Totals 4.89 438.18
𝐶𝑁𝑢𝑠𝑒𝑑 =𝑡𝑜𝑡𝑎𝑙 𝑝𝑟𝑜𝑑𝑢𝑐𝑡
𝑡𝑜𝑡𝑎𝑙 𝑎𝑟𝑒𝑎=
438.18
4.89= 90
These calculations resulted in a 95% increase in volume due to the proposed development. (Refer to Appendix B, Critical Storm/Detention Calculations, for full calculations) Using table 2-5 in Stormwater Manual, this correlated to a 10-year, 24-hour critical storm. Based on this calculation, all storm events more frequent than, and including the critical year storm, shall be reduced down to the 1-year, 24-hour pre-existing storm event. All less frequent events up to and including the 100-year, 24-hour storm shall be reduced down to the critical storm condition. The time of concentration was determined using the TR-55 method. Runoff from proposed buildings, pavement/ parking and landscape area will sheet flow to storm system which contain, drainage inlets, 8”-24” pipes and, pond. Stormwater will be controlled by an outlet control structure along the east side of the pond. This structure will control the release per City of Dublin requirements. As the structure releases the stormwater, 2 outlet pipes will convey runoff and release in 2 separate locations. These locations are to the northeast corner (along SR 161) and southeast corner. The purpose of this configuration is to match the existing conditions of where storm runoff is currently released. The table below summarizes the peak outflows for the pre- and post-developed conditions. Reference Appendix C, Hydrographs, Reservoirs, and Routing Calculations, for the full stormwater routing calculations. Table 3.3 Post-Developed Runoff Coefficients
Design Storm
Pre-Developed
Runoff, Q (cfs)
Post-Developed
Runoff, Q (cfs)
Allowable Post-
Developed Runoff, Q (cfs)
Proposed Post-Developed Runoff, Q (cfs) Difference
1 1.95 8.04 1.95 0.70 1.25
2 2.89 10.20 1.95 1.00 0.95
5 4.35 13.27 1.95 1.47 0.48
10* 5.62 15.78 1.95 1.91 0.04
25 7.46 19.28 5.62 3.01 2.61
50 9.03 22.16 5.62 4.17 1.45
100 10.71 25.18 5.62 5.32 0.30
*Critical Storm
IV. Stormwater Conveyance System Summary
The conveyance system was designed using a 2-year, 24-hour storm in accordance with section 4.A,2 (Flow Conveyance) in the Stormwater Manual . The system was designed so that no surcharge from runoff is caused by the 2 year, 24 hour storm and that the hydraulic grade line of the storm sewer stays below the gutter flow line of the overlying roadway, or below the top of drainage structures outside the roadway during the 5 year, 24 hour storm. Full calculations can be found in Appendix D. As mentioned above, this pond and outlet control structure has been designed so that there are 2 different discharge points from the pond. Those being to the north and south. This is due to the fact that releasing the entire runoff volume to one discharge point or the other would result in increasing the runoff condition from the existing condition flow. Reviewing the existing conditions show that approximately ½ of the existing site discharges to the north as the other ½ discharges o the south. This is why 2 outlet pipes have been proposed and will best mimic the existing runoff conditions.
V. Stormwater Quality Runoff Summary The total disturbed acreage for the proposed project is 4.89 acres, requiring a Notice of Intent (NOI) for coverage under the OH000004. The water quality requirements follow the OEPA permit, which requires all stomrwater control measures to treat the first three-quarter inch rainfall of each storm event. This volume was calculated as follows:
𝑊𝑄𝑣 = 𝐶 ∗ 0.75 ∗ 𝐴 12⁄
𝑊𝑄𝑣 = 0.8 ∗ 0.75 ∗ 4.8912⁄ = 0.24 𝐴𝑐𝑟𝑒 − 𝑓𝑡 = 10,650 𝑐𝑢. 𝑓𝑡.
Site runoff will be treated by the proposed wet detention pond south of the building. Stormwater will be conveyed to the detention pond and there control to release per City of Dublin requirements. Water quality volume will be released over a 24 hour period to ensure proper treatment. Reference Appendix E for full Water Quality Calculations.

APPENDIX A PRE- AND POST-DEVELOPED DRAINAGE PLANS

FULK
RO
AD
(40
' R/W
)
K
o
C
r
A
K
o
C
r
A
C
r
A
K
o
LeB
Ko
L
e
B
K
o
PROJECT NUMBER:
DRAWN BY:
DATE:
SHEET NUMBER:
REVISION:
STATUS:
PROJECT NUMBER:
DRAWN BY:
DATE:
SHEET NUMBER:
REVISION:
STATUS:
SHEET NAME:SHEET NAME:
2016.223
SF
23 OCTOBER 2017
URBA
N AI
R
7679
-768
5 PLA
IN C
ITY-
DUBL
IN R
OAD
| DUB
LIN, O
H 43
064 |
990 West Third Avenue | Columbus, OH 43212
1100 Superior Ave - Suite 300 | Cleveland, OH 44114
TM
441 Wolf Ledges Road - Suite 300 | Akron, OH 44311
1 10-03-17 ADDENDUM 12 10-12-17 ADDENDUM 23 10-23-17 ADDENDUM 3
NORTH
1 inch = ft.
( IN FEET )
GRAPHIC SCALE
040 40
40
20
PRE-DEVELOPED DRAINAGE AREA
ON-SITE PERVIOUS AREA = 4.89 AC
ROW PERVIOUS AREA = 0.94 AC
ON-SITE IMPERVIOUS AREA = 0.00 AC
ROW IMPERVIOUS AREA = 0.40 AC
TOTAL ON-SITE PROPERTY AREA = 4.89 AC
TOTAL R/W AREA = 1.34 AC
TOTAL DISTURBED AREA = 6.23 AC
#
LEGEND
AREAS (REFER TO DRAINAGE REPORT FOR DETAILS)
1
2
3

P
H
A
S
E
1
P
R
O
P
O
S
E
D
P
R
E
-
E
N
G
IN
E
E
R
IN
G
M
E
T
A
L
B
U
IL
D
IN
G
(
2
0
,0
0
0
S
F
)
P
H
A
S
E
2
P
R
O
P
O
S
E
D
P
R
E
-
E
N
G
IN
E
E
R
IN
G
M
E
T
A
L
B
U
IL
D
IN
G
(
2
0
,0
0
0
S
F
)
1
9
9
.8
'
1
0
0
.3
'
2
0
0
.1
'
1
0
0
'
1
0
0
.1
'
2
0
0
'
1
0
0
.1
'
2
0
0
'
PR
DE
TE
NT
ION
BA
SIN
1
3
+
0
0
1
4
+
0
0
1
5
+
0
0
FULK
RO
AD
(40
' R/W
)
K
o
C
r
A
K
o
C
r
A
C
r
A
K
o
LeB
Ko
L
e
B
K
o
PROJECT NUMBER:
DRAWN BY:
DATE:
SHEET NUMBER:
REVISION:
STATUS:
PROJECT NUMBER:
DRAWN BY:
DATE:
SHEET NUMBER:
REVISION:
STATUS:
SHEET NAME:SHEET NAME:
2016.223
SF
23 OCTOBER 2017
URBA
N AI
R
7679
-768
5 PLA
IN C
ITY-
DUBL
IN R
OAD
| DUB
LIN, O
H 43
064 |
990 West Third Avenue | Columbus, OH 43212
1100 Superior Ave - Suite 300 | Cleveland, OH 44114
TM
441 Wolf Ledges Road - Suite 300 | Akron, OH 44311
1 10-03-17 ADDENDUM 12 10-12-17 ADDENDUM 23 10-23-17 ADDENDUM 3
NORTH
1 inch = ft.
( IN FEET )
GRAPHIC SCALE
040 40
40
20
1
2
3
54
9
6
7
8
16
17
13
12
15
10
11
14
POST-DEVELOPED DRAINAGE AREA
ON-SITE PERVIOUS AREA = 2.26 AC
ROW PERVIOUS AREA = 0.58 AC
ON-SITE IMPERVIOUS AREA = 2.62 AC
ROW IMPERVIOUS AREA = 0.77 AC
TOTAL ON-SITE PROPERTY AREA = 4.89 AC
TOTAL R/W AREA = 1.34 AC
TOTAL DISTURBED AREA = 6.23 AC
#
LEGEND
AREAS (REFER TO DRAINAGE REPORT FOR DETAILS)
18
19

APPENDIX B CRITICAL STORM CALCULATIONS

I. Existing Conditions
1 year, 24 hour storm
Project Area 4.89 acres
Rainfall, P 2.20 inches
Curver Number, CN 80
Runoff, Q 0.69 inches
Total Runoff Volume 12202 cubic feet
II. Developed Conditions
1 year, 24 hour storm
Project Area 4.89 acres
Rainfall, P 2.20 inches
Curve Number, CN 90
Runoff, Q 1.24 inches
Total Runoff Volume 22022 cubic feet
III. Runoff Increase Due to Development
Existing Runoff 12202 cubic feet
Development Runoff 22022 cubic feet
Percent Increase in Runoff 80 %
IV. Critical Storm
80 % Increase in Runoff; Requires a 10-year critical storm.
A. Storm water runoff peak for the 10-year developed storm will not exceed the
storm water runoff peak for the 1 year, existing storm.
B. For storms greater than the 10-year storm, the developed storm water runoff will
not exceed the existing storm water runoff peak for each storm. Refer to the storm water runoff
summary sheet for allowable and design peaks.
DETERMINATION OF CRITICAL STORM

APPENDIX C HYDROGRAPHS, RESERVOIRS, AND ROUTING CALCULATIONS

APPENDIX C.1 HYDROGRAPHS REPORTS

1
2
3
4
5
6
7
1
Watershed Model SchematicHydraflow Hydrographs Extension for AutoCAD® Civil 3D® 2015 by Autodesk, Inc. v10.4
Project: Dublin Urban Air Hydroflow 10-19-17.gpw Monday, 10 / 23 / 2017
Hyd. Origin Description
Legend
1 SCS Runoff PRE (NORTH)
2 SCS Runoff PRE (SOUTH)
3 Combine PRE TOTAL
4 SCS Runoff POST
5 Reservoir ROUTED
6 SCS Runoff POST RUNOFF
7 Combine POST TOTAL

Hydrograph Return Period Recap
2
Hyd. Hydrograph Inflow Peak Outflow (cfs) Hydrograph
No. type hyd(s) Description
(origin) 1-yr 2-yr 3-yr 5-yr 10-yr 25-yr 50-yr 100-yr
1 SCS Runoff ------ 1.015 1.508 ------- 2.270 2.932 3.894 4.714 5.590 PRE (NORTH)
2 SCS Runoff ------ 0.952 1.412 ------- 2.121 2.737 3.632 4.393 5.212 PRE (SOUTH)
3 Combine 1, 2 1.948 2.893 ------- 4.352 5.618 7.460 9.029 10.71 PRE TOTAL
4 SCS Runoff ------ 8.037 10.20 ------- 13.27 15.78 19.28 22.16 25.18 POST
5 Reservoir 4 0.018 0.110 ------- 0.312 0.594 1.198 1.803 2.508 ROUTED
6 SCS Runoff ------ 0.687 0.993 ------- 1.461 1.868 2.457 2.956 3.488 POST RUNOFF
7 Combine 5, 6 0.700 1.008 ------- 1.477 1.915 3.013 4.176 5.323 POST TOTAL
Proj. file: Dublin Urban Air Hydroflow 10-19-17.gpw Monday, 10 / 23 / 2017
Hydraflow Hydrographs Extension for AutoCAD® Civil 3D® 2015 by Autodesk, Inc. v10.4

Hydrograph Summary Report
3
Hyd. Hydrograph Peak Time Time to Hyd. Inflow Maximum Total Hydrograph
No. type flow interval Peak volume hyd(s) elevation strge used Description
(origin) (cfs) (min) (min) (cuft) (ft) (cuft)
1 SCS Runoff 1.015 2 746 6,646 ------ ------ ------ PRE (NORTH)
2 SCS Runoff 0.952 2 742 5,570 ------ ------ ------ PRE (SOUTH)
3 Combine 1.948 2 744 12,215 1, 2 ------ ------ PRE TOTAL
4 SCS Runoff 8.037 2 720 21,015 ------ ------ ------ POST
5 Reservoir 0.018 2 1454 5,063 4 943.85 33,394 ROUTED
6 SCS Runoff 0.687 2 728 2,498 ------ ------ ------ POST RUNOFF
7 Combine 0.700 2 728 7,561 5, 6 ------ ------ POST TOTAL
Dublin Urban Air Hydroflow 10-19-17.gpw Return Period: 1 Year Monday, 10 / 23 / 2017
Hydraflow Hydrographs Extension for AutoCAD® Civil 3D® 2015 by Autodesk, Inc. v10.4

Hydrograph Report
Hydraflow Hydrographs Extension for AutoCAD® Civil 3D® 2015 by Autodesk, Inc. v10.4 Monday, 10 / 23 / 2017
Hyd. No. 1
PRE (NORTH)
Hydrograph type = SCS Runoff Peak discharge = 1.015 cfsStorm frequency = 1 yrs Time to peak = 12.43 hrsTime interval = 2 min Hyd. volume = 6,646 cuftDrainage area = 2.640 ac Curve number = 80*Basin Slope = 0.0 % Hydraulic length = 0 ftTc method = TR55 Time of conc. (Tc) = 54.00 minTotal precip. = 2.20 in Distribution = Type IIStorm duration = 24 hrs Shape factor = 484
* Composite (Area/CN) = [(3.010 x 77) + (1.880 x 65)] / 2.640
4
0 2 4 6 8 10 12 14 16 18 20 22 24 26
Q (cfs)
0.00 0.00
1.00 1.00
2.00 2.00
Q (cfs)
Time (hrs)
PRE (NORTH)
Hyd. No. 1 -- 1 Year
Hyd No. 1

Hydrograph Report
Hydraflow Hydrographs Extension for AutoCAD® Civil 3D® 2015 by Autodesk, Inc. v10.4 Monday, 10 / 23 / 2017
Hyd. No. 2
PRE (SOUTH)
Hydrograph type = SCS Runoff Peak discharge = 0.952 cfsStorm frequency = 1 yrs Time to peak = 12.37 hrsTime interval = 2 min Hyd. volume = 5,570 cuftDrainage area = 2.250 ac Curve number = 80Basin Slope = 0.0 % Hydraulic length = 0 ftTc method = TR55 Time of conc. (Tc) = 44.80 minTotal precip. = 2.20 in Distribution = Type IIStorm duration = 24 hrs Shape factor = 484
0 2 4 6 8 10 12 14 16 18 20 22 24 26
Q (cfs)
0.00 0.00
0.10 0.10
0.20 0.20
0.30 0.30
0.40 0.40
0.50 0.50
0.60 0.60
0.70 0.70
0.80 0.80
0.90 0.90
1.00 1.00
Q (cfs)
Time (hrs)
PRE (SOUTH)
Hyd. No. 2 -- 1 Year
Hyd No. 2

Hydrograph Report
Hydraflow Hydrographs Extension for AutoCAD® Civil 3D® 2015 by Autodesk, Inc. v10.4 Monday, 10 / 23 / 2017
Hyd. No. 3
PRE TOTAL
Hydrograph type = Combine Peak discharge = 1.948 cfsStorm frequency = 1 yrs Time to peak = 12.40 hrsTime interval = 2 min Hyd. volume = 12,215 cuftInflow hyds. = 1, 2 Contrib. drain. area = 4.890 ac
0 2 4 6 8 10 12 14 16 18 20 22 24 26
Q (cfs)
0.00 0.00
1.00 1.00
2.00 2.00
Q (cfs)
Time (hrs)
PRE TOTAL
Hyd. No. 3 -- 1 Year
Hyd No. 3 Hyd No. 1 Hyd No. 2

Hydrograph Report
Hydraflow Hydrographs Extension for AutoCAD® Civil 3D® 2015 by Autodesk, Inc. v10.4 Monday, 10 / 23 / 2017
Hyd. No. 4
POST
Hydrograph type = SCS Runoff Peak discharge = 8.037 cfsStorm frequency = 1 yrs Time to peak = 12.00 hrsTime interval = 2 min Hyd. volume = 21,015 cuftDrainage area = 3.960 ac Curve number = 92*Basin Slope = 0.0 % Hydraulic length = 0 ftTc method = User Time of conc. (Tc) = 10.00 minTotal precip. = 2.20 in Distribution = Type IIStorm duration = 24 hrs Shape factor = 484
* Composite (Area/CN) = [(1.370 x 80) + (2.590 x 98)] / 3.960
0 2 4 6 8 10 12 14 16 18 20 22 24 26
Q (cfs)
0.00 0.00
2.00 2.00
4.00 4.00
6.00 6.00
8.00 8.00
10.00 10.00
Q (cfs)
Time (hrs)
POST
Hyd. No. 4 -- 1 Year
Hyd No. 4

Hydrograph Report
Hydraflow Hydrographs Extension for AutoCAD® Civil 3D® 2015 by Autodesk, Inc. v10.4 Monday, 10 / 23 / 2017
Hyd. No. 5
ROUTED
Hydrograph type = Reservoir Peak discharge = 0.312 cfsStorm frequency = 5 yrs Time to peak = 15.87 hrsTime interval = 2 min Hyd. volume = 16,978 cuftInflow hyd. No. = 4 - POST Max. Elevation = 944.31 ftReservoir name = Detention Pond Max. Storage = 39,854 cuft
Storage Indication method used. Wet pond routing start elevation = 942.00 ft.
5
0 10 20 30 40 50 60 70 80 90 100
Q (cfs)
0.00 0.00
2.00 2.00
4.00 4.00
6.00 6.00
8.00 8.00
10.00 10.00
12.00 12.00
14.00 14.00
Q (cfs)
Time (hrs)
ROUTED
Hyd. No. 5 -- 5 Year
Hyd No. 5 Hyd No. 4 Total storage used = 39,854 cuft

Hydrograph Report
Hydraflow Hydrographs Extension for AutoCAD® Civil 3D® 2015 by Autodesk, Inc. v10.4 Monday, 10 / 23 / 2017
Hyd. No. 6
POST RUNOFF
Hydrograph type = SCS Runoff Peak discharge = 0.687 cfsStorm frequency = 1 yrs Time to peak = 12.13 hrsTime interval = 2 min Hyd. volume = 2,498 cuftDrainage area = 0.920 ac Curve number = 81*Basin Slope = 0.0 % Hydraulic length = 0 ftTc method = TR55 Time of conc. (Tc) = 22.90 minTotal precip. = 2.20 in Distribution = Type IIStorm duration = 24 hrs Shape factor = 484
* Composite (Area/CN) = [(0.890 x 80) + (0.030 x 98)] / 0.920
0 2 4 6 8 10 12 14 16 18 20 22 24 26
Q (cfs)
0.00 0.00
0.10 0.10
0.20 0.20
0.30 0.30
0.40 0.40
0.50 0.50
0.60 0.60
0.70 0.70
0.80 0.80
0.90 0.90
1.00 1.00
Q (cfs)
Time (hrs)
POST RUNOFF
Hyd. No. 6 -- 1 Year
Hyd No. 6

Hydrograph Report
Hydraflow Hydrographs Extension for AutoCAD® Civil 3D® 2015 by Autodesk, Inc. v10.4 Monday, 10 / 23 / 2017
Hyd. No. 7
POST TOTAL
Hydrograph type = Combine Peak discharge = 0.700 cfsStorm frequency = 1 yrs Time to peak = 12.13 hrsTime interval = 2 min Hyd. volume = 7,561 cuftInflow hyds. = 5, 6 Contrib. drain. area = 0.920 ac
0 10 20 30 40 50 60 70 80 90 100
Q (cfs)
0.00 0.00
0.10 0.10
0.20 0.20
0.30 0.30
0.40 0.40
0.50 0.50
0.60 0.60
0.70 0.70
0.80 0.80
0.90 0.90
1.00 1.00
Q (cfs)
Time (hrs)
POST TOTAL
Hyd. No. 7 -- 1 Year
Hyd No. 7 Hyd No. 5 Hyd No. 6

Hydrograph Summary Report
6
Hyd. Hydrograph Peak Time Time to Hyd. Inflow Maximum Total Hydrograph
No. type flow interval Peak volume hyd(s) elevation strge used Description
(origin) (cfs) (min) (min) (cuft) (ft) (cuft)
1 SCS Runoff 1.508 2 746 9,464 ------ ------ ------ PRE (NORTH)
2 SCS Runoff 1.412 2 742 7,932 ------ ------ ------ PRE (SOUTH)
3 Combine 2.893 2 744 17,396 1, 2 ------ ------ PRE TOTAL
4 SCS Runoff 10.20 2 720 26,889 ------ ------ ------ POST
5 Reservoir 0.110 2 1440 8,578 4 944.14 37,276 ROUTED
6 SCS Runoff 0.993 2 728 3,522 ------ ------ ------ POST RUNOFF
7 Combine 1.008 2 728 12,100 5, 6 ------ ------ POST TOTAL
Dublin Urban Air Hydroflow 10-19-17.gpw Return Period: 2 Year Monday, 10 / 23 / 2017
Hydraflow Hydrographs Extension for AutoCAD® Civil 3D® 2015 by Autodesk, Inc. v10.4

Hydrograph Report
Hydraflow Hydrographs Extension for AutoCAD® Civil 3D® 2015 by Autodesk, Inc. v10.4 Monday, 10 / 23 / 2017
Hyd. No. 1
PRE (NORTH)
Hydrograph type = SCS Runoff Peak discharge = 1.508 cfsStorm frequency = 2 yrs Time to peak = 12.43 hrsTime interval = 2 min Hyd. volume = 9,464 cuftDrainage area = 2.640 ac Curve number = 80*Basin Slope = 0.0 % Hydraulic length = 0 ftTc method = TR55 Time of conc. (Tc) = 54.00 minTotal precip. = 2.63 in Distribution = Type IIStorm duration = 24 hrs Shape factor = 484
* Composite (Area/CN) = [(3.010 x 77) + (1.880 x 65)] / 2.640
7
0 2 4 6 8 10 12 14 16 18 20 22 24 26
Q (cfs)
0.00 0.00
1.00 1.00
2.00 2.00
Q (cfs)
Time (hrs)
PRE (NORTH)
Hyd. No. 1 -- 2 Year
Hyd No. 1

Hydrograph Report
Hydraflow Hydrographs Extension for AutoCAD® Civil 3D® 2015 by Autodesk, Inc. v10.4 Monday, 10 / 23 / 2017
Hyd. No. 2
PRE (SOUTH)
Hydrograph type = SCS Runoff Peak discharge = 1.412 cfsStorm frequency = 2 yrs Time to peak = 12.37 hrsTime interval = 2 min Hyd. volume = 7,932 cuftDrainage area = 2.250 ac Curve number = 80Basin Slope = 0.0 % Hydraulic length = 0 ftTc method = TR55 Time of conc. (Tc) = 44.80 minTotal precip. = 2.63 in Distribution = Type IIStorm duration = 24 hrs Shape factor = 484
0 2 4 6 8 10 12 14 16 18 20 22 24 26
Q (cfs)
0.00 0.00
1.00 1.00
2.00 2.00
Q (cfs)
Time (hrs)
PRE (SOUTH)
Hyd. No. 2 -- 2 Year
Hyd No. 2

Hydrograph Report
Hydraflow Hydrographs Extension for AutoCAD® Civil 3D® 2015 by Autodesk, Inc. v10.4 Monday, 10 / 23 / 2017
Hyd. No. 3
PRE TOTAL
Hydrograph type = Combine Peak discharge = 2.893 cfsStorm frequency = 2 yrs Time to peak = 12.40 hrsTime interval = 2 min Hyd. volume = 17,396 cuftInflow hyds. = 1, 2 Contrib. drain. area = 4.890 ac
0 2 4 6 8 10 12 14 16 18 20 22 24 26
Q (cfs)
0.00 0.00
1.00 1.00
2.00 2.00
3.00 3.00
Q (cfs)
Time (hrs)
PRE TOTAL
Hyd. No. 3 -- 2 Year
Hyd No. 3 Hyd No. 1 Hyd No. 2

Hydrograph Report
Hydraflow Hydrographs Extension for AutoCAD® Civil 3D® 2015 by Autodesk, Inc. v10.4 Monday, 10 / 23 / 2017
Hyd. No. 4
POST
Hydrograph type = SCS Runoff Peak discharge = 10.20 cfsStorm frequency = 2 yrs Time to peak = 12.00 hrsTime interval = 2 min Hyd. volume = 26,889 cuftDrainage area = 3.960 ac Curve number = 92*Basin Slope = 0.0 % Hydraulic length = 0 ftTc method = User Time of conc. (Tc) = 10.00 minTotal precip. = 2.63 in Distribution = Type IIStorm duration = 24 hrs Shape factor = 484
* Composite (Area/CN) = [(1.370 x 80) + (2.590 x 98)] / 3.960
0 2 4 6 8 10 12 14 16 18 20 22 24 26
Q (cfs)
0.00 0.00
2.00 2.00
4.00 4.00
6.00 6.00
8.00 8.00
10.00 10.00
12.00 12.00
Q (cfs)
Time (hrs)
POST
Hyd. No. 4 -- 2 Year
Hyd No. 4

Hydrograph Report
Hydraflow Hydrographs Extension for AutoCAD® Civil 3D® 2015 by Autodesk, Inc. v10.4 Monday, 10 / 23 / 2017
Hyd. No. 5
ROUTED
Hydrograph type = Reservoir Peak discharge = 0.110 cfsStorm frequency = 2 yrs Time to peak = 24.00 hrsTime interval = 2 min Hyd. volume = 8,578 cuftInflow hyd. No. = 4 - POST Max. Elevation = 944.14 ftReservoir name = Detention Pond Max. Storage = 37,276 cuft
Storage Indication method used. Wet pond routing start elevation = 942.00 ft.
4
0 10 20 30 40 50 60 70 80 90 100
Q (cfs)
0.00 0.00
2.00 2.00
4.00 4.00
6.00 6.00
8.00 8.00
10.00 10.00
12.00 12.00
Q (cfs)
Time (hrs)
ROUTED
Hyd. No. 5 -- 2 Year
Hyd No. 5 Hyd No. 4 Total storage used = 37,276 cuft
Hydrograph Report
Hydraflow Hydrographs Extension for AutoCAD® Civil 3D® 2015 by Autodesk, Inc. v10.4 Monday, 10 / 23 / 2017
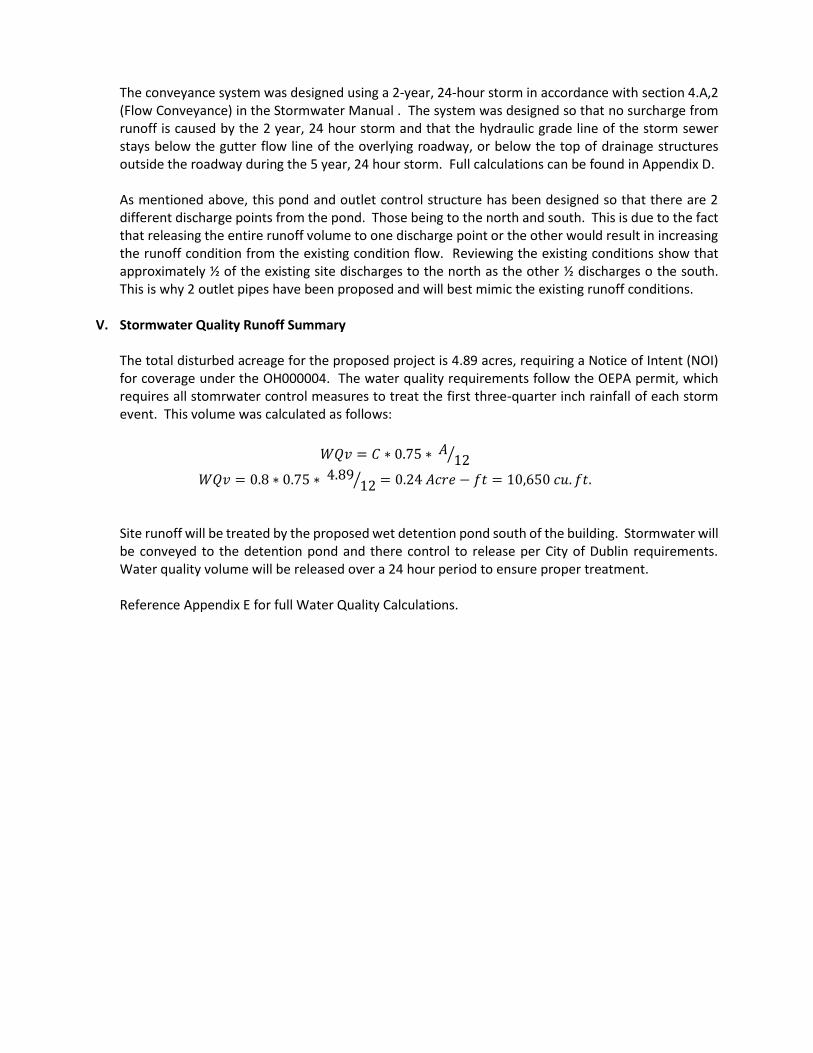
Hyd. No. 6
POST RUNOFF
Hydrograph type = SCS Runoff Peak discharge = 0.993 cfsStorm frequency = 2 yrs Time to peak = 12.13 hrsTime interval = 2 min Hyd. volume = 3,522 cuftDrainage area = 0.920 ac Curve number = 81*Basin Slope = 0.0 % Hydraulic length = 0 ftTc method = TR55 Time of conc. (Tc) = 22.90 minTotal precip. = 2.63 in Distribution = Type IIStorm duration = 24 hrs Shape factor = 484
* Composite (Area/CN) = [(0.890 x 80) + (0.030 x 98)] / 0.920
0 2 4 6 8 10 12 14 16 18 20 22 24 26
Q (cfs)
0.00 0.00
0.10 0.10
0.20 0.20
0.30 0.30
0.40 0.40
0.50 0.50
0.60 0.60
0.70 0.70
0.80 0.80
0.90 0.90
1.00 1.00
Q (cfs)
Time (hrs)
POST RUNOFF
Hyd. No. 6 -- 2 Year
Hyd No. 6

Hydrograph Report
Hydraflow Hydrographs Extension for AutoCAD® Civil 3D® 2015 by Autodesk, Inc. v10.4 Monday, 10 / 23 / 2017
Hyd. No. 7
POST TOTAL
Hydrograph type = Combine Peak discharge = 1.008 cfsStorm frequency = 2 yrs Time to peak = 12.13 hrsTime interval = 2 min Hyd. volume = 12,100 cuftInflow hyds. = 5, 6 Contrib. drain. area = 0.920 ac
0 10 20 30 40 50 60 70 80 90 100
Q (cfs)
0.00 0.00
1.00 1.00
2.00 2.00
Q (cfs)
Time (hrs)
POST TOTAL
Hyd. No. 7 -- 2 Year
Hyd No. 7 Hyd No. 5 Hyd No. 6

Hydrograph Summary Report
8
Hyd. Hydrograph Peak Time Time to Hyd. Inflow Maximum Total Hydrograph
No. type flow interval Peak volume hyd(s) elevation strge used Description
(origin) (cfs) (min) (min) (cuft) (ft) (cuft)
1 SCS Runoff 2.270 2 746 13,838 ------ ------ ------ PRE (NORTH)
2 SCS Runoff 2.121 2 742 11,597 ------ ------ ------ PRE (SOUTH)
3 Combine 4.352 2 744 25,435 1, 2 ------ ------ PRE TOTAL
4 SCS Runoff 13.27 2 720 35,409 ------ ------ ------ POST
5 Reservoir 0.312 2 952 16,978 4 944.31 39,854 ROUTED
6 SCS Runoff 1.461 2 726 5,101 ------ ------ ------ POST RUNOFF
7 Combine 1.477 2 726 22,079 5, 6 ------ ------ POST TOTAL
Dublin Urban Air Hydroflow 10-19-17.gpw Return Period: 5 Year Monday, 10 / 23 / 2017
Hydraflow Hydrographs Extension for AutoCAD® Civil 3D® 2015 by Autodesk, Inc. v10.4

Hydrograph Report
Hydraflow Hydrographs Extension for AutoCAD® Civil 3D® 2015 by Autodesk, Inc. v10.4 Monday, 10 / 23 / 2017
Hyd. No. 1
PRE (NORTH)
Hydrograph type = SCS Runoff Peak discharge = 2.270 cfsStorm frequency = 5 yrs Time to peak = 12.43 hrsTime interval = 2 min Hyd. volume = 13,838 cuftDrainage area = 2.640 ac Curve number = 80*Basin Slope = 0.0 % Hydraulic length = 0 ftTc method = TR55 Time of conc. (Tc) = 54.00 minTotal precip. = 3.24 in Distribution = Type IIStorm duration = 24 hrs Shape factor = 484
* Composite (Area/CN) = [(3.010 x 77) + (1.880 x 65)] / 2.640
9
0 2 4 6 8 10 12 14 16 18 20 22 24 26
Q (cfs)
0.00 0.00
1.00 1.00
2.00 2.00
3.00 3.00
Q (cfs)
Time (hrs)
PRE (NORTH)
Hyd. No. 1 -- 5 Year
Hyd No. 1

Hydrograph Report
Hydraflow Hydrographs Extension for AutoCAD® Civil 3D® 2015 by Autodesk, Inc. v10.4 Monday, 10 / 23 / 2017
Hyd. No. 2
PRE (SOUTH)
Hydrograph type = SCS Runoff Peak discharge = 2.121 cfsStorm frequency = 5 yrs Time to peak = 12.37 hrsTime interval = 2 min Hyd. volume = 11,597 cuftDrainage area = 2.250 ac Curve number = 80Basin Slope = 0.0 % Hydraulic length = 0 ftTc method = TR55 Time of conc. (Tc) = 44.80 minTotal precip. = 3.24 in Distribution = Type IIStorm duration = 24 hrs Shape factor = 484
0 2 4 6 8 10 12 14 16 18 20 22 24 26
Q (cfs)
0.00 0.00
1.00 1.00
2.00 2.00
3.00 3.00
Q (cfs)
Time (hrs)
PRE (SOUTH)
Hyd. No. 2 -- 5 Year
Hyd No. 2

Hydrograph Report
Hydraflow Hydrographs Extension for AutoCAD® Civil 3D® 2015 by Autodesk, Inc. v10.4 Monday, 10 / 23 / 2017
Hyd. No. 3
PRE TOTAL
Hydrograph type = Combine Peak discharge = 4.352 cfsStorm frequency = 5 yrs Time to peak = 12.40 hrsTime interval = 2 min Hyd. volume = 25,435 cuftInflow hyds. = 1, 2 Contrib. drain. area = 4.890 ac
0 2 4 6 8 10 12 14 16 18 20 22 24 26
Q (cfs)
0.00 0.00
1.00 1.00
2.00 2.00
3.00 3.00
4.00 4.00
5.00 5.00
Q (cfs)
Time (hrs)
PRE TOTAL
Hyd. No. 3 -- 5 Year
Hyd No. 3 Hyd No. 1 Hyd No. 2

Hydrograph Report
Hydraflow Hydrographs Extension for AutoCAD® Civil 3D® 2015 by Autodesk, Inc. v10.4 Monday, 10 / 23 / 2017
Hyd. No. 4
POST
Hydrograph type = SCS Runoff Peak discharge = 13.27 cfsStorm frequency = 5 yrs Time to peak = 12.00 hrsTime interval = 2 min Hyd. volume = 35,409 cuftDrainage area = 3.960 ac Curve number = 92*Basin Slope = 0.0 % Hydraulic length = 0 ftTc method = User Time of conc. (Tc) = 10.00 minTotal precip. = 3.24 in Distribution = Type IIStorm duration = 24 hrs Shape factor = 484
* Composite (Area/CN) = [(1.370 x 80) + (2.590 x 98)] / 3.960
0 2 4 6 8 10 12 14 16 18 20 22 24 26
Q (cfs)
0.00 0.00
2.00 2.00
4.00 4.00
6.00 6.00
8.00 8.00
10.00 10.00
12.00 12.00
14.00 14.00
Q (cfs)
Time (hrs)
POST
Hyd. No. 4 -- 5 Year
Hyd No. 4

Hydrograph Report
Hydraflow Hydrographs Extension for AutoCAD® Civil 3D® 2015 by Autodesk, Inc. v10.4 Monday, 10 / 23 / 2017
Hyd. No. 5
ROUTED
Hydrograph type = Reservoir Peak discharge = 0.312 cfsStorm frequency = 5 yrs Time to peak = 15.87 hrsTime interval = 2 min Hyd. volume = 16,978 cuftInflow hyd. No. = 4 - POST Max. Elevation = 944.31 ftReservoir name = Detention Pond Max. Storage = 39,854 cuft
Storage Indication method used. Wet pond routing start elevation = 942.00 ft.
5
0 10 20 30 40 50 60 70 80 90 100
Q (cfs)
0.00 0.00
2.00 2.00
4.00 4.00
6.00 6.00
8.00 8.00
10.00 10.00
12.00 12.00
14.00 14.00
Q (cfs)
Time (hrs)
ROUTED
Hyd. No. 5 -- 5 Year
Hyd No. 5 Hyd No. 4 Total storage used = 39,854 cuft
Hydrograph Report
Hydraflow Hydrographs Extension for AutoCAD® Civil 3D® 2015 by Autodesk, Inc. v10.4 Monday, 10 / 23 / 2017
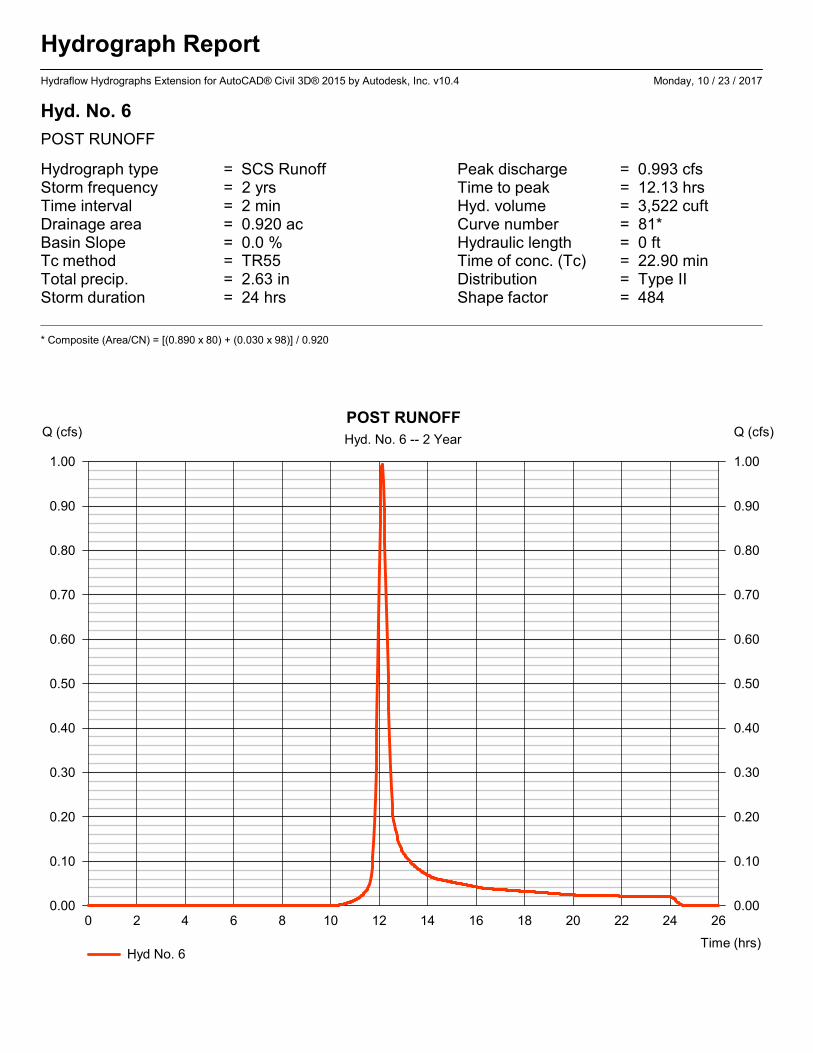
Hyd. No. 6
POST RUNOFF
Hydrograph type = SCS Runoff Peak discharge = 1.461 cfsStorm frequency = 5 yrs Time to peak = 12.10 hrsTime interval = 2 min Hyd. volume = 5,101 cuftDrainage area = 0.920 ac Curve number = 81*Basin Slope = 0.0 % Hydraulic length = 0 ftTc method = TR55 Time of conc. (Tc) = 22.90 minTotal precip. = 3.24 in Distribution = Type IIStorm duration = 24 hrs Shape factor = 484
* Composite (Area/CN) = [(0.890 x 80) + (0.030 x 98)] / 0.920
0 2 4 6 8 10 12 14 16 18 20 22 24 26
Q (cfs)
0.00 0.00
1.00 1.00
2.00 2.00
Q (cfs)
Time (hrs)
POST RUNOFF
Hyd. No. 6 -- 5 Year
Hyd No. 6

Hydrograph Report
Hydraflow Hydrographs Extension for AutoCAD® Civil 3D® 2015 by Autodesk, Inc. v10.4 Monday, 10 / 23 / 2017
Hyd. No. 7
POST TOTAL
Hydrograph type = Combine Peak discharge = 1.477 cfsStorm frequency = 5 yrs Time to peak = 12.10 hrsTime interval = 2 min Hyd. volume = 22,079 cuftInflow hyds. = 5, 6 Contrib. drain. area = 0.920 ac
0 10 20 30 40 50 60 70 80 90 100
Q (cfs)
0.00 0.00
1.00 1.00
2.00 2.00
Q (cfs)
Time (hrs)
POST TOTAL
Hyd. No. 7 -- 5 Year
Hyd No. 7 Hyd No. 5 Hyd No. 6

Hydrograph Summary Report
10
Hyd. Hydrograph Peak Time Time to Hyd. Inflow Maximum Total Hydrograph
No. type flow interval Peak volume hyd(s) elevation strge used Description
(origin) (cfs) (min) (min) (cuft) (ft) (cuft)
1 SCS Runoff 2.932 2 746 17,663 ------ ------ ------ PRE (NORTH)
2 SCS Runoff 2.737 2 742 14,804 ------ ------ ------ PRE (SOUTH)
3 Combine 5.618 2 744 32,467 1, 2 ------ ------ PRE TOTAL
4 SCS Runoff 15.78 2 720 42,500 ------ ------ ------ POST
5 Reservoir 0.594 2 838 24,032 4 944.48 42,495 ROUTED
6 SCS Runoff 1.868 2 726 6,475 ------ ------ ------ POST RUNOFF
7 Combine 1.915 2 728 30,507 5, 6 ------ ------ POST TOTAL
Dublin Urban Air Hydroflow 10-19-17.gpw Return Period: 10 Year Monday, 10 / 23 / 2017
Hydraflow Hydrographs Extension for AutoCAD® Civil 3D® 2015 by Autodesk, Inc. v10.4

Hydrograph Report
Hydraflow Hydrographs Extension for AutoCAD® Civil 3D® 2015 by Autodesk, Inc. v10.4 Monday, 10 / 23 / 2017
Hyd. No. 1
PRE (NORTH)
Hydrograph type = SCS Runoff Peak discharge = 2.932 cfsStorm frequency = 10 yrs Time to peak = 12.43 hrsTime interval = 2 min Hyd. volume = 17,663 cuftDrainage area = 2.640 ac Curve number = 80*Basin Slope = 0.0 % Hydraulic length = 0 ftTc method = TR55 Time of conc. (Tc) = 54.00 minTotal precip. = 3.74 in Distribution = Type IIStorm duration = 24 hrs Shape factor = 484
* Composite (Area/CN) = [(3.010 x 77) + (1.880 x 65)] / 2.640
11
0 2 4 6 8 10 12 14 16 18 20 22 24 26
Q (cfs)
0.00 0.00
1.00 1.00
2.00 2.00
3.00 3.00
Q (cfs)
Time (hrs)
PRE (NORTH)
Hyd. No. 1 -- 10 Year
Hyd No. 1

Hydrograph Report
Hydraflow Hydrographs Extension for AutoCAD® Civil 3D® 2015 by Autodesk, Inc. v10.4 Monday, 10 / 23 / 2017
Hyd. No. 2
PRE (SOUTH)
Hydrograph type = SCS Runoff Peak discharge = 2.737 cfsStorm frequency = 10 yrs Time to peak = 12.37 hrsTime interval = 2 min Hyd. volume = 14,804 cuftDrainage area = 2.250 ac Curve number = 80Basin Slope = 0.0 % Hydraulic length = 0 ftTc method = TR55 Time of conc. (Tc) = 44.80 minTotal precip. = 3.74 in Distribution = Type IIStorm duration = 24 hrs Shape factor = 484
0 2 4 6 8 10 12 14 16 18 20 22 24 26
Q (cfs)
0.00 0.00
1.00 1.00
2.00 2.00
3.00 3.00
Q (cfs)
Time (hrs)
PRE (SOUTH)
Hyd. No. 2 -- 10 Year
Hyd No. 2

Hydrograph Report
Hydraflow Hydrographs Extension for AutoCAD® Civil 3D® 2015 by Autodesk, Inc. v10.4 Monday, 10 / 23 / 2017
Hyd. No. 3
PRE TOTAL
Hydrograph type = Combine Peak discharge = 5.618 cfsStorm frequency = 10 yrs Time to peak = 12.40 hrsTime interval = 2 min Hyd. volume = 32,467 cuftInflow hyds. = 1, 2 Contrib. drain. area = 4.890 ac
0 2 4 6 8 10 12 14 16 18 20 22 24 26
Q (cfs)
0.00 0.00
1.00 1.00
2.00 2.00
3.00 3.00
4.00 4.00
5.00 5.00
6.00 6.00
Q (cfs)
Time (hrs)
PRE TOTAL
Hyd. No. 3 -- 10 Year
Hyd No. 3 Hyd No. 1 Hyd No. 2

Hydrograph Report
Hydraflow Hydrographs Extension for AutoCAD® Civil 3D® 2015 by Autodesk, Inc. v10.4 Monday, 10 / 23 / 2017
Hyd. No. 4
POST
Hydrograph type = SCS Runoff Peak discharge = 15.78 cfsStorm frequency = 10 yrs Time to peak = 12.00 hrsTime interval = 2 min Hyd. volume = 42,500 cuftDrainage area = 3.960 ac Curve number = 92*Basin Slope = 0.0 % Hydraulic length = 0 ftTc method = User Time of conc. (Tc) = 10.00 minTotal precip. = 3.74 in Distribution = Type IIStorm duration = 24 hrs Shape factor = 484
* Composite (Area/CN) = [(1.370 x 80) + (2.590 x 98)] / 3.960
0 2 4 6 8 10 12 14 16 18 20 22 24 26
Q (cfs)
0.00 0.00
3.00 3.00
6.00 6.00
9.00 9.00
12.00 12.00
15.00 15.00
18.00 18.00
Q (cfs)
Time (hrs)
POST
Hyd. No. 4 -- 10 Year
Hyd No. 4

Hydrograph Report
Hydraflow Hydrographs Extension for AutoCAD® Civil 3D® 2015 by Autodesk, Inc. v10.4 Monday, 10 / 23 / 2017
Hyd. No. 5
ROUTED
Hydrograph type = Reservoir Peak discharge = 0.594 cfsStorm frequency = 10 yrs Time to peak = 13.97 hrsTime interval = 2 min Hyd. volume = 24,032 cuftInflow hyd. No. = 4 - POST Max. Elevation = 944.48 ftReservoir name = Detention Pond Max. Storage = 42,495 cuft
Storage Indication method used. Wet pond routing start elevation = 942.00 ft.
6
0 10 20 30 40 50 60 70 80 90 100
Q (cfs)
0.00 0.00
3.00 3.00
6.00 6.00
9.00 9.00
12.00 12.00
15.00 15.00
18.00 18.00
Q (cfs)
Time (hrs)
ROUTED
Hyd. No. 5 -- 10 Year
Hyd No. 5 Hyd No. 4 Total storage used = 42,495 cuft

Hydrograph Report
Hydraflow Hydrographs Extension for AutoCAD® Civil 3D® 2015 by Autodesk, Inc. v10.4 Monday, 10 / 23 / 2017
Hyd. No. 6
POST RUNOFF
Hydrograph type = SCS Runoff Peak discharge = 1.868 cfsStorm frequency = 10 yrs Time to peak = 12.10 hrsTime interval = 2 min Hyd. volume = 6,475 cuftDrainage area = 0.920 ac Curve number = 81*Basin Slope = 0.0 % Hydraulic length = 0 ftTc method = TR55 Time of conc. (Tc) = 22.90 minTotal precip. = 3.74 in Distribution = Type IIStorm duration = 24 hrs Shape factor = 484
* Composite (Area/CN) = [(0.890 x 80) + (0.030 x 98)] / 0.920
0 2 4 6 8 10 12 14 16 18 20 22 24 26
Q (cfs)
0.00 0.00
1.00 1.00
2.00 2.00
Q (cfs)
Time (hrs)
POST RUNOFF
Hyd. No. 6 -- 10 Year
Hyd No. 6

Hydrograph Report
Hydraflow Hydrographs Extension for AutoCAD® Civil 3D® 2015 by Autodesk, Inc. v10.4 Monday, 10 / 23 / 2017
Hyd. No. 7
POST TOTAL
Hydrograph type = Combine Peak discharge = 1.915 cfsStorm frequency = 10 yrs Time to peak = 12.13 hrsTime interval = 2 min Hyd. volume = 30,507 cuftInflow hyds. = 5, 6 Contrib. drain. area = 0.920 ac
0 4 8 12 16 20 24 28 32 36 40
Q (cfs)
0.00 0.00
1.00 1.00
2.00 2.00
Q (cfs)
Time (hrs)
POST TOTAL
Hyd. No. 7 -- 10 Year
Hyd No. 7 Hyd No. 5 Hyd No. 6

Hydrograph Summary Report
12
Hyd. Hydrograph Peak Time Time to Hyd. Inflow Maximum Total Hydrograph
No. type flow interval Peak volume hyd(s) elevation strge used Description
(origin) (cfs) (min) (min) (cuft) (ft) (cuft)
1 SCS Runoff 3.894 2 746 23,281 ------ ------ ------ PRE (NORTH)
2 SCS Runoff 3.632 2 742 19,512 ------ ------ ------ PRE (SOUTH)
3 Combine 7.460 2 744 42,793 1, 2 ------ ------ PRE TOTAL
4 SCS Runoff 19.28 2 720 52,533 ------ ------ ------ POST
5 Reservoir 1.198 2 780 34,029 4 944.78 46,982 ROUTED
6 SCS Runoff 2.457 2 726 8,485 ------ ------ ------ POST RUNOFF
7 Combine 3.013 2 730 42,514 5, 6 ------ ------ POST TOTAL
Dublin Urban Air Hydroflow 10-19-17.gpw Return Period: 25 Year Monday, 10 / 23 / 2017
Hydraflow Hydrographs Extension for AutoCAD® Civil 3D® 2015 by Autodesk, Inc. v10.4

Hydrograph Report
Hydraflow Hydrographs Extension for AutoCAD® Civil 3D® 2015 by Autodesk, Inc. v10.4 Monday, 10 / 23 / 2017
Hyd. No. 1
PRE (NORTH)
Hydrograph type = SCS Runoff Peak discharge = 3.894 cfsStorm frequency = 25 yrs Time to peak = 12.43 hrsTime interval = 2 min Hyd. volume = 23,281 cuftDrainage area = 2.640 ac Curve number = 80*Basin Slope = 0.0 % Hydraulic length = 0 ftTc method = TR55 Time of conc. (Tc) = 54.00 minTotal precip. = 4.44 in Distribution = Type IIStorm duration = 24 hrs Shape factor = 484
* Composite (Area/CN) = [(3.010 x 77) + (1.880 x 65)] / 2.640
13
0 2 4 6 8 10 12 14 16 18 20 22 24 26
Q (cfs)
0.00 0.00
1.00 1.00
2.00 2.00
3.00 3.00
4.00 4.00
Q (cfs)
Time (hrs)
PRE (NORTH)
Hyd. No. 1 -- 25 Year
Hyd No. 1

Hydrograph Report
Hydraflow Hydrographs Extension for AutoCAD® Civil 3D® 2015 by Autodesk, Inc. v10.4 Monday, 10 / 23 / 2017
Hyd. No. 2
PRE (SOUTH)
Hydrograph type = SCS Runoff Peak discharge = 3.632 cfsStorm frequency = 25 yrs Time to peak = 12.37 hrsTime interval = 2 min Hyd. volume = 19,512 cuftDrainage area = 2.250 ac Curve number = 80Basin Slope = 0.0 % Hydraulic length = 0 ftTc method = TR55 Time of conc. (Tc) = 44.80 minTotal precip. = 4.44 in Distribution = Type IIStorm duration = 24 hrs Shape factor = 484
0 2 4 6 8 10 12 14 16 18 20 22 24 26
Q (cfs)
0.00 0.00
1.00 1.00
2.00 2.00
3.00 3.00
4.00 4.00
Q (cfs)
Time (hrs)
PRE (SOUTH)
Hyd. No. 2 -- 25 Year
Hyd No. 2

Hydrograph Report
Hydraflow Hydrographs Extension for AutoCAD® Civil 3D® 2015 by Autodesk, Inc. v10.4 Monday, 10 / 23 / 2017
Hyd. No. 3
PRE TOTAL
Hydrograph type = Combine Peak discharge = 7.460 cfsStorm frequency = 25 yrs Time to peak = 12.40 hrsTime interval = 2 min Hyd. volume = 42,793 cuftInflow hyds. = 1, 2 Contrib. drain. area = 4.890 ac
0 2 4 6 8 10 12 14 16 18 20 22 24 26
Q (cfs)
0.00 0.00
2.00 2.00
4.00 4.00
6.00 6.00
8.00 8.00
Q (cfs)
Time (hrs)
PRE TOTAL
Hyd. No. 3 -- 25 Year
Hyd No. 3 Hyd No. 1 Hyd No. 2

Hydrograph Report
Hydraflow Hydrographs Extension for AutoCAD® Civil 3D® 2015 by Autodesk, Inc. v10.4 Monday, 10 / 23 / 2017
Hyd. No. 4
POST
Hydrograph type = SCS Runoff Peak discharge = 19.28 cfsStorm frequency = 25 yrs Time to peak = 12.00 hrsTime interval = 2 min Hyd. volume = 52,533 cuftDrainage area = 3.960 ac Curve number = 92*Basin Slope = 0.0 % Hydraulic length = 0 ftTc method = User Time of conc. (Tc) = 10.00 minTotal precip. = 4.44 in Distribution = Type IIStorm duration = 24 hrs Shape factor = 484
* Composite (Area/CN) = [(1.370 x 80) + (2.590 x 98)] / 3.960
0 2 4 6 8 10 12 14 16 18 20 22 24 26
Q (cfs)
0.00 0.00
3.00 3.00
6.00 6.00
9.00 9.00
12.00 12.00
15.00 15.00
18.00 18.00
21.00 21.00
Q (cfs)
Time (hrs)
POST
Hyd. No. 4 -- 25 Year
Hyd No. 4

Hydrograph Report
Hydraflow Hydrographs Extension for AutoCAD® Civil 3D® 2015 by Autodesk, Inc. v10.4 Monday, 10 / 23 / 2017
Hyd. No. 5
ROUTED
Hydrograph type = Reservoir Peak discharge = 1.198 cfsStorm frequency = 25 yrs Time to peak = 13.00 hrsTime interval = 2 min Hyd. volume = 34,029 cuftInflow hyd. No. = 4 - POST Max. Elevation = 944.78 ftReservoir name = Detention Pond Max. Storage = 46,982 cuft
Storage Indication method used. Wet pond routing start elevation = 942.00 ft.
7
0 10 20 30 40 50 60 70 80 90 100
Q (cfs)
0.00 0.00
3.00 3.00
6.00 6.00
9.00 9.00
12.00 12.00
15.00 15.00
18.00 18.00
21.00 21.00
Q (cfs)
Time (hrs)
ROUTED
Hyd. No. 5 -- 25 Year
Hyd No. 5 Hyd No. 4 Total storage used = 46,982 cuft

Hydrograph Report
Hydraflow Hydrographs Extension for AutoCAD® Civil 3D® 2015 by Autodesk, Inc. v10.4 Monday, 10 / 23 / 2017
Hyd. No. 6
POST RUNOFF
Hydrograph type = SCS Runoff Peak discharge = 2.457 cfsStorm frequency = 25 yrs Time to peak = 12.10 hrsTime interval = 2 min Hyd. volume = 8,485 cuftDrainage area = 0.920 ac Curve number = 81*Basin Slope = 0.0 % Hydraulic length = 0 ftTc method = TR55 Time of conc. (Tc) = 22.90 minTotal precip. = 4.44 in Distribution = Type IIStorm duration = 24 hrs Shape factor = 484
* Composite (Area/CN) = [(0.890 x 80) + (0.030 x 98)] / 0.920
0 2 4 6 8 10 12 14 16 18 20 22 24 26
Q (cfs)
0.00 0.00
1.00 1.00
2.00 2.00
3.00 3.00
Q (cfs)
Time (hrs)
POST RUNOFF
Hyd. No. 6 -- 25 Year
Hyd No. 6
Hydrograph Report
Hydraflow Hydrographs Extension for AutoCAD® Civil 3D® 2015 by Autodesk, Inc. v10.4 Monday, 10 / 23 / 2017
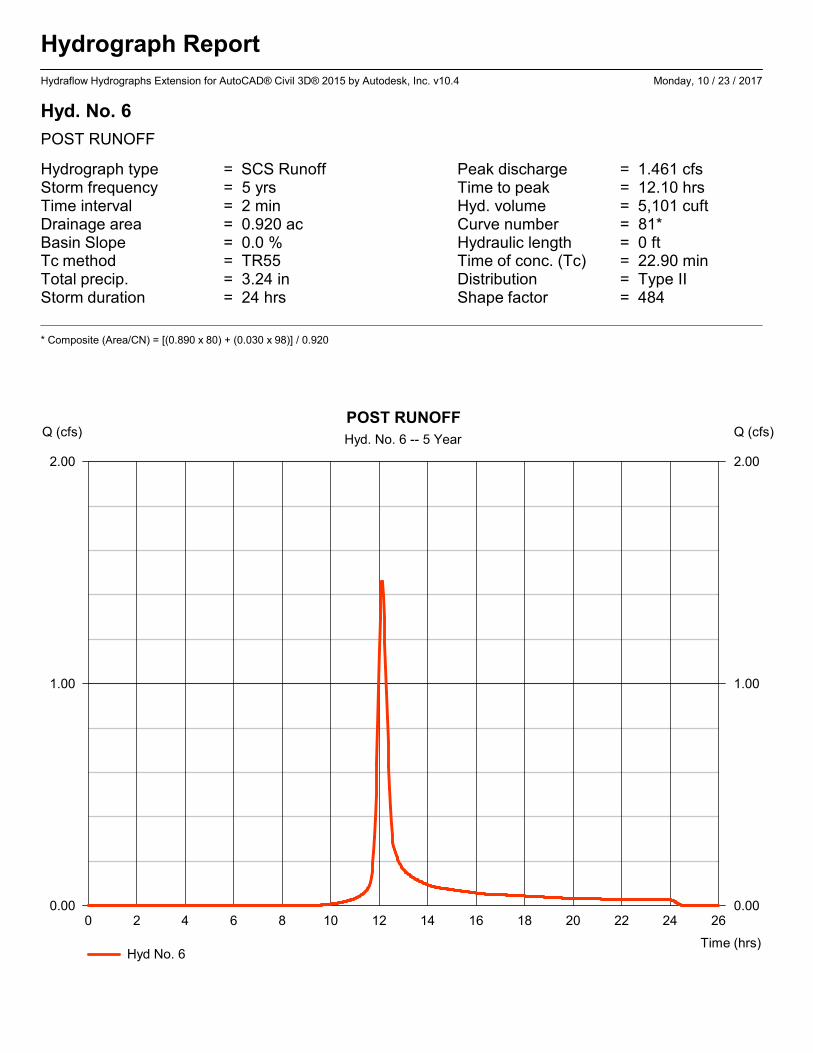
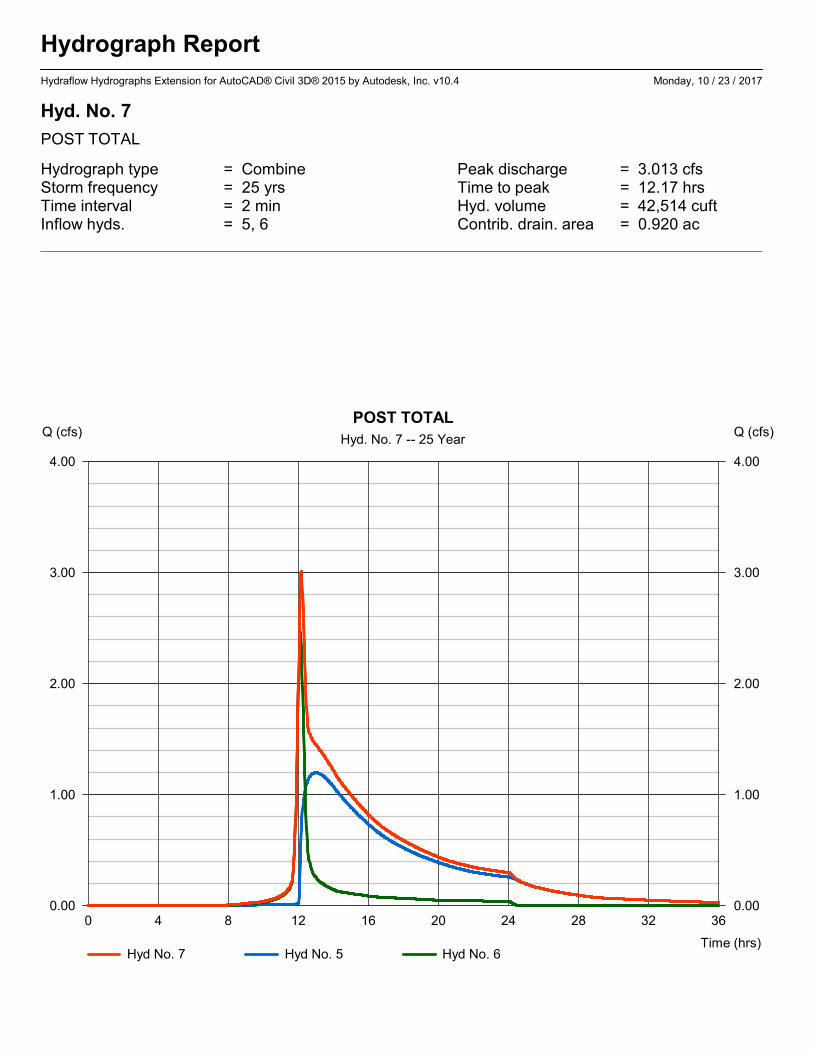
Hyd. No. 7
POST TOTAL
Hydrograph type = Combine Peak discharge = 3.013 cfsStorm frequency = 25 yrs Time to peak = 12.17 hrsTime interval = 2 min Hyd. volume = 42,514 cuftInflow hyds. = 5, 6 Contrib. drain. area = 0.920 ac
0 4 8 12 16 20 24 28 32 36
Q (cfs)
0.00 0.00
1.00 1.00
2.00 2.00
3.00 3.00
4.00 4.00
Q (cfs)
Time (hrs)
POST TOTAL
Hyd. No. 7 -- 25 Year
Hyd No. 7 Hyd No. 5 Hyd No. 6

Hydrograph Summary Report
14
Hyd. Hydrograph Peak Time Time to Hyd. Inflow Maximum Total Hydrograph
No. type flow interval Peak volume hyd(s) elevation strge used Description
(origin) (cfs) (min) (min) (cuft) (ft) (cuft)
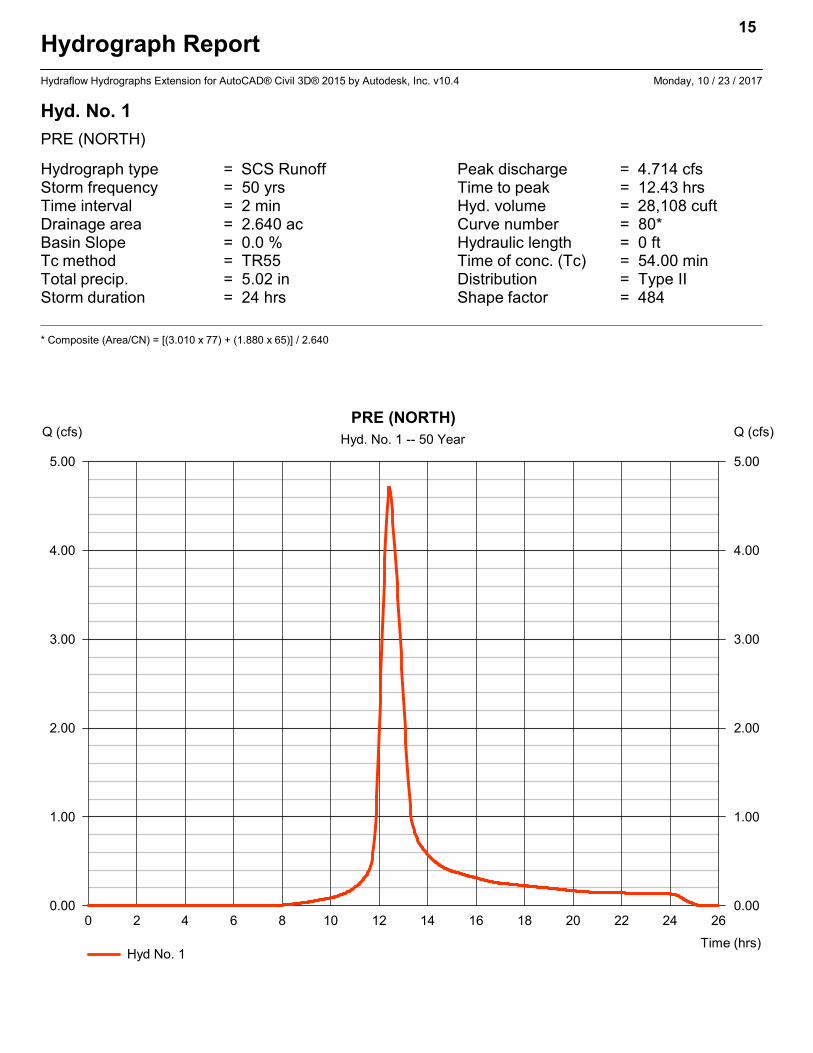
1 SCS Runoff 4.714 2 746 28,108 ------ ------ ------ PRE (NORTH)
2 SCS Runoff 4.393 2 742 23,558 ------ ------ ------ PRE (SOUTH)
3 Combine 9.029 2 744 51,666 1, 2 ------ ------ PRE TOTAL
4 SCS Runoff 22.16 2 720 60,909 ------ ------ ------ POST
5 Reservoir 1.803 2 760 42,382 4 945.05 51,221 ROUTED
6 SCS Runoff 2.956 2 726 10,208 ------ ------ ------ POST RUNOFF
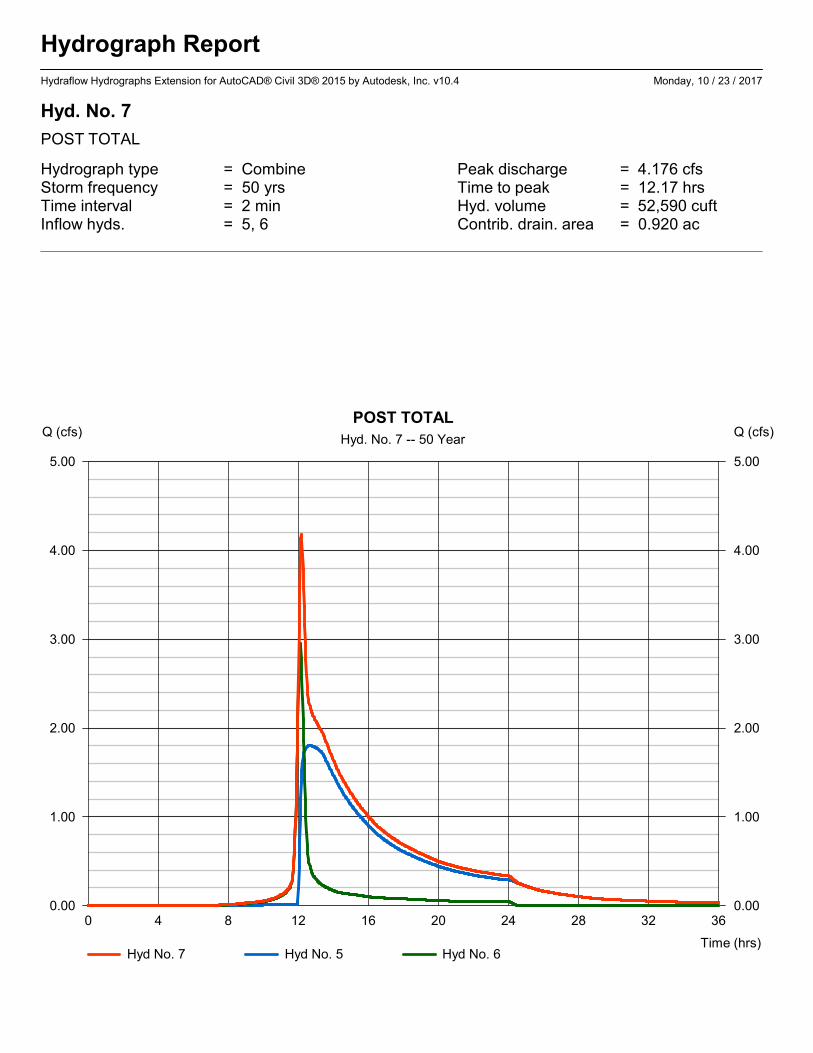
7 Combine 4.176 2 730 52,590 5, 6 ------ ------ POST TOTAL
Dublin Urban Air Hydroflow 10-19-17.gpw Return Period: 50 Year Monday, 10 / 23 / 2017
Hydraflow Hydrographs Extension for AutoCAD® Civil 3D® 2015 by Autodesk, Inc. v10.4
Hydrograph Report
Hydraflow Hydrographs Extension for AutoCAD® Civil 3D® 2015 by Autodesk, Inc. v10.4 Monday, 10 / 23 / 2017
Hyd. No. 1
PRE (NORTH)
Hydrograph type = SCS Runoff Peak discharge = 4.714 cfsStorm frequency = 50 yrs Time to peak = 12.43 hrsTime interval = 2 min Hyd. volume = 28,108 cuftDrainage area = 2.640 ac Curve number = 80*Basin Slope = 0.0 % Hydraulic length = 0 ftTc method = TR55 Time of conc. (Tc) = 54.00 minTotal precip. = 5.02 in Distribution = Type IIStorm duration = 24 hrs Shape factor = 484
* Composite (Area/CN) = [(3.010 x 77) + (1.880 x 65)] / 2.640
15
0 2 4 6 8 10 12 14 16 18 20 22 24 26
Q (cfs)
0.00 0.00
1.00 1.00
2.00 2.00
3.00 3.00
4.00 4.00
5.00 5.00
Q (cfs)
Time (hrs)
PRE (NORTH)
Hyd. No. 1 -- 50 Year
Hyd No. 1

Hydrograph Report
Hydraflow Hydrographs Extension for AutoCAD® Civil 3D® 2015 by Autodesk, Inc. v10.4 Monday, 10 / 23 / 2017
Hyd. No. 2
PRE (SOUTH)
Hydrograph type = SCS Runoff Peak discharge = 4.393 cfsStorm frequency = 50 yrs Time to peak = 12.37 hrsTime interval = 2 min Hyd. volume = 23,558 cuftDrainage area = 2.250 ac Curve number = 80Basin Slope = 0.0 % Hydraulic length = 0 ftTc method = TR55 Time of conc. (Tc) = 44.80 minTotal precip. = 5.02 in Distribution = Type IIStorm duration = 24 hrs Shape factor = 484
0 2 4 6 8 10 12 14 16 18 20 22 24 26
Q (cfs)
0.00 0.00
1.00 1.00
2.00 2.00
3.00 3.00
4.00 4.00
5.00 5.00
Q (cfs)
Time (hrs)
PRE (SOUTH)
Hyd. No. 2 -- 50 Year
Hyd No. 2

Hydrograph Report
Hydraflow Hydrographs Extension for AutoCAD® Civil 3D® 2015 by Autodesk, Inc. v10.4 Monday, 10 / 23 / 2017
Hyd. No. 3
PRE TOTAL
Hydrograph type = Combine Peak discharge = 9.029 cfsStorm frequency = 50 yrs Time to peak = 12.40 hrsTime interval = 2 min Hyd. volume = 51,666 cuftInflow hyds. = 1, 2 Contrib. drain. area = 4.890 ac
0 2 4 6 8 10 12 14 16 18 20 22 24 26
Q (cfs)
0.00 0.00
2.00 2.00
4.00 4.00
6.00 6.00
8.00 8.00
10.00 10.00
Q (cfs)
Time (hrs)
PRE TOTAL
Hyd. No. 3 -- 50 Year
Hyd No. 3 Hyd No. 1 Hyd No. 2

Hydrograph Report
Hydraflow Hydrographs Extension for AutoCAD® Civil 3D® 2015 by Autodesk, Inc. v10.4 Monday, 10 / 23 / 2017
Hyd. No. 4
POST
Hydrograph type = SCS Runoff Peak discharge = 22.16 cfsStorm frequency = 50 yrs Time to peak = 12.00 hrsTime interval = 2 min Hyd. volume = 60,909 cuftDrainage area = 3.960 ac Curve number = 92*Basin Slope = 0.0 % Hydraulic length = 0 ftTc method = User Time of conc. (Tc) = 10.00 minTotal precip. = 5.02 in Distribution = Type IIStorm duration = 24 hrs Shape factor = 484
* Composite (Area/CN) = [(1.370 x 80) + (2.590 x 98)] / 3.960
0 2 4 6 8 10 12 14 16 18 20 22 24 26
Q (cfs)
0.00 0.00
4.00 4.00
8.00 8.00
12.00 12.00
16.00 16.00
20.00 20.00
24.00 24.00
Q (cfs)
Time (hrs)
POST
Hyd. No. 4 -- 50 Year
Hyd No. 4

Hydrograph Report
Hydraflow Hydrographs Extension for AutoCAD® Civil 3D® 2015 by Autodesk, Inc. v10.4 Monday, 10 / 23 / 2017
Hyd. No. 5
ROUTED
Hydrograph type = Reservoir Peak discharge = 1.803 cfsStorm frequency = 50 yrs Time to peak = 12.67 hrsTime interval = 2 min Hyd. volume = 42,382 cuftInflow hyd. No. = 4 - POST Max. Elevation = 945.05 ftReservoir name = Detention Pond Max. Storage = 51,221 cuft
Storage Indication method used. Wet pond routing start elevation = 942.00 ft.
8
0 4 8 12 16 20 24 28 32 36 40 44 48 52
Q (cfs)
0.00 0.00
4.00 4.00
8.00 8.00
12.00 12.00
16.00 16.00
20.00 20.00
24.00 24.00
Q (cfs)
Time (hrs)
ROUTED
Hyd. No. 5 -- 50 Year
Hyd No. 5 Hyd No. 4 Total storage used = 51,221 cuft

Hydrograph Report
Hydraflow Hydrographs Extension for AutoCAD® Civil 3D® 2015 by Autodesk, Inc. v10.4 Monday, 10 / 23 / 2017
Hyd. No. 6
POST RUNOFF
Hydrograph type = SCS Runoff Peak discharge = 2.956 cfsStorm frequency = 50 yrs Time to peak = 12.10 hrsTime interval = 2 min Hyd. volume = 10,208 cuftDrainage area = 0.920 ac Curve number = 81*Basin Slope = 0.0 % Hydraulic length = 0 ftTc method = TR55 Time of conc. (Tc) = 22.90 minTotal precip. = 5.02 in Distribution = Type IIStorm duration = 24 hrs Shape factor = 484
* Composite (Area/CN) = [(0.890 x 80) + (0.030 x 98)] / 0.920
0 2 4 6 8 10 12 14 16 18 20 22 24 26
Q (cfs)
0.00 0.00
1.00 1.00
2.00 2.00
3.00 3.00
Q (cfs)
Time (hrs)
POST RUNOFF
Hyd. No. 6 -- 50 Year
Hyd No. 6
Hydrograph Report
Hydraflow Hydrographs Extension for AutoCAD® Civil 3D® 2015 by Autodesk, Inc. v10.4 Monday, 10 / 23 / 2017
Hyd. No. 7
POST TOTAL
Hydrograph type = Combine Peak discharge = 4.176 cfsStorm frequency = 50 yrs Time to peak = 12.17 hrsTime interval = 2 min Hyd. volume = 52,590 cuftInflow hyds. = 5, 6 Contrib. drain. area = 0.920 ac
0 4 8 12 16 20 24 28 32 36
Q (cfs)
0.00 0.00
1.00 1.00
2.00 2.00
3.00 3.00
4.00 4.00
5.00 5.00
Q (cfs)
Time (hrs)
POST TOTAL
Hyd. No. 7 -- 50 Year
Hyd No. 7 Hyd No. 5 Hyd No. 6

Hydrograph Summary Report
16
Hyd. Hydrograph Peak Time Time to Hyd. Inflow Maximum Total Hydrograph
No. type flow interval Peak volume hyd(s) elevation strge used Description
(origin) (cfs) (min) (min) (cuft) (ft) (cuft)
1 SCS Runoff 5.590 2 746 33,312 ------ ------ ------ PRE (NORTH)
2 SCS Runoff 5.212 2 740 27,919 ------ ------ ------ PRE (SOUTH)
3 Combine 10.71 2 742 61,231 1, 2 ------ ------ PRE TOTAL
4 SCS Runoff 25.18 2 720 69,763 ------ ------ ------ POST
5 Reservoir 2.508 2 752 51,216 4 945.31 56,087 ROUTED
6 SCS Runoff 3.488 2 726 12,061 ------ ------ ------ POST RUNOFF
7 Combine 5.323 2 728 63,277 5, 6 ------ ------ POST TOTAL
Dublin Urban Air Hydroflow 10-19-17.gpw Return Period: 100 Year Monday, 10 / 23 / 2017
Hydraflow Hydrographs Extension for AutoCAD® Civil 3D® 2015 by Autodesk, Inc. v10.4

Hydrograph Report
Hydraflow Hydrographs Extension for AutoCAD® Civil 3D® 2015 by Autodesk, Inc. v10.4 Monday, 10 / 23 / 2017
Hyd. No. 1
PRE (NORTH)
Hydrograph type = SCS Runoff Peak discharge = 5.590 cfsStorm frequency = 100 yrs Time to peak = 12.43 hrsTime interval = 2 min Hyd. volume = 33,312 cuftDrainage area = 2.640 ac Curve number = 80*Basin Slope = 0.0 % Hydraulic length = 0 ftTc method = TR55 Time of conc. (Tc) = 54.00 minTotal precip. = 5.63 in Distribution = Type IIStorm duration = 24 hrs Shape factor = 484
* Composite (Area/CN) = [(3.010 x 77) + (1.880 x 65)] / 2.640
17
0 2 4 6 8 10 12 14 16 18 20 22 24 26
Q (cfs)
0.00 0.00
1.00 1.00
2.00 2.00
3.00 3.00
4.00 4.00
5.00 5.00
6.00 6.00
Q (cfs)
Time (hrs)
PRE (NORTH)
Hyd. No. 1 -- 100 Year
Hyd No. 1

Hydrograph Report
Hydraflow Hydrographs Extension for AutoCAD® Civil 3D® 2015 by Autodesk, Inc. v10.4 Monday, 10 / 23 / 2017
Hyd. No. 2
PRE (SOUTH)
Hydrograph type = SCS Runoff Peak discharge = 5.212 cfsStorm frequency = 100 yrs Time to peak = 12.33 hrsTime interval = 2 min Hyd. volume = 27,919 cuftDrainage area = 2.250 ac Curve number = 80Basin Slope = 0.0 % Hydraulic length = 0 ftTc method = TR55 Time of conc. (Tc) = 44.80 minTotal precip. = 5.63 in Distribution = Type IIStorm duration = 24 hrs Shape factor = 484
0 2 4 6 8 10 12 14 16 18 20 22 24 26
Q (cfs)
0.00 0.00
1.00 1.00
2.00 2.00
3.00 3.00
4.00 4.00
5.00 5.00
6.00 6.00
Q (cfs)
Time (hrs)
PRE (SOUTH)
Hyd. No. 2 -- 100 Year
Hyd No. 2

Hydrograph Report
Hydraflow Hydrographs Extension for AutoCAD® Civil 3D® 2015 by Autodesk, Inc. v10.4 Monday, 10 / 23 / 2017
Hyd. No. 3
PRE TOTAL
Hydrograph type = Combine Peak discharge = 10.71 cfsStorm frequency = 100 yrs Time to peak = 12.37 hrsTime interval = 2 min Hyd. volume = 61,231 cuftInflow hyds. = 1, 2 Contrib. drain. area = 4.890 ac
0 2 4 6 8 10 12 14 16 18 20 22 24 26
Q (cfs)
0.00 0.00
2.00 2.00
4.00 4.00
6.00 6.00
8.00 8.00
10.00 10.00
12.00 12.00
Q (cfs)
Time (hrs)
PRE TOTAL
Hyd. No. 3 -- 100 Year
Hyd No. 3 Hyd No. 1 Hyd No. 2

Hydrograph Report
Hydraflow Hydrographs Extension for AutoCAD® Civil 3D® 2015 by Autodesk, Inc. v10.4 Monday, 10 / 23 / 2017
Hyd. No. 4
POST
Hydrograph type = SCS Runoff Peak discharge = 25.18 cfsStorm frequency = 100 yrs Time to peak = 12.00 hrsTime interval = 2 min Hyd. volume = 69,763 cuftDrainage area = 3.960 ac Curve number = 92*Basin Slope = 0.0 % Hydraulic length = 0 ftTc method = User Time of conc. (Tc) = 10.00 minTotal precip. = 5.63 in Distribution = Type IIStorm duration = 24 hrs Shape factor = 484
* Composite (Area/CN) = [(1.370 x 80) + (2.590 x 98)] / 3.960
0 2 4 6 8 10 12 14 16 18 20 22 24 26
Q (cfs)
0.00 0.00
4.00 4.00
8.00 8.00
12.00 12.00
16.00 16.00
20.00 20.00
24.00 24.00
28.00 28.00
Q (cfs)
Time (hrs)
POST
Hyd. No. 4 -- 100 Year
Hyd No. 4

Hydrograph Report
Hydraflow Hydrographs Extension for AutoCAD® Civil 3D® 2015 by Autodesk, Inc. v10.4 Monday, 10 / 23 / 2017
Hyd. No. 5
ROUTED
Hydrograph type = Reservoir Peak discharge = 2.508 cfsStorm frequency = 100 yrs Time to peak = 12.53 hrsTime interval = 2 min Hyd. volume = 51,216 cuftInflow hyd. No. = 4 - POST Max. Elevation = 945.31 ftReservoir name = Detention Pond Max. Storage = 56,087 cuft
Storage Indication method used. Wet pond routing start elevation = 942.00 ft.
9
0 4 8 12 16 20 24 28 32 36 40
Q (cfs)
0.00 0.00
4.00 4.00
8.00 8.00
12.00 12.00
16.00 16.00
20.00 20.00
24.00 24.00
28.00 28.00
Q (cfs)
Time (hrs)
ROUTED
Hyd. No. 5 -- 100 Year
Hyd No. 5 Hyd No. 4 Total storage used = 56,087 cuft

Hydrograph Report
Hydraflow Hydrographs Extension for AutoCAD® Civil 3D® 2015 by Autodesk, Inc. v10.4 Monday, 10 / 23 / 2017
Hyd. No. 6
POST RUNOFF
Hydrograph type = SCS Runoff Peak discharge = 3.488 cfsStorm frequency = 100 yrs Time to peak = 12.10 hrsTime interval = 2 min Hyd. volume = 12,061 cuftDrainage area = 0.920 ac Curve number = 81*Basin Slope = 0.0 % Hydraulic length = 0 ftTc method = TR55 Time of conc. (Tc) = 22.90 minTotal precip. = 5.63 in Distribution = Type IIStorm duration = 24 hrs Shape factor = 484
* Composite (Area/CN) = [(0.890 x 80) + (0.030 x 98)] / 0.920
0 2 4 6 8 10 12 14 16 18 20 22 24 26
Q (cfs)
0.00 0.00
1.00 1.00
2.00 2.00
3.00 3.00
4.00 4.00
Q (cfs)
Time (hrs)
POST RUNOFF
Hyd. No. 6 -- 100 Year
Hyd No. 6

Hydrograph Report
Hydraflow Hydrographs Extension for AutoCAD® Civil 3D® 2015 by Autodesk, Inc. v10.4 Monday, 10 / 23 / 2017
Hyd. No. 7
POST TOTAL
Hydrograph type = Combine Peak discharge = 5.323 cfsStorm frequency = 100 yrs Time to peak = 12.13 hrsTime interval = 2 min Hyd. volume = 63,277 cuftInflow hyds. = 5, 6 Contrib. drain. area = 0.920 ac
0 4 8 12 16 20 24 28 32 36
Q (cfs)
0.00 0.00
1.00 1.00
2.00 2.00
3.00 3.00
4.00 4.00
5.00 5.00
6.00 6.00
Q (cfs)
Time (hrs)
POST TOTAL
Hyd. No. 7 -- 100 Year
Hyd No. 7 Hyd No. 5 Hyd No. 6

TR55 Tc Worksheet5
Hydraflow Hydrographs Extension for AutoCAD® Civil 3D® 2015 by Autodesk, Inc. v10.4
Hyd. No. 1
PRE (NORTH)
Description A B C Totals
Sheet FlowManning's n-value = 0.240 0.240 0.011Flow length (ft) = 300.0 0.0 0.0Two-year 24-hr precip. (in) = 2.63 2.63 0.00Land slope (%) = 1.33 0.00 0.00
Travel Time (min) = 44.63 + 0.00 + 0.00 = 44.63
Shallow Concentrated FlowFlow length (ft) = 496.00 0.00 0.00Watercourse slope (%) = 0.30 0.00 0.00Surface description = Unpaved Paved PavedAverage velocity (ft/s) =0.88 0.00 0.00
Travel Time (min) = 9.35 + 0.00 + 0.00 = 9.35
Channel FlowX sectional flow area (sqft) = 0.00 0.00 0.00Wetted perimeter (ft) = 0.00 0.00 0.00Channel slope (%) = 0.00 0.00 0.00Manning's n-value = 0.015 0.015 0.015Velocity (ft/s) =0.00
0.000.00
Flow length (ft) ({0})0.0 0.0 0.0
Travel Time (min) = 0.00 + 0.00 + 0.00 = 0.00
Total Travel Time, Tc .............................................................................. 54.00 min

TR55 Tc Worksheet2
Hydraflow Hydrographs Extension for AutoCAD® Civil 3D® 2015 by Autodesk, Inc. v10.4
Hyd. No. 2
PRE (SOUTH)
Description A B C Totals
Sheet FlowManning's n-value = 0.240 0.011 0.011Flow length (ft) = 300.0 0.0 0.0Two-year 24-hr precip. (in) = 2.63 0.00 0.00Land slope (%) = 1.60 0.00 0.00
Travel Time (min) = 41.45 + 0.00 + 0.00 = 41.45
Shallow Concentrated FlowFlow length (ft) = 112.00 0.00 0.00Watercourse slope (%) = 0.12 0.00 0.00Surface description = Unpaved Paved PavedAverage velocity (ft/s) =0.56 0.00 0.00
Travel Time (min) = 3.34 + 0.00 + 0.00 = 3.34
Channel FlowX sectional flow area (sqft) = 0.00 0.00 0.00Wetted perimeter (ft) = 0.00 0.00 0.00Channel slope (%) = 0.00 0.00 0.00Manning's n-value = 0.015 0.015 0.015Velocity (ft/s) =0.00
0.000.00
Flow length (ft) ({0})0.0 0.0 0.0
Travel Time (min) = 0.00 + 0.00 + 0.00 = 0.00
Total Travel Time, Tc .............................................................................. 44.80 min

TR55 Tc Worksheet2
Hydraflow Hydrographs Extension for AutoCAD® Civil 3D® 2015 by Autodesk, Inc. v10.4
Hyd. No. 6
POST RUNOFF
Description A B C Totals
Sheet FlowManning's n-value = 0.240 0.240 0.011Flow length (ft) = 40.0 45.0 0.0Two-year 24-hr precip. (in) = 2.63 2.63 0.00Land slope (%) = 2.00 13.00 0.00
Travel Time (min) = 7.56 + 3.93 + 0.00 = 11.49
Shallow Concentrated FlowFlow length (ft) = 492.00 0.00 0.00Watercourse slope (%) = 0.20 0.00 0.00Surface description = Unpaved Paved PavedAverage velocity (ft/s) =0.72 0.00 0.00
Travel Time (min) = 11.36 + 0.00 + 0.00 = 11.36
Channel FlowX sectional flow area (sqft) = 0.00 0.00 0.00Wetted perimeter (ft) = 0.00 0.00 0.00Channel slope (%) = 0.00 0.00 0.00Manning's n-value = 0.015 0.015 0.015Velocity (ft/s) =0.00
0.000.00
Flow length (ft) ({0})0.0 0.0 0.0
Travel Time (min) = 0.00 + 0.00 + 0.00 = 0.00
Total Travel Time, Tc .............................................................................. 22.90 min

Hydraflow Rainfall Report18
Hydraflow Hydrographs Extension for AutoCAD® Civil 3D® 2015 by Autodesk, Inc. v10.4 Monday, 10 / 23 / 2017
Return Intensity-Duration-Frequency Equation Coefficients (FHA)Period
(Yrs) B D E (N/A)
1 0.0000 0.0000 0.0000 --------
2 69.8703 13.1000 0.8658 --------
3 0.0000 0.0000 0.0000 --------
5 79.2597 14.6000 0.8369 --------
10 88.2351 15.5000 0.8279 --------
25 102.6072 16.5000 0.8217 --------
50 114.8193 17.2000 0.8199 --------
100 127.1596 17.8000 0.8186 --------
File name: SampleFHA.idf
Intensity = B / (Tc + D)^E
Return Intensity Values (in/hr)Period
(Yrs) 5 min 10 15 20 25 30 35 40 45 50 55 60
1 0.00 0.00 0.00 0.00 0.00 0.00 0.00 0.00 0.00 0.00 0.00 0.00
2 5.69 4.61 3.89 3.38 2.99 2.69 2.44 2.24 2.07 1.93 1.81 1.70
3 0.00 0.00 0.00 0.00 0.00 0.00 0.00 0.00 0.00 0.00 0.00 0.00
5 6.57 5.43 4.65 4.08 3.65 3.30 3.02 2.79 2.59 2.42 2.27 2.15
10 7.24 6.04 5.21 4.59 4.12 3.74 3.43 3.17 2.95 2.77 2.60 2.46
25 8.25 6.95 6.03 5.34 4.80 4.38 4.02 3.73 3.48 3.26 3.07 2.91
50 9.04 7.65 6.66 5.92 5.34 4.87 4.49 4.16 3.88 3.65 3.44 3.25
100 9.83 8.36 7.30 6.50 5.87 5.36 4.94 4.59 4.29 4.03 3.80 3.60
Tc = time in minutes. Values may exceed 60.
Rainfall Precipitation Table (in)
Precip. file name: C:\Users\nharrington\Desktop\Bryden Rd\Storm\Columbus OH - Precipitation.pcp
StormDistribution 1-yr 2-yr 3-yr 5-yr 10-yr 25-yr 50-yr 100-yr
SCS 24-hour 2.20 2.63 0.00 3.24 3.74 4.44 5.02 5.63
SCS 6-Hr 0.00 0.00 0.00 0.00 0.00 0.00 0.00 0.00
Huff-1st 0.00 0.00 0.00 0.00 0.00 0.00 0.00 0.00
Huff-2nd 0.00 0.00 0.00 0.00 0.00 0.00 0.00 0.00
Huff-3rd 0.00 0.00 0.00 0.00 0.00 0.00 0.00 0.00
Huff-4th 0.00 0.00 0.00 0.00 0.00 0.00 0.00 0.00
Huff-Indy 0.00 0.00 0.00 0.00 0.00 0.00 0.00 0.00
Custom 0.00 0.00 0.00 0.00 0.00 0.00 0.00 0.00

APPENDIX C.2 POND REPORT

Pond Report 2
Hydraflow Hydrographs Extension for AutoCAD® Civil 3D® 2015 by Autodesk, Inc. v10.4 Monday, 10 / 23 / 2017
Pond No. 1 - Detention Pond
Pond Data
Contours -User-defined contour areas. Conic method used for volume calculation. Begining Elevation = 938.00 ft
Stage / Storage Table
Stage (ft) Elevation (ft) Contour area (sqft) Incr. Storage (cuft) Total storage (cuft)
0.00 938.00 1,426 0 01.00 939.00 2,012 1,710 1,7102.00 940.00 2,687 2,341 4,0523.00 941.00 3,651 3,156 7,2084.00 942.00 8,563 5,935 13,1435.00 943.00 11,022 9,766 22,9086.00 944.00 13,603 12,289 35,1977.00 945.00 16,575 15,063 50,2608.00 946.00 21,622 19,041 69,301
Culvert / Orifice Structures Weir Structures
[A] [B] [C] [PrfRsr] [A] [B] [C] [D]
Rise (in) = 12.00 0.50 12.00 0.00
Span (in) = 12.00 0.50 6.00 0.00
No. Barrels = 1 2 1 0
Invert El. (ft) = 942.00 942.01 944.00 0.00
Length (ft) = 300.00 1.00 1.00 0.00
Slope (%) = 0.25 0.25 1.00 n/a
N-Value = .013 .013 .013 n/a
Orifice Coeff. = 0.60 0.60 0.60 0.60
Multi-Stage = n/a Yes Yes No
Crest Len (ft) = 8.00 0.00 0.00 0.00
Crest El. (ft) = 945.25 0.00 0.00 0.00
Weir Coeff. = 3.33 3.33 3.33 3.33
Weir Type = Rect --- --- ---
Multi-Stage = Yes No No No
Exfil.(in/hr) = 0.000 (by Wet area)
TW Elev. (ft) = 0.00
Note: Culvert/Orifice outflows are analyzed under inlet (ic) and outlet (oc) control. Weir risers checked for orifice conditions (ic) and submergence (s).
Stage / Storage / Discharge Table
Stage Storage Elevation Clv A Clv B Clv C PrfRsr Wr A Wr B Wr C Wr D Exfil User Totalft cuft ft cfs cfs cfs cfs cfs cfs cfs cfs cfs cfs cfs
0.00 0 938.00 0.00 0.00 0.00 --- 0.00 --- --- --- --- --- 0.0000.10 171 938.10 0.00 0.00 0.00 --- 0.00 --- --- --- --- --- 0.0000.20 342 938.20 0.00 0.00 0.00 --- 0.00 --- --- --- --- --- 0.0000.30 513 938.30 0.00 0.00 0.00 --- 0.00 --- --- --- --- --- 0.0000.40 684 938.40 0.00 0.00 0.00 --- 0.00 --- --- --- --- --- 0.0000.50 855 938.50 0.00 0.00 0.00 --- 0.00 --- --- --- --- --- 0.0000.60 1,026 938.60 0.00 0.00 0.00 --- 0.00 --- --- --- --- --- 0.0000.70 1,197 938.70 0.00 0.00 0.00 --- 0.00 --- --- --- --- --- 0.0000.80 1,368 938.80 0.00 0.00 0.00 --- 0.00 --- --- --- --- --- 0.0000.90 1,539 938.90 0.00 0.00 0.00 --- 0.00 --- --- --- --- --- 0.0001.00 1,710 939.00 0.00 0.00 0.00 --- 0.00 --- --- --- --- --- 0.0001.10 1,945 939.10 0.00 0.00 0.00 --- 0.00 --- --- --- --- --- 0.0001.20 2,179 939.20 0.00 0.00 0.00 --- 0.00 --- --- --- --- --- 0.0001.30 2,413 939.30 0.00 0.00 0.00 --- 0.00 --- --- --- --- --- 0.0001.40 2,647 939.40 0.00 0.00 0.00 --- 0.00 --- --- --- --- --- 0.0001.50 2,881 939.50 0.00 0.00 0.00 --- 0.00 --- --- --- --- --- 0.0001.60 3,115 939.60 0.00 0.00 0.00 --- 0.00 --- --- --- --- --- 0.0001.70 3,349 939.70 0.00 0.00 0.00 --- 0.00 --- --- --- --- --- 0.0001.80 3,583 939.80 0.00 0.00 0.00 --- 0.00 --- --- --- --- --- 0.0001.90 3,817 939.90 0.00 0.00 0.00 --- 0.00 --- --- --- --- --- 0.0002.00 4,052 940.00 0.00 0.00 0.00 --- 0.00 --- --- --- --- --- 0.0002.10 4,367 940.10 0.00 0.00 0.00 --- 0.00 --- --- --- --- --- 0.0002.20 4,683 940.20 0.00 0.00 0.00 --- 0.00 --- --- --- --- --- 0.0002.30 4,999 940.30 0.00 0.00 0.00 --- 0.00 --- --- --- --- --- 0.0002.40 5,314 940.40 0.00 0.00 0.00 --- 0.00 --- --- --- --- --- 0.0002.50 5,630 940.50 0.00 0.00 0.00 --- 0.00 --- --- --- --- --- 0.0002.60 5,945 940.60 0.00 0.00 0.00 --- 0.00 --- --- --- --- --- 0.0002.70 6,261 940.70 0.00 0.00 0.00 --- 0.00 --- --- --- --- --- 0.0002.80 6,577 940.80 0.00 0.00 0.00 --- 0.00 --- --- --- --- --- 0.0002.90 6,892 940.90 0.00 0.00 0.00 --- 0.00 --- --- --- --- --- 0.0003.00 7,208 941.00 0.00 0.00 0.00 --- 0.00 --- --- --- --- --- 0.0003.10 7,801 941.10 0.00 0.00 0.00 --- 0.00 --- --- --- --- --- 0.0003.20 8,395 941.20 0.00 0.00 0.00 --- 0.00 --- --- --- --- --- 0.0003.30 8,988 941.30 0.00 0.00 0.00 --- 0.00 --- --- --- --- --- 0.000
Continues on next page...

3
Detention Pond
Stage / Storage / Discharge Table
Stage Storage Elevation Clv A Clv B Clv C PrfRsr Wr A Wr B Wr C Wr D Exfil User Totalft cuft ft cfs cfs cfs cfs cfs cfs cfs cfs cfs cfs cfs
3.40 9,582 941.40 0.00 0.00 0.00 --- 0.00 --- --- --- --- --- 0.0003.50 10,175 941.50 0.00 0.00 0.00 --- 0.00 --- --- --- --- --- 0.0003.60 10,769 941.60 0.00 0.00 0.00 --- 0.00 --- --- --- --- --- 0.0003.70 11,362 941.70 0.00 0.00 0.00 --- 0.00 --- --- --- --- --- 0.0003.80 11,956 941.80 0.00 0.00 0.00 --- 0.00 --- --- --- --- --- 0.0003.90 12,549 941.90 0.00 0.00 0.00 --- 0.00 --- --- --- --- --- 0.0004.00 13,143 942.00 0.00 0.00 0.00 --- 0.00 --- --- --- --- --- 0.0004.10 14,119 942.10 0.00 oc 0.00 ic 0.00 --- 0.00 --- --- --- --- --- 0.0034.20 15,096 942.20 0.01 oc 0.01 ic 0.00 --- 0.00 --- --- --- --- --- 0.0054.30 16,072 942.30 0.01 oc 0.01 ic 0.00 --- 0.00 --- --- --- --- --- 0.0074.40 17,049 942.40 0.01 oc 0.01 ic 0.00 --- 0.00 --- --- --- --- --- 0.0084.50 18,025 942.50 0.01 oc 0.01 ic 0.00 --- 0.00 --- --- --- --- --- 0.0094.60 19,002 942.60 0.01 oc 0.01 ic 0.00 --- 0.00 --- --- --- --- --- 0.0104.70 19,979 942.70 0.01 oc 0.01 ic 0.00 --- 0.00 --- --- --- --- --- 0.0114.80 20,955 942.80 0.01 oc 0.01 ic 0.00 --- 0.00 --- --- --- --- --- 0.0114.90 21,932 942.90 0.01 oc 0.01 ic 0.00 --- 0.00 --- --- --- --- --- 0.0125.00 22,908 943.00 0.01 oc 0.01 ic 0.00 --- 0.00 --- --- --- --- --- 0.0135.10 24,137 943.10 0.01 oc 0.01 ic 0.00 --- 0.00 --- --- --- --- --- 0.0135.20 25,366 943.20 0.02 oc 0.01 ic 0.00 --- 0.00 --- --- --- --- --- 0.0145.30 26,595 943.30 0.02 oc 0.01 ic 0.00 --- 0.00 --- --- --- --- --- 0.0155.40 27,824 943.40 0.02 oc 0.02 ic 0.00 --- 0.00 --- --- --- --- --- 0.0155.50 29,053 943.50 0.02 oc 0.02 ic 0.00 --- 0.00 --- --- --- --- --- 0.0165.60 30,281 943.60 0.02 oc 0.02 ic 0.00 --- 0.00 --- --- --- --- --- 0.0165.70 31,510 943.70 0.02 oc 0.02 ic 0.00 --- 0.00 --- --- --- --- --- 0.0175.80 32,739 943.80 0.02 oc 0.02 ic 0.00 --- 0.00 --- --- --- --- --- 0.0175.90 33,968 943.90 0.02 oc 0.02 ic 0.00 --- 0.00 --- --- --- --- --- 0.0186.00 35,197 944.00 0.02 oc 0.02 ic 0.00 --- 0.00 --- --- --- --- --- 0.0186.10 36,703 944.10 0.08 oc 0.02 ic 0.05 ic --- 0.00 --- --- --- --- --- 0.0726.20 38,209 944.20 0.17 oc 0.02 ic 0.15 ic --- 0.00 --- --- --- --- --- 0.1716.30 39,716 944.30 0.31 oc 0.02 ic 0.28 ic --- 0.00 --- --- --- --- --- 0.2986.40 41,222 944.40 0.45 oc 0.02 ic 0.43 ic --- 0.00 --- --- --- --- --- 0.4496.50 42,728 944.50 0.62 oc 0.02 ic 0.60 ic --- 0.00 --- --- --- --- --- 0.6216.60 44,235 944.60 0.83 oc 0.02 ic 0.79 ic --- 0.00 --- --- --- --- --- 0.8106.70 45,741 944.70 1.02 oc 0.02 ic 1.00 ic --- 0.00 --- --- --- --- --- 1.0166.80 47,247 944.80 1.25 oc 0.02 ic 1.22 ic --- 0.00 --- --- --- --- --- 1.2376.90 48,754 944.90 1.48 oc 0.02 ic 1.45 ic --- 0.00 --- --- --- --- --- 1.4727.00 50,260 945.00 1.72 oc 0.02 ic 1.70 ic --- 0.00 --- --- --- --- --- 1.7217.10 52,164 945.10 1.88 oc 0.02 ic 1.86 ic --- 0.00 --- --- --- --- --- 1.8837.20 54,068 945.20 2.03 oc 0.02 ic 2.01 ic --- 0.00 --- --- --- --- --- 2.0327.30 55,972 945.30 2.47 oc 0.02 ic 2.15 ic --- 0.30 --- --- --- --- --- 2.4667.40 57,876 945.40 3.16 oc 0.01 ic 1.60 ic --- 1.55 --- --- --- --- --- 3.1567.50 59,780 945.50 3.40 oc 0.00 ic 0.77 ic --- 2.63 s --- --- --- --- --- 3.4037.60 61,684 945.60 3.49 oc 0.00 ic 0.53 ic --- 2.95 s --- --- --- --- --- 3.4847.70 63,588 945.70 3.55 oc 0.00 ic 0.39 ic --- 3.15 s --- --- --- --- --- 3.5477.80 65,493 945.80 3.61 oc 0.00 ic 0.31 ic --- 3.29 s --- --- --- --- --- 3.6057.90 67,397 945.90 3.66 oc 0.00 ic 0.25 ic --- 3.39 s --- --- --- --- --- 3.6488.00 69,301 946.00 3.71 oc 0.00 ic 0.21 ic --- 3.48 s --- --- --- --- --- 3.693
...End

APPENDIX D STORM SEWER CALCULATIONS
Project: Urban Air Date:
Job No.: 20170111 Revised:
Contact: Nathan Harrington Revised:
(V): 614-556-4272 Ext. 5011 Revised:
Pre-DevelopedRunoff
Coefficient C * A
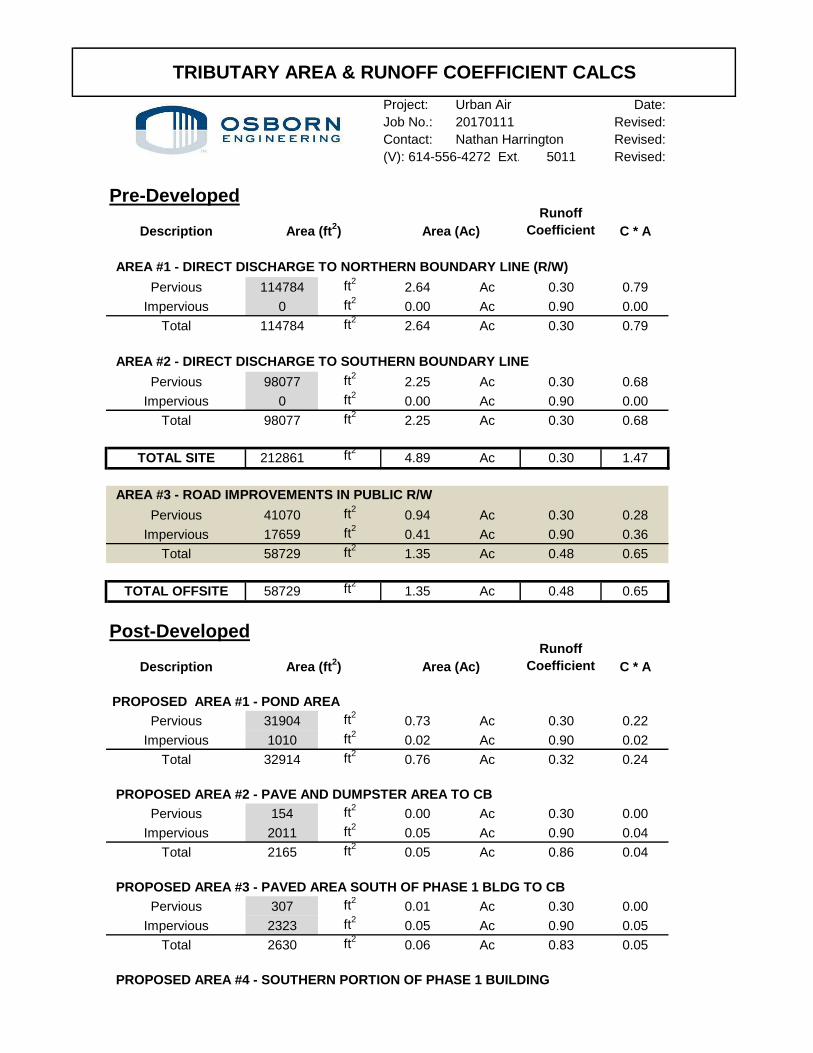
AREA #1 - DIRECT DISCHARGE TO NORTHERN BOUNDARY LINE (R/W)
114784 ft2
2.64 Ac 0.30 0.79
0 ft2
0.00 Ac 0.90 0.00
114784 ft2
2.64 Ac 0.30 0.79
AREA #2 - DIRECT DISCHARGE TO SOUTHERN BOUNDARY LINE
98077 ft2
2.25 Ac 0.30 0.68
0 ft2
0.00 Ac 0.90 0.00
98077 ft2
2.25 Ac 0.30 0.68
212861 ft2
4.89 Ac 0.30 1.47
AREA #3 - ROAD IMPROVEMENTS IN PUBLIC R/W
41070 ft2
0.94 Ac 0.30 0.28
17659 ft2
0.41 Ac 0.90 0.36
58729 ft2
1.35 Ac 0.48 0.65
58729 ft2
1.35 Ac 0.48 0.65
Post-DevelopedRunoff
Coefficient C * A
PROPOSED AREA #1 - POND AREA
31904 ft2
0.73 Ac 0.30 0.22
1010 ft2
0.02 Ac 0.90 0.02
32914 ft2
0.76 Ac 0.32 0.24
PROPOSED AREA #2 - PAVE AND DUMPSTER AREA TO CB
154 ft2
0.00 Ac 0.30 0.00
2011 ft2
0.05 Ac 0.90 0.04
2165 ft2
0.05 Ac 0.86 0.04
PROPOSED AREA #3 - PAVED AREA SOUTH OF PHASE 1 BLDG TO CB
307 ft2
0.01 Ac 0.30 0.00
2323 ft2
0.05 Ac 0.90 0.05
2630 ft2
0.06 Ac 0.83 0.05
PROPOSED AREA #4 - SOUTHERN PORTION OF PHASE 1 BUILDING
TOTAL SITE
TRIBUTARY AREA & RUNOFF COEFFICIENT CALCS
TOTAL OFFSITE
Description
Pervious
Impervious
Total
Pervious
Impervious
Total
Pervious
Impervious
Total
Area (ft2) Area (Ac)
Total
Area (ft2) Area (Ac)
Pervious
Impervious
Total
Description
Pervious
Total
Impervious
Pervious
Impervious

Project: Urban Air Date:
Job No.: 20170111 Revised:
Contact: Nathan Harrington Revised:
(V): 614-556-4272 Ext. 5011 Revised:
TRIBUTARY AREA & RUNOFF COEFFICIENT CALCS
0 ft2
0.00 Ac 0.30 0.00
10000 ft2
0.23 Ac 0.90 0.21
10000 ft2
0.23 Ac 0.90 0.21
PROPOSED AREA #5 - PAVED AREA SE OF PHASE 1 BLDG TO CB
182 ft2
0.00 Ac 0.30 0.00
2095 ft2
0.05 Ac 0.90 0.04
2277 ft2
0.05 Ac 0.85 0.04
PROPOSED AREA #6 - PARKING AREA EAST OF PHASE 1 BLDG TO CB
1066 ft2
0.02 Ac 0.30 0.01
13801 ft2
0.32 Ac 0.90 0.29
14867 ft2
0.34 Ac 0.86 0.29
PROPOSED AREA #7 - PARKING AREA NE OF PHASE 1 BLDG TO CB
669 ft2
0.02 Ac 0.30 0.00
4260 ft2
0.10 Ac 0.90 0.09
4929 ft2
0.11 Ac 0.82 0.09
PROPOSED AREA #8 - PARKING AREA NORTH OF PHASE 1 BLDG TO CB
2857 ft2
0.07 Ac 0.30 0.02
14404 ft2
0.33 Ac 0.90 0.30
17261 ft2
0.40 Ac 0.80 0.32
PROPOSED AREA #9 - NORTH PORTION OF PHASE 1 BUILDING
0 ft2
0.00 Ac 0.30 0.00
10000 ft2
0.23 Ac 0.90 0.21
10000 ft2
0.23 Ac 0.90 0.21
PROPOSED AREA #10 - COURT YARD AREA BETWEEN BLDG
2085 ft2
0.05 Ac 0.30 0.01
2930 ft2
0.07 Ac 0.90 0.06
5015 ft2
0.12 Ac 0.65 0.07
PROPOSED AREA #11 - PARKING AREA NORTH OF PHASE 2 BLDG TO CB
1502 ft2
0.03 Ac 0.30 0.01
17076 ft2
0.39 Ac 0.90 0.35
18578 ft2
0.43 Ac 0.85 0.36
PROPOSED AREA #12 - NORTH PORTION OF PHASE 2 BUILDING
0 ft2
0.00 Ac 0.30 0.00
10000 ft2
0.23 Ac 0.90 0.21
10000 ft2
0.23 Ac 0.90 0.21
PROPOSED AREA #13 - PARKING AREA NW OF PHASE 2 BLDG TO CB
Impervious
Total
Pervious
Pervious
Pervious
Pervious
Impervious
Total
Impervious
Total
Pervious
Impervious
Total
Pervious
Impervious
Total
Impervious
Total
Pervious
Impervious
Total
Pervious
Impervious
Total
Pervious
Impervious
Total

Project: Urban Air Date:
Job No.: 20170111 Revised:
Contact: Nathan Harrington Revised:
(V): 614-556-4272 Ext. 5011 Revised:
TRIBUTARY AREA & RUNOFF COEFFICIENT CALCS
1028 ft2
0.02 Ac 0.30 0.01
9891 ft2
0.23 Ac 0.90 0.20
10919 ft2
0.25 Ac 0.84 0.21
PROPOSED AREA #14 - PARKING AREA NE CORNER TO PHASE 1 BLDG
289 ft2
0.01 Ac 0.30 0.00
3152 ft2
0.07 Ac 0.90 0.07
3441 ft2
0.08 Ac 0.85 0.07
PROPOSED AREA #15 - SOUTH PORTION OF PHASE 2 BUILDING
0 ft2
0.00 Ac 0.30 0.00
10000 ft2
0.23 Ac 0.90 0.21
10000 ft2
0.23 Ac 0.90 0.21
PROPOSED AREA #16 - LANDSCAPE AREA TO YARD DRAIN NORTH OF PHASE 1 BLDG
7830 ft2
0.18 Ac 0.30 0.05
0 ft2
0.00 Ac 0.90 0.00
7830 ft2
0.18 Ac 0.30 0.05
PROPOSED AREA #17 - LANDSCAPE AREA TO YARD DRAIN NORTH OF PHASE 2 BLDG
9969 ft2
0.23 Ac 0.30 0.07
0 ft2
0.00 Ac 0.90 0.00
9969 ft2
0.23 Ac 0.30 0.07
PROPOSED AREA #18 - DIRECT RUNOFF
38860 ft2
0.89 Ac 0.30 0.27
1206 ft2
0.03 Ac 0.90 0.02
40066 ft2
0.92 Ac 0.32 0.29
212861 ft2
4.89 Ac 0.62 3.04
PROPOSED AREA #19 - ROAD IMPROVEMENTS IN PUBLIC R/W
25363 ft2
0.58 Ac 0.30 0.17
33366 ft2
0.77 Ac 0.90 0.69
58729 ft2
1.35 Ac 0.64 0.86
58729 ft2
1.35 Ac 0.64 0.86
Total
Impervious
Pervious
TOTAL SITE
Total
TOTAL OFFSITE
Impervious
Pervious
Pervious
Impervious
Total
Impervious
Total
Pervious
Impervious
Total
Pervious
Impervious
Total
Pervious
Impervious
Total
Pervious

Page: 1/1
Storm Design - PIPES.xls
Project: Urban Air Date: 10/23/17
Job No.: 20170111 Revised:
Contact: Nathan Harrington Revised:
(V): 614-556-4272 Ext. 5011 Revised:
5 Yr Design Storm n = 0.012
Stu
ctu
re
Nu
mb
er
Typ
e
Sta
tio
n
Tri
bu
tary
Are
a
Cu
mu
lative
Are
a
Ru
no
ff
Co
eff
icie
nt
Cu
mu
lative
C *
A
D T
ime
(min
)
S T
ime
(min
)
Inte
nsity
(in
/hr)
De
sig
n Q
(cfs
)
Le
ng
th
(ft)
Dia
me
ter
(in
)
Slo
pe
(%)
Ve
locity
(fp
s)
Ca
pa
city
(cfs
)
Sta
tus
Do
wn
str
ea
m
Inve
rt
Up
str
ea
m
Inve
rt
To
p o
f
Ca
stin
g
14 CB 0.25 0.25 0.84 10.00 10.00 4.21 0.89 947.50
0.00 0.00 0.21 N/A 182.00 12 0.400% 3.11 2.44 OK 944.73 944.73
13 CB** 0.88 1.14 0.68 0.98 10.98 4.09 3.34 944.00 944.00 947.50
0.82 N/A 123.00 18 0.250% 3.22 5.69 OK
12 MH* 0.12 1.25 0.65 0.64 11.61 4.00 3.57 943.69 1.00 948.15
0.00 0.89 N/A 110.00 18 0.250% 3.22 5.69 OK
11 CB* 0.63 1.88 0.85 0.57 12.18 3.94 5.61 943.69 943.42 947.16
0.00 1.42 N/A 162.00 18 0.250% 3.22 5.69 OK
10 CB** 0.37 2.25 0.66 0.84 13.02 3.84 6.40 943.69 943.69 947.25
0.00 1.67 N/A 165.00 24 0.250% 3.90 12.26 OK
8 CB* 0.39 2.64 0.85 0.70 13.72 3.76 7.54 942.60 942.60 947.00
0.00 2.00 N/A 130.00 24 0.250% 3.90 12.26 OK
6 CB** 0.29 2.93 0.90 0.56 14.28 3.71 8.40 942.28 942.28 948.00
0.00 2.26 N/A 27.00 24 0.250% 3.90 12.26 OK
5 HW 0.00 2.93 0.00 0.12 14.39 3.70 8.38 942.00
0.00 2.26 N/A
3.62
1.67
1.9
2.86
STORM SEWER DESIGN SHEET
Cover (feet)
City of Columbus, OH
Structure Data Drainage Area Calculations Time of Conc. Flow Data Pipe Data Pipe / Structure Data
1.87
1.46
2.3

APPENDIX E WATER QUALITY CALCULATIONS
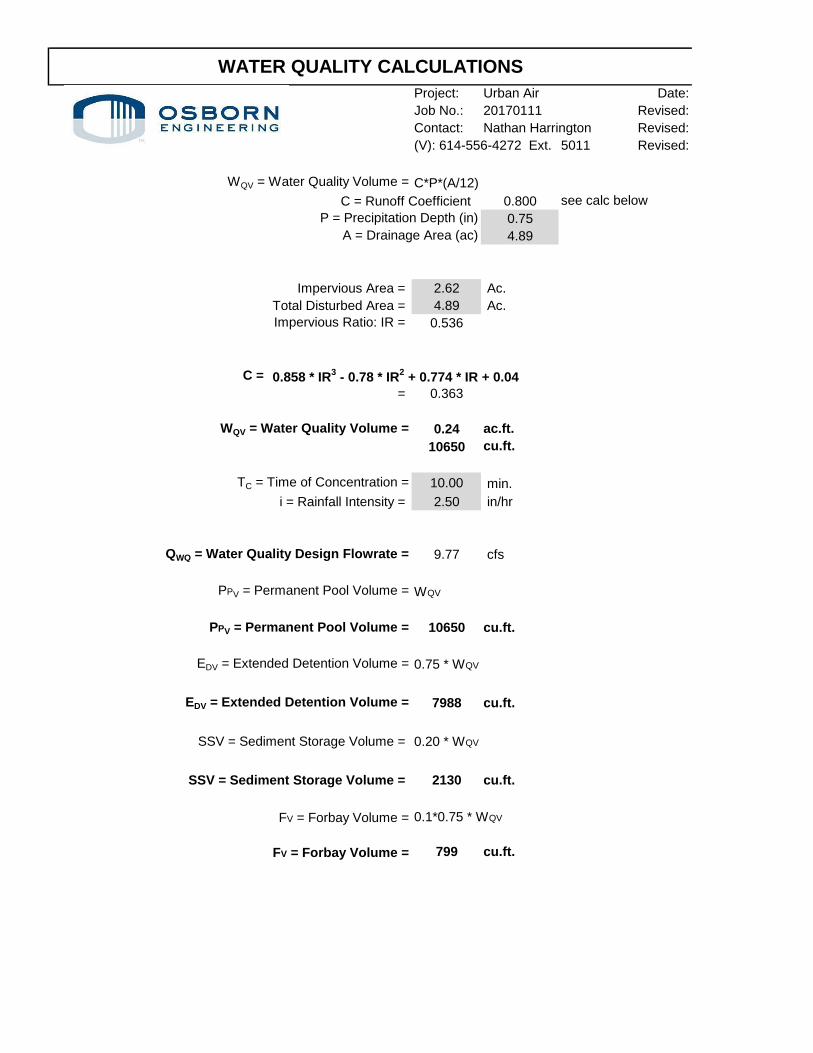
Project: Urban Air Date:
Job No.: 20170111 Revised:
Contact: Nathan Harrington Revised:
(V): 614-556-4272 Ext. 5011 Revised:
WQV = Water Quality Volume =
C = Runoff Coefficient 0.800 see calc below
P = Precipitation Depth (in) 0.75
A = Drainage Area (ac) 4.89
Impervious Area = 2.62 Ac.
Total Disturbed Area = 4.89 Ac.
Impervious Ratio: IR = 0.536
C = 0.858 * IR3 - 0.78 * IR
2 + 0.774 * IR + 0.04
= 0.363
WQV = Water Quality Volume = 0.24 ac.ft.
10650 cu.ft.
TC = Time of Concentration = 10.00 min.
i = Rainfall Intensity = 2.50 in/hr
QWQ = Water Quality Design Flowrate = 9.77 cfs
PPV = Permanent Pool Volume =
PPV = Permanent Pool Volume = 10650 cu.ft.
EDV = Extended Detention Volume =
EDV = Extended Detention Volume = 7988 cu.ft.
SSV = Sediment Storage Volume =
SSV = Sediment Storage Volume = 2130 cu.ft.
FV = Forbay Volume =
FV = Forbay Volume = 799 cu.ft.
0.75 * WQV
0.20 * WQV
0.1*0.75 * WQV
WQV
C*P*(A/12)
WATER QUALITY CALCULATIONS

Drawdown Time Calculation
0.12 cfs
A= 0.005 sqft 0.5
C= 0.66 (Per city of Columbus Stormwater Manual, Section 3.3.2)
H= 1 ft
0.03 cfs
Number of Perforations Required = 4
Number of Perforations Proposed = 2
Hole size (in) =
Q (provided) =
Q (required) =
Q = A*C*(64.4*H)^1/2
Q = Orfice Discharge Rate (cfs)
A = Area of the Orifice (sqft)
C = Orifice Coefficient
H = Head, measured from the centerline of orifice, (ft)
Drawdown Time = 24 Hrs

APPENDIX F SITE SOILS

Soil Map—Franklin County, Ohio
Natural ResourcesConservation Service
Web Soil SurveyNational Cooperative Soil Survey
8/9/2017Page 1 of 3
4441
770
4441
800
4441
830
4441
860
4441
890
4441
920
4441
950
4441
770
4441
800
4441
830
4441
860
4441
890
4441
920
312810 312840 312870 312900 312930 312960 312990 313020 313050 313080
312810 312840 312870 312900 312930 312960 312990 313020 313050 313080
40° 6' 25'' N83
° 1
1' 4
7'' W
40° 6' 25'' N
83° 1
1' 3
4'' W
40° 6' 19'' N
83° 1
1' 4
7'' W
40° 6' 19'' N
83° 1
1' 3
4'' W
N
Map projection: Web Mercator Corner coordinates: WGS84 Edge tics: UTM Zone 17N WGS840 50 100 200 300
Feet0 15 30 60 90
MetersMap Scale: 1:1,330 if printed on A landscape (11" x 8.5") sheet.
Soil Map may not be valid at this scale.

MAP LEGEND MAP INFORMATION
Area of Interest (AOI)Area of Interest (AOI)
SoilsSoil Map Unit Polygons
Soil Map Unit Lines
Soil Map Unit Points
Special Point FeaturesBlowout
Borrow Pit
Clay Spot
Closed Depression
Gravel Pit
Gravelly Spot
Landfill
Lava Flow
Marsh or swamp
Mine or Quarry
Miscellaneous Water
Perennial Water
Rock Outcrop
Saline Spot
Sandy Spot
Severely Eroded Spot
Sinkhole
Slide or Slip
Sodic Spot
Spoil Area
Stony Spot
Very Stony Spot
Wet Spot
Other
Special Line Features
Water FeaturesStreams and Canals
TransportationRails
Interstate Highways
US Routes
Major Roads
Local Roads
BackgroundAerial Photography
The soil surveys that comprise your AOI were mapped at1:15,800.
Warning: Soil Map may not be valid at this scale.
Enlargement of maps beyond the scale of mapping can causemisunderstanding of the detail of mapping and accuracy of soilline placement. The maps do not show the small areas ofcontrasting soils that could have been shown at a more detailedscale.
Please rely on the bar scale on each map sheet for mapmeasurements.
Source of Map: Natural Resources Conservation ServiceWeb Soil Survey URL:Coordinate System: Web Mercator (EPSG:3857)
Maps from the Web Soil Survey are based on the Web Mercatorprojection, which preserves direction and shape but distortsdistance and area. A projection that preserves area, such as theAlbers equal-area conic projection, should be used if moreaccurate calculations of distance or area are required.
This product is generated from the USDA-NRCS certified data asof the version date(s) listed below.
Soil Survey Area: Franklin County, OhioSurvey Area Data: Version 14, Sep 22, 2016
Soil map units are labeled (as space allows) for map scales1:50,000 or larger.
Date(s) aerial images were photographed: Nov 12, 2009—Dec26, 2016
The orthophoto or other base map on which the soil lines werecompiled and digitized probably differs from the backgroundimagery displayed on these maps. As a result, some minorshifting of map unit boundaries may be evident.
Soil Map—Franklin County, Ohio
Natural ResourcesConservation Service
Web Soil SurveyNational Cooperative Soil Survey
8/9/2017Page 2 of 3

Map Unit Legend
Franklin County, Ohio (OH049)
Map Unit Symbol Map Unit Name Acres in AOI Percent of AOI
CrA Crosby silt loam, SouthernOhio Till Plain, 0 to 2 percentslopes
2.5 38.5%
Ko Kokomo silty clay loam, 0 to 2percent slopes
2.5 38.4%
LeB Lewisburg-Crosby complex, 2to 6 percent slopes
1.5 23.0%
Totals for Area of Interest 6.4 100.0%
Soil Map—Franklin County, Ohio
Natural ResourcesConservation Service
Web Soil SurveyNational Cooperative Soil Survey
8/9/2017Page 3 of 3

Franklin County, Ohio
CrA—Crosby silt loam, Southern Ohio Till Plain, 0 to 2 percent slopes
Map Unit SettingNational map unit symbol: 2thy7Elevation: 520 to 1,550 feetMean annual precipitation: 36 to 44 inchesMean annual air temperature: 48 to 54 degrees FFrost-free period: 145 to 180 daysFarmland classification: Prime farmland if drained
Map Unit CompositionCrosby and similar soils: 90 percentMinor components: 10 percentEstimates are based on observations, descriptions, and transects of
the mapunit.
Description of Crosby
SettingLandform: Ground moraines, recessionial moraines, water-lain
morainesLandform position (two-dimensional): Summit, backslope,
footslopeLandform position (three-dimensional): Interfluve, riseDown-slope shape: ConvexAcross-slope shape: LinearParent material: Silty material or loess over loamy till
Typical profileAp - 0 to 8 inches: silt loamBE - 8 to 11 inches: silt loamBt1 - 11 to 14 inches: silt loam2Bt2 - 14 to 28 inches: silty clay loam2BCt - 28 to 36 inches: loam2Cd - 36 to 79 inches: loam
Properties and qualitiesSlope: 0 to 2 percentDepth to restrictive feature: 24 to 40 inches to densic materialNatural drainage class: Somewhat poorly drainedRunoff class: MediumCapacity of the most limiting layer to transmit water (Ksat): Low to
moderately high (0.01 to 0.20 in/hr)Depth to water table: About 6 to 24 inchesFrequency of flooding: NoneFrequency of ponding: NoneCalcium carbonate, maximum in profile: 50 percentSalinity, maximum in profile: Nonsaline to very slightly saline (0.0
to 2.0 mmhos/cm)
Map Unit Description: Crosby silt loam, Southern Ohio Till Plain, 0 to 2 percent slopes---Franklin County, Ohio
Natural ResourcesConservation Service
Web Soil SurveyNational Cooperative Soil Survey
10/4/2017Page 1 of 2

Available water storage in profile: Low (about 5.7 inches)
Interpretive groupsLand capability classification (irrigated): None specifiedLand capability classification (nonirrigated): 2wHydrologic Soil Group: C/DHydric soil rating: No
Minor Components
Kokomo, drainedPercent of map unit: 5 percentLandform: Depressions, swales, water-lain morainesLandform position (two-dimensional): Toeslope, footslopeLandform position (three-dimensional): Base slope, dipDown-slope shape: LinearAcross-slope shape: ConcaveHydric soil rating: Yes
Celina, erodedPercent of map unit: 4 percentLandform: Ground moraines, recessionial moraines, water-lain
morainesLandform position (two-dimensional): Summit, shoulder, backslopeLandform position (three-dimensional): Crest, head slope, nose
slope, side slope, riseDown-slope shape: Convex, linearAcross-slope shape: Linear, convexHydric soil rating: No
Miamian, erodedPercent of map unit: 1 percentLandform: Ground moraines, recessionial moraines, water-lain
morainesLandform position (two-dimensional): Summit, shoulder, backslopeLandform position (three-dimensional): Crest, head slope, nose
slope, side slope, riseDown-slope shape: Convex, linearAcross-slope shape: Linear, convexHydric soil rating: No
Data Source Information
Soil Survey Area: Franklin County, OhioSurvey Area Data: Version 14, Sep 22, 2016
Map Unit Description: Crosby silt loam, Southern Ohio Till Plain, 0 to 2 percent slopes---Franklin County, Ohio
Natural ResourcesConservation Service
Web Soil SurveyNational Cooperative Soil Survey
10/4/2017Page 2 of 2
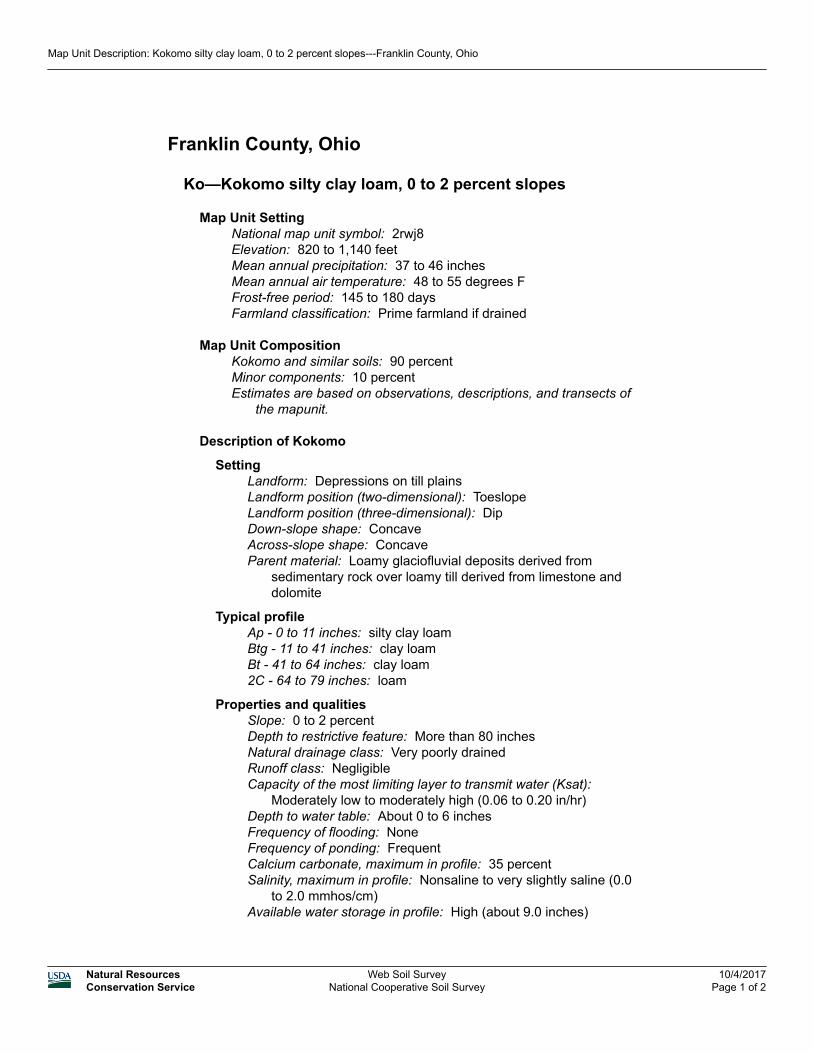
Franklin County, Ohio
Ko—Kokomo silty clay loam, 0 to 2 percent slopes
Map Unit SettingNational map unit symbol: 2rwj8Elevation: 820 to 1,140 feetMean annual precipitation: 37 to 46 inchesMean annual air temperature: 48 to 55 degrees FFrost-free period: 145 to 180 daysFarmland classification: Prime farmland if drained
Map Unit CompositionKokomo and similar soils: 90 percentMinor components: 10 percentEstimates are based on observations, descriptions, and transects of
the mapunit.
Description of Kokomo
SettingLandform: Depressions on till plainsLandform position (two-dimensional): ToeslopeLandform position (three-dimensional): DipDown-slope shape: ConcaveAcross-slope shape: ConcaveParent material: Loamy glaciofluvial deposits derived from
sedimentary rock over loamy till derived from limestone and dolomite
Typical profileAp - 0 to 11 inches: silty clay loamBtg - 11 to 41 inches: clay loamBt - 41 to 64 inches: clay loam2C - 64 to 79 inches: loam
Properties and qualitiesSlope: 0 to 2 percentDepth to restrictive feature: More than 80 inchesNatural drainage class: Very poorly drainedRunoff class: NegligibleCapacity of the most limiting layer to transmit water (Ksat):
Moderately low to moderately high (0.06 to 0.20 in/hr)Depth to water table: About 0 to 6 inchesFrequency of flooding: NoneFrequency of ponding: FrequentCalcium carbonate, maximum in profile: 35 percentSalinity, maximum in profile: Nonsaline to very slightly saline (0.0
to 2.0 mmhos/cm)Available water storage in profile: High (about 9.0 inches)
Map Unit Description: Kokomo silty clay loam, 0 to 2 percent slopes---Franklin County, Ohio
Natural ResourcesConservation Service
Web Soil SurveyNational Cooperative Soil Survey
10/4/2017Page 1 of 2

Interpretive groupsLand capability classification (irrigated): None specifiedLand capability classification (nonirrigated): 2wHydrologic Soil Group: C/DHydric soil rating: Yes
Minor Components
CrosbyPercent of map unit: 5 percentLandform: Till plainsLandform position (two-dimensional): FootslopeLandform position (three-dimensional): InterfluveDown-slope shape: LinearAcross-slope shape: LinearHydric soil rating: No
CelinaPercent of map unit: 5 percentLandform: Till plainsLandform position (two-dimensional): SummitLandform position (three-dimensional): RiseDown-slope shape: ConvexAcross-slope shape: ConvexHydric soil rating: No
Data Source Information
Soil Survey Area: Franklin County, OhioSurvey Area Data: Version 14, Sep 22, 2016
Map Unit Description: Kokomo silty clay loam, 0 to 2 percent slopes---Franklin County, Ohio
Natural ResourcesConservation Service
Web Soil SurveyNational Cooperative Soil Survey
10/4/2017Page 2 of 2

Franklin County, Ohio
LeB—Lewisburg-Crosby complex, 2 to 6 percent slopes
Map Unit SettingNational map unit symbol: 5mqhElevation: 600 to 1,200 feetMean annual precipitation: 33 to 45 inchesMean annual air temperature: 50 to 55 degrees FFrost-free period: 140 to 195 daysFarmland classification: All areas are prime farmland
Map Unit CompositionLewisburg and similar soils: 45 percentCrosby and similar soils: 40 percentMinor components: 15 percentEstimates are based on observations, descriptions, and transects of
the mapunit.
Description of Lewisburg
SettingLandform: Till plainsLandform position (two-dimensional): SummitLandform position (three-dimensional): InterfluveDown-slope shape: ConvexAcross-slope shape: LinearParent material: Loamy till
Typical profileH1 - 0 to 6 inches: silt loamH2 - 6 to 16 inches: silty clay loamH3 - 16 to 70 inches: loam
Properties and qualitiesSlope: 2 to 6 percentDepth to restrictive feature: More than 80 inchesNatural drainage class: Moderately well drainedRunoff class: HighCapacity of the most limiting layer to transmit water (Ksat):
Moderately low to moderately high (0.06 to 0.20 in/hr)Depth to water table: About 24 to 48 inchesFrequency of flooding: NoneFrequency of ponding: NoneCalcium carbonate, maximum in profile: 47 percentAvailable water storage in profile: Moderate (about 7.0 inches)
Interpretive groupsLand capability classification (irrigated): None specifiedLand capability classification (nonirrigated): 2eHydrologic Soil Group: DHydric soil rating: No
Map Unit Description: Lewisburg-Crosby complex, 2 to 6 percent slopes---Franklin County, Ohio
Natural ResourcesConservation Service
Web Soil SurveyNational Cooperative Soil Survey
10/4/2017Page 1 of 2
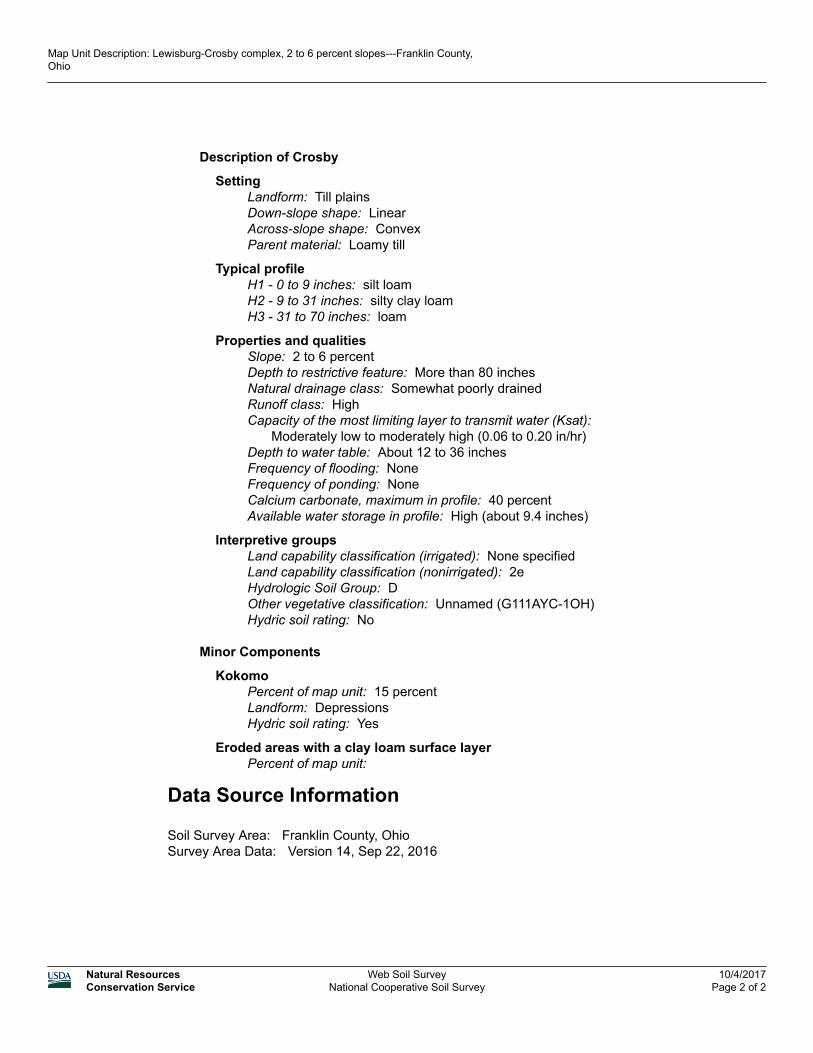
Description of Crosby
SettingLandform: Till plainsDown-slope shape: LinearAcross-slope shape: ConvexParent material: Loamy till
Typical profileH1 - 0 to 9 inches: silt loamH2 - 9 to 31 inches: silty clay loamH3 - 31 to 70 inches: loam
Properties and qualitiesSlope: 2 to 6 percentDepth to restrictive feature: More than 80 inchesNatural drainage class: Somewhat poorly drainedRunoff class: HighCapacity of the most limiting layer to transmit water (Ksat):
Moderately low to moderately high (0.06 to 0.20 in/hr)Depth to water table: About 12 to 36 inchesFrequency of flooding: NoneFrequency of ponding: NoneCalcium carbonate, maximum in profile: 40 percentAvailable water storage in profile: High (about 9.4 inches)
Interpretive groupsLand capability classification (irrigated): None specifiedLand capability classification (nonirrigated): 2eHydrologic Soil Group: DOther vegetative classification: Unnamed (G111AYC-1OH)Hydric soil rating: No
Minor Components
KokomoPercent of map unit: 15 percentLandform: DepressionsHydric soil rating: Yes
Eroded areas with a clay loam surface layerPercent of map unit:
Data Source Information
Soil Survey Area: Franklin County, OhioSurvey Area Data: Version 14, Sep 22, 2016
Map Unit Description: Lewisburg-Crosby complex, 2 to 6 percent slopes---Franklin County, Ohio
Natural ResourcesConservation Service
Web Soil SurveyNational Cooperative Soil Survey
10/4/2017Page 2 of 2