STORMTOOLS* -Simplified Flood Inundation Maps for RI with Sea Level Rise (SLR)
24
Malcolm L. Spaulding 1 Chris Damon 2 1 Professor Emeritus, Ocean Engineering 2 Environmental Data Center University of RI Narragansett, RI December 9, 2014 *http://www.beachsamp.org/research/stormtools/
-
Upload
riseagrant -
Category
Education
-
view
110 -
download
3
Transcript of STORMTOOLS* -Simplified Flood Inundation Maps for RI with Sea Level Rise (SLR)

Malcolm L. Spaulding1Chris Damon2
1Professor Emeritus, Ocean Engineering2Environmental Data Center
University of RINarragansett, RI
December 9, 2014*http://www.beachsamp.org/research/stormtools/

Outline STORMTOOLS Vision Tools under development
‐ Simplified Method for Coastal Flooding for RI with SLR
‐ Develop Flood Insurance Rate Maps (FIRMS) for Washington County, using high resolution hydrodynamic and wave models (in progress)‐Hydrological model of Pawtuxet River Basin for real time operation, linked coastal and riverineflooding (planned)
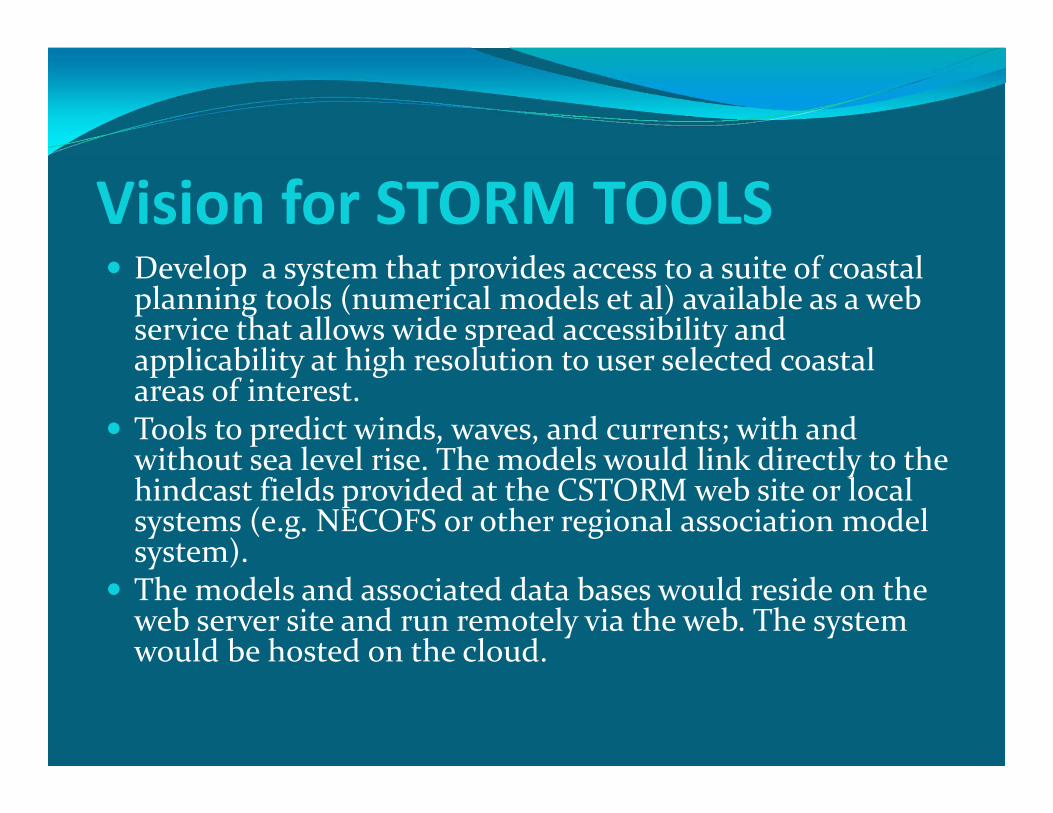
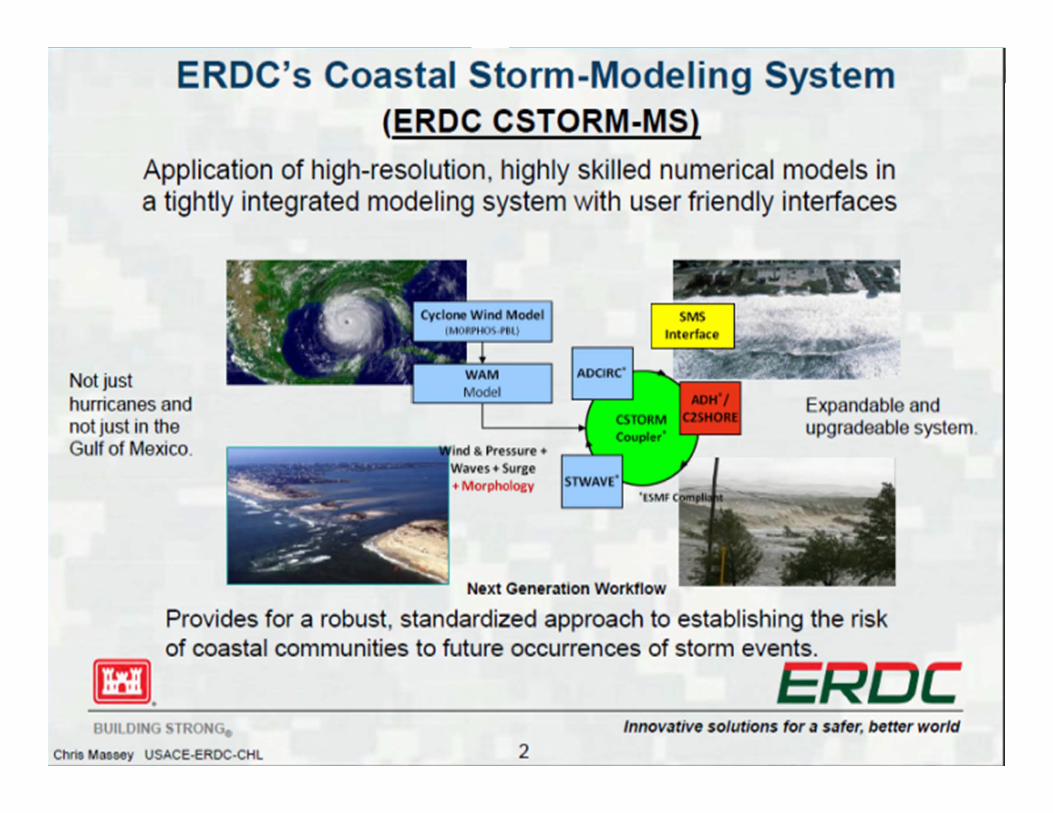
Vision for STORM TOOLS Develop a system that provides access to a suite of coastal planning tools (numerical models et al) available as a web service that allows wide spread accessibility and applicability at high resolution to user selected coastal areas of interest.
Tools to predict winds, waves, and currents; with and without sea level rise. The models would link directly to the hindcast fields provided at the CSTORM web site or local systems (e.g. NECOFS or other regional association model system).
The models and associated data bases would reside on the web server site and run remotely via the web. The system would be hosted on the cloud.
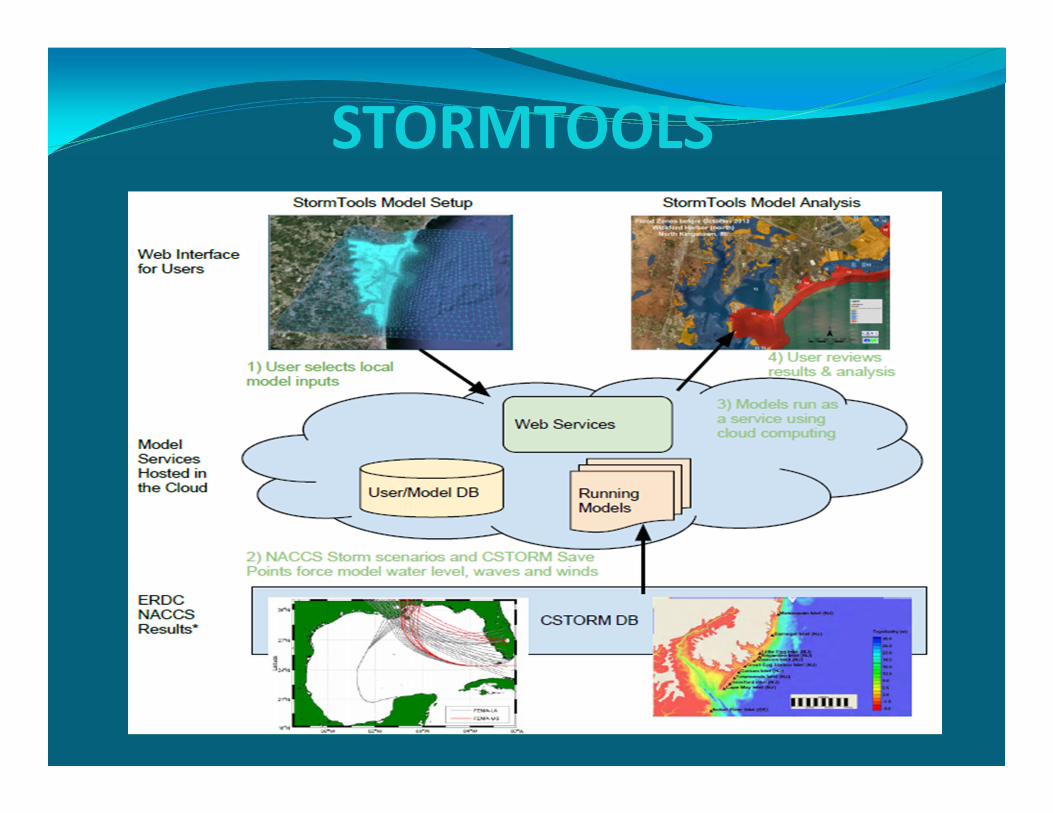
STORMTOOLS

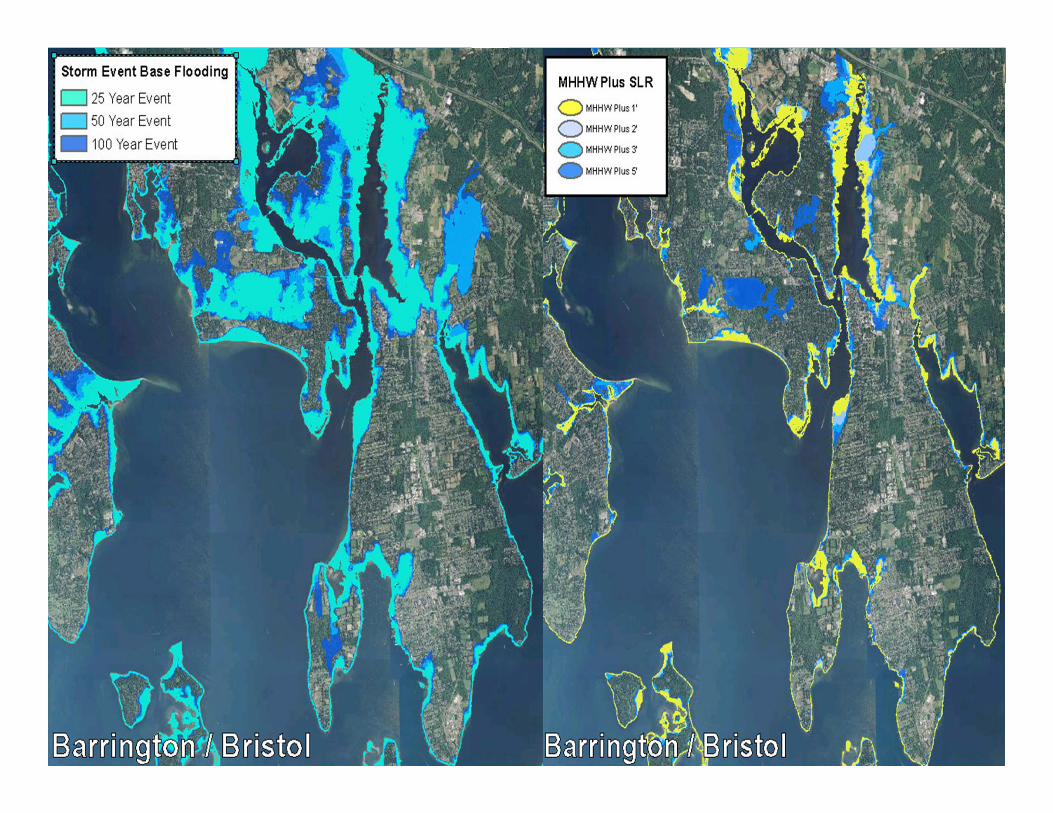
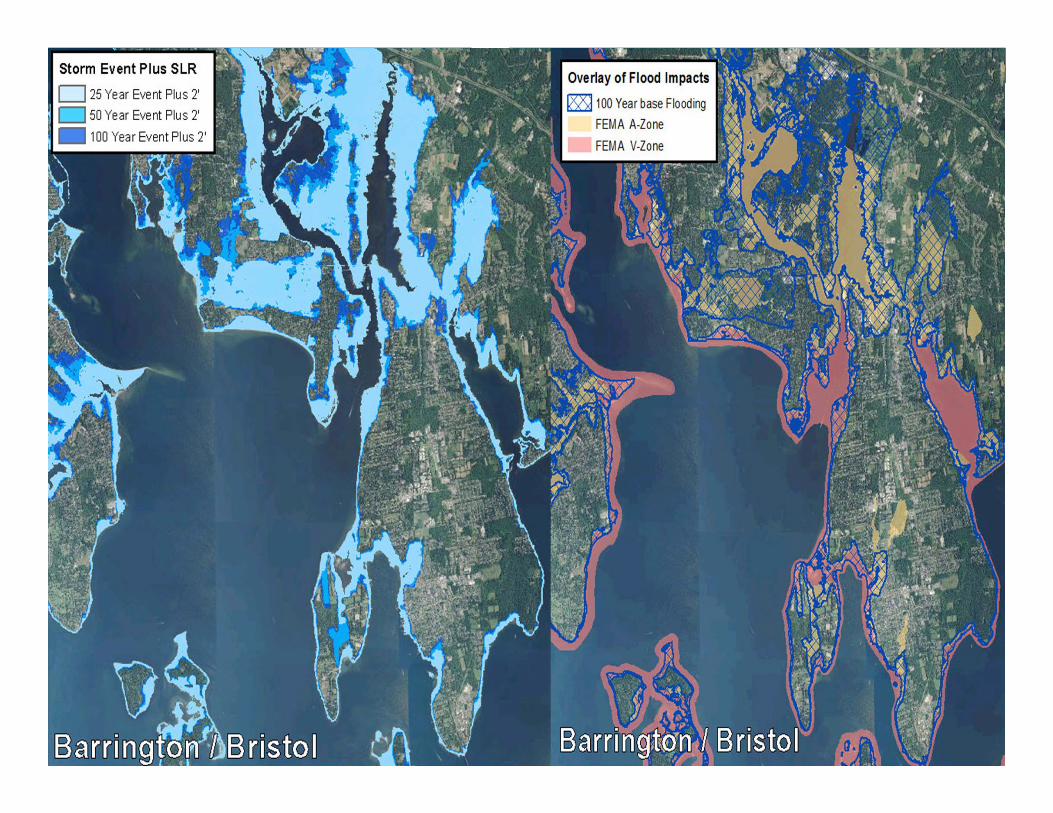
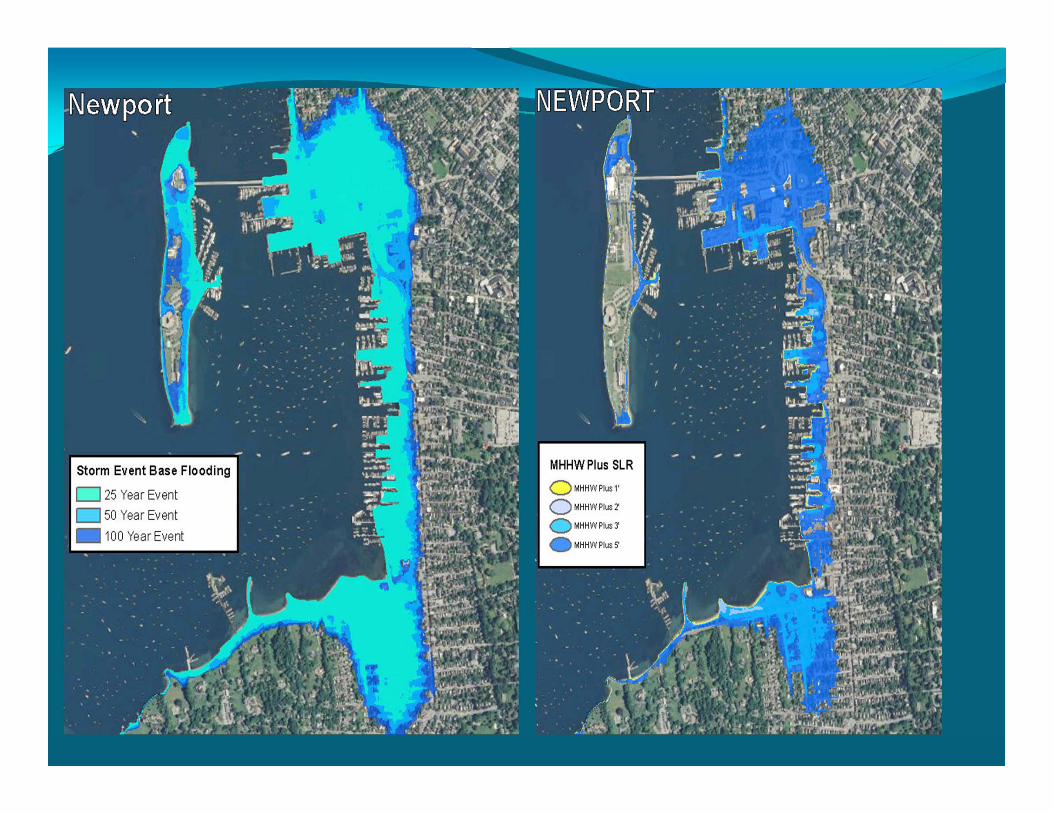
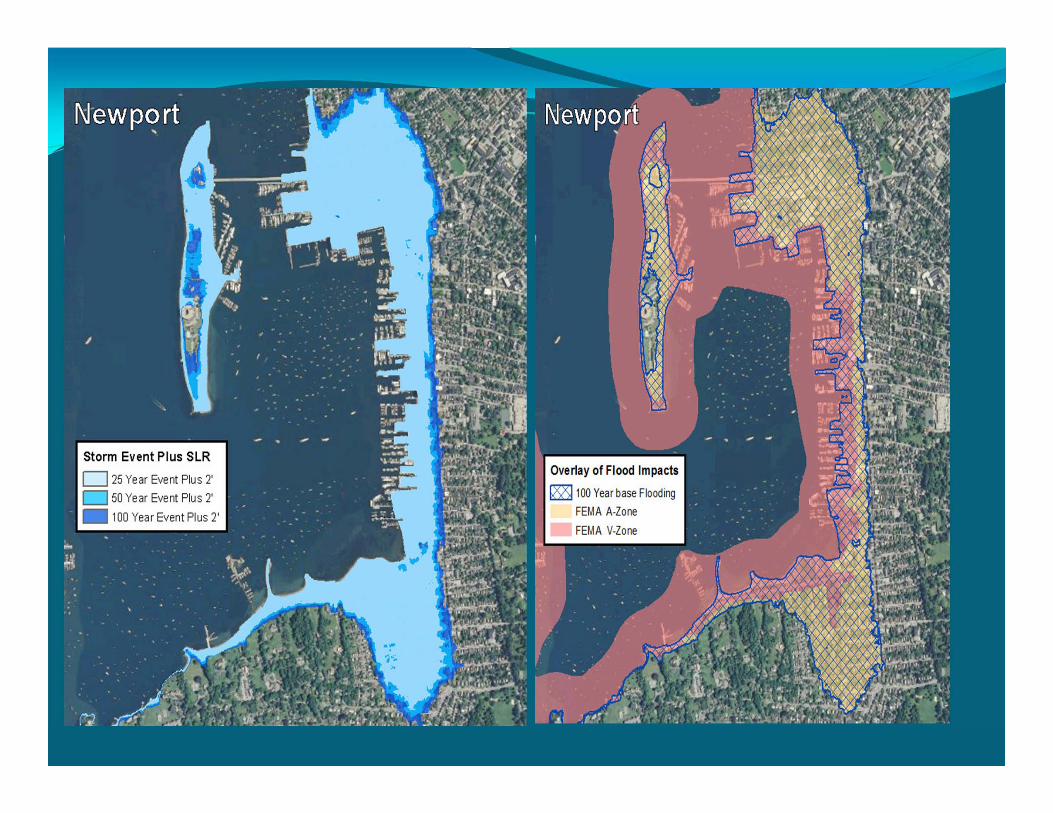
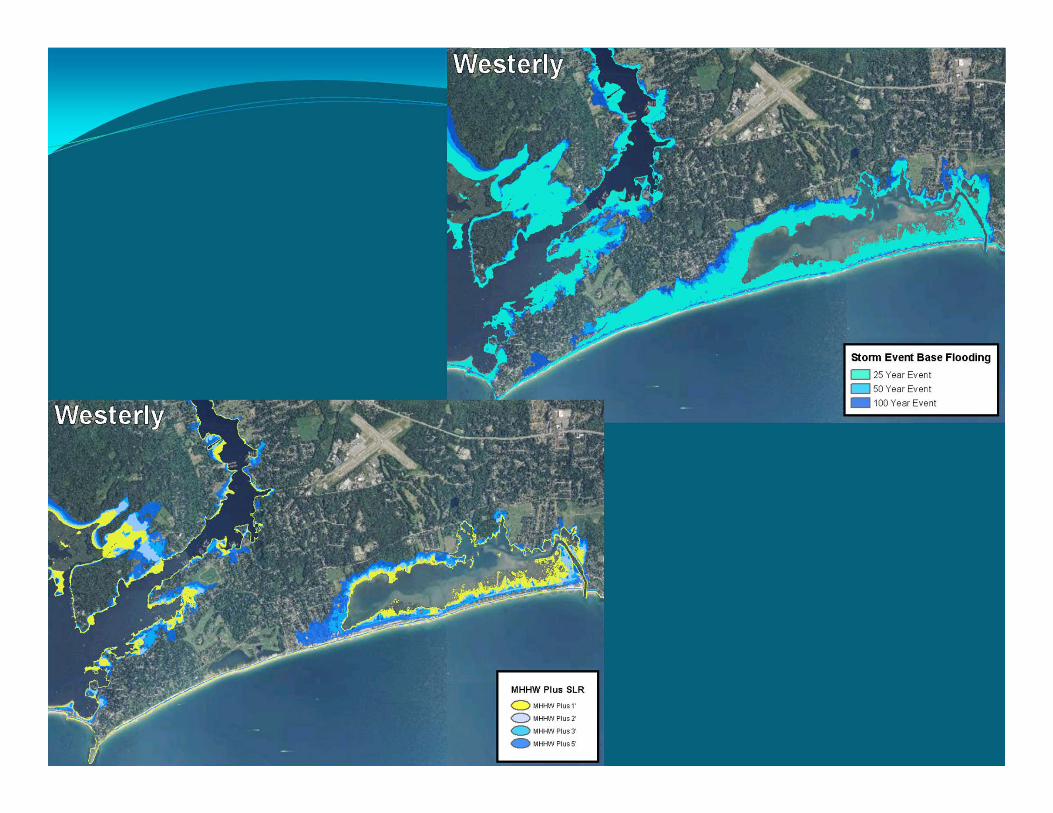
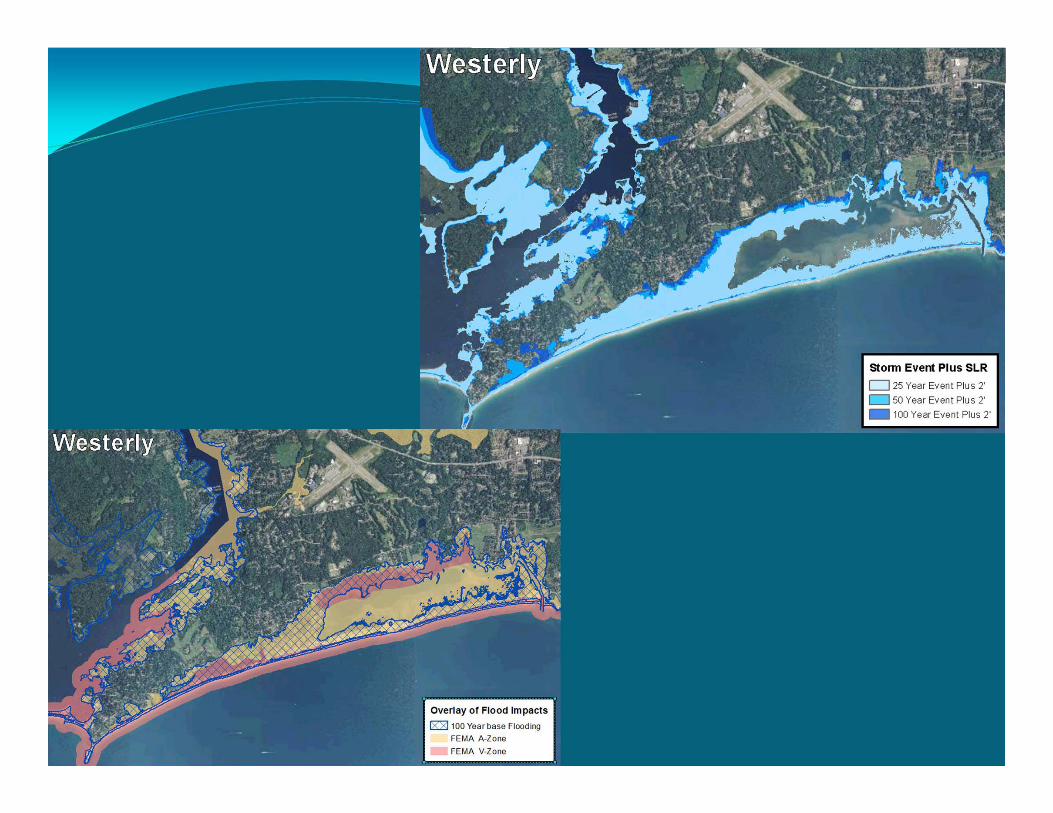
* Use extremal analysis and results of high resolution storm inundation models to predict 25, 50, and 100 yr water levels with SLR (0, 1, 2, 3, and 5 ft) for RI waters (explicitly consider uncertainty).
* Prepare maps for each return period and sea level rise scenario for all coastal waters and access via publically available web map viewer.
Simplified Flood Mapping Strategy:
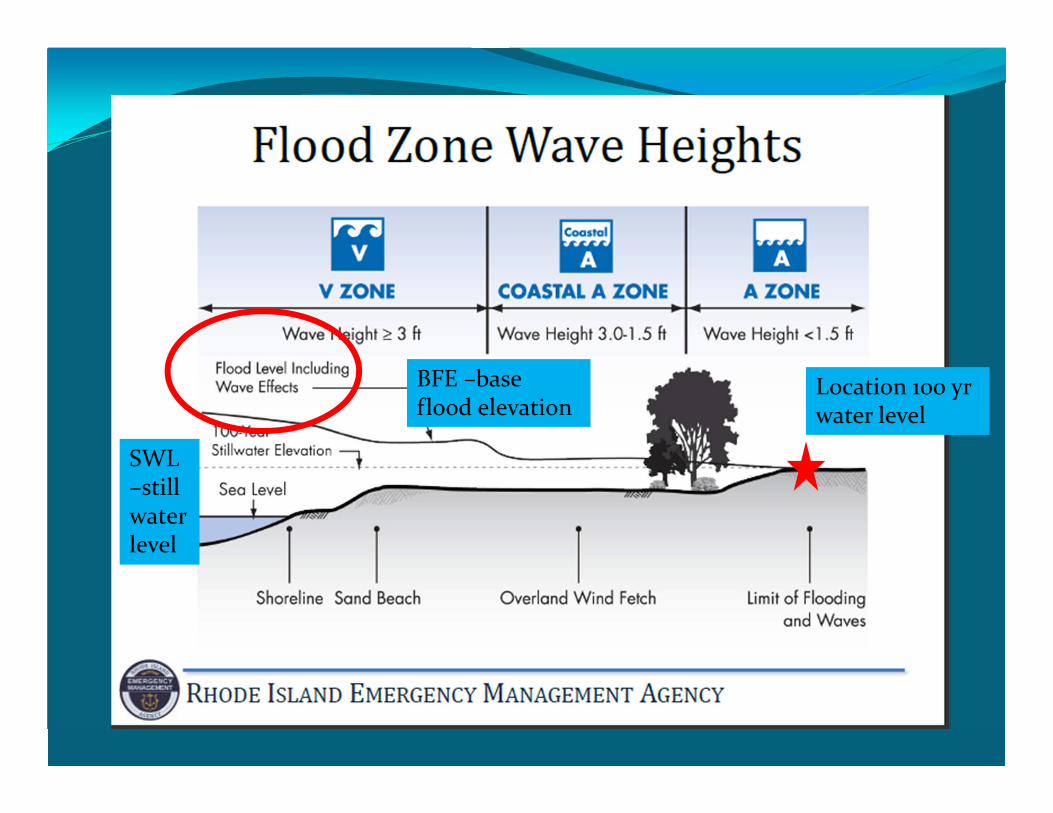
Location 100 yr water level
SWL –still water level
BFE –base flood elevation
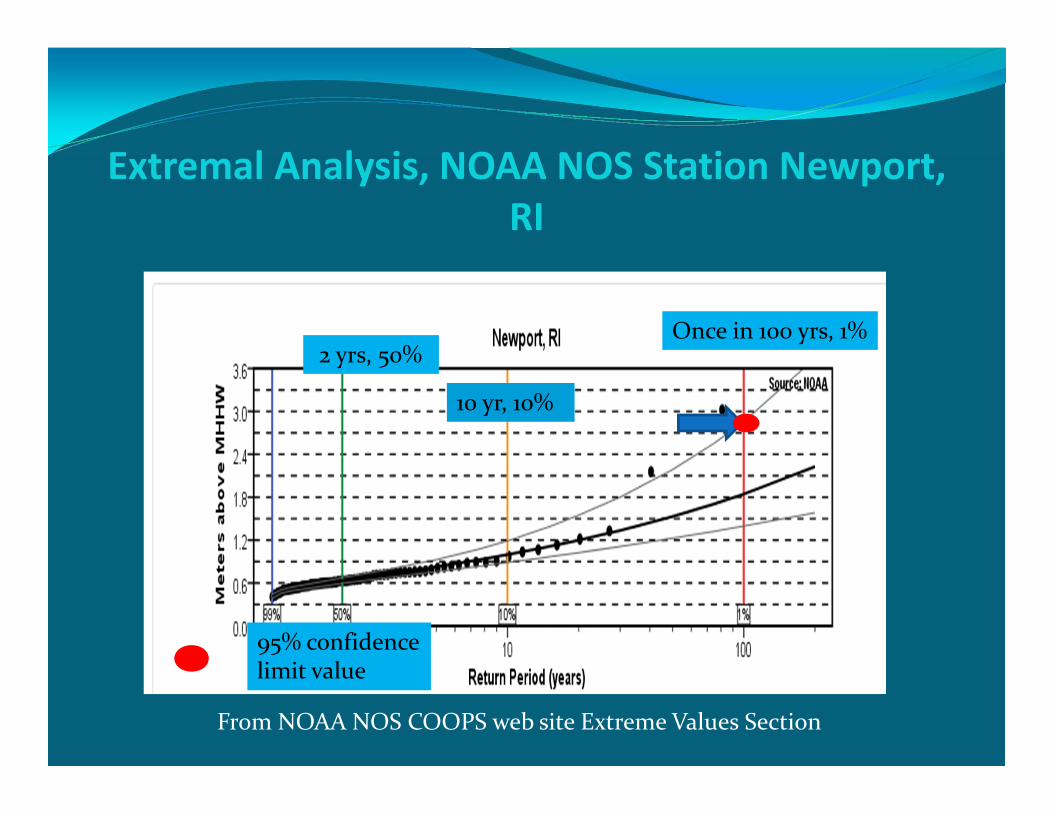
Extremal Analysis, NOAA NOS Station Newport, RI
Once in 100 yrs, 1%
From NOAA NOS COOPS web site Extreme Values Section
2 yrs, 50%
10 yr, 10%
95% confidence limit value
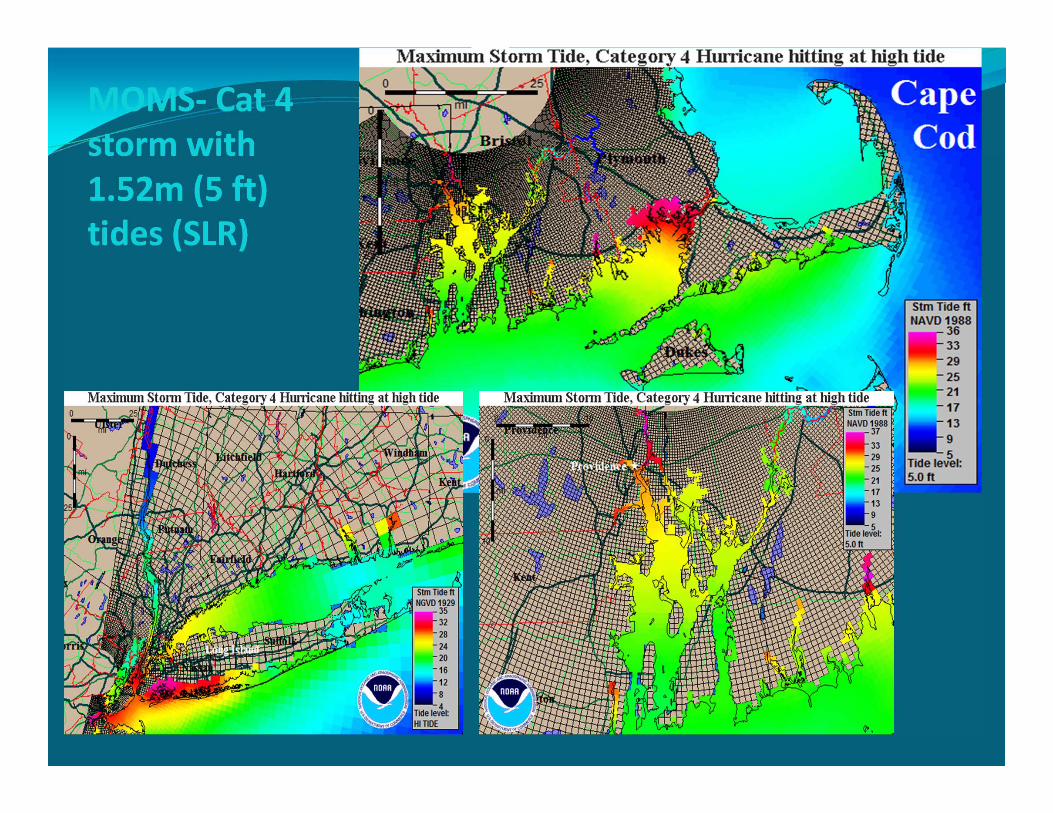
MOMS‐ Cat 4 storm with 1.52m (5 ft) tides (SLR)

Sea Level Rise Estimates for Newport, RIGauge: 8452660, RI, Newport: 77 yrs
All values are in feet
YearUSACE USACE USACELow Int High
2010 0.15 0.18 0.272015 0.19 0.24 0.392020 0.24 0.31 0.532025 0.28 0.38 0.682030 0.32 0.45 0.862035 0.36 0.53 1.052040 0.41 0.61 1.262045 0.45 0.7 1.492050 0.49 0.79 1.742055 0.53 0.89 22060 0.58 0.99 2.292065 0.62 1.09 2.592070 0.66 1.2 2.922075 0.7 1.32 3.262080 0.74 1.43 3.622085 0.79 1.56 3.992090 0.83 1.68 4.392095 0.87 1.82 4.82100 0.91 1.95 5.24
http://www.corpsclimate.us/ccaceslcurves(superseded).cfm
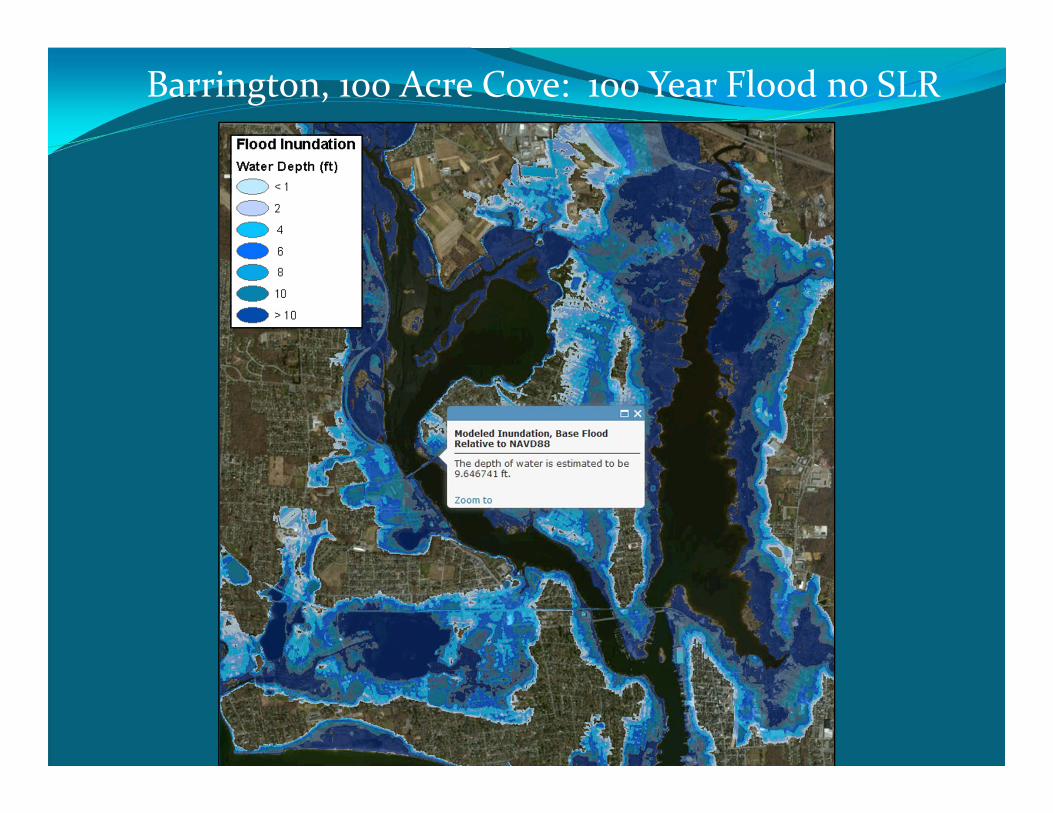
Barrington, 100 Acre Cove: 100 Year Flood no SLR

Barrington, 100 Acre Cove: 100 Year Flood, 5’ SLR
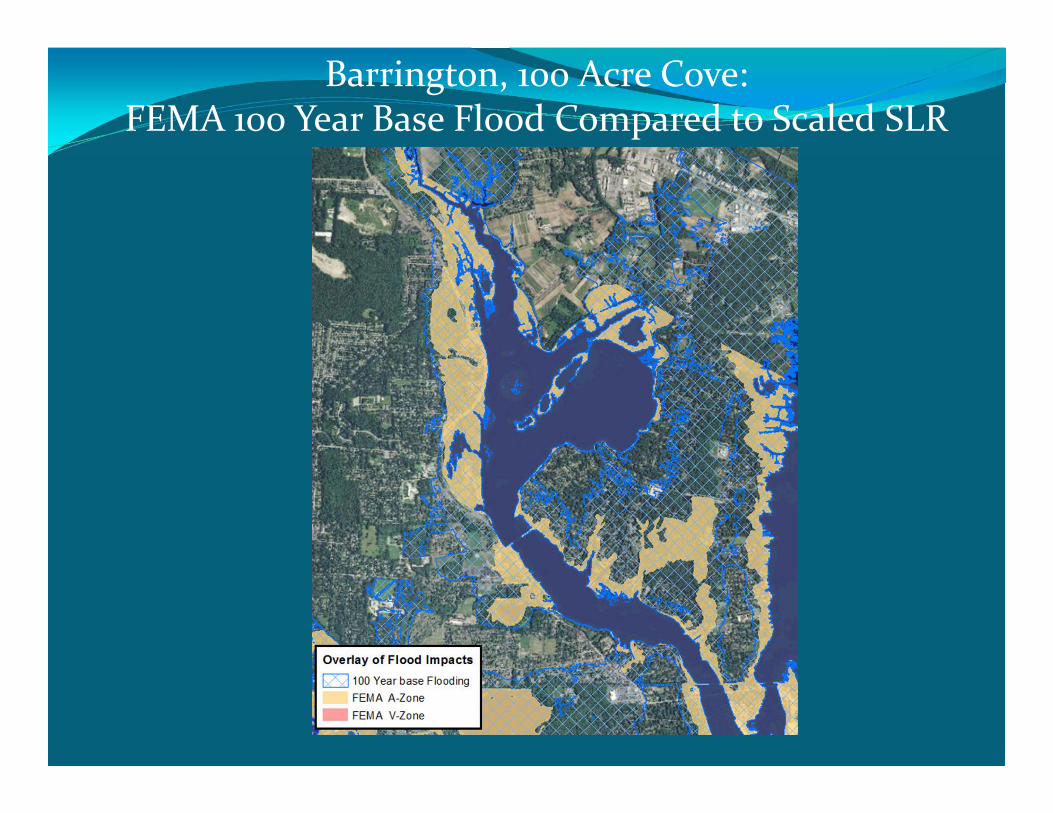
Barrington, 100 Acre Cove:FEMA 100 Year Base Flood Compared to Scaled SLR
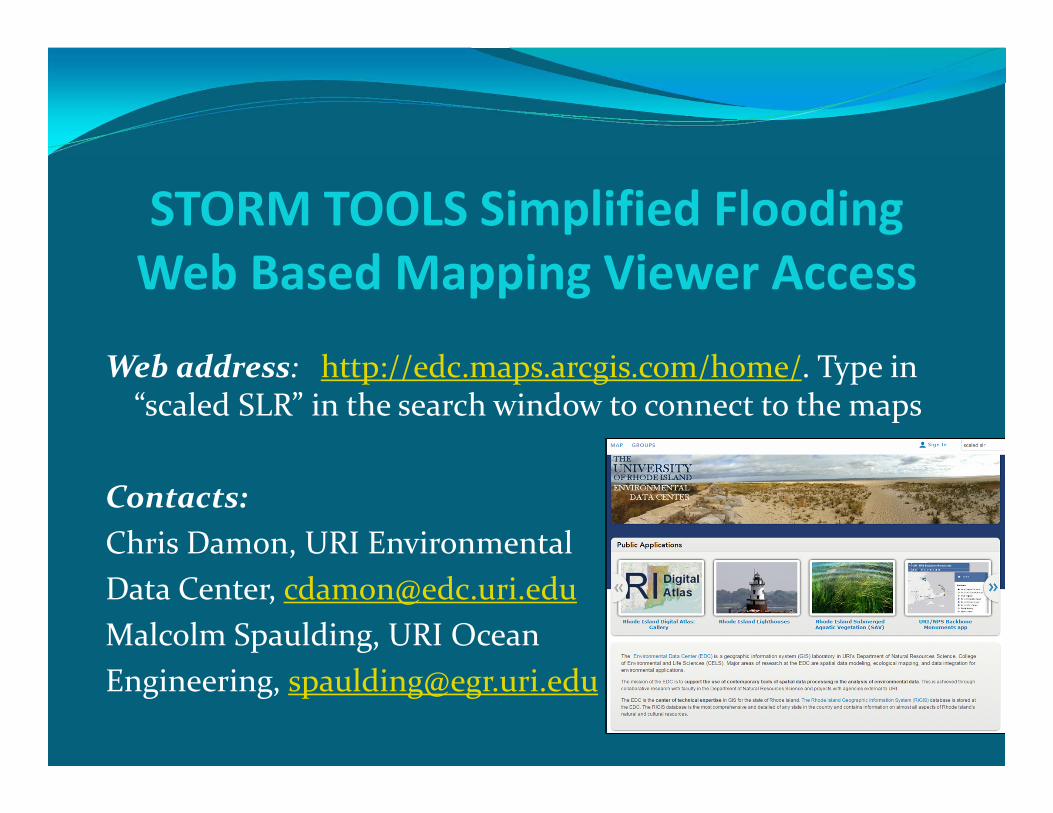
STORM TOOLS Simplified Flooding Web Based Mapping Viewer Access
Web address: http://edc.maps.arcgis.com/home/. Type in “scaled SLR” in the search window to connect to the maps
Contacts: Chris Damon, URI Environmental Data Center, [email protected] Spaulding, URI Ocean Engineering, [email protected]
Additional Slides
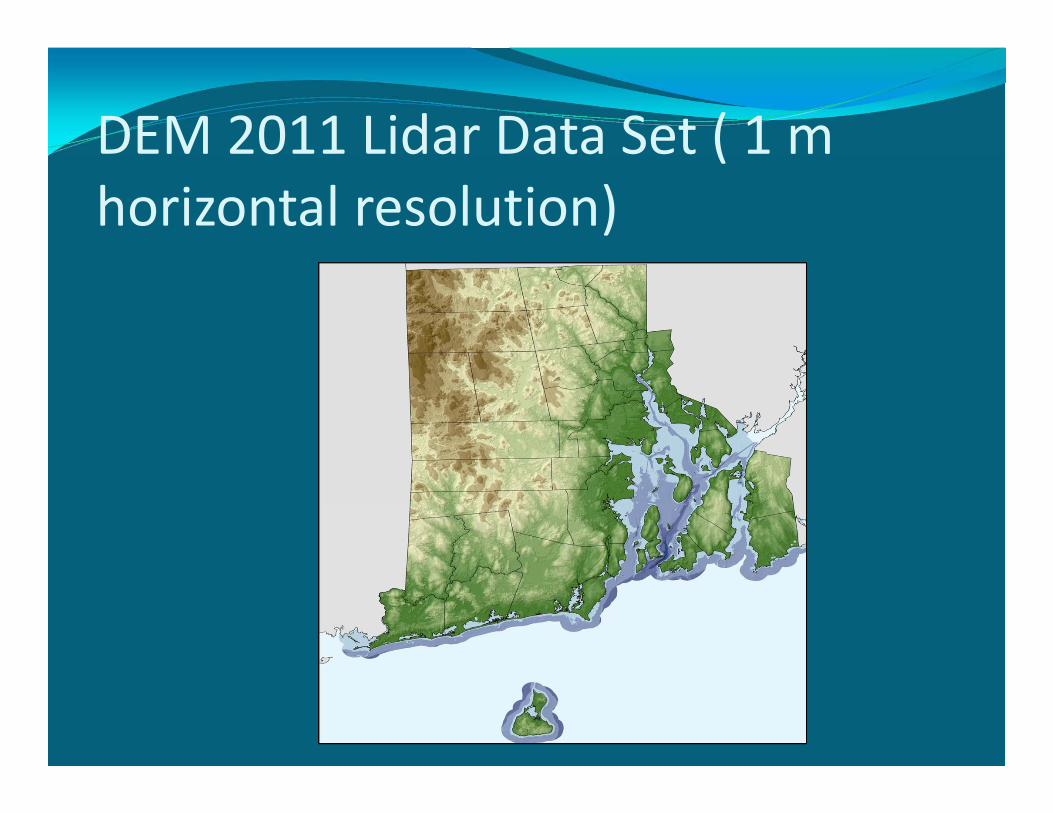
DEM 2011 Lidar Data Set ( 1 m horizontal resolution)