Storms and Floods of July 30, 2016, and May 27, 2018, in ...
6
U.S. Department of the Interior U.S. Geological Survey Fact Sheet 2021–3025 April 2021 Storms and Floods of July 30, 2016, and May 27, 2018, in Ellicott City, Howard County, Maryland Printed on recycled paper By Edward J. Doheny and Christopher W. Nealen Introduction On July 30, 2016, and May 27, 2018, the downtown area of Ellicott City, Maryland (fig. 1), was severely flooded by intense, short-duration rainfall that resulted in loss of life; significant damage to buildings, roads, infrastructure; and hundreds of vehicles washed away. Precipitation from the 2016 event totaled 6.60 inches in 3 hours (National Oceanic and Atmospheric Administration, 2016). Precipitation from the 2018 storm totaled 6.56 inches in 3 hours (National Oceanic and Atmospheric Administration, 2018). In the aftermath of both storms, personnel from the U.S. Geological Survey (USGS) performed indirect discharge mea- surements to determine peak flow on the three streams that drain through the downtown area of Ellicott City and empty into the Patapsco River. High-water marks were flagged on selected reaches of three streams, Hudson Branch (station 01589017), Tiber Branch (station 01589019), and New Cut Branch (sta- tion 01589021) (fig. 2). Peak flows were computed using flow- through-culvert techniques with road overflow for Hudson Branch and slope-area techniques for Tiber Branch and New Cut Branch. This fact sheet describes the basin characteristics, hydro- logic characteristics, and flood history of the Ellicott City, Mary- land, area. The storms and flood characteristics for July 30, 2016, and May 27, 2018, are described. Peak discharges computed from the indirect discharge measurements for Hudson Branch, Tiber Branch, and New Cut Branch are presented for the storms and floods of July 30, 2016, and May 27, 2018. To provide histori- cal perspective on these floods in Ellicott City, results from the indirect discharge measurement computations were compared to peak flows from 75 USGS streamgages and 6 miscellaneous sites in Maryland and Delaware that resulted from intense storms in August and September 1971 (Carpenter, 1974). The findings indi- cate that although the Ellicott City storms and floods from July 30, 2016, and May 27, 2018, are considered very rare in terms of their probability of occurrence, other storms have occurred in the Maryland and Delaware regions in the past that have pro- duced comparable runoff characteristics relative to drainage-area magnitude. Description of Study Area Ellicott City is an unincorporated community in Howard County, Maryland, approximately 4.6 miles (mi) southwest of the City of Baltimore and lying within the eastern section of the Piedmont Physiographic Province (fig. 1). The population of the community was 65,834 as of 2010, an increase of 9,437 people since 2000 (U.S. Census Bureau, 2019, U.S. Census Bureau, 2003). Mean annual precipitation in the region is approximately 45 inches. Ellicott City is underlain by one geologic formation com- posed of Paleozoic Era crystalline rocks that are approximately 420 to 470 million years old (Silurian/Ordovician Period). This formation is the Ellicott City Granodiorite, which ranges from biotite granodiorite along the margins to quartz monzonite in the core of the formation (Maryland Geological Survey, 1968). Ellicott City 75°0' 75°20' 75°40' 76°0' 76°20' 76°40' 77°0' 77°20' 77°40' 78°0' 78°20' 78°40' 79°0' 79°20' 79°40' 40°20' 40°10' 40°0' 39°50' 39°40' 39°30' 39°20' 39°10' 39°0' 38°50' 38°40' 38°30' 38°20' Study area EXPLANATION Howard County Fall line boundary between the Piedmont and Coastal Plain Sources: Esri, HERE, Garmin, Intermap, increment P Corp., GEBCO, USGS, FAO, NPS, NRCAN, GeoBase, IGN, Kadaster NL, Ordnance Survey, Esri Japan, METI, Esri China (Hong Kong), (c) OpenStreetMap contributors, and the GIS User Community Figure 1. Location of Ellicott City, Howard County, Maryland, and surrounding area.
Transcript of Storms and Floods of July 30, 2016, and May 27, 2018, in ...

U.S. Department of the InteriorU.S. Geological Survey
Fact Sheet 2021–3025April 2021
Storms and Floods of July 30, 2016, and May 27, 2018, in Ellicott City, Howard County, Maryland
Printed on recycled paper
By Edward J. Doheny and Christopher W. Nealen
Description of Study Area
Introduction
On July 30, 2016, and May 27, 2018, the downtown area of Ellicott City, Maryland (fig. 1), was severely flooded by intense, short-duration rainfall that resulted in loss of life; significant damage to buildings, roads, infrastructure; and hundreds of vehicles washed away. Precipitation from the 2016 event totaled 6.60 inches in 3 hours (National Oceanic and Atmospheric Administration, 2016). Precipitation from the 2018 storm totaled 6.56 inches in 3 hours (National Oceanic and Atmospheric Administration, 2018).
In the aftermath of both storms, personnel from the U.S. Geological Survey (USGS) performed indirect discharge mea-surements to determine peak flow on the three streams that drain through the downtown area of Ellicott City and empty into the Patapsco River. High-water marks were flagged on selected reaches of three streams, Hudson Branch (station 01589017), Tiber Branch (station 01589019), and New Cut Branch (sta-tion 01589021) (fig. 2). Peak flows were computed using flow-through-culvert techniques with road overflow for Hudson Branch and slope-area techniques for Tiber Branch and New Cut Branch.
This fact sheet describes the basin characteristics, hydro-logic characteristics, and flood history of the Ellicott City, Mary-land, area. The storms and flood characteristics for July 30, 2016, and May 27, 2018, are described. Peak discharges computed from the indirect discharge measurements for Hudson Branch, Tiber Branch, and New Cut Branch are presented for the storms and
floods of July 30, 2016, and May 27, 2018. To provide histori-cal perspective on these floods in Ellicott City, results from the indirect discharge measurement computations were compared to peak flows from 75 USGS streamgages and 6 miscellaneous sites in Maryland and Delaware that resulted from intense storms in August and September 1971 (Carpenter, 1974). The findings indi-cate that although the Ellicott City storms and floods from July 30, 2016, and May 27, 2018, are considered very rare in terms of their probability of occurrence, other storms have occurred in the Maryland and Delaware regions in the past that have pro-duced comparable runoff characteristics relative to drainage-area magnitude.
Description of Study Area
Ellicott City is an unincorporated community in Howard County, Maryland, approximately 4.6 miles (mi) southwest of the City of Baltimore and lying within the eastern section of the Piedmont Physiographic Province (fig. 1). The population of the community was 65,834 as of 2010, an increase of 9,437 people since 2000 (U.S. Census Bureau, 2019, U.S. Census Bureau, 2003). Mean annual precipitation in the region is approximately 45 inches.
Ellicott City is underlain by one geologic formation com-posed of Paleozoic Era crystalline rocks that are approximately 420 to 470 million years old (Silurian/Ordovician Period). This formation is the Ellicott City Granodiorite, which ranges from biotite granodiorite along the margins to quartz monzonite in the core of the formation (Maryland Geological Survey, 1968).
Ellicott City
75°0'75°20'75°40'76°0'76°20'76°40'77°0'77°20'77°40'78°0'78°20'78°40'79°0'79°20'79°40'40°20'
40°10'
40°0'
39°50'
39°40'
39°30'
39°20'
39°10'
39°0'
38°50'
38°40'
38°30'
38°20'
Study area
EXPLANATION
Howard County
Fall line boundary between the Piedmont and Coastal Plain
Sources: Esri, HERE, Garmin, Intermap, increment P Corp., GEBCO,USGS, FAO, NPS, NRCAN, GeoBase, IGN, Kadaster NL, OrdnanceSurvey, Esri Japan, METI, Esri China (Hong Kong), (c) OpenStreetMapcontributors, and the GIS User Community
Figure 1. Location of Ellicott City, Howard County, Maryland, and surrounding area.

Ellicott City lies within the Tiber Branch watershed. At the confluence of the Tiber Branch with the Patapsco River, the Tiber Branch watershed encompasses approximately 3.68 square miles (mi2) with relief of about 300 feet (ft). The watershed has drain-age from three streams—Hudson Branch, Tiber Branch, and New Cut Branch (fig. 2). The watershed is approximately 31.6 percent forested and 65.2 percent developed land, with 30.9 percent char-acterized as impervious and having a mean basin slope of 0.076 foot per foot (ft/ft) (U.S. Geological Survey, 2019a). A combina-tion of fairly steep stream slopes, up to 300 ft of relief, and large areas of impervious surfaces near these small streams can cause the stage and corresponding discharge to fluctuate quickly during storms, contributing to flashy surface-water hydrology that is characteristic of urban streams (Paul and Meyer, 2001).
The three sub-watersheds are considered either urban or suburban on the basis of current development conditions. Hudson Branch is the most developed (75.5 percent) and the most imper-vious (39.6 percent) (U.S. Geological Survey, 2019a). A summary of selected basin characteristics for the sub-watersheds of Hudson Branch, Tiber Branch, and New Cut Branch is shown in table 1. 76°51' 76°50'
The Patapsco River watershed encompasses approximately 294 mi2 at Ellicott City. Streamflow has been regulated by Liberty Reservoir for 3
water supply approximately 15 mi upstream from Ellicott City since July 1954. The watershed is approximately 28.5 percent forested and 20.2 percent developed land, with 11.7 percent characterized as impervious and having a mean basin slope of 0.082 ft/ft (U.S.
3
Geological Survey, 2019a).Downtown Ellicott City is suscep-
tible to significant flooding owing to its location at the bottom of a hill where the Hudson Branch, Tiber Branch, and New Cut Branch streams converge and empty into the Patapsco River, which borders Ellicott City on the east side. As a result, the flood susceptibility can include flash flooding from Hudson Branch, Tiber Branch, and New Cut Branch; overbank flooding from the Patapsco River; or a combination of both. During the 2016 and 2018 flash-flood scenarios, Main Street in down-town Ellicott City became an overflow channel for excess runoff from Hudson Branch, Tiber Branch, and New Cut Branch. The upper section of Main Street floods exclusively owing to excess runoff from Hudson Branch and Tiber Branch. The lower section of Main Street can flood owing to excess runoff from one or more of the three streams or overbank flooding from the Patapsco River.
History of Flooding in Ellicott City, Maryland Ellicott City, Maryland has a long history of flooding.
Reports of flooding date back to 1768, shortly before the com-munity was officially founded by the Ellicott brothers in 1772 (Preservation Maryland, 2016). Prior to the flash floods of July 30, 2016 and May 27, 2018, the largest known floods occurring in Ellicott City were those of July 1868, June 1972, September 1923, September 1975, May 1952, and July 1956. Flood markers in the downtown area documented the peak stage of the Patapsco River above street level for all these events except for July 1956 (fig. 3) (Preservation Maryland, 2016). Peak stage at the flood markers ranged from 21.5 ft above street level in July 1868 to 7.0 ft above street level in May 1952. According to the markers, the peak stage for the flood of July 1868 was 7.0 ft higher than during the flood caused by Tropical Storm Agnes in June 1972, which caused record peak stages at numerous streamflow gages across the Maryland region. The flood markers were destroyed in
USGS Gage 01589000 Patapsco River at Hollofield, MD
Main Street
USGS Gage 01589019Tiber Branch at Ellicott City, MD
USGS Gage 01589017Hudson Branch at Ellicott City, MD
USGS Gage 01589021New Cut Branch at Ellicott City, MD
76°46'76°47'76°48'76°49'
9°19'
9°18'
39°17'
39°16'
39°15'
39°14'
Study area
Sources: Esri, HERE, Garmin, Intermap, increment P Corp., GEBCO,USGS, FAO, NPS, NRCAN, GeoBase, IGN, Kadaster NL, OrdnanceSurvey, Esri Japan, METI, Esri China (Hong Kong), (c) OpenStreetMapcontributors, and the GIS User Community
EXPLANATIONTiber Branch watershed
Hudson Branch
Tiber Branch
New Cut Branch
Figure 2. Location of Ellicott City watersheds and surrounding area.
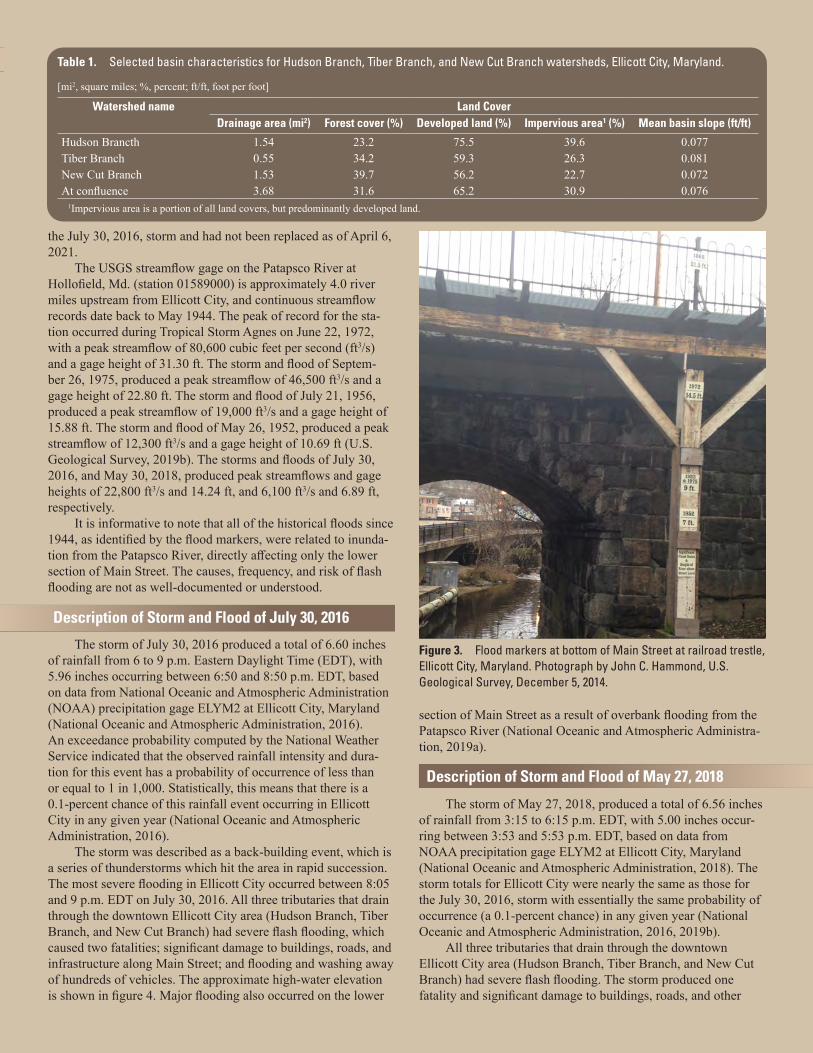
the July 30, 2016, storm and had not been replaced as of April 6, 2021.
The USGS streamflow gage on the Patapsco River at Hollofield, Md. (station 01589000) is approximately 4.0 river miles upstream from Ellicott City, and continuous streamflow records date back to May 1944. The peak of record for the sta-tion occurred during Tropical Storm Agnes on June 22, 1972, with a peak streamflow of 80,600 cubic feet per second (ft3/s) and a gage height of 31.30 ft. The storm and flood of Septem-ber 26, 1975, produced a peak streamflow of 46,500 ft3/s and a gage height of 22.80 ft. The storm and flood of July 21, 1956, produced a peak streamflow of 19,000 ft3/s and a gage height of 15.88 ft. The storm and flood of May 26, 1952, produced a peak streamflow of 12,300 ft3/s and a gage height of 10.69 ft (U.S. Geological Survey, 2019b). The storms and floods of July 30, 2016, and May 30, 2018, produced peak streamflows and gage heights of 22,800 ft3/s and 14.24 ft, and 6,100 ft3/s and 6.89 ft, respectively.
It is informative to note that all of the historical floods since 1944, as identified by the flood markers, were related to inunda-tion from the Patapsco River, directly affecting only the lower section of Main Street. The causes, frequency, and risk of flash flooding are not as well-documented or understood.
Description of Storm and Flood of July 30, 2016
Table 1. Selected basin characteristics for Hudson Branch, Tiber Branch, and New Cut Branch watersheds, Ellicott City, Maryland.
[mi2, square miles; %, percent; ft/ft, foot per foot]
Watershed name Land CoverDrainage area (mi2) Forest cover (%) Developed land (%) Impervious area1 (%) Mean basin slope (ft/ft)
Hudson Brancth 1.54 23.2 75.5 39.6 0.077Tiber Branch 0.55 34.2 59.3 26.3 0.081New Cut Branch 1.53 39.7 56.2 22.7 0.072At confluence 3.68 31.6 65.2 30.9 0.076
1Impervious area is a portion of all land covers, but predominantly developed land.
Description of Storm and Flood of May 27, 2018
Description of Storm and Flood of July 30, 2016
The storm of July 30, 2016 produced a total of 6.60 inches of rainfall from 6 to 9 p.m. Eastern Daylight Time (EDT), with 5.96 inches occurring between 6:50 and 8:50 p.m. EDT, based on data from National Oceanic and Atmospheric Administration (NOAA) precipitation gage ELYM2 at Ellicott City, Maryland (National Oceanic and Atmospheric Administration, 2016). An exceedance probability computed by the National Weather Service indicated that the observed rainfall intensity and dura-tion for this event has a probability of occurrence of less than or equal to 1 in 1,000. Statistically, this means that there is a 0.1-percent chance of this rainfall event occurring in Ellicott City in any given year (National Oceanic and Atmospheric Administration, 2016).
The storm was described as a back-building event, which is a series of thunderstorms which hit the area in rapid succession. The most severe flooding in Ellicott City occurred between 8:05 and 9 p.m. EDT on July 30, 2016. All three tributaries that drain through the downtown Ellicott City area (Hudson Branch, Tiber Branch, and New Cut Branch) had severe flash flooding, which caused two fatalities; significant damage to buildings, roads, and infrastructure along Main Street; and flooding and washing away of hundreds of vehicles. The approximate high-water elevation is shown in figure 4. Major flooding also occurred on the lower
section of Main Street as a result of overbank flooding from the Patapsco River (National Oceanic and Atmospheric Administra-tion, 2019a).
Figure 3. Flood markers at bottom of Main Street at railroad trestle, Ellicott City, Maryland. Photograph by John C. Hammond, U.S. Geological Survey, December 5, 2014.
Description of Storm and Flood of May 27, 2018
The storm of May 27, 2018, produced a total of 6.56 inches of rainfall from 3:15 to 6:15 p.m. EDT, with 5.00 inches occur-ring between 3:53 and 5:53 p.m. EDT, based on data from NOAA precipitation gage ELYM2 at Ellicott City, Maryland (National Oceanic and Atmospheric Administration, 2018). The storm totals for Ellicott City were nearly the same as those for the July 30, 2016, storm with essentially the same probability of occurrence (a 0.1-percent chance) in any given year (National Oceanic and Atmospheric Administration, 2016, 2019b).
All three tributaries that drain through the downtown Ellicott City area (Hudson Branch, Tiber Branch, and New Cut Branch) had severe flash flooding. The storm produced one fatality and significant damage to buildings, roads, and other

infrastructure along Main Street, as well as flooding and wash-ing away of hundreds of vehicles. The Patapsco River did not contribute as much flooding to the town as in 2016, peaking more than 3 ft lower in May 2018 than in July 2016. However, the Patapsco River still likely caused some backwater during the May 2018 storm that prevented water from quickly draining from Main Street (National Oceanic and Atmospheric Adminis-tration, 2018, 2019a).
Two rounds of heavy rain fell during the May 2018 storm as opposed to one round in July 2016. The location of the heaviest rainfall was estimated to have hit farther south during the May 2018 storm, such that NOAA precipitation gage ELYM2 was not within the heaviest rainfall area for the storm (National Oceanic and Atmospheric Administration, 2018).
USGS high-water-mark data collected after the storm indi-cate that the New Cut Branch watershed produced significantly larger flows during May 2018 than during July 2016. The high-water marks, in two comparable locations, indicated peak water levels that were from 1.3 to 1.7 ft higher in May 2018 than in July 2016. This finding is consistent with the National Weather Service estimates that indicate heavier rain fell farther south dur-ing the May 2018 storm.
Indirect Measurements of Peak Discharge in Ellicott City WatershedsIndirect Measurements of Peak Discharge in Ellicott City Watersheds
In the aftermath of the July 2016 and May 2018 flash floods, personnel from the USGS made indirect discharge measurements in selected reaches of Hudson Branch (station 01589017), Tiber Branch (station 01589019), and New Cut Branch (station 01589021) to determine peak flows for the three watersheds that drain through downtown Ellicott City to the Patapsco River. Slope-area techniques were used for Tiber Branch and New Cut Branch, whereas a flow-through-culvert with road-overflow computation was done for Hudson Branch (Dalrymple and Benson, 1967; Bodhaine, 1968; Hulsing, 1967).
In the aftermath of the two storms, high-water marks were flagged to define the extent of flooding on each of the three streams. Reaches were selected on each stream that were a short distance outside the downtown area of Ellicott City in areas where the streamflow at the peak was more confined in the val-ley than along Main Street and could be pinpointed as coming from each of the three watersheds. High-water-mark elevations were surveyed along with cross-section geometry to define the dimension and profile of the channels during the peak. Bridge geometry was also surveyed at the Hudson Branch location to define the culvert dimensions. Values of the dimensionless
Figure 4. The approximate high-water elevation and damage to sidewalks along Main Street in Ellicott City, Maryland, in the aftermath of the July 30, 2016, storm and flood. Photograph by Eric L. Boyd, U.S. Geological Survey, August 5, 2016.
Manning’s roughness coefficient (n) were estimated based on the degree of resistance to flood flows in the stream channel and overbank (Barnes, 1967; French, 1985). Peak discharges computed for the Hudson Branch, Tiber Branch, and New Cut Branch indirect measurement reaches for the storms of July 30, 2016, and May 27, 2018, are presented in table 2.
The data in table 2 indicate that the peak flows for all three stations were greater during the May 27, 2018, storm. For Hud-son Branch, the May 27, 2018, peak flow was approximately 9 percent greater than that of July 30, 2016. For Tiber Branch and New Cut Branch, the May 27, 2018, peak flows were approxi-mately 28.5 percent and 85.5 percent greater, respectively, indicating that the May 27, 2018, storm was centered farther to the south and fell on the New Cut Branch watershed with more intensity than on Tiber Branch and Hudson Branch. The timing of the individual peaks is unknown for Tiber Branch and New Cut Branch for both storms, but a flood-warning gage operated by the Howard County, Maryland, government at the location of the indirect computation for Hudson Branch indicated the peak stage occurred at about 8:10 p.m. EDT for the July 30, 2016, storm and at about 5:53 p.m. EDT for the May 27, 2018, storm (National Oceanic and Atmospheric Administration, 2018).
Table 2. Computed peak discharges for storms of July 30, 2016, and May 27, 2018, at indirect measurement reaches on Hudson Branch, Tiber Branch, and New Cut Branch, Ellicott City, Maryland.
[Md., Maryland; mi2, square miles; %, percent, ft3/s, cubic feet per second]
Station Station Land Covernumber name Drainage Forest Developed Impervious Peak discharge on Peak discharge on
area (mi2) cover (%) land (%) area1 (%) July 30, 2016 (ft3/s) May 27, 2018 (ft3/s)01589017 Hudson Branch at Ellicott City, Md. 1.26 19.1 79.7 40.5 2,750 3,00001589019 Tiber Branch at Ellicott City, Md. 0.53 33.1 59.9 26.5 2,100 2,70001589021 New Cut Branch at Ellicott City, Md. 1.53 39.7 56.2 22.7 3,320 6,1601Impervious area is a portion of all land covers, but predominantly developed land.
Historical Perspective: July 2016 and May 2018 FloodsHistorical Perspective: July 2016 and May 2018 Floods
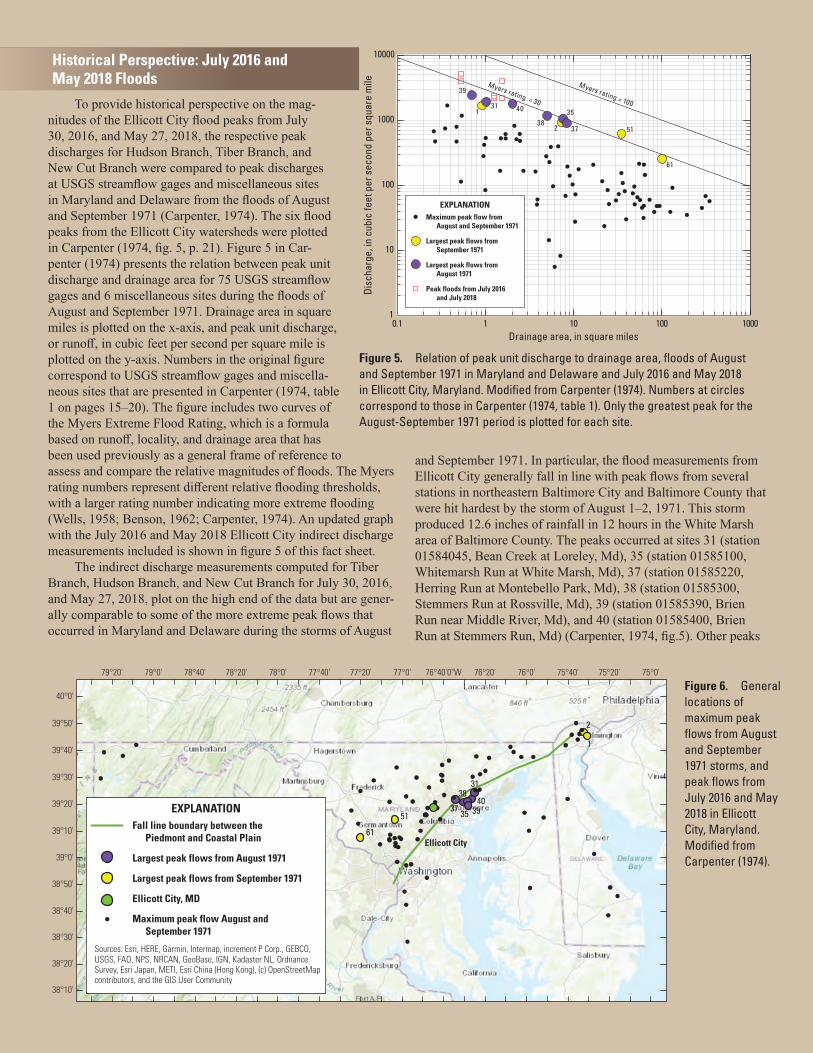
To provide historical perspective on the mag-nitudes of the Ellicott City flood peaks from July 30, 2016, and May 27, 2018, the respective peak discharges for Hudson Branch, Tiber Branch, and New Cut Branch were compared to peak discharges at USGS streamflow gages and miscellaneous sites in Maryland and Delaware from the floods of August and September 1971 (Carpenter, 1974). The six flood peaks from the Ellicott City watersheds were plotted in Carpenter (1974, fig. 5, p. 21). Figure 5 in Car-penter (1974) presents the relation between peak unit discharge and drainage area for 75 USGS streamflow gages and 6 miscellaneous sites during the floods of August and September 1971. Drainage area in square miles is plotted on the x-axis, and peak unit discharge, or runoff, in cubic feet per second per square mile is plotted on the y-axis. Numbers in the original figure correspond to USGS streamflow gages and miscella-neous sites that are presented in Carpenter (1974, table 1 on pages 15–20). The figure includes two curves of the Myers Extreme Flood Rating, which is a formula based on runoff, locality, and drainage area that has been used previously as a general frame of reference to assess and compare the relative magnitudes of floods. The Myers rating numbers represent different relative flooding thresholds, with a larger rating number indicating more extreme flooding (Wells, 1958; Benson, 1962; Carpenter, 1974). An updated graph with the July 2016 and May 2018 Ellicott City indirect discharge measurements included is shown in figure 5 of this fact sheet.
Myers rating = 100
Myers rating = 30
1
10
100
1000
10000
00010010111.0
1
2 51
61
3135
3738
39
40
Disc
harg
e, in
cub
ic fe
et p
er s
econ
d pe
r squ
are
mile
Drainage area, in square miles
EXPLANATIONMaximum peak flow from
August and September 1971
Largest peak flows from September 1971
Largest peak flows fromAugust 1971
Peak floods from July 2016and July 2018
Figure 5. Relation of peak unit discharge to drainage area, floods of August and September 1971 in Maryland and Delaware and July 2016 and May 2018 in Ellicott City, Maryland. Modified from Carpenter (1974). Numbers at circles correspond to those in Carpenter (1974, table 1). Only the greatest peak for the August-September 1971 period is plotted for each site.
The indirect discharge measurements computed for Tiber Branch, Hudson Branch, and New Cut Branch for July 30, 2016, and May 27, 2018, plot on the high end of the data but are gener-ally comparable to some of the more extreme peak flows that occurred in Maryland and Delaware during the storms of August
and September 1971. In particular, the flood measurements from Ellicott City generally fall in line with peak flows from several stations in northeastern Baltimore City and Baltimore County that were hit hardest by the storm of August 1–2, 1971. This storm produced 12.6 inches of rainfall in 12 hours in the White Marsh area of Baltimore County. The peaks occurred at sites 31 (station 01584045, Bean Creek at Loreley, Md), 35 (station 01585100, Whitemarsh Run at White Marsh, Md), 37 (station 01585220, Herring Run at Montebello Park, Md), 38 (station 01585300, Stemmers Run at Rossville, Md), 39 (station 01585390, Brien Run near Middle River, Md), and 40 (station 01585400, Brien Run at Stemmers Run, Md) (Carpenter, 1974, fig.5). Other peaks
2
61
51
4039
38
37
31
1
35
Ellicott City
75°0'75°20'79°20' 75°40'76°0'76°20'76°40'0"W77°0'77°20'77°40'78°0'78°20'78°40'79°0'
40°0'
39°50'
39°40'
39°30'
39°20'
39°10'
39°0'
38°50'
38°40'
38°30'
38°20'
38°10'
EXPLANATIONFall line boundary between the
Piedmont and Coastal Plain
Largest peak flows from August 1971
Largest peak flows from September 1971
Ellicott City, MD
Maximum peak flow August and September 1971
Sources: Esri, HERE, Garmin, Intermap, increment P Corp., GEBCO,USGS, FAO, NPS, NRCAN, GeoBase, IGN, Kadaster NL, OrdnanceSurvey, Esri Japan, METI, Esri China (Hong Kong), (c) OpenStreetMapcontributors, and the GIS User Community
Figure 6. General locations of maximum peak flows from August and September 1971 storms, and peak flows from July 2016 and May 2018 in Ellicott City, Maryland. Modified from Carpenter (1974).

that generally fall in line with the flood measurements from Elli-cott City occurred during the storm of September 11–13, 1971, which produced 6–10 inches of rainfall over areas of central Maryland and northern Delaware (Carpenter, 1974). These peaks occurred at sites 1 (station 01477790, Matson Run at Wilmington, De), 2 (station 01477800, Shellpot Creek at Wilmington, De), 51 (station 01591000, Patuxent River near Unity, Md), and 61 (station 01645000, Seneca Creek at Dawsonville, Md) in figure 5 of this fact sheet. This finding indicates that, although the Ellicott City storms and floods from July 30, 2016, and May 27, 2018, are considered rare in terms of their probability of occurrence, there are other storms that have occurred in the Maryland and Dela-ware region in the past that have produced comparable runoff characteristics relative to drainage-area magnitude. The spatial locations of these stations are shown in figure 6 and indicate a generally straight-line pattern that runs southwest to northeast through central Maryland and northeastern Delaware.
This straight-line pattern of spatial locations is consistent with results from a more recent study conducted by O’Connor and Costa (2003), which investigated the locations and causes of the largest floods in the United States, based on data from USGS streamflow gages through the 1997 water year. The O’Connor and Costa (2003) study indicated that the distribution of the larg-est historical flows in the United States is not random and reflects regional climate and landscape properties, such as topography. The area of Maryland along the eastern edge of the Appalachian Mountains is one of the locations identified in O’Connor and Costa (2003) as having a high density of the largest historical floods. A combination of the local topography and subtropical moisture from the Gulf of Mexico and the Atlantic Ocean often serve as triggers for convective storms in this area of Maryland, which includes Ellicott City (O’Connor and Costa, 2003).
References CitedReferences Cited
Barnes, H.H., Jr., 1967, Roughness characteristics of natural channels: U.S. Geological Survey Water-Supply Paper 1949, 213 p.
Benson, M.A., 1962, Evolution of methods for evaluating the occurrence of floods: U.S. Geological Survey Water-Supply Paper 1580-A, 30 p. [Also available at https://pubs.er.usgs.gov/publication/wsp1580A.]
Bodhaine, G.L., 1968, Measurement of peak discharge at culverts by indirect methods: U.S. Geological Survey Techniques of Water Resources Investigations, book 3, chap. A3, 60 p. [Also available at https://pubs.er.usgs.gov/publication/twri03A3.]
Carpenter, D.H., 1974, Floods of August and September 1971 in Maryland and Delaware: U.S. Geological Survey Open-File Report 74-1015, 35 p. [Also available at https://pubs.er.usgs.gov/publication/ofr741015.] https://doi.org/10.3133/ofr741015
Dalrymple, T., and Benson, M.A., 1967, Measurement of peak discharge by the slope-area method: U.S. Geological Survey Techniques of Water Resources Investigations, book 3, chap. A2, 12 p. [Also avail-able at https://pubs.er.usgs.gov/publication/twri03A2.]
French, R.H., 1985, Open-channel hydraulics: New York, McGraw-Hill Book Company, 705 p.
Hulsing, H., 1967, Measurement of peak discharge at dams by indirect methods: U.S. Geological Survey Techniques of Water Resources Investigations, book 3, chap. A5, 29 p. [Also available at https://pubs.er.usgs.gov/publication/twri03A5.]
Maryland Geological Survey, 1968, Geologic Maps of Maryland, How-ard County: Maryland Geological Survey, scale 1:250,000, accessed October 4, 2019, at http://www.mgs.md.gov/esic/geo/how.html.
National Oceanic and Atmospheric Administration, 2016, National Weather Service, Ellicott City historic rain and flash flood – July 30, 2016, online report: National Oceanic and Atmospheric Administra-tion, accessed September 20, 2019, at: https://www.weather.gov/lwx/EllicottCityFlood2016.
National Oceanic and Atmospheric Administration, 2018, National Weather Service, May 27, 2018 Flooding–Ellicott City & Catonsville, MD: National Oceanic and Atmospheric Administration, accessed September 20, 2019, at https://www.weather.gov/lwx/EllicottCity-Flood2018.
National Oceanic and Atmospheric Administration, 2019a, National Weather Service, Stage hydrograph for NOAA station ELPM2, Patapsco River at Ellicott City, MD: National Oceanic and Atmo-spheric Administration, accessed September 30, 2019, at https://water.weather.gov/ahps2/hydrograph.php?wfo=lwx&gage=elpm2.
National Oceanic and Atmospheric Administration, 2019b, National Weather Service, NOAA Atlas 14 Point Precipitation Frequency Estimates—MD: National Oceanic and Atmospheric Administration, accessed October 2, 2019, at https://hdsc.nws.noaa.gov/hdsc/pfds/pfds_map_cont.html?bkmrk=md.
O’Connor, J.E., and Costa, J.E., 2003, Large floods in the United States—Where they happen and why: U.S. Geological Survey Circu-lar 1245, 13 p. https://doi.org/10.3133/cir1245.
Paul, M.J., and Meyer, J.L., 2001, Streams in the urban landscape: Annual Review of Ecology and Systematics, v. 32, no. 1, p. 333–365. https://doi.org/10.1146/annurev.ecolsys.32.081501.114040.
Preservation Maryland, 2016, Historic context of the Ellicott City flood: Baltimore, MD, Preservation Maryland, accessed September 27, 2019, at https://www.preservationmaryland.org/historic-context-ellicott-city-flood/.
U.S. Census Bureau, 2019, QuickFacts, Ellicott City Census Designated Place (CDP), Maryland: U.S. Census Bureau, accessed October 3, 2019, at https://www.census.gov/quickfacts/ellicottcitycdpmaryland.
U.S. Census Bureau, 2003, Maryland: 2000, Population and Hous-ing Unit Counts, 2000 Census of Population and Housing, accessed November 3, 2020, at https://www.census.gov/prod/cen2000/phc-3-22.pdf.
U.S. Geological Survey, 2019a, The StreamStats application, accessed August 26, 2019, at https://streamstats.usgs.gov/ss/.
U.S. Geological Survey, 2019b, USGS 01589000, Patapsco River at Hollofield, Md., in USGS water data for the Nation, National Water Information System database, accessed September 27, 2019, at https://www.doi.org/10.5066/F7P55KJN. [Site information directly accessible at https://waterdata.usgs.gov/md/nwis/inventory/?site_no=01589000&agency_cd=USGS.]
Wells, J.V.B., 1958, Compilation of records of surface waters of the United States through September 1950—Part 14. Pacific slope basins in Oregon and lower Columbia River basin: U.S. Geological Survey Water-Supply Paper 1318, 558 p.
ISSN 2327-6916 (print)ISSN 2327-6932 (online)https://doi.org/10.3133/fs20213025