InfiniVault 35 Mid-End Active Archive Storage Appliance Info Sheet
Storing, Protecting and
Connecting a Digital World
Investing in the Future
January 2012
Imation: Storing, Protecting and Connecting 2
Risks and Uncertainties
Certain information which does not relate to historical financial information may be deemed to constitute forward-looking statements. The
words or phrases “is targeting,” “will likely result,” “are expected to,” “will continue,” “is anticipated,” “estimate,” “project,” “believe” or similar
expressions identify “forward-looking statements” within the meaning of the Private Securities Litigation Reform Act of 1995. Such statements
are subject to certain risks and uncertainties that could cause our actual results in the future to differ materially from our historical results and
those presently anticipated or projected. We wish to caution investors not to place undue reliance on any such forward-looking statements.
Any forward-looking statements speak only as of the date on which such statements are made, and we undertake no obligation to update
such statements to reflect events or circumstances arising after such date. Risk factors include our ability to successfully implement our
strategy; our ability to grow our business in new products with profitable margins and the rate of revenue decline for certain existing products;
the ready availability and price of energy and key raw materials or critical components; our ability to pass along price increases to our
customers; changes in European law or practice related to the imposition or collectability of optical levies; our potential dependence on third
parties for new product introductions or technologies in order to introduce our own new products; our ability to introduce new offerings in a
timely manner either independently or in association with TDK, OEMs and other third parties and the market acceptance of newly introduced
product and service offerings; continuing uncertainty in global and regional economic conditions; our ability to identify, integrate and realize
the expected benefits from any acquisition which has occurred or may occur in connection with our strategy; our ability to realize the benefits
from our global sourcing and development strategy for magnetic data storage products and the related restructuring; the volatility of the
markets in which we operate; foreign currency fluctuations; our ability to source and deliver products to our customers at acceptable quality,
volume and cost levels; significant changes in discount rates and other assumptions used in the valuation of our pension plans; changes in tax
laws, regulations and results of inspections by various tax authorities; our ability to meet our revenue growth, gross margin and earnings
targets; our ability to secure adequate supply of certain high demand products at acceptable prices; changes in the supply and cost of raw
materials and key components of our products resulting from the effects of natural disasters including the October 2011 flooding in Thailand;
our ability to efficiently source, warehouse and distribute our products globally; a material change in customer relationships or in customer
demand for products; the future financial and operating performance of major customers and industries served; our ability to successfully
defend our intellectual property rights and the ability or willingness of our suppliers to provide adequate protection against third party
intellectual property or product liability claims; the possibility that our long-lived assets for any goodwill that we acquire in the future may
become impaired; the outcome of any pending or future litigation; and the volatility of our stock price due to our results or market trends, as
well as various factors set forth in Item 1A of our Annual Report on Form 10-K for the fiscal year ended December 31, 2010 and from time to
time in our filings with the Securities and Exchange Commission.
Imation: Storing, Protecting and Connecting 3
Company Background
Our Opportunity
Strategies
Key Success Factors
Financial Goals
Today’s Agenda

Imation: Storing, Protecting and Connecting 4 Company Background Our Opportunity Strategies Key Success Factors Financial Goals
Company Background
Our Opportunity
Strategies
Key Success Factors
Financial Goals
Today’s Agenda

Imation: Storing, Protecting and Connecting 5 Company Background Our Opportunity Strategies Key Success Factors Financial Goals
Imation at a Glance
• 2010 revenue of $1.46 billion
• Located in Oakdale, Minnesota
• 1075 Employees as of 9/30/11
• Doing business in 100 countries
• Owns and takes to market major
brands (Imation, Memorex, TDK Life on Record, XtremeMac)
• Now focused on storing, protecting, and connecting digital
information
• Main product categories are Traditional Storage, Secure & Scalable
Storage, and Audio & Video Information

Imation: Storing, Protecting and Connecting 6 Company Background Our Opportunity Strategies Key Success Factors Financial Goals
Our Product Categories
• Optical – Blu-ray growing, overall market
declining
– Leading position - 35% share
– 70% share in U.S.
– IMN, TDK, MMX, HP
– Competition – Sony, Verbatim,
Maxell
• Tape – Leading position – 30 to 35%
share
– Key OEMs (IBM, HP, Oracle)
investing in future
– Most cost efficient long-term
archive solution
– IMN, TDK, IBM, ORCL
– Competition – Fuji, Sony, Maxell
• Standard USB Flash and
Hard Drive – Overall markets large and
growing but very competitive (e.g.
- SanDisk, Buffalo, WD, Seagate)
• Secure Storage – Focus is the application, not the
product
– Small market, but sizable growth
opportunity and higher margins
than standard media
• Scalable Storage – Leading position in RDX
technology (both docks and
media)
– Major OEM’s have adopted RDX
technology (IBM, HP, Dell,
others)
– Primary focus is SMB
• Strong Memorex and TDK Life
on Record brand recognition
• XtremeMac brand strong with
Apple enthusiasts
• Full line of audio products
(speakers, headphones, iPod,
iPad and iPhone docks)
• Accessories focused on audio
and gaming
70% of revenues 17% of revenues 13% of Revenues
Traditional Storage (Optical & Magnetic)
Secure & Scalable Storage (Flash & HDD)
Audio & Video Information (Digital Audio & Accessories)

Imation: Storing, Protecting and Connecting 7 Company Background Our Opportunity Strategies Key Success Factors Financial Goals
Strategic Highlights
Announced our strategic direction and long-term financial goals in
Feb. 2011
Closed on five acquisitions in 2011:
• Nine Technology’s IP for deduplication – acquired in December 2011
• IronKey’s secure hardware assets – acquired in October 2011 for $19 million
• ProStor Systems’ InfiniVault assets – acquired in August 2011 for $500,000
• MXI Security – acquired in June 2011 for $24.5 million
• ENCRYPTX – acquired in February 2011 for $1 million
Substantial reskilling over the last two years:
• More than half of management team new in last 18 months
• 20% of HQ staff new in last 12 months
• 56 new hires to RD&E in 2011

Company Background Imation: Storing, Protecting and Connecting 8
Our Opportunity Strategies Key Success Factors Financial Goals
Company Background
Our Opportunity
Strategies
Key Success Factors
Financial Goals
Today’s Agenda

Company Background Imation: Storing, Protecting and Connecting 9
Our Opportunity Strategies Key Success Factors Financial Goals
Information is Growing Exponentially Producing a Storage Gap

Company Background Imation: Storing, Protecting and Connecting 10
Our Opportunity Strategies Key Success Factors Financial Goals
Data Protection is Becoming a Critical Issue
• In 2010, 662 breaches were
reported in the U.S., causing
16,167,542 individual record
exposures (Source: Identity Theft Resource Center)
Data breaches are
relatively common and
extremely costly
Company Background Imation: Storing, Protecting and Connecting 11
Our Opportunity Strategies Key Success Factors Financial Goals
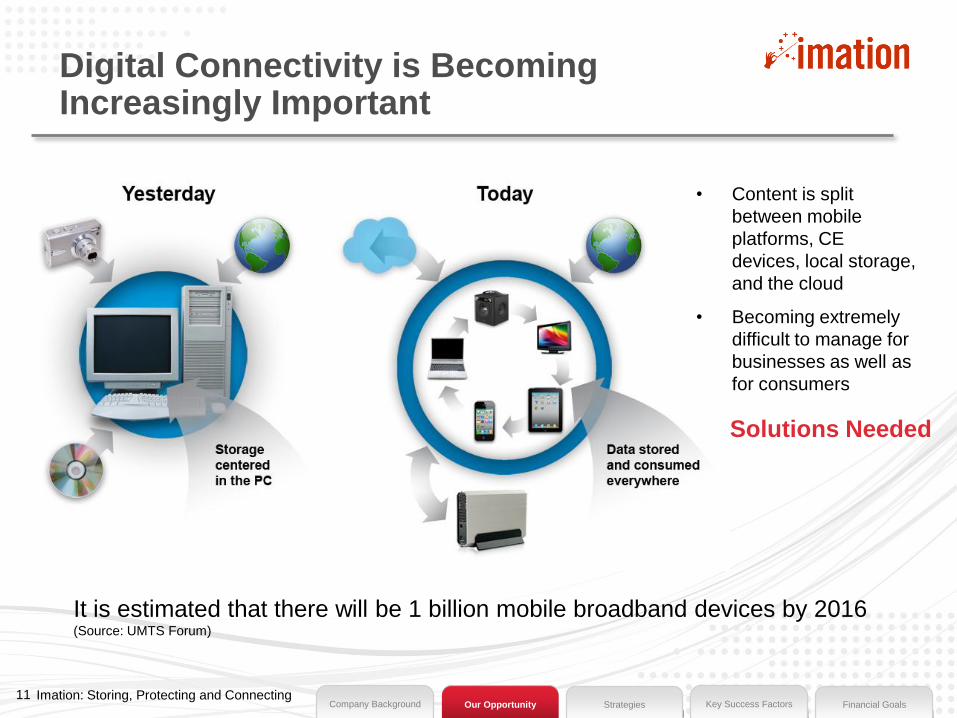
Digital Connectivity is Becoming Increasingly Important
• Content is split
between mobile
platforms, CE
devices, local storage,
and the cloud
• Becoming extremely
difficult to manage for
businesses as well as
for consumers
It is estimated that there will be 1 billion mobile broadband devices by 2016 (Source: UMTS Forum)
Solutions Needed

Strategies Imation: Storing, Protecting and Connecting 12
Company Background Our Opportunity Key Success Factors Financial Goals
Company Background
Our Opportunity
Strategies
Key Success Factors
Financial Goals
Today’s Agenda

Strategies Imation: Storing, Protecting and Connecting 13
Company Background Our Opportunity Key Success Factors Financial Goals
To be a global technology company dedicated to helping people and
organizations store, protect and connect their digital world
We Have a Clear Vision
Strategies Imation: Storing, Protecting and Connecting 14
Company Background Our Opportunity Key Success Factors Financial Goals
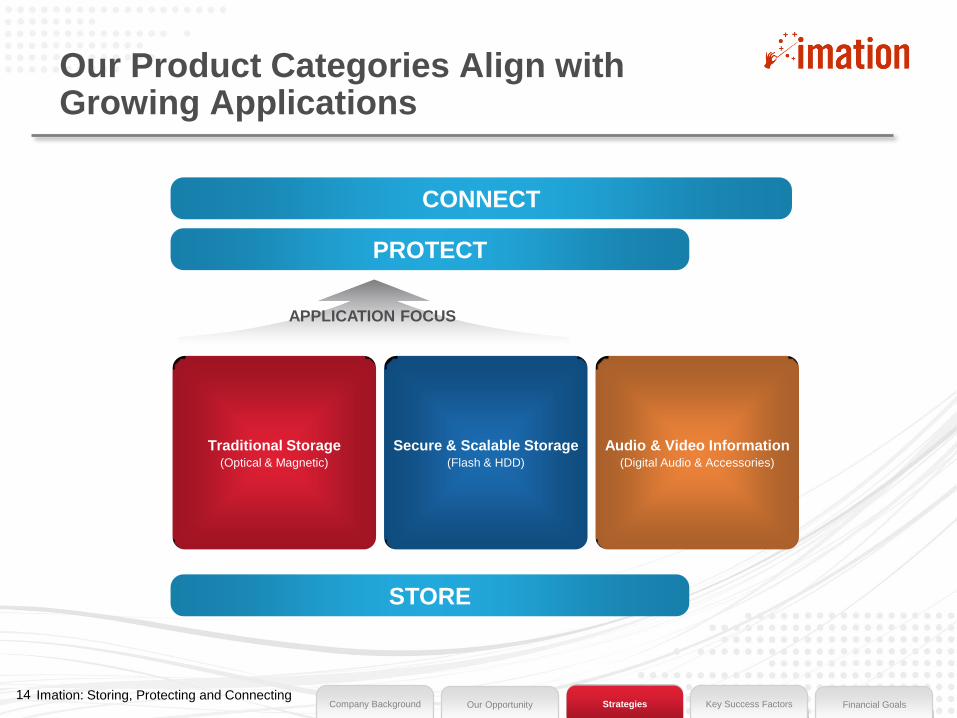
Traditional Storage (Optical & Magnetic)
Our Product Categories Align with Growing Applications
Secure & Scalable Storage (Flash & HDD)
Audio & Video Information (Digital Audio & Accessories)
CONNECT
PROTECT
STORE
APPLICATION FOCUS

Strategies Imation: Storing, Protecting and Connecting 15
Company Background Our Opportunity Key Success Factors Financial Goals
Traditional Storage (Optical & Magnetic)
Secure & Scalable Storage (Flash & HDD)
Audio & Video Information (Digital Audio & Accessories)
• Optimize profitability and cash
in declining markets
• Stabilize gross margins in
Optical in light of recent cost
volatility
• Continue multi-brand strategy
on both tape and optical
• Maintain market share position
• Invest organically and
inorganically
• Secure storage
• RDX
• Scalable storage
• Launch differentiated products
and rationalize low margin
businesses
• Focus on high margin
categories in digital audio and
accessories at mass merchants
and big-box retailers
• Direct resources primarily to
digital audio and accessories
We have three distinct product areas with three separate strategies
Declining Targeting rapid growth Targeting growth
Radically transform this segment by significantly growing both revenue and gross margin through a series of small/medium acquisitions
Generate cash and improve return on assets in Tape through a strategic partnership, and harvest the Optical business
Grow both revenue and gross margin through a continuation of our internal re-skilling efforts and focus on differentiation

Strategies Imation: Storing, Protecting and Connecting 16
Company Background Our Opportunity Key Success Factors Financial Goals
To execute on this direction and strategy, we need to change….
• Followed storage technology with our
media technology
• Sold removable data storage media
• “Took orders” for media
• Sold commoditized CE products
• Develops Data Storage Appliances
technology and products
• Develops security technology and products
• Sells solutions and services
• Develops and sells differentiated Audio
products and accessories
• Moves its center of gravity to Secure &
Scalable Storage
We are transforming from a
company that primarily: To a company that:

Strategies Imation: Storing, Protecting and Connecting 17
Company Background Our Opportunity Key Success Factors Financial Goals
Further expanding on Secure & Scalable Storage,
we have segments focused on Flash/Defender,
RDX/Appliances, and eventually Cloud
Future – Vision
Traditional
Storage
Audio & Video
Information Secure &
Scalable
Storage

Strategies Imation: Storing, Protecting and Connecting 18
Company Background Our Opportunity Key Success Factors Financial Goals Our Opportunity
Continued growth in revenue and margin
Strategies Key Success Factors Financial Goals

Strategies Imation: Storing, Protecting and Connecting 19
Company Background Our Opportunity Key Success Factors Financial Goals
2010/2011: Market Leadership in Mobile Security
Strategies Company Background Our Opportunity Key Success Factors Financial Goals

Strategies Imation: Storing, Protecting and Connecting 20
Company Background Our Opportunity Key Success Factors Financial Goals
Q2 11: A8 – First Imation Network Attached Storage Device
Strategies Company Background Our Opportunity Key Success Factors Financial Goals

Strategies Imation: Storing, Protecting and Connecting 21
Company Background Our Opportunity Key Success Factors Financial Goals
2012-2014
Continued organic and
inorganic growth
2012: DataGuard Data
Protection Appliances
Q3 11: InfiniVault Data Archive
Appliances (Global in Q2 12)
Strategies Company Background Our Opportunity Key Success Factors Financial Goals
Q4 11: Nine Technology
Deduplication IP Acquisition

Imation: Storing, Protecting and Connecting 22 Key Success Factors Company Background Our Opportunity Strategies Financial Goals
Company Background
Our Opportunity
Strategies
Key Success Factors
Financial Goals
Today’s Agenda

Imation: Storing, Protecting and Connecting 23 Key Success Factors Company Background Our Opportunity Strategies Financial Goals
Key Success Factors
Emerging technologies – Focus going forward
Recognized global brands
Customer and channel strength leveraging global footprint

Imation: Storing, Protecting and Connecting 24 Key Success Factors Company Background Our Opportunity Strategies Financial Goals
Strategy: Invest in Four Core Product Technologies
Scalable Storage (for SMB space)
– Data Reduction: De-duplication &
Compression
– RHDD Automation & Integrated NAS
Back-up
– Secure RHDD
– Cloud Connectivity
Magnetic Tape
– Partnering with TDK to develop future
multi-terabyte tape formats based on
Barium Ferrite technology
Secure Storage
– Authentication & Encryption
– Central Management Software
– New Standards: FIPS 140-3; Opal HDD
– Secure Portable Computing
– Digital Identity
Wireless/Connectivity
– Wireless Audio
– Wireless AV & Data

Imation: Storing, Protecting and Connecting 25 Key Success Factors Company Background Our Opportunity Strategies Financial Goals
Recognized Global Brands
Core Global Brands
Brands We Distribute:

Imation: Storing, Protecting and Connecting 26 Key Success Factors Company Background Our Opportunity Strategies Financial Goals
Customer and Channel Strength Leveraging Global Footprint
• Relationships with mass merchants, big box retailers, OEMs and VARs
• Facilities in over 35 countries and capabilities to reach customers in more than 100 countries

Imation: Storing, Protecting and Connecting 27 Financial Goals Company Background Our Opportunity Strategies Key Success Factors
Company Background
Our Opportunity
Strategies
Key Success Factors
Financial Goals
Today’s Agenda

Imation: Storing, Protecting and Connecting 28 Financial Goals Company Background Our Opportunity Strategies Key Success Factors
Our Financial Goals Goals Progress to Date
Returning to top-line growth by end
of 2012
Decline rates moderated in 2011
Q2 and Q3 2011 decline rates under 10 percent
Improving product gross margins
towards 20% through product
differentiation (average of 15% to
16%, before charges, in recent past)
Steady improvement in gross margins
All product categories at or above 15% in Q3
Driving results through organic and
inorganic investment
Organically investing $15 million in 2011 to drive future
operating margin improvements
Four acquisitions completed in 2011 – total cash
investment of $45 million
Increasing operating margins to the
4% to 5% level (average of 1%,
before charges, in recent past)
Investing today for improvements in future
Continuing to generate operating
cash flow
Generated $300 million in operating cash flows in FY
2008, 2009 and 2010
Present cash balance of $230 million as of 9/30/11
Thank you

Financial Appendix

Imation: Storing, Protecting and Connecting 31
Comparison of GAAP to Non-GAAP Financial Measures
This presentation contains Non-GAAP financial measurements which are provided to assist in understanding the impact of
certain items on Imation’s actual results of operations when compared with prior periods. Management believes this will assist
investors in making an evaluation of Imation’s performance against prior periods on a comparable basis by adjusting for these
items. Management understands that there are material limitations on the use of Non-GAAP measures. Non-GAAP measures
are not substitutes for GAAP measures for the purpose of analyzing financial performance. These Non-GAAP measures are not
in accordance with, or an alternative for measures prepared in accordance with, generally accepted accounting principles and
may be different from Non-GAAP measures used by other companies. In addition, these Non-GAAP measures are not based on
any comprehensive set of accounting rules or principles. This information should not be construed as an alternative to the
reported results, which have been determined in accordance with accounting principles generally accepted in the United States
of America.
Imation: Storing, Protecting and Connecting 32
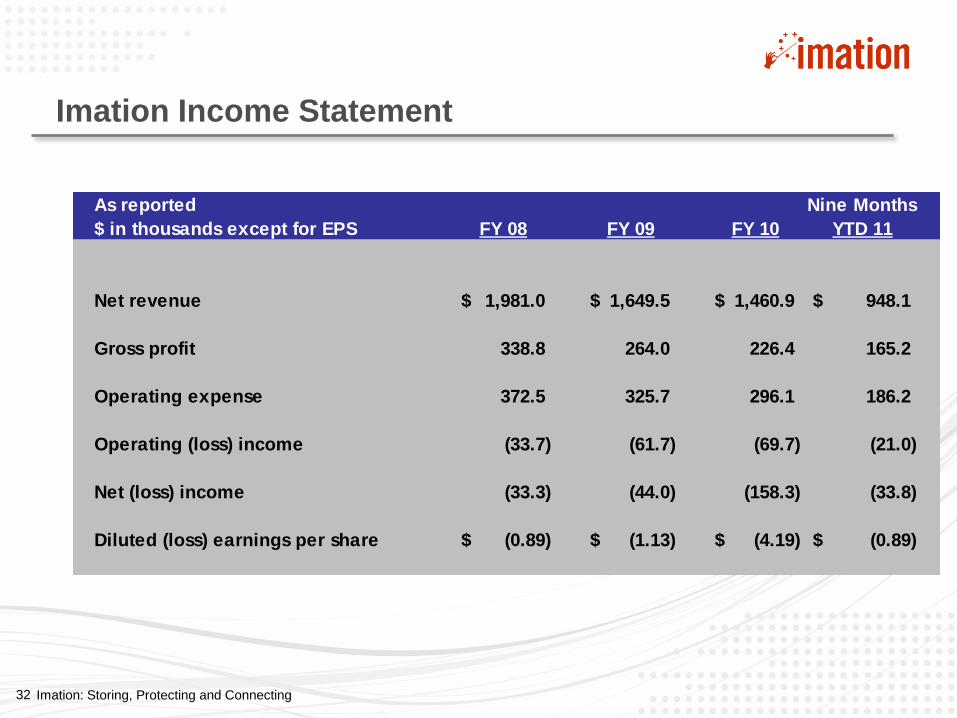
Imation Income Statement
As reported Nine Months
$ in thousands except for EPS FY 08 FY 09 FY 10 YTD 11
Net revenue 1,981.0$ 1,649.5$ 1,460.9$ 948.1$
Gross profit 338.8 264.0 226.4 165.2
Operating expense 372.5 325.7 296.1 186.2
Operating (loss) income (33.7) (61.7) (69.7) (21.0)
Net (loss) income (33.3) (44.0) (158.3) (33.8)
Diluted (loss) earnings per share (0.89)$ (1.13)$ (4.19)$ (0.89)$

Imation: Storing, Protecting and Connecting 33
Imation Income Statement
As reported Nine Months
$ in thousands except for EPS Q1 11 Q2 11 Q3 11 YTD 11
Net revenue 316.5$ 323.0$ 308.6$ 948.1$
Gross profit 54.0 54.0 57.2 165.2
Operating expense 57.4 63.3 65.5 186.2
Operating (loss) income (3.4) (9.3) (8.3) (21.0)
Net (loss) income (7.2) (12.5) (14.1) (33.8)
Diluted (loss) earnings per share (0.19)$ (0.33)$ (0.38)$ (0.89)$

Imation: Storing, Protecting and Connecting 34
Imation Non GAAP Income Statement
Note: See reconciliation of GAAP to Non GAAP Operating income (loss) in Appendix
Nine Months
$ in thousands except for EPS FY 08 FY 09 FY 10 YTD 11
Net revenue 1,981.0$ 1,649.5$ 1,460.9$ 948.1$
Gross profit 340.8 264.0 240.6 166.7
% of Net revenue 17.2% 16.0% 16.5% 17.6%
Operating expense 311.2 250.1 218.9 165.8
% of Net revenue 15.7% 15.2% 15.0% 17.5%
Operating (loss) income 29.6 13.9 21.7 0.9
% of Net revenue 1.5% 0.8% 1.5% 0.1%

Imation: Storing, Protecting and Connecting 35
Imation Non GAAP Income Statement
Note: See reconciliation of GAAP to Non GAAP Operating income (loss) in Appendix
Nine Months
$ in thousands Q1 11 Q2 11 Q3 11 YTD 11
Net revenue 316.5$ 323.0$ 308.6$ 948.1$
Gross profit 55.2 54.3 57.2 166.7
% of Net revenue 17.4% 16.8% 18.5% 17.6%
Operating expense 54.9 52.9 58.0 165.8
% of Net revenue 17.3% 16.4% 18.8% 17.5%
Operating (loss) income 0.3 1.4 (0.8) 0.9
% of Net revenue 0.1% 0.4% -0.3% 0.1%

Imation: Storing, Protecting and Connecting 36
Imation Balance Sheet
$ in thousands 2009 2010
Dec Dec Mar Jun Sept
Cash 163 305 286 258 233
Accounts receivable 315 259 225 220 212
Inventories 236 203 216 221 235
Other current assets 164 74 66 62 60
Total current assets 878 841 793 761 740
Property, plant and equipment 110 67 67 62 58
Goodwill 24 - - 22 22
Intangible assets 337 320 315 321 317
Other assets 45 23 23 24 26
Total assets 1,394 1,251 1,198 1,190 1,163
Accounts payable 201 219 206 201 201
Other current liabitiles 171 172 141 139 153
Total current liabilities 372 392 347 340 354
Other liabilities 95 78 71 79 75
Shareholders' equity 927 782 780 771 734
Total liabilities and shareholers' equity 1,394 1,251 1,198 1,190 1,163
2011

Imation: Storing, Protecting and Connecting 37
Imation Working Capital
79 74
60 59 59
(77)
786972
6969758498 101
575761 65 61
58 5958
(76)(64)(76)(72)(63)(51)(60)(62)(62) (72)
566460625556
648485
10497
-100
-50
0
50
100
150
200
Mar '09 Jun '09 Sep '09 Dec '09 Mar '10 Jun'10 Sep'10 Dec'10 Mar'11 Jun'11 Sep'11
0
20
40
60
80
100
120
Days of Inventory Supply Days Sales Outstanding Days of Payables Net Working Capital Days

Imation: Storing, Protecting and Connecting 38
Reconciliation of GAAP Operating Income (Loss) to
Adjusted Non-GAAP Operating Income (Loss)
Imation Operating Income
Nine Months
$ in thousands FY 08 FY 09 FY 10 YTD 11
As reported - GAAP (33.7)$ (61.7)$ (69.7)$ (21.0)$
Goodwill impairment 32.4 - 23.5 1.6
Inventory write-off included in COGS 2.0 - 14.2 1.5
Restructuring and other 28.9 26.6 51.1 16.8
Litigation settlement - 49.0 2.6 2.0
Adjusted - Non-GAAP 29.6$ 13.9$ 21.7$ 0.9$

Imation: Storing, Protecting and Connecting 39
Reconciliation of GAAP Operating Income (Loss) to
Adjusted Non-GAAP Operating Income (Loss)
Imation Operating Income
Nine Months
$ in thousands Q1 11 Q2 11 Q3 11 YTD 11
As reported - GAAP (3.4)$ (9.3)$ (8.3)$ (21.0)$
Goodwill impairment 1.6 - - 1.6
Inventroy write-offs included in COGS 1.2 0.3 - 1.5
Restructuring and other 0.9 10.4 5.5 16.8
Litigation settlement - - 2.0 2.0
Adjusted - Non-GAAP 0.3$ 1.4$ (0.8)$ 0.9$

Imation: Storing, Protecting and Connecting 40
0%
5%
10%
15%
20%
Q1
09
Q2
09
Q3
09
Q4
09
Q1
10
Q2
10
Q3
10
Q4
10
Q1
11
Q2
11
Q3
11
% t
o r
even
ue
Gross Margins
Gross margins have been stable to improving. Going forward, we need to
continue improving margins in our growth categories to move our Company
to 20%
Total Imation Long-
term Goal:
20%
Traditional
Goal: Stabilize
Secure &
Scalable Goal:
Upper teens%+
AVI Goal: 20%+