STOP HIV/AIDS Pilot Project - Together, we can stop HIV &...
99
STOP HIV/AIDS Pilot Project: 2012 (Q2) Indicators Report 1 STOP HIV/AIDS Pilot Project QUARTERLY INDICATORS REPORT: 1 April through 30 June 2012 (Q2) SUBMITTED TO: The BC Ministry of Health SUBMITTED BY: Dr. Mark Gilbert and Dr. Kate Heath On behalf of The STOP HIV/AIDS Technical (Indicators) Group CONTRIBUTORS: Teddy Consolacion, Sung Lee, Monika Lindegger, Stanley Wong, Amanda Yu, Nada Gataric, and Benita Yip VERSION DATE: July 20, 2012
-
Upload
hoangduong -
Category
Documents
-
view
216 -
download
0
Transcript of STOP HIV/AIDS Pilot Project - Together, we can stop HIV &...
STOP HIV/AIDS Pilot Project: 2012 (Q2) Indicators Report
1
STOP HIV/AIDS Pilot Project QUARTERLY INDICATORS REPORT: 1 April through 30 June 2012 (Q2) SUBMITTED TO: The BC Ministry of Health SUBMITTED BY: Dr. Mark Gilbert and Dr. Kate Heath On behalf of The STOP HIV/AIDS Technical (Indicators) Group CONTRIBUTORS: Teddy Consolacion, Sung Lee, Monika Lindegger, Stanley Wong, Amanda Yu, Nada Gataric, and Benita Yip
VERSION DATE: July 20, 2012

STOP HIV/AIDS Pilot Project: 2012 (Q2) Indicators Report 2
Contact Information Irene Day STOP HIV/AIDS Leadership Committee Co-Chair Director of Operations, BC Centre for Excellence in HIV/AIDS (604) 806-8202 [email protected] 613-1081 Burrard Street Vancouver, BC, V6Z 1Y6 Reka Gustafson STOP HIV/AIDS Leadership Committee Co-Chair Medical Health Officer and Medical Director of Communicable Disease Control Vancouver Coastal Health (604) 675-3925 [email protected] 800-601 West Broadway Vancouver, BC, V5Z 4C2

STOP HIV/AIDS Pilot Project: 2012 (Q2) Indicators Report 3
Table of Contents Introduction .................................................................................................................................................. 4 Indicator 1: Number of HIV tests .................................................................................................................... 6 Indicator 2: Population HIV testing rate ........................................................................................................... 9 Indicator 3: Number of new HIV diagnoses .................................................................................................... 12 Indicator 4: Rate of new AIDS case reports ................................................................................................... 15 Indicator 5: Percentage positivity among persons tested for HIV ..................................................................... 17 Indicator 6a: Proportion of individuals tested for syphilis who are tested for HIV at the same clinical encounter . 19 Indicator 6b: Proportion of individuals with a new STI diagnosis who are tested for HIV within three months of STI diagnosis ……….…………………………………………………………………………………………………………………………………….22 Indicator 7: Proportion of individuals with a new HCV diagnosis who are tested for HIV within three months of HCV diagnosis ............................................................................................................................................... 25 Indicator 9: Proportion of individuals with a new HIV diagnosis with advanced HIV disease .............................. 28 Indicator 11: Proportion of individuals with a new HIV diagnosis with acute HIV infection ................................. 31 Indicator 14: Proportion of individuals starting antiretroviral therapy (ART) late in the course of HIV disease ..... 34
Indicator 18: Proportion of individuals with a new HIV diagnosis who are tested for syphilis within three months of HIV diagnosis ............................................................................................................................................. 36 Indicator 21: Percentage of HIV-infected individuals who are tested for genotypic antiretroviral drug resistance prior to starting antiretroviral therapy (ART) ..................................................................................................... 39 Indicator 22: Percentage of individuals starting antiretroviral therapy (ART) who achieve HIV plasma viral load (pVL) of <200 copies/mL within nine months of therapy initiation ...................................................................... 41 Indicator 23: Percentage of individuals who initiated antiretroviral therapy (ART) with a recommended therapy regimen (among those with no drug resistance) ............................................................................................... 44 Indicator 24: Percentage of individuals on antiretroviral therapy (ART) that achieve annual prescription refill adherence of >95% ....................................................................................................................................... 47 Indicator 25: Number of physicians initiating therapy or providing HIV-related care to patients on antiretroviral therapy (ART) ................................................................................................................................................ 49 Indicator 26: Percentage of individuals on antiretroviral therapy (ART) who experience a serious adverse drug reaction (ADR) ............................................................................................................................................... 51 Indicator 28: Incidence of resistance to any retroviral drug ............................................................................ 54 Indicator 29: Proportion of individuals on antiretroviral therapy who change antiretroviral drug treatment ......... 56 Data Tables ................................................................................................................................................. 58 Appendix A: List of Indicators ....................................................................................................................... 98
STOP HIV/AIDS Pilot Project: 2012 (Q2) Indicators Report 4
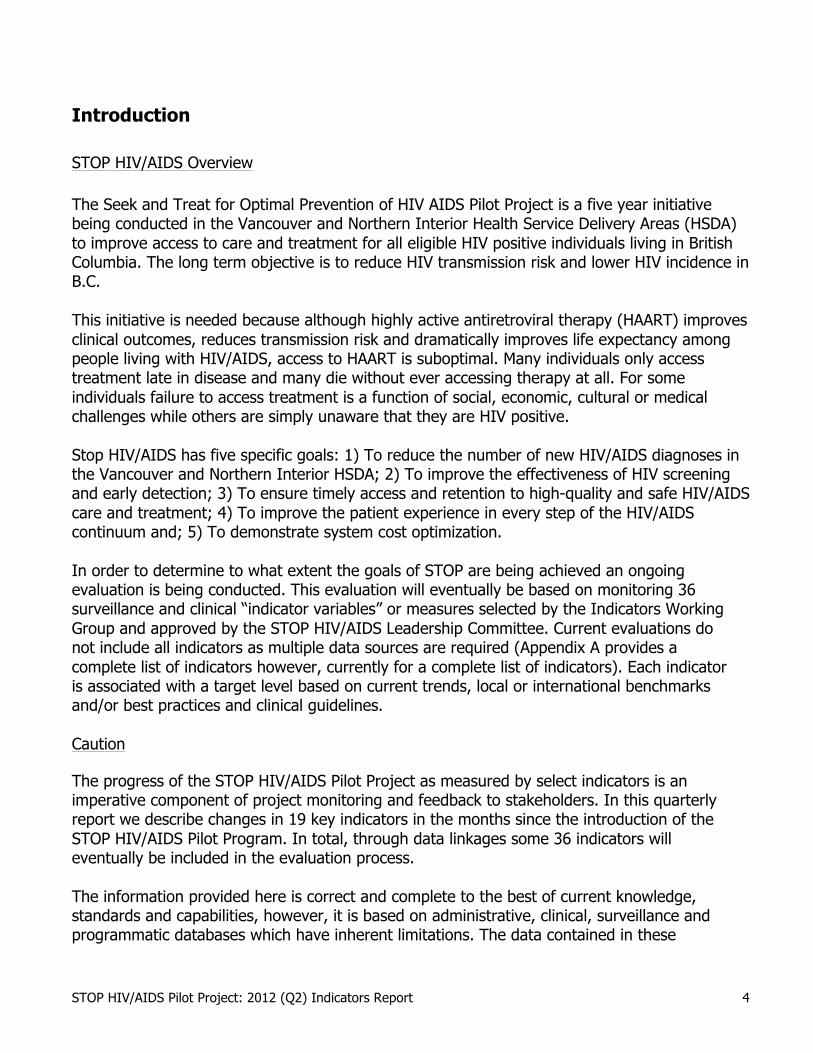
Introduction STOP HIV/AIDS Overview The Seek and Treat for Optimal Prevention of HIV AIDS Pilot Project is a five year initiative being conducted in the Vancouver and Northern Interior Health Service Delivery Areas (HSDA) to improve access to care and treatment for all eligible HIV positive individuals living in British Columbia. The long term objective is to reduce HIV transmission risk and lower HIV incidence in B.C. This initiative is needed because although highly active antiretroviral therapy (HAART) improves clinical outcomes, reduces transmission risk and dramatically improves life expectancy among people living with HIV/AIDS, access to HAART is suboptimal. Many individuals only access treatment late in disease and many die without ever accessing therapy at all. For some individuals failure to access treatment is a function of social, economic, cultural or medical challenges while others are simply unaware that they are HIV positive. Stop HIV/AIDS has five specific goals: 1) To reduce the number of new HIV/AIDS diagnoses in the Vancouver and Northern Interior HSDA; 2) To improve the effectiveness of HIV screening and early detection; 3) To ensure timely access and retention to high-quality and safe HIV/AIDS care and treatment; 4) To improve the patient experience in every step of the HIV/AIDS continuum and; 5) To demonstrate system cost optimization. In order to determine to what extent the goals of STOP are being achieved an ongoing evaluation is being conducted. This evaluation will eventually be based on monitoring 36 surveillance and clinical “indicator variables” or measures selected by the Indicators Working Group and approved by the STOP HIV/AIDS Leadership Committee. Current evaluations do not include all indicators as multiple data sources are required (Appendix A provides a complete list of indicators however, currently for a complete list of indicators). Each indicator is associated with a target level based on current trends, local or international benchmarks and/or best practices and clinical guidelines. Caution The progress of the STOP HIV/AIDS Pilot Project as measured by select indicators is an imperative component of project monitoring and feedback to stakeholders. In this quarterly report we describe changes in 19 key indicators in the months since the introduction of the STOP HIV/AIDS Pilot Program. In total, through data linkages some 36 indicators will eventually be included in the evaluation process. The information provided here is correct and complete to the best of current knowledge, standards and capabilities, however, it is based on administrative, clinical, surveillance and programmatic databases which have inherent limitations. The data contained in these
STOP HIV/AIDS Pilot Project: 2012 (Q2) Indicators Report 5
databases were not originally collected for the purpose for which they are now being used and limitations arise directly from their originally intended purpose. Therefore, while each database is rich in information for select utilizations, these data should comprise only one component of our efforts to inform service delivery and policy decision-making. We are continuing to refine our analyses to improve the quality of these indicators. This may result in small changes in the magnitude of these indicators between subsequent reports. These changes to methods are documented and accompany each indicator. It is important to proceed with caution when interpreting trends over the short term as they are presented here. Some indicators exhibit considerable variation from one reporting period to the next. This is particularly true of estimates made for the Northern Interior Health Service Delivery Area where statistics may be based on extremely small numbers allowing for particular instability in estimates. Only by review of longer-term temporal trends (including consideration of pre-pilot fluctuations) can a complete evaluation of the direction, stability and possible future progress of each trend be evaluated. It is also important to acknowledge the inherent difficulty in ascribing changes in indicators directly to the STOP HIV/AIDS initiative given the complex, rapidly progressing nature of HIV-related care, research and service delivery in the context of a dynamic health care and data-collection systems. Despite inherent limitations of currently available data, continual refinement of indicators and reporting strategies in conjunction with planned assessment of other data sources, integration of existing extensive datasets, and triangulation of variables will be used to construct a robust scientific platform. In this context, the observation and analyses of long-term trends will provide a powerful, complete, and accurate evaluation of the STOP HIV/AIDS Pilot Project.

STOP HIV/AIDS Pilot Project: 2012 (Q2) Indicators Report 6
Indicator 1: Number of HIV test episodes
Target: Increase by 50%
Actual: VAN: 22,512 testing episodes in 2012 Q2 NI: 1,583 testing episodes in 2012 Q2
Figure 1.1 Number of HIV test episodes by HSDA
Figure 1.2 Number of HIV test episodes by HSDA – Males
STOP HIV/AIDS Pilot Project: 2012 (Q2) Indicators Report 7
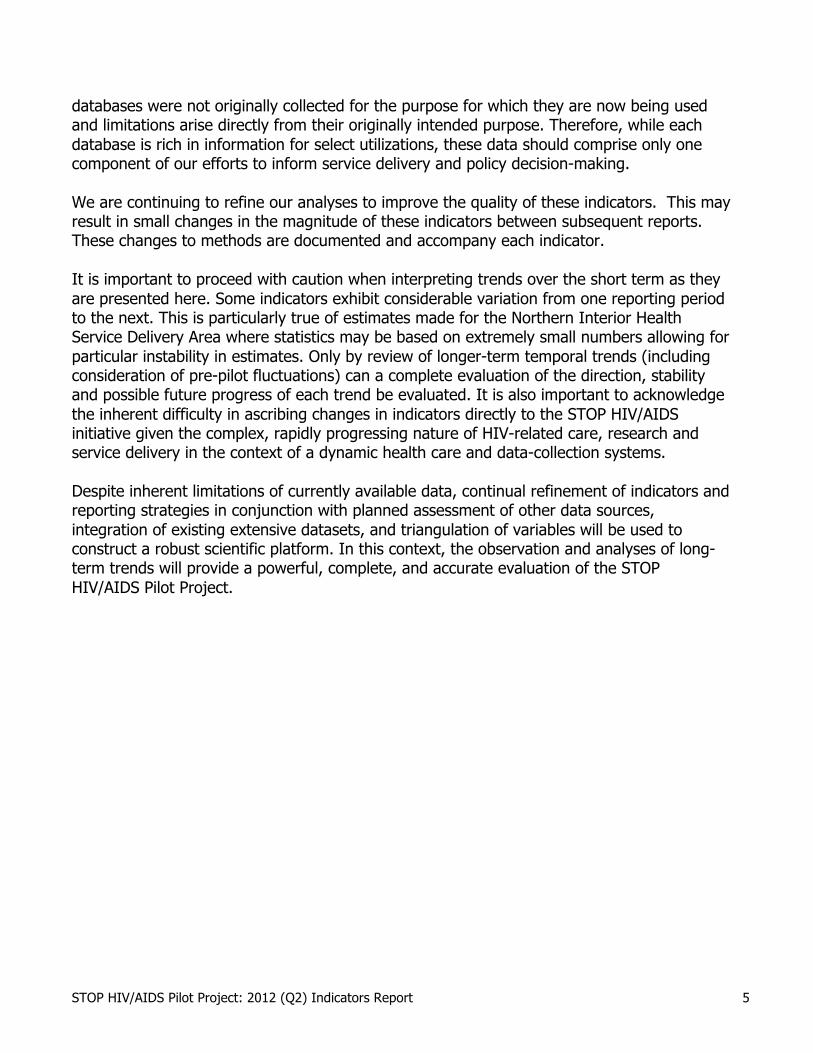
Figure 1.3 Number of HIV test episodes by HSDA – Females
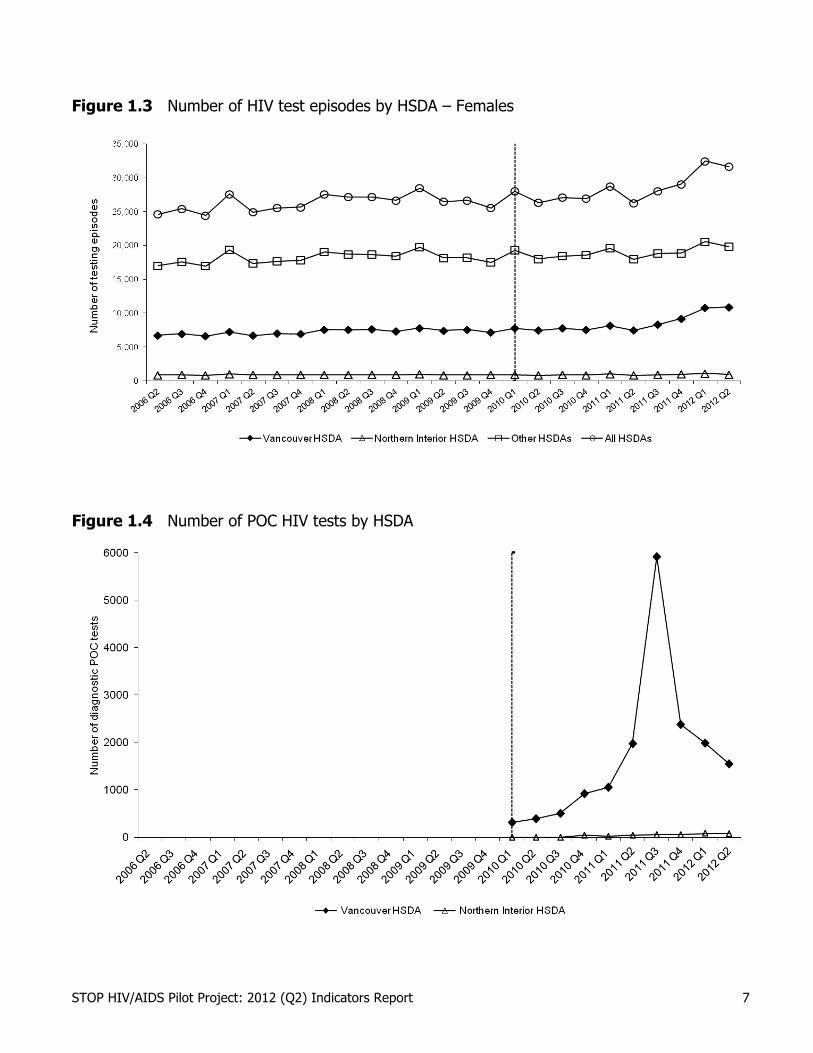
Figure 1.4 Number of POC HIV tests by HSDA
STOP HIV/AIDS Pilot Project: 2012 (Q2) Indicators Report 8
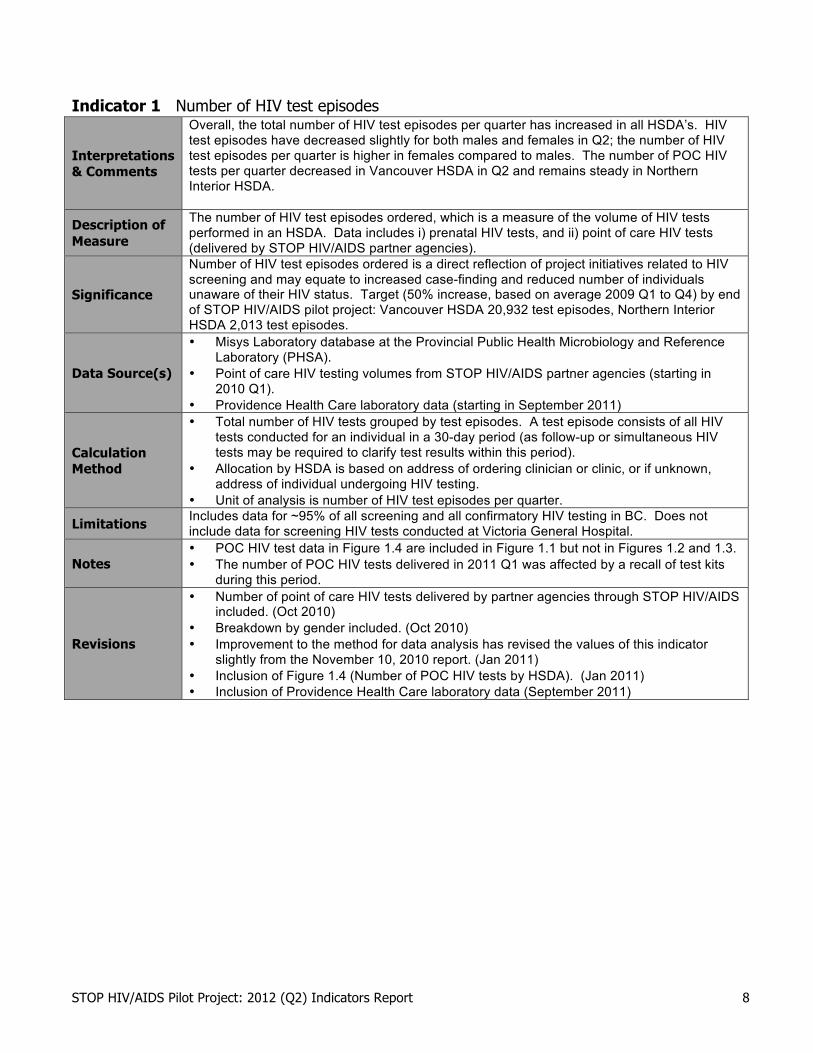
Indicator 1 Number of HIV test episodes
Interpretations & Comments
Overall, the total number of HIV test episodes per quarter has increased in all HSDA’s. HIV test episodes have decreased slightly for both males and females in Q2; the number of HIV test episodes per quarter is higher in females compared to males. The number of POC HIV tests per quarter decreased in Vancouver HSDA in Q2 and remains steady in Northern Interior HSDA.
Description of Measure
The number of HIV test episodes ordered, which is a measure of the volume of HIV tests performed in an HSDA. Data includes i) prenatal HIV tests, and ii) point of care HIV tests (delivered by STOP HIV/AIDS partner agencies).
Significance
Number of HIV test episodes ordered is a direct reflection of project initiatives related to HIV screening and may equate to increased case-finding and reduced number of individuals unaware of their HIV status. Target (50% increase, based on average 2009 Q1 to Q4) by end of STOP HIV/AIDS pilot project: Vancouver HSDA 20,932 test episodes, Northern Interior HSDA 2,013 test episodes.
Data Source(s)
• Misys Laboratory database at the Provincial Public Health Microbiology and Reference Laboratory (PHSA).
• Point of care HIV testing volumes from STOP HIV/AIDS partner agencies (starting in 2010 Q1).
• Providence Health Care laboratory data (starting in September 2011)
Calculation Method
• Total number of HIV tests grouped by test episodes. A test episode consists of all HIV tests conducted for an individual in a 30-day period (as follow-up or simultaneous HIV tests may be required to clarify test results within this period).
• Allocation by HSDA is based on address of ordering clinician or clinic, or if unknown, address of individual undergoing HIV testing.
• Unit of analysis is number of HIV test episodes per quarter.
Limitations Includes data for ~95% of all screening and all confirmatory HIV testing in BC. Does not include data for screening HIV tests conducted at Victoria General Hospital.
Notes • POC HIV test data in Figure 1.4 are included in Figure 1.1 but not in Figures 1.2 and 1.3. • The number of POC HIV tests delivered in 2011 Q1 was affected by a recall of test kits
during this period.
Revisions
• Number of point of care HIV tests delivered by partner agencies through STOP HIV/AIDS included. (Oct 2010)
• Breakdown by gender included. (Oct 2010) • Improvement to the method for data analysis has revised the values of this indicator
slightly from the November 10, 2010 report. (Jan 2011) • Inclusion of Figure 1.4 (Number of POC HIV tests by HSDA). (Jan 2011) • Inclusion of Providence Health Care laboratory data (September 2011)

STOP HIV/AIDS Pilot Project: 2012 (Q2) Indicators Report 9
Indicator 2: Population HIV testing rates
Target: Increase by 50%
Actual: VAN: 6,965.0 per 100,000 in 2011 NI: 3,641.4 per 100,000 in 2011
Figure 2.1 Population HIV testing rate by HSDA
0
2,000
4,000
6,000
8,000
10,000
2006 2007 2008 2009 2010 2011
Rat
e pe
r 100
,000
pop
ulat
ion
Vancouver HSDA Northern Interior HSDA Other HSDAs All HSDAs
Figure 2.2 Population HIV testing rate by HSDA – Males
0
2,000
4,000
6,000
8,000
10,000
2006 2007 2008 2009 2010 2011
Rat
e pe
r 100
,000
pop
ulat
ion
Vancouver HSDA Northern Interior HSDA Other HSDAs All HSDAs

STOP HIV/AIDS Pilot Project: 2012 (Q2) Indicators Report 10
Figure 2.3 Population HIV testing rate by HSDA – Females
0
2,000
4,000
6,000
8,000
10,000
2006 2007 2008 2009 2010 2011
Rat
e pe
r 100
,000
pop
ulat
ion
Vancouver HSDA Northern Interior HSDA Other HSDAs All HSDAs

STOP HIV/AIDS Pilot Project: 2012 (Q2) Indicators Report 11
Indicator 2 Population HIV testing rates
Interpretations & Comments
In 2011, the population HIV testing rate in Vancouver HSDA has increased above historical trends; Northern Interior HSDA and other HSDAs remain within historic trends. Similar trends are observed for both males and females; the HIV testing rate is higher in females compared to males.
Description of Measure
Annual population rate of unique individuals tested for HIV.
Significance
Number of individuals tested for HIV is a direct reflection of project initiatives related to HIV screening and may equate to increased case-finding and reduced number of individuals unaware of their HIV status. Target (50% increase, based on 2009 rate) by end of STOP HIV/AIDS pilot project: Vancouver HSDA 9,722 persons tested per 100,000 population, Northern Interior HSDA 5,264 persons tested per 100,000 population.
Data Source(s) Misys Laboratory database at the Provincial Public Health Microbiology and Reference Laboratory (PHSA).
Calculation Method
• Probabilistic matching of identifiers is conducted to identify individuals having greater than one HIV test in the same year.
• Denominator: Population of HSDA • Numerator: Number of unique individuals tested for HIV • Allocation by HSDA is based on address of individual undergoing HIV testing, or if
unknown, address of ordering clinician or clinic. • Unit of analysis is rate of individuals tested for HIV per 100,000 population per year.
Limitations
• As per Indicator 1. Repeat tests in individuals who test under different identifiers (e.g., initials, pseudonyms, non-nominally) may not be identified and these individuals may be counted more than once.
• Indicator #2 does not include POC test volumes or Providence Health Care laboratory data and therefore cannot be compared to trends in Indicator #1
• This indicator is limited to annual reporting as if examined on a quarterly basis one does not see a big difference from the number of HIV test episodes per quarter (as repeat HIV testing is unlikely within smaller time periods).
Notes
Would be difficult to include POC HIV test data and data from other labs in this analysis, as this would require full sharing of identifying in order to link to testing done at the Provincial Public Health Microbiology and Reference Laboratory and identify unique individuals. Total number of HIV test episodes (Indicator 1) may be preferable.
Revisions • Breakdown by gender included. (Oct 2010) • Improvement to the method for data analysis has revised the values of this indicator
slightly from the November 10, 2010 report. (Jan 2011)
STOP HIV/AIDS Pilot Project: 2012 (Q2) Indicators Report 12
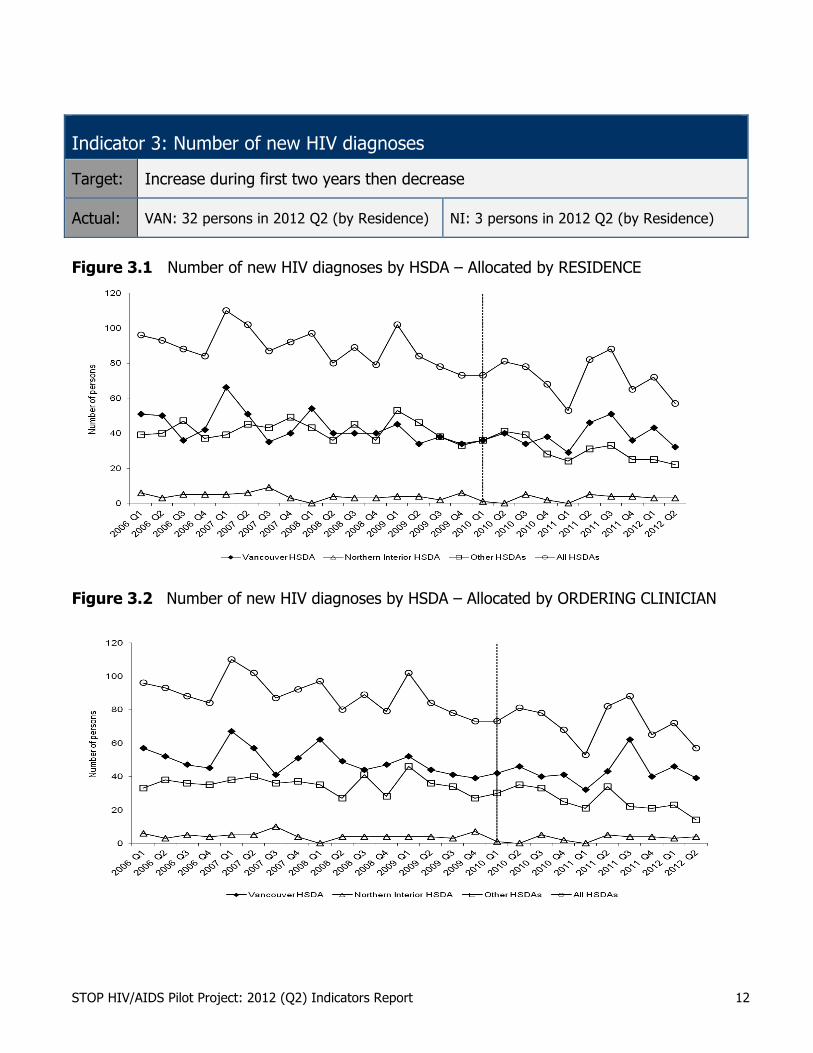
Indicator 3: Number of new HIV diagnoses
Target: Increase during first two years then decrease
Actual: VAN: 32 persons in 2012 Q2 (by Residence) NI: 3 persons in 2012 Q2 (by Residence)
Figure 3.1 Number of new HIV diagnoses by HSDA – Allocated by RESIDENCE
Figure 3.2 Number of new HIV diagnoses by HSDA – Allocated by ORDERING CLINICIAN
STOP HIV/AIDS Pilot Project: 2012 (Q2) Indicators Report 13
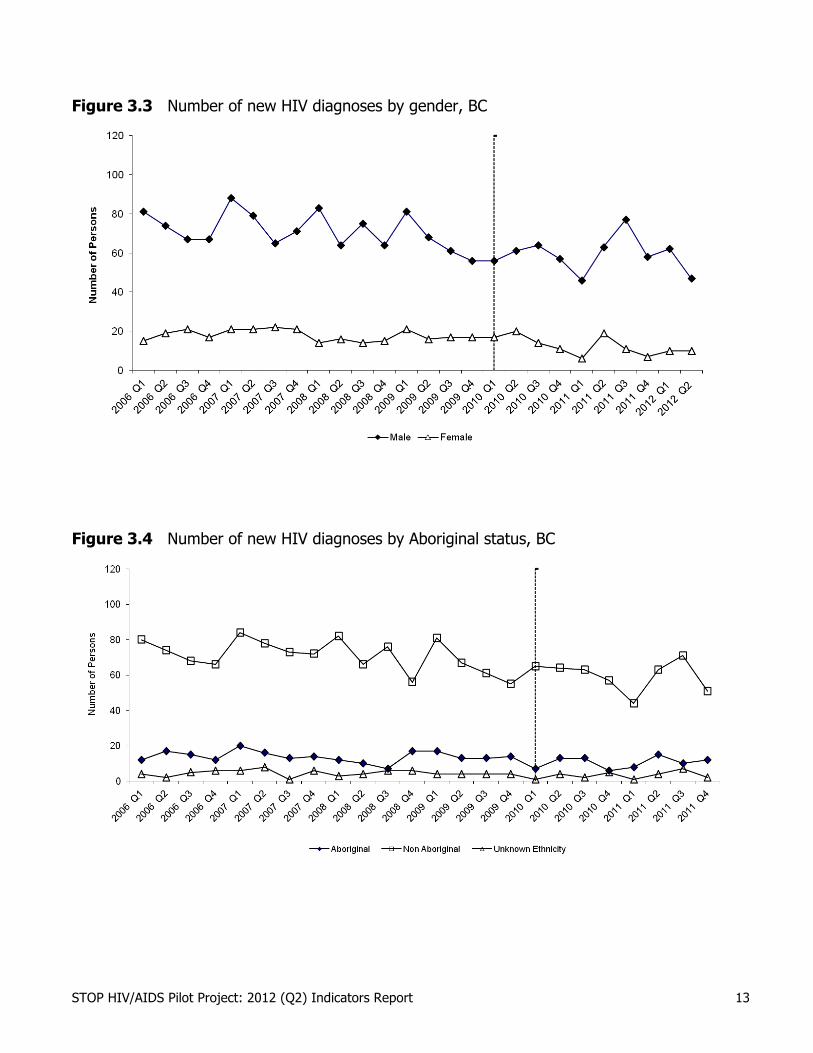
Figure 3.3 Number of new HIV diagnoses by gender, BC
Figure 3.4 Number of new HIV diagnoses by Aboriginal status, BC
STOP HIV/AIDS Pilot Project: 2012 (Q2) Indicators Report 14
Indicator 3 Number of new HIV diagnoses
1 For HIV case definition, refer to Annual Surveillance Report: HIV and Sexually Transmitted Infections 2008, BCCDC
(Technical Appendix).
Interpretations & Comments
Allocation by Residence: The number of new HIV diagnoses per quarter in Vancouver HSDA decreased in 2012 Q2 and remained steady in Northern Interior HSDA. In other HSDAs, the number of new diagnoses has decreased. In Q2 there was a decrease in the number of new diagnosis in BC for males yet females remained steady. The number of new HIV diagnoses in Aboriginal people is stable.
Description of Measure
Number of individuals identified with a new diagnosis of HIV (i.e., a new positive HIV test).
Significance
The number of individuals identified with a new HIV diagnosis may be influenced by initiatives to expand HIV screening (resulting in increased case-finding and an increase in new diagnoses - may be observed during initial implementation of screening initiatives) and decreases in HIV incidence as a result of expanded HAART which would result in a decrease in new HIV diagnoses.
Data Source(s) Provincial HIV/AIDS surveillance database at BCCDC.
Calculation Method
• On receipt of a positive HIV test result, history of previous HIV testing is elicited from provincial databases or during public health follow-up. An individual identified with a new positive HIV test in BC is included (individuals with a previous positive HIV test inside or outside BC are excluded).1
• Allocation by HSDA is done two ways: • Figure 3.1: by Residence - based on address of individual with new HIV diagnosis, or
if unknown, address of ordering clinician or clinic. • Figure 3.2: by Ordering Clinician – based on address of ordering clinician or clinic, or
if unknown, by address of individual with new HIV diagnosis • Unit of analysis is number of new diagnoses of HIV per quarter.
Limitations
• This indicator is not a measure of HIV incidence (number of newly acquired HIV infections) within each time period, as an individual can be diagnosed with HIV at varying lengths of time after acquiring infection (months to years).
• May be difficult to interpret trends given influence of both HIV testing trends and HIV incidence on this variable.
• In Northern Interior HSDA, there will be greater variability for this indicator due to small numbers making trends more difficult to interpret.
• Ethnicity is elicited during public health follow up and there is an expected reporting delay of 6 months
Notes
• In comparing indicator reports, the number of new HIV diagnoses for the most recent quarters may decrease. This is an expected finding as during public health follow-up, individuals identified as a new HIV diagnosis are found to have previously tested positive (e.g., in another province).
• The number of new HIV diagnoses allocated by Ordering Physician may more accurately represent new HIV diagnoses that occur through HIV testing services within each region (e.g., residents of FHA who test and are diagnosed through VCH services are allocated to VCH HSDA).
Revisions • Breakdown by gender included. (Oct 2010) • Addition of allocation to HSDA by Ordering Clinician (Fig 3.2). (Jan 2011) • Breakdown by Aboriginal status included. (June 2011)
STOP HIV/AIDS Pilot Project: 2012 (Q2) Indicators Report 15
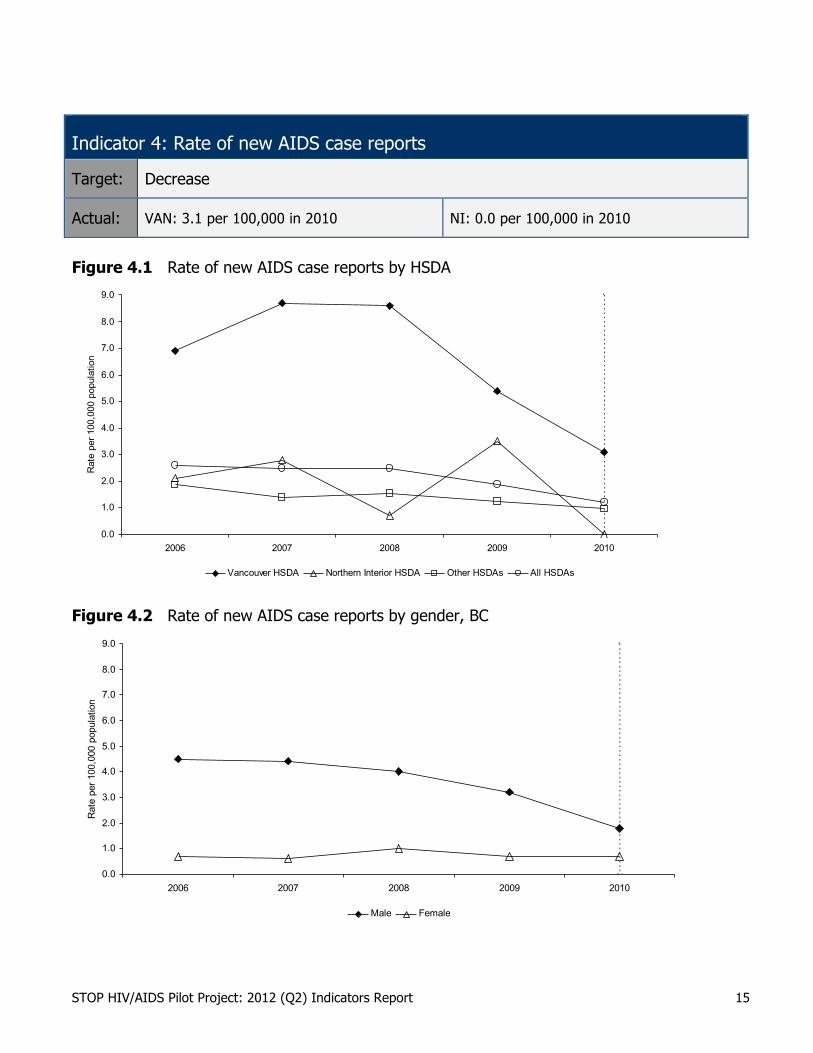
Indicator 4: Rate of new AIDS case reports
Target: Decrease
Actual: VAN: 3.1 per 100,000 in 2010 NI: 0.0 per 100,000 in 2010
Figure 4.1 Rate of new AIDS case reports by HSDA
0.0
1.0
2.0
3.0
4.0
5.0
6.0
7.0
8.0
9.0
2006 2007 2008 2009 2010
Rat
e pe
r 100
,000
pop
ulat
ion
Vancouver HSDA Northern Interior HSDA Other HSDAs All HSDAs
Figure 4.2 Rate of new AIDS case reports by gender, BC
0.0
1.0
2.0
3.0
4.0
5.0
6.0
7.0
8.0
9.0
2006 2007 2008 2009 2010
Rat
e pe
r 100
,000
pop
ulat
ion
Male Female
STOP HIV/AIDS Pilot Project: 2012 (Q2) Indicators Report 16
Indicator 4 Rate of new AIDS case reports
2 For AIDS case definition, refer to Annual Surveillance Report: HIV and Sexually Transmitted Infections 2008, BCCDC (Technical Appendix).
Interpretations & Comments
In 2010, the rate of new AIDS case reports decreased in all HSDA’s. The rate of new AIDS case reports in 2009 decreased for males and remained steady in females.
Description of Measure
The rate of individuals with an AIDS case report, which indicates the first diagnosis of an AIDS defining illness in an individual with HIV infection.
Significance Presentation with an AIDS defining illness may indicate delayed diagnosis of HIV, delays in initiation of HAART or sub-optimal management of HAART.
Data Source(s) • Provincial HIV/AIDS surveillance database at BCCDC. • The majority of AIDS case reports are reported by the Drug Treatment Program (DTP) at
the BC CfE, which submits data twice yearly to BCCDC.
Calculation Method
• Multiple AIDS case report forms may be submitted for the same individual; only the first case report form is included in the rate of new AIDS case reports.2
• Denominator: Population of HSDA • Numerator: Number of individuals with an AIDS case report • Allocation by HSDA is based on address of the individual with an AIDS case report at the
time of reporting, or if unknown, address of clinician or clinic completing the AIDS case report form.
• Unit of analysis is the rate of new AIDS case reports per 100,000 population per year.
Limitations
• In BC, AIDS surveillance is based on passive reporting initiated by care providers, and under-reporting is likely. There is an expected reporting delay of up to 12 months and this indicator will only be generated at the end of the following calendar year (i.e., data for 2010 will be available in January 2012).
• In Northern Interior HSDA, there will be greater variability for this indicator due to small numbers making trends more difficult to interpret.
Notes
In 2010, the BCCfE as part of routine program activities received historic data on cancer-related outcomes from the BC Cancer Agency for DTP participants. New AIDS diagnoses for DTP participants occurring in the past were identified and reported to BCCDC. The number of new AIDS case reports per year has increased slightly from previous reports as a result.
Revisions • Breakdown by gender included. (Oct 2010)

STOP HIV/AIDS Pilot Project: 2012 (Q2) Indicators Report 17
Indicator 5: Percentage positivity among persons tested for HIV
Target Increase from 0.4 to 0.8 percent
Actual VAN: 0.26% in 20112 Q2 NI: 0.40% in 2012 Q2
Figure 5.1 Percentage positivity among persons tested for HIV by HSDA
Figure 5.2 Percentage positivity among persons tested for HIV, by gender, BC
STOP HIV/AIDS Pilot Project: 2012 (Q2) Indicators Report 18
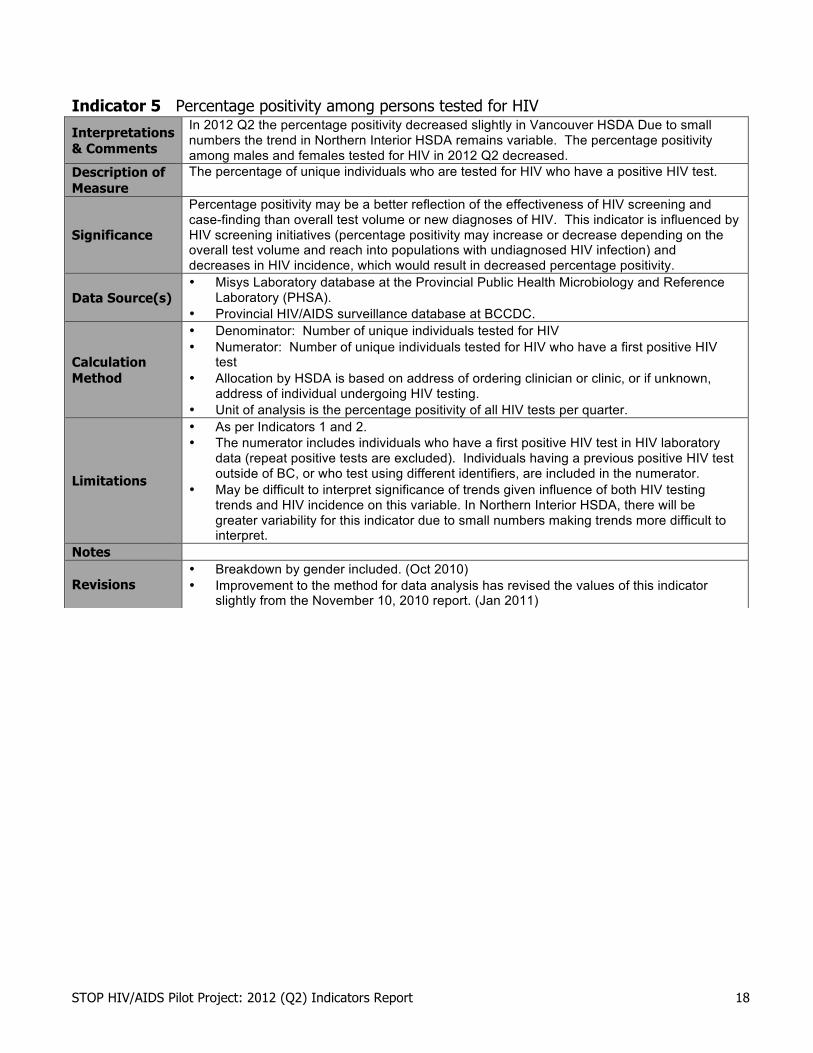
Indicator 5 Percentage positivity among persons tested for HIV
Interpretations & Comments
In 2012 Q2 the percentage positivity decreased slightly in Vancouver HSDA Due to small numbers the trend in Northern Interior HSDA remains variable. The percentage positivity among males and females tested for HIV in 2012 Q2 decreased.
Description of Measure
The percentage of unique individuals who are tested for HIV who have a positive HIV test.
Significance
Percentage positivity may be a better reflection of the effectiveness of HIV screening and case-finding than overall test volume or new diagnoses of HIV. This indicator is influenced by HIV screening initiatives (percentage positivity may increase or decrease depending on the overall test volume and reach into populations with undiagnosed HIV infection) and decreases in HIV incidence, which would result in decreased percentage positivity.
Data Source(s) • Misys Laboratory database at the Provincial Public Health Microbiology and Reference
Laboratory (PHSA). • Provincial HIV/AIDS surveillance database at BCCDC.
Calculation Method
• Denominator: Number of unique individuals tested for HIV • Numerator: Number of unique individuals tested for HIV who have a first positive HIV
test • Allocation by HSDA is based on address of ordering clinician or clinic, or if unknown,
address of individual undergoing HIV testing. • Unit of analysis is the percentage positivity of all HIV tests per quarter.
Limitations
• As per Indicators 1 and 2. • The numerator includes individuals who have a first positive HIV test in HIV laboratory
data (repeat positive tests are excluded). Individuals having a previous positive HIV test outside of BC, or who test using different identifiers, are included in the numerator.
• May be difficult to interpret significance of trends given influence of both HIV testing trends and HIV incidence on this variable. In Northern Interior HSDA, there will be greater variability for this indicator due to small numbers making trends more difficult to interpret.
Notes
Revisions • Breakdown by gender included. (Oct 2010) • Improvement to the method for data analysis has revised the values of this indicator
slightly from the November 10, 2010 report. (Jan 2011)

STOP HIV/AIDS Pilot Project: 2012 (Q2) Indicators Report 19
Indicator 6a: Proportion of individuals tested for syphilis who are tested for HIV at the same clinical encounter
Target: Increase
Actual: VAN: 80.4% in 2012 Q2 NI: 85.5% in 2012 Q2 Figure 6a.1 Proportion of individuals tested for syphilis who are tested for HIV at the same
clinical encounter by HSDA
Figure 6a.2 Proportion of individuals tested for syphilis who are tested for HIV at the same
clinical encounter by HSDA – Males

STOP HIV/AIDS Pilot Project: 2012 (Q2) Indicators Report 20
Figure 6a.3 Proportion of individuals tested for syphilis who are tested for HIV at the same clinical encounter by HSDA – Females
STOP HIV/AIDS Pilot Project: 2012 (Q2) Indicators Report 21
Indicator 6a Proportion of individuals tested for syphilis who are tested for HIV at the same
clinical encounter
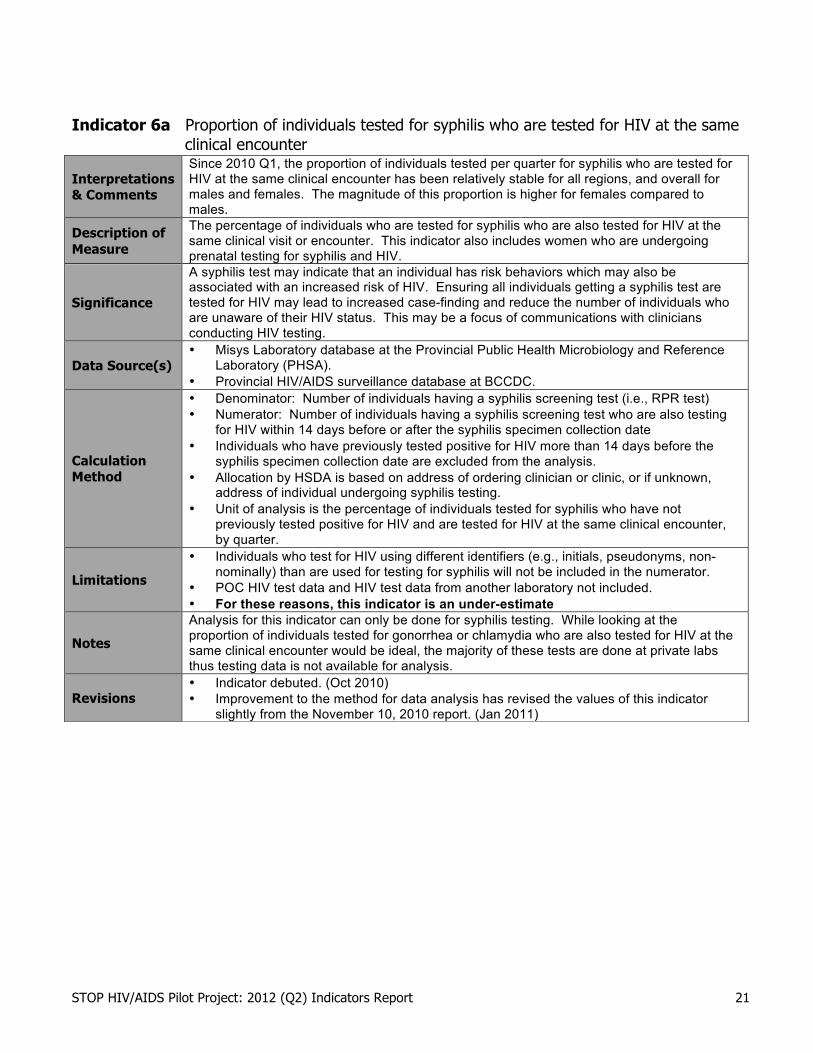
Interpretations & Comments
Since 2010 Q1, the proportion of individuals tested per quarter for syphilis who are tested for HIV at the same clinical encounter has been relatively stable for all regions, and overall for males and females. The magnitude of this proportion is higher for females compared to males.
Description of Measure
The percentage of individuals who are tested for syphilis who are also tested for HIV at the same clinical visit or encounter. This indicator also includes women who are undergoing prenatal testing for syphilis and HIV.
Significance
A syphilis test may indicate that an individual has risk behaviors which may also be associated with an increased risk of HIV. Ensuring all individuals getting a syphilis test are tested for HIV may lead to increased case-finding and reduce the number of individuals who are unaware of their HIV status. This may be a focus of communications with clinicians conducting HIV testing.
Data Source(s) • Misys Laboratory database at the Provincial Public Health Microbiology and Reference
Laboratory (PHSA). • Provincial HIV/AIDS surveillance database at BCCDC.
Calculation Method
• Denominator: Number of individuals having a syphilis screening test (i.e., RPR test) • Numerator: Number of individuals having a syphilis screening test who are also testing
for HIV within 14 days before or after the syphilis specimen collection date • Individuals who have previously tested positive for HIV more than 14 days before the
syphilis specimen collection date are excluded from the analysis. • Allocation by HSDA is based on address of ordering clinician or clinic, or if unknown,
address of individual undergoing syphilis testing. • Unit of analysis is the percentage of individuals tested for syphilis who have not
previously tested positive for HIV and are tested for HIV at the same clinical encounter, by quarter.
Limitations
• Individuals who test for HIV using different identifiers (e.g., initials, pseudonyms, non-nominally) than are used for testing for syphilis will not be included in the numerator.
• POC HIV test data and HIV test data from another laboratory not included. • For these reasons, this indicator is an under-estimate
Notes
Analysis for this indicator can only be done for syphilis testing. While looking at the proportion of individuals tested for gonorrhea or chlamydia who are also tested for HIV at the same clinical encounter would be ideal, the majority of these tests are done at private labs thus testing data is not available for analysis.
Revisions • Indicator debuted. (Oct 2010) • Improvement to the method for data analysis has revised the values of this indicator
slightly from the November 10, 2010 report. (Jan 2011)

STOP HIV/AIDS Pilot Project: 2012 (Q2) Indicators Report 22
Indicator 6b: Proportion of individuals with a new STI diagnosis who are tested for HIV within three months of STI diagnosis
Target: Increase
Actual: VAN: 39.1% in 2012 Q1 NI: 22.7% in 2012 Q1 Figure 6b.1 Proportion of individuals with a new STI diagnosis who are tested for HIV within
3 months of STI diagnosis
Figure 6b.2 Proportion of individuals with a new STI diagnosis who are tested for HIV within
3 months of STI diagnosis – Males

STOP HIV/AIDS Pilot Project: 2012 (Q2) Indicators Report 23
Figure 6b.3 Proportion of individuals with a new STI diagnosis who are tested for HIV within 3 months of STI diagnosis – Females

STOP HIV/AIDS Pilot Project: 2012 (Q2) Indicators Report 24
Indicator 6b Proportion of individuals with a new STI diagnosis who are tested for HIV within three months of STI diagnosis
Interpretations & Comments
Since 2010 Q1, the proportion of individuals with a new STI diagnosis tested for HIV within three months of STI diagnosis has remained steady in Vancouver HSDA and Other HSDA’s, and increased in Northern Interior HSDA. Similar trends are observed for females and males. The magnitude of this proportion is higher for males compared to females.
Description of Measure
The percentage of individuals with a new diagnosis of a sexually transmitted infection (STI) who are tested for HIV within 3 months of their STI diagnosis.
Significance
An STI diagnosis indicates that an individual may have risk behaviors which may also be associated with an increased risk of HIV. Recommending individuals with a new STI diagnosis are tested for HIV may lead to increased case-finding and reduce the number of individuals who are unaware of their HIV status. This may be a focus of communications with clinicians conducting HIV testing.
Data Source(s) • Provincial STI surveillance system at BCCDC. • Misys Laboratory database at the Provincial Public Health Microbiology and Reference
Laboratory (PHSA).
Calculation Method
• An individual with a new diagnosis of an STI is defined as an individual with a new case report for chlamydia or gonorrhea (repeat diagnoses within one month excluded).
• The individual’s new case report for an STI will be linked to an HIV test, where available. HIV test history is identified through a probabilistic match of identifiers for STI case reports and identifiers for HIV testers.
• Individuals with a new STI case report who are linked to an earlier positive HIV test result are excluded from the analysis.
• Denominator: Number of new case reports for an STI • Numerator: Number of new case reports for an STI who have a documented HIV test
within 14 days before or 3 months after the date of STI diagnosis • Allocation by HSDA is based on address of new case report for an STI, or if unknown,
address of ordering clinician or clinic. • Unit of analysis is the percentage of new case reports for an STI diagnosis who are
tested within 3 months for HIV, by quarter.
Limitations
o Individuals who test for HIV using different identifiers (e.g., initials, pseudonyms, non-nominally) than are used for an STI diagnosis will not be included in the numerator.
o This indicator (in comparison to 6a) involves two distinct databases and the potential for misclassification is higher.
o POC HIV test data and HIV test data from another laboratory are not included in the data linkage.
o Due to data quality limitations (which are greater than for indicator 6a) this indicator underestimates the true proportion
Notes • This indicator depends on linkage between two databases using probabilistic matching
and may be more likely to be an underestimate (i.e., compared to Indicators 6a or 7, which are primarily a linkage within the same database).
Revisions • Indicator debuted. (Apr 2011)
STOP HIV/AIDS Pilot Project: 2012 (Q2) Indicators Report 25
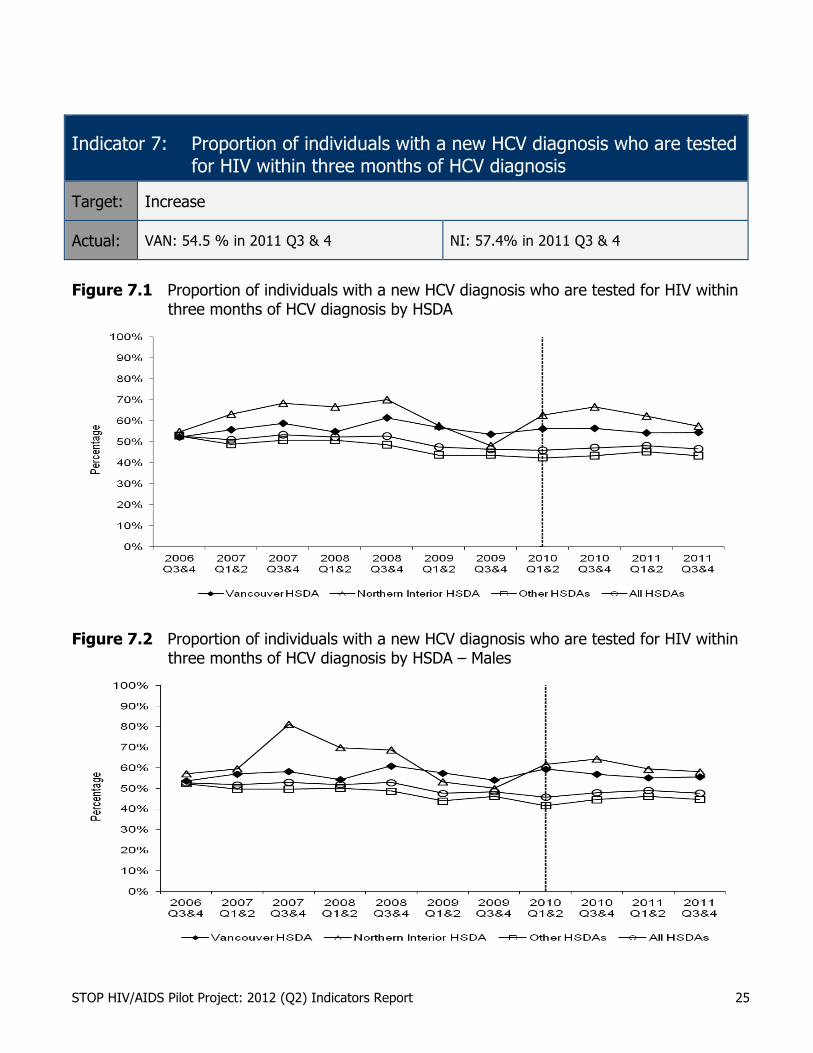
Indicator 7: Proportion of individuals with a new HCV diagnosis who are tested for HIV within three months of HCV diagnosis
Target: Increase
Actual: VAN: 54.5 % in 2011 Q3 & 4 NI: 57.4% in 2011 Q3 & 4
Figure 7.1 Proportion of individuals with a new HCV diagnosis who are tested for HIV within
three months of HCV diagnosis by HSDA
Figure 7.2 Proportion of individuals with a new HCV diagnosis who are tested for HIV within
three months of HCV diagnosis by HSDA – Males

STOP HIV/AIDS Pilot Project: 2012 (Q2) Indicators Report 26
Figure 7.3 Proportion of individuals with a new HCV diagnosis who are tested for HIV within three months of HCV diagnosis by HSDA – Females
STOP HIV/AIDS Pilot Project: 2012 (Q2) Indicators Report 27
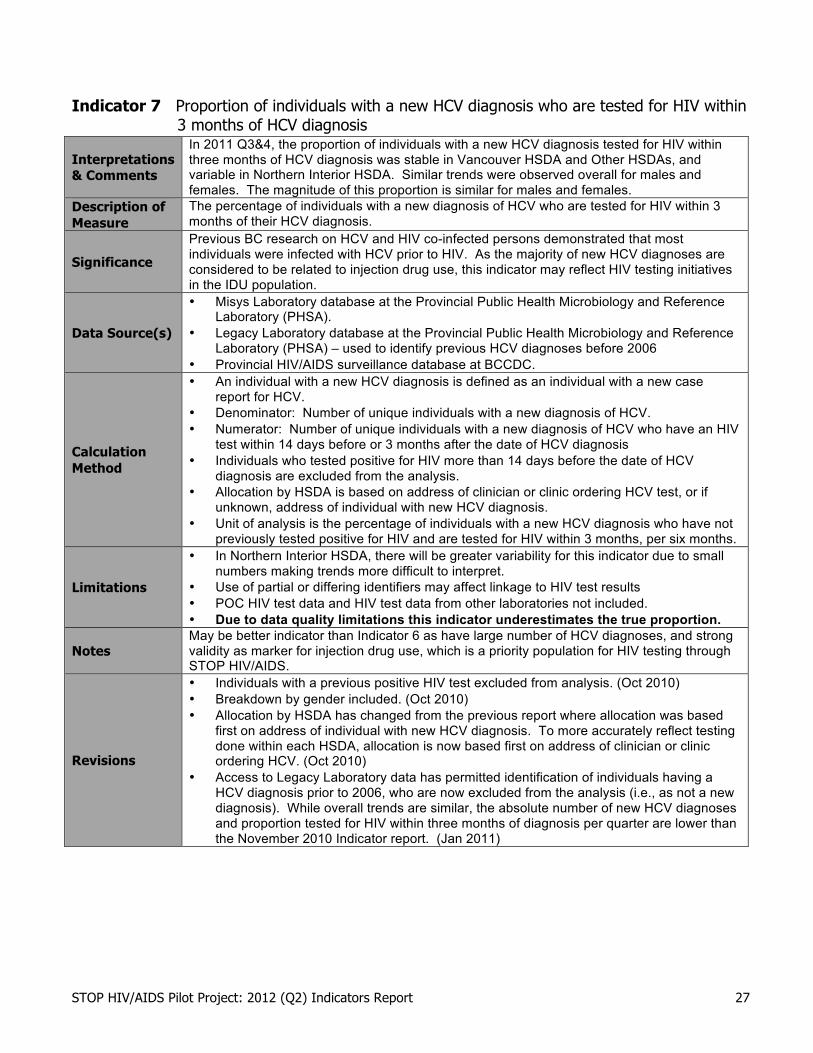
Indicator 7 Proportion of individuals with a new HCV diagnosis who are tested for HIV within 3 months of HCV diagnosis
Interpretations & Comments
In 2011 Q3&4, the proportion of individuals with a new HCV diagnosis tested for HIV within three months of HCV diagnosis was stable in Vancouver HSDA and Other HSDAs, and variable in Northern Interior HSDA. Similar trends were observed overall for males and females. The magnitude of this proportion is similar for males and females.
Description of Measure
The percentage of individuals with a new diagnosis of HCV who are tested for HIV within 3 months of their HCV diagnosis.
Significance
Previous BC research on HCV and HIV co-infected persons demonstrated that most individuals were infected with HCV prior to HIV. As the majority of new HCV diagnoses are considered to be related to injection drug use, this indicator may reflect HIV testing initiatives in the IDU population.
Data Source(s)
• Misys Laboratory database at the Provincial Public Health Microbiology and Reference Laboratory (PHSA).
• Legacy Laboratory database at the Provincial Public Health Microbiology and Reference Laboratory (PHSA) – used to identify previous HCV diagnoses before 2006
• Provincial HIV/AIDS surveillance database at BCCDC.
Calculation Method
• An individual with a new HCV diagnosis is defined as an individual with a new case report for HCV.
• Denominator: Number of unique individuals with a new diagnosis of HCV. • Numerator: Number of unique individuals with a new diagnosis of HCV who have an HIV
test within 14 days before or 3 months after the date of HCV diagnosis • Individuals who tested positive for HIV more than 14 days before the date of HCV
diagnosis are excluded from the analysis. • Allocation by HSDA is based on address of clinician or clinic ordering HCV test, or if
unknown, address of individual with new HCV diagnosis. • Unit of analysis is the percentage of individuals with a new HCV diagnosis who have not
previously tested positive for HIV and are tested for HIV within 3 months, per six months.
Limitations
• In Northern Interior HSDA, there will be greater variability for this indicator due to small numbers making trends more difficult to interpret.
• Use of partial or differing identifiers may affect linkage to HIV test results • POC HIV test data and HIV test data from other laboratories not included. • Due to data quality limitations this indicator underestimates the true proportion.
Notes May be better indicator than Indicator 6 as have large number of HCV diagnoses, and strong validity as marker for injection drug use, which is a priority population for HIV testing through STOP HIV/AIDS.
Revisions
• Individuals with a previous positive HIV test excluded from analysis. (Oct 2010) • Breakdown by gender included. (Oct 2010) • Allocation by HSDA has changed from the previous report where allocation was based
first on address of individual with new HCV diagnosis. To more accurately reflect testing done within each HSDA, allocation is now based first on address of clinician or clinic ordering HCV. (Oct 2010)
• Access to Legacy Laboratory data has permitted identification of individuals having a HCV diagnosis prior to 2006, who are now excluded from the analysis (i.e., as not a new diagnosis). While overall trends are similar, the absolute number of new HCV diagnoses and proportion tested for HIV within three months of diagnosis per quarter are lower than the November 2010 Indicator report. (Jan 2011)

STOP HIV/AIDS Pilot Project: 2012 (Q2) Indicators Report 28
Indicator 9: Proportion of individuals with a new HIV diagnosis with advanced HIV disease
Target: Decrease
Actual: VAN: 8.1% in 2010 NI: 0.0% in 2010
Figure 9.1 Proportion of individuals with a new HIV diagnosis with advanced HIV disease by
HSDA
0%
10%
20%
30%
40%
50%
60%
70%
80%
90%
100%
2006 2007 2008 2009 2010
Per
cent
age
Vancouver HSDA Northern Interior HSDA Other HSDAs All HSDAs
Figure 9.2 Proportion of individuals with a new HIV diagnosis with advanced HIV disease by gender, BC
0%
10%
20%
30%
40%
50%
60%
70%
80%
90%
100%
2006 2007 2008 2009 2010
Percentage
Male Female
STOP HIV/AIDS Pilot Project: 2012 (Q2) Indicators Report 29
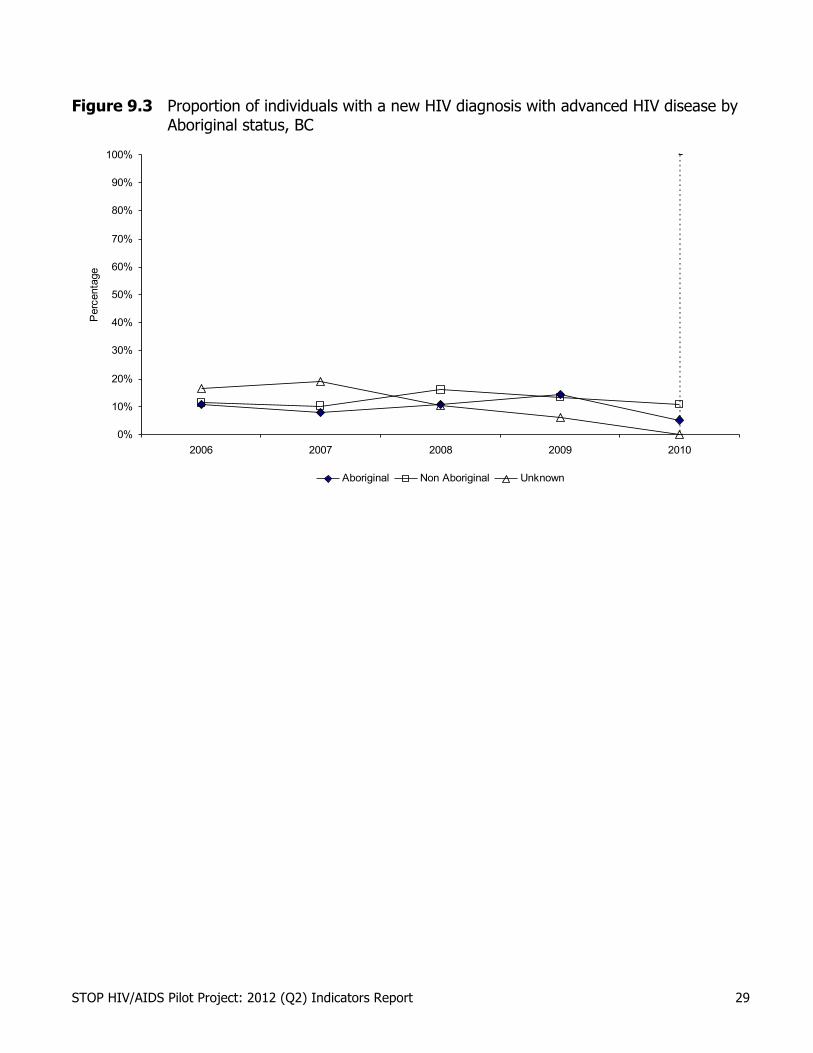
Figure 9.3 Proportion of individuals with a new HIV diagnosis with advanced HIV disease by Aboriginal status, BC
0%
10%
20%
30%
40%
50%
60%
70%
80%
90%
100%
2006 2007 2008 2009 2010
Per
cent
age
Aboriginal Non Aboriginal Unknown
STOP HIV/AIDS Pilot Project: 2012 (Q2) Indicators Report 30
Indicator 9 Proportion of individuals with a new HIV diagnosis with advanced HIV disease
AHD = advanced HIV disease
Interpretations & Comments
In 2010, the proportion of individuals with a new HIV diagnosis with advanced HIV disease (AHD) was relatively stable and within the historic range in Vancouver HSDA and Other HSDAs, and more variable for Northern Interior. Among males, this proportion decreased slightly in 2010 and remained variable for females.
Description of Measure
The percentage of individuals testing newly positive for HIV who are at an advanced stage of HIV infection at the time of their HIV diagnosis.
Significance
Indicates the proportion of individuals with a new positive HIV test who test at an advanced stage of infection (i.e., diagnosis occurs years later than the time of HIV infection). These individuals have had persistent undiagnosed HIV infection which impacts on clinical care and may contribute to ongoing HIV transmission. Delays in diagnosis may be due to lack of awareness regarding risk of HIV or barriers to accessing HIV testing (i.e., HIV stigma).
Data Source(s) Provincial HIV/AIDS surveillance database at BCCDC.
Calculation Method
• Probabilistic matching of identifiers is used to link AIDS and HIV case report forms. AHD at diagnosis is defined as an individual with a new diagnosis of HIV and with a linked AIDS case report form before or up to 12 months after the date of HIV diagnosis.
• Denominator: Number of individuals newly diagnosed with HIV (Indicator 3) • Numerator: Number of individuals newly diagnosed with HIV and with AHD • Allocation by HSDA is based on address of individual with new HIV diagnosis, or if
unknown, address of ordering clinician or clinic. • Unit of analysis is proportion of newly diagnosed individuals with AHD per year.
Limitations
• As per Indicator 4. There is an expected reporting delay of up to 12 months and this indicator will only be generated at the end of the following calendar year (i.e., data for 2010 will be available in January 2012).
• Individuals with different identifiers on HIV and AIDS case report forms will not be identified (and are not included in the numerator).
• In Northern Interior HSDA, there will be greater variability for this indicator due to small numbers making trends more difficult to interpret
Notes
• This indicator can be improved by consideration of first viral load and CD4+ count, which will allow for greater identification of AHD (e.g., expand AHD case definition to include all individuals with a first CD4+ count of < 200 cells/mm3). This will be achieved through data linkage with BCCFE data and is captured in Indicator 10.
• In 2010, the BCCfE as part of routine program activities received historic data on cancer-related outcomes from the BC Cancer Agency for DTP participants. New AIDS diagnoses for DTP participants occurring in the past were identified and reported to BCCDC. The number of new AIDS case reports per year has increased slightly from previous reports as a result.
Revisions • Breakdown by gender included. (Oct 2010) • Breakdown by Aboriginal status included. (June 2011)

STOP HIV/AIDS Pilot Project: 2012 (Q2) Indicators Report 31
Indicator 11: Proportion of individuals with a new HIV diagnosis with acute HIV infection
Target: Increase
Actual: VAN: 10 % in 2011 NI: 0% in 2011
Figure 11.1 Proportion of individuals with a new HIV diagnosis with acute HIV infection by
HSDA
0%
10%
20%
30%
40%
50%
60%
70%
80%
90%
100%
2006 2007 2008 2009 2010 2011
Perc
enta
ge
Vancouver HSDA Northern Interior HSDA Other HSDAs All HSDAs
Figure 11.2 Proportion of individuals with a new HIV diagnosis with acute HIV infection by
gender, BC
0%
10%
20%
30%
40%
50%
60%
70%
80%
90%
100%
2006 2007 2008 2009 2010 2011
Percentage
Male Female

STOP HIV/AIDS Pilot Project: 2012 (Q2) Indicators Report 32
Figure 11.3 Proportion of individuals with a new HIV diagnosis with acute HIV infection by Aboriginal status, BC
0%
10%
20%
30%
40%
50%
60%
70%
80%
90%
100%
2006 2007 2008 2009 2010 2011
Per
cent
age
Aboriginal Non Aboriginal Unknown

STOP HIV/AIDS Pilot Project: 2012 (Q2) Indicators Report 33
Indicator 11 Proportion of individuals with a new HIV diagnosis with acute HIV infection
Interpretations & Comments
In 2011, the proportion of individuals with a new HIV diagnosis with acute HIV infection remained steady in all HSDA’s. This proportion declined for females and remained steady for males. The proportion for Aboriginal persons decreased in 2011.
Description of Measure
The percentage of individuals testing newly positive for HIV who are identified as having acute HIV infection (i.e., tested up to 6-8 weeks after infection with HIV).
Significance
Individuals may test for HIV during the period of acute infection due to sero-conversion symptoms, as a result of enhanced case-finding (e.g., testing of contacts of a new index HIV case), by testing after a recent risk exposure or event, or by chance (e.g., a routine tester who tests while acutely infected). Increases in this indicator may reflect overall earlier diagnosis of HIV or increased HIV testing frequency in individuals at risk of HIV infection.
Data Source(s) Provincial HIV/AIDS surveillance database at BCCDC.
Calculation Method
• Acute HIV infection is defined on the basis of characteristic laboratory findings and the absence of an AIDS case report before or up to 12 months after HIV diagnosis.
• Denominator: All unique individuals with a new HIV diagnosis. • Numerator: Number of unique individuals with a new HIV diagnosis and with acute HIV
infection. • Allocation by HSDA is based on address of individual with new HIV diagnosis, or if
unknown, address of ordering clinician or clinic. • Unit of analysis is proportion of newly diagnosed individuals with acute HIV infection per
year.
Limitations
• Ability to identify acute HIV infection depends on test window periods, which vary by type of test used (which may vary by HSDA and over time).
• Pooled NAAT testing is available at select clinics with gay male clients in Vancouver and contributes to increased detection of acute HIV infection in men testing at those sites.
• A future switch from 3rd generation to 4th generation EIA testing at the Provincial Public Health Microbiology and Reference Laboratory may influence trends.
• In Northern Interior HSDA, there will be greater variability for this indicator due to small numbers making trends more difficult to interpret.
Notes
Revisions • Breakdown by gender included. (Oct 2010) • Breakdown by Aboriginal status included. (June 2011)

STOP HIV/AIDS Pilot Project: 2012 (Q2) Indicators Report 34
Indicator 14: Proportion of individuals starting antiretroviral therapy (ART) late in the course of HIV disease
Target: Decrease
Actual: VAN: 18.18% NI: 0.00%
Figure 14.1 Proportion of individuals starting antiretroviral therapy (ART) late in the course
of HIV disease by HSDA
0%
10%
20%
30%
40%
50%
60%
70%
80%
90%
100%
2006Q1
2006Q2
2006Q3
2006Q4
2007Q1
2007Q2
2007Q3
2007Q4
2008Q1
2008Q2
2008Q3
2008Q4
2009Q1
2009Q2
2009Q3
2009Q4
2010Q1
2010Q2
2010Q3
2010Q4
2011Q1
2011Q2
2011Q3
2011Q4
2012Q1
2012Q2
Per
cent
age
Vancouver HSDA Northern Interior HSDA Other HSDAs All HSDAs

STOP HIV/AIDS Pilot Project: 2012 (Q2) Indicators Report 35
Figure 14.2 Proportion of individuals starting antiretroviral therapy (ART) late in the course of HIV disease by gender
0%
10%
20%
30%
40%
50%
60%
70%
80%
90%
100%
2006Q1
2006Q2
2006Q3
2006Q4
2007Q1
2007Q2
2007Q3
2007Q4
2008Q1
2008Q2
2008Q3
2008Q4
2009Q1
2009Q2
2009Q3
2009Q4
2010Q1
2010Q2
2010Q3
2010Q4
2011Q1
2011Q2
2011Q3
2011Q4
2012Q1
2012Q2
Percentage
Male Female
Indicator 14 Proportion of individuals starting antiretroviral therapy (ART) late in the course
of HIV disease
Interpretations & Comments
The proportion of individuals initiating therapy late in the disease course has historically seen a modest decline. Over the course of 2011 this decline continued in and rates have stabilized for the most part in the first half of 2012. NI continues to experience large fluctuations associated with the small sample size. Trends have historically been similar for both sexes and the modest divergence seen in the last quarter has disappeared.
Description of Measure
Percentage of individuals starting ART who have cd4 cell counts below 200 cells/mL.
Significance
Current clinical guidelines are complex in terms of eligibility for ART and rely on an algorithm which takes into account cd4, viral load, concomitant illness or other morbidities including laboratory findings, other medications and their safety profiles as well as the lifestyle or personal challenges of the individual. A cd4 cell count of <200 cells/mL however, represents severe HIV disease and a point at which all individuals should be accessing therapy.
Data Source(s) British Columbia Center for Excellence Drug Treatment Program Database
Calculation Method
Denominator: Total number of distinct individuals who are initiating ART in the time period of interest. Numerator: Total number of individuals from the denominator with cd4 cell counts lower than 200 cells/mL
Limitations CD4 count is only one measure of treatment eligibility. Therefore, there are likely to be individuals who are eligible for treatment on other grounds but whose cd4 count is greater than 200 and will not be captured in the numerator in this estimate.
Notes Revisions
STOP HIV/AIDS Pilot Project: 2012 (Q2) Indicators Report
36
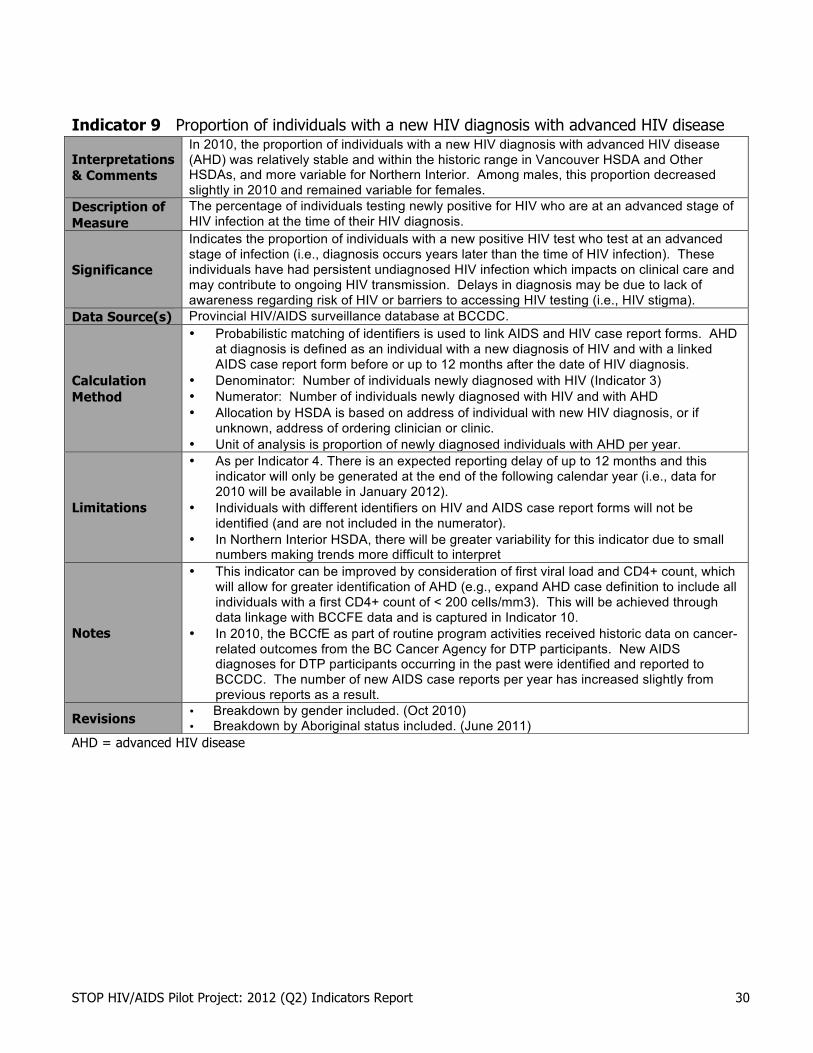
Indicator 18: Proportion of individuals with a new HIV diagnosis who are tested for syphilis within three months of HIV diagnosis
Target: >95%
Actual: VAN: 73.3% in 2011 Q3 & Q4 NI: 33.3% in 2011 Q3 & Q4
Figure 18.1 Proportion of individuals with a new HIV diagnosis who are tested for
syphilis within 3 months of HIV diagnosis by HSDA
Figure 18.2 Proportion of individuals with a new HIV diagnosis who are tested for
syphilis within 3 months of HIV diagnosis by HSDA – Males
STOP HIV/AIDS Pilot Project: 2012 (Q2) Indicators Report 37
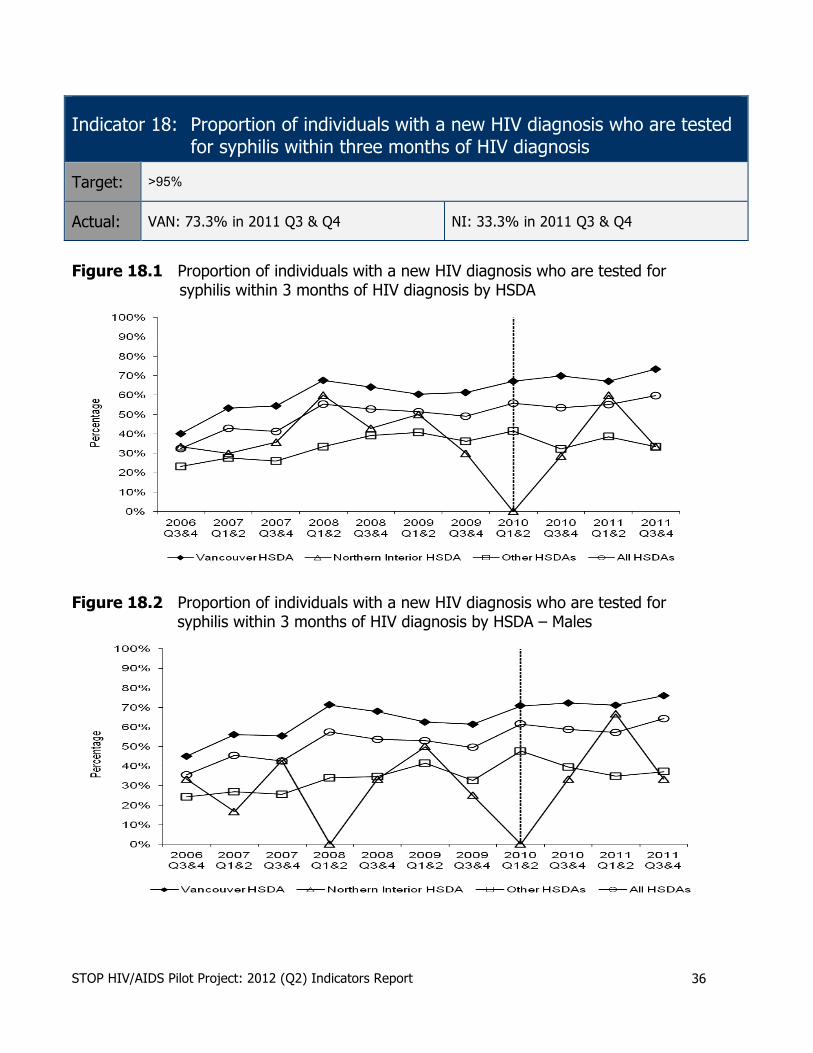
Figure 18.3 Proportion of individuals with a new HIV diagnosis who are tested for syphilis within 3 months of HIV diagnosis by HSDA – Females
Figure 18.4 Proportion of individuals with a new HIV diagnosis who are tested for
syphilis within 3 months of HIV diagnosis– by Aboriginal status
STOP HIV/AIDS Pilot Project: 2012 (Q2) Indicators Report 38
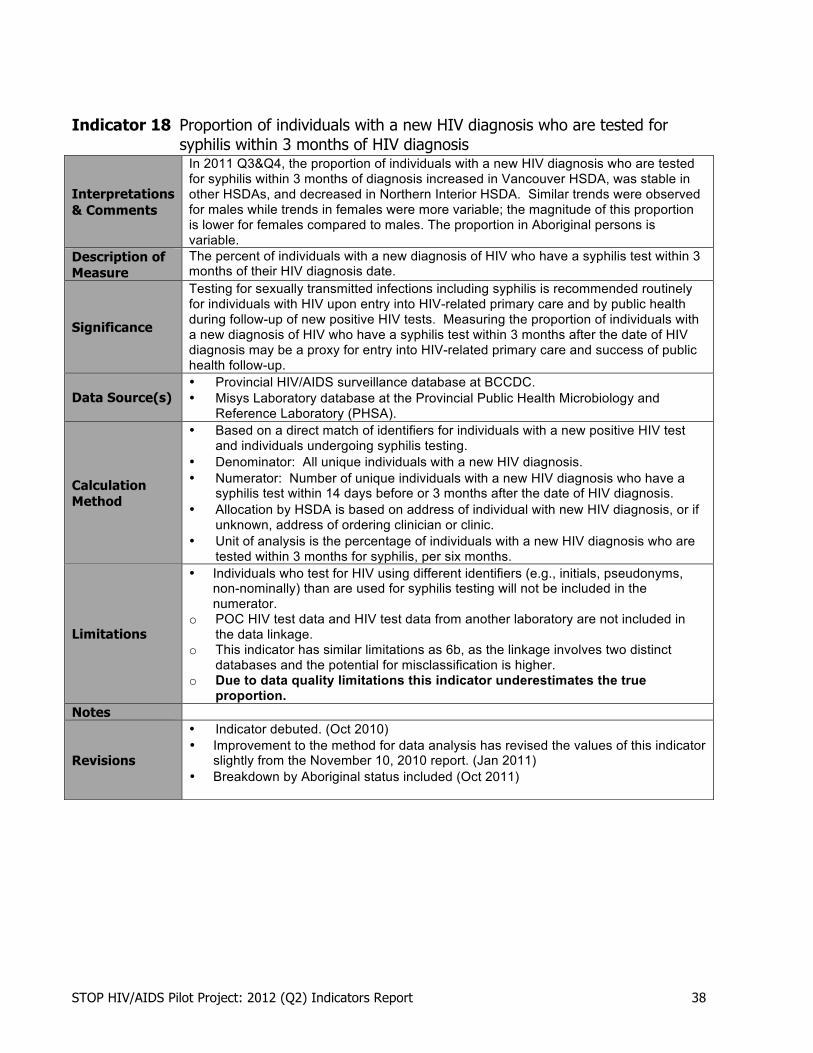
Indicator 18 Proportion of individuals with a new HIV diagnosis who are tested for
syphilis within 3 months of HIV diagnosis
Interpretations & Comments
In 2011 Q3&Q4, the proportion of individuals with a new HIV diagnosis who are tested for syphilis within 3 months of diagnosis increased in Vancouver HSDA, was stable in other HSDAs, and decreased in Northern Interior HSDA. Similar trends were observed for males while trends in females were more variable; the magnitude of this proportion is lower for females compared to males. The proportion in Aboriginal persons is variable.
Description of Measure
The percent of individuals with a new diagnosis of HIV who have a syphilis test within 3 months of their HIV diagnosis date.
Significance
Testing for sexually transmitted infections including syphilis is recommended routinely for individuals with HIV upon entry into HIV-related primary care and by public health during follow-up of new positive HIV tests. Measuring the proportion of individuals with a new diagnosis of HIV who have a syphilis test within 3 months after the date of HIV diagnosis may be a proxy for entry into HIV-related primary care and success of public health follow-up.
Data Source(s) • Provincial HIV/AIDS surveillance database at BCCDC. • Misys Laboratory database at the Provincial Public Health Microbiology and
Reference Laboratory (PHSA).
Calculation Method
• Based on a direct match of identifiers for individuals with a new positive HIV test and individuals undergoing syphilis testing.
• Denominator: All unique individuals with a new HIV diagnosis. • Numerator: Number of unique individuals with a new HIV diagnosis who have a
syphilis test within 14 days before or 3 months after the date of HIV diagnosis. • Allocation by HSDA is based on address of individual with new HIV diagnosis, or if
unknown, address of ordering clinician or clinic. • Unit of analysis is the percentage of individuals with a new HIV diagnosis who are
tested within 3 months for syphilis, per six months.
Limitations
• Individuals who test for HIV using different identifiers (e.g., initials, pseudonyms, non-nominally) than are used for syphilis testing will not be included in the numerator.
o POC HIV test data and HIV test data from another laboratory are not included in the data linkage.
o This indicator has similar limitations as 6b, as the linkage involves two distinct databases and the potential for misclassification is higher.
o Due to data quality limitations this indicator underestimates the true proportion.
Notes
Revisions
• Indicator debuted. (Oct 2010) • Improvement to the method for data analysis has revised the values of this indicator
slightly from the November 10, 2010 report. (Jan 2011) • Breakdown by Aboriginal status included (Oct 2011)

STOP HIV/AIDS Pilot Project: 2012 (Q2) Indicators Report 39
Figure 21.1 Percentage of HIV-infected individuals who are tested for genotypic
antiretroviral drug resistance prior to starting antiretroviral therapy (ART) by HSDA
0%
10%
20%
30%
40%
50%
60%
70%
80%
90%
100%
2006Q1
2006Q2
2006Q3
2006Q4
2007Q1
2007Q2
2007Q3
2007Q4
2008Q1
2008Q2
2008Q3
2008Q4
2009Q1
2009Q2
2009Q3
2009Q4
2010Q1
2010Q2
2010Q3
2010Q4
2011Q1
2011Q2
2011Q3
2011Q4
2012Q1
2012Q2
Per
cent
age
Vancouver HSDA Northern Interior HSDA Other HSDAs All HSDAs
Figure 21.2 Percentage of HIV-infected individuals who are tested for genotypic
antiretroviral drug resistance prior to starting antiretroviral therapy (ART) by gender
Indicator 21: Percentage of HIV-infected individuals who are tested for genotypic antiretroviral drug resistance prior to starting antiretroviral therapy (ART)
Target: Increase to >95%
Actual: VAN: 88.89% NI: 100.00%

STOP HIV/AIDS Pilot Project: 2012 (Q2) Indicators Report 40
0%
10%
20%
30%
40%
50%
60%
70%
80%
90%
100%
2006Q1
2006Q2
2006Q3
2006Q4
2007Q1
2007Q2
2007Q3
2007Q4
2008Q1
2008Q2
2008Q3
2008Q4
2009Q1
2009Q2
2009Q3
2009Q4
2010Q1
2010Q2
2010Q3
2010Q4
2011Q1
2011Q2
2011Q3
2011Q4
2012Q1
2012Q2
Percentage
Male Female
Indicator 21 Percentage of HIV-infected individuals who are tested for genotypic
antiretroviral drug resistance prior to starting antiretroviral therapy (ART)
Interpretations & Comments
Estimates of the proportion of individuals receiving genotypic testing have remained relatively steady throughout 2011 and the first half of 2012. The overall trend is towards rates near goal levels for both men and women.
Description of Measure
Percentage of HIV positive individuals who receive laboratory testing for genotypic drug resistance before they begin antiretroviral therapy.
Significance
Over time individuals exposed to ART can develop strains of HIV that are resistant to some or all of the drugs in a given therapy regimen. When this happens the efficacy of the drugs declines and the drug regimen must be changed. People with resistant virus can pass along these resistant virus strains so that those they infect actually have drug resistance even though they have never taken antiretroviral drugs. Therefore, it is important to conduct genotype testing on those who have never been exposed to ART but who are initiating therapy. The purpose of this is to establish whether the patient is harboring drug resistant strains of the HI virus so that the therapy can be tailored to suit the patient's needs. Testing typically includes resistance to nucleoside reverse transcriptase inhibitors (NRTI), non-nucleoside reverse transcriptase inhibitors (NNRTI), M18, and protease inhibitor (PI) classes of therapy.
Data Source(s) British Columbia Center for Excellence Drug Treatment Program Database
Calculation Method
Percentage of all those initiating first therapy who have prior genotype testing. Denominator: All individuals who initiated first ever antiretroviral therapy Numerator: All those in the denominator that have had at least one resistance profile conducted prior to therapy start date.
Limitations Viral load must be >=250 copies/mL for testing to be conducted. Prior to January 1, 2002 pVL needed to be >=1,000 copies/mL.
Notes Revisions

STOP HIV/AIDS Pilot Project: 2012 (Q2) Indicators Report 41
Figure 22.1 Percentage of individuals starting ART who achieve HIV plasma viral load
(pVL) of < 200 copies/mL within 9 months of therapy initiation by HSDA
0%
10%
20%
30%
40%
50%
60%
70%
80%
90%
100%
2006Q1
2006Q2
2006Q3
2006Q4
2007Q1
2007Q2
2007Q3
2007Q4
2008Q1
2008Q2
2008Q3
2008Q4
2009Q1
2009Q2
2009Q3
2009Q4
2010Q1
2010Q2
2010Q3
2010Q4
2011Q1
2011Q2
2011Q3
2011Q4
2012Q1
2012Q2
Per
cent
age
Vancouver HSDA Northern Interior HSDA Other HSDAs All HSDAs
Indicator 22: Percentage of individuals starting antiretroviral therapy (ART) who achieve HIV plasma viral load (pVL) of <200 copies/mL within nine months of therapy initiation
Target: Increase to >95%
Actual: VAN: 91.55% NI: 75.00%

STOP HIV/AIDS Pilot Project: 2012 (Q2) Indicators Report 42
Figure 22.2 Percentage of individuals starting ART who achieve HIV plasma viral load (pVL) of < 200 copies/mL within nine months of therapy initiation by gender
0%
10%
20%
30%
40%
50%
60%
70%
80%
90%
100%
2006Q1
2006Q2
2006Q3
2006Q4
2007Q1
2007Q2
2007Q3
2007Q4
2008Q1
2008Q2
2008Q3
2008Q4
2009Q1
2009Q2
2009Q3
2009Q4
2010Q1
2010Q2
2010Q3
2010Q4
2011Q1
2011Q2
2011Q3
2011Q4
2012Q1
2012Q2
Percentage
Male Female
STOP HIV/AIDS Pilot Project: 2012 (Q2) Indicators Report 43
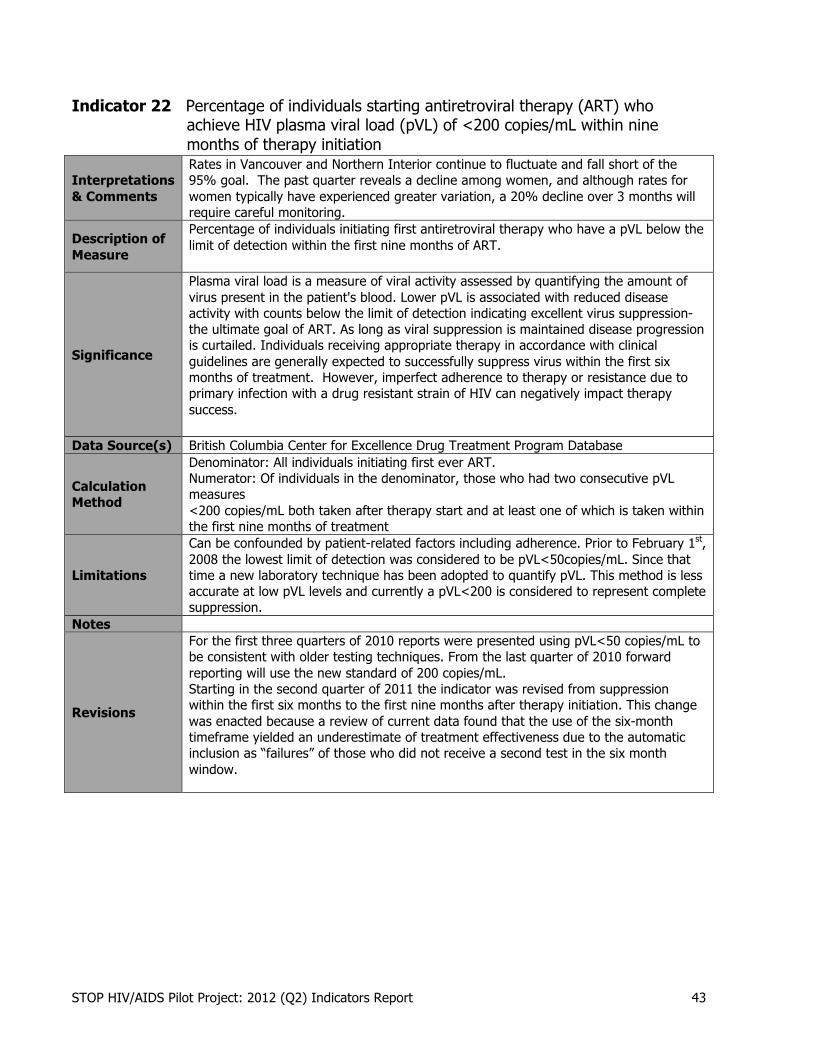
Indicator 22 Percentage of individuals starting antiretroviral therapy (ART) who achieve HIV plasma viral load (pVL) of <200 copies/mL within nine months of therapy initiation
Interpretations & Comments
Rates in Vancouver and Northern Interior continue to fluctuate and fall short of the 95% goal. The past quarter reveals a decline among women, and although rates for women typically have experienced greater variation, a 20% decline over 3 months will require careful monitoring.
Description of Measure
Percentage of individuals initiating first antiretroviral therapy who have a pVL below the limit of detection within the first nine months of ART.
Significance
Plasma viral load is a measure of viral activity assessed by quantifying the amount of virus present in the patient's blood. Lower pVL is associated with reduced disease activity with counts below the limit of detection indicating excellent virus suppression- the ultimate goal of ART. As long as viral suppression is maintained disease progression is curtailed. Individuals receiving appropriate therapy in accordance with clinical guidelines are generally expected to successfully suppress virus within the first six months of treatment. However, imperfect adherence to therapy or resistance due to primary infection with a drug resistant strain of HIV can negatively impact therapy success.
Data Source(s) British Columbia Center for Excellence Drug Treatment Program Database
Calculation Method
Denominator: All individuals initiating first ever ART. Numerator: Of individuals in the denominator, those who had two consecutive pVL measures <200 copies/mL both taken after therapy start and at least one of which is taken within the first nine months of treatment
Limitations
Can be confounded by patient-related factors including adherence. Prior to February 1st, 2008 the lowest limit of detection was considered to be pVL<50copies/mL. Since that time a new laboratory technique has been adopted to quantify pVL. This method is less accurate at low pVL levels and currently a pVL<200 is considered to represent complete suppression.
Notes
Revisions
For the first three quarters of 2010 reports were presented using pVL<50 copies/mL to be consistent with older testing techniques. From the last quarter of 2010 forward reporting will use the new standard of 200 copies/mL. Starting in the second quarter of 2011 the indicator was revised from suppression within the first six months to the first nine months after therapy initiation. This change was enacted because a review of current data found that the use of the six-month timeframe yielded an underestimate of treatment effectiveness due to the automatic inclusion as “failures” of those who did not receive a second test in the six month window.

STOP HIV/AIDS Pilot Project: 2012 (Q2) Indicators Report 44
Figure 23.1 Percentage of individuals who initiated antiretroviral therapy (ART) with a
recommended therapy regimen (among those with no drug resistance) by HSDA
0%
10%
20%
30%
40%
50%
60%
70%
80%
90%
100%
2006Q1
2006Q2
2006Q3
2006Q4
2007Q1
2007Q2
2007Q3
2007Q4
2008Q1
2008Q2
2008Q3
2008Q4
2009Q1
2009Q2
2009Q3
2009Q4
2010Q1
2010Q2
2010Q3
2010Q4
2011Q1
2011Q2
2011Q3
2011Q4
2012Q1
2012Q2
Per
cent
age
Vancouver HSDA Northern Interior HSDA Other HSDAs All HSDAs
Indicator 23*: Percentage of individuals who initiated antiretroviral therapy (ART) with a recommended therapy regimen (among those with no drug resistance)
Target: Increase to >95%
Actual: VAN: 72.22% NI: 100.00%

STOP HIV/AIDS Pilot Project: 2012 (Q2) Indicators Report 45
Figure 23.2 Percentage of individuals who initiated antiretroviral therapy (ART) with a recommended therapy regimen (among those with no drug resistance) by gender
0%
10%
20%
30%
40%
50%
60%
70%
80%
90%
100%
2006Q1
2006Q2
2006Q3
2006Q4
2007Q1
2007Q2
2007Q3
2007Q4
2008Q1
2008Q2
2008Q3
2008Q4
2009Q1
2009Q2
2009Q3
2009Q4
2010Q1
2010Q2
2010Q3
2010Q4
2011Q1
2011Q2
2011Q3
2011Q4
2012Q1
2012Q2
Percentage
Male Female

STOP HIV/AIDS Pilot Project: 2012 (Q2) Indicators Report 46
Indicator 23 Percentage of individuals who initiated antiretroviral therapy (ART) with a
recommended therapy regimen (among those with no drug resistance)
Interpretations & Comments
In 2012 thus far rates continue to fluctuate around the 75% mark, a distant 20% from the goal level. Both sexes continue to follow similar patterns although women are, once again, experiencing a drift downwards in comparison to men.
Description of Measure
Percentage of individuals who are starting first ever ART and who have been shown to have no drug resistance who initiate therapy with one of the therapy regimens recommended for those who have never been on therapy and who do not have any drug resistance.
Significance
As described in Indicator 21, resistance testing is an important precursor to treatment. Drug resistance complicates treatment and limits treatment options. Individuals without drug resistance have the option of using, and should be prescribed, the most simple and effective therapy options. Currently 8 options are recommended for people who are new to treatment and who do not have drug resistance.
Data Source(s) British Columbia Center for Excellence Drug Treatment Program Database
Calculation Method
Denominator: All individuals initiating first ever ART who had drug resistance testing prior to ART start date, which documented no resistance to any of nucleoside reverse transcriptase inhibitors (NRTI), non-nucleoside reverse transcriptase inhibitors (NNRTI), M18, and protease inhibitor (PI) classes of therapy. Numerator: Individuals in the denominator who initiated first ever therapy with one of the eight therapy regimens recommended.
Limitations Patients may have specific contraindications other than resistance and these data are not completely captured.
Notes*
THIS INDICATOR IS UNDER REVIEW TO REFLECT CHANGES IN CURRENTLY RECCOMENDED THERPY OPTIONS. Q2 FIGURES MAY BE UPDATED IN Q3 TO REFLECT THESE GHANGES AND ARE PROVIDED HERE IN THE INTEREST OF CONSISTANCY ONLY.
Revisions
From study start through Q2 of 2012, the options for first line therapy were: • Lamivudine/lopinavir+ritonavir/tenofovir • Lamivudine/efavirenz/tenofovir • Lamivudine/nevirapine/tenofovir • Lamivudine/tenofovir/ritonavir boosted atazanavir • Lopinavir+ritonavir/tenofovir/emtricitabine • Efavirenz/tenofovir/emtricitabine • Nevirapine/tenofovir/emtricitabine • Tenofovir/ritonavir boosted atazanavir/emtricitabine
STOP HIV/AIDS Pilot Project: 2012 (Q2) Indicators Report 47
Figure 24.1 Percentage of individuals on antiretroviral therapy (ART) that achieve
annual prescription refill adherence of >95% by HSDA
0%
10%
20%
30%
40%
50%
60%
70%
80%
90%
100%
2006Q1
2006Q2
2006Q3
2006Q4
2007Q1
2007Q2
2007Q3
2007Q4
2008Q1
2008Q2
2008Q3
2008Q4
2009Q1
2009Q2
2009Q3
2009Q4
2010Q1
2010Q2
2010Q3
2010Q4
2011Q1
2011Q2
2011Q3
2011Q4
2012Q1
2012Q2
Per
cent
age
Vancouver HSDA Northern Interior HSDA Other HSDAs All HSDAs
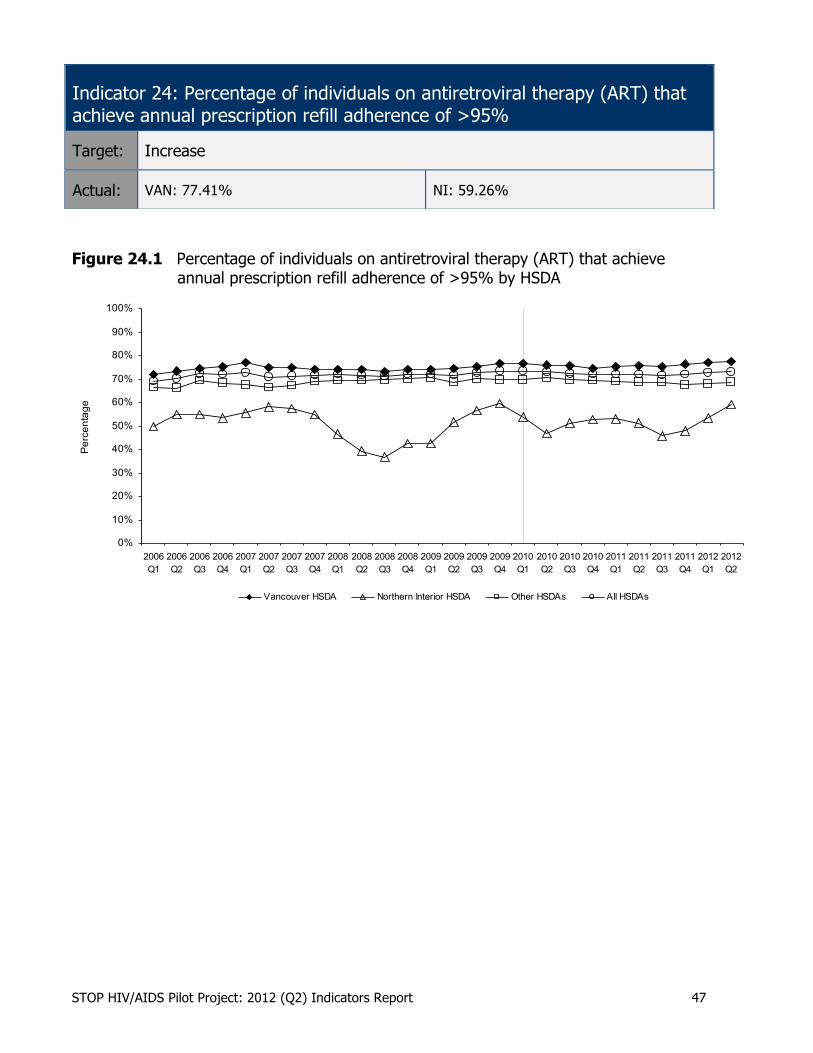
Indicator 24: Percentage of individuals on antiretroviral therapy (ART) that achieve annual prescription refill adherence of >95%
Target: Increase
Actual: VAN: 77.41% NI: 59.26%
STOP HIV/AIDS Pilot Project: 2012 (Q2) Indicators Report 48
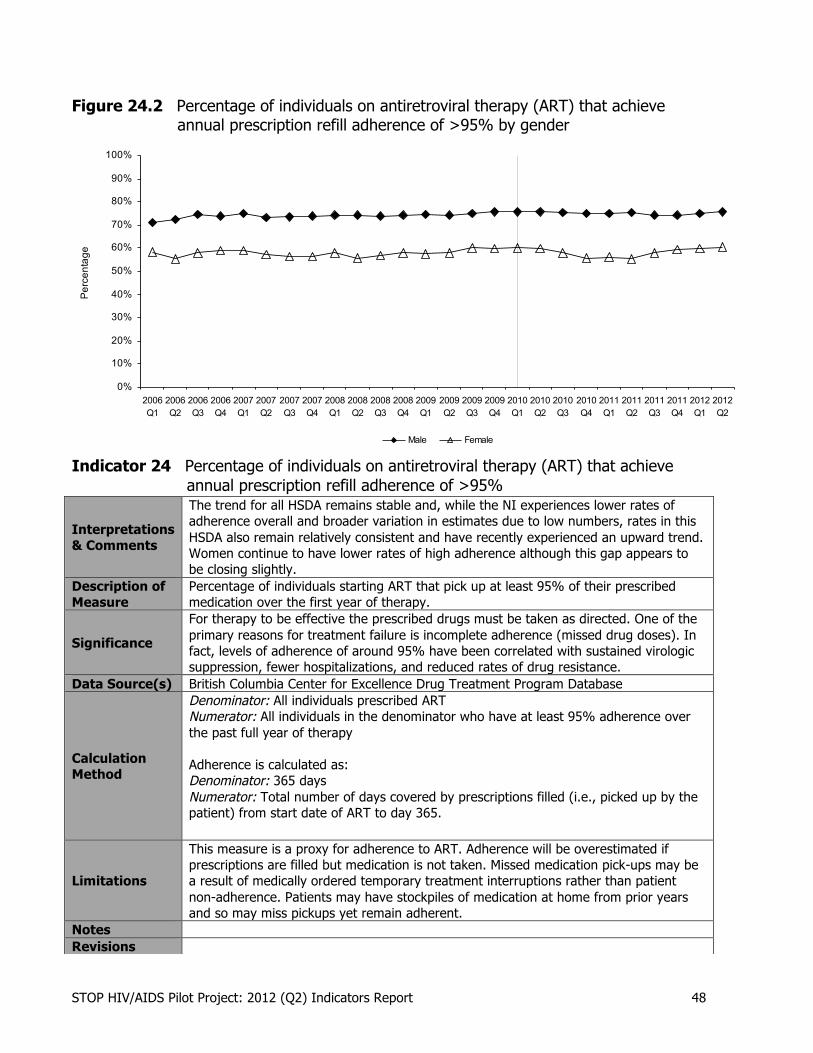
Figure 24.2 Percentage of individuals on antiretroviral therapy (ART) that achieve annual prescription refill adherence of >95% by gender
0%
10%
20%
30%
40%
50%
60%
70%
80%
90%
100%
2006Q1
2006Q2
2006Q3
2006Q4
2007Q1
2007Q2
2007Q3
2007Q4
2008Q1
2008Q2
2008Q3
2008Q4
2009Q1
2009Q2
2009Q3
2009Q4
2010Q1
2010Q2
2010Q3
2010Q4
2011Q1
2011Q2
2011Q3
2011Q4
2012Q1
2012Q2
Percentage
Male Female
Indicator 24 Percentage of individuals on antiretroviral therapy (ART) that achieve annual prescription refill adherence of >95%
Interpretations & Comments
The trend for all HSDA remains stable and, while the NI experiences lower rates of adherence overall and broader variation in estimates due to low numbers, rates in this HSDA also remain relatively consistent and have recently experienced an upward trend. Women continue to have lower rates of high adherence although this gap appears to be closing slightly.
Description of Measure
Percentage of individuals starting ART that pick up at least 95% of their prescribed medication over the first year of therapy.
Significance
For therapy to be effective the prescribed drugs must be taken as directed. One of the primary reasons for treatment failure is incomplete adherence (missed drug doses). In fact, levels of adherence of around 95% have been correlated with sustained virologic suppression, fewer hospitalizations, and reduced rates of drug resistance.
Data Source(s) British Columbia Center for Excellence Drug Treatment Program Database
Calculation Method
Denominator: All individuals prescribed ART Numerator: All individuals in the denominator who have at least 95% adherence over the past full year of therapy Adherence is calculated as: Denominator: 365 days Numerator: Total number of days covered by prescriptions filled (i.e., picked up by the patient) from start date of ART to day 365.
Limitations
This measure is a proxy for adherence to ART. Adherence will be overestimated if prescriptions are filled but medication is not taken. Missed medication pick-ups may be a result of medically ordered temporary treatment interruptions rather than patient non-adherence. Patients may have stockpiles of medication at home from prior years and so may miss pickups yet remain adherent.
Notes Revisions
STOP HIV/AIDS Pilot Project: 2012 (Q2) Indicators Report 49
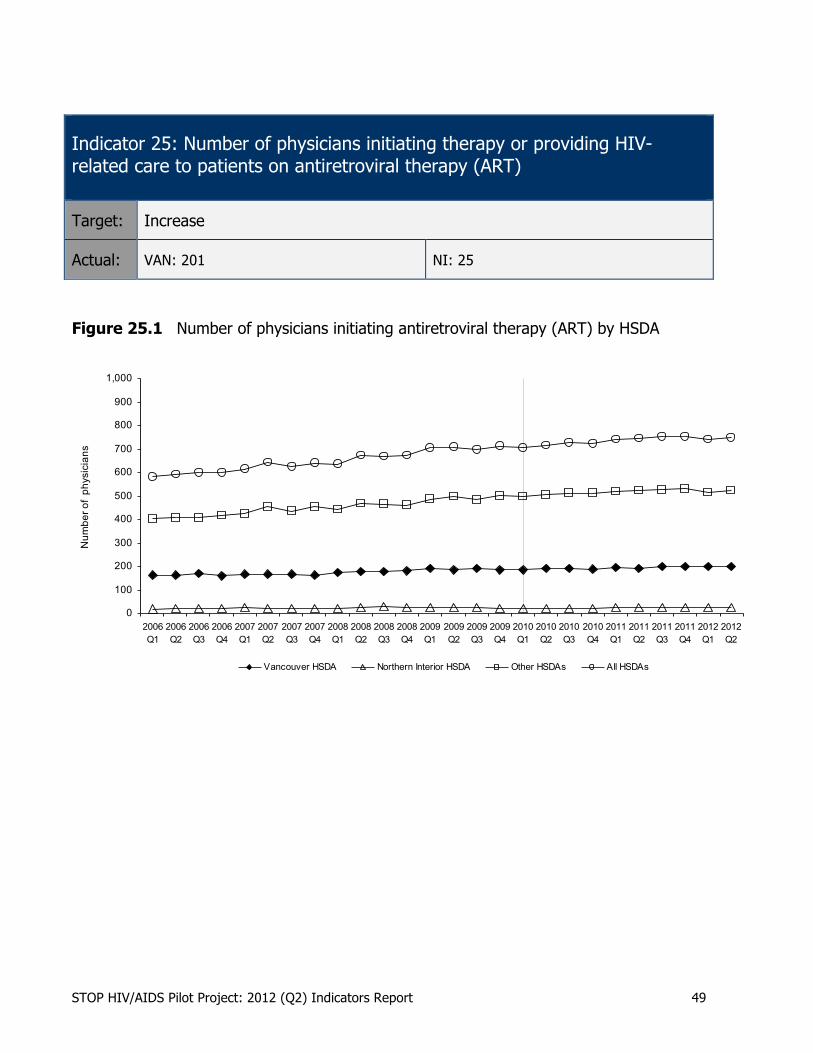
Indicator 25: Number of physicians initiating therapy or providing HIV-related care to patients on antiretroviral therapy (ART)
Target: Increase
Actual: VAN: 201 NI: 25
Figure 25.1 Number of physicians initiating antiretroviral therapy (ART) by HSDA
0
100
200
300
400
500
600
700
800
900
1,000
2006Q1
2006Q2
2006Q3
2006Q4
2007Q1
2007Q2
2007Q3
2007Q4
2008Q1
2008Q2
2008Q3
2008Q4
2009Q1
2009Q2
2009Q3
2009Q4
2010Q1
2010Q2
2010Q3
2010Q4
2011Q1
2011Q2
2011Q3
2011Q4
2012Q1
2012Q2
Num
ber o
f ph
ysic
ians
Vancouver HSDA Northern Interior HSDA Other HSDAs All HSDAs
STOP HIV/AIDS Pilot Project: 2012 (Q2) Indicators Report
50
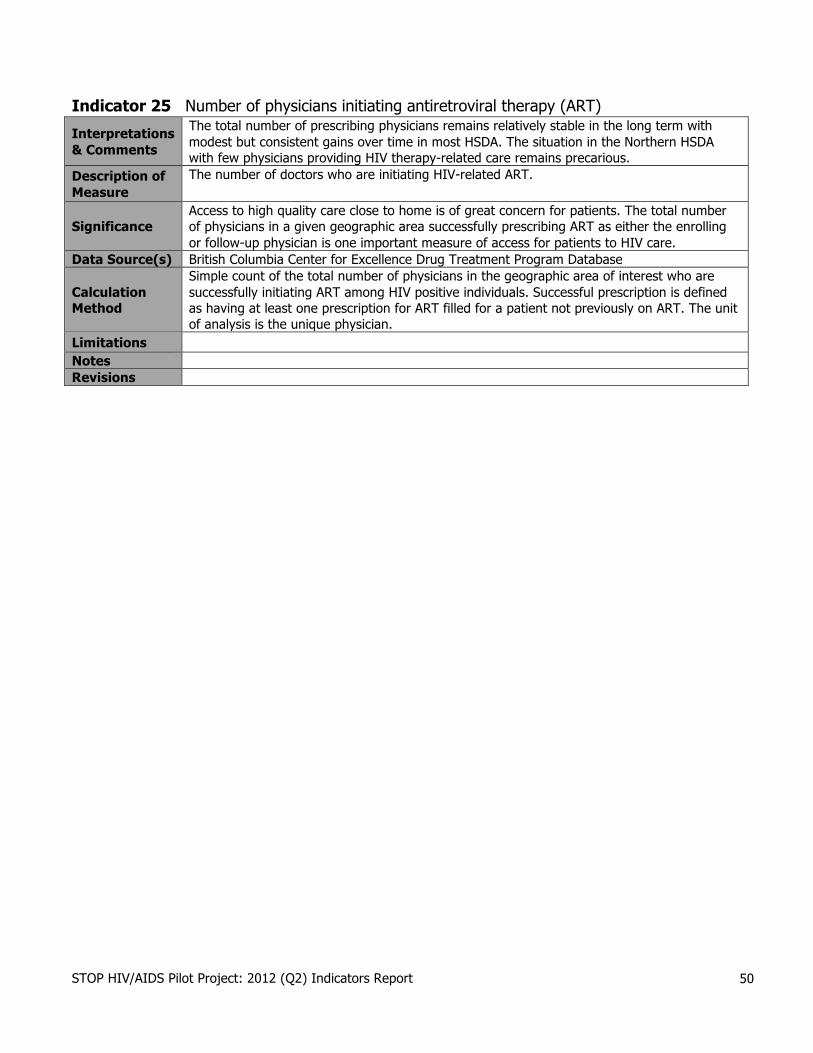
Indicator 25 Number of physicians initiating antiretroviral therapy (ART)
Interpretations & Comments
The total number of prescribing physicians remains relatively stable in the long term with modest but consistent gains over time in most HSDA. The situation in the Northern HSDA with few physicians providing HIV therapy-related care remains precarious.
Description of Measure
The number of doctors who are initiating HIV-related ART.
Significance Access to high quality care close to home is of great concern for patients. The total number of physicians in a given geographic area successfully prescribing ART as either the enrolling or follow-up physician is one important measure of access for patients to HIV care.
Data Source(s) British Columbia Center for Excellence Drug Treatment Program Database
Calculation Method
Simple count of the total number of physicians in the geographic area of interest who are successfully initiating ART among HIV positive individuals. Successful prescription is defined as having at least one prescription for ART filled for a patient not previously on ART. The unit of analysis is the unique physician.
Limitations Notes Revisions
STOP HIV/AIDS Pilot Project: 2012 (Q2) Indicators Report 51
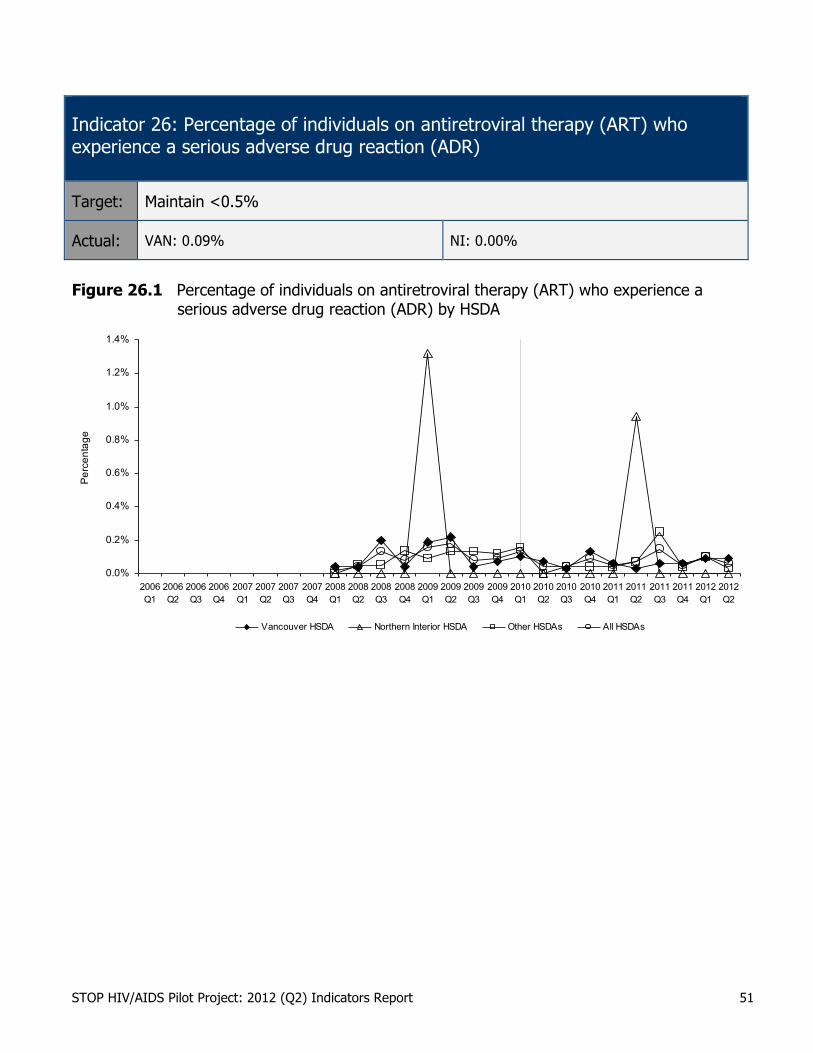
Indicator 26: Percentage of individuals on antiretroviral therapy (ART) who experience a serious adverse drug reaction (ADR)
Target: Maintain <0.5%
Actual: VAN: 0.09% NI: 0.00%
Figure 26.1 Percentage of individuals on antiretroviral therapy (ART) who experience a
serious adverse drug reaction (ADR) by HSDA
0.0%
0.2%
0.4%
0.6%
0.8%
1.0%
1.2%
1.4%
2006Q1
2006Q2
2006Q3
2006Q4
2007Q1
2007Q2
2007Q3
2007Q4
2008Q1
2008Q2
2008Q3
2008Q4
2009Q1
2009Q2
2009Q3
2009Q4
2010Q1
2010Q2
2010Q3
2010Q4
2011Q1
2011Q2
2011Q3
2011Q4
2012Q1
2012Q2
Per
cent
age
Vancouver HSDA Northern Interior HSDA Other HSDAs All HSDAs

STOP HIV/AIDS Pilot Project: 2012 (Q2) Indicators Report 52
Figure 26.2 Percentage of individuals on antiretroviral therapy (ART) who experience a serious adverse drug reaction (ADR) by gender
0.0%
0.2%
0.4%
0.6%
0.8%
1.0%
1.2%
1.4%
2006Q1
2006Q2
2006Q3
2006Q4
2007Q1
2007Q2
2007Q3
2007Q4
2008Q1
2008Q2
2008Q3
2008Q4
2009Q1
2009Q2
2009Q3
2009Q4
2010Q1
2010Q2
2010Q3
2010Q4
2011Q1
2011Q2
2011Q3
2011Q4
2012Q1
2012Q2
Percentage
Male Female

STOP HIV/AIDS Pilot Project: 2012 (Q2) Indicators Report 53
Indicator 26 Percentage of individuals on antiretroviral therapy (ART) who experience a serious adverse drug reaction (ADR)
Interpretations & Comments
The trend remains towards very low ADR rates. While women may experience (or their physicians report) greater rates of ADR this gap has closed over the past three quarters. Due to the small number of events trends in this indicator must be interpreted with caution- particularly in the Northern HSDA where a single case can cause a dramatic spike in comparative quarterly rates.
Description of Measure
Percentage of individuals on ART who have a serious negative reaction to an ART drug.
Significance
Most medications can be associated with adverse reactions. Serious adverse drug events in HIV therapy cover a wide range of problems in various organ systems and are defined as reactions that are potentially life-threatening or which lead to hospitalization or death. Monitoring for ADRs in the general population of ART users is important because the clinical trials in which drug testing is conducted usually include relatively few patients followed over a comparatively short time period. Therefore, trials may not identify ADR if they are very rare or are a result of very long exposure. Fortunately, the risk of a serous ADR in response to antiretroviral drugs is very low.
Data Source(s) British Columbia Center for Excellence Drug Treatment Program Database
Calculation Method
Denominator: Total number of distinct individuals who are taking ART and any given time in the time period of interest. Numerator: Number of serious adverse events over the time period of interest.
Limitations
Reporting of adverse drug reactions, even serious ones, is voluntary- relying on physician report. Moreover, those that are reported are not confirmed or substantiated independently and it remains unknown whether factors other than ART drugs may be responsible or partially responsible for the adverse event.
Notes Revisions

STOP HIV/AIDS Pilot Project: 2012 (Q2) Indicators Report 54
Figure 28.1 Incidence of resistance to any antiretroviral drug by HSDA
0.0%
0.2%
0.4%
0.6%
0.8%
1.0%
1.2%
1.4%
1.6%
1.8%
2006Q1
2006Q2
2006Q3
2006Q4
2007Q1
2007Q2
2007Q3
2007Q4
2008Q1
2008Q2
2008Q3
2008Q4
2009Q1
2009Q2
2009Q3
2009Q4
2010Q1
2010Q2
2010Q3
2010Q4
2011Q1
2011Q2
2011Q3
2011Q4
2012Q1
2012Q2
Per
cent
age
Vancouver HSDA Northern Interior HSDA Other HSDAs All HSDAs
Indicator 28: Incidence of resistance to any retroviral drug
Target: Decrease
Actual: VAN: 0.05% NI: 0.31%

STOP HIV/AIDS Pilot Project: 2012 (Q2) Indicators Report 55
Figure 28.2 Incidence of resistance to any antiretroviral drug by gender
0.0%
0.2%
0.4%
0.6%
0.8%
1.0%
1.2%
1.4%
1.6%
1.8%
2006Q1
2006Q2
2006Q3
2006Q4
2007Q1
2007Q2
2007Q3
2007Q4
2008Q1
2008Q2
2008Q3
2008Q4
2009Q1
2009Q2
2009Q3
2009Q4
2010Q1
2010Q2
2010Q3
2010Q4
2011Q1
2011Q2
2011Q3
2011Q4
2012Q1
2012Q2
Percentage
Male Female
Indicator 28 Incidence of resistance to any antiretroviral drug
Interpretations & Comments
All HSDA have consistently low rates of incident drug resistance throughout 2010/2011 and the first half of 2012. The slightly higher rates among women observed historically have resolved to a large degree in the past six months.
Description of Measure
Counts new cases of antiretroviral drug resistance occurring over the time period of interest among all individuals taking antiretroviral therapy.
Significance
One goal of the STOP HIV pilot is to reduce transmission of drug-resistant HIV strains. The lower the incidence of resistance and the fewer people with HIV harboring resistant viral strains, the more successful these efforts will be.
Data Source(s) British Columbia Center for Excellence Drug Treatment Program Database and genotypic testing database held at the British Columbia Center for Excellence laboratory
Calculation Method
Numerator: Number of new (excludes previously identified resistance) cases of drug resistance detected in each quarter Denominator: Total number of person-months of antiretroviral exposure in the quarter.
Limitations
This indicator show trends in the detection of resistance, however temporal trends in the frequency of resistance testing (increasing rates over time) may confound trends in the actual occurrence of resistance. Genotyping can only be conducted for individuals with pVL >= 250 copies/mL (although this may be of little clinical relevance).
Notes Revisions

STOP HIV/AIDS Pilot Project: 2012 (Q2) Indicators Report 56
Figure 29.1 Proportion of individuals on antiretroviral therapy who change antiretroviral drug
treatment by HSDA
0%
2%
4%
6%
8%
10%
12%
14%
2006Q1
2006Q2
2006Q3
2006Q4
2007Q1
2007Q2
2007Q3
2007Q4
2008Q1
2008Q2
2008Q3
2008Q4
2009Q1
2009Q2
2009Q3
2009Q4
2010Q1
2010Q2
2010Q3
2010Q4
2011Q1
2011Q2
2011Q3
2011Q4
2012Q1
2012Q2
Per
cent
age
Vancouver HSDA Northern Interior HSDA Other HSDAs All HSDAs
Indicator 29: Proportion of individuals on antiretroviral therapy who change antiretroviral drug treatment
Target: Decrease
Actual: VAN: 3.70% NI: 2.46%

STOP HIV/AIDS Pilot Project: 2012 (Q2) Indicators Report 57
Figure 29.2 Proportion of individuals on antiretroviral therapy who change antiretroviral drug treatment by gender
0%
2%
4%
6%
8%
10%
12%
14%
2006Q1
2006Q2
2006Q3
2006Q4
2007Q1
2007Q2
2007Q3
2007Q4
2008Q1
2008Q2
2008Q3
2008Q4
2009Q1
2009Q2
2009Q3
2009Q4
2010Q1
2010Q2
2010Q3
2010Q4
2011Q1
2011Q2
2011Q3
2011Q4
2012Q1
2012Q2
Percentage
Male Female
Indicator 29 Proportion of individuals on antiretroviral therapy who change antiretroviral drug
treatment
Interpretations & Comments
The trend remains steady with consistently low rates and over the past three quarters in all HSDA and among both sexes.
Description of Measure
The percentage of all individuals on antiretroviral therapy who change their therapeutic regimen over the course of the time period of interest.
Significance
Changes in therapy regimen occur most commonly as a result of drug intolerance, adverse drug reactions or treatment failure. By counting the occurrence of regimen change and identifying the reasons for these changes a broader and more inclusive estimate of the safety of antiretroviral therapies can be made. Please see limitations of adverse drug event reporting under Indicator 26.
Data Source(s) British Columbia Center for Excellence Drug Treatment Program Database
Calculation Method
Numerator: Total number of regimen changes, where a regimen change is defined as a class change in the NNRTI or PI component of the therapy regimen. Denominator: Total number of individuals on antiretroviral therapy.
Limitations The reason for change is often not well recorded and the indicator relies heavily on exclusion of treatment failure as the reason for therapy change.
Notes Revisions
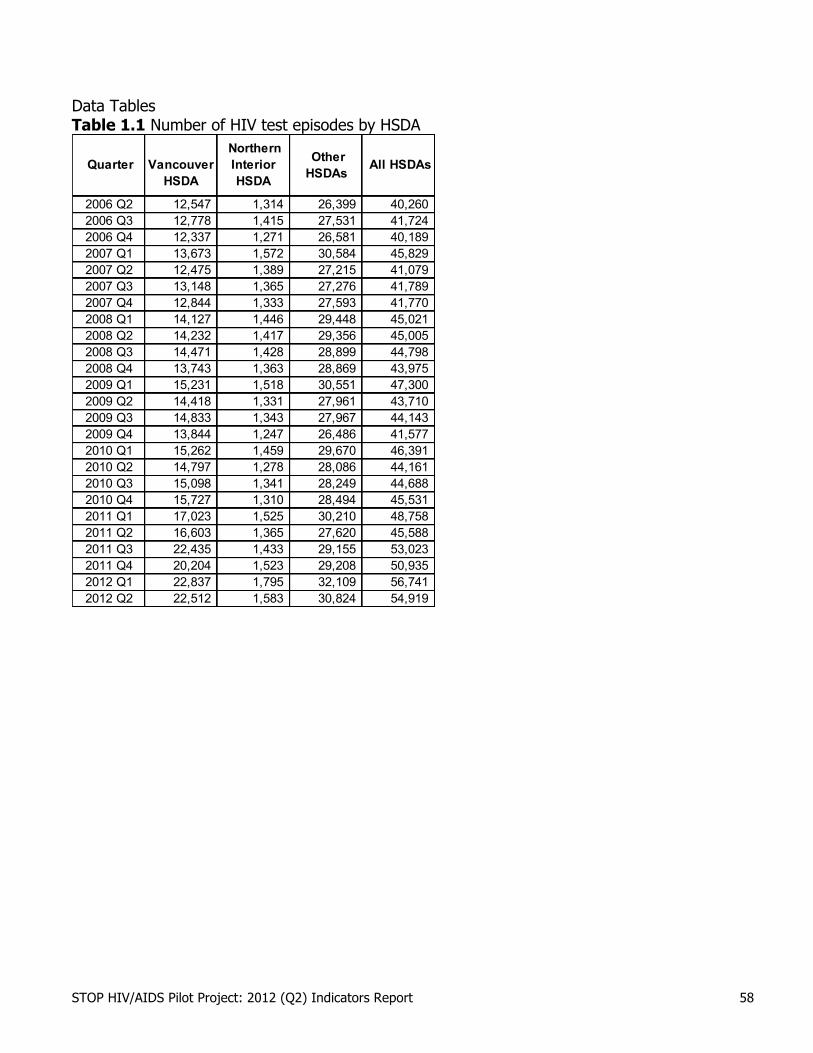
STOP HIV/AIDS Pilot Project: 2012 (Q2) Indicators Report 58
Data Tables Table 1.1 Number of HIV test episodes by HSDA
Quarter
Vancouver HSDA
Northern Interior HSDA
Other HSDAs All HSDAs
2006 Q2 12,547 1,314 26,399 40,260 2006 Q3 12,778 1,415 27,531 41,724 2006 Q4 12,337 1,271 26,581 40,189 2007 Q1 13,673 1,572 30,584 45,829 2007 Q2 12,475 1,389 27,215 41,079 2007 Q3 13,148 1,365 27,276 41,789 2007 Q4 12,844 1,333 27,593 41,770 2008 Q1 14,127 1,446 29,448 45,021 2008 Q2 14,232 1,417 29,356 45,005 2008 Q3 14,471 1,428 28,899 44,798 2008 Q4 13,743 1,363 28,869 43,975 2009 Q1 15,231 1,518 30,551 47,300 2009 Q2 14,418 1,331 27,961 43,710 2009 Q3 14,833 1,343 27,967 44,143 2009 Q4 13,844 1,247 26,486 41,577 2010 Q1 15,262 1,459 29,670 46,391 2010 Q2 14,797 1,278 28,086 44,161 2010 Q3 15,098 1,341 28,249 44,688 2010 Q4 15,727 1,310 28,494 45,531 2011 Q1 17,023 1,525 30,210 48,758 2011 Q2 16,603 1,365 27,620 45,588 2011 Q3 22,435 1,433 29,155 53,023 2011 Q4 20,204 1,523 29,208 50,935 2012 Q1 22,837 1,795 32,109 56,741 2012 Q2 22,512 1,583 30,824 54,919

STOP HIV/AIDS Pilot Project: 2012 (Q2) Indicators Report 59
Table 1.2 Number of HIV test episodes by HSDA – Males
Quarter
Vancouver HSDA
Northern Interior HSDA
Other HSDAs All HSDAs
2006 Q2 5,602 435 9,101 15,138 2006 Q3 5,585 456 9,479 15,520 2006 Q4 5,426 429 9,135 14,990 2007 Q1 6,161 502 10,558 17,221 2007 Q2 5,544 446 9,338 15,328 2007 Q3 5,929 429 9,198 15,556 2007 Q4 5,712 385 9,391 15,488 2008 Q1 6,323 503 10,068 16,894 2008 Q2 6,406 451 10,302 17,159 2008 Q3 6,562 512 9,951 17,025 2008 Q4 6,168 452 10,167 16,787 2009 Q1 7,077 525 10,505 18,107 2009 Q2 6,547 439 9,556 16,542 2009 Q3 6,798 454 9,491 16,743 2009 Q4 6,307 356 8,798 15,461 2010 Q1 7,034 535 10,075 17,644 2010 Q2 6,897 435 9,809 17,141 2010 Q3 6,932 436 9,627 16,995 2010 Q4 6,901 398 9,733 17,032 2011 Q1 7,398 472 10,408 18,278 2011 Q2 6,759 469 9,428 16,656 2011 Q3 7,776 468 10,000 18,244 2011 Q4 8,205 475 10,151 18,831 2012 Q1 9,756 599 11,325 21,680 2012 Q2 9,833 567 10,754 21,154

STOP HIV/AIDS Pilot Project: 2012 (Q2) Indicators Report 60
Table 1.3 Number of HIV test episodes by HSDA – Females
Quarter
Vancouver HSDA
Northern Interior HSDA
Other HSDAs All HSDAs
2006 Q2 6,728 855 17,005 24,588 2006 Q3 6,950 897 17,581 25,428 2006 Q4 6,630 806 16,972 24,408 2007 Q1 7,222 1,008 19,361 27,591 2007 Q2 6,665 882 17,349 24,896 2007 Q3 6,983 899 17,632 25,514 2007 Q4 6,932 911 17,809 25,652 2008 Q1 7,565 919 19,069 27,553 2008 Q2 7,553 915 18,702 27,170 2008 Q3 7,618 891 18,639 27,148 2008 Q4 7,315 889 18,445 26,649 2009 Q1 7,806 957 19,729 28,492 2009 Q2 7,416 869 18,160 26,445 2009 Q3 7,578 869 18,201 26,648 2009 Q4 7,160 877 17,481 25,518 2010 Q1 7,791 908 19,305 28,004 2010 Q2 7,487 832 18,003 26,322 2010 Q3 7,754 890 18,448 27,092 2010 Q4 7,536 851 18,560 26,947 2011 Q1 8,132 1,018 19,587 28,737 2011 Q2 7,454 835 17,973 26,262 2011 Q3 8,309 901 18,834 28,044 2011 Q4 9,206 976 18,857 29,039 2012 Q1 10,806 1,092 20,562 32,460 2012 Q2 10,895 927 19,799 31,621

STOP HIV/AIDS Pilot Project: 2012 (Q2) Indicators Report 61
Table 1.4 Number of POC HIV tests by HSDA
Vancouver HSDA
Northern Interior HSDA
2006 Q2 2006 Q3 2006 Q4 2007 Q1 2007 Q2 2007 Q3 2007 Q4 2008 Q1 2008 Q2 2008 Q3 2008 Q4 2009 Q1 2009 Q2 2009 Q3 2009 Q4 2010 Q1 312 0 2010 Q2 396 0 2010 Q3 503 0 2010 Q4 915 45 2011 Q1 1059 192011 Q2 1971 492011 Q3 5912 542011 Q4 2379 522012 Q1 1987 832012 Q2 1552 74

STOP HIV/AIDS Pilot Project: 2012 (Q2) Indicators Report 62
Table 2.1 Population HIV testing rate by HSDA
Year Vancouver HSDA Northern Interior
HSDA Other HSDAs All HSDAs HIV Test Rate HIV Test Rate HIV Test Rate HIV Test Rate
2006 38,940 6,356.2 5,227 3,720.9 109,850 3,147.1 154,017 3,629.4 2007 37,401 5,998.2 5,284 3,748.4 114,728 3,236.2 157,413 3,652.6 2008 40,946 6,500.4 5,209 3,667.2 118,085 3,269.3 164,240 3,746.5 2009 42,634 6,627.8 5,028 3,521.9 114,858 3,126.0 162,520 3,643.7 2010 43,010 6,524.4 4,944 3,438.4 116,876 3,135.1 164,830 3,637.9 2011 46,305 6,965.0 5,248 3,641.4 119,075 3,154.2 170,628 3,722.2
Table 2.2 Population HIV testing rate by HSDA – Males
Year Vancouver HSDA Northern Interior
HSDA Other HSDAs All HSDAs HIV Test Rate HIV Test Rate HIV Test Rate HIV Test Rate
2006 17,483 5,760.0 1,716 2,399.0 37,946 2,197.1 57,145 2,718.4 2007 16,940 5,479.6 1,680 2,339.8 39,550 2,254.0 58,170 2,723.8 2008 18,440 5,899.7 1,784 2,465.0 41,506 2,320.8 61,730 2,840.3 2009 19,415 6,078.1 1,635 2,247.2 39,668 2,179.7 60,718 2,744.8 2010 19,828 6,056.4 1,673 2,283.6 40,807 2,210.4 62,308 2,773.2 2011 21,199 6,419.6 1,775 2,419.2 42,051 2,250.0 65,025 2,861.3
Table 2.3 Population HIV testing rate by HSDA – Females
Year Vancouver HSDA Northern Interior
HSDA Other HSDAs All HSDAs HIV Test Rate HIV Test Rate HIV Test Rate HIV Test Rate
2006 20,524 6,761.9 3,345 4,676.4 70,210 4,065.2 94,079 4,475.4 2007 19,520 6,314.1 3,419 4,761.7 73,224 4,173.1 96,163 4,502.8 2008 21,469 6,868.8 3,307 4,569.3 75,372 4,214.3 100,148 4,607.9 2009 21,616 6,767.2 3,303 4,539.8 74,187 4,076.4 99,106 4,480.2 2010 21,600 6,597.7 3,216 4,389.8 75,160 4,071.3 99,976 4,449.8 2011 23,441 7,098.5 3,418 4,658.5 76,371 4,086.3 103,230 4,542.5
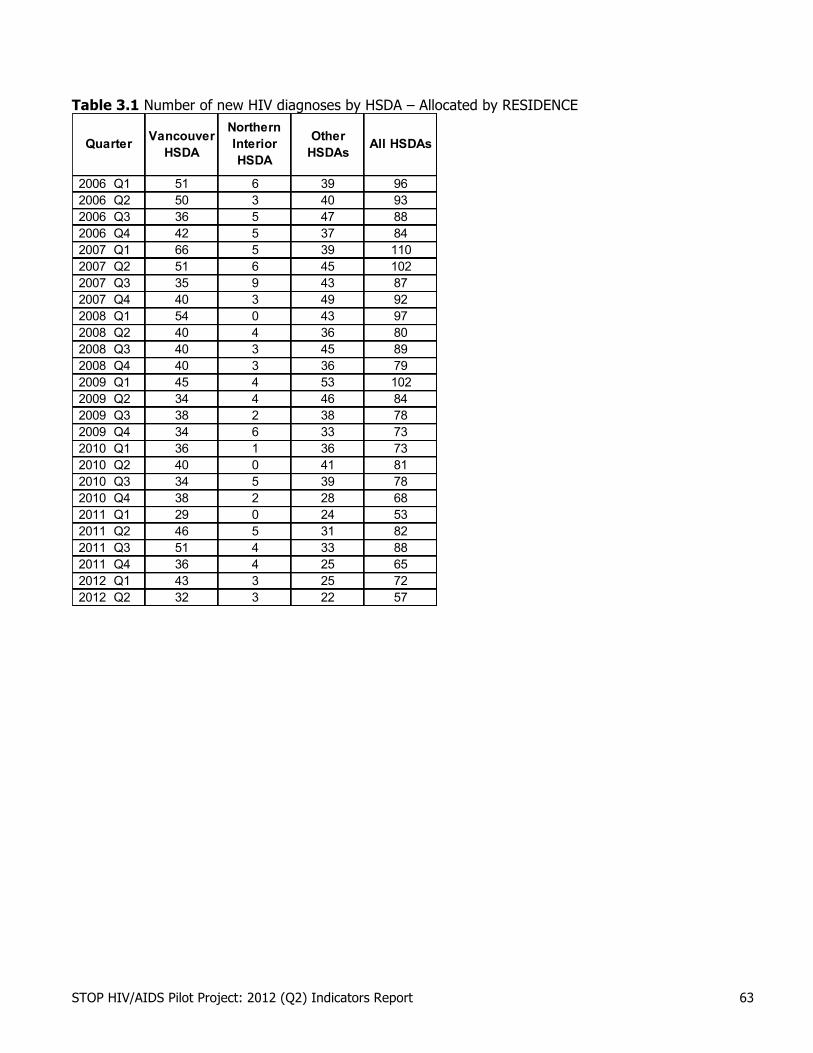
STOP HIV/AIDS Pilot Project: 2012 (Q2) Indicators Report 63
Table 3.1 Number of new HIV diagnoses by HSDA – Allocated by RESIDENCE
Quarter Vancouver HSDA
Northern Interior HSDA
Other HSDAs All HSDAs
2006 Q1 51 6 39 962006 Q2 50 3 40 932006 Q3 36 5 47 882006 Q4 42 5 37 842007 Q1 66 5 39 1102007 Q2 51 6 45 1022007 Q3 35 9 43 872007 Q4 40 3 49 922008 Q1 54 0 43 972008 Q2 40 4 36 802008 Q3 40 3 45 892008 Q4 40 3 36 792009 Q1 45 4 53 1022009 Q2 34 4 46 842009 Q3 38 2 38 782009 Q4 34 6 33 732010 Q1 36 1 36 732010 Q2 40 0 41 812010 Q3 34 5 39 782010 Q4 38 2 28 682011 Q1 29 0 24 532011 Q2 46 5 31 822011 Q3 51 4 33 882011 Q4 36 4 25 652012 Q1 43 3 25 722012 Q2 32 3 22 57
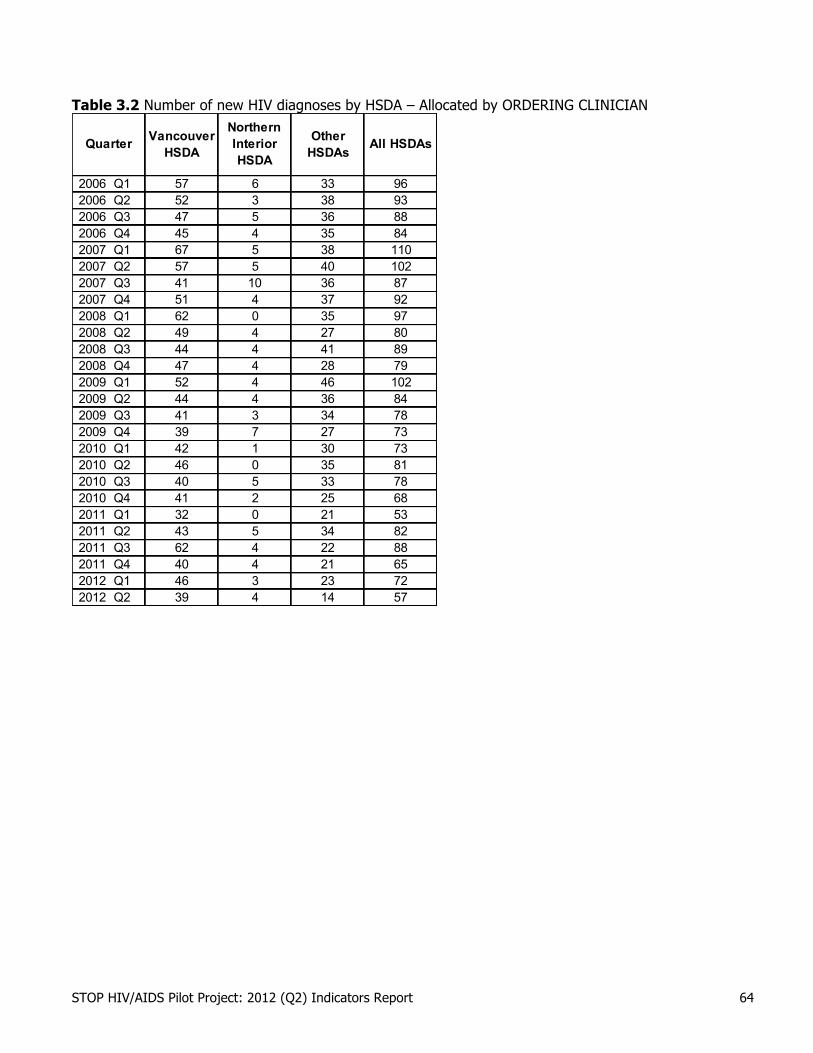
STOP HIV/AIDS Pilot Project: 2012 (Q2) Indicators Report 64
Table 3.2 Number of new HIV diagnoses by HSDA – Allocated by ORDERING CLINICIAN
Quarter Vancouver HSDA
Northern Interior HSDA
Other HSDAs All HSDAs
2006 Q1 57 6 33 962006 Q2 52 3 38 932006 Q3 47 5 36 882006 Q4 45 4 35 842007 Q1 67 5 38 1102007 Q2 57 5 40 1022007 Q3 41 10 36 872007 Q4 51 4 37 922008 Q1 62 0 35 972008 Q2 49 4 27 802008 Q3 44 4 41 892008 Q4 47 4 28 792009 Q1 52 4 46 1022009 Q2 44 4 36 842009 Q3 41 3 34 782009 Q4 39 7 27 732010 Q1 42 1 30 732010 Q2 46 0 35 812010 Q3 40 5 33 782010 Q4 41 2 25 682011 Q1 32 0 21 532011 Q2 43 5 34 822011 Q3 62 4 22 882011 Q4 40 4 21 652012 Q1 46 3 23 722012 Q2 39 4 14 57

STOP HIV/AIDS Pilot Project: 2012 (Q2) Indicators Report 65
Table 3.3 Number of new HIV diagnoses by gender, BC Quarter Male Female Other All
2006 Q1 81 15 0 962006 Q2 74 19 0 932006 Q3 67 21 0 882006 Q4 67 17 0 842007 Q1 88 21 1 1102007 Q2 79 21 2 1022007 Q3 65 22 0 872007 Q4 71 21 0 922008 Q1 83 14 0 972008 Q2 64 16 0 802008 Q3 75 14 0 892008 Q4 64 15 0 792009 Q1 81 21 0 1022009 Q2 68 16 0 842009 Q3 61 17 0 782009 Q4 56 17 0 732010 Q1 56 17 0 732010 Q2 61 20 0 812010 Q3 64 14 0 782010 Q4 57 11 0 682011 Q1 46 6 1 532011 Q2 63 19 0 822011 Q3 77 11 0 882011 Q4 58 7 0 652012 Q1 62 10 0 722012 Q2 47 10 0 57
Other = Transgender + Gender Unknown

STOP HIV/AIDS Pilot Project: 2012 (Q2) Indicators Report 66
Table 3.4 Number of new HIV diagnoses by Aboriginal status, BC
Quarter Aboriginal Non Aboriginal
Unknown Ethnicity All
2006 Q1 12 80 4 962006 Q2 17 74 2 932006 Q3 15 68 5 882006 Q4 12 66 6 842007 Q1 20 84 6 1102007 Q2 16 78 8 1022007 Q3 13 73 1 872007 Q4 14 72 6 922008 Q1 12 82 3 972008 Q2 10 66 4 802008 Q3 7 76 6 892008 Q4 17 56 6 792009 Q1 17 81 4 1022009 Q2 13 67 4 842009 Q3 13 61 4 782009 Q4 14 55 4 732010 Q1 7 65 1 732010 Q2 13 64 4 812010 Q3 13 63 2 782010 Q4 6 57 5 682011 Q1 8 44 1 532011 Q2 15 63 4 822011 Q3 10 71 7 882011 Q4 12 51 2 65
Unknown: ethnicity not stated
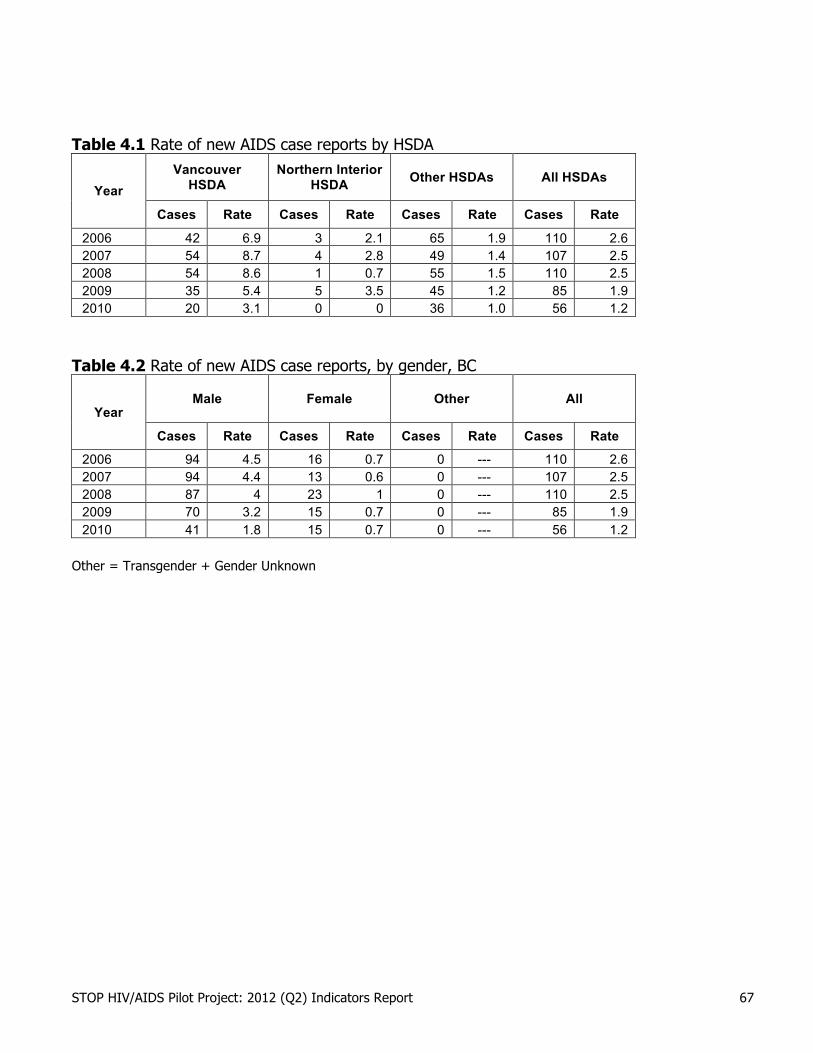
STOP HIV/AIDS Pilot Project: 2012 (Q2) Indicators Report 67
Table 4.1 Rate of new AIDS case reports by HSDA
Year Vancouver
HSDA Northern Interior
HSDA Other HSDAs All HSDAs
Cases Rate Cases Rate Cases Rate Cases Rate
2006 42 6.9 3 2.1 65 1.9 110 2.6 2007 54 8.7 4 2.8 49 1.4 107 2.5 2008 54 8.6 1 0.7 55 1.5 110 2.5 2009 35 5.4 5 3.5 45 1.2 85 1.9 2010 20 3.1 0 0 36 1.0 56 1.2
Table 4.2 Rate of new AIDS case reports, by gender, BC
Year Male Female Other All
Cases Rate Cases Rate Cases Rate Cases Rate
2006 94 4.5 16 0.7 0 --- 110 2.6 2007 94 4.4 13 0.6 0 --- 107 2.5 2008 87 4 23 1 0 --- 110 2.5 2009 70 3.2 15 0.7 0 --- 85 1.9 2010 41 1.8 15 0.7 0 --- 56 1.2
Other = Transgender + Gender Unknown

STOP HIV/AIDS Pilot Project: 2012 (Q2) Indicators Report 68
Table 5.1 Percentage positivity among persons tested for HIV by HSDA
FirstHIV+ HIV Test % First
HIV+ HIV Test % FirstHIV+ HIV Test % First
HIV+ HIV Test %
2006 Q2 62 12,431 0.50% 3 1,302 0.23% 43 26,180 0.16% 108 39,913 0.27%2006 Q3 59 12,667 0.47% 5 1,405 0.36% 43 27,288 0.16% 107 41,360 0.26%2006 Q4 64 12,225 0.52% 5 1,258 0.40% 44 26,383 0.17% 113 39,866 0.28%2007 Q1 80 13,540 0.59% 5 1,561 0.32% 49 30,326 0.16% 134 45,427 0.29%2007 Q2 68 12,342 0.55% 7 1,378 0.51% 49 26,997 0.18% 124 40,717 0.30%2007 Q3 57 13,001 0.44% 10 1,352 0.74% 45 27,063 0.17% 112 41,416 0.27%2007 Q4 62 12,727 0.49% 5 1,315 0.38% 52 27,392 0.19% 119 41,434 0.29%2008 Q1 79 13,964 0.57% 1 1,430 0.07% 49 29,179 0.17% 129 44,573 0.29%2008 Q2 68 14,079 0.48% 6 1,408 0.43% 30 29,094 0.10% 104 44,581 0.23%2008 Q3 55 14,298 0.38% 3 1,412 0.21% 52 28,629 0.18% 110 44,339 0.25%2008 Q4 59 13,615 0.43% 4 1,344 0.30% 41 28,648 0.14% 104 43,607 0.24%2009 Q1 65 15,053 0.43% 4 1,503 0.27% 58 30,291 0.19% 127 46,847 0.27%2009 Q2 60 14,257 0.42% 4 1,322 0.30% 49 27,712 0.18% 113 43,291 0.26%2009 Q3 52 14,674 0.35% 4 1,326 0.30% 41 27,725 0.15% 97 43,725 0.22%2009 Q4 49 13,714 0.36% 7 1,240 0.56% 40 26,274 0.15% 96 41,228 0.23%2010 Q1 61 15,062 0.40% 1 1,440 0.07% 34 29,385 0.12% 96 45,887 0.21%2010 Q2 53 14,624 0.36% 0 1,268 0.00% 42 27,870 0.15% 95 43,762 0.22%2010 Q3 54 14,900 0.36% 4 1,330 0.30% 45 28,012 0.16% 103 44,242 0.23%2010 Q4 51 14,638 0.35% 2 1,250 0.16% 28 28,239 0.10% 81 44,127 0.18%2011 Q1 40 15,731 0.25% 0 1,491 0.00% 26 29,929 0.09% 66 47,151 0.14%2011 Q2 61 14,454 0.42% 4 1,306 0.31% 43 27,302 0.16% 108 43,062 0.25%2011 Q3 88 16,285 0.54% 5 1,357 0.37% 37 28,752 0.13% 130 46,394 0.28%2011 Q4 58 17,605 0.33% 4 1,450 0.28% 30 28,912 0.10% 92 47,967 0.19%2012 Q1 62 20,568 0.30% 8 1,691 0.47% 34 31,703 0.11% 104 53,962 0.19%2012 Q2 54 20,697 0.26% 6 1,483 0.40% 21 30,393 0.07% 81 52,573 0.15%
All HSDA
Quarter
Vancouver HSDA Northern Interior HSDA Other HSDA
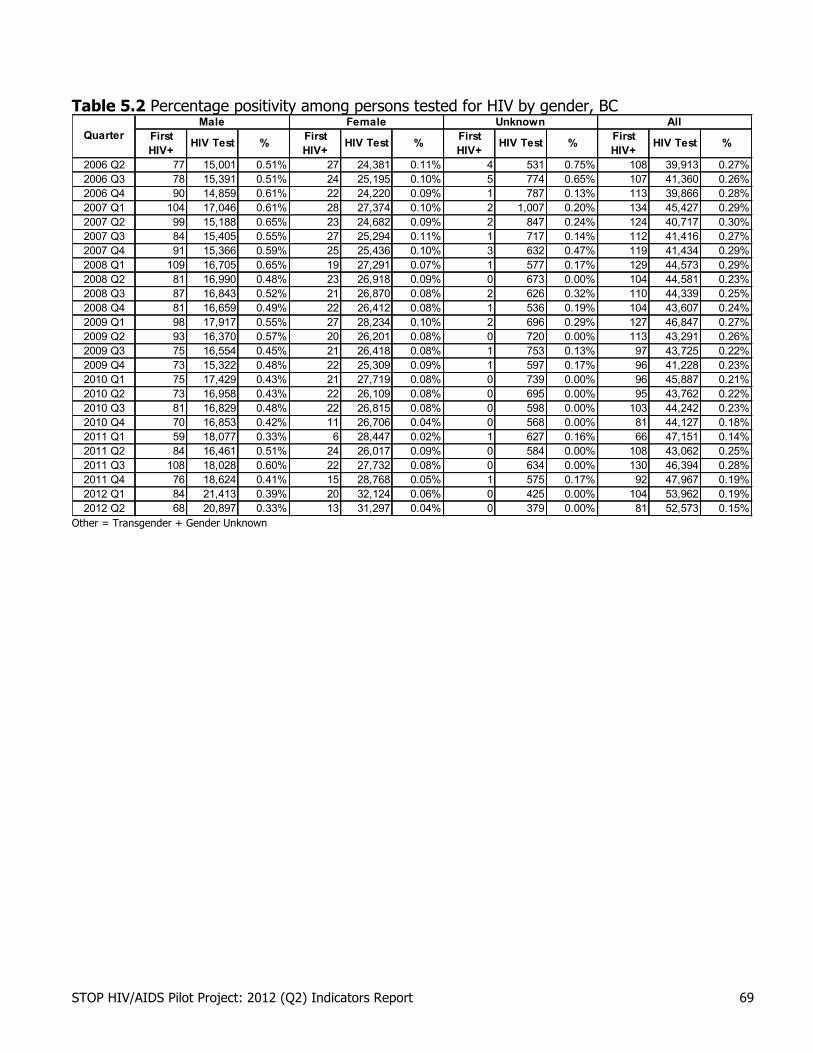
STOP HIV/AIDS Pilot Project: 2012 (Q2) Indicators Report 69
Table 5.2 Percentage positivity among persons tested for HIV by gender, BC
FirstHIV+ HIV Test % First
HIV+ HIV Test % FirstHIV+ HIV Test % First
HIV+ HIV Test %
2006 Q2 77 15,001 0.51% 27 24,381 0.11% 4 531 0.75% 108 39,913 0.27%2006 Q3 78 15,391 0.51% 24 25,195 0.10% 5 774 0.65% 107 41,360 0.26%2006 Q4 90 14,859 0.61% 22 24,220 0.09% 1 787 0.13% 113 39,866 0.28%2007 Q1 104 17,046 0.61% 28 27,374 0.10% 2 1,007 0.20% 134 45,427 0.29%2007 Q2 99 15,188 0.65% 23 24,682 0.09% 2 847 0.24% 124 40,717 0.30%2007 Q3 84 15,405 0.55% 27 25,294 0.11% 1 717 0.14% 112 41,416 0.27%2007 Q4 91 15,366 0.59% 25 25,436 0.10% 3 632 0.47% 119 41,434 0.29%2008 Q1 109 16,705 0.65% 19 27,291 0.07% 1 577 0.17% 129 44,573 0.29%2008 Q2 81 16,990 0.48% 23 26,918 0.09% 0 673 0.00% 104 44,581 0.23%2008 Q3 87 16,843 0.52% 21 26,870 0.08% 2 626 0.32% 110 44,339 0.25%2008 Q4 81 16,659 0.49% 22 26,412 0.08% 1 536 0.19% 104 43,607 0.24%2009 Q1 98 17,917 0.55% 27 28,234 0.10% 2 696 0.29% 127 46,847 0.27%2009 Q2 93 16,370 0.57% 20 26,201 0.08% 0 720 0.00% 113 43,291 0.26%2009 Q3 75 16,554 0.45% 21 26,418 0.08% 1 753 0.13% 97 43,725 0.22%2009 Q4 73 15,322 0.48% 22 25,309 0.09% 1 597 0.17% 96 41,228 0.23%2010 Q1 75 17,429 0.43% 21 27,719 0.08% 0 739 0.00% 96 45,887 0.21%2010 Q2 73 16,958 0.43% 22 26,109 0.08% 0 695 0.00% 95 43,762 0.22%2010 Q3 81 16,829 0.48% 22 26,815 0.08% 0 598 0.00% 103 44,242 0.23%2010 Q4 70 16,853 0.42% 11 26,706 0.04% 0 568 0.00% 81 44,127 0.18%2011 Q1 59 18,077 0.33% 6 28,447 0.02% 1 627 0.16% 66 47,151 0.14%2011 Q2 84 16,461 0.51% 24 26,017 0.09% 0 584 0.00% 108 43,062 0.25%2011 Q3 108 18,028 0.60% 22 27,732 0.08% 0 634 0.00% 130 46,394 0.28%2011 Q4 76 18,624 0.41% 15 28,768 0.05% 1 575 0.17% 92 47,967 0.19%2012 Q1 84 21,413 0.39% 20 32,124 0.06% 0 425 0.00% 104 53,962 0.19%2012 Q2 68 20,897 0.33% 13 31,297 0.04% 0 379 0.00% 81 52,573 0.15%
AllQuarter
Male Female Unknown
Other = Transgender + Gender Unknown
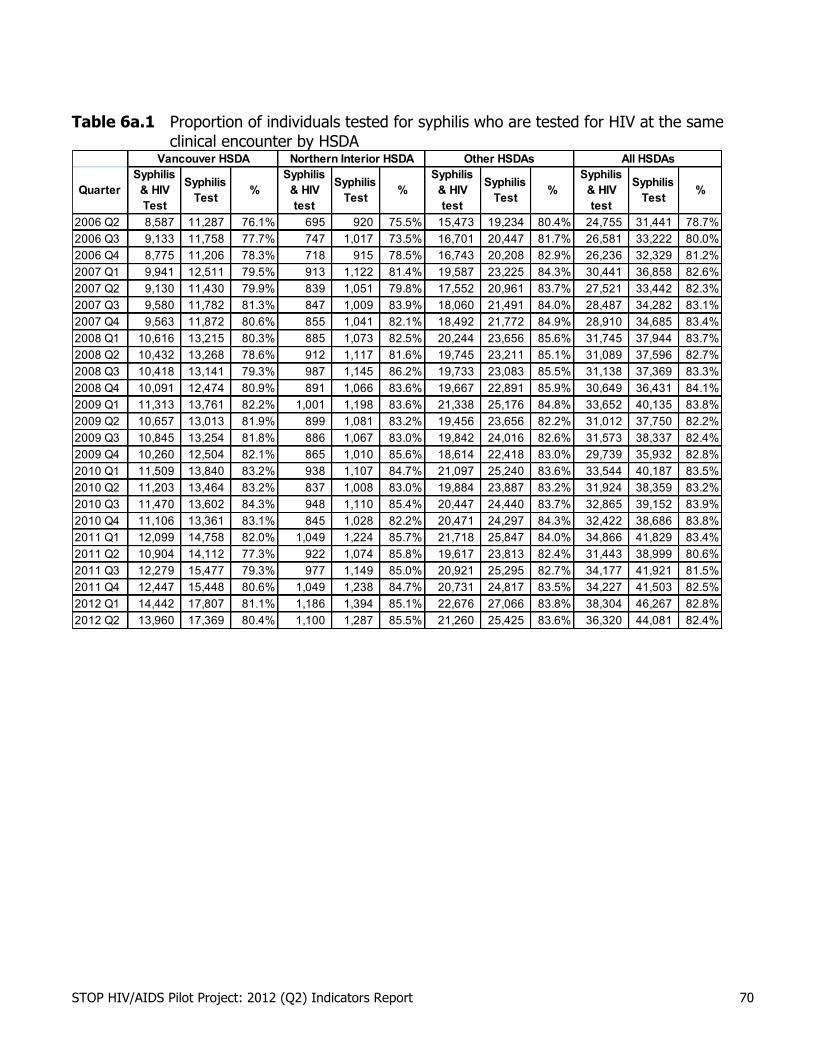
STOP HIV/AIDS Pilot Project: 2012 (Q2) Indicators Report 70
Table 6a.1 Proportion of individuals tested for syphilis who are tested for HIV at the same
clinical encounter by HSDA
QuarterSyphilis
& HIV Test
Syphilis Test %
Syphilis & HIV test
Syphilis Test %
Syphilis & HIV test
Syphilis Test %
Syphilis & HIV test
Syphilis Test %
2006 Q2 8,587 11,287 76.1% 695 920 75.5% 15,473 19,234 80.4% 24,755 31,441 78.7%2006 Q3 9,133 11,758 77.7% 747 1,017 73.5% 16,701 20,447 81.7% 26,581 33,222 80.0%2006 Q4 8,775 11,206 78.3% 718 915 78.5% 16,743 20,208 82.9% 26,236 32,329 81.2%2007 Q1 9,941 12,511 79.5% 913 1,122 81.4% 19,587 23,225 84.3% 30,441 36,858 82.6%2007 Q2 9,130 11,430 79.9% 839 1,051 79.8% 17,552 20,961 83.7% 27,521 33,442 82.3%2007 Q3 9,580 11,782 81.3% 847 1,009 83.9% 18,060 21,491 84.0% 28,487 34,282 83.1%2007 Q4 9,563 11,872 80.6% 855 1,041 82.1% 18,492 21,772 84.9% 28,910 34,685 83.4%2008 Q1 10,616 13,215 80.3% 885 1,073 82.5% 20,244 23,656 85.6% 31,745 37,944 83.7%2008 Q2 10,432 13,268 78.6% 912 1,117 81.6% 19,745 23,211 85.1% 31,089 37,596 82.7%2008 Q3 10,418 13,141 79.3% 987 1,145 86.2% 19,733 23,083 85.5% 31,138 37,369 83.3%2008 Q4 10,091 12,474 80.9% 891 1,066 83.6% 19,667 22,891 85.9% 30,649 36,431 84.1%2009 Q1 11,313 13,761 82.2% 1,001 1,198 83.6% 21,338 25,176 84.8% 33,652 40,135 83.8%2009 Q2 10,657 13,013 81.9% 899 1,081 83.2% 19,456 23,656 82.2% 31,012 37,750 82.2%2009 Q3 10,845 13,254 81.8% 886 1,067 83.0% 19,842 24,016 82.6% 31,573 38,337 82.4%2009 Q4 10,260 12,504 82.1% 865 1,010 85.6% 18,614 22,418 83.0% 29,739 35,932 82.8%2010 Q1 11,509 13,840 83.2% 938 1,107 84.7% 21,097 25,240 83.6% 33,544 40,187 83.5%2010 Q2 11,203 13,464 83.2% 837 1,008 83.0% 19,884 23,887 83.2% 31,924 38,359 83.2%2010 Q3 11,470 13,602 84.3% 948 1,110 85.4% 20,447 24,440 83.7% 32,865 39,152 83.9%2010 Q4 11,106 13,361 83.1% 845 1,028 82.2% 20,471 24,297 84.3% 32,422 38,686 83.8%2011 Q1 12,099 14,758 82.0% 1,049 1,224 85.7% 21,718 25,847 84.0% 34,866 41,829 83.4%2011 Q2 10,904 14,112 77.3% 922 1,074 85.8% 19,617 23,813 82.4% 31,443 38,999 80.6%2011 Q3 12,279 15,477 79.3% 977 1,149 85.0% 20,921 25,295 82.7% 34,177 41,921 81.5%2011 Q4 12,447 15,448 80.6% 1,049 1,238 84.7% 20,731 24,817 83.5% 34,227 41,503 82.5%2012 Q1 14,442 17,807 81.1% 1,186 1,394 85.1% 22,676 27,066 83.8% 38,304 46,267 82.8%2012 Q2 13,960 17,369 80.4% 1,100 1,287 85.5% 21,260 25,425 83.6% 36,320 44,081 82.4%
Vancouver HSDA Northern Interior HSDA Other HSDAs All HSDAs

STOP HIV/AIDS Pilot Project: 2012 (Q2) Indicators Report 71
Table 6a.2 Proportion of individuals tested for syphilis who are tested for HIV at the same clinical encounter by HSDA – Males
QuarterSyphilis
& HIV Test
Syphilis Test %
Syphilis & HIV test
Syphilis Test %
Syphilis & HIV test
Syphilis Test %
Syphilis & HIV test
Syphilis Test %
2006 Q2 3,641 5,166 70.5% 129 232 55.6% 3,992 5,535 72.1% 7,762 10,933 71.0%2006 Q3 3,765 5,293 71.1% 158 279 56.6% 4,396 5,882 74.7% 8,319 11,454 72.6%2006 Q4 3,681 5,141 71.6% 163 255 63.9% 4,433 5,862 75.6% 8,277 11,258 73.5%2007 Q1 4,249 5,886 72.2% 178 278 64.0% 5,223 6,668 78.3% 9,650 12,832 75.2%2007 Q2 3,859 5,257 73.4% 197 301 65.4% 4,765 6,196 76.9% 8,821 11,754 75.0%2007 Q3 4,117 5,556 74.1% 196 265 74.0% 4,980 6,435 77.4% 9,293 12,256 75.8%2007 Q4 3,887 5,396 72.0% 191 280 68.2% 5,042 6,454 78.1% 9,120 12,130 75.2%2008 Q1 4,347 6,020 72.2% 215 312 68.9% 5,624 7,142 78.7% 10,186 13,474 75.6%2008 Q2 4,258 6,075 70.1% 218 315 69.2% 5,583 7,111 78.5% 10,059 13,501 74.5%2008 Q3 4,302 6,108 70.4% 289 353 81.9% 5,538 6,961 79.6% 10,129 13,422 75.5%2008 Q4 4,146 5,656 73.3% 247 336 73.5% 5,702 7,184 79.4% 10,095 13,176 76.6%2009 Q1 4,791 6,467 74.1% 266 352 75.6% 5,884 7,633 77.1% 10,941 14,452 75.7%2009 Q2 4,440 5,983 74.2% 239 320 74.7% 5,417 7,345 73.8% 10,096 13,648 74.0%2009 Q3 4,551 6,131 74.2% 247 326 75.8% 5,517 7,386 74.7% 10,315 13,843 74.5%2009 Q4 4,328 5,795 74.7% 195 259 75.3% 4,961 6,670 74.4% 9,484 12,724 74.5%2010 Q1 4,883 6,402 76.3% 283 371 76.3% 5,774 7,636 75.6% 10,940 14,409 75.9%2010 Q2 4,835 6,290 76.9% 230 314 73.2% 5,683 7,561 75.2% 10,748 14,165 75.9%2010 Q3 4,902 6,309 77.7% 282 354 79.7% 5,745 7,596 75.6% 10,929 14,259 76.6%2010 Q4 4,701 6,143 76.5% 237 320 74.1% 5,790 7,500 77.2% 10,728 13,963 76.8%2011 Q1 5,144 6,896 74.6% 272 352 77.3% 6,212 8,120 76.5% 11,628 15,368 75.7%2011 Q2 4,592 6,663 68.9% 286 363 78.8% 5,627 7,518 74.8% 10,505 14,544 72.2%2011 Q3 5,374 7,529 71.4% 296 373 79.4% 6,047 7,968 75.9% 11,717 15,870 73.8%2011 Q4 5,183 7,172 72.3% 309 394 78.4% 6,052 7,921 76.4% 11,544 15,487 74.5%
2012 Q1 6,085 8,331 73.0% 350 441 79.4% 6,597 8,582 76.9% 13,032 17,354 75.1%
2012 Q2 5,940 8,211 72.3% 369 450 82.0% 6,121 8,096 75.6% 12,430 16,757 74.2%
Vancouver HSDA Northern Interior HSDA Other HSDAs All HSDAs

STOP HIV/AIDS Pilot Project: 2012 (Q2) Indicators Report 72
Table 6a.3 Proportion of individuals tested for syphilis who are tested for HIV at the same clinical encounter by HSDA – Females
Quarter Syphilis & HIV
Syphilis Test
% Syphilis & HIV
Syphilis Test
% Syphilis & HIV
Syphilis Test
% Syphilis & HIV
Syphilis Test
%
2006 Q2 4,856 5,954 81.6% 563 684 82.3% 11,431 13,607 84.0% 16,850 20,245 83.2%2006 Q3 5,237 6,268 83.6% 578 721 80.2% 12,182 14,369 84.8% 17,997 21,358 84.3%2006 Q4 4,916 5,853 84.0% 549 652 84.2% 12,150 14,129 86.0% 17,615 20,634 85.4%2007 Q1 5,505 6,423 85.7% 715 820 87.2% 14,139 16,268 86.9% 20,359 23,511 86.6%2007 Q2 5,088 5,967 85.3% 623 725 85.9% 12,618 14,544 86.8% 18,329 21,236 86.3%2007 Q3 5,291 6,041 87.6% 642 732 87.7% 12,909 14,843 87.0% 18,842 21,616 87.2%2007 Q4 5,515 6,306 87.5% 653 749 87.2% 13,287 15,119 87.9% 19,455 22,174 87.7%2008 Q1 6,108 7,026 86.9% 658 745 88.3% 14,497 16,362 88.6% 21,263 24,133 88.1%2008 Q2 5,986 6,991 85.6% 672 778 86.4% 14,008 15,920 88.0% 20,666 23,689 87.2%2008 Q3 5,903 6,799 86.8% 689 779 88.4% 14,055 15,956 88.1% 20,647 23,534 87.7%2008 Q4 5,758 6,603 87.2% 642 723 88.8% 13,861 15,587 88.9% 20,261 22,913 88.4%2009 Q1 6,257 7,020 89.1% 719 826 87.0% 15,297 17,357 88.1% 22,273 25,203 88.4%2009 Q2 5,889 6,687 88.1% 651 751 86.7% 13,920 16,165 86.1% 20,460 23,603 86.7%2009 Q3 5,986 6,787 88.2% 632 732 86.3% 14,188 16,460 86.2% 20,806 23,979 86.8%2009 Q4 5,668 6,436 88.1% 664 742 89.5% 13,548 15,627 86.7% 19,880 22,805 87.2%2010 Q1 6,347 7,144 88.8% 649 728 89.1% 15,177 17,437 87.0% 22,173 25,309 87.6%2010 Q2 6,124 6,912 88.6% 602 688 87.5% 14,062 16,173 86.9% 20,788 23,773 87.4%2010 Q3 6,323 7,023 90.0% 658 748 88.0% 14,614 16,742 87.3% 21,595 24,513 88.1%2010 Q4 6,155 6,959 88.4% 605 705 85.8% 14,571 16,675 87.4% 21,331 24,339 87.6%2011 Q1 6,667 7,566 88.1% 770 863 89.2% 15,394 17,602 87.5% 22,831 26,031 87.7%2011 Q2 5,998 7,130 84.1% 629 701 89.7% 13,904 16,192 85.9% 20,531 24,023 85.5%2011 Q3 6,610 7,650 86.4% 677 771 87.8% 14,765 17,198 85.9% 22,052 25,619 86.1%2011 Q4 6,982 7,987 87.4% 727 828 87.8% 14,597 16,803 86.9% 22,306 25,618 87.1%2012 Q1 8,222 9,338 88.0% 827 941 87.9% 16,019 18,411 87.0% 25,068 28,690 87.4%2012 Q2 7,945 9,079 87.5% 720 825 87.3% 15,077 17,255 87.4% 23,742 27,159 87.4%
Vancouver HSDA Northern Interior HSDA Other HSDAs All HSDAs

STOP HIV/AIDS Pilot Project: 2012 (Q2) Indicators Report 73
Table 6b.1 Proportion of individuals with a new STI diagnosis (e.g., syphilis) who are simultaneously tested for HIV by HSDA
QuarterSTI Dx & HIV Test STI Dx %
STI Dx & HIV Test STI Dx %
STI Dx & HIV Test STI Dx %
STI Dx & HIV Test STI Dx %
2006 Q2 184 559 32.9% 19 112 17.0% 436 1818 24.0% 639 2489 25.7%2006 Q3 184 504 36.5% 31 127 24.4% 451 1914 23.6% 666 2545 26.2%2006 Q4 187 538 34.8% 13 133 9.8% 392 1854 21.1% 592 2525 23.4%2007 Q1 187 618 30.3% 26 145 17.9% 473 2084 22.7% 686 2847 24.1%2007 Q2 185 532 34.8% 43 168 25.6% 400 1913 20.9% 628 2613 24.0%2007 Q3 217 589 36.8% 25 151 16.6% 481 2065 23.3% 723 2805 25.8%2007 Q4 196 561 34.9% 33 162 20.4% 513 1973 26.0% 742 2696 27.5%2008 Q1 185 536 34.5% 39 168 23.2% 502 2113 23.8% 726 2817 25.8%2008 Q2 217 600 36.2% 41 189 21.7% 521 2126 24.5% 779 2915 26.7%2008 Q3 202 573 35.3% 32 162 19.8% 499 2232 22.4% 733 2967 24.7%2008 Q4 217 577 37.6% 28 150 18.7% 582 2353 24.7% 827 3080 26.9%2009 Q1 229 593 38.6% 37 158 23.4% 519 2146 24.2% 785 2897 27.1%2009 Q2 195 548 35.6% 28 143 19.6% 505 2206 22.9% 728 2897 25.1%2009 Q3 240 655 36.6% 31 180 17.2% 566 2412 23.5% 837 3247 25.8%2009 Q4 228 589 38.7% 30 160 18.8% 491 2241 21.9% 749 2990 25.1%2010 Q1 257 666 38.6% 32 150 21.3% 528 2438 21.7% 817 3254 25.1%2010 Q2 232 626 37.1% 28 161 17.4% 513 2276 22.5% 773 3063 25.2%2010 Q3 281 709 39.6% 37 187 19.8% 530 2264 23.4% 848 3160 26.8%2010 Q4 311 750 41.5% 29 169 17.2% 550 2340 23.5% 890 3259 27.3%2011 Q1 313 748 41.8% 28 180 15.6% 575 2321 24.8% 916 3249 28.2%2011 Q2 298 739 40.3% 35 165 21.2% 530 2312 22.9% 863 3216 26.8%2011 Q3 318 752 42.3% 27 154 17.5% 588 2400 24.5% 933 3306 28.2%2011 Q4 300 716 41.9% 41 166 24.7% 567 2291 24.7% 908 3173 28.6%2012 Q1 325 782 41.6% 40 167 24.0% 590 2316 25.5% 955 3265 29.2%
Vancouver HSDA Northern Interior HSDA Other HSDAs All HSDAs

STOP HIV/AIDS Pilot Project: 2012 (Q2) Indicators Report 74
Table 6b.2 Proportion of individuals with a new STI diagnosis (e.g., syphilis) who are simultaneously tested for HIV HSDA – Males
Vancouver HSDA Northern Interior HSDA Other HSDAs All HSDAs
Quarter STI
Dx & HIV Test
STI Dx %
STI Dx & HIV Test
STI Dx %
STI Dx & HIV Test
STI Dx %
STI Dx & HIV Test
STI Dx %
2006 Q2 105 275 38.2% 6 35 17.1% 173 594 29.1% 284 904 31.4%
2006 Q3 95 233 40.8% 12 40 30.0% 192 651 29.5% 299 924 32.4%
2006 Q4 98 242 40.5% 7 45 15.6% 165 610 27.0% 270 897 30.1%
2007 Q1 100 282 35.5% 8 42 19.0% 208 717 29.0% 316 1041 30.4%
2007 Q2 93 241 38.6% 13 53 24.5% 156 663 23.5% 262 957 27.4%
2007 Q3 106 269 39.4% 9 52 17.3% 221 698 31.7% 336 1019 33.0%
2007 Q4 104 254 40.9% 18 65 27.7% 208 679 30.6% 330 998 33.1%
2008 Q1 105 245 42.9% 17 68 25.0% 216 742 29.1% 338 1055 32.0%
2008 Q2 123 262 46.9% 9 57 15.8% 212 725 29.2% 344 1044 33.0%
2008 Q3 99 253 39.1% 15 64 23.4% 227 805 28.2% 341 1122 30.4%
2008 Q4 108 252 42.9% 6 41 14.6% 255 867 29.4% 369 1160 31.8%
2009 Q1 130 265 49.1% 11 52 21.2% 241 781 30.9% 382 1098 34.8%
2009 Q2 107 242 44.2% 8 50 16.0% 219 754 29.0% 334 1046 31.9%
2009 Q3 124 283 43.8% 15 65 23.1% 233 824 28.3% 372 1172 31.7%
2009 Q4 131 287 45.6% 9 54 16.7% 200 781 25.6% 340 1122 30.3%
2010 Q1 137 297 46.1% 9 42 21.4% 219 823 26.6% 365 1162 31.4%
2010 Q2 111 250 44.4% 10 54 18.5% 239 763 31.3% 360 1067 33.7%
2010 Q3 160 346 46.2% 17 67 25.4% 228 751 30.4% 405 1164 34.8%
2010 Q4 185 354 52.3% 10 61 16.4% 239 806 29.7% 434 1221 35.5%
2011 Q1 181 360 50.3% 15 64 23.4% 240 792 30.3% 436 1216 35.9%
2011 Q2 158 338 46.7% 20 62 32.3% 208 745 27.9% 386 1145 33.7%
2011 Q3 177 394 44.9% 9 55 16.4% 254 816 31.1% 440 1265 34.8%
2011 Q4 175 383 45.7% 17 68 25.0% 236 803 29.4% 428 1254 34.1%
2012 Q1 204 417 48.9% 12 49 24.5% 257 830 31.0% 473 1296 36.5%
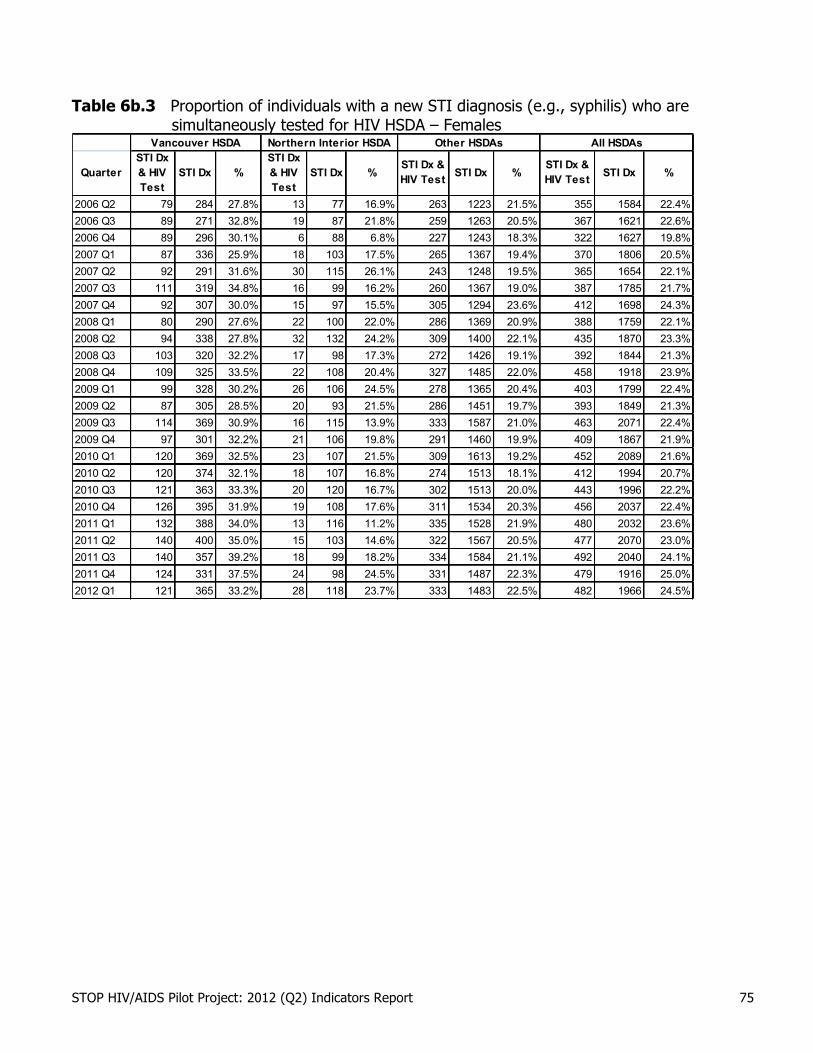
STOP HIV/AIDS Pilot Project: 2012 (Q2) Indicators Report 75
Table 6b.3 Proportion of individuals with a new STI diagnosis (e.g., syphilis) who are simultaneously tested for HIV HSDA – Females
QuarterSTI Dx & HIV Test
STI Dx %STI Dx & HIV Test
STI Dx %STI Dx & HIV Test STI Dx %
STI Dx & HIV Test STI Dx %
2006 Q2 79 284 27.8% 13 77 16.9% 263 1223 21.5% 355 1584 22.4%2006 Q3 89 271 32.8% 19 87 21.8% 259 1263 20.5% 367 1621 22.6%2006 Q4 89 296 30.1% 6 88 6.8% 227 1243 18.3% 322 1627 19.8%2007 Q1 87 336 25.9% 18 103 17.5% 265 1367 19.4% 370 1806 20.5%2007 Q2 92 291 31.6% 30 115 26.1% 243 1248 19.5% 365 1654 22.1%2007 Q3 111 319 34.8% 16 99 16.2% 260 1367 19.0% 387 1785 21.7%2007 Q4 92 307 30.0% 15 97 15.5% 305 1294 23.6% 412 1698 24.3%2008 Q1 80 290 27.6% 22 100 22.0% 286 1369 20.9% 388 1759 22.1%2008 Q2 94 338 27.8% 32 132 24.2% 309 1400 22.1% 435 1870 23.3%2008 Q3 103 320 32.2% 17 98 17.3% 272 1426 19.1% 392 1844 21.3%2008 Q4 109 325 33.5% 22 108 20.4% 327 1485 22.0% 458 1918 23.9%2009 Q1 99 328 30.2% 26 106 24.5% 278 1365 20.4% 403 1799 22.4%2009 Q2 87 305 28.5% 20 93 21.5% 286 1451 19.7% 393 1849 21.3%2009 Q3 114 369 30.9% 16 115 13.9% 333 1587 21.0% 463 2071 22.4%2009 Q4 97 301 32.2% 21 106 19.8% 291 1460 19.9% 409 1867 21.9%2010 Q1 120 369 32.5% 23 107 21.5% 309 1613 19.2% 452 2089 21.6%2010 Q2 120 374 32.1% 18 107 16.8% 274 1513 18.1% 412 1994 20.7%2010 Q3 121 363 33.3% 20 120 16.7% 302 1513 20.0% 443 1996 22.2%2010 Q4 126 395 31.9% 19 108 17.6% 311 1534 20.3% 456 2037 22.4%2011 Q1 132 388 34.0% 13 116 11.2% 335 1528 21.9% 480 2032 23.6%2011 Q2 140 400 35.0% 15 103 14.6% 322 1567 20.5% 477 2070 23.0%2011 Q3 140 357 39.2% 18 99 18.2% 334 1584 21.1% 492 2040 24.1%2011 Q4 124 331 37.5% 24 98 24.5% 331 1487 22.3% 479 1916 25.0%2012 Q1 121 365 33.2% 28 118 23.7% 333 1483 22.5% 482 1966 24.5%
Vancouver HSDA Northern Interior HSDA Other HSDAs All HSDAs
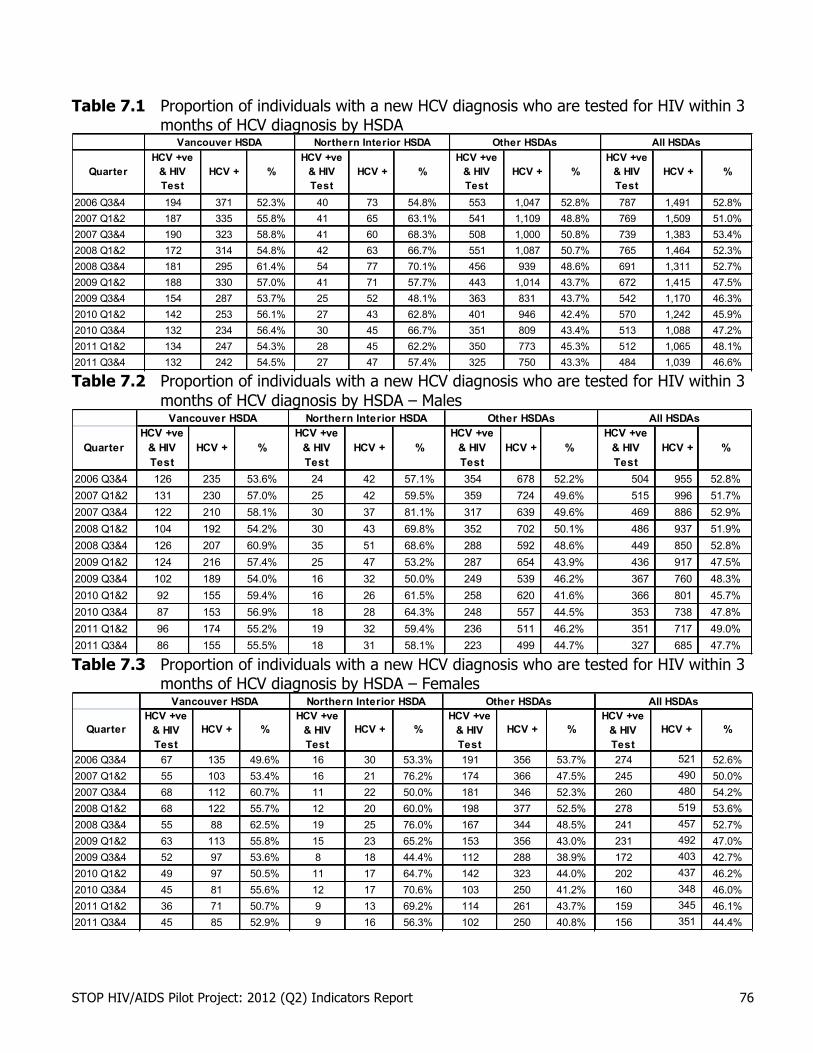
STOP HIV/AIDS Pilot Project: 2012 (Q2) Indicators Report 76
Table 7.1 Proportion of individuals with a new HCV diagnosis who are tested for HIV within 3 months of HCV diagnosis by HSDA
QuarterHCV +ve
& HIV Test
HCV + %HCV +ve
& HIV Test
HCV + %HCV +ve
& HIV Test
HCV + %HCV +ve
& HIV Test
HCV + %
2006 Q3&4 194 371 52.3% 40 73 54.8% 553 1,047 52.8% 787 1,491 52.8%2007 Q1&2 187 335 55.8% 41 65 63.1% 541 1,109 48.8% 769 1,509 51.0%2007 Q3&4 190 323 58.8% 41 60 68.3% 508 1,000 50.8% 739 1,383 53.4%2008 Q1&2 172 314 54.8% 42 63 66.7% 551 1,087 50.7% 765 1,464 52.3%2008 Q3&4 181 295 61.4% 54 77 70.1% 456 939 48.6% 691 1,311 52.7%2009 Q1&2 188 330 57.0% 41 71 57.7% 443 1,014 43.7% 672 1,415 47.5%2009 Q3&4 154 287 53.7% 25 52 48.1% 363 831 43.7% 542 1,170 46.3%2010 Q1&2 142 253 56.1% 27 43 62.8% 401 946 42.4% 570 1,242 45.9%2010 Q3&4 132 234 56.4% 30 45 66.7% 351 809 43.4% 513 1,088 47.2%2011 Q1&2 134 247 54.3% 28 45 62.2% 350 773 45.3% 512 1,065 48.1%2011 Q3&4 132 242 54.5% 27 47 57.4% 325 750 43.3% 484 1,039 46.6%
Other HSDAsNorthern Interior HSDAVancouver HSDA All HSDAs
Table 7.2 Proportion of individuals with a new HCV diagnosis who are tested for HIV within 3
months of HCV diagnosis by HSDA – Males
QuarterHCV +ve
& HIV Test
HCV + %HCV +ve
& HIV Test
HCV + %HCV +ve
& HIV Test
HCV + %HCV +ve
& HIV Test
HCV + %
2006 Q3&4 126 235 53.6% 24 42 57.1% 354 678 52.2% 504 955 52.8%2007 Q1&2 131 230 57.0% 25 42 59.5% 359 724 49.6% 515 996 51.7%2007 Q3&4 122 210 58.1% 30 37 81.1% 317 639 49.6% 469 886 52.9%2008 Q1&2 104 192 54.2% 30 43 69.8% 352 702 50.1% 486 937 51.9%2008 Q3&4 126 207 60.9% 35 51 68.6% 288 592 48.6% 449 850 52.8%2009 Q1&2 124 216 57.4% 25 47 53.2% 287 654 43.9% 436 917 47.5%2009 Q3&4 102 189 54.0% 16 32 50.0% 249 539 46.2% 367 760 48.3%2010 Q1&2 92 155 59.4% 16 26 61.5% 258 620 41.6% 366 801 45.7%2010 Q3&4 87 153 56.9% 18 28 64.3% 248 557 44.5% 353 738 47.8%2011 Q1&2 96 174 55.2% 19 32 59.4% 236 511 46.2% 351 717 49.0%2011 Q3&4 86 155 55.5% 18 31 58.1% 223 499 44.7% 327 685 47.7%
Vancouver HSDA Northern Interior HSDA Other HSDAs All HSDAs
Table 7.3 Proportion of individuals with a new HCV diagnosis who are tested for HIV within 3
months of HCV diagnosis by HSDA – Females
QuarterHCV +ve
& HIV Test
HCV + %HCV +ve
& HIV Test
HCV + %HCV +ve
& HIV Test
HCV + %HCV +ve
& HIV Test
HCV + %
2006 Q3&4 67 135 49.6% 16 30 53.3% 191 356 53.7% 274 521 52.6%2007 Q1&2 55 103 53.4% 16 21 76.2% 174 366 47.5% 245 490 50.0%2007 Q3&4 68 112 60.7% 11 22 50.0% 181 346 52.3% 260 480 54.2%2008 Q1&2 68 122 55.7% 12 20 60.0% 198 377 52.5% 278 519 53.6%2008 Q3&4 55 88 62.5% 19 25 76.0% 167 344 48.5% 241 457 52.7%2009 Q1&2 63 113 55.8% 15 23 65.2% 153 356 43.0% 231 492 47.0%2009 Q3&4 52 97 53.6% 8 18 44.4% 112 288 38.9% 172 403 42.7%2010 Q1&2 49 97 50.5% 11 17 64.7% 142 323 44.0% 202 437 46.2%2010 Q3&4 45 81 55.6% 12 17 70.6% 103 250 41.2% 160 348 46.0%2011 Q1&2 36 71 50.7% 9 13 69.2% 114 261 43.7% 159 345 46.1%2011 Q3&4 45 85 52.9% 9 16 56.3% 102 250 40.8% 156 351 44.4%
Vancouver HSDA Northern Interior HSDA Other HSDAs All HSDAs
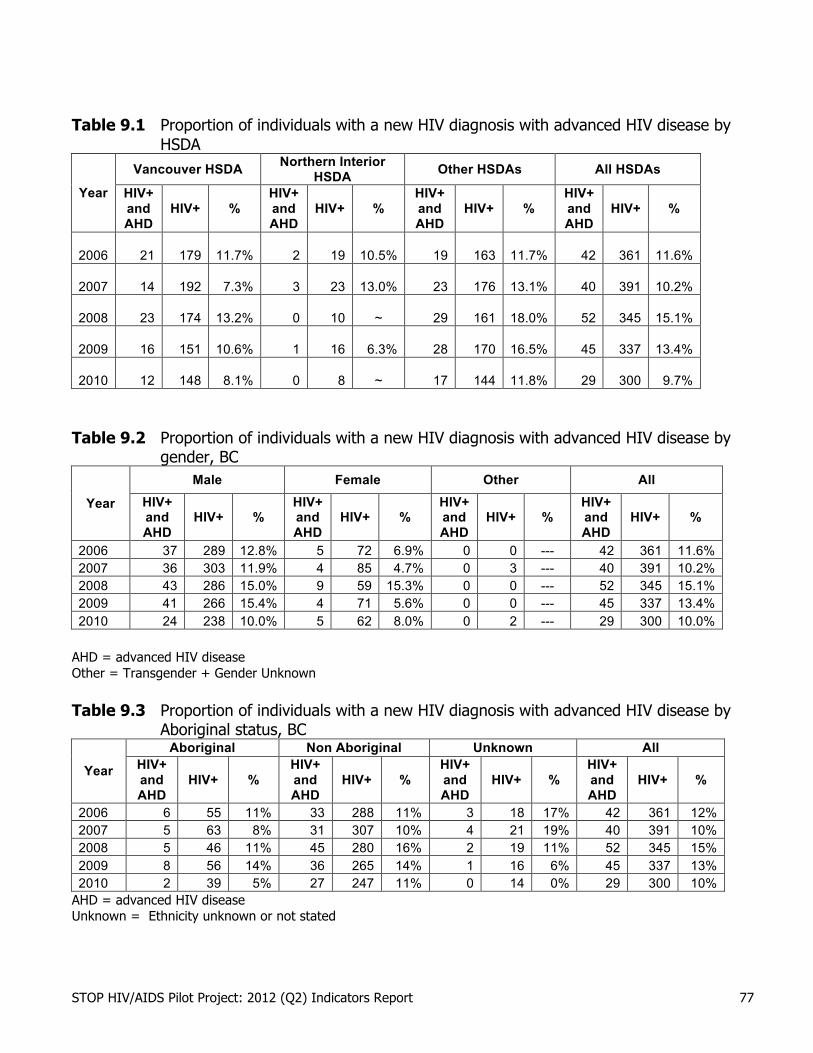
STOP HIV/AIDS Pilot Project: 2012 (Q2) Indicators Report 77
Table 9.1 Proportion of individuals with a new HIV diagnosis with advanced HIV disease by
HSDA
Year
Vancouver HSDA Northern Interior HSDA Other HSDAs All HSDAs
HIV+ and AHD
HIV+ % HIV+ and AHD
HIV+ % HIV+ and AHD
HIV+ % HIV+ and AHD
HIV+ %
2006 21 179 11.7% 2 19 10.5% 19 163 11.7% 42 361 11.6%
2007 14 192 7.3% 3 23 13.0% 23 176 13.1% 40 391 10.2%
2008 23 174 13.2% 0 10 ~ 29 161 18.0% 52 345 15.1%
2009 16 151 10.6% 1 16 6.3% 28 170 16.5% 45 337 13.4%
2010 12 148 8.1% 0 8 ~ 17 144 11.8% 29 300 9.7%
Table 9.2 Proportion of individuals with a new HIV diagnosis with advanced HIV disease by
gender, BC
Year
Male Female Other All HIV+ and AHD
HIV+ % HIV+ and AHD
HIV+ % HIV+ and AHD
HIV+ % HIV+ and AHD
HIV+ %
2006 37 289 12.8% 5 72 6.9% 0 0 --- 42 361 11.6% 2007 36 303 11.9% 4 85 4.7% 0 3 --- 40 391 10.2% 2008 43 286 15.0% 9 59 15.3% 0 0 --- 52 345 15.1% 2009 41 266 15.4% 4 71 5.6% 0 0 --- 45 337 13.4% 2010 24 238 10.0% 5 62 8.0% 0 2 --- 29 300 10.0%
AHD = advanced HIV disease Other = Transgender + Gender Unknown Table 9.3 Proportion of individuals with a new HIV diagnosis with advanced HIV disease by
Aboriginal status, BC
Year
Aboriginal Non Aboriginal Unknown All HIV+ and AHD
HIV+ % HIV+ and AHD
HIV+ % HIV+ and AHD
HIV+ % HIV+ and AHD
HIV+ %
2006 6 55 11% 33 288 11% 3 18 17% 42 361 12% 2007 5 63 8% 31 307 10% 4 21 19% 40 391 10% 2008 5 46 11% 45 280 16% 2 19 11% 52 345 15% 2009 8 56 14% 36 265 14% 1 16 6% 45 337 13% 2010 2 39 5% 27 247 11% 0 14 0% 29 300 10%
AHD = advanced HIV disease Unknown = Ethnicity unknown or not stated
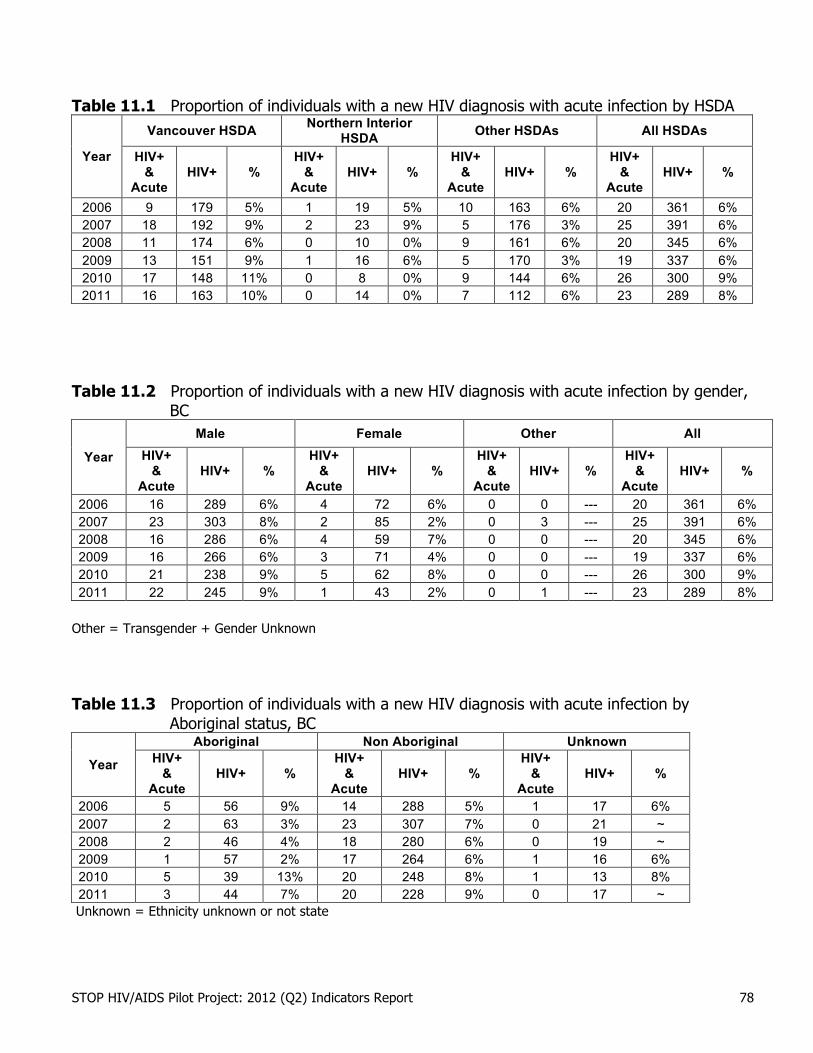
STOP HIV/AIDS Pilot Project: 2012 (Q2) Indicators Report 78
Table 11.1 Proportion of individuals with a new HIV diagnosis with acute infection by HSDA
Year
Vancouver HSDA Northern Interior HSDA Other HSDAs All HSDAs
HIV+ &
Acute HIV+ %
HIV+ &
Acute HIV+ %
HIV+ &
Acute HIV+ %
HIV+ &
Acute HIV+ %
2006 9 179 5% 1 19 5% 10 163 6% 20 361 6% 2007 18 192 9% 2 23 9% 5 176 3% 25 391 6% 2008 11 174 6% 0 10 0% 9 161 6% 20 345 6% 2009 13 151 9% 1 16 6% 5 170 3% 19 337 6% 2010 17 148 11% 0 8 0% 9 144 6% 26 300 9% 2011 16 163 10% 0 14 0% 7 112 6% 23 289 8%
Table 11.2 Proportion of individuals with a new HIV diagnosis with acute infection by gender,
BC
Year
Male Female Other All HIV+
& Acute
HIV+ % HIV+
& Acute
HIV+ % HIV+
& Acute
HIV+ % HIV+
& Acute
HIV+ %
2006 16 289 6% 4 72 6% 0 0 --- 20 361 6% 2007 23 303 8% 2 85 2% 0 3 --- 25 391 6% 2008 16 286 6% 4 59 7% 0 0 --- 20 345 6% 2009 16 266 6% 3 71 4% 0 0 --- 19 337 6% 2010 21 238 9% 5 62 8% 0 0 --- 26 300 9% 2011 22 245 9% 1 43 2% 0 1 --- 23 289 8%
Other = Transgender + Gender Unknown Table 11.3 Proportion of individuals with a new HIV diagnosis with acute infection by
Aboriginal status, BC
Year
Aboriginal Non Aboriginal Unknown HIV+
& Acute
HIV+ % HIV+
& Acute
HIV+ % HIV+
& Acute
HIV+ %
2006 5 56 9% 14 288 5% 1 17 6% 2007 2 63 3% 23 307 7% 0 21 ~ 2008 2 46 4% 18 280 6% 0 19 ~ 2009 1 57 2% 17 264 6% 1 16 6% 2010 5 39 13% 20 248 8% 1 13 8% 2011 3 44 7% 20 228 9% 0 17 ~
Unknown = Ethnicity unknown or not state

STOP HIV/AIDS Pilot Project: 2012 (Q2) Indicators Report 79
Table 14.1 Proportion of individuals starting antiretroviral therapy (ART) late in the course of HIV disease by HSDA
Quarter2006 Q1 25 / 55 45.45% 6 / 6 100.00% 28 / 52 53.85% 59 / 113 52.21%2006 Q2 29 / 53 54.72% 4 / 4 100.00% 20 / 41 48.78% 53 / 98 54.08%2006 Q3 26 / 41 63.41% 0 / 1 0.00% 23 / 50 46.00% 49 / 92 53.26%2006 Q4 26 / 48 54.17% 2 / 3 66.67% 30 / 58 51.72% 58 / 109 53.21%2007 Q1 34 / 57 59.65% 5 / 6 83.33% 18 / 51 35.29% 57 / 114 50.00%2007 Q2 30 / 73 41.10% 2 / 2 100.00% 35 / 61 57.38% 67 / 136 49.26%2007 Q3 28 / 59 47.46% 0 / 1 0.00% 22 / 47 46.81% 50 / 107 46.73%2007 Q4 23 / 58 39.66% 3 / 4 75.00% 27 / 61 44.26% 53 / 123 43.09%2008 Q1 23 / 53 43.40% 0 / 0 0.00% 33 / 72 45.83% 56 / 125 44.80%2008 Q2 20 / 58 34.48% 1 / 4 25.00% 31 / 67 46.27% 52 / 129 40.31%2008 Q3 20 / 67 29.85% 3 / 6 50.00% 24 / 67 35.82% 47 / 140 33.57%2008 Q4 19 / 56 33.93% 2 / 7 28.57% 22 / 68 32.35% 43 / 131 32.82%2009 Q1 18 / 66 27.27% 3 / 7 42.86% 22 / 74 29.73% 43 / 147 29.25%2009 Q2 15 / 58 25.86% 1 / 4 25.00% 28 / 79 35.44% 44 / 141 31.21%2009 Q3 11 / 54 20.37% 3 / 6 50.00% 21 / 63 33.33% 35 / 123 28.46%2009 Q4 16 / 58 27.59% 0 / 3 0.00% 19 / 82 23.17% 35 / 143 24.48%2010 Q1 7 / 68 10.29% 0 / 0 0.00% 19 / 67 28.36% 26 / 135 19.26%2010 Q2 14 / 59 23.73% 0 / 4 0.00% 23 / 62 37.10% 37 / 125 29.60%2010 Q3 12 / 58 20.69% 2 / 3 66.67% 27 / 78 34.62% 41 / 139 29.50%2010 Q4 16 / 54 29.63% 3 / 5 60.00% 19 / 61 31.15% 38 / 120 31.67%2011 Q1 14 / 74 18.92% 7 / 9 77.78% 14 / 71 19.72% 35 / 154 22.73%2011 Q2 13 / 71 18.31% 1 / 1 100.00% 15 / 62 24.19% 29 / 134 21.64%2011 Q3 10 / 68 14.71% 2 / 8 25.00% 19 / 83 22.89% 31 / 159 19.50%2011 Q4 7 / 58 12.07% 2 / 6 33.33% 20 / 69 28.99% 29 / 133 21.80%2012 Q1 8 / 59 13.56% 1 / 3 33.33% 15 / 77 19.48% 24 / 139 17.27%2012 Q2 8 / 44 18.18% 0 / 1 0.00% 13 / 74 17.57% 21 / 119 17.65%
Vancouver HSDA Northern Interior HSDA Other HSDAs All HSDAs

STOP HIV/AIDS Pilot Project: 2012 (Q2) Indicators Report 80
Table 14.2 Proportion of individuals starting antiretroviral therapy (ART) late in the course of HIV disease by gender
Quarter2006 Q1 50 / 95 52.63% 9 / 18 50.00%2006 Q2 45 / 84 53.57% 8 / 14 57.14%2006 Q3 35 / 70 50.00% 14 / 22 63.64%2006 Q4 45 / 86 52.33% 13 / 23 56.52%2007 Q1 43 / 87 49.43% 14 / 27 51.85%2007 Q2 57 / 118 48.31% 10 / 18 55.56%2007 Q3 40 / 82 48.78% 10 / 25 40.00%2007 Q4 44 / 105 41.90% 9 / 18 50.00%2008 Q1 45 / 103 43.69% 11 / 22 50.00%2008 Q2 45 / 108 41.67% 7 / 21 33.33%2008 Q3 31 / 106 29.25% 16 / 34 47.06%2008 Q4 34 / 109 31.19% 9 / 22 40.91%2009 Q1 34 / 116 29.31% 9 / 31 29.03%2009 Q2 39 / 120 32.50% 5 / 21 23.81%2009 Q3 31 / 104 29.81% 4 / 19 21.05%2009 Q4 29 / 115 25.22% 6 / 28 21.43%2010 Q1 18 / 107 16.82% 8 / 28 28.57%2010 Q2 29 / 106 27.36% 8 / 19 42.11%2010 Q3 31 / 110 28.18% 10 / 29 34.48%2010 Q4 29 / 98 29.59% 9 / 22 40.91%2011 Q1 28 / 128 21.88% 7 / 26 26.92%2011 Q2 24 / 111 21.62% 5 / 23 21.74%2011 Q3 24 / 130 18.46% 7 / 29 24.14%2011 Q4 23 / 109 21.10% 6 / 24 25.00%2012 Q1 21 / 113 18.58% 3 / 26 11.54%2012 Q2 18 / 99 18.18% 3 / 20 15.00%
Male Female

STOP HIV/AIDS Pilot Project: 2012 (Q2) Indicators Report 81
Table 18.1 Proportion of individuals with a new HIV diagnosis who are tested for syphilis within 3 months of HIV diagnosis by HSDA
Quarter
HIV +ve &
Syphilis test
HIV +ve %
HIV +ve &
Syphilis test
HIV +ve %
HIV +ve &
Syphilis test
HIV +ve %HIV +ve & Syphilis
testHIV +ve %
2006 Q3&4 36 90 40% 3 9 33% 17 73 23% 56 172 33%2007 Q1&2 66 124 53% 3 10 30% 21 76 28% 90 210 43%2007 Q3&4 50 92 54% 5 14 36% 19 73 26% 74 179 41%2008 Q1&2 75 111 68% 3 5 60% 21 63 33% 99 179 55%2008 Q3&4 57 89 64% 3 7 43% 27 69 39% 87 165 53%2009 Q1&2 58 96 60% 4 8 50% 33 81 41% 95 185 51%2009 Q3&4 49 80 61% 3 10 30% 22 61 36% 74 151 49%2010 Q1&2 59 88 67% 0 1 0% 27 65 42% 86 154 56%2010 Q3&4 58 83 70% 2 7 29% 18 56 32% 78 146 53%2011 Q1&2 51 76 67% 3 5 60% 22 57 39% 76 138 55%2011 Q3&4 77 105 73% 3 9 33% 15 45 33% 95 159 60%
All HSDAsVancouver HSDA Northern Interior HSDA Other HSDAs
Table 18.2 Proportion of individuals with a new HIV diagnosis who are tested for syphilis
within 3 months of HIV diagnosis – Males
Quarter
HIV +ve &
Syphilis test
HIV +ve %
HIV +ve &
Syphilis test
HIV +ve %
HIV +ve &
Syphilis test
HIV +ve %
HIV +ve &
Syphilis test
HIV +ve %
2006 Q3&4 32 71 45% 2 6 33% 14 58 24% 48 135 36%2007 Q1&2 60 107 56% 1 6 17% 14 52 27% 75 165 45%2007 Q3&4 41 74 55% 3 7 43% 14 55 25% 58 136 43%2008 Q1&2 67 94 71% 0 1 0% 18 53 34% 85 148 57%2008 Q3&4 53 78 68% 2 6 33% 18 52 35% 73 136 54%2009 Q1&2 50 80 63% 2 4 50% 27 65 42% 79 149 53%2009 Q3&4 43 70 61% 1 4 25% 14 43 33% 58 117 50%2010 Q1&2 51 72 71% 0 1 0% 21 44 48% 72 117 62%2010 Q3&4 52 72 72% 2 6 33% 17 43 40% 71 121 59%2011 Q1&2 47 66 71% 2 3 67% 15 43 35% 64 112 57%2011 Q3&4 73 96 76% 2 6 33% 13 35 37% 88 137 64%
Vancouver HSDA Northern Interior HSDA Other HSDAs All HSDAs
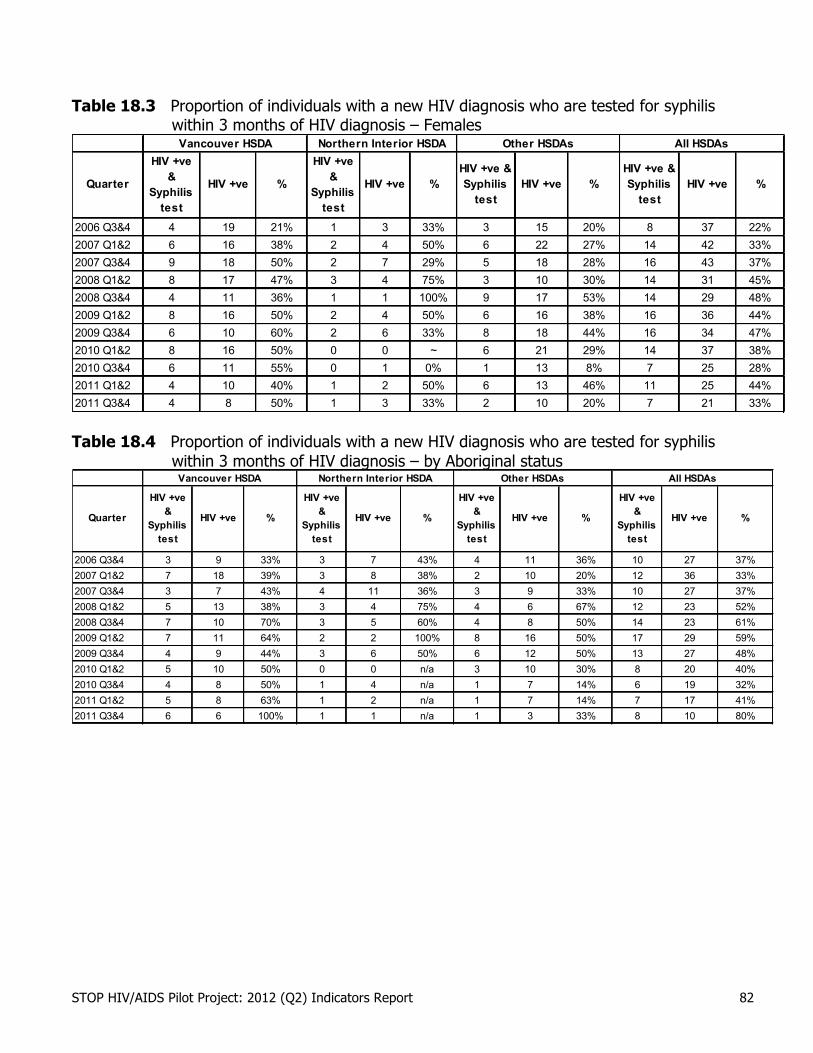
STOP HIV/AIDS Pilot Project: 2012 (Q2) Indicators Report 82
Table 18.3 Proportion of individuals with a new HIV diagnosis who are tested for syphilis within 3 months of HIV diagnosis – Females
Quarter
HIV +ve &
Syphilis test
HIV +ve %
HIV +ve &
Syphilis test
HIV +ve %HIV +ve & Syphilis
testHIV +ve %
HIV +ve & Syphilis
testHIV +ve %
2006 Q3&4 4 19 21% 1 3 33% 3 15 20% 8 37 22%2007 Q1&2 6 16 38% 2 4 50% 6 22 27% 14 42 33%2007 Q3&4 9 18 50% 2 7 29% 5 18 28% 16 43 37%2008 Q1&2 8 17 47% 3 4 75% 3 10 30% 14 31 45%2008 Q3&4 4 11 36% 1 1 100% 9 17 53% 14 29 48%2009 Q1&2 8 16 50% 2 4 50% 6 16 38% 16 36 44%2009 Q3&4 6 10 60% 2 6 33% 8 18 44% 16 34 47%2010 Q1&2 8 16 50% 0 0 ~ 6 21 29% 14 37 38%2010 Q3&4 6 11 55% 0 1 0% 1 13 8% 7 25 28%2011 Q1&2 4 10 40% 1 2 50% 6 13 46% 11 25 44%2011 Q3&4 4 8 50% 1 3 33% 2 10 20% 7 21 33%
Vancouver HSDA Northern Interior HSDA Other HSDAs All HSDAs
Table 18.4 Proportion of individuals with a new HIV diagnosis who are tested for syphilis
within 3 months of HIV diagnosis – by Aboriginal status
Quarter
HIV +ve &
Syphilis test
HIV +ve %
HIV +ve &
Syphilis test
HIV +ve %
HIV +ve &
Syphilis test
HIV +ve %
HIV +ve &
Syphilis test
HIV +ve %
2006 Q3&4 3 9 33% 3 7 43% 4 11 36% 10 27 37%2007 Q1&2 7 18 39% 3 8 38% 2 10 20% 12 36 33%2007 Q3&4 3 7 43% 4 11 36% 3 9 33% 10 27 37%2008 Q1&2 5 13 38% 3 4 75% 4 6 67% 12 23 52%2008 Q3&4 7 10 70% 3 5 60% 4 8 50% 14 23 61%2009 Q1&2 7 11 64% 2 2 100% 8 16 50% 17 29 59%2009 Q3&4 4 9 44% 3 6 50% 6 12 50% 13 27 48%2010 Q1&2 5 10 50% 0 0 n/a 3 10 30% 8 20 40%2010 Q3&4 4 8 50% 1 4 n/a 1 7 14% 6 19 32%2011 Q1&2 5 8 63% 1 2 n/a 1 7 14% 7 17 41%2011 Q3&4 6 6 100% 1 1 n/a 1 3 33% 8 10 80%
Vancouver HSDA Northern Interior HSDA Other HSDAs All HSDAs

STOP HIV/AIDS Pilot Project: 2012 (Q2) Indicators Report
83
Table 21.1 Percentage of HIV-infected individuals who are tested for genotypic antiretroviral
drug resistance prior to starting antiretroviral therapy (ART) by HSDA Quarter2006 Q1 35 / 55 63.64% 5 / 6 83.33% 30 / 56 53.57% 70 / 117 59.83%2006 Q2 38 / 53 71.70% 3 / 4 75.00% 20 / 45 44.44% 61 / 102 59.80%2006 Q3 25 / 43 58.14% 1 / 1 100.00% 16 / 53 30.19% 42 / 97 43.30%2006 Q4 36 / 48 75.00% 1 / 3 33.33% 38 / 60 63.33% 75 / 111 67.57%2007 Q1 46 / 59 77.97% 5 / 6 83.33% 33 / 53 62.26% 84 / 118 71.19%2007 Q2 58 / 75 77.33% 2 / 2 100.00% 37 / 64 57.81% 97 / 141 68.79%2007 Q3 44 / 60 73.33% 0 / 1 0.00% 28 / 48 58.33% 72 / 109 66.06%2007 Q4 45 / 59 76.27% 1 / 4 25.00% 47 / 68 69.12% 93 / 131 70.99%2008 Q1 46 / 55 83.64% 0 / 0 0.00% 39 / 77 50.65% 85 / 132 64.39%2008 Q2 41 / 58 70.69% 4 / 4 100.00% 47 / 71 66.20% 92 / 133 69.17%2008 Q3 56 / 67 83.58% 4 / 6 66.67% 40 / 70 57.14% 100 / 143 69.93%2008 Q4 39 / 58 67.24% 6 / 7 85.71% 52 / 70 74.29% 97 / 135 71.85%2009 Q1 57 / 67 85.07% 6 / 7 85.71% 61 / 78 78.21% 124 / 152 81.58%2009 Q2 47 / 58 81.03% 3 / 4 75.00% 64 / 82 78.05% 114 / 144 79.17%2009 Q3 48 / 57 84.21% 6 / 6 100.00% 52 / 66 78.79% 106 / 129 82.17%2009 Q4 50 / 59 84.75% 2 / 3 66.67% 65 / 83 78.31% 117 / 145 80.69%2010 Q1 55 / 69 79.71% 0 / 0 0.00% 57 / 71 80.28% 112 / 140 80.00%2010 Q2 53 / 61 86.89% 4 / 4 100.00% 55 / 66 83.33% 112 / 131 85.50%2010 Q3 51 / 59 86.44% 3 / 3 100.00% 60 / 80 75.00% 114 / 142 80.28%2010 Q4 44 / 55 80.00% 5 / 5 100.00% 49 / 65 75.38% 98 / 125 78.40%2011 Q1 68 / 74 91.89% 9 / 9 100.00% 60 / 73 82.19% 137 / 156 87.82%2011 Q2 63 / 73 86.30% 1 / 1 100.00% 52 / 66 78.79% 116 / 140 82.86%2011 Q3 63 / 71 88.73% 8 / 8 100.00% 73 / 85 85.88% 144 / 164 87.80%2011 Q4 49 / 58 84.48% 6 / 6 100.00% 57 / 73 78.08% 112 / 137 81.75%2012 Q1 53 / 60 88.33% 3 / 4 75.00% 69 / 82 84.15% 125 / 146 85.62%2012 Q2 40 / 45 88.89% 1 / 1 100.00% 64 / 81 79.01% 105 / 127 82.68%
Vancouver HSDA Northern Interior HSDA Other HSDAs All HSDAs

STOP HIV/AIDS Pilot Project: 2012 (Q2) Indicators Report 84
Table 21.2 Percentage of HIV-infected individuals who are tested for genotypic antiretroviral drug resistance prior to starting antiretroviral therapy (ART) by gender
Quarter2006 Q1 61 / 99 61.62% 9 / 18 50.00%2006 Q2 54 / 86 62.79% 7 / 16 43.75%2006 Q3 30 / 73 41.10% 12 / 24 50.00%2006 Q4 62 / 88 70.45% 13 / 23 56.52%2007 Q1 68 / 89 76.40% 16 / 29 55.17%2007 Q2 87 / 122 71.31% 10 / 19 52.63%2007 Q3 56 / 84 66.67% 16 / 25 64.00%2007 Q4 81 / 112 72.32% 12 / 19 63.16%2008 Q1 66 / 108 61.11% 19 / 24 79.17%2008 Q2 78 / 111 70.27% 14 / 22 63.64%2008 Q3 77 / 108 71.30% 23 / 35 65.71%2008 Q4 81 / 112 72.32% 16 / 23 69.57%2009 Q1 96 / 120 80.00% 28 / 32 87.50%2009 Q2 98 / 123 79.67% 16 / 21 76.19%2009 Q3 88 / 109 80.73% 18 / 20 90.00%2009 Q4 95 / 117 81.20% 22 / 28 78.57%2010 Q1 87 / 112 77.68% 25 / 28 89.29%2010 Q2 95 / 110 86.36% 17 / 21 80.95%2010 Q3 90 / 112 80.36% 24 / 30 80.00%2010 Q4 78 / 101 77.23% 20 / 24 83.33%2011 Q1 113 / 129 87.60% 24 / 27 88.89%2011 Q2 95 / 114 83.33% 21 / 26 80.77%2011 Q3 116 / 134 86.57% 28 / 30 93.33%2011 Q4 91 / 113 80.53% 21 / 24 87.50%2012 Q1 102 / 119 85.71% 23 / 27 85.19%2012 Q2 88 / 107 82.24% 17 / 20 85.00%
Male Female
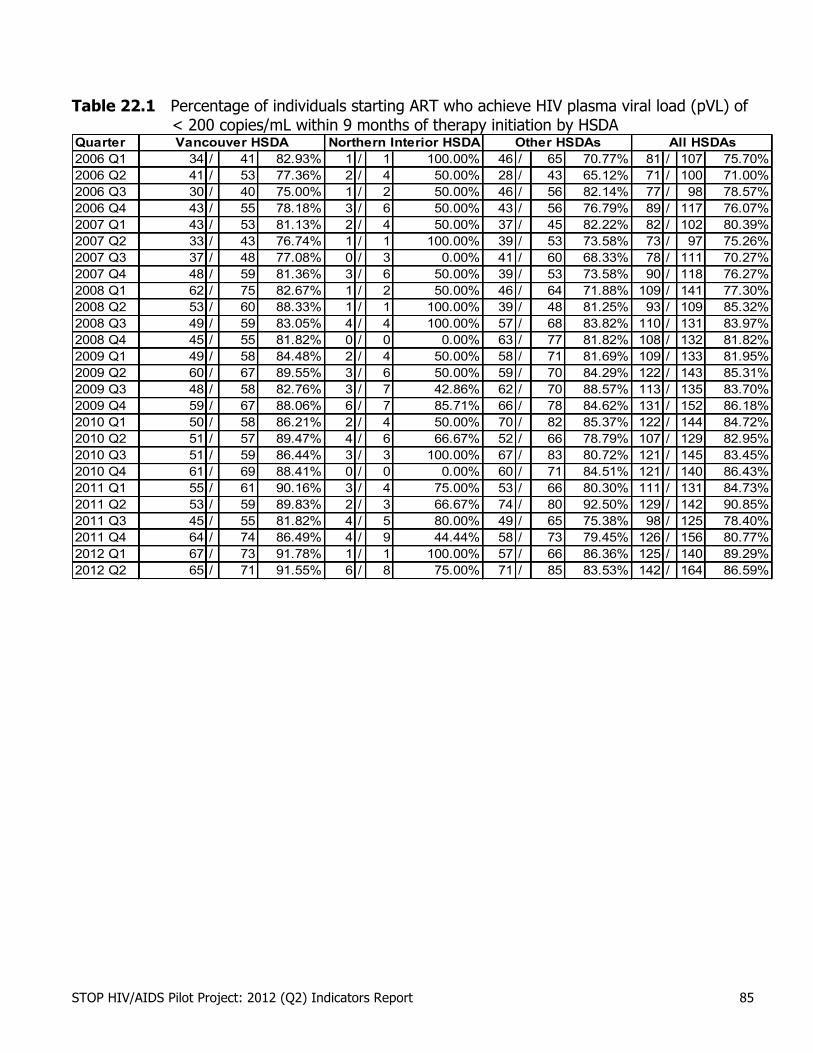
STOP HIV/AIDS Pilot Project: 2012 (Q2) Indicators Report 85
Table 22.1 Percentage of individuals starting ART who achieve HIV plasma viral load (pVL) of < 200 copies/mL within 9 months of therapy initiation by HSDA
Quarter2006 Q1 34 / 41 82.93% 1 / 1 100.00% 46 / 65 70.77% 81 / 107 75.70%2006 Q2 41 / 53 77.36% 2 / 4 50.00% 28 / 43 65.12% 71 / 100 71.00%2006 Q3 30 / 40 75.00% 1 / 2 50.00% 46 / 56 82.14% 77 / 98 78.57%2006 Q4 43 / 55 78.18% 3 / 6 50.00% 43 / 56 76.79% 89 / 117 76.07%2007 Q1 43 / 53 81.13% 2 / 4 50.00% 37 / 45 82.22% 82 / 102 80.39%2007 Q2 33 / 43 76.74% 1 / 1 100.00% 39 / 53 73.58% 73 / 97 75.26%2007 Q3 37 / 48 77.08% 0 / 3 0.00% 41 / 60 68.33% 78 / 111 70.27%2007 Q4 48 / 59 81.36% 3 / 6 50.00% 39 / 53 73.58% 90 / 118 76.27%2008 Q1 62 / 75 82.67% 1 / 2 50.00% 46 / 64 71.88% 109 / 141 77.30%2008 Q2 53 / 60 88.33% 1 / 1 100.00% 39 / 48 81.25% 93 / 109 85.32%2008 Q3 49 / 59 83.05% 4 / 4 100.00% 57 / 68 83.82% 110 / 131 83.97%2008 Q4 45 / 55 81.82% 0 / 0 0.00% 63 / 77 81.82% 108 / 132 81.82%2009 Q1 49 / 58 84.48% 2 / 4 50.00% 58 / 71 81.69% 109 / 133 81.95%2009 Q2 60 / 67 89.55% 3 / 6 50.00% 59 / 70 84.29% 122 / 143 85.31%2009 Q3 48 / 58 82.76% 3 / 7 42.86% 62 / 70 88.57% 113 / 135 83.70%2009 Q4 59 / 67 88.06% 6 / 7 85.71% 66 / 78 84.62% 131 / 152 86.18%2010 Q1 50 / 58 86.21% 2 / 4 50.00% 70 / 82 85.37% 122 / 144 84.72%2010 Q2 51 / 57 89.47% 4 / 6 66.67% 52 / 66 78.79% 107 / 129 82.95%2010 Q3 51 / 59 86.44% 3 / 3 100.00% 67 / 83 80.72% 121 / 145 83.45%2010 Q4 61 / 69 88.41% 0 / 0 0.00% 60 / 71 84.51% 121 / 140 86.43%2011 Q1 55 / 61 90.16% 3 / 4 75.00% 53 / 66 80.30% 111 / 131 84.73%2011 Q2 53 / 59 89.83% 2 / 3 66.67% 74 / 80 92.50% 129 / 142 90.85%2011 Q3 45 / 55 81.82% 4 / 5 80.00% 49 / 65 75.38% 98 / 125 78.40%2011 Q4 64 / 74 86.49% 4 / 9 44.44% 58 / 73 79.45% 126 / 156 80.77%2012 Q1 67 / 73 91.78% 1 / 1 100.00% 57 / 66 86.36% 125 / 140 89.29%2012 Q2 65 / 71 91.55% 6 / 8 75.00% 71 / 85 83.53% 142 / 164 86.59%
Vancouver HSDA Northern Interior HSDA Other HSDAs All HSDAs

STOP HIV/AIDS Pilot Project: 2012 (Q2) Indicators Report 86
Table 22.2 Percentage of individuals starting ART who achieve HIV plasma viral load (pVL) of < 50 copies/mL within 9 months of therapy initiation by gender
Quarter2006 Q1 68 / 87 78.16% 13 / 20 65.00%2006 Q2 57 / 80 71.25% 14 / 20 70.00%2006 Q3 66 / 80 82.50% 11 / 18 61.11%2006 Q4 77 / 99 77.78% 12 / 18 66.67%2007 Q1 71 / 86 82.56% 11 / 16 68.75%2007 Q2 55 / 73 75.34% 18 / 24 75.00%2007 Q3 65 / 88 73.86% 13 / 23 56.52%2007 Q4 68 / 89 76.40% 22 / 29 75.86%2008 Q1 98 / 122 80.33% 11 / 19 57.89%2008 Q2 72 / 84 85.71% 21 / 25 84.00%2008 Q3 99 / 112 88.39% 11 / 19 57.89%2008 Q4 93 / 108 86.11% 15 / 24 62.50%2009 Q1 92 / 111 82.88% 17 / 22 77.27%2009 Q2 94 / 108 87.04% 28 / 35 80.00%2009 Q3 98 / 112 87.50% 15 / 23 65.22%2009 Q4 103 / 120 85.83% 28 / 32 87.50%2010 Q1 106 / 123 86.18% 16 / 21 76.19%2010 Q2 90 / 109 82.57% 17 / 20 85.00%2010 Q3 96 / 117 82.05% 25 / 28 89.29%2010 Q4 96 / 112 85.71% 25 / 28 89.29%2011 Q1 93 / 110 84.55% 18 / 21 85.71%2011 Q2 102 / 112 91.07% 27 / 30 90.00%2011 Q3 81 / 101 80.20% 17 / 24 70.83%2011 Q4 105 / 129 81.40% 21 / 27 77.78%2012 Q1 104 / 114 91.23% 21 / 26 80.77%2012 Q2 124 / 134 92.54% 18 / 30 60.00%
Male Female

STOP HIV/AIDS Pilot Project: 2012 (Q2) Indicators Report 87
Table 23.1 Percentage of individuals who initiated antiretroviral therapy (ART) with a recommended therapy regimen (among those with no drug resistance) by HSDA
Quarter2006 Q1 19 / 27 70.37% 3 / 3 100.00% 17 / 21 80.95% 39 / 51 76.47%2006 Q2 20 / 30 66.67% 2 / 2 100.00% 14 / 17 82.35% 36 / 49 73.47%2006 Q3 15 / 22 68.18% 1 / 1 100.00% 11 / 14 78.57% 27 / 37 72.97%2006 Q4 23 / 30 76.67% 0 / 1 0.00% 22 / 35 62.86% 45 / 66 68.18%2007 Q1 34 / 44 77.27% 5 / 5 100.00% 23 / 32 71.88% 62 / 81 76.54%2007 Q2 48 / 55 87.27% 2 / 2 100.00% 26 / 35 74.29% 76 / 92 82.61%2007 Q3 31 / 38 81.58% 0 / 0 0.00% 24 / 27 88.89% 55 / 65 84.62%2007 Q4 34 / 43 79.07% 1 / 1 100.00% 25 / 37 67.57% 60 / 81 74.07%2008 Q1 30 / 41 73.17% 0 / 0 0.00% 29 / 36 80.56% 59 / 77 76.62%2008 Q2 30 / 38 78.95% 2 / 2 100.00% 25 / 39 64.10% 57 / 79 72.15%2008 Q3 43 / 50 86.00% 4 / 4 100.00% 29 / 36 80.56% 76 / 90 84.44%2008 Q4 32 / 36 88.89% 4 / 4 100.00% 39 / 46 84.78% 75 / 86 87.21%2009 Q1 46 / 52 88.46% 6 / 6 100.00% 49 / 56 87.50% 101 / 114 88.60%2009 Q2 33 / 39 84.62% 1 / 3 33.33% 51 / 58 87.93% 85 / 100 85.00%2009 Q3 38 / 46 82.61% 6 / 6 100.00% 42 / 49 85.71% 86 / 101 85.15%2009 Q4 39 / 43 90.70% 2 / 2 100.00% 52 / 57 91.23% 93 / 102 91.18%2010 Q1 41 / 52 78.85% 0 / 0 0.00% 43 / 49 87.76% 84 / 101 83.17%2010 Q2 38 / 46 82.61% 4 / 4 100.00% 40 / 51 78.43% 82 / 101 81.19%2010 Q3 37 / 47 78.72% 3 / 3 100.00% 40 / 53 75.47% 80 / 103 77.67%2010 Q4 30 / 40 75.00% 3 / 3 100.00% 38 / 45 84.44% 71 / 88 80.68%2011 Q1 56 / 65 86.15% 7 / 9 77.78% 48 / 55 87.27% 111 / 129 86.05%2011 Q2 39 / 54 72.22% 1 / 1 100.00% 35 / 43 81.40% 75 / 98 76.53%2011 Q3 46 / 57 80.70% 8 / 8 100.00% 53 / 66 80.30% 107 / 131 81.68%2011 Q4 28 / 40 70.00% 6 / 6 100.00% 34 / 51 66.67% 68 / 97 70.10%2012 Q1 37 / 47 78.72% 2 / 3 66.67% 45 / 59 76.27% 84 / 109 77.06%2012 Q2 26 / 36 72.22% 1 / 1 100.00% 43 / 57 75.44% 70 / 94 74.47%
Vancouver HSDA Northern Interior HSDA Other HSDAs All HSDAs

STOP HIV/AIDS Pilot Project: 2012 (Q2) Indicators Report 88
Table 23.2 Percentage of individuals who initiated antiretroviral therapy (ART) with a recommended therapy regimen (among those with no drug resistance) by gender
Quarter2006 Q1 35 / 46 76.09% 4 / 5 80.00%2006 Q2 33 / 45 73.33% 3 / 4 75.00%2006 Q3 20 / 25 80.00% 7 / 12 58.33%2006 Q4 38 / 54 70.37% 7 / 12 58.33%2007 Q1 52 / 65 80.00% 10 / 16 62.50%2007 Q2 70 / 82 85.37% 6 / 10 60.00%2007 Q3 43 / 50 86.00% 12 / 15 80.00%2007 Q4 51 / 70 72.86% 9 / 11 81.82%2008 Q1 46 / 61 75.41% 13 / 16 81.25%2008 Q2 49 / 65 75.38% 8 / 14 57.14%2008 Q3 60 / 69 86.96% 16 / 21 76.19%2008 Q4 62 / 71 87.32% 13 / 15 86.67%2009 Q1 84 / 92 91.30% 17 / 22 77.27%2009 Q2 76 / 85 89.41% 9 / 15 60.00%2009 Q3 72 / 83 86.75% 14 / 18 77.78%2009 Q4 74 / 82 90.24% 19 / 20 95.00%2010 Q1 67 / 78 85.90% 17 / 23 73.91%2010 Q2 74 / 85 87.06% 8 / 16 50.00%2010 Q3 63 / 81 77.78% 17 / 22 77.27%2010 Q4 58 / 71 81.69% 13 / 17 76.47%2011 Q1 95 / 106 89.62% 16 / 23 69.57%2011 Q2 60 / 79 75.95% 15 / 19 78.95%2011 Q3 86 / 105 81.90% 21 / 26 80.77%2011 Q4 57 / 80 71.25% 11 / 17 64.71%2012 Q1 71 / 91 78.02% 13 / 18 72.22%2012 Q2 61 / 80 76.25% 9 / 14 64.29%
Male Female

STOP HIV/AIDS Pilot Project: 2012 (Q2) Indicators Report 89
Table 24.1 Percentage of individuals on antiretroviral therapy (ART) that achieve annual prescription refill adherence of > 95% by HSDA
Quarter2006 Q1 1280 / 1781 71.87% 16 / 32 50.00% 994 / 1497 66.40% 2290 / 3310 69.18%2006 Q2 1343 / 1825 73.59% 17 / 31 54.84% 1028 / 1554 66.15% 2388 / 3410 70.03%2006 Q3 1389 / 1859 74.72% 17 / 31 54.84% 1089 / 1564 69.63% 2495 / 3454 72.24%2006 Q4 1409 / 1874 75.19% 16 / 30 53.33% 1113 / 1628 68.37% 2538 / 3532 71.86%2007 Q1 1478 / 1914 77.22% 20 / 36 55.56% 1134 / 1675 67.70% 2632 / 3625 72.61%2007 Q2 1491 / 1992 74.85% 21 / 36 58.33% 1152 / 1730 66.59% 2664 / 3758 70.89%2007 Q3 1533 / 2046 74.93% 19 / 33 57.58% 1174 / 1748 67.16% 2726 / 3827 71.23%2007 Q4 1549 / 2089 74.15% 23 / 42 54.76% 1213 / 1760 68.92% 2785 / 3891 71.58%2008 Q1 1596 / 2149 74.27% 20 / 43 46.51% 1236 / 1775 69.63% 2852 / 3967 71.89%2008 Q2 1654 / 2232 74.10% 18 / 46 39.13% 1289 / 1856 69.45% 2961 / 4134 71.63%2008 Q3 1664 / 2272 73.24% 18 / 49 36.73% 1321 / 1896 69.67% 3003 / 4217 71.21%2008 Q4 1726 / 2332 74.01% 23 / 54 42.59% 1362 / 1941 70.17% 3111 / 4327 71.90%2009 Q1 1762 / 2377 74.13% 23 / 54 42.59% 1421 / 2011 70.66% 3206 / 4442 72.17%2009 Q2 1817 / 2436 74.59% 29 / 56 51.79% 1429 / 2078 68.77% 3275 / 4570 71.66%2009 Q3 1885 / 2506 75.22% 33 / 58 56.90% 1487 / 2118 70.21% 3405 / 4682 72.73%2009 Q4 1946 / 2537 76.70% 37 / 62 59.68% 1516 / 2170 69.86% 3499 / 4769 73.37%2010 Q1 2000 / 2601 76.89% 36 / 67 53.73% 1549 / 2216 69.90% 3585 / 4884 73.40%2010 Q2 2020 / 2657 76.03% 36 / 77 46.75% 1590 / 2255 70.51% 3646 / 4989 73.08%2010 Q3 2054 / 2722 75.46% 40 / 78 51.28% 1618 / 2317 69.83% 3712 / 5117 72.54%2010 Q4 2065 / 2766 74.66% 41 / 78 52.56% 1653 / 2379 69.48% 3759 / 5223 71.97%2011 Q1 2144 / 2846 75.33% 43 / 81 53.09% 1667 / 2414 69.06% 3854 / 5341 72.16%2011 Q2 2180 / 2879 75.72% 45 / 88 51.14% 1687 / 2461 68.55% 3912 / 5428 72.07%2011 Q3 2214 / 2946 75.15% 42 / 92 45.65% 1718 / 2500 68.72% 3974 / 5538 71.76%2011 Q4 2280 / 2988 76.31% 49 / 102 48.04% 1719 / 2535 67.81% 4048 / 5625 71.96%2012 Q1 2349 / 3041 77.24% 55 / 103 53.40% 1769 / 2598 68.09% 4173 / 5742 72.68%2012 Q2 2368 / 3059 77.41% 64 / 108 59.26% 1833 / 2665 68.78% 4265 / 5832 73.13%
Vancouver HSDA Northern Interior HSDA Other HSDAs All HSDAs

STOP HIV/AIDS Pilot Project: 2012 (Q2) Indicators Report 90
Table 24.2 Percentage of individuals on antiretroviral therapy (ART) that achieve annual prescription refill adherence of > 95% by gender
Quarter2006 Q1 2024 / 2853 70.94% 266 / 457 58.21%2006 Q2 2120 / 2928 72.40% 268 / 482 55.60%2006 Q3 2209 / 2961 74.60% 286 / 493 58.01%2006 Q4 2241 / 3029 73.98% 297 / 503 59.05%2007 Q1 2329 / 3112 74.84% 303 / 513 59.06%2007 Q2 2365 / 3235 73.11% 299 / 523 57.17%2007 Q3 2420 / 3285 73.67% 306 / 542 56.46%2007 Q4 2472 / 3338 74.06% 313 / 553 56.60%2008 Q1 2516 / 3389 74.24% 336 / 578 58.13%2008 Q2 2627 / 3534 74.34% 334 / 600 55.67%2008 Q3 2644 / 3585 73.75% 359 / 632 56.80%2008 Q4 2741 / 3688 74.32% 370 / 639 57.90%2009 Q1 2819 / 3770 74.77% 387 / 672 57.59%2009 Q2 2869 / 3868 74.17% 406 / 702 57.83%2009 Q3 2973 / 3963 75.02% 432 / 719 60.08%2009 Q4 3056 / 4030 75.83% 443 / 739 59.95%2010 Q1 3126 / 4121 75.86% 459 / 763 60.16%2010 Q2 3181 / 4210 75.56% 465 / 779 59.69%2010 Q3 3254 / 4325 75.24% 458 / 792 57.83%2010 Q4 3296 / 4395 74.99% 463 / 828 55.92%2011 Q1 3372 / 4485 75.18% 482 / 856 56.31%2011 Q2 3420 / 4540 75.33% 492 / 888 55.41%2011 Q3 3455 / 4644 74.40% 519 / 894 58.05%2011 Q4 3506 / 4715 74.36% 542 / 910 59.56%2012 Q1 3614 / 4807 75.18% 559 / 935 59.79%2012 Q2 3687 / 4877 75.60% 578 / 955 60.52%
Male Female

STOP HIV/AIDS Pilot Project: 2012 (Q2) Indicators Report 91
Table 25.1 Number of physicians initiating therapy or providing HIV-related care to patients on antiretroviral therapy (ART)
Quarter Vancouver HSDA Northern Interior HSDA Other HSDAs All HSDAs2006 Q1 162 19 402 5832006 Q2 165 22 407 5942006 Q3 171 22 407 6002006 Q4 160 22 417 5992007 Q1 168 24 424 6162007 Q2 166 22 455 6432007 Q3 168 21 438 6272007 Q4 163 22 455 6402008 Q1 174 22 442 6382008 Q2 177 25 470 6722008 Q3 178 28 464 6702008 Q4 183 27 461 6712009 Q1 191 27 489 7072009 Q2 184 26 499 7092009 Q3 191 24 482 6972009 Q4 187 23 502 7122010 Q1 185 23 498 7062010 Q2 192 21 504 7172010 Q3 192 23 512 7272010 Q4 189 23 511 7232011 Q1 196 25 521 7422011 Q2 193 27 525 7452011 Q3 200 26 528 7542011 Q4 199 24 530 7532012 Q1 199 25 517 7412012 Q2 201 25 522 748

STOP HIV/AIDS Pilot Project: 2012 (Q2) Indicators Report 92
Table 26.1 Percentage of individuals on antiretroviral therapy (ART) who experience a serious adverse drug reaction (ADR) by HSDA
Quarter2006 Q1 / 1968 / 45 / 1686 / 36992006 Q2 / 2005 / 46 / 1740 / 37912006 Q3 / 2031 / 41 / 1765 / 38372006 Q4 / 2073 / 42 / 1805 / 39202007 Q1 / 2121 / 44 / 1842 / 40072007 Q2 / 2217 / 50 / 1920 / 41872007 Q3 / 2286 / 46 / 1931 / 42632007 Q4 / 2342 / 53 / 1956 / 43512008 Q1 1 / 2382 0.04% 0 / 52 0.00% 0 / 2008 0.00% 1 / 4442 0.02%2008 Q2 1 / 2457 0.04% 0 / 55 0.00% 1 / 2099 0.05% 2 / 4611 0.04%2008 Q3 5 / 2517 0.20% 0 / 58 0.00% 1 / 2149 0.05% 6 / 4724 0.13%2008 Q4 1 / 2587 0.04% 0 / 66 0.00% 3 / 2189 0.14% 4 / 4842 0.08%2009 Q1 5 / 2657 0.19% 1 / 76 1.32% 2 / 2242 0.09% 8 / 4975 0.16%2009 Q2 6 / 2718 0.22% 0 / 80 0.00% 3 / 2322 0.13% 9 / 5120 0.18%2009 Q3 1 / 2783 0.04% 0 / 79 0.00% 3 / 2346 0.13% 4 / 5208 0.08%2009 Q4 2 / 2825 0.07% 0 / 81 0.00% 3 / 2403 0.12% 5 / 5309 0.09%2010 Q1 3 / 2875 0.10% 0 / 81 0.00% 4 / 2464 0.16% 7 / 5420 0.13%2010 Q2 2 / 2915 0.07% 0 / 89 0.00% 0 / 2504 0.00% 2 / 5508 0.04%2010 Q3 1 / 3009 0.03% 0 / 86 0.00% 1 / 2549 0.04% 2 / 5644 0.04%2010 Q4 4 / 3039 0.13% 0 / 93 0.00% 1 / 2611 0.04% 5 / 5743 0.09%2011 Q1 2 / 3118 0.06% 0 / 105 0.00% 1 / 2656 0.04% 3 / 5879 0.05%2011 Q2 1 / 3171 0.03% 1 / 106 0.94% 2 / 2690 0.07% 4 / 5967 0.07%2011 Q3 2 / 3220 0.06% 0 / 112 0.00% 7 / 2773 0.25% 9 / 6105 0.15%2011 Q4 2 / 3241 0.06% 0 / 122 0.00% 1 / 2837 0.04% 3 / 6200 0.05%2012 Q1 3 / 3293 0.09% 0 / 118 0.00% 3 / 2891 0.10% 6 / 6302 0.10%2012 Q2 3 / 3299 0.09% 0 / 122 0.00% 1 / 2959 0.03% 4 / 6380 0.06%
Vancouver HSDA Northern Interior HSDA Other HSDAs All HSDAs

STOP HIV/AIDS Pilot Project: 2012 (Q2) Indicators Report 93
Table 26.2 Percentage of individuals on antiretroviral therapy (ART) who experience a serious adverse drug reaction (ADR) by gender
Quarter2006 Q1 / 3174 / 5252006 Q2 / 3248 / 5432006 Q3 / 3280 / 5572006 Q4 / 3351 / 5692007 Q1 / 3418 / 5892007 Q2 / 3580 / 6072007 Q3 / 3636 / 6272007 Q4 / 3723 / 6282008 Q1 1 / 3792 0.03% 0 / 650 0.00%2008 Q2 1 / 3928 0.03% 1 / 683 0.15%2008 Q3 6 / 4000 0.15% 0 / 724 0.00%2008 Q4 3 / 4110 0.07% 1 / 732 0.14%2009 Q1 5 / 4201 0.12% 3 / 774 0.39%2009 Q2 6 / 4317 0.14% 3 / 803 0.37%2009 Q3 4 / 4404 0.09% 0 / 804 0.00%2009 Q4 4 / 4477 0.09% 1 / 832 0.12%2010 Q1 4 / 4566 0.09% 3 / 854 0.35%2010 Q2 1 / 4637 0.02% 1 / 871 0.11%2010 Q3 1 / 4751 0.02% 1 / 893 0.11%2010 Q4 3 / 4817 0.06% 2 / 926 0.22%2011 Q1 3 / 4926 0.06% 0 / 953 0.00%2011 Q2 2 / 4979 0.04% 2 / 988 0.20%2011 Q3 6 / 5107 0.12% 3 / 998 0.30%2011 Q4 2 / 5186 0.04% 1 / 1014 0.10%2012 Q1 5 / 5269 0.09% 1 / 1033 0.10%2012 Q2 3 / 5330 0.06% 1 / 1050 0.10%
Male Female
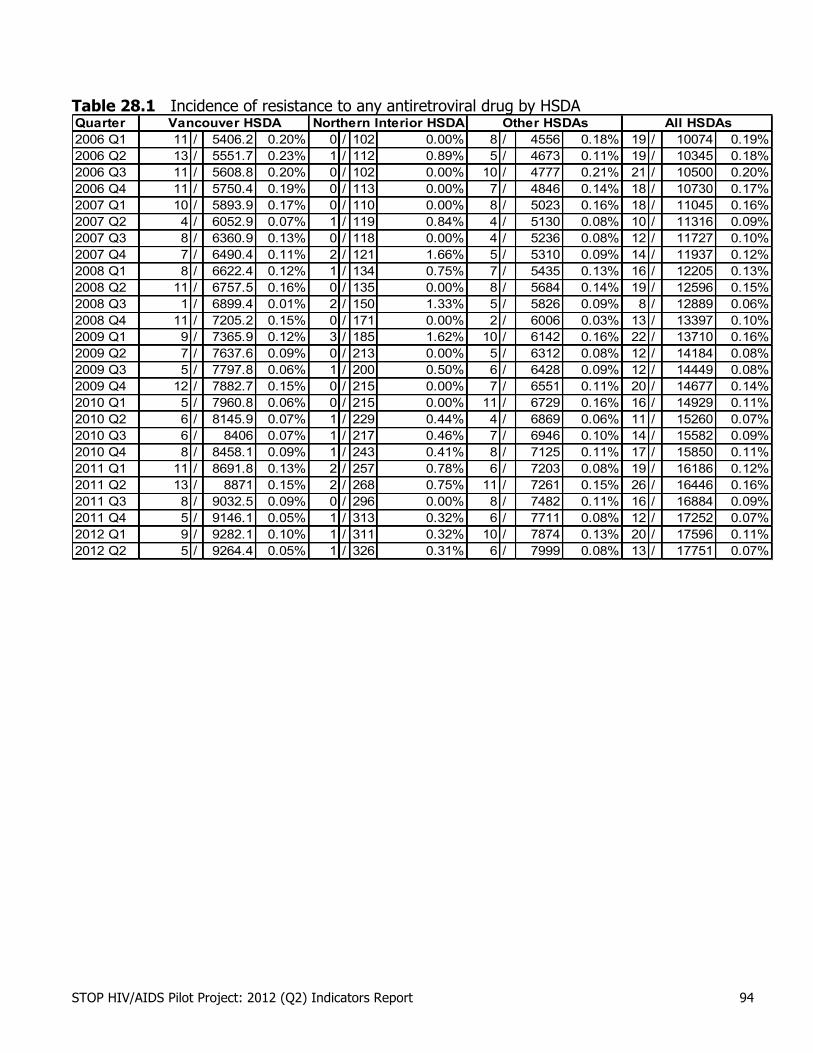
STOP HIV/AIDS Pilot Project: 2012 (Q2) Indicators Report 94
Table 28.1 Incidence of resistance to any antiretroviral drug by HSDA Quarter2006 Q1 11 / 5406.2 0.20% 0 / 102 0.00% 8 / 4556 0.18% 19 / 10074 0.19%2006 Q2 13 / 5551.7 0.23% 1 / 112 0.89% 5 / 4673 0.11% 19 / 10345 0.18%2006 Q3 11 / 5608.8 0.20% 0 / 102 0.00% 10 / 4777 0.21% 21 / 10500 0.20%2006 Q4 11 / 5750.4 0.19% 0 / 113 0.00% 7 / 4846 0.14% 18 / 10730 0.17%2007 Q1 10 / 5893.9 0.17% 0 / 110 0.00% 8 / 5023 0.16% 18 / 11045 0.16%2007 Q2 4 / 6052.9 0.07% 1 / 119 0.84% 4 / 5130 0.08% 10 / 11316 0.09%2007 Q3 8 / 6360.9 0.13% 0 / 118 0.00% 4 / 5236 0.08% 12 / 11727 0.10%2007 Q4 7 / 6490.4 0.11% 2 / 121 1.66% 5 / 5310 0.09% 14 / 11937 0.12%2008 Q1 8 / 6622.4 0.12% 1 / 134 0.75% 7 / 5435 0.13% 16 / 12205 0.13%2008 Q2 11 / 6757.5 0.16% 0 / 135 0.00% 8 / 5684 0.14% 19 / 12596 0.15%2008 Q3 1 / 6899.4 0.01% 2 / 150 1.33% 5 / 5826 0.09% 8 / 12889 0.06%2008 Q4 11 / 7205.2 0.15% 0 / 171 0.00% 2 / 6006 0.03% 13 / 13397 0.10%2009 Q1 9 / 7365.9 0.12% 3 / 185 1.62% 10 / 6142 0.16% 22 / 13710 0.16%2009 Q2 7 / 7637.6 0.09% 0 / 213 0.00% 5 / 6312 0.08% 12 / 14184 0.08%2009 Q3 5 / 7797.8 0.06% 1 / 200 0.50% 6 / 6428 0.09% 12 / 14449 0.08%2009 Q4 12 / 7882.7 0.15% 0 / 215 0.00% 7 / 6551 0.11% 20 / 14677 0.14%2010 Q1 5 / 7960.8 0.06% 0 / 215 0.00% 11 / 6729 0.16% 16 / 14929 0.11%2010 Q2 6 / 8145.9 0.07% 1 / 229 0.44% 4 / 6869 0.06% 11 / 15260 0.07%2010 Q3 6 / 8406 0.07% 1 / 217 0.46% 7 / 6946 0.10% 14 / 15582 0.09%2010 Q4 8 / 8458.1 0.09% 1 / 243 0.41% 8 / 7125 0.11% 17 / 15850 0.11%2011 Q1 11 / 8691.8 0.13% 2 / 257 0.78% 6 / 7203 0.08% 19 / 16186 0.12%2011 Q2 13 / 8871 0.15% 2 / 268 0.75% 11 / 7261 0.15% 26 / 16446 0.16%2011 Q3 8 / 9032.5 0.09% 0 / 296 0.00% 8 / 7482 0.11% 16 / 16884 0.09%2011 Q4 5 / 9146.1 0.05% 1 / 313 0.32% 6 / 7711 0.08% 12 / 17252 0.07%2012 Q1 9 / 9282.1 0.10% 1 / 311 0.32% 10 / 7874 0.13% 20 / 17596 0.11%2012 Q2 5 / 9264.4 0.05% 1 / 326 0.31% 6 / 7999 0.08% 13 / 17751 0.07%
Vancouver HSDA Northern Interior HSDA Other HSDAs All HSDAs

STOP HIV/AIDS Pilot Project: 2012 (Q2) Indicators Report 95
Table 28.2 Incidence of resistance to any antiretroviral drug by gender (BC) Quarter2006 Q1 12 / 8714.6 0.14% 7 / 1360 0.51%2006 Q2 9 / 8955.9 0.10% 10 / 1389 0.72%2006 Q3 18 / 9069.6 0.20% 3 / 1430 0.21%2006 Q4 12 / 9273 0.13% 6 / 1457 0.41%2007 Q1 13 / 9537.9 0.14% 5 / 1507 0.33%2007 Q2 9 / 9760.9 0.09% 1 / 1555 0.06%2007 Q3 8 / 10100 0.08% 4 / 1626 0.25%2007 Q4 10 / 10298 0.10% 4 / 1639 0.24%2008 Q1 14 / 10524 0.13% 2 / 1680 0.12%2008 Q2 15 / 10843 0.14% 4 / 1753 0.23%2008 Q3 6 / 11056 0.05% 2 / 1833 0.11%2008 Q4 12 / 11447 0.10% 1 / 1950 0.05%2009 Q1 15 / 11680 0.13% 7 / 2030 0.34%2009 Q2 8 / 12076 0.07% 4 / 2108 0.19%2009 Q3 9 / 12307 0.07% 3 / 2142 0.14%2009 Q4 17 / 12489 0.14% 3 / 2187 0.14%2010 Q1 11 / 12708 0.09% 5 / 2221 0.23%2010 Q2 6 / 12950 0.05% 5 / 2310 0.22%2010 Q3 10 / 13263 0.08% 4 / 2319 0.17%2010 Q4 13 / 13445 0.10% 4 / 2405 0.17%2011 Q1 13 / 13676 0.10% 6 / 2510 0.24%2011 Q2 13 / 13880 0.09% 13 / 2566 0.51%2011 Q3 11 / 14213 0.08% 5 / 2672 0.19%2011 Q4 4 / 14556 0.03% 8 / 2696 0.30%2012 Q1 17 / 14834 0.11% 3 / 2761 0.11%2012 Q2 9 / 14943 0.06% 4 / 2808 0.14%
Male Female

STOP HIV/AIDS Pilot Project: 2012 (Q2) Indicators Report 96
Table 29.1 Proportion of individuals on antiretroviral therapy who change antiretroviral drug treatment by HSDA
Quarter2006 Q1 182 / 1968 9.25% 3 / 45 6.67% 138 / 1682 8.20% 323 / 3699 8.73%2006 Q2 220 / 2005 10.97% 2 / 46 4.35% 183 / 1736 10.54% 406 / 3791 10.71%2006 Q3 233 / 2031 11.47% 2 / 41 4.88% 181 / 1761 10.28% 416 / 3837 10.84%2006 Q4 244 / 2073 11.77% 3 / 42 7.14% 209 / 1794 11.65% 458 / 3920 11.68%2007 Q1 242 / 2121 11.41% 1 / 44 2.27% 165 / 1833 9.00% 408 / 4006 10.18%2007 Q2 219 / 2217 9.88% 0 / 50 0.00% 168 / 1914 8.78% 388 / 4187 9.27%2007 Q3 156 / 2286 6.82% 2 / 46 4.35% 120 / 1926 6.23% 279 / 4263 6.54%2007 Q4 226 / 2342 9.65% 1 / 53 1.89% 166 / 1950 8.51% 393 / 4351 9.03%2008 Q1 202 / 2382 8.48% 1 / 52 1.92% 163 / 1999 8.15% 366 / 4441 8.24%2008 Q2 259 / 2457 10.54% 5 / 55 9.09% 193 / 2088 9.24% 458 / 4611 9.93%2008 Q3 206 / 2516 8.19% 2 / 58 3.45% 134 / 2144 6.25% 342 / 4724 7.24%2008 Q4 162 / 2587 6.26% 1 / 66 1.52% 153 / 2180 7.02% 316 / 4841 6.53%2009 Q1 176 / 2657 6.62% 2 / 76 2.63% 146 / 2234 6.54% 324 / 4975 6.51%2009 Q2 146 / 2718 5.37% 5 / 80 6.25% 117 / 2312 5.06% 269 / 5120 5.25%2009 Q3 123 / 2784 4.42% 3 / 79 3.80% 100 / 2335 4.28% 226 / 5208 4.34%2009 Q4 120 / 2825 4.25% 2 / 81 2.47% 105 / 2392 4.39% 227 / 5309 4.28%2010 Q1 133 / 2875 4.63% 2 / 81 2.47% 99 / 2454 4.03% 234 / 5420 4.32%2010 Q2 117 / 2915 4.01% 0 / 89 0.00% 101 / 2497 4.04% 218 / 5508 3.96%2010 Q3 137 / 3008 4.55% 1 / 86 1.16% 112 / 2543 4.40% 250 / 5644 4.43%2010 Q4 131 / 3039 4.31% 5 / 93 5.38% 110 / 2602 4.23% 246 / 5743 4.28%2011 Q1 131 / 3119 4.20% 4 / 105 3.81% 119 / 2638 4.51% 255 / 5879 4.34%2011 Q2 122 / 3171 3.85% 4 / 106 3.77% 93 / 2672 3.48% 219 / 5967 3.67%2011 Q3 132 / 3219 4.10% 10 / 112 8.93% 105 / 2747 3.82% 247 / 6105 4.05%2011 Q4 113 / 3241 3.49% 5 / 122 4.10% 82 / 2794 2.93% 200 / 6200 3.23%2012 Q1 124 / 3293 3.77% 1 / 118 0.85% 78 / 2840 2.75% 207 / 6302 3.28%2012 Q2 122 / 3298 3.70% 3 / 122 2.46% 96 / 2894 3.32% 223 / 6380 3.50%
Vancouver HSDA Northern Interior HSDA Other HSDAs All HSDAs
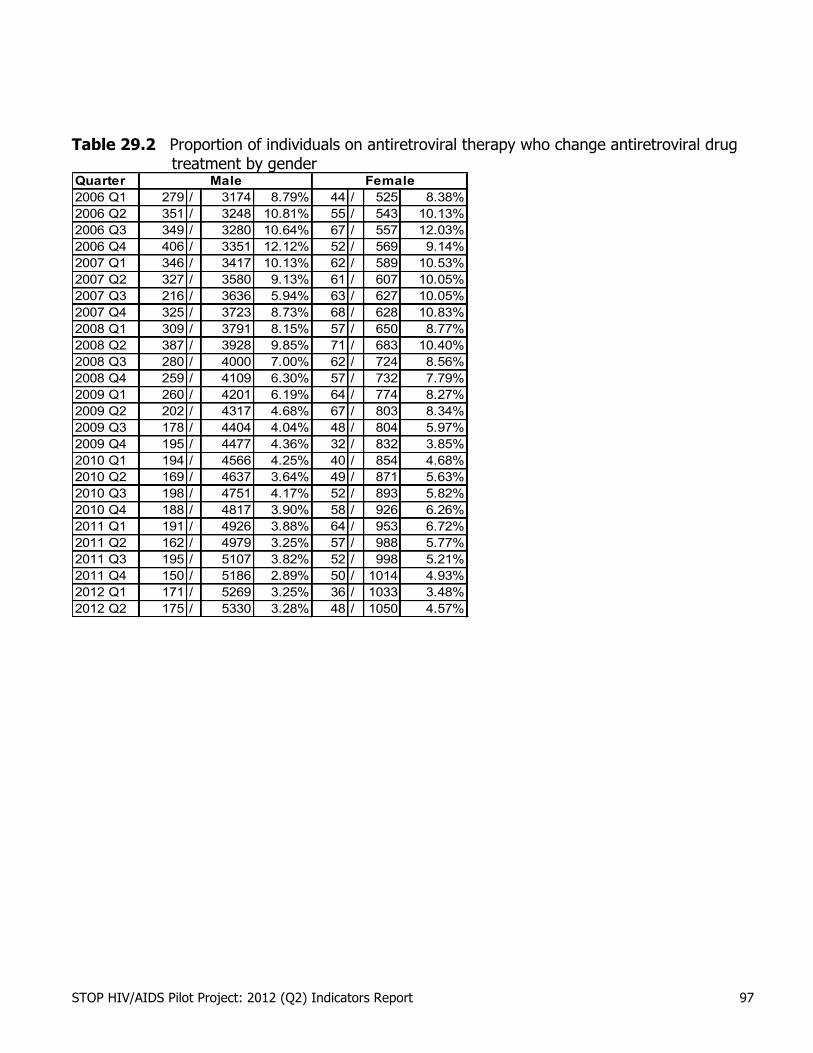
STOP HIV/AIDS Pilot Project: 2012 (Q2) Indicators Report 97
Table 29.2 Proportion of individuals on antiretroviral therapy who change antiretroviral drug
treatment by gender Quarter2006 Q1 279 / 3174 8.79% 44 / 525 8.38%2006 Q2 351 / 3248 10.81% 55 / 543 10.13%2006 Q3 349 / 3280 10.64% 67 / 557 12.03%2006 Q4 406 / 3351 12.12% 52 / 569 9.14%2007 Q1 346 / 3417 10.13% 62 / 589 10.53%2007 Q2 327 / 3580 9.13% 61 / 607 10.05%2007 Q3 216 / 3636 5.94% 63 / 627 10.05%2007 Q4 325 / 3723 8.73% 68 / 628 10.83%2008 Q1 309 / 3791 8.15% 57 / 650 8.77%2008 Q2 387 / 3928 9.85% 71 / 683 10.40%2008 Q3 280 / 4000 7.00% 62 / 724 8.56%2008 Q4 259 / 4109 6.30% 57 / 732 7.79%2009 Q1 260 / 4201 6.19% 64 / 774 8.27%2009 Q2 202 / 4317 4.68% 67 / 803 8.34%2009 Q3 178 / 4404 4.04% 48 / 804 5.97%2009 Q4 195 / 4477 4.36% 32 / 832 3.85%2010 Q1 194 / 4566 4.25% 40 / 854 4.68%2010 Q2 169 / 4637 3.64% 49 / 871 5.63%2010 Q3 198 / 4751 4.17% 52 / 893 5.82%2010 Q4 188 / 4817 3.90% 58 / 926 6.26%2011 Q1 191 / 4926 3.88% 64 / 953 6.72%2011 Q2 162 / 4979 3.25% 57 / 988 5.77%2011 Q3 195 / 5107 3.82% 52 / 998 5.21%2011 Q4 150 / 5186 2.89% 50 / 1014 4.93%2012 Q1 171 / 5269 3.25% 36 / 1033 3.48%2012 Q2 175 / 5330 3.28% 48 / 1050 4.57%
Male Female

STOP HIV/AIDS Pilot Project: 2012 (Q2) Indicators Report 98
Appendix A: List of Indicators
Indicator 1: Number of HIV tests
Indicator 2: Population HIV testing rate
Indicator 3: Number of new HIV diagnoses
Indicator 4: Rate of new AIDS case reports
Indicator 5: Percentage positivity among persons tested for HIV
Indicator 6a: Proportion of individuals tested for syphilis who are tested for HIV at the same clinical encounter
Indicator 6b: Proportion of individuals with a new STI diagnosis who are tested for HIV within three months of STI diagnosis
Indicator 7: Proportion of individuals with a new HCV diagnosis who are tested for HIV within three months of HCV diagnosis
Indicator 8: Proportion of individuals named as contacts of an index case who have a subsequent HIV test
Indicator 9: Proportion of individuals with a new HIV diagnosis with advanced HIV disease Indicator 10: Proportion of HIV individuals with a CD4 cell count <200 cells/mL at fist postive HIV test
Indicator 11: Proportion of individuals with a new HIV diagnosis with acute HIV infection Indicator 12: Proportion of HIV positive individuals with a family physician
Indicator 13: Interval between first HIV positive test and first HIV plasma viral load
Indicator 14: Proportion of individuals starting antiretroviral therapy (ART) late in the course of HIV disease
Indicator 15: Proportion of HIV positive individuals eligible to start ART by CD4 cell count criteria who are currently on ART
Indicator 16: Proportion of HIV positive individuals who are accessing ART
Indicator 17: Rate of disease progression among individuals accessing and not accessing ART
Indicator 18: Proportion of individuals with a new HIV diagnosis who are tested for syphilis within three months of HIV diagnosis
Indicator 19: Proportion of HIV positive women with baseline and annual pap smears
Indicator 20: Proportion of HIV positive individuals who have had > three pVL measures in the past year
Indicator 21: Percentage of HIV-infected individuals who are tested for genotypic antiretroviral drug resistance prior to starting antiretroviral therapy (ART)
STOP HIV/AIDS Pilot Project: 2012 (Q2) Indicators Report 99
Indicator 22: Percentage of individuals starting antiretroviral therapy (ART) who achieve HIV plasma viral load (pVL) of <200 copies/mL within six months of therapy initiation
Indicator 23: Percentage of individuals who initiated antiretroviral therapy (ART) with a recommended therapy regimen (among those with no drug resistance)
Indicator 24: Percentage of individuals on antiretroviral therapy (ART) that achieve annual prescription refill adherence of >95%
Indicator 25: Number of physicians initiating antiretroviral therapy (ART)
Indicator 26: Percentage of individuals on antiretroviral therapy (ART) who experience a serious adverse drug reaction (ADR)
Indicator 27: Rate of transmission of primary resistance
Indicator 28: Incidence of resistance to any retroviral drug
Indicator 29: Proportion of individuals on antiretroviral therapy who change antiretroviral drug treatment
Indicator 30: Social determinant to be determined
Indicator 31: Social determinant to be determined
Indicator 32: Social determinant to be determined
Indicator 33: Social determinant to be determined
Indicator 34: Estimates of health service cost and use among HIV positive individuals using supportive services
Indicator 35: The number and specturm of health care services used by HIV positive individuals who are using and not using ART
Indicator 36: Cost of health service use among HIV positive individuals who are using and not using ART