Stoichiometric controls on carbon, nitrogen, and ...
18
Ecological Monographs, 80(1), 2010, pp. 89–106 Ó 2010 by the Ecological Society of America Stoichiometric controls on carbon, nitrogen, and phosphorus dynamics in decomposing litter STEFANO MANZONI, 1 JOHN A. TROFYMOW, 2 ROBERT B. JACKSON, 3 AND AMILCARE PORPORATO 1,4 1 Civil and Environmental Engineering Department, Duke University, 121 Hudson Hall, Box 90287, Durham, North Carolina 27708-0287 USA 2 Canadian Forest Service, Pacific Forestry Centre, 506 West Burnside Road, Victoria, British Columbia V8Z 1M5 Canada 3 Department of Biology and Nicholas School of the Environment, Duke University, Box 90338, 3311 FFSC, Durham, North Carolina 27708 USA Abstract. The mineralization of nitrogen and phosphorus from plant residues provides an important input of inorganic nutrients to the soil, which can be taken up by plants. The dynamics of nutrient mineralization or immobilization during decomposition are controlled by different biological and physical factors. Decomposers sequester carbon and nutrients from organic substrates and exchange inorganic nutrients with the environment to maintain their stoichiometric balance. Additionally, physical losses of organic compounds from leaching and other processes may alter the nutrient content of litter. In this work, we extend a stoichiometric model of litter nitrogen mineralization to include (1) phosphorus mineraliza- tion, (2) physical losses of organic nutrients, and (3) chemical heterogeneity of litter substrates. The enhanced model provides analytical mineralization curves for nitrogen and phosphorus as well as critical litter carbon : nutrient ratios (the carbon : nutrient ratios below which net nutrient release occurs) as a function of the elemental composition of the decomposers, their carbon-use efficiency, and the rate of physical loss of organic compounds. The model is used to infer the critical litter carbon : nutrient ratios from observed nitrogen and phosphorus dynamics in about 2600 litterbag samplings from 21 decomposition data sets spanning artic to tropical ecosystems. At the beginning of decomposition, nitrogen and phosphorus tend to be immobilized in boreal and temperate climates (i.e., both C:N and C:P critical ratios are lower than the initial ratios), while in tropical areas nitrogen is generally released and phosphorus may be either immobilized or released, regardless of the typically low phosphorus concentrations. The critical carbon : nutrient ratios we observed were found to increase with initial litter carbon : nutrient ratios, indicating that decomposers adapt to low-nutrient conditions by reducing their carbon-use efficiency. This stoichiometric control on nutrient dynamics appears ubiquitous across climatic regions and ecosystems, although other biological and physical processes also play important roles in litter decomposition. In tropical humid conditions, we found high critical C:P ratios likely due to high leaching and low decomposer phosphorus concentrations. In general, the compound effects of stoichiometric constraints and physical losses explain most of the variability in critical carbon : nutrient ratios and dynamics of nutrient immobilization and release at the global scale. Key words: carbon; decomposer stoichiometry; microbial immobilization; mineralization; nitrogen; nutrient cycling; phosphorus; plant residue decomposition. INTRODUCTION Nitrogen and phosphorus are considered the most important limiting elements for vegetation in terrestrial ecosystems (Vitousek 1984, Chapin et al. 1986, Vitousek and Howarth 1991). The amount of plant-available nitrogen and phosphorus constrains both natural and managed ecosystems, including agricultural productivity where fertilizers are not used (Seneviratne 2000). At decadal and longer time scales typical of ecosystem development, the predominant source of phosphorus is from rock weathering, while nitrogen is of atmospheric origin. Accordingly, plants growing on young soils tend to be nitrogen limited, while vegetation on older, highly weathered soils is often phosphorus limited (Vitousek 1984, Jobbagy and Jackson 2001, Reich and Oleksyn 2004). Similarly, peatland soils may have large phos- phorus stocks bound in resistant organic forms that are not readily available for plant use. These broad-scale trends in soil features, coupled with smaller scale heterogeneity in soil–vegetation interactions, produce a spectrum of nutrient availabilities and patterns of nutrient limitation, which in turn result in plant tissues and residues with very different chemical compositions (Vitousek and Howarth 1991, McGroddy et al. 2004, Reich and Oleksyn 2004, Townsend et al. 2007). At the yearly time scale, much of the available inorganic Manuscript received 31 January 2009; revised 21 May 2009; accepted 1 June 2009. Corresponding Editor: P. M. Groffman. 4 Corresponding author. E-mail: [email protected] 89
Transcript of Stoichiometric controls on carbon, nitrogen, and ...

Ecological Monographs, 80(1), 2010, pp. 89–106! 2010 by the Ecological Society of America
Stoichiometric controls on carbon, nitrogen, and phosphorusdynamics in decomposing litter
STEFANO MANZONI,1 JOHN A. TROFYMOW,2 ROBERT B. JACKSON,3 AND AMILCARE PORPORATO1,4
1Civil and Environmental Engineering Department, Duke University, 121 Hudson Hall, Box 90287,Durham, North Carolina 27708-0287 USA
2Canadian Forest Service, Pacific Forestry Centre, 506 West Burnside Road, Victoria, British Columbia V8Z1M5 Canada3Department of Biology and Nicholas School of the Environment, Duke University, Box 90338, 3311 FFSC,
Durham, North Carolina 27708 USA
Abstract. The mineralization of nitrogen and phosphorus from plant residues provides animportant input of inorganic nutrients to the soil, which can be taken up by plants. Thedynamics of nutrient mineralization or immobilization during decomposition are controlledby different biological and physical factors. Decomposers sequester carbon and nutrients fromorganic substrates and exchange inorganic nutrients with the environment to maintain theirstoichiometric balance. Additionally, physical losses of organic compounds from leaching andother processes may alter the nutrient content of litter. In this work, we extend astoichiometric model of litter nitrogen mineralization to include (1) phosphorus mineraliza-tion, (2) physical losses of organic nutrients, and (3) chemical heterogeneity of litter substrates.The enhanced model provides analytical mineralization curves for nitrogen and phosphorus aswell as critical litter carbon : nutrient ratios (the carbon : nutrient ratios below which netnutrient release occurs) as a function of the elemental composition of the decomposers, theircarbon-use efficiency, and the rate of physical loss of organic compounds. The model is usedto infer the critical litter carbon : nutrient ratios from observed nitrogen and phosphorusdynamics in about 2600 litterbag samplings from 21 decomposition data sets spanning artic totropical ecosystems. At the beginning of decomposition, nitrogen and phosphorus tend to beimmobilized in boreal and temperate climates (i.e., both C:N and C:P critical ratios are lowerthan the initial ratios), while in tropical areas nitrogen is generally released and phosphorusmay be either immobilized or released, regardless of the typically low phosphorusconcentrations. The critical carbon : nutrient ratios we observed were found to increase withinitial litter carbon : nutrient ratios, indicating that decomposers adapt to low-nutrientconditions by reducing their carbon-use efficiency. This stoichiometric control on nutrientdynamics appears ubiquitous across climatic regions and ecosystems, although otherbiological and physical processes also play important roles in litter decomposition. In tropicalhumid conditions, we found high critical C:P ratios likely due to high leaching and lowdecomposer phosphorus concentrations. In general, the compound effects of stoichiometricconstraints and physical losses explain most of the variability in critical carbon : nutrient ratiosand dynamics of nutrient immobilization and release at the global scale.
Key words: carbon; decomposer stoichiometry; microbial immobilization; mineralization; nitrogen;nutrient cycling; phosphorus; plant residue decomposition.
INTRODUCTION
Nitrogen and phosphorus are considered the most
important limiting elements for vegetation in terrestrial
ecosystems (Vitousek 1984, Chapin et al. 1986, Vitousek
and Howarth 1991). The amount of plant-available
nitrogen and phosphorus constrains both natural and
managed ecosystems, including agricultural productivity
where fertilizers are not used (Seneviratne 2000). At
decadal and longer time scales typical of ecosystem
development, the predominant source of phosphorus is
from rock weathering, while nitrogen is of atmospheric
origin. Accordingly, plants growing on young soils tendto be nitrogen limited, while vegetation on older, highlyweathered soils is often phosphorus limited (Vitousek1984, Jobbagy and Jackson 2001, Reich and Oleksyn2004). Similarly, peatland soils may have large phos-phorus stocks bound in resistant organic forms that arenot readily available for plant use. These broad-scaletrends in soil features, coupled with smaller scaleheterogeneity in soil–vegetation interactions, produce aspectrum of nutrient availabilities and patterns ofnutrient limitation, which in turn result in plant tissuesand residues with very different chemical compositions(Vitousek and Howarth 1991, McGroddy et al. 2004,Reich and Oleksyn 2004, Townsend et al. 2007). At theyearly time scale, much of the available inorganic
Manuscript received 31 January 2009; revised 21 May 2009;accepted 1 June 2009. Corresponding Editor: P. M. Groffman.
4 Corresponding author. E-mail: [email protected]
89

nutrient comes from biological mineralization of plantresidues. Thus, it is important to quantify nutrientinteractions and patterns of release from chemicallydifferent litter types and under different climaticconditions.Nutrient mineralization from plant residues is pre-
dominantly controlled by the activity of decomposerorganisms. Decomposers tend to grow following rela-tively rigid stoichiometric requirements (Cleveland andLiptzin 2007), and carbon and nutrients are typicallyprocessed together in order to achieve balanced growthconditions (Sinsabaugh and Moorhead 1994, Sinsa-baugh et al. 2008). Since nitrogen and phosphorusconcentrations in plant litter tend to be low compared tothe decomposer requirements, nutrients may be initiallyimmobilized from the environment by decomposers untilthe nutrient concentrations in the litter reach a criticalvalue and net release occurs (Aber et al. 1978, Berg andMcClaugherty 2003, Moore et al. 2006, Parton et al.2007). As a consequence of this coupling betweencarbon and nutrients through decomposer activity, alinear increase in litter nitrogen or phosphorus concen-trations as a function of the remaining carbon in litterhas been observed (Waksman 1924, Gosz et al. 1973,Aber and Melillo 1980). Under most conditions,physical processes such as leaching also play a role inthe early phases of decomposition, although in humidenvironments they may be important through all phasesof decomposition, when water flushes away solubleorganic compounds, or freeze–thaw cycles mechanicallydisrupt residue texture, causing losses by fragmentation(Yavitt and Fahey 1986, Currie and Aber 1997, Bergand McClaugherty 2003, Cleveland et al. 2006).Although simultaneous patterns of nitrogen and
phosphorus immobilization and release have beendocumented in the field, mechanistic models havetypically focused on nitrogen alone (Manzoni et al.2008a, Manzoni and Porporato 2009). Among the fewmodels that include phosphorus cycling, only one hasbeen specifically applied to nitrogen and phosphorusdynamics in different litter types under natural condi-tions (Bosatta and Agren 1991, Hyvonen et al. 2000).Importantly, very few models account for physical lossesof organic substrates during decomposition (e.g., Currieand Aber 1997, Michalzik et al. 2003), neglecting apotentially important factor in the litter nutrientbalance, especially for nutrients in organic form thatare prone to leaching such as phosphorous. A mecha-nistic representation of nutrient dynamics and interac-tions in decomposing litter is therefore needed thatincludes both biological and physical factors. Such amodel may be useful to analyze the variety of observedpatterns arising from chemically different litter typesand under different environmental conditions.Here we extend the framework and model of Manzoni
et al. (2008a) to describe litter carbon, nitrogen, andphosphorus dynamics, with the aim of explaining thepatterns of nutrient immobilization and release that
have been observed across ecosystems worldwide. Weuse 21 terrestrial decomposition data sets, including theextensive Canadian Intersite Decomposition Experiment(CIDET; Trofymow and CIDET Working Group 1998),and several wood decomposition chronosequences(Table 1). We derive critical carbon : nutrient ratios(below which net nutrient release occurs) in terms ofdecomposer characteristics, including carbon-use effi-ciency and elemental composition, as well as specificlitter and environmental parameters. Because thedecomposer C:N ratio is relatively constant acrosssubstrate types, Manzoni et al. (2008a) have shown thatthe variability of the critical C:N of the litter is largelyexplained by a reduced decomposers’ carbon-use effi-ciency with decreasing initial litter nitrogen concentra-tion. This response to low organic nitrogen availabilityis common to bacteria and consumers at higher trophiclevels (Mattson 1980, Pandian and Marian 1986, Russelland Cook 1995, del Giorgio and Cole 1998, Elser et al.2000). Similarly, reduced efficiency would be expectedalso under conditions of low organic phosphorusavailability (Elser et al. 2000, Sterner and Elser 2002),but this hypothesis has not, to our knowledge, beentested for terrestrial decomposer organisms.Based on this theoretical framework, we analyze the
patterns of immobilization and mineralization of bothnitrogen and phosphorus, assessing the effects of bothnutrients on the biochemical characteristics of thedecomposer communities. We then compute the criticalcarbon : nutrient ratios as a function of these character-istics and analyze their patterns of variation across littertypes and climatic conditions. As a result, we obtainsimple relationships between the thresholds of netnutrient release and litter type that are valid at theglobal scale.
METHODS
Data description
Using data from the Canadian Intersite Decomposi-tion Experiment (CIDET) and 20 other literaturesources, we compiled a database of litter carbon,nitrogen, and phosphorus contents during decomposi-tion (Table 1). Each decomposition data set wasassociated with a broad climatic region according tothe mean annual temperature. We distinguished amongartic and boreal, temperate, and tropical regions. TheCIDET data set encompasses ten types of leaf litterdecomposed at 21 locations in Canada (Trofymow andCIDET Working Group 1998, Trofymow et al. 2002,Moore et al. 2006). The other decomposition data setsare mainly from boreal and temperate forest ecosystemsbut also include tropical regions (Table 1). Except fortwo data sets based on a reciprocal litterbag design(CIDET; and Thompson and Vitousek 1997), all theother studies focus on decomposition of local littermaterial.In this paper our focus is on surface litter decompo-
sition in terrestrial ecosystems, where external inputs of
STEFANO MANZONI ET AL.90 Ecological MonographsVol. 80, No. 1

organic carbon and nutrients in the litterbag aregenerally negligible. Hence, no data from litterbagsburied into the soil or decomposed in wetland sites wereincluded here. We also excluded litter fertilizationstudies where the availability of inorganic nutrients issignificantly larger than in natural conditions. To havetime series of carbon and nutrient contents representa-tive of the entire decomposition process, we onlyselected those data sets presenting both significant masslosses (generally .50%) and at least seven data points.We treated observations from the same litter typedecomposed at different sites within a given climaticregion as a single data set, on the grounds that siteeffects should be generally less important than stoichio-metric effects (Parton et al. 2007).We also added six chronosequence studies of coarse
wood decomposition to widen the range of initial C:Nand C:P ratios (Table 1). Only a few points weregenerally available in these data sets (four to sevenobservations), but they generally covered several de-cades of decomposition, better characterizing the laterstages of degradation. The temporal evolution of wooddensity was used as a proxy for the wood dry mass (orcarbon mass) evolution in some of the data sets whereno other specific information was given (Foster andLang 1982, Sollins et al. 1987, Means et al. 1992, Busse1994). Although this approximation might tend tooverestimate nutrient immobilization in decomposinglogs (Krankina et al. 1999), the uncertainties in the mass(and hence carbon) temporal evolution are not expectedto significantly affect patterns of accumulation andrelease for nitrogen and phosphorus in these nutrient-poor substrates. For all data sets, a carbon concentra-
tion of 50% was assumed unless specific information wasavailable.
Mineralization and balance equations
Nitrogen and phosphorus release curves can beobtained analytically using a simplified lumped modelof litter dynamics valid at monthly to yearly time scales(depending on the climatic conditions that dictate theoverall decomposition rates). Using a similar approachas Manzoni et al. (2008a), we consider the total mass ofcarbon CL and total mass of a nutrient element EL in alitterbag or in a given volume of decomposing wood,where the element E may be nitrogen or phosphorus(Fig. 1). The decomposition flux, controlled by substrateand decomposer availability as well as environmentalconditions, is denoted by D. Climatic effects andavailability of nutrients in the environment are accountedfor in the functional dependence of D on litter moisture,temperature, and inorganic nitrogen and phosphorus.These effects, as will be made clear below, only changethe reaction rate, but not the carbon–nutrient relation-ship in decomposing litter. We model two biologicalfluxes involved in the decay process and related to theflux D: heterotrophic respiration, by which organiccarbon is mineralized and released to the atmosphere,and net nutrient mineralization, which controls therelease and accumulation of nutrients in the residues.We also explicitly consider physical losses (mainlyleaching) of organic compounds from the litter (Fig. 1).
Leaching of organic nutrients from litter typicallytakes place in two phases. One is an initial, very rapidphase where leaching of soluble compounds is broughtabout by some intense rainfall event or freeze–thaw cycle(Gosz et al. 1973, Aber and Melillo 1980, Yavitt and
TABLE 1. Data set description.
Data set Method! Litter type" Climatic region§ (C/N )L,0 range (C/P)L,0 range
Lambert et al. (1980) CS & BR 332 3992Foster and Lang (1982) CS & BR 624–714 5000–8568Edmonds (1987) LB & TM 118–209 866–1151Sollins et al. (1987) CS & TM 454–625 5387–12 407Blair (1988) LB § TM 56–86 525–1137Berg and McClaugherty (1989) LB §, n BR, TM 16–147 208–2632Means et al. (1992) CS & TM 620 23 682Tripathi and Singh (1992) LB *, §, & TR 37–59 590–1842Busse (1994) CS & TM 1327 14 959Zhu and Ehrenfeld (1996) LB n TM 58 873Thompson and Vitousek (1997) LB § TR 31–40 357–455Trofymow and CIDET Working Group (1998) LB *, §, n BR, TM 39–82 369–2122Krankina et al. (1999) CS & BR 277–294 7056–13 573Liu et al. (2000) LB *, § TM 32–39 415–708Chuyong et al. (2002) LB § TR 28–49 515–1282Hirobe et al. (2004) LB § TR 33–73 1419–11 450Osono and Takeda (2004, 2005) LB §, n TM 17–94 352–2500Isaac and Nair (2005) LB § TR 33–47 331–1470Xu (2006) LB n TR 59–79 2165–3615Li et al. (2007) LB §, n TM 30–70 381–849Ball et al. (2009) LB § TM 40–87.3 1001–2444
! Key to abbreviations: LB, litterbag method; CS, chronosequence study." Key to symbols: *, grass leaves and moss; §, broadleaved tree and shrub leaves; n, conifer needles; &, woody residues.§ Key to abbreviations: BR, polar, subpolar, and boreal (open black symbols in Figs. 3, 7, and 8); TM, temperate (solid gray
symbols); TR, tropical and subtropical (open gray symbols).
February 2010 91STOICHIOMETRY OF LITTER DECOMPOSITION

Fahey 1986). The other is a less intense but prolongedphase when compounds solubilized by extracellularenzymes and freeze–thaw cycles or small litter fragmentsare lost from the litterbags (Currie and Aber 1997). Forlonger timescales (e.g., years) the initial loss is effectivelyan instantaneous process, so we assume that the earlyleaching event is equivalent to changing the initialcondition of the litter (Aber and Melillo 1980, Berg andStaaf 1987). The degree of this correction is computedfrom the observed nutrient losses during the early phaseof decomposition (seeMethods: Data analysis). To modelleaching during the following phases of decomposition,we assume that constant fractions of carbon and nutrientfluxes from residue decomposition are lost from thesystem (coefficients kC and kE; see Fig. 1).The remaining carbon from decomposition is either
converted to new decomposer biomass according to acarbon-use efficiency e (the fraction (1 ! kC)e) orrespired (the fraction (1 – kC)(1 ! e); see Fig. 1). Sincedecomposers grow at a rate G¼ (1! kC)eD in terms ofcarbon mass, they also need to assimilate proportionalamounts of nutrient E to maintain their given C/E ratio,as indicated by (C/E)B. Both the parameters e and(C/E)B are assumed to be constant through time.The stoichiometric flux of organic nutrients mobilized
from a perfectly homogeneous litter is D(EL/CL) (Fig.1). To account for the chemical heterogeneity of the
residues in a simplified way, we use a coefficient aE thatmodifies the flux D(EL/CL). When aE is larger than one,decomposers preferentially assimilate nutrient-rich com-pounds from the litter residues, resulting in slowerdecomposition in nutrient-poor substrates. The theoret-ical nutrient mineralization fluxes ME can be computedas the difference between the assimilated nutrients (i.e.,(1 ! kE)aED(EL/CL)) and the stoichiometric demand(i.e., GðC=EÞ!1
B ):
ME ¼ Dð1! kEÞaEEL
CL! ð1! kCÞe
ðC=EÞB
! ": ð1Þ
When ME is positive, the excess organic nutrients thatare assimilated are mineralized; if ME is negative, thennutrient demands are met by nutrient immobilization.The mass balance equations for CL, and EL in a littercohort can be written as
dCL
dt¼ !D ð1! kCÞð1! eÞ þ kC½ ' ð2Þ
and
dEL
dt¼ !ME ! kEaED
EL
CL¼ !aED
EL
CL! 1
ðC=EÞCR
! "ð3Þ
where (C/E)CR is a generalized critical carbon : nutrientratio that also accounts for physical losses of organiccarbon (controlled by the parameter kC), and preferen-tial assimilation of nutrient-rich compounds (aE):
ðC=EÞCR ¼ aEðC=EÞBð1! kCÞe
: ð4Þ
When the ratio CL/EL is larger than the critical ratio,immobilization of the nutrient from the inorganic pool isneeded; otherwise net nutrient mineralization occurs. Inmost litter types, as shown below, the initial littercarbon : nutrient ratio is higher than (C/E)CR, resultingin an early immobilization phase during which CL/EL
decreases, followed by a net release phase when CL/EL ,(C/E)CR. In Eq. 4, high leaching rates kC and highvalues of aE lead to higher values of (C/E)CR. When noleaching occurs (i.e., kC¼ kE¼ 0), and carbon and E aredecomposed in proportion equal to their ratio (i.e., aE¼1), (C/E)CR ¼ (C/E)B/e, which is the typical definitionbased solely on decomposer characteristics (Bosatta andStaaf 1982, Manzoni and Porporato 2007). Note thatEq. 3 does not depend on kE because the mineralizationflux ME compensates any leaching losses of nutrients inorganic form by increasing immobilization.
Nutrient release curves
Proceeding as in Manzoni et al. (2008a), we combineEqs. 2 and 3, eliminating the direct time dependence(with the associated effects of climatic parameters andexternal nutrient availability), and obtain a single first-order ordinary differential equation for the independentvariable CL and the dependent variable EL:
FIG. 1. Schematic representation of litter carbon (CL) andnutrient (EL, representing either litter N or litter P) dynamics.Solid lines represent the carbon fluxes (D, decomposition flux;G, growth rate; e, carbon use efficiency; R, respiration rate; kC,fraction of D lost through leaching), and dashed lines representthe nutrient fluxes (ME, net nutrient mineralization flux; aE,coefficient accounting for preferential decomposition of EL; kE,fraction of nutrient decomposition lost through leaching;(C/E)B, decomposer C/E ratio). Note that ME is defined to bepositive when nutrient is released from the litter and negativewhen immobilization occurs.
STEFANO MANZONI ET AL.92 Ecological MonographsVol. 80, No. 1

dEL
dCL¼ aE
1! eð1! kCÞEL
CL! 1
ðC=EÞCR
! ": ð5Þ
Eq. 5 can be solved in terms of the normalized variablesc ¼ CL(t)/CL(0) and e ¼ EL(t)/EL(0), with initialcondition e(c ¼ 1) ¼ 1 (e.g., Bender and Orszag 1987).This solution leads to the nutrient release curve:
eðcÞ ¼ cbEðC=EÞL;0ðC=EÞB
þ 1! bEðC=EÞL;0ðC=EÞB
! "caE= 1!eð1!kCÞ½ '
ð6Þ
where the subscript L,0 indicates carbon : nutrientratios at the beginning of decomposition [i.e., (C/E)L,0¼ CL(0)/EL(0)] and, for simplicity of notation, wedefined
bE ¼ eð1! kCÞeð1! kCÞ þ aE ! 1
: ð7Þ
When no leaching occurs and aE ¼ 1, Eq. 6 can besimplified to
eðcÞ ¼ cðC=EÞE;0ðC=EÞB
þ 1!ðC=EÞL;0ðC=EÞB
! "c1=ð1!eÞ: ð8Þ
This is the same nutrient release curve derived byManzoni et al. (2008a) for litter nitrogen. Eq. 8 had alsobeen already derived in a different manner for a lumpedmodel based on linear decomposition (Bosatta andStaaf 1982) and as a special solution of a continuumquality model including both nitrogen and phosphorusdynamics (Bosatta and Agren 1991, Hyvonen et al.2000). This outcome suggests that the compartmentalstructure of the decomposition model is of secondaryimportance with respect to macroscopic stoichiometricconstraints when modeling decomposition of individuallitter types. Notably, Eqs. 6 and 8 do not depend on thespecific function used to model the decomposition flux(e.g., linear vs. nonlinear formulations for D; see alsoManzoni and Porporato 2007). This result similarlyimplies that the nutrient release curves are roughlyindependent of the climatic forcing and biochemicalconstraints on decomposition rates. The proposedmodel also assumes that the availability of inorganicnutrients only affects the rates of decomposition bymodifying the flux D, while the stoichiometry of thedecomposers, represented by Eq. 6, remains the same(Manzoni and Porporato 2007, 2009). In this manner,the roles of climate and external nutrient availabilityare separated from that of stoichiometry, therebycapturing the main mineralization patterns independentof specific climatic conditions at the decomposition site.However, climatic factors strongly affect the speed ofthe degradation process, resulting in faster convergencetowards the condition c ¼ n ¼ p ¼ 0.Eq. 6 can be rearranged to present the litter
carbon : nutrient ratio as a function of the fraction ofremaining carbon (e.g., data presented in Fig. 4):
CL
EL¼ bE
ðC=EÞB
#
þ 1
ðC=EÞ0! bEðC=EÞB
! "c aE= 1!eð1!kCÞ½ 'f g!1
$!1
: ð9Þ
From Eq. 9, the evolution of the litter N:P ratio as afunction of remaining carbon can also be derived:
NL
PL¼ bNðC=NÞ
!1B
n
þ ðC=NÞ!1L;0 ! bNðC=NÞ
!1B
h ic aN= 1!eð1!kCÞ½ 'f g!1
o
4 bPðC=PÞ!1B þ ðC=PÞ!1
L;0 ! bPðC=PÞ!1B
h in
3 c aP= 1!eð1!kCÞ½ 'f g!1o: ð10Þ
Projections of different trajectories of litter nitrogenand phosphorus evolution in the n–p space duringdecomposition are shown in Fig. 2 to illustrate thetypical model behavior. All trajectories start at c¼ n¼ p¼ 1, and eventually reach the end of the decompositionprocess at c ¼ n ¼ p ¼ 0. The shape of the particulartrajectories depends on the initial conditions, withstronger immobilization (n . 1 or p . 1) occurringwhen residues are nutrient poor and initial netmineralization of nutrients (n and p) in richer littermonotonically decrease. The extent of the immobiliza-tion phase depends on the critical C/E ratio in Eq. 4,which increases with decreasing efficiency e (assumingthat the decomposer elemental composition (C/E)B,leaching rate kC, and preferential nutrient assimilationaE are constant). Four possible regimes are observed.(A) The initial C:N and C:P ratios are both higher thanthe corresponding critical ratios (dotted–dashed graycurve in Fig. 2), and net immobilization of bothnutrients occurs (n and p . 1) before net release isinitiated (n and p decrease ,1). (B) The initial C:N ratiois higher than (C/N )CR, while the initial C:P ratio islower than (C/P)CR (solid gray line in Fig. 2); netnitrogen immobilization occurs at the beginning ofdecomposition, while phosphorus is released throughoutthe process. (C) The initial C:P ratio is higher than(C/P)CR, while the initial C:N is lower than (C/N )CR(dashed gray line in Fig. 2), leading to net phosphorusimmobilization and nitrogen release. (D) The initial C:Nand C:P ratios are both lower than the correspondingcritical ratios and net nitrogen and phosphorus miner-alization occurs from the start of decomposition, withthe trajectories remaining below one. This limitingregime may occur even in low-nutrient litters whendecomposer carbon-use efficiency is also very low (blackcurves in Fig. 2). In fact, when e is low enough, thedecomposer nutrient demand is decreased, and immo-bilization is less necessary. Under these conditionsnutrients typically accumulate without net immobiliza-
February 2010 93STOICHIOMETRY OF LITTER DECOMPOSITION

tion (i.e., the concentration in the litter increases evenwith net nutrient release).
Estimation of model parameters
Eq. 6 has four parameters (e, (C/E)B, aE, and kC) thatare assumed constant in time, although they may varyacross litter types and climatic or site conditions. In thissection we discuss which of the parameters may beassumed to be constant across data sets and which onesare more likely to change with litter type. The goal is toestimate at least some of the parameters a priori, andleave only a minimal number to be obtained throughregression of the data.There are no direct observations of carbon-use
efficiency e for litter decomposers, and observations inaquatic bacteria and insects suggest a dependence onsubstrate nutrient concentration (Mattson 1980, PandianandMarian 1986, del Giorgio and Cole 1998, Sterner andElser 2002). Thus, given its possible variation across litter
types, we will consider e as a parameter to be fit to thedata. The decomposer C:N ratio can be relatively well-constrained using data from the literature, with typicalvalues ranging from ;7 in soils to ;15 in plant residues(Table 2). This range is considerably smaller than therange of substrate C:N, so that we can approximate itwith a constant value (C/N )B¼ 10 across litter types. Toassess the sensitivity of this assumption, we alsoconsidered a power law dependence between decomposerand initial C:N ratio, based on the data reported in Table2. Using the data for whole decomposer biomass andexcluding the value (C/N )B ¼ 24.8 (considered unrealis-tically high, given the corresponding substrate C:Nratio), we found (C/N )B¼ 4.333 ðC=NÞ0:22L;0 . In contrast,the microbial C:P ratio is more variable, with most valuesin the range of 10–60 in mineral soils, but with extremevalues as low as five and as high as 500 (Fig. 3, Table 2).Moreover, precise information on litter decomposers islacking, so that we cannot define a single (C/P)B, or anyfunction relating this parameter to litter chemistry andenvironmental conditions. Thus we will keep it as aparameter to be fit to the data.The value of the leaching rate kC will likely vary with
precipitation amount and intensity. In most ecosystems,leaching of organic carbon from the forest floor is,10%of aboveground productivity, with little dependence onannual precipitation in the range of 500–2500 mm(Michalzik et al. 2001, Huxman et al. 2004). Respirationlosses will thus be predominant in the long term, and wecan set kC ’ 0 for that precipitation range withoutintroducing substantial error. In contrast, sites with highprecipitation rates (e.g., .2500 mm) are prone tosignificant leaching losses (Cleveland et al. 2006, Golleret al. 2006, Schrumpf et al. 2006, Chang et al. 2007).This fact in turn increases their critical carbon : nutrientratios (Eq. 4). Using data of litter mass loss and leachingunder tropical humid conditions (Rees et al. 2006,Chang et al. 2007) we estimate that kC ’ 0.5 whenannual rainfall is about 4000 mm/yr. These consider-ations suggest that leaching is (as expected) a highlynonlinear process, approximately negligible below acertain threshold of rainfall intensity but increasinglyimportant above it. (A similar threshold-like nonlinear-ity is found in the commonly used term ‘‘field capacity,’’which is used in hydrology as a good approximation tomodel percolation of water from the soil layer.) Thus, asa first approximation, we account for this increase bylinearly interpolating kC between zero at 2500 mm/yr ofrainfall to 0.5 at 4000 mm/yr. This approximationaffected three data sets from humid tropical conditions(Chuyong et al. 2002, Hirobe et al. 2004, Xu 2006),resulting in values of kC between 0.06 and 0.45. UnlikekC, the parameter kE does not affect nutrient evolutioncurves because losses of organic nutrients are compen-sated by decomposer immobilization through the fluxME (Eq. 1).We estimated aE by comparing observed and modeled
dynamics toward the end of the decomposition process.
FIG. 2. Trajectories of litter decomposition in the n–p space(where n and p are the fractions of remaining N and P,respectively) for different litter types and decomposer carbonuse efficiency e. (Solid black lines are characterized by lowerefficiency than gray lines.) Each trajectory starts at n¼ 1, p¼ 1and evolves in time in the direction indicated by the arrows.Solid lines illustrate the evolution of a phosphorus-rich,nitrogen-poor residue; dashed lines refer to a nitrogen-rich,phosphorus-poor residue; the dotted–dashed trajectory alongthe diagonal refers to a litter poor in both nitrogen andphosphorus. Decomposer composition is kept constant in eachlitter type [(C/N )B ¼ 10, (C/P)B ¼ 50], so that the critical C/Eratios are altered by varying only the carbon-use efficiency e.
STEFANO MANZONI ET AL.94 Ecological MonographsVol. 80, No. 1

In fact, aE is analytically related to the asymptotic values(subscript L,‘) of the carbon : nutrient ratios, (C/E)L,‘¼(C/E)Bb
!1E , which can be found from Eq. 9 in the limit of
c tending to zero, by the following relationship:
aE ¼ kC þ ð1! kCÞ 1þ eðC=EÞL;‘ðC=EÞB
! 1
% &! ": ð11Þ
All the fine-litter data seem to converge towards the
same asymptotic C/E ratio values, with (C/N )L,‘ ’ 20
and (C/P)L,‘ ’ 350 (Fig. 4). Assuming, as a first orderapproximation, kC ’ 0, (C/N )B ’ 10, (C/P)B ’ 50, and
e’ 0.25 (Hyvonen et al. 2000), we find aN ’ 1.25 and aP’ 2.5, indicating a marked preferential decomposition
of phosphorus-rich compounds (when kC . 0, slightly
smaller values for aE are found). Similar values of aE canalso be found for wood, where higher asymptotic C/E
ratios (Fig. 4) and lower decomposer carbon-use
efficiency (as estimated by Manzoni et al. 2008a) balanceeach other. The value of aN is close to one, suggesting
that no preferential decomposition of nitrogen-richsubstrates occurs. This result is also in agreement with
the assumption aN ¼ 1 used to model litter nitrogen
dynamics by Manzoni et al. (2008a).
Data analysis
We first grouped the selected data sets according tothe climatic region where they were decomposed (Table1) and then converted them to the normalized variables c¼ CL(t)/CL(0), n ¼ NL(t)/NL(0), and p ¼ PL(t)/PL(0). Apreliminary inspection of the data revealed that, ingeneral, relevant mass or nutrient losses in the earlydecomposition phase did not occur, but the initialcondition evolved approximately continuously along thedecay trajectory. Some data sets showed an initial sharpdecrease of nutrient content (phosphorus in particular)with respect to the initial concentration. Where it didoccur, we accounted for this loss by modifying the initialcondition of the litter, as suggested by Aber and Melillo(1980) and Berg and Staaf (1987). When the firstobserved n and p values were lower than the threshold0.9 and lay below the 1:1 line in the n–c or p–c plots(meaning that nutrient losses occurred faster thancarbon losses), we set C/E at that first point as a newinitial condition, approximating a rapid leaching eventthat decreases the initial nutrient content. Six decom-position series from tropical sites showed a leachingphase that lasted until about 50% of the mass was lost,and these were not considered in this analysis. We also
TABLE 2. Observed carbon : nutrient ratios (on a mass basis) of decomposer biomass growing in the field on different substrates.
Substrate type# Climatic regions
Decomposer Substrate
ReferenceC:N C:P C:N C:P
Wood TM 263.! ;590 Cromack et al. (1975)Wood TM 14.6! 54.! ;570 ;5125 Edmonds and Lebo (1998)Wood TM 8.2 117.2 Hart (1999)Wood TM 22.4! Hobbie et al. (2001)Litter TR "26.8!, 14.1" "224!–102" 18.2 285 Stark (1972)Litter TR "12.8!, 19" "197!, 199" 19.7 837 Stark (1972)Litter TR "21.3!, 29.2" "121!, 276" 21.8 385 Stark (1972)Litter TM "6.3§, 10.7!, 23.9" "81§, 100!, 242" 54.6 100 Stark (1972)Litter BR 13.5 71.4 150 Baath and Soderstrom (1979)Litter BR 13.7 28.3 Wagener and Schimel (1998)Litter BR 9.8 ;35 Schimel et al. (1999)Litter BR 11.6 41 Ross et al. (1999)Litter BR 13.5 48 Ross et al. (1999)Litter BR 13.6 40 Ross et al. (1999)Litter BR 24.8 75 Ross et al. (1999)Litter TM 9.2! Hobbie et al. (2001)Litter} TM 10.1 24.3 33.6 734.2 van Meeteren et al. (2008)Litter BR 5.5 27.2 Hannam et al. (2007)Litter BR 5.8 30.7 Hannam et al. (2007)Litter þ O layer BR 7.1 27.6 Vance and Chapin (2001)Litter þ O layer BR 8.3 28.2 Vance and Chapin (2001)Litter þ O layer BR 6.4 25.5 Vance and Chapin (2001)Litter þ O layer BR 12.4 51.4 Vance and Chapin (2001)O layer TM "73.5!, 297" ;300 Cromack et al. (1975)O layer TM "116!, 333" ;440 Cromack et al. (1975)O layer BR 10.7 22.1 Wagener and Schimel (1998)Soil organic matter# BR, TM, TR 7.37 23.0 12.3 72.0 Cleveland and Liptzin (2007)
Notes: Reported values are time and treatment averages for each substrate type, in each site. Climatic regions: BR, polar,subpolar, and boreal; TM, temperate; and TR, tropical and subtropical.
! Fungal sporocarps only; 50% carbon concentration is assumed." Fungal rhizomorphs only; 50% carbon concentration is assumed.§ Slime mold only; 50% carbon concentration is assumed.}Data from the first sampling date (two months after litterbag placement), characterized by an isolated peak in carbon : nutrient
ratios, were excluded.# Carbon : nutrient ratios are averaged across all sites reported by Cleveland and Liptzin (2007).
February 2010 95STOICHIOMETRY OF LITTER DECOMPOSITION
excluded a decomposition series where immobilizationof nitrogen occurred regardless of the very high initialnitrogen concentration (alder leaves in Berg andMcClaugherty 1989).After accounting for the initial loss, the selected data
sets were used to obtain the free parameters e and(C/P)B in Eq. 6 through numerical nonlinear regres-sions. The nonlinear regression was performed in twosteps. Following Manzoni et al. (2008a), we obtained thecarbon-use efficiency using the n(c) curve, where all theother parameters are fixed. As a second step, we used theobtained e and found (C/P)B from the p(c) curve.Finally, the generalized critical carbon : nutrient ratiosfor the different litter types and climatic conditions werecomputed from Eq. 4.
RESULTS
General patterns of nutrient immobilization and release
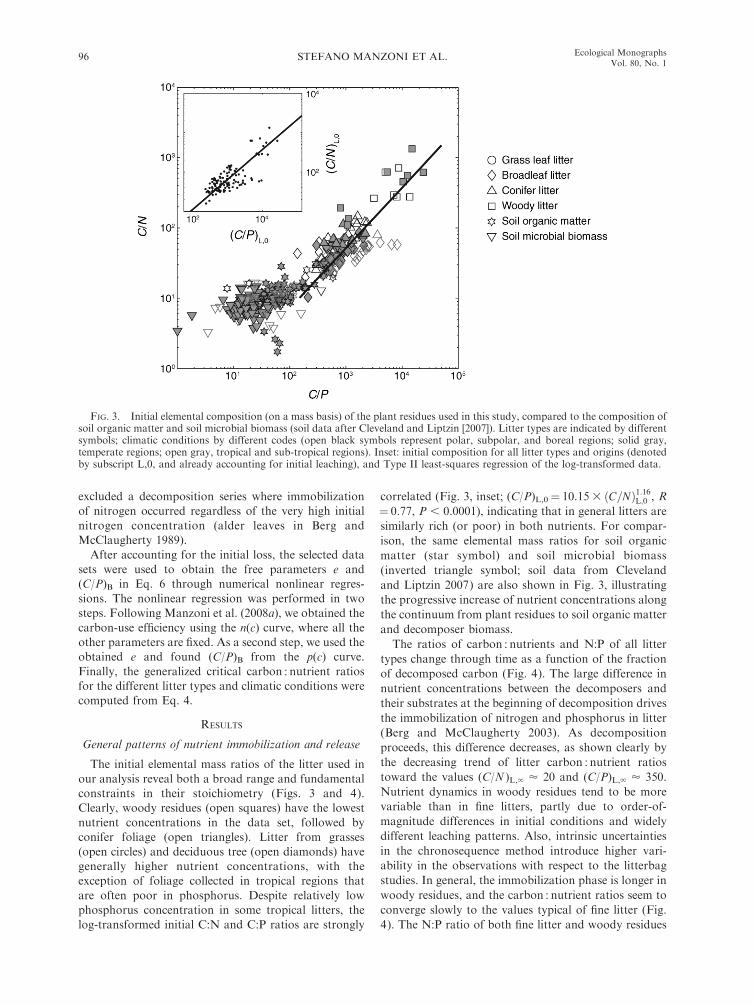
The initial elemental mass ratios of the litter used inour analysis reveal both a broad range and fundamentalconstraints in their stoichiometry (Figs. 3 and 4).Clearly, woody residues (open squares) have the lowestnutrient concentrations in the data set, followed byconifer foliage (open triangles). Litter from grasses(open circles) and deciduous tree (open diamonds) havegenerally higher nutrient concentrations, with theexception of foliage collected in tropical regions thatare often poor in phosphorus. Despite relatively lowphosphorus concentration in some tropical litters, thelog-transformed initial C:N and C:P ratios are strongly
correlated (Fig. 3, inset; (C/P)L,0¼ 10.153 ðC=NÞ1:16L;0 , R¼ 0.77, P , 0.0001), indicating that in general litters aresimilarly rich (or poor) in both nutrients. For compar-ison, the same elemental mass ratios for soil organicmatter (star symbol) and soil microbial biomass(inverted triangle symbol; soil data from Clevelandand Liptzin 2007) are also shown in Fig. 3, illustratingthe progressive increase of nutrient concentrations alongthe continuum from plant residues to soil organic matterand decomposer biomass.The ratios of carbon : nutrients and N:P of all litter
types change through time as a function of the fractionof decomposed carbon (Fig. 4). The large difference innutrient concentrations between the decomposers andtheir substrates at the beginning of decomposition drivesthe immobilization of nitrogen and phosphorus in litter(Berg and McClaugherty 2003). As decompositionproceeds, this difference decreases, as shown clearly bythe decreasing trend of litter carbon : nutrient ratiostoward the values (C/N )L,‘ ’ 20 and (C/P)L,‘ ’ 350.Nutrient dynamics in woody residues tend to be morevariable than in fine litters, partly due to order-of-magnitude differences in initial conditions and widelydifferent leaching patterns. Also, intrinsic uncertaintiesin the chronosequence method introduce higher vari-ability in the observations with respect to the litterbagstudies. In general, the immobilization phase is longer inwoody residues, and the carbon : nutrient ratios seem toconverge slowly to the values typical of fine litter (Fig.4). The N:P ratio of both fine litter and woody residues
FIG. 3. Initial elemental composition (on a mass basis) of the plant residues used in this study, compared to the composition ofsoil organic matter and soil microbial biomass (soil data after Cleveland and Liptzin [2007]). Litter types are indicated by differentsymbols; climatic conditions by different codes (open black symbols represent polar, subpolar, and boreal regions; solid gray,temperate regions; open gray, tropical and sub-tropical regions). Inset: initial composition for all litter types and origins (denotedby subscript L,0, and already accounting for initial leaching), and Type II least-squares regression of the log-transformed data.
STEFANO MANZONI ET AL.96 Ecological MonographsVol. 80, No. 1

converges to a value of ;20, as observed previously inlong-term decomposition studies (Laiho and Prescott2004, Moore et al. 2008).As described by our model (Fig. 2), the patterns of
nitrogen and phosphorus immobilization and mineral-ization of individual litter species change dramatically asa function of litter initial conditions and decomposercharacteristics. Four regimes in the n–p plane can becharacterized, each with a different combination ofinitial carbon : nutrient ratios. Fig. 5 shows an exampleof model fitting to the decomposition data for each
regime (see Methods: Data analysis for details), illus-trating how changes in carbon-use efficiency anddecomposer C:P ratio control the shape of the nutrientrelease curves. In the tropical data set of Thompson andVitousek (1997), nitrogen is immobilized from thebeginning of decomposition (when n and p are still closeto one), while phosphorus is released (Fig. 5A). In thiscase, (C/N )CR/(C/N )L,0 , 1 and (C/P)CR/(C/P)L,0 . 1.Fig. 5B, carbon shows two more tropical decompositiondata sets, from Chuyong et al. (2002) and Isaac and Nair(2005); the former shows net release of both nutrients
FIG. 4. C:N (top panels), C:P (middle panels), and N:P (bottom panels) ratios for all data (grass and broadleaf tree litter in theleft panels [A, C, E]; conifer and woody litter in the right panels [B, D, F]) as a function of the fraction of decomposed carbon, 1!CL(t)/CL,0. The data sets are described in more detail in Table 1; all ratios are expressed on a mass basis.
February 2010 97STOICHIOMETRY OF LITTER DECOMPOSITION

(Fig. 5B) while the latter shows immobilization ofboth initially (Fig. 5C), indicating that the criticalcarbon : nutrient ratios were lower than the correspond-ing initial C/E ratios. Fig. 5D illustrates the case ofphosphorus immobilization and nitrogen release, whichoccurs in some litters that are relatively poor inphosphorus and rich in nitrogen (Li et al. 2007).
Decomposer stoichiometric parameters
Based on a theoretical framework, our analyticalmodel captures the different stoichiometric trajectoriesof decomposition shown in Fig. 5 quite well. A similarclose fit is achieved with the global data set where theonly free parameter e, the carbon-use efficiency, explainsmost of the variance in the nitrogen evolution curves (R2
¼ 0.96, P , 0.0001; Fig. 6A) while the combination of eand (C/P)B is sufficient to describe the correspondingphosphorus dynamics (R2 ¼ 0.90, P , 0.0001; Fig. 6B).Variability in the carbon-use efficiency e is largely
explained by the initial litter C:N ratio (Fig. 7A; e¼ 6.253 ðC=NÞ!0:77
L;0 , R2 ¼ 0.65, P , 0.0001), resulting in astrong power law dependence of the critical C:N ratio onthe initial C:N ratio (Fig. 7C; (C/N )CR ¼ 2.33 3ðC=NÞ0:75L;0 , R2 ¼ 0.64, P , 0.0001). We also assessed
the effects of another index of litter quality, the acidunhydrolyzable fraction (so called ‘‘lignin’’), on theestimated carbon-use efficiencies. The parameter e is notcorrelated with the initial concentration of acid unhy-drolyzable fraction (R¼!0.06, P . 0.1), allowing us tofocus on the stoichiometric controls, and neglect the roleof chemical recalcitrance.Most of the variability in the phosphorus evolution
during decomposition is also captured by changes in e,with a residual effect of (C/P)B (Fig. 7B; (C/P)B¼ 14.33ðC=PÞ0:26L;0 , R
2 ¼ 0.24, P , 0.0001). As in Fig. 7C, thecombined effects of e and (C/P)B leads to a strong powerlaw dependence of the critical C:P ratio on the initialC:P ratio (Fig. 7D; (C/P)CR ¼ 2.27 3 ðC=PÞ0:84L;0 , R
2 ¼0.83, P , 0.0001). When the parameter (C/N )B isallowed to vary with initial litter C:N ratio, we still find asignificant negative correlation between carbon useefficiency and initial litter C:N ratio (Fig. 7A, dashedline; e ¼ 2.58 3 ðC=NÞ!0:55
L;0 , R2 ¼ 0.49, P , 0.0001),although the slope of the relationship is smaller. Thesedifferences are mirrored by the relationship between theestimated (C/P)B and (C/P)L,0, which becomes steeper(Fig. 7B, dashed line; (C/P)B ¼ 5.40 3 ðC=PÞ0:40L;0 , R
2 ¼0.52, P , 0.0001).
FIG. 5. Sample trajectories of litter decomposition in the n–p space, for different critical carbon : nutrient ratios and litter types(time evolves in the direction of the arrows). The four possible combinations of (C/E)CR and (C/E)L,0 result in different initialnutrient immobilization or mineralization (see also Fig. 7). Data sources: (A) Thompson and Vitousek (1997); (B) Chuyong et al.(2002); (C) Isaac and Nair (2005); and (D) Li et al. (2007). Solid thick lines are model results (Eq. 6).
STEFANO MANZONI ET AL.98 Ecological MonographsVol. 80, No. 1

As a result of the relationships between critical andinitial ratios, the patterns of initial nutrient mineraliza-tion or immobilization depend not only on litter typeand composition, but are also mediated by decomposercharacteristics. To illustrate these effects we normalizethe critical C/E ratios with respect to the litter initial C/Eratios, and plot them in a (C/N )CR/(C/N )L,0–(C/P)CR/(C/P)L,0 plane (Fig. 8). Although the variabilityof the data points is large, (C/N )CR/(C/N )L,0 and(C/P)CR/(C/P)L,0 are significantly and positively corre-lated (R¼ 0.63, P , 0.0001). Values .1.0 on either axisindicate that (C/E)CR is higher than (C/E)L,0, corre-sponding to a net release of the nutrient E from thebeginning of decomposition. The correlation of initiallitter C:N and C:P ratios (Fig. 3), with high nutrientlitters characterized by low C:N and C:P ratios, andnutrient-poor litters characterized by higher ratios,allows us to further generalize and explore the patternsof mineralization and immobilization based on theinitial nutrient concentrations. To do this, the regres-sions in Fig. 7C, D for the critical C/E ratios arecombined with that of Fig. 3 relating the initialconditions. The result is a parametric relationship inthe (C/N )CR/(C/N )L,0–(C/P)CR/(C/P)L,0 plane (solidblack line in Fig. 8):
ðC=PÞCRðC=PÞL;0
¼ 0:87ðC=NÞCRðC=NÞL;0
" #0:77
ð12Þ
which describes the tendency of plant residues where theinitial C:N and C:P ratios are related (Fig. 3, inset) tomineralize either nitrogen or phosphorus at the begin-ning of decomposition.
DISCUSSION
Variability of the decomposer carbon-use efficiency
As demonstrated by Figs. 2 and 5, the most importantfactors controlling the shape of the nutrient releasecurves are the initial and critical carbon : nutrient ratios.The critical ratio has been interpreted mathematically asa function of decomposer biochemical characteristics(Bosatta and Staaf 1982, Agren and Bosatta 1996,Manzoni and Porporato 2007). Here we extended theprevious models of (C/E)CR, including the role ofphysical losses of organic matter from the litter andthe possible preferential decomposition of nutrient-richcompounds. These physical and chemical factors areaccounted for in the parameters kC and aE, respectively(Eq. 4). The last two parameters can be assumed to benegligible or relatively constant (with the exception ofhigh kC in humid conditions; see Methods: Estimation ofmodel parameters) so that the variability in the criticalratios across litter types can be mostly attributed to theefficiency e and the decomposer elemental composition(Fig. 7A, B).Some modeling analyses have assumed that the
carbon-use efficiency is constant, while (C/N )B variesacross litter types (Hyvonen et al. 2000, Nicolardot et al.
2001). The (C/N )B values necessary to describe theobserved nutrient mineralization patterns assumingconstant carbon-use efficiency would range betweenabout two to nearly 100 (in nutrient-rich and nutrient-poor residues, respectively). Such a range seemsunrealistically wide, since observed changes in microbialC:N ratio are well-constrained across a variety of soilorganic matter substrates (Fig. 1; Cleveland and Liptzin2007), and small long-term responses have beenobserved after amending soils with different organicmaterials (Bremer and Vankessel 1992, Mueller et al.1998). Data on litter microbial C:N ratios in naturalconditions are sparser than in mineral soils, althoughthey consistently fall in the range of 8–15 (Table 2), evenin low nitrogen partly decomposed wood ((C/N )B¼ 8.2;Hart 1999). The whole decomposer community, encom-passing both microbial and faunal groups with (C/N )B’ 4–10 (Hunt et al. 1987), is expected to have an overallC:N ratio smaller than a fungal-dominated community((C/N )B ’ 15), and the assumption of a constant value(C/N )B ¼ 10 seems to be reasonable for the presentlarge-scale analysis. The results obtained when relaxingthis assumption and allowing (C/N )B to increase with
FIG. 6. Scatter plot of modeled vs. observed (A) carbon : ni-trogen and (B) carbon : phosphorus ratios.
February 2010 99STOICHIOMETRY OF LITTER DECOMPOSITION

(C/N )L,0 (based on the limited data reported in Table 2)are similar.Accordingly, we attribute most of the variability in
(C/N )CR to changes in the decomposer carbon-useefficiency e (Fig. 7A), on the basis that more efficientcarbon use occurs when nutrients in organic forms aremore available, while (C/N )B is relatively constant(Manzoni et al. 2008a). This is in agreement withmodeling studies showing a positive correlation betweenlitter decomposer efficiency and nitrogen content ofhumus underlying the litter layer (d’Annunzio et al.2008), and with decreases in efficiency observed inconsumers in terrestrial and aquatic environments whensubstrate nutrient concentration is low (Mattson 1980,Pandian and Marian 1986, del Giorgio and Cole 1998,Elser et al. 2000). From a physiological perspective,decreased efficiency might be related to regulation ofcatabolic reactions (Russell and Cook 1995), orincreased energy use for nutrient mining through
increased exoenzyme production (Craine et al. 2007,Sinsabaugh et al. 2008). Additional energetic costs mayalso result from asymbiotic nitrogen fixation (Vitousekand Howarth 1991, Vitousek and Hobbie 2000), whichcontributes up to 10% of the total nitrogen immobilizedin decomposing residues (Thompson and Vitousek1997). Nitrogen fixation tends to be higher in easilydecomposable litter with low N:P ratio, where thenitrogen demand is higher (Vitousek and Hobbie 2000,Reed et al. 2007), consistent with the increasingrespiration costs shown in Fig. 7A.The fact that the decomposer carbon-use efficiency
increases with the initial organic nitrogen concentrationof the litter is also connected to the effects of inorganicnutrient availability on decomposer metabolism. Whenlitters have low initial C:N ratios, net mineralizationprevails and the inorganic nitrogen pool increases; incontrast, available inorganic nitrogen in nitrogen-poorlitters is likely very low because of strong immobiliza-
FIG. 7. (A) Decomposer carbon-use efficiency e and (C) critical C:N ratio as a function of initial litter C:N, as well as (B)decomposer C:P ratio and (D) critical C:P ratios as a function of initial litter C:P for different litter types and climatic regions(symbols and codes as in Fig. 3). Initial litter C/E already accounts for the initial leaching phase. Solid lines are linear least-squaresregressions of the log-transformed data when (C/N )B¼ 10; dashed lines refer to the case (C/N )B¼ 4.333 ðC=NÞ0:22L;0 (correspondingdata points are not shown).
STEFANO MANZONI ET AL.100 Ecological MonographsVol. 80, No. 1

tion. Hence, there is a positive correlation betweenorganic nitrogen in decomposing litter and inorganicnitrogen availability in the litterbags and their sur-roundings. In principle, both organic nitrogen andinorganic nitrogen could affect the carbon-use efficiencyin a similar way (i.e., by decreasing the efficiency whennutrient availability is low). The small or negative effectsof nitrogen fertilization on respiration rates that havebeen observed (e.g., Fog 1988, Hobbie and Vitousek2000, Craine et al. 2007) could be explained bydecreased carbon-use efficiency when inorganic nitrogenis limiting, as also suggested by a theoretical study(Agren et al. 2001). Moreover, limited inorganicnitrogen due to CO2 enrichments has been shown toenhance carbon losses due to altered microbial activity(Gill et al. 2006). These pieces of evidence indirectlysupport our hypothesis of reduced efficiency withincreased initial litter C:N ratio.The quality of litter carbon could also affect the
decomposer carbon-use efficiency. The investment inenzyme production increases with the complexity of thesubstrates, ranging from simple soluble compounds tothe more recalcitrant compounds such as cellulose,hemicellulose, tannins, waxes, and lignin (Berg andMcClaugherty 2003). Consistently with the largercarbon costs to degrade complex substrates, theoreticalstudies generally assume that e decreases with the degreeof recalcitrance (Agren and Bosatta 1996, Moorheadand Sinsabaugh 2006). Hence, during decomposition,changes in litter chemical composition may become animportant driver for e. However, we did not find anysignificant relationship between the estimated long-terme and the initial concentration of acid unhydrolyzablefraction in litters from our database, suggesting that thestoichiometric constraints may be stronger than the litterchemical features in the long term and at the larger scalewe investigated.
Variability of the decomposer C:P ratio
After obtaining the carbon-use efficiency from thenitrogen release curves, we used the phosphorus releasecurves to estimate the parameter (C/P)B (Fig. 7B). Theeffects of organic phosphorus availability on decompos-er composition and activity have been rarely studied. Wefound values in the 20–100 range for most ecosystems,with increasingly higher values in phosphorus-poorresidues (in particular in some tropical litters and woodresidues, Fig. 7B). A similar pattern arises regardless ofthe assumed dependency of (C/N )B and (C/N )L,0,although (C/P)B increases faster with (C/P)L,0 whenpart of the variability in the critical C:N ratio isattributed to changes in (C/N )B (dashed line in Fig.7B). Although the estimated values are, on average,higher than the ones observed in mineral soils (Fig. 3,Table 2), they are generally not unrealistic, given thehigh variability of this parameter in natural conditions,and the high C:P ratios observed in litter and wooddecomposing fungi, in particular in the tropics (Stark
1972, Cromack et al. 1975). Only few litter types from atropical humid site (Hirobe et al. 2004) and wooddecomposition data sets resulted in unrealistically high(C/P)B (Fig. 7B). Such values are likely not indicative ofreal decomposer composition but rather a result of thefact that in these ecosystems phosphorus release isextremely fast, even if the initial concentration is low,thus giving rise to very high values of the critical C:Pratio (Fig. 7D). In fact, our method attributes all thevariability in the phosphorus release curves to e and(C/P)B, while it is also possible that some of thevariability could be explained by higher values of aP orkC in particular sites or litter types.
Moreover, site effects other than precipitation (e.g.,soil nutrient availability and microclimatic conditions)may affect the patterns of nutrient release and accumu-lation and hence the critical ratios. As shown byreciprocal litterbag experiments, sites with highernutrient availability tend to have larger nutrientaccumulation in a given litter type (Thompson andVitousek 1997, Hobbie and Vitousek 2000, Moore et al.2006), resulting in lower critical carbon : nutrient ratio.In turn this would suggest higher carbon-use efficiencyin nutrient-rich sites, consistent with theoretical studies(Agren et al. 2001).
FIG. 8. Patterns of initial nutrient mineralization (MIN) orimmobilization (IMM) as a function of litter type and climaticregion (symbols and codes as in Fig. 3). Each point in the plotrepresents a litter data set in terms of its critical and initialcarbon : nutrient ratios. When the critical carbon : nutrient ratiois larger than the initial carbon : nutrient ratio [i.e.,(C/N )CR/(C/N )L,0 . 1 or (C/P)CR/(C/P)L,0 . 1], net mineral-ization occurs; otherwise net immobilization is needed. Thepoints corresponding to the four combinations of initialmineralization and immobilization shown in Fig. 5 areindicated by stars. The solid black line represents themineralization conditions for litters where the initial C:N andC:P ratios are perfectly correlated (Fig. 3), and the criticalratios are given by the regressions in Fig. 7 (Eq. 12).
February 2010 101STOICHIOMETRY OF LITTER DECOMPOSITION

Stoichiometric and climatic controlsof the critical C/E ratios
As already noted in the case of nitrogen (Manzoni etal. 2008a), the estimated critical ratios (Eq. 4) of bothnitrogen and phosphorus correlate well with the initialcarbon : nutrient ratios in each litter type and in everyclimatic region (Fig. 7C, D). The values of (C/E)CR thathad been estimated in previous works from decompo-sition data are in agreement with our results for bothtropical (Seneviratne 2000) and mid to high latitude datasets (Berg and McClaugherty 1989, Moore et al. 2006).No significant correlation between the critical C/E ratiosand climatic region appears in mid to high latitudes, sothat most of the variability can be attributed to theinitial ratios (C/N )L,0 and (C/P)L,0 in those regions.Tropical sites with high rainfall have critical ratios thatare generally higher for a given initial condition (Fig.7C, D). Our results suggest that the compound effects ofincreased decomposer respiration, high decomposer C:Pratio, and physical losses (in particular leaching oforganic matter under high rainfall regimes) may lead tothese high critical ratios, which imply a tendency torelease of nitrogen and phosphorus even from verynutrient-poor residues.The fact that (C/E)CR are not constant but increase
with initial C/E ratio implies that residues with lowinitial nutrient concentration may have a relatively shortimmobilization phase. For instance, woody residuesinitially immobilize both nitrogen and phosphorus(lower left quadrant in Fig. 8), although quite surpris-ingly they also start releasing these nutrients at high C/Eratios (Hart 1999, Krankina et al. 1999). According toour results, this is possible because of the consistentlylow carbon-use efficiency of wood decomposers. Mostconifer litters also tend to immobilize both nutrients inthe first stages of decomposition, although a few showedinitial net release. Deciduous tree and grass foliageshowed different behaviors depending on their chemicalcharacteristics and climatic conditions. Only a fewdeciduous species and grasses are able to release bothnitrogen and phosphorus throughout decompositionbecause of their low initial C:N and C:P ratios orparticularly high critical ratios (upper right quadrant inFig. 8). In boreal and temperate climates, nitrogen tendsto be immobilized (left quadrants), while it is generallyreleased in tropical areas (right quadrants). Similarly,phosphorus is typically immobilized in boreal andtemperate regions, while it may be immobilized orreleased in the tropical ones, depending on the initialcondition.Most residues are either relatively poor in nitrogen
and phosphorus, or they are relatively rich in bothnutrients. Nutrient-poor litters (regime A; lower leftquadrant in Fig. 8) immobilize both nitrogen andphosphorus, while nutrient-rich litters (regime D; upperright quadrant in Fig. 8) release the two nutrients. Thispattern mirrors the strong correlation between initialC:N and C:P ratios (Fig. 3), and results in rare co-
occurrence of phosphorus mineralization and nitrogenimmobilization, or nitrogen mineralization and phos-phorus immobilization (Eq. 12). Remarkably, the fewtropical plant residues with particularly high initial N:Pratio, which might be expected to release nitrogen andimmobilize phosphorus, tend to behave similarly tolitters richer in phosphorus. As a consequence, the N:Pratio alone in these cases does not predict which of thetwo nutrients is released first. This result can beexplained by the combination of low carbon-useefficiency, unusually high (C/P)B, and possibly signifi-cant leaching losses, which lead to high enough values of(C/P)CR to allow phosphorus release even from residueswith a very high N:P ratio.
Evaluation of model assumptions
The mass balance equations that describe carbon andnutrient dynamics in the litter (Eqs. 2, 3) account forbiological processes in a simplified but realistic way. Theassimilation of nitrogen and phosphorus from bothorganic (plant residues) and inorganic sources isdescribed in the model through the net mineralizationfluxes (Eq. 1). The net fluxes are sufficient to compute themass balances of the litter nutrient pools, but neglect thephysiological differences in the assimilation pathways ofthese two nutrients. Nitrogen is directly assimilated fromthe organic sources in the form of amino acids, fromwhich ammonium is released through endogenousdeamination (Swift et al. 1979, McGill and Christie1983), while organic phosphorus is first mineralized toorthophosphate ions by extracellular enzymes and thenimmobilized (Sinsabaugh et al. 1993, Plante 2005). Thesephysiological differences may lead to different patternsof gross nutrient mineralization and immobilization,with larger gross fluxes associated with phosphorusassimilation. In turn, large gross immobilization is oftenrelated to strong nutrient limitation, which may inhibitthe decomposition process (Manzoni and Porporato2007, 2009). However, the goal of the model is todescribe the stoichiometric evolution of decomposinglitter regardless of the speed of the process, so thatmodeling the net fluxes exchanged between the decom-poser biomass and the inorganic pools is sufficient. Thisallows us to avoid a detailed description of grossmineralization and immobilization fluxes (Parton et al.1988, Bosatta and Agren 1991, Manzoni et al. 2008a).The mathematical description of leaching losses of
organic carbon and nutrients is also simplified. Weassumed that leaching can be described by a rapid initialloss of organic nitrogen and phosphorus, which isfollowed by prolonged low-intensity losses. Since freshplant residues have a pool of readily soluble materials,leaching will likely be larger early during decomposition,while long-term physical losses may be less significant(Berg and McClaugherty 2003, Cleveland et al. 2006).We estimated that in 43% of the data sets the initialphosphorus loss was larger than the nitrogen loss, whilethe reverse was true in 7% of the analyzed cases. This
STEFANO MANZONI ET AL.102 Ecological MonographsVol. 80, No. 1

result is not surprising, as the initial loss of organicnitrogen is generally lower than the loss of phosphorus,which is particularly important in humid Nordicecosystems (Berg and Staaf 1987, Blair 1988, Berg andCortina 1995, Berg andMcClaugherty 2003) and tropicalecosystems (Hirobe et al. 2004, Isaac and Nair 2005). Wealso assume that leaching may persist during decompo-sition, and we model these nutrient losses as proportionalto the decomposition flux by means of a constant kC(e.g., Currie and Aber 1997). The rationale behind thischoice is that organic substrates are made available bythe activity of the decomposers at a rate D (Fig. 1).Our assumptions that the decomposer biochemical
characteristics, e and (C/E)B, are constant in time maybe justified by the focus on long-term patterns ofmineralization (i.e., monthly and yearly time scales intropical and temperate climates, respectively) acrosswidely different litter types. The parameters e and(C/E)B may be interpreted as time-averaged character-istics representative of the whole decomposer commu-nity and of its response to litter type. This assumption isalso in agreement with long-term experimental observa-tions (Hart et al. 1994, van Meeteren et al. 2008), andprevious modeling studies (Hyvonen et al. 2000).Moreover, although some temporal trends of microbialelemental composition may occur (e.g., Wagener andSchimel [1998] found decreasing microbial C:N ratiofrom the fresh litter to the O horizons in a forest floorchronosequence), the range of C:N ratio variabilityfound is relatively small and does not, in our opinion,justify a more complicated model structure at the level ofresolution of this study.The proposed model also neglects the transport of
organic compounds by mycorrhizal fungi and roots.This pathway of nutrient export from the litter has beenshown to be important in the temporal dynamics ofnitrogen and phosphorus supplies to plants (Trofymowand van den Drieesche 1991); however, it does not seemto be significant from the perspective of litter massbalances and stoichiometry. In fact, the presence of fineroots and mycorrhizae in the litterbag tends only toaccelerate decomposition in some ecosystems, but itdoes not appear to affect the evolution of carbon : nu-trient ratios during the process (Cuevas and Medina1988, Zhu and Ehrenfeld 1996, Chuyong et al. 2002,Luizao et al. 2007).
Modeling nutrient mineralizationin soils and aquatic systems
We developed our model to describe nutrient miner-alization patterns in aboveground plant residues decom-posing in terrestrial ecosystems. Nevertheless, similarbiological and physical processes also control nutrientaccumulation and release from organic matter decom-posing in mineral soils as well as plant residuesdecomposing in aquatic systems. A formally similarsolution to Eq. 8 was derived by Agren and Bosatta(1996) to describe the evolution of homogeneous plant
residues into soil organic matter compounds. Similarly,Eq. 8 can be directly applied to describe organic matterdynamics in soils where the interactions of fresh residuesand more stabilized compounds can be neglected. Whensoil spatial and chemical heterogeneities are importantand nutrients are actively recycled between nutrient-richand poor patches (e.g., in litter-amended soils), miner-alization can still be described rigorously by lumpedmodels as in Eqs. 6 or 8, provided that a suitableparameterization of decomposer stoichiometry is used(Manzoni et al. 2008b). The presence of dissolvedorganic matter leaching from the litter layer and itsinteraction with humic compounds and soil decompos-ers (Michalzik et al. 2001) could also be added in themass balances in Eqs. 2 and 3.
The improved model could also be used to describeplant residue decomposition in wetlands, streams, orestuarine and marine systems. In such systems thepatterns of immobilization and mineralization as afunction of carbon loss qualitatively follow the samepatterns observed in terrestrial systems (Gulis andSuberkropp 2003, Moore et al. 2005, 2008, Davis et al.2006). Similarly to mineral soils, however, in aquaticsystems the flux of dissolved organic matter entering thelitter pool through water flow will sometimes beimportant. Accordingly, the present model could beapplied in aquatic systems only where such externalinputs of organic compounds are not significant.
CONCLUSIONS
Using a simplified mathematical model we haveshown that decomposers are indeed ‘‘integrators of thevarious element cycles’’ (Plante 2005). The dynamics ofcarbon, nitrogen, and phosphorus in plant litterworldwide, mediated by decomposer activity, result inclear patterns of nutrient immobilization and releasethat depend on the chemical characteristics of the litterand the stoichiometric requirements of the decomposers.Our results suggest that the critical C:N and C:P ratios,below which nutrients are released, increase withdecreasing initial litter nitrogen and phosphorus con-centrations. From the theoretical definition of criticalcarbon : nutrient ratios, we suggest that this pattern canbe explained by reduced decomposer carbon-use effi-ciency and, in tropical regions, by increased decomposerC:P ratios and higher leaching rates. These factors allownutrient release from plant residues with low nutrientconcentrations, in particular in tropical regions. As aconsequence, in tropical systems the litter N:P ratioalone may not be a reliable index to predict whichnutrient is released first during decomposition. Specificobservations of microbial carbon : nutrient ratios inlitters from different climatic regions will help to testthese results.
ACKNOWLEDGMENTS
This research was supported in part by the Forest–Atmosphere Carbon Transfer and Storage (FACTS-1), fundedby the U.S. Department of Energy, the U.S. Department of
February 2010 103STOICHIOMETRY OF LITTER DECOMPOSITION

Agriculture, NSF DEB (#0717191), and DOE’s Program inEcosystem Research (#64242-0012346). Funding for theCIDET experiment was provided by Climate Change andEcosystem Processes Network of the Canadian Forest Serviceand Natural Resources Department Panel on Energy ResearchDevelopment. A. Porporato gratefully acknowledges thesupport of the Landolt and Cie visiting Chair ‘‘Innovativestrategies for a sustainable future’’ at the Ecole PolytechniqueFederale de Lausanne (EPFL), Lausanne, Switzerland. We alsothank D. D. Richter and two anonymous reviewers for theiruseful comments.
LITERATURE CITED
Aber, J. D., D. B. Botkin, and J. M. Melillo. 1978. Predictingeffects of different harvesting regimes on forest floordynamics in northern hardwoods. Canadian Journal ofForest Research 8:306–315.
Aber, J. D., and J. M. Melillo. 1980. Litter decomposition:measuring relative contributions of organic-matter andnitrogen to forest soils. Canadian Journal of Botany 58:416–421.
Agren, G. I., and E. Bosatta. 1996. Theoretical ecosystemecology. Understanding element cycles. Cambridge Univer-sity Press, Cambridge, UK.
Agren, G. I., E. Bosatta, and A. H. Magill. 2001. Combiningtheory and experiment to understand effects of inorganicnitrogen on litter decomposition. Oecologia 128:94–98.
Baath, E., and B. Soderstrom. 1979. Fungal biomass and fungalimmobilization of plant nutrients in Swedish coniferousforest soils. Revue d’Ecologie et de Biologie du Sol 16:477–489.
Ball, B. A., M. A. Bradford, and M. D. Hunter. 2009. Nitrogenand phosphorus release from mixed litter layers is lower thanpredicted from single species decay. Ecosystems 12:87–100.
Bender, C. M., and S. A. Orszag. 1987. Advanced mathematicalmethods for scientists and engineers. Third edition. McGraw-Hill, New York, New York, USA.
Berg, B., and J. Cortina. 1995. Nutrient dynamics in somedecomposing leaf and needle litter types in a Pinus sylvestrisforest. Scandinavian Journal of Forest Research 10:1–11.
Berg, B., and C. McClaugherty. 1989. Nitrogen and phospho-rus release from decomposing litter in relation to thedisappearance of lignin. Canadian Journal of Botany 67:1148–1156.
Berg, B., and C. A. McClaugherty. 2003. Plant litter:decomposition. humus formation. carbon sequestration.Springer-Verlag Heidelberg, Berlin, Germany.
Berg, B., and H. Staaf. 1987. Release of nutrients fromdecomposing white birch leaves and Scots pine needle litter.Pedobiologia 30:55–63.
Blair, J. M. 1988. Nitrogen, sulfur and phosphorus dynamics indecomposing deciduous leaf litter in the southern Appala-chians. Soil Biology and Biochemistry 20:693–701.
Bosatta, E., and G. I. Agren. 1991. Theoretical analysis ofcarbon and nutrient interactions in soils under energy-limitedconditions. Soil Science Society of America Journal 55:728–733.
Bosatta, E., and H. Staaf. 1982. The control of nitrogen turn-over in forest litter. Oikos 39:143–151.
Bremer, E., and C. Vankessel. 1992. Seasonal microbialbiomass dynamics after addition of lentil and wheat residues.Soil Science Society of America Journal 56:1141–1146.
Busse, M. D. 1994. Downed bole-wood decomposition inlodgepole pine forests of central Oregon. Soil Science Societyof America Journal 58:221–227.
Chang, S. C., C. P. Wang, C. M. Feng, R. Rees, U. Hell, and E.Matzner. 2007. Soil fluxes of mineral elements and dissolvedorganic matter following manipulation of leaf litter input in aTaiwan Chamaecyparis forest. Forest Ecology and Manage-ment 242:133–141.
Chapin, F. S., P. M. Vitousek, and K. Vancleve. 1986. Thenature of nutrient limitation in plant communities. AmericanNaturalist 127:48–58.
Chuyong, G. B., D. M. Newbery, and N. C. Songwe. 2002.Litter breakdown and mineralization in a central African rainforest dominated by ectomycorrhizal trees. Biogeochemistry61:73–94.
Cleveland, C. C., and D. Liptzin. 2007. C:N:P stoichiometry insoil: Is there a ‘‘Redfield ratio’’ for the microbial biomass?Biogeochemistry 85:235–252.
Cleveland, C. C., S. C. Reed, and A. R. Townsend. 2006.Nutrient regulation of organic matter decomposition in atropical rain forest. Ecology 87:492–503.
Craine, J. M., C. Morrow, and N. Fierer. 2007. Microbialnitrogen limitation increases decomposition. Ecology 88:2105–2113.
Cromack, K., R. L. Todd, and C. D. Monk. 1975. Patterns ofbasidiomycete nutrient accumulation in conifer and decidu-ous forest litter. Soil Biology and Biochemistry 7:265–268.
Cuevas, E., and E. Medina. 1988. Nutrient dynamics withinAmazonian forests. 2. Fine root growth, nutrient availabilityand leaf litter decomposition. Oecologia 76:222–235.
Currie, W. S., and J. D. Aber. 1997. Modeling leaching as adecomposition process in humid Montane forests. Ecology78:1844–1860.
d’Annunzio, R., B. Zeller, M. Nicolas, J. F. Dhote, and L.Saint-Andre. 2008. Decomposition of European beech(Fagus sylvatica) litter: Combining quality theory and N-15labelling experiments. Soil Biology and Biochemistry 40:322–333.
Davis, S. E., D. L. Childers, and G. B. Noe. 2006. Thecontribution of leaching to the rapid release of nutrients andcarbon in the early decay of wetland vegetation. Hydro-biologia 569:87–97.
del Giorgio, P. A., and J. J. Cole. 1998. Bacterial growthefficiency in natural aquatic systems. Annual Review ofEcology and Systematics 29:503–541.
Edmonds, R. L. 1987. Decomposition rates and nutrientdynamics in small-diameter woody litter in four forestecosystems in Washington, USA. Canadian Journal of ForestResearch 17:499–509.
Edmonds, R. L., and D. S. Lebo. 1998. Diversity, production,and nutrient dynamics of fungal sporocarps on logs in an old-growth temperate rain forest, Olympic National Park,Washington. Canadian Journal of Forest Research 28:665–673.
Elser, J. J., W. F. Fagan, R. F. Denno, D. R. Dobberfuhl, A.Folarin, A. Huberty, S. Interlandi, S. S. Kilham, E.McCauley, K. L. Schulz, E. H. Siemann, and R. W. Sterner.2000. Nutritional constraints in terrestrial and freshwaterfood webs. Nature 408:578–580.
Fog, K. 1988. The effect of added nitrogen on the rate ofdecomposition of organic matter. Biological Reviews of theCambridge Philosophical Society 63:433–462.
Foster, J. R., and G. E. Lang. 1982. Decomposition of redspruce and balsam fir boles in the White Mountains of NewHampshire. Canadian Journal of Forest Research 12:617–626.
Gill, R. A., L. J. Anderson, H. W. Polley, H. B. Johnson, andR. B. Jackson. 2006. Potential nitrogen constraints on soilcarbon sequestration under low and elevated atmosphericCO2. Ecology 87:41–52.
Goller, R., W. Wilcke, K. Fleischbein, C. Valarezo, and W.Zech. 2006. Dissolved nitrogen, phosphorus, and sulfurforms in the ecosystem fluxes of a montane forest inEcuador. Biogeochemistry 77:57–89.
Gosz, J. R., G. E. Likens, and F. H. Bormann. 1973. Nutrientrelease from decomposing leaf and branch litter in HubbardBrook Forest, New Hampshire. Ecological Monographs 43:173–191.
STEFANO MANZONI ET AL.104 Ecological MonographsVol. 80, No. 1

Gulis, V., and K. Suberkropp. 2003. Leaf litter decompositionand microbial activity in nutrient-enriched and unalteredreaches of a headwater stream.Freshwater Biology 48:123–134.
Hannam, K. D., S. A. Quideau, and B. E. Kishchuk. 2007. Themicrobial communities of aspen and spruce forest floors areresistant to changes in litter inputs and microclimate. AppliedSoil Ecology 35:635–647.
Hart, S. C. 1999. Nitrogen transformations in fallen tree bolesand mineral soil of an old-growth forest. Ecology 80:1385–1394.
Hart, S. C., G. E. Nason, D. D. Myrold, and D. A. Perry. 1994.Dynamics of gross nitrogen transformations in an old-growth forest: the carbon connection. Ecology 75:880–891.
Hirobe, M., J. Sabang, B. K. Bhatta, and H. Takeda. 2004.Leaf-litter decomposition of 15 tree species in a lowlandtropical rain forest in Sarawak: dynamics of carbon,nutrients, and organic constituents. Journal of ForestResearch 9:347–354.
Hobbie, E. A., N. S. Weber, and J. M. Trappe. 2001.Mycorrhizal vs. saprotrophic status of fungi: the isotopicevidence. New Phytologist 150:601–610.
Hobbie, S. E., and P. M. Vitousek. 2000. Nutrient limitation ofdecomposition in Hawaiian forests. Ecology 81:1867–1877.
Hunt, H. W., D. C. Coleman, E. R. Ingham, R. E. Ingham,E. T. Elliott, J. C. Moore, S. L. Rose, C. P. P. Reid, andC. R. Morley. 1987. The detrital food web in a shortgrassprairie. Biology and Fertility of Soils 3:57–68.
Huxman, T. E., et al. 2004. Convergence across biomes to acommon rain-use efficiency. Nature 429:651–654.
Hyvonen, R., B. A. Olsson, H. Lundkvist, and H. Staaf. 2000.Decomposition and nutrient release from Picea abies (L.)Karst. and Pinus sylvestris L. logging residues. ForestEcology and Management 126:97–112.
Isaac, S. R., and M. A. Nair. 2005. Biodegradation of leaf litterin the warm humid tropics of Kerala, India. Soil Biology andBiochemistry 37:1656–1664.
Jobbagy, E. G., and R. B. Jackson. 2001. The distribution ofsoil nutrients with depth: global patterns and the imprint ofplants. Biogeochemistry 53:51–77.
Krankina, O. N., M. E. Harmon, and A. V. Griazkin. 1999.Nutrient stores and dynamics of woody detritus in a borealforest: modeling potential implications at the stand level.Canadian Journal of Forest Research 29:20–32.
Laiho, R., and C. E. Prescott. 2004. Decay and nutrientdynamics of coarse woody debris in northern coniferousforests: a synthesis. Canadian Journal of Forest Research 34:763–777.
Lambert, R. L., G. E. Lang, and W. A. Reiners. 1980. Loss ofmass and chemical change in decaying boles of a subalpinebalsam fir forest. Ecology 61:1460–1473.
Li, X. F., S. J. Han, and Y. Zhang. 2007. Foliar decompositionin a broadleaf-mixed Korean pine (Pinus koraiensis Sieb. EtZucc) plantation forest: the impact of initial litter quality andthe decomposition of three kinds of organic matter fractionon mass loss and nutrient release rates. Plant and Soil 295:151–167.
Liu, W. Y., J. E. D. Fox, and Z. F. Xu. 2000. Leaf litterdecomposition of canopy trees, bamboo and moss in amontane moist evergreen broad-leaved forest on AilaoMountain, Yunnan, south-west China. Ecological Research15:435–447.
Luizao, R. C. C., F. J. Luizao, and J. Proctor. 2007. Fine rootgrowth and nutrient release in decomposing leaf litter in threecontrasting vegetation types in central Amazonia. PlantEcology 192:225–236.
Manzoni, S., R. B. Jackson, J. A. Trofymow, and A.Porporato. 2008a. The global stoichiometry of litter nitrogenmineralization. Science 321:684–686.
Manzoni, S., and A. Porporato. 2007. Theoretical analysis ofnonlinearities and feedbacks in soil carbon and nitrogencycles. Soil Biology and Biochemistry 39:1542–1556.
Manzoni, S., and A. Porporato. 2009. Soil carbon and nitrogenmineralization: theory and models across scales. Soil Biologyand Biochemistry 41:1355–1379.
Manzoni, S., A. Porporato, and J. P. Schimel. 2008b. Soilheterogeneity in lumped mineralization–immobilization mod-els. Soil Biology and Biochemistry 40:1137–1148.
Mattson, W. J. 1980. Herbivory in relation to plant nitrogencontent. Annual Review of Ecology and Systematics 11:119–161.
McGill, W. B., and E. K. Christie. 1983. Biogeochemicalaspects of nutrient cycle interactions in soils and organisms.Pages 271–301 in B. Bolin and R. B. Cook, editors. Themajor biogeochemical cycles and their interactions. JohnWiley and Sons, Oxford, UK.
McGroddy, M. E., T. Daufresne, and L. O. Hedin. 2004.Scaling of C:N:P stoichiometry in forests ecosystemsworldwide: implications of terrestrial Redfield-type ratios.Ecology 85:2390–2401.
Means, J. E., P. C. Macmillan, and K. Cromack. 1992. Biomassand nutrient content of Douglas-fir logs and other detritalpools in an old-growth forest, Oregon, USA. CanadianJournal of Forest Research 22:1536–1546.
Michalzik, B., K. Kalbitz, J. H. Park, S. Solinger, and E.Matzner. 2001. Fluxes and concentrations of dissolvedorganic carbon and nitrogen—a synthesis for temperateforests. Biogeochemistry 52:173–205.
Michalzik, B., E. Tipping, J. Mulder, J. F. G. Lancho, E.Matzner, C. L. Bryant, N. Clarke, S. Lofts, and M. A. V.Esteban. 2003. Modelling the production and transport ofdissolved organic carbon in forest soils. Biogeochemistry 66:241–264.
Moore, T. R., J. A. Trofymow, C. E. Prescott, J. Fyles, andB. D. Titus. 2006. Patterns of carbon, nitrogen andphosphorus dynamics in decomposing foliar litter in Cana-dian forests. Ecosystems 9:46–62.
Moore, T. R., J. A. Trofymow, M. Siltanen, and L. M. Kozak.2008. Litter decomposition and nitrogen and phosphorusdynamics in peatlands and uplands over 12 years in centralCanada. Oecologia 157:317–325.
Moore, T. R., J. A. Trofymow, M. Siltanen, and C. Prescott.2005. Patterns of decomposition and carbon, nitrogen, andphosphorus dynamics of litter in upland forest and peatlandsites in central Canada. Canadian Journal of Forest Research35:133–142.
Moorhead, D. L., and R. L. Sinsabaugh. 2006. A theoreticalmodel of litter decay and microbial interaction. EcologicalMonographs 76:151–174.
Mueller, T., L. S. Jensen, N. E. Nielsen, and J. Magid. 1998.Turnover of carbon and nitrogen in a sandy loam soilfollowing incorporation of chopped maize plants, barleystraw and blue grass in the field. Soil Biology andBiochemistry 30:561–571.
Nicolardot, B., S. Recous, and B. Mary. 2001. Simulation of Cand N mineralisation during crop residue decomposition: asimple dynamic model based on the C:N ratio of the residues.Plant and Soil 228:83–103.
Osono, T., and H. Takeda. 2004. Accumulation and release ofnitrogen and phosphorus in relation to lignin decompositionin leaf litter of 14 tree species. Ecological Research 19:593–602.
Osono, T., and H. Takeda. 2005. Decomposition of organicchemical components in relation to nitrogen dynamics in leaflitter of 14 tree species in a cool temperate forest. EcologicalResearch 20:41–49.
Pandian, T. J., and M. P. Marian. 1986. An indirect procedurefor the estimation of assimilation efficiency of aquatic insects.Freshwater Biology 16:93–98.
Parton, W., W. L. Silver, I. C. Burke, L. Grassens, M. E.Harmon, W. S. Currie, J. Y. King, E. C. Adair, L. A. Brandt,S. C. Hart, and B. Fasth. 2007. Global-scale similarities in
February 2010 105STOICHIOMETRY OF LITTER DECOMPOSITION

nitrogen release patterns during long-term decomposition.Science 315:361–364.
Parton, W. J., J. W. B. Stewart, and C. V. Cole. 1988.Dynamics of C, N, P and S in grassland soils: a model.Biogeochemistry 5:109–131.
Plante, A. F. 2005. Soil biogeochemical cycling of inorganicnutrients and metals. Pages 389–432 in E. A. Paul, editor.Soil microbiology, ecology and biochemistry. Elsevier, NewYork, New York, USA.
Reed, S. C., C. C. Cleveland, and A. R. Townsend. 2007.Controls over leaf litter and soil nitrogen fixation in twolowland tropical rain forests. Biotropica 39:585–592.
Rees, R., S. C. Chang, C. P. Wang, and E. Matzner. 2006.Release of nutrients and dissolved organic carbon duringdecomposition of Chamaecyparis obtusa var. formosanaleaves in a mountain forest in Taiwan. Journal of PlantNutrition and Soil Science 169:792–798.
Reich, P. B., and J. Oleksyn. 2004. Global patterns of plant leafN and P in relation to temperature and latitude. Proceedingsof the National Academy of Sciences USA 101:11001–11006.
Ross, D. J., F. M. Kelliher, and K. R. Tate. 1999. Microbialprocesses in relation to carbon, nitrogen and temperatureregimes in litter and a sandy mineral soil from a centralSiberian Pinus sylvestris L. forest. Soil Biology and Bio-chemistry 31:757–767.
Russell, J. B., and G. M. Cook. 1995. Energetics of bacterialgrowth: balance of anabolic and catabolic reactions. Micro-biological Reviews 59:48–62.
Schimel, J. P., J. M. Gulledge, J. S. Clein-Curley, J. E.Lindstrom, and J. F. Braddock. 1999. Moisture effects onmicrobial activity and community structure in decomposingbirch litter in the Alaskan taiga. Soil Biology and Biochem-istry 31:831–838.
Schrumpf, M., W. Zech, J. Lehmann, and H. V. C. Lyaruu.2006. TOC, TON, TOS and TOP in rainfall, throughfall,litter percolate and soil solution of a montane rainforestsuccession at Mt. Kilimanjaro, Tanzania. Biogeochemistry78:361–387.
Seneviratne, G. 2000. Litter quality and nitrogen release intropical agriculture: a synthesis. Biology and Fertility of Soils31:60–64.
Sinsabaugh, R. L., R. K. Antibus, A. E. Linkins, C. A.McClaugherty, L. Rayburn, D. Repert, and T. Weiland.1993. Wood decomposition: nitrogen and phosphorusdynamics in relation to extracellular enzyme activity. Ecology74:1586–1593.
Sinsabaugh, R. L., et al. 2008. Stoichiometry of soil enzymeactivity at global scale. Ecology Letters 11:1252–1264.
Sinsabaugh, R. L., and D. L. Moorhead. 1994. Resourceallocation to extracellular enzyme production: a model fornitrogen and phosphorus control of litter decomposition. SoilBiology and Biochemistry 26:1305–1311.
Sollins, P., S. P. Cline, T. Verhoeven, D. Sachs, and G. Spycher.1987. Patterns of log decay in old-growth Douglas-fir forests.Canadian Journal of Forest Research 17:1585–1595.
Stark, N. 1972. Nutrient cycling pathways and litter fungi.Bioscience 22:355–360.
Sterner, R. W., and J. J. Elser. 2002. Ecological stoichiometry.The biology of elements from molecules to the biosphere.Princeton University Press, Princeton, New Jersey, USA.
Swift, M. J., O. W. Heal, and J. M. Anderson. 1979.Decomposition in terrestrial ecosystems. University ofCalifornia Press, Berkeley, California, USA.
Thompson, M. V., and P. M. Vitousek. 1997. Asymbioticnitrogen fixation and litter decomposition on a long soil-agegradient in Hawaiian montane rain forest. Biotropica 29:134–144.
Townsend, A. R., C. C. Cleveland, G. P. Asner, and M. M. C.Bustamante. 2007. Controls over foliar N:P ratios in tropicalrain forests. Ecology 88:107–118.
Tripathi, S. K., and K. P. Singh. 1992. Nutrient immobilizationand release patterns during plant decomposition in a drytropical bamboo savanna, India. Biology and Fertility ofSoils 14:191–199.
Trofymow, J. A., and CIDET Working Group. 1998. TheCanadian Intersite Decomposition Experiment (CIDET).Project and site establishment report. BC-X-378. PacificForestry Centre, Victoria, British Columbia, Canada.
Trofymow, J. A., et al. 2002. Rates of litter decomposition over6 years in Canadian forests: influence of litter quality andclimate. Canadian Journal of Forest Research 32:789–804.
Trofymow, J. A., and R. van den Drieesche. 1991. Mycorrhizas.In R. van den Drieesche, editor. Mineral nutrition of coniferseedlings. CRC Press, Boca Raton, Florida, USA.
Vance, E. D., and F. S. Chapin. 2001. Substrate limitations tomicrobial activity in taiga forest floors. Soil Biology andBiochemistry 33:173–188.
van Meeteren, M. M., A. Tietema, E. E. van Loon, and J. M.Verstraten. 2008. Microbial dynamics and litter decomposi-tion under a changed climate in a Dutch heathland. AppliedSoil Ecology 38:119–127.
Vitousek, P. M. 1984. Litterfall, nutrient cycling, and nutrientlimitation in tropical forests. Ecology 65:285–298.
Vitousek, P. M., and S. Hobbie. 2000. Heterotrophic nitrogenfixation in decomposing litter: patterns and regulation.Ecology 81:2366–2376.
Vitousek, P. M., and R. W. Howarth. 1991. Nitrogen limitationon land and in the sea: How can it occur? Biogeochemistry13:87–115.
Wagener, S. M., and J. P. Schimel. 1998. Stratification of soilecological processes: a study of the birch forest floor in theAlaskan taiga. Oikos 81:63–74.
Waksman, S. A. 1924. Influence of microorganisms upon thecarbon : nitrogen ratio in the soil. Journal of AgriculturalScience 14:555–562.
Xu, X. N. 2006. Nutrient dynamics in decomposing needles ofPinus luchuensis after typhoon disturbance in a subtropicalenvironment. Annals of Forest Science 63:707–713.
Yavitt, J. B., and T. J. Fahey. 1986. Litter decay and leachingfrom the forest floor in Pinus contorta (lodgepole pine)ecosystems. Journal of Ecology 74:525–545.
Zhu, W. X., and J. G. Ehrenfeld. 1996. The effects ofmycorrhizal roots on litter decomposition, soil biota, andnutrients in a spodosolic soil. Plant and Soil 179:109–118.
STEFANO MANZONI ET AL.106 Ecological MonographsVol. 80, No. 1