StockTrak Report
36
FINANCIAL DERIVATIVES STOCKTRAK REPORT Submitted To: Frank Conway Submitted By: Name: Abbas Ahmed Student ID: W20026831 Module: Financial Derivatives Programme: MSc Global Financial Information Systems
-
Upload
abbas-ahmed -
Category
Economy & Finance
-
view
121 -
download
0
Transcript of StockTrak Report
Submitted To: Frank ConwaySubmitted By: Name: Abbas Ahmed Student ID: W20026831 Module: Financial Derivatives Programme: MSc Global Financial Information Systems
ContentsIntroduction...........................................................................................................................................2
Stock market......................................................................................................................................2
Buy and Hold.........................................................................................................................................3
Stock selection for buy and hold........................................................................................................4
Active account.......................................................................................................................................6
Stock selection for an Active account................................................................................................8
Short selling.....................................................................................................................................13
Options................................................................................................................................................14
Call option.......................................................................................................................................15
Put Option.......................................................................................................................................16
Straddle...........................................................................................................................................17
Strangle...........................................................................................................................................20
Bull call spread.................................................................................................................................22
Futures................................................................................................................................................24
Future selection...............................................................................................................................24
Gold Futures....................................................................................................................................25
Future options.................................................................................................................................26
Overview of Active account.................................................................................................................27
Overall Reflection of StockTrak............................................................................................................28
1 | P a g e
IntroductionTrading involves high risk and uncertainty in the market. In order to understand the risk in
the market it is important to understand the financial derivatives. Throughout the module I
have experienced trading in stocks, futures and options. The movement in the stock price is
highly related to the volatility of the market. The stock market has been drastically changed
in the past few years. Before taking this module I have known the manual form of trading
where stocks were purchased manually at the broker’s location by filing the documentation.
In the past the owner of shares used to get the certificate of the shares and if a person wanted
to sell the shares then the person has to bring the certificate to the broker. The use of
StockTrak gave me the opportunity to learn trading electronically. In the first part of the
project I have used buy and hold account to trade in 20 stocks and hold them for about 3
months. The active account is used to trade in stocks where I have been given the opportunity
to buy and sell the stocks using my own strategy to make gains on my trades.
Stock marketStock market is the place where stocks are traded. Stock market gives companies an
opportunity to make money in order to survive in the market. Companies with financial
difficulties use stocks as a tool to generate extra cash by giving investors a small percentage
of shares in their company. The investors get the advantage of making money by trading in
different stocks by exercising different stock strategy. The investors make money when
companies are profitable and they pay dividend to their investor. On the other hand this is a
risky market where investors can make losses if the stock price falls. I have learnt two types
of stock market one the primary market where stocks are sold initially in public offering and
institutional investors purchased most of the shares. The secondary form of stock market is
where shares are purchased by both institutional and individual investors. I have experienced
trading in the most common stock market in the world such as New York Exchange and
Nasdaq Index.
2 | P a g e
Buy and HoldThe buy and hold trading strategy was to study on fundamental analysis and the portfolio of
the company. The purpose of buy and hold was to buy 20 stocks and hold for about 3 months.
My buy and hold strategy was to invest in the strong assets in the market with the high return
on investment. Using the fundamental analysis I have studied on the Beta which helped me to
identify the volatility in the stock market. Beta 1 indicates that the stock price will move with
the market but if Beta is less than 1 that indicates that stock price is less volatile than the
market and if Beta is higher than 1 that means the security price is more volatile than the
market. P/E ratio is another tool that indicates the investors return on the investment. The
higher the P/E ratio means that investors are expecting higher return on their investment.
However it varies industry to industry.
In my buy and hold strategy I invested almost equal amount of $50000 in each stock. I limit
my decision on investment based on the knowledge, awareness and the pattern of the market.
Being able to identify of the stock market trends is a way to predict the future stock market
turns. Stock pattern are generally continuation or reversal. The continuation pattern is
sometime are more powerful and they often lead to outstanding and includes lower risk.
Reversal pattern can be positive or negative and they indicate that there is a need of different
strategy.
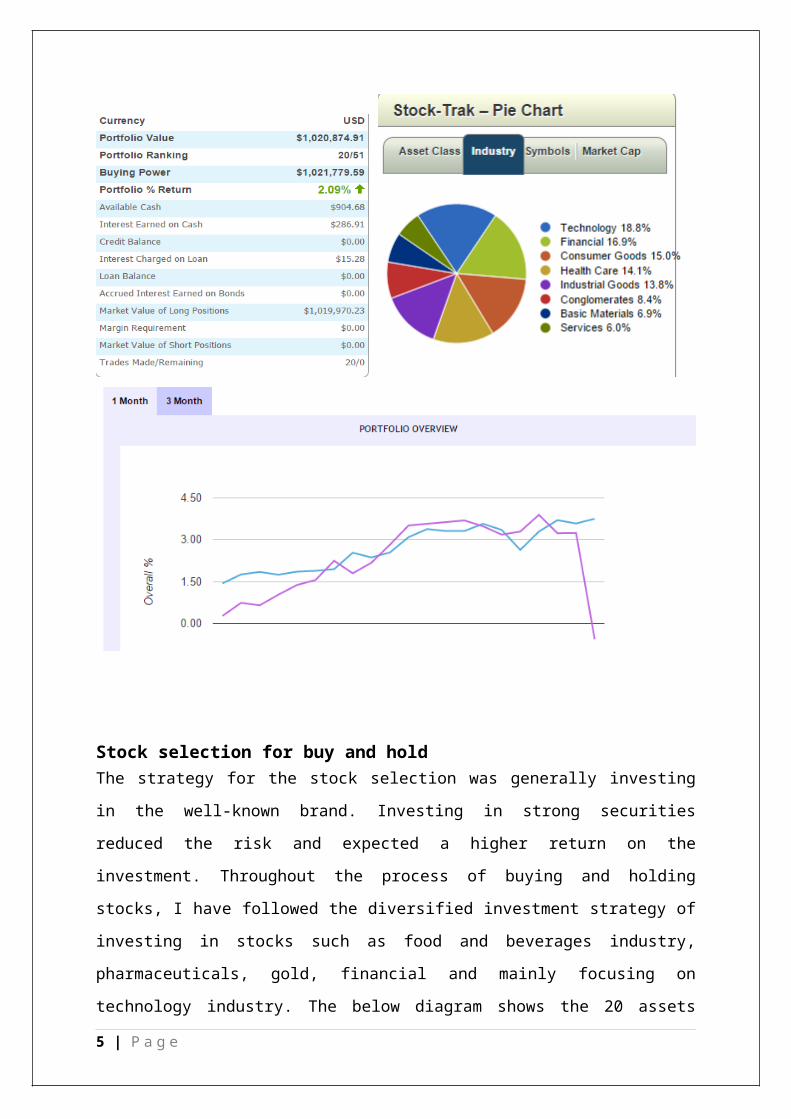
The below graph shows the overview of my buy and hold account. Investing in stocks using
buy and hold gave me the opportunity to learn the basic concept of investment, reading stock
tables and the impact of market volatility and trading strategies. Below is the summary and
graph of buy and hold account portfolio.
3 | P a g e
Stock selection for buy and holdThe strategy for the stock selection was generally investing in the well-known brand.
Investing in strong securities reduced the risk and expected a higher return on the investment.
Throughout the process of buying and holding stocks, I have followed the diversified
investment strategy of investing in stocks such as food and beverages industry,
pharmaceuticals, gold, financial and mainly focusing on technology industry. The below
diagram shows the 20 assets which I believed will perform better and will produce a good
return on the investment.
4 | P a g e
Apple announced the launch of new IPhone 6 and I assumed that there will be an increase in
the company’s sale and there will be an increased in the company’s revenue or profit
projections. The stock appeared to be relatively cheap for a technology stock. The price-to-
earnings ratio of 15 appeared reasonable, considering the revenue and earnings growth
projections for 2015 of 12.20 percent and 15.2 percent respectively. Apple was displaying a
great relative strength. Apple looked like it was in the middle of a consolidation phase where
5 | P a g e
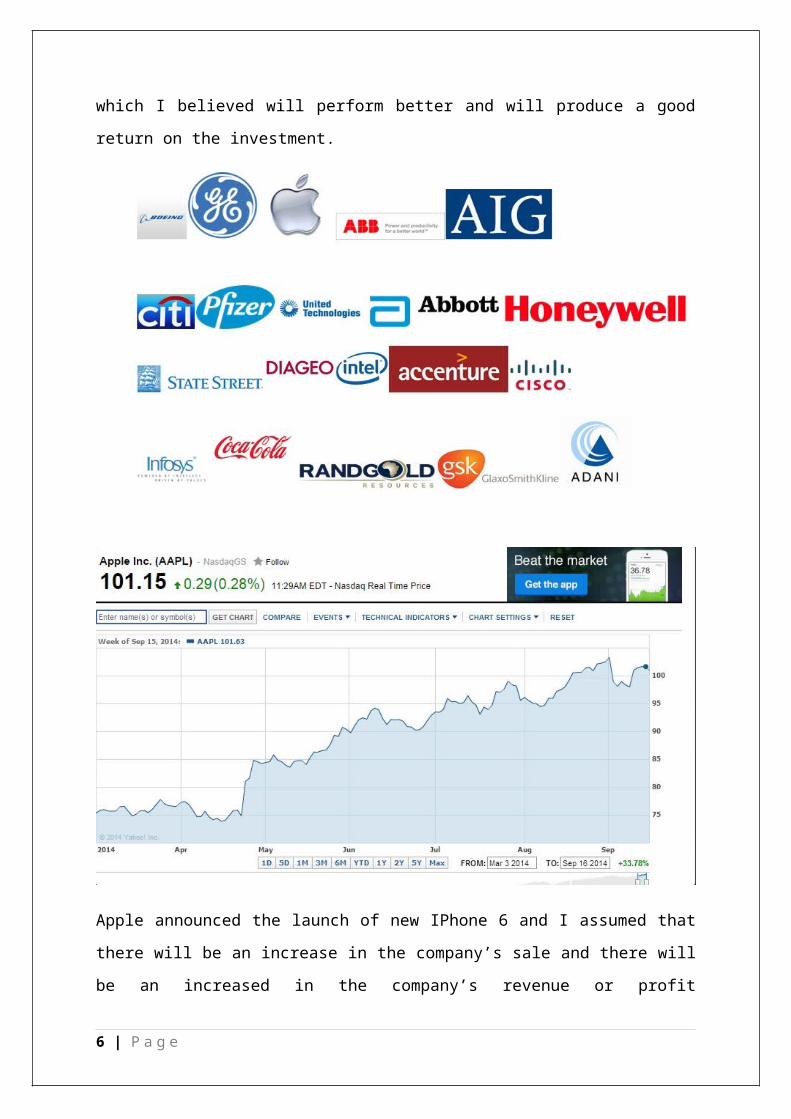
the ceiling is $103.74. A breakout above that trading range would lead to acceleration in the
same direction of the breakout.
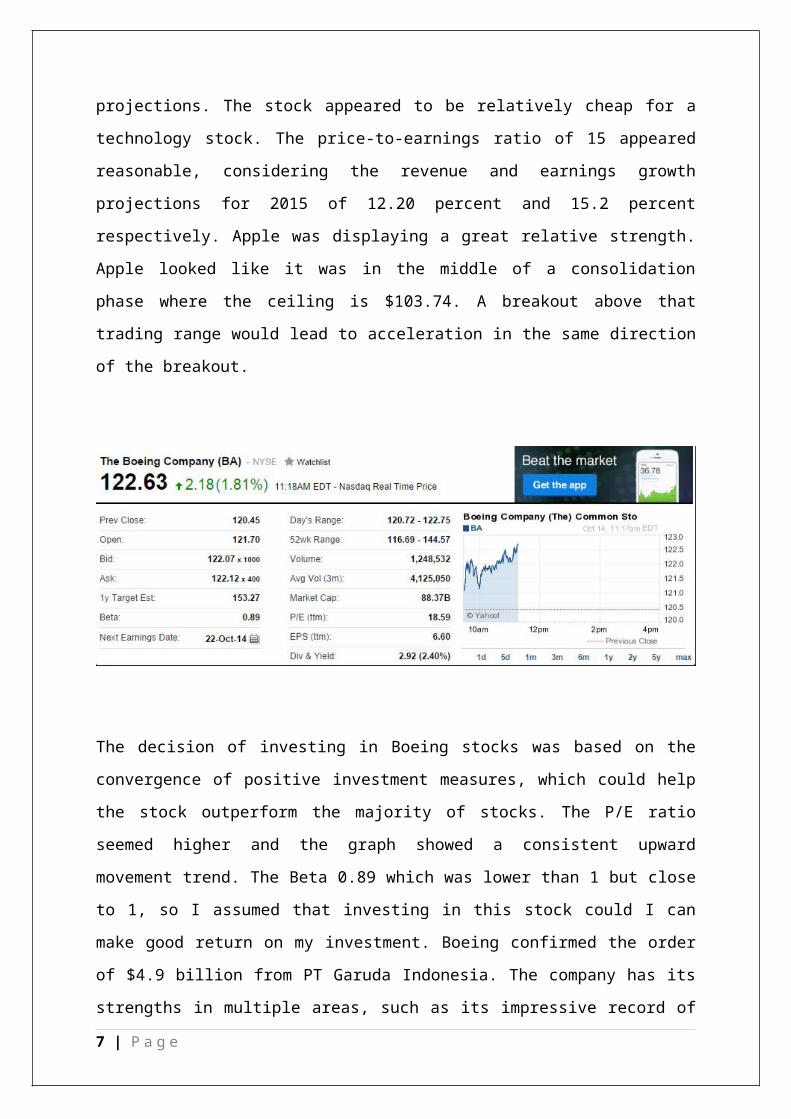
The decision of investing in Boeing stocks was based on the convergence of positive
investment measures, which could help the stock outperform the majority of stocks. The P/E
ratio seemed higher and the graph showed a consistent upward movement trend. The Beta
0.89 which was lower than 1 but close to 1, so I assumed that investing in this stock could I
can make good return on my investment. Boeing confirmed the order of $4.9 billion from PT
Garuda Indonesia. The company has its strengths in multiple areas, such as its impressive
record of earnings per share growth, compelling growth in net income, revenue growth,
increase in stock price during the past year and return on equity.
6 | P a g e
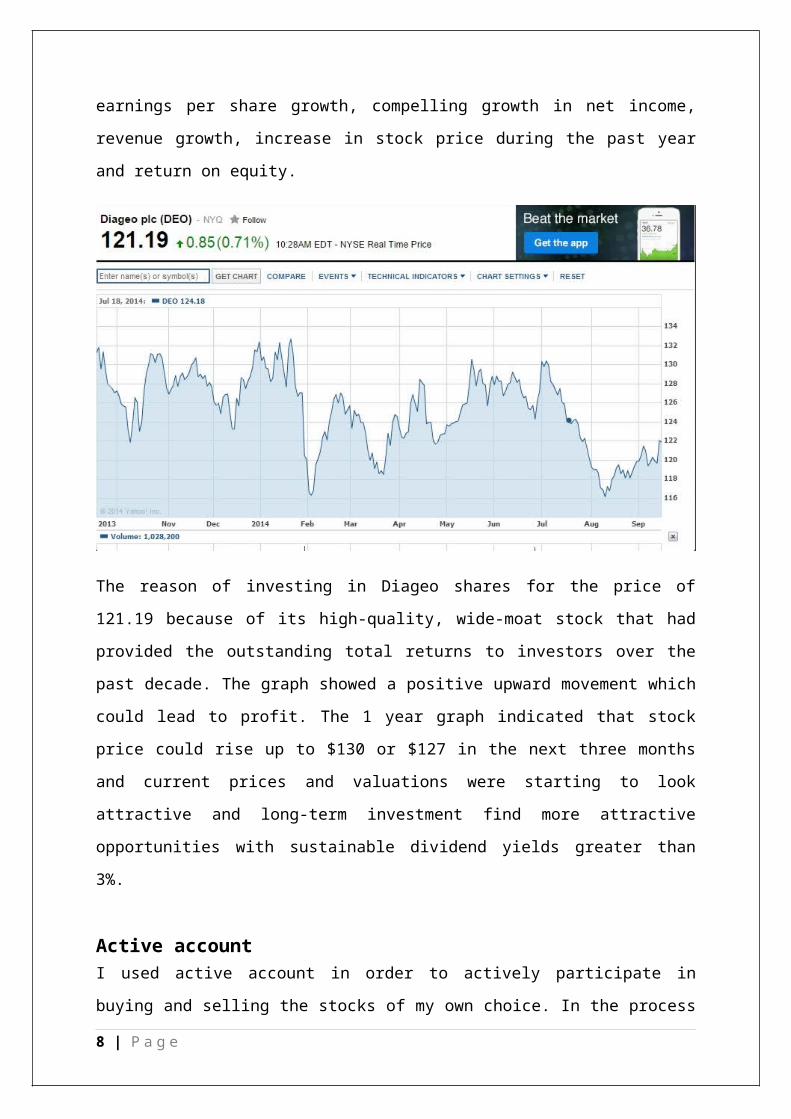
The reason of investing in Diageo shares for the price of 121.19 because of its high-quality,
wide-moat stock that had provided the outstanding total returns to investors over the past
decade. The graph showed a positive upward movement which could lead to profit. The 1
year graph indicated that stock price could rise up to $130 or $127 in the next three months
and current prices and valuations were starting to look attractive and long-term investment
find more attractive opportunities with sustainable dividend yields greater than 3%.
Active accountI used active account in order to actively participate in buying and selling the stocks of my
own choice. In the process of buying and selling I have followed different strategies in order
to make a gain from the movement of the market. In the past three months, I have invested in
stocks, options and future. In the start it was hard to understand trading in stock options.
Throughout buying and selling the stocks I have used technical and fundamental analysis
which helped me to invest in the particular stock.
I have used technical and fundamental analysis to trade in active account. In the fundamental
analysis I have used the Beta and P/E ratio to analyse the future forecast of the stocks.
Technical analysis is one of the most popular tools for analysing the future prices of the
particular stock. In technical analysis of stock, I have used relevant strength index (RSI) as a
tool to forecast the stock prices. Relevant strength index indicates that if the stock is
overbought or oversold in the market. Candlesticks are one of the common measure to
7 | P a g e
analyse the stocks. If the candlesticks are green that means the stock is trading higher than the
opening price of the stock and if it is red that means stock is trading lower than the opening
price. Candlesticks are generally are indication of investors emotion for a particular stock.
Simple moving average is another tool, I have used for technical analysis for the stock.
Simple average moving explains the closing price of stock in past number of days. Bollinger
band is one of the useful tools for technical analysis for the stocks. Bollinger band indicates
the volatility of the market. The band widen when market is more volatile and gets closer to
average when market is less volatile. The band close to average indicates the traders that the
market volatility is going to increase.
Stock selection for an Active accountBelow are the some of the stocks I have chosen for my active account. For each stock, I have
provided with the detailed analysis of profit and loss, stock performance over the past year
and rationale of investing.
8 | P a g e
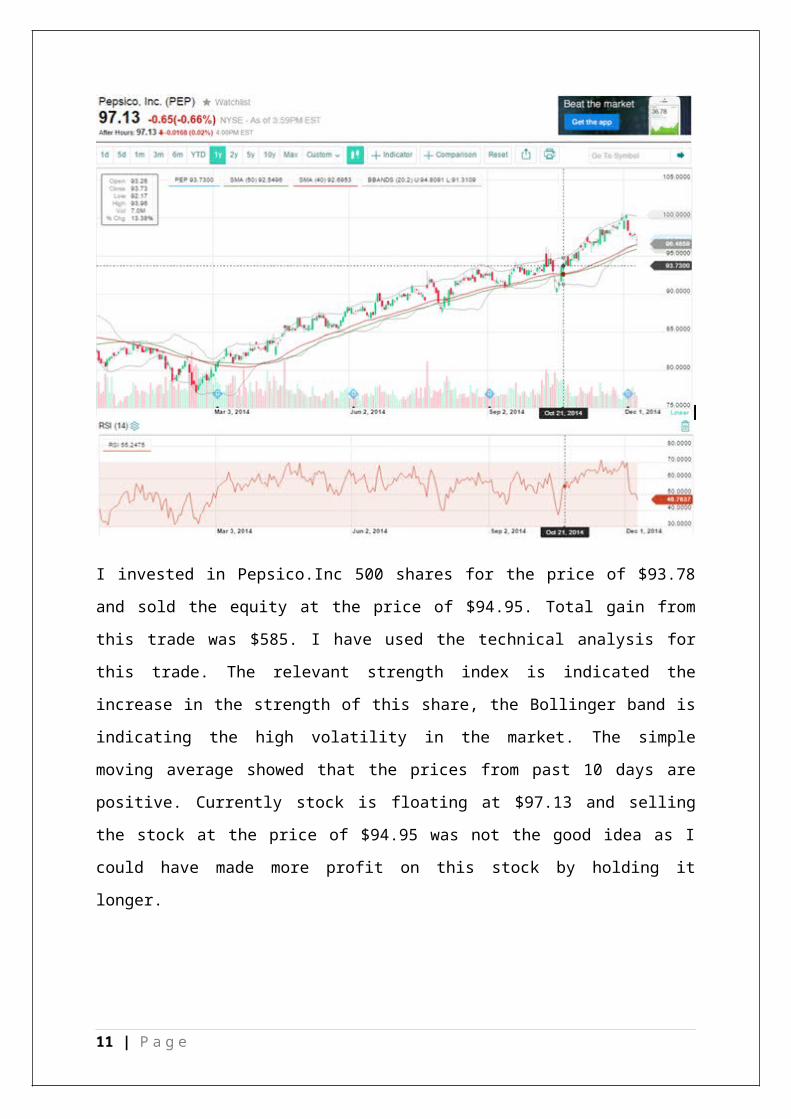
I invested in Pepsico.Inc 500 shares for the price of $93.78 and sold the equity at the price of
$94.95. Total gain from this trade was $585. I have used the technical analysis for this trade.
The relevant strength index is indicated the increase in the strength of this share, the
Bollinger band is indicating the high volatility in the market. The simple moving average
showed that the prices from past 10 days are positive. Currently stock is floating at $97.13
and selling the stock at the price of $94.95 was not the good idea as I could have made more
profit on this stock by holding it longer.
9 | P a g e
Investing in Google’s 100 shares at the price of $529.26 based on the technical analysis gave
me the opportunity to gain $662 in a short time. I have used RSI and band in my technical
analysis to invest in Google stock. The wide band indicated that the stock will further move
up but only for a short time. RSI indicated that the stock has more buyers in the market and it
is best time to gain from the stock.
10 | P a g e
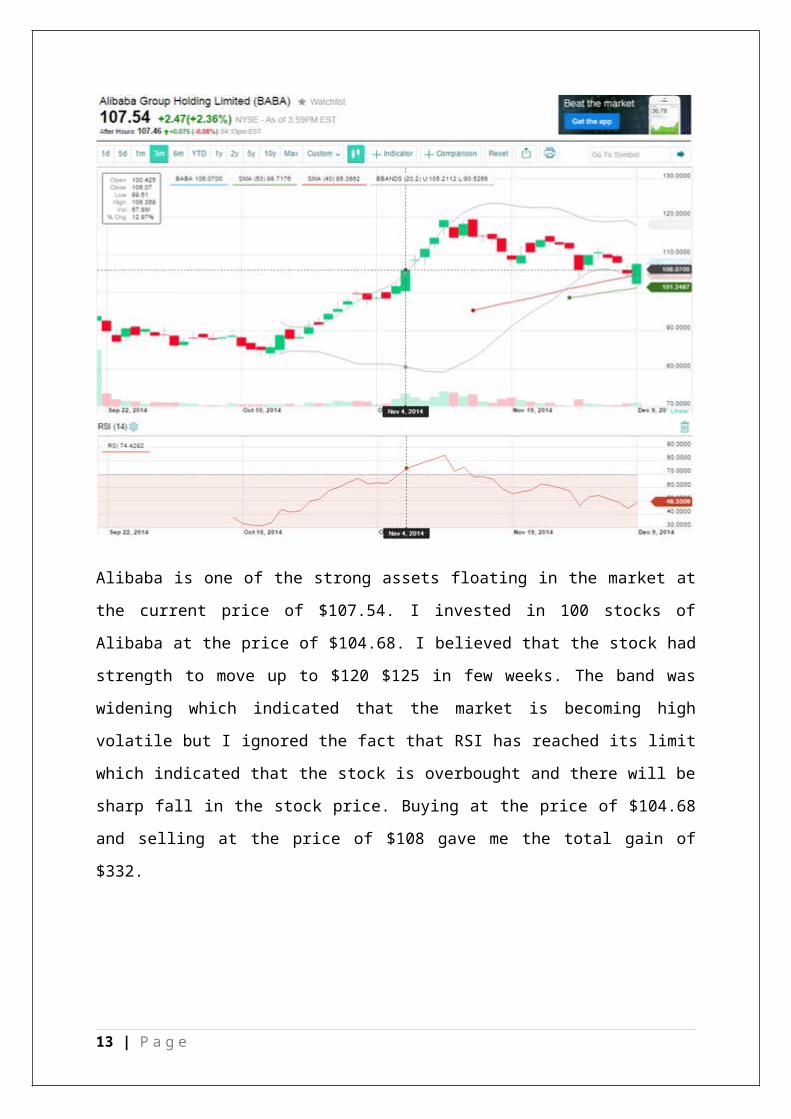
Alibaba is one of the strong assets floating in the market at the current price of $107.54. I
invested in 100 stocks of Alibaba at the price of $104.68. I believed that the stock had
strength to move up to $120 $125 in few weeks. The band was widening which indicated that
the market is becoming high volatile but I ignored the fact that RSI has reached its limit
which indicated that the stock is overbought and there will be sharp fall in the stock price.
Buying at the price of $104.68 and selling at the price of $108 gave me the total gain of $332.
11 | P a g e

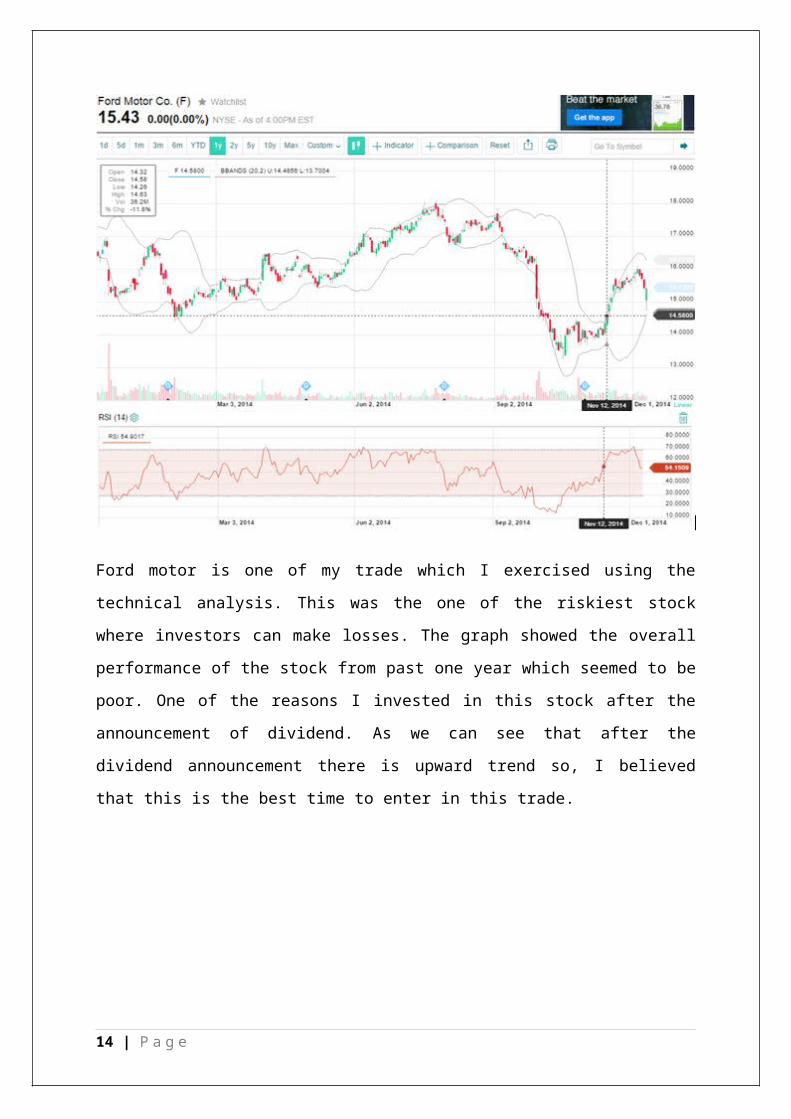
Ford motor is one of my trade which I exercised using the technical analysis. This was the
one of the riskiest stock where investors can make losses. The graph showed the overall
performance of the stock from past one year which seemed to be poor. One of the reasons I
invested in this stock after the announcement of dividend. As we can see that after the
dividend announcement there is upward trend so, I believed that this is the best time to enter
in this trade.
12 | P a g e
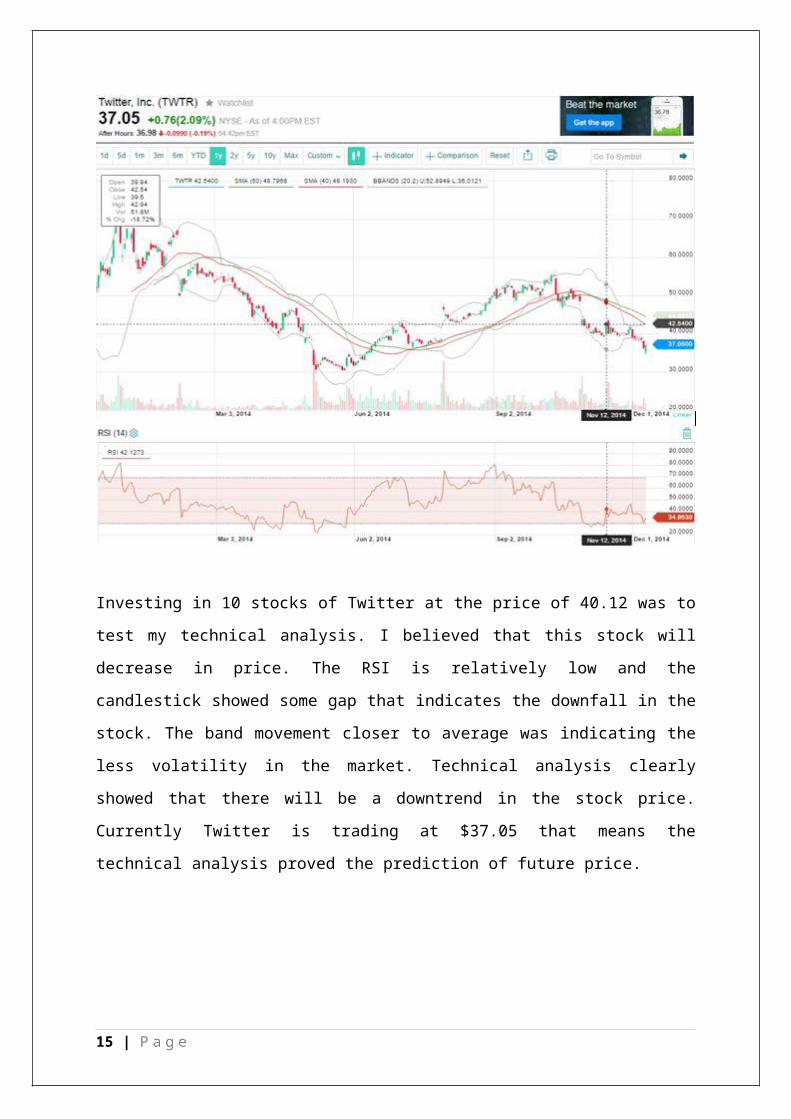
Investing in 10 stocks of Twitter at the price of 40.12 was to test my technical analysis. I
believed that this stock will decrease in price. The RSI is relatively low and the candlestick
showed some gap that indicates the downfall in the stock. The band movement closer to
average was indicating the less volatility in the market. Technical analysis clearly showed
that there will be a downtrend in the stock price. Currently Twitter is trading at $37.05 that
means the technical analysis proved the prediction of future price.
13 | P a g e
Short sellingShort selling is the strategy which allows trader to sell shares which they don’t own. Short
selling is basically borrowing of shares. Short selling is a risky trade. In short selling the
trader believes that the stock price will fall and agree to buy stock at the reduce price. If the
stock price falls, the trader makes profit and buy stock at the reduced price but if the stock
price rise then trader have to pay the higher price to buy the stock in an open market which is
the loss. I have exercised short selling in some of my trades where I believed that stock price
would fall in order to understand this type of trade.
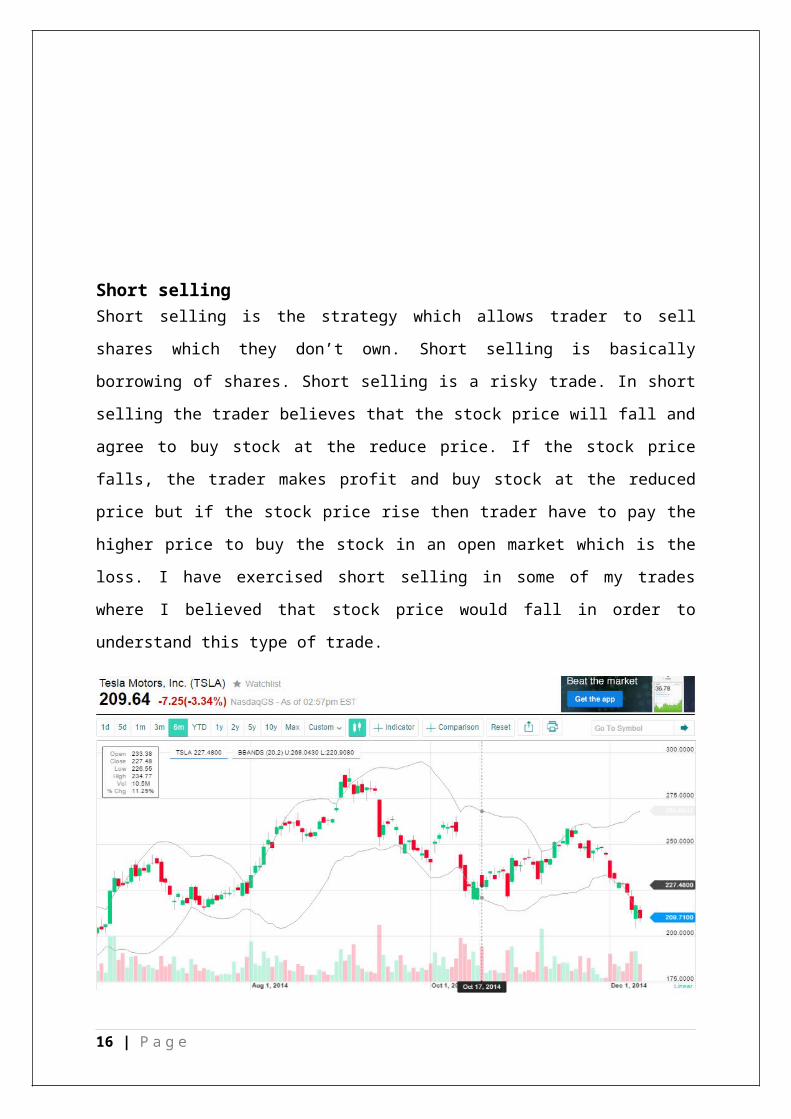
Short selling Tesla motors 200 stocks at the price of $226.33 and buying back at the price of
$232.84 gave me the total loss of $1302. From my technical analysis, I believed that the stock
price will fall. The simple moving average indicated that the stock is closing at a lower price
than the opening price. The band seemed to narrowing down and the red candlesticks were
quite larger than the green. Currently stock is floating at the price of $209.64 which is
relatively lower than the $226.33. By holding the position I could have gained the good
return on my investment.
14 | P a g e
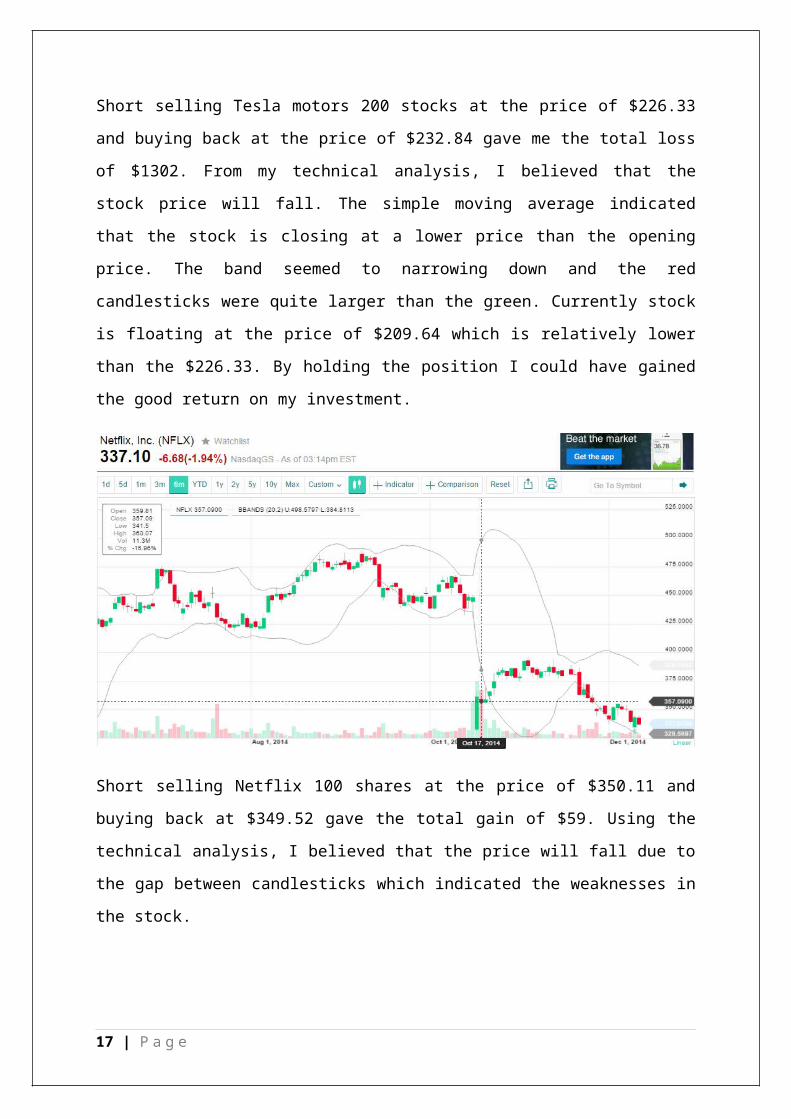
Short selling Netflix 100 shares at the price of $350.11 and buying back at $349.52 gave the
total gain of $59. Using the technical analysis, I believed that the price will fall due to the gap
between candlesticks which indicated the weaknesses in the stock.
OptionsBuying an option is one of the types of strategy where investor can benefit of buying the
stock option only paying a premium. Stock options are the contracts which give traders the
right to buy and sell the shares on a specified price which is called a strike price within the
specified period of time. Option strategy includes call and put option. Investors exercise call
option when they believe that the stock price will rise and put option gives the buyer the
opportunity to make money on the falling prices of stock.
Stock options are insurance contracts and the buyer pays a premium to purchase the stock.
Option strategy helps the buyer to eliminate the risk of stock price falling of holding stocks.
The buyer gets the benefit with the option strategy, if the stock price fall the owner will only
lose the premium he paid to buy an option. Options are the strategy to hedge against
uncertainty. Option prices depend on the stock volatility. Higher volatility means that the
traders will pay higher price for an option. The higher volatility means the investors will
make profit by exercising the options.
15 | P a g e
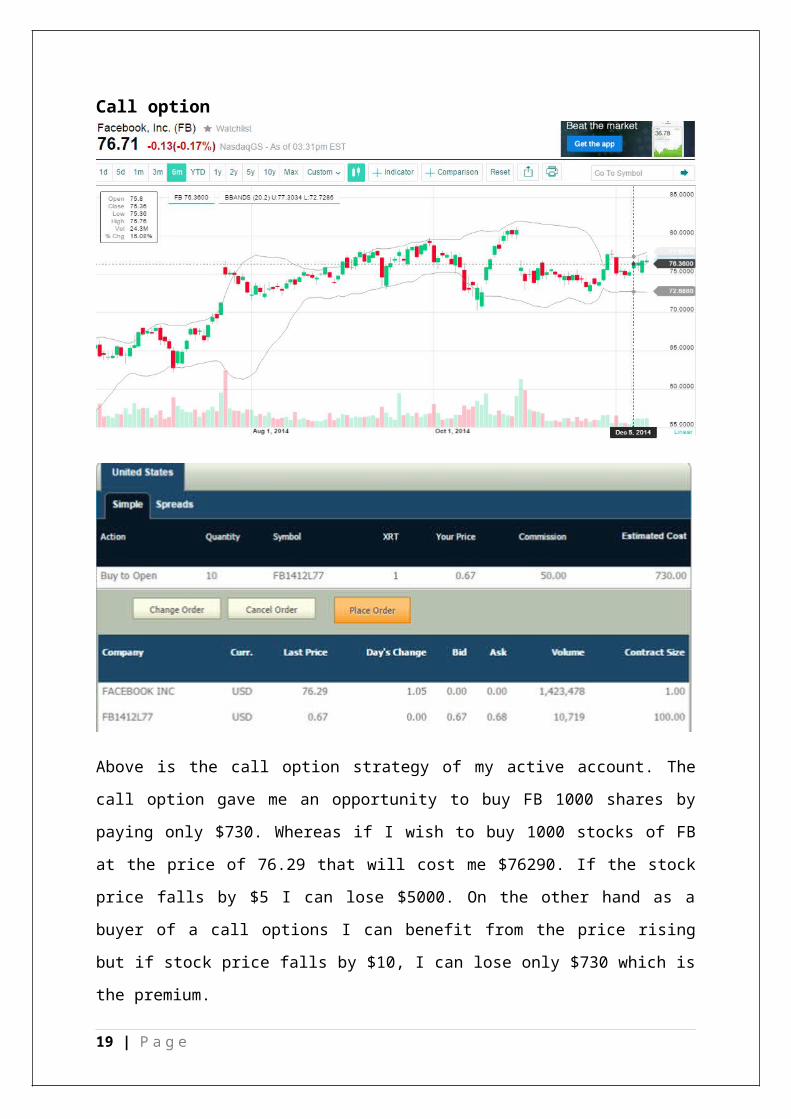
Call option
Above is the call option strategy of my active account. The call option gave me an
opportunity to buy FB 1000 shares by paying only $730. Whereas if I wish to buy 1000
stocks of FB at the price of 76.29 that will cost me $76290. If the stock price falls by $5 I can
lose $5000. On the other hand as a buyer of a call options I can benefit from the price rising
but if stock price falls by $10, I can lose only $730 which is the premium.
Options can be more complex when exercising. To get the maximum gain from the options it
is important to understand the figures and numbers. The technical analysis of the particular
stock is very important before buying a call options. As mentioned before the stock volatility
is important factor in the option strategy because the stock with less volatility has no gain and
16 | P a g e
they will expire worthless. As we can see from the above graph of FB where volume is 10719
for the call options that means there is high volatility in the market.
Option prices depends on the strike price and the most of the investors select the strike price
which is close to the strike price but some stocks have high option price close to the stock
price because of the high volume. The call option for the FB for the strike price of $77 is
$0.67 and if we select a higher stock price the call option price will reduce. The selection of
strike price depends on the volatility of the stocks, if there is high volatility in the stock the
selection of higher strike price would be an advantage of paying less call option price and if
the stock price rise I can make profit from this trade. In option the contract size is important
to understand as 1 contract of FB call option includes 100 shares so buying a 10 contracts of
FB are equal to 1000 shares. The contract length is another issue in the option strategy. The
longer the contract period the more premium you have to pay against that security. In the
above example of FB the contract expired on 12/12/2014 and the price is 0.67 on the strike
price of $77, if I increase the length of the contract to 12/26/2014 it will cost me $1.37 per
share so longer you hold the stock the longer you have to pay the insurance.
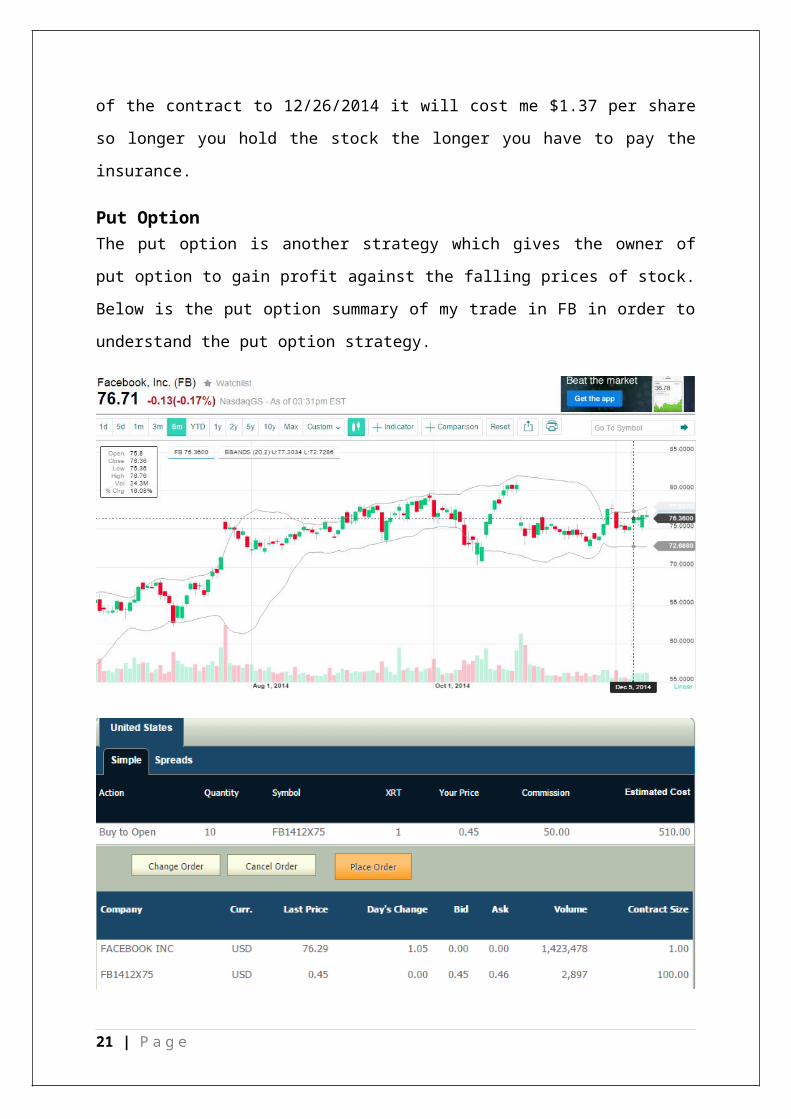
Put OptionThe put option is another strategy which gives the owner of put option to gain profit against
the falling prices of stock. Below is the put option summary of my trade in FB in order to
understand the put option strategy.
17 | P a g e
The price for the put option for FB is $0.45 per share. I believed that the price of stock will
fall and by exercising this I will make profit from the strategy. If the stock price rise the
maximum risk I could have is $510 which is the premium paid against the 1000 shares. In
both call option and put option there is a charge of $50 which is the commission and when
calculating the price of an option it should add in the price of premium paid.
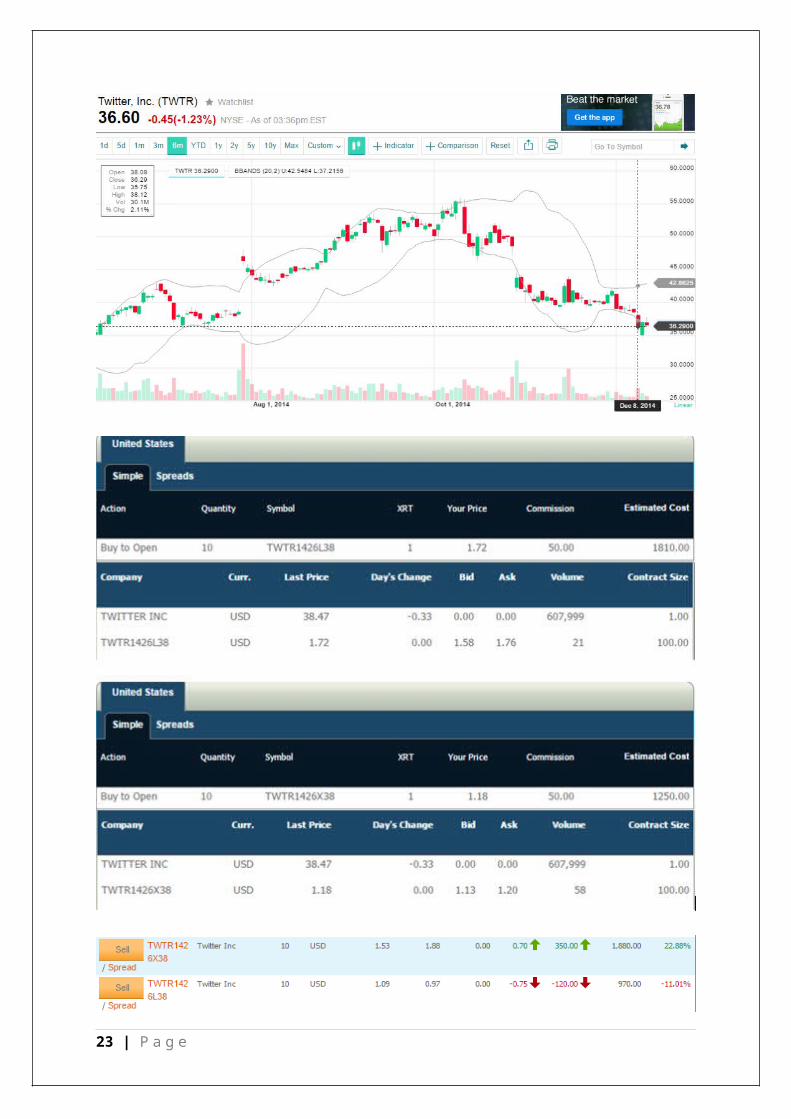
StraddleStraddle is one the option strategy where investor buy a contract for call and put option for a
same strike price expire at the same time. I have traded few straddle strategy to make the gain
from these strategy in order to understand the concept of buying a straddle options. Below is
the one the straddle trade of my active account.
18 | P a g e
19 | P a g e
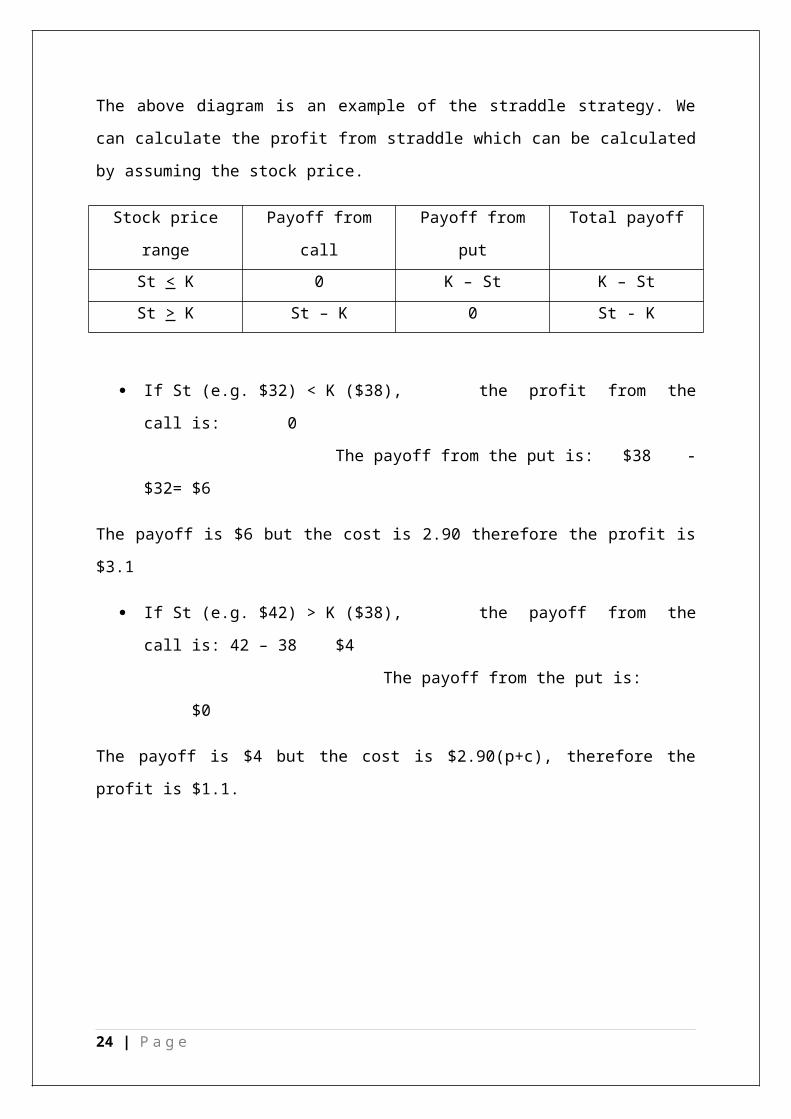
The above diagram is an example of the straddle strategy. We can calculate the profit from
straddle which can be calculated by assuming the stock price.
Stock price range Payoff from call Payoff from put Total payoff
St < K 0 K – St K – St
St > K St – K 0 St - K
If St (e.g. $32) < K ($38), the profit from the call is: 0
The payoff from the put is: $38 - $32= $6
The payoff is $6 but the cost is 2.90 therefore the profit is $3.1
If St (e.g. $42) > K ($38), the payoff from the call is: 42 – 38 $4
The payoff from the put is: $0
The payoff is $4 but the cost is $2.90(p+c), therefore the profit is $1.1.
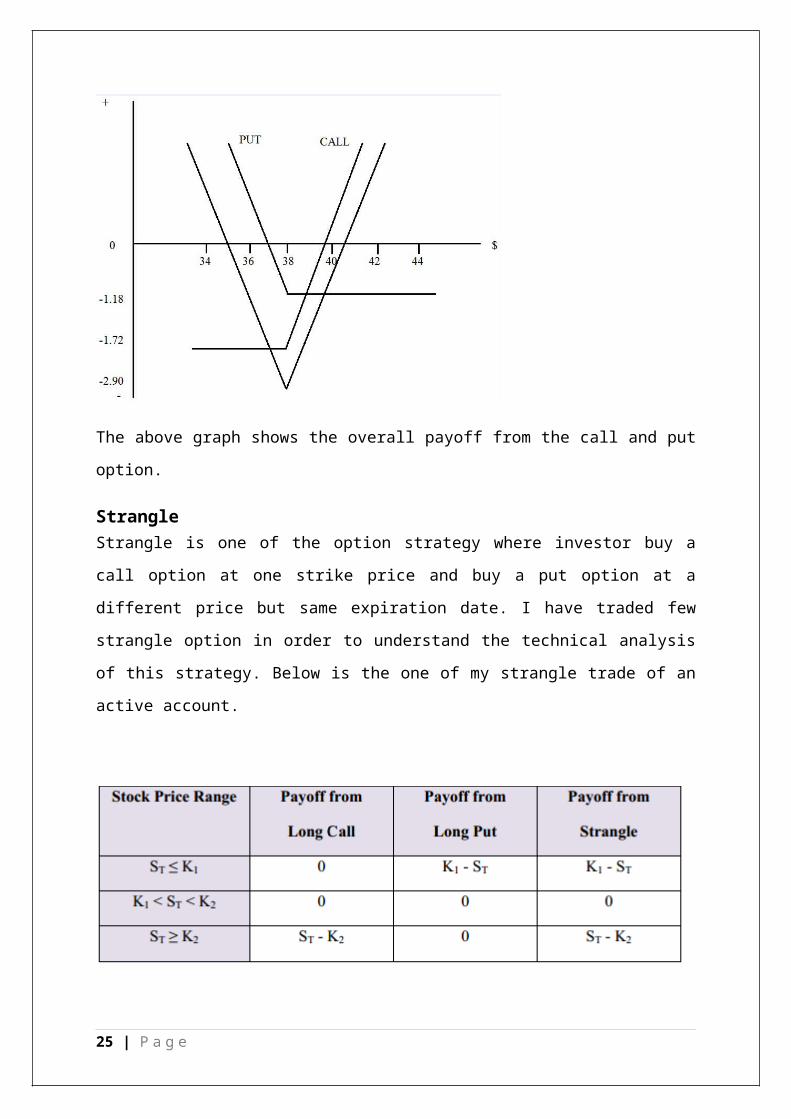
The above graph shows the overall payoff from the call and put option.
20 | P a g e
StrangleStrangle is one of the option strategy where investor buy a call option at one strike price and
buy a put option at a different price but same expiration date. I have traded few strangle
option in order to understand the technical analysis of this strategy. Below is the one of my
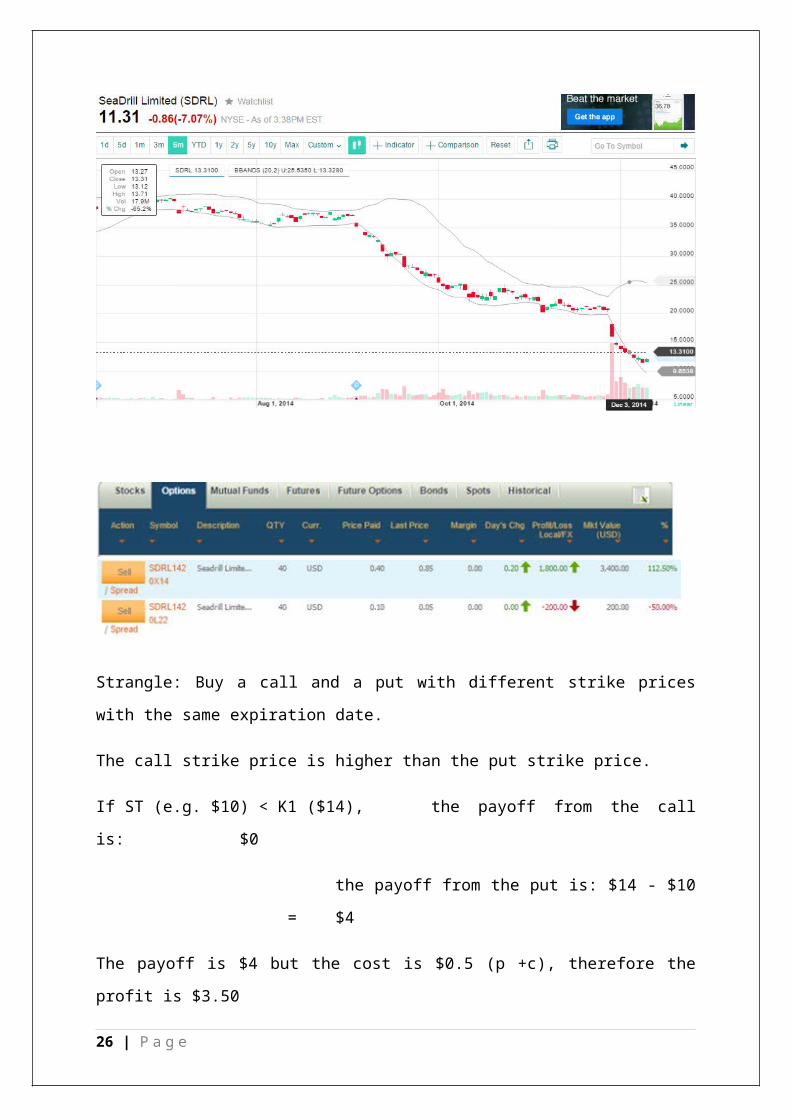
strangle trade of an active account.
21 | P a g e
Strangle: Buy a call and a put with different strike prices with the same expiration date.
The call strike price is higher than the put strike price.
If ST (e.g. $10) < K1 ($14), the payoff from the call is: $0
the payoff from the put is: $14 - $10 = $4
The payoff is $4 but the cost is $0.5 (p +c), therefore the profit is $3.50
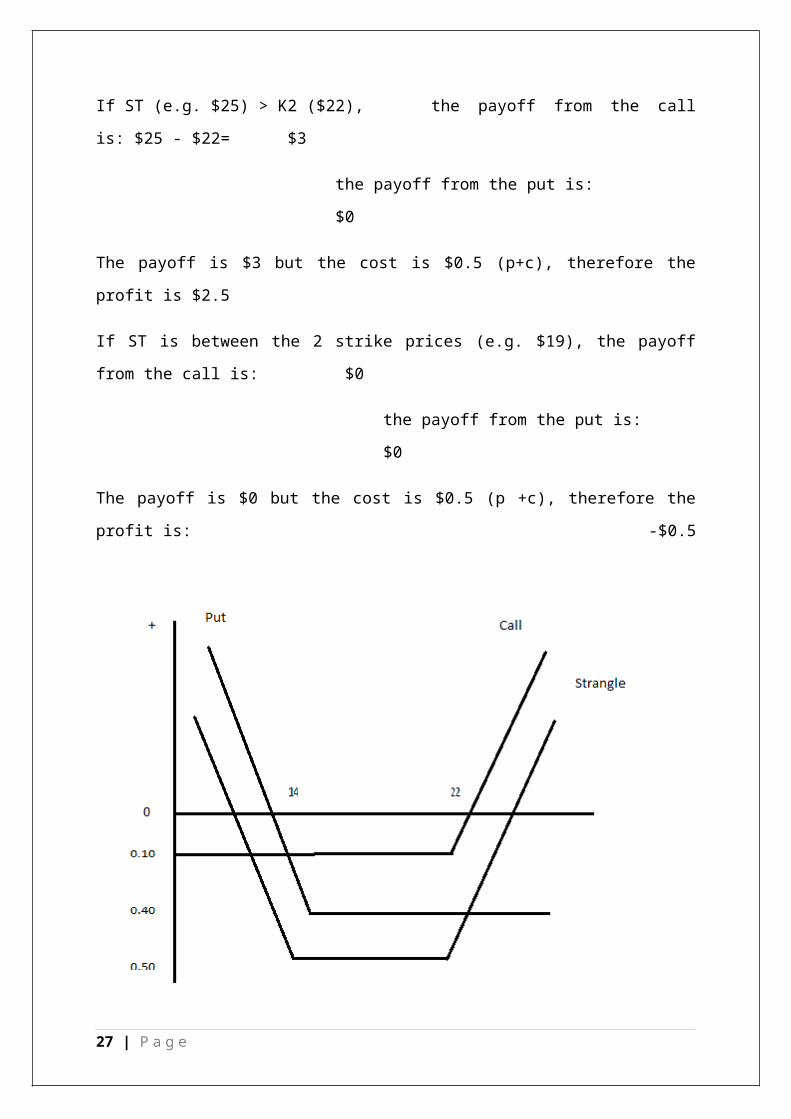
If ST (e.g. $25) > K2 ($22), the payoff from the call is: $25 - $22= $3
the payoff from the put is: $0
The payoff is $3 but the cost is $0.5 (p+c), therefore the profit is $2.5
If ST is between the 2 strike prices (e.g. $19), the payoff from the call is: $0
the payoff from the put is: $0
The payoff is $0 but the cost is $0.5 (p +c), therefore the profit is: -$0.5
22 | P a g e
Strangle strategy is buying an out of money call and put option. Strangle is less expensive
than the straddle. In this strategy of options I would make money when stock moves outside
of the strike price. If the stock price rise the put option will be worthless and I will lose only
the premium paid and if the stock price goes up I can make profit minus the price paid for put
option.
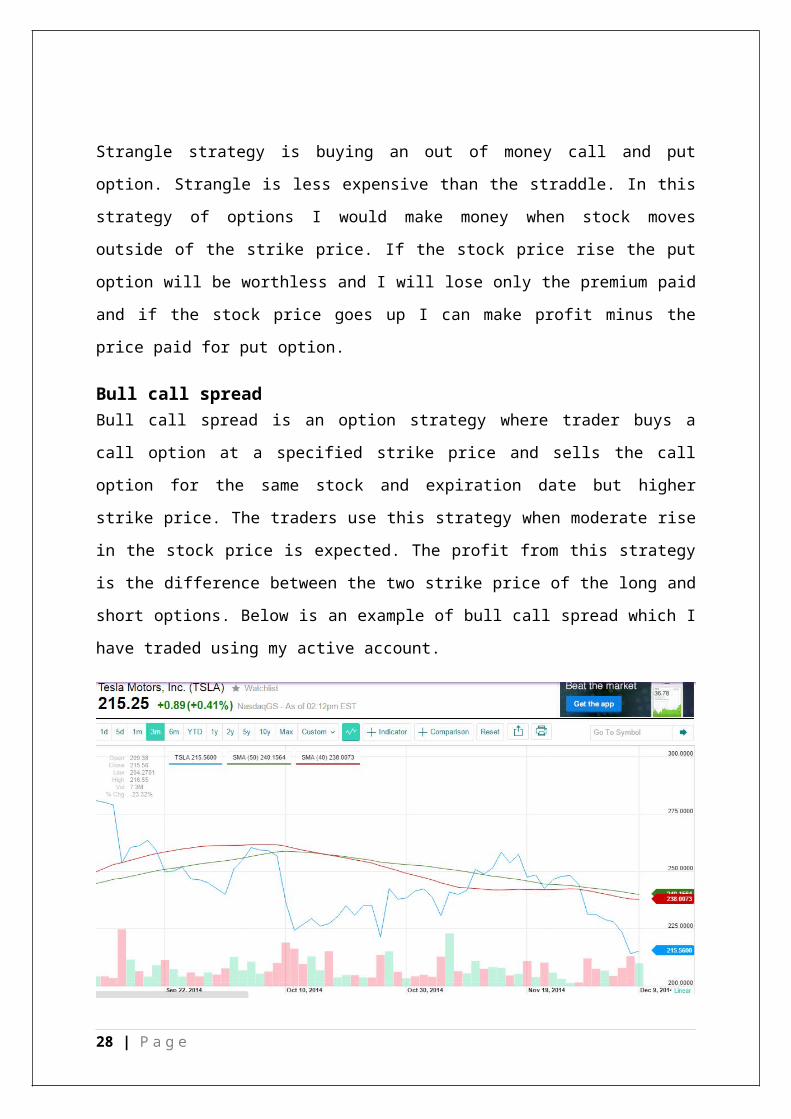
Bull call spreadBull call spread is an option strategy where trader buys a call option at a specified strike price
and sells the call option for the same stock and expiration date but higher strike price. The
traders use this strategy when moderate rise in the stock price is expected. The profit from
this strategy is the difference between the two strike price of the long and short options.
Below is an example of bull call spread which I have traded using my active account.
23 | P a g e
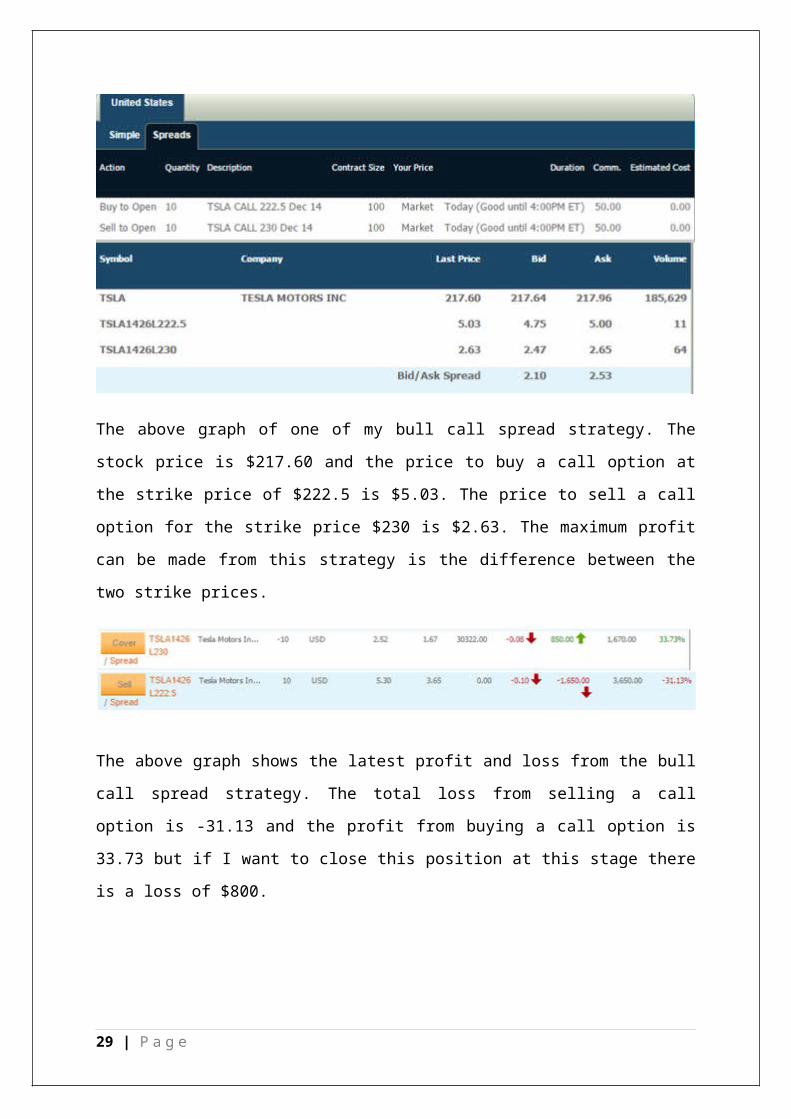
The above graph of one of my bull call spread strategy. The stock price is $217.60 and the
price to buy a call option at the strike price of $222.5 is $5.03. The price to sell a call option
for the strike price $230 is $2.63. The maximum profit can be made from this strategy is the
difference between the two strike prices.
24 | P a g e
The above graph shows the latest profit and loss from the bull call spread strategy. The total
loss from selling a call option is -31.13 and the profit from buying a call option is 33.73 but if
I want to close this position at this stage there is a loss of $800.
Futures Futures are the contract of a physical commodity or financial instrument. Buyer can purchase
and sell the futures at future date and price. Some buyers of futures can call physical delivery
of commodity. Most of the futures are settled in cash. The profit of future market is higher
than the stock market. Futures can be used to hedge. Some producer of commodity uses the
future to lock the future price to reduce the risk of hedging.
Future selectionI have exercised trading in futures such as Gold and wheat in order to understand this type of
trade. Below is the futures trade of wheat using active account.
This graph shows the maximum gained from buying the future contracts of wheat. I have
traded the wheat futures contract at the price of $583 and sold at $601.38. I have used the
technical analysis for futures where analysing the 1 year graph helped me to predict the future
25 | P a g e
prices of wheat. In order to invest in commodity the knowledge of seasonality is very
important. For an example the wheat demands increase in the winter because it produces in
the summer time. In case of commodity if the supply is higher than the demand then it will
result in price fall.
Gold Futures
26 | P a g e
Trading in Gold futures is one the challenge of its unstable prices. I have made small gains on
the Gold future contracts of $1040 but the other hand due to sudden drop of Gold prices
incurred a significant loss of $2350. I have conducted the technical analysis for the gold in
order to make profit by trading gold futures but comparing to last year the gold is unstable
and involve high risk.
Future optionsFuture options are the strategy which gives trader an opportunity to enter in a trade to buy a
commodity at future price. The trader can enter in a long or short term contract. I have
exercised on the future option on wheat.
27 | P a g e
Trading in future options was not the good idea. The total loss from this trade was $4412.50.
The strategy was to buy a call for the future options. I believed that the future option of wheat
will increase after conducting all the technical analysis but the market reacted in an opposite
direction. It is concluded that future options can be profitable trade but the other hand
entering in this type of trade can be risky and face losses.
Overview of Active account
This is an overview of my active account where I have made 63 transactions and portfolio
value $1074845.83 and portfolio ranking 10.
28 | P a g e
Overall Reflection of StockTrakOverall experience of using Stock Track for trading is a great source of understanding the
basics of stock market. I experienced investing in diversified range of stocks including
technology, food, manufacturing and pharmaceutical industry etc. Thus I learnt how to create
a portfolio. In the start I have faced many losses from my trades but that helped me to
understand the basic functions of StockTrak. In the first part using buy and hold account I
have learnt the basic rules of trading. Active account helped me to understand the strategies
such as investing in options and short selling without having a big amount of money to own a
stock.
In the start I found it hard to trade in options because some of the trades didn’t fill. Some
option position filled as soon as the market opens but most of the options are delayed. I made
losses in some of the option positions due to delay in the filling the positions. Buying call and
put options of stocks help me to understand the contract size, contract length, strike price etc.
For me futures are more profitable compare to the stocks but the risk is also the same. Future
options are the profitable trades where a small investment can make profit and it is less risky
trade compare to investing in futures.
Overall experience using StockTrak was enjoyable. I have almost experienced all functions
of StockTrak which gave the knowledge and opportunity to learn the basics of stock market.
After completing my StockTrak experience I am able to trade in stocks, options, future,
future options, hedging, short selling etc. I have gained confidence and improved my
technical analysis skills in order to read and predict the stock prices.
29 | P a g e