Stocks Trading
23
Financial Management Stocks Trading Final Project pg. 1 Guideline for Choosing Stocks to Invest Investing in a stock market is no child's play. To make a consistent and sizable profit on the market requires years of experience to back it up and consistently choosing the best stocks to invest in. Even after years of worldwide economics research and thousands of books being written on how to identify the best stocks to invest in, we are none the wiser and nobody has the perfect formula to select best stocks to invest in! This is because there are just too many variables involved which control the fate of a stock. It is not possible to predict with mathematical precision, which stock is the best to invest in, as the stock market developments are not totally based on logic, but on human emotions, irrational apprehensions and speculation! Therefore there is no surefire method to find the best stocks to invest in stock trading. Few criteria worth considering are: • Earnings growth • Recent earnings surprises • Price/earnings ratio • Dividends • Market cap or size • Industry • Relative strength Stock Research you should also take a look at the company's annual report and its financial statements for the following. From the Income Statement: • Earnings growth (earnings acceleration is even better). Earnings are considered by many investors to be the most important single number, the assumption being that earnings pave the way for future dividends. • Revenue growth. • Stable or increasing margins • Stable or increasing R&D spending as a percentage of sales (specifically for technology companies). • Tax abnormalities. • Number of common shares outstanding. Increases in the number of shares negatively impact earnings per share (issuance of new shares isn't necessarily bad; the important consideration is why they're doing it).
-
Upload
imran-zubair -
Category
Documents
-
view
227 -
download
2
Transcript of Stocks Trading

8/6/2019 Stocks Trading
http://slidepdf.com/reader/full/stocks-trading 1/23
Financial Management Stocks Trading
Final Project pg. 1
Guideline for Choosing Stocks to Invest
Investing in a stock market is no child's play. To make a consistent and sizable profit on themarket requires years of experience to back it up and consistently choosing the best stocks to
invest in. Even after years of worldwide economics research and thousands of books being
written on how to identify the best stocks to invest in, we are none the wiser and nobody has the
perfect formula to select best stocks to invest in! This is because there are just too manyvariables involved which control the fate of a stock. It is not possible to predict with
mathematical precision, which stock is the best to invest in, as the stock market developments
are not totally based on logic, but on human emotions, irrational apprehensions and speculation!
Therefore there is no surefire method to find the best stocks to invest in stock trading. Few
criteria worth considering are:
• Earnings growth• Recent earnings surprises
• Price/earnings ratio
• Dividends
• Market cap or size
• Industry
• Relative strength
Stock Research
you should also take a look at the company's annual report and its financial statements for the
following.
From the Income Statement:
• Earnings growth (earnings acceleration is even better). Earnings are considered by manyinvestors to be the most important single number, the assumption being that earnings pavethe way for future dividends.
• Revenue growth.
• Stable or increasing margins
• Stable or increasing R&D spending as a percentage of sales (specifically for technologycompanies).
• Tax abnormalities.
• Number of common shares outstanding. Increases in the number of shares negatively impactearnings per share (issuance of new shares isn't necessarily bad; the important consideration
is why they're doing it).

8/6/2019 Stocks Trading
http://slidepdf.com/reader/full/stocks-trading 2/23
Financial Management Stocks Trading
Final Project pg. 2
From the Cash Flow Statement:
• Cash flow. Ideally, cash flow should be positive, large, and increasing. In any case,understand why the company's cash flow is what it is.
From the Balance Sheet:
• Debt. The debt to equity ratio (long term debt divided by stockholder's equity) is the measuretypically used. Lower is better, and zero is ideal.
• Cash (relative to annual sales). Cash is always a good thing, but it's especially important to
companies that sometimes want or need to temporarily go cash flow negative. Rememberthat when new shares are issued, proceeds from the sale also appear here.
• Return on equity. This is a measure of net income relative to stockholder's equity. Higher isbetter.
• Receivables and inventory. They should not be rising much faster than sales are.
• Current ratio. This is the ratio of current assets (cash, receivables and inventory) to short-term liabilities. The higher the better.
8/6/2019 Stocks Trading
http://slidepdf.com/reader/full/stocks-trading 3/23
Financial Management Stocks Trading
Final Project pg. 3
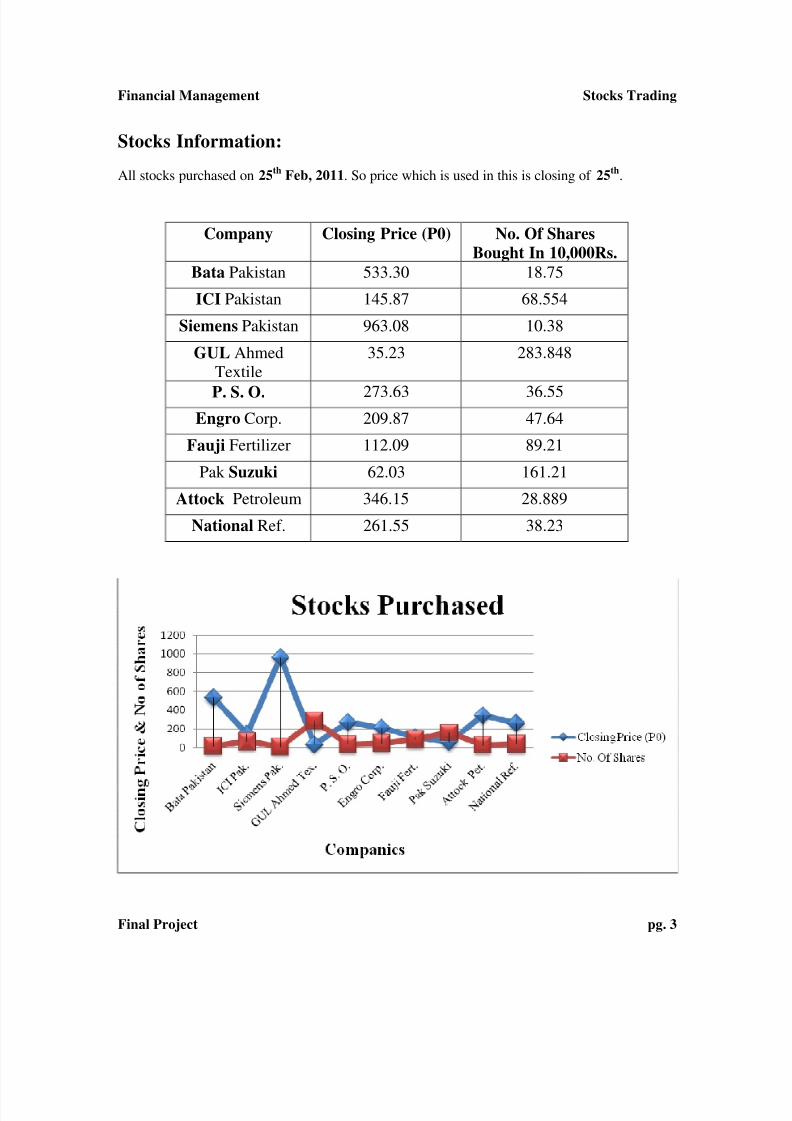
Stocks Information:
All stocks purchased on 25
th
Feb, 2011. So price which is used in this is closing of 25
th
.
Company Closing Price (P0) No. Of Shares
Bought In 10,000Rs.
Bata Pakistan 533.30 18.75
ICI Pakistan 145.87 68.554
Siemens Pakistan 963.08 10.38
GUL Ahmed
Textile
35.23 283.848
P. S. O. 273.63 36.55
Engro Corp. 209.87 47.64
Fauji Fertilizer 112.09 89.21
Pak Suzuki 62.03 161.21
Attock Petroleum 346.15 28.889
National Ref. 261.55 38.23

8/6/2019 Stocks Trading
http://slidepdf.com/reader/full/stocks-trading 4/23
Financial Management Stocks Trading
Final Project pg. 4
Reasons of Investment in these Stocks:
The basic criteria behind the selection of the stocks are that I am familiar with all these stocksand have viewed the information about the stocks.
Bata Pakistan is established industry and share price if this company is increasing gradually and
Price Earnings ratio of this company is also good.
ICI Pakistan is also growing in market and share price of it also increasing. The company's
earnings per share increased to PKR 17.50 in the period under review against PKR 14.73 in the
same period a year back.
Siemens Pakistan’s shares are trading in market on high prices and repute of this company is
also good so that’s why share price is increasing. Its P/E Ratio is better than others in market.
Year over year, GUL Ahmed Textile Mills Ltd. has been able to grow revenues from 14.2B to
19.9B. Company has been able to reduce general and administrative costs from 8.64% to 7.82%.
This was a driver that led to a bottom line growth from 113.8M to 468.2M.
P. S. O., Engro Corp., Fauji Fertilizer, is those companies whose share price is increasing and
Dividend Yield of these companies is also good which create attractiveness for the investors to
invest in these companies. Downfall in shares prices is also low in these stocks.
Pak Suzuki is growing in share market due to its good image and they are maintaining their sales
which led them to increase profitability and share price is also increasing persistently.
Attock Petroleum Ltd. announced earnings results for the half year ended December 31, 2010.
The company reported sales increased to PKR 46.751 billion in the half year period in 2010
against PKR 42.875 billion in the same period in 2009. The company's profit before taxation
increased to PKR 2.390 billion in the half year period in 2010 against PKR 1.965 billion in the
same period a year back.
National Ref. is stock listed company whose share price is increasing and fluctuation in share
price from last 52 weeks is very low. Dividend Yield of National Ref. is 7.65-10 and Price
Earnings Ratio is 3.33. Company’s sales also increasing which cause increase in profitability.

8/6/2019 Stocks Trading
http://slidepdf.com/reader/full/stocks-trading 5/23
Financial Management Stocks Trading
Final Project pg. 5
Stocks Information:
WEEK 2 (4th Mar, 2011) Closing Price
(P0) Gain/Loss New Stocks (P0)
No. Of
Shares
566.33 619.3512095
160.69 1015.973127
977 144.5362794
35.56 93.67016747 Millat Tractors 517.45 19.50656134
281.47 286.5182911
216.29 305.9036546
119.82 689.624409
65.83 612.6068032 Pak Oilfield 316.3 33.55234525
352.93 195.868843
287.03 974.192315
WEEK 1 (25th Feb, 2011)
CompanyClosing Price
(P0) Investment
No. Of
Shares
Bata Pakistan 533.3 10000 18.75117195
ICI Pak. 145.87 10000 68.55419209
Siemens Pak. 963.08 10000 10.38335341
GUL Ahmed
Tex. 35.23 10000 283.8489923
P. S. O. 273.63 10000 36.5457004
Engro Corp. 209.87 10000 47.64854434
Fauji Fert. 112.09 10000 89.21402444
Pak Suzuki 62.03 10000 161.2123166
Attock Pet. 346.15 10000 28.88920988
National Ref. 261.55 10000 38.23360734

8/6/2019 Stocks Trading
http://slidepdf.com/reader/full/stocks-trading 6/23
Financial Management Stocks Trading
Final Project pg. 6
Stocks Selling & Purchasing Information:
I have purchased 2 new stocks Millat Tractors and Pak Oilfield in place of Gul Ahmad
Textile and Pak Suzuki respectively. Share price of all stocks rise but rise in prices of these
stocks were low as compared to other stocks so this is main reason due to which I sold these
stocks.
Reasons for purchasing new Stocks:
Millat Tractors and Pak Oilfield are those companies whose share price is increasing and
Dividend Yield of these companies is also good which create attractiveness for the investors to
invest in these companies. Downfall during last 52 weeks in shares prices is also low in these
stocks. So these are some reasons for which I have chosen these stocks.

8/6/2019 Stocks Trading
http://slidepdf.com/reader/full/stocks-trading 7/23
Financial Management Stocks Trading
Final Project pg. 7
Stocks Information:
S1 WEEK 3 (11th Mar, 2011) Company Investment No. Of Shares Closing Price (P0) Gain/Loss
Bata Pakistan 10619.35121 18.75117195 531.33 -656.2910182
ICI Pak. 11015.97313 68.55419209 158.65 -139.8505519
Siemens Pak. 10144.53628 10.38335341 975 -20.76670682
Millat Tractors 10093.67017 19.50656134 541.63 471.6686533
P. S. O. 10286.51829 36.5457004 285.21 136.6809195
Engro Corp. 10305.90365 47.64854434 234.84 883.8804975
Fauji Fert. 10689.62441 89.21402444 133.13 1187.438665
Pak Oilfield 10612.6068 33.55234525 322.29 200.9785481
Attock Pet. 10195.86884 28.88920988 361.99 261.7362415
National Ref. 10974.19232 38.23360734 292.93 225.5782833
WEEK 3 Purchases
New Stocks (P0) No. Of Shares
Nishat Mills 64.52 154.4181679
D.G. Khan Ce. 25.04 434.3499431

8/6/2019 Stocks Trading
http://slidepdf.com/reader/full/stocks-trading 8/23
Financial Management Stocks Trading
Final Project pg. 8
Stocks Information:
WEEK 4 (18th Mar, 2011) Company Investment No. Of Shares Closing Price (P0) Gain/Loss
Nishat Mills 9963.060191 154.4181679 64.67 23.16272518
D.G. Khan Ce. 10876.12257 434.3499431 23.66 -599.4029215
Siemens Pak. 10123.76957 10.38335341 975 0
Millat Tractors 10565.33882 19.50656134 517.05 -479.4712778
P. S. O. 10423.19921 36.5457004 280.44 -174.3229909
Engro Corp. 11189.78415 47.64854434 199.11 -1702.482489
Fauji Fert. 11877.06307 89.21402444 130.01 -278.3477563
Pak Oilfield 10813.58535 33.55234525 322.4 3.690757978
Attock Pet. 10457.60508 28.88920988 351.02 -316.9146324
National Ref. 11199.7706 38.23360734 291.52 -53.90938635
WEEK 4 Purchases
New Stocks (P0) No. Of Shares
Pak Cables 53 191.0145202
Cherat Paper 51.5 184.2194498

8/6/2019 Stocks Trading
http://slidepdf.com/reader/full/stocks-trading 9/23
Financial Management Stocks Trading
Final Project pg. 9
Stocks Selling & Purchasing Information:
I have purchased 2 new stocks Pak Cables and Cherat Paper in place of Siemens Pakistan and
Engro Corporation respectively. Share price of all stocks fall to some extent but fall in prices of
these stocks were high as compared to other stocks so this is main reason due to which I sold
these stocks.
Reasons for purchasing new Stocks:
Cherat Paper and Pak Cables are those companies whose share price is increasing and
Dividend Yield of these companies is also good which create attractiveness for the investors to
invest in these companies. Downfall during last 52 weeks in shares prices is also low in these
stocks. So these are some reasons for which I have chosen these stocks.

8/6/2019 Stocks Trading
http://slidepdf.com/reader/full/stocks-trading 10/23
Financial Management Stocks Trading
Final Project pg. 10
Stocks Information:
WEEK 5 (25th Mar, 2011)
Company Investment No. Of Shares Closing Price (P0) Gain/Loss
Nishat Mills 9986.222916 154.4181679 63.96 -109.6368992
D.G. Khan Ce. 10276.71965 434.3499431 23.81 65.15249146
Pak Cables 10123.76957 191.0145202 52 -191.0145202
Millat Tractors 10085.86754 19.50656134 510.76 -122.6962709
P. S. O. 10248.87622 36.5457004 276.63 -139.2391185Cherat Paper 9487.301663 184.2194498 48.6 -534.2364043
Fauji Fert. 11598.71532 89.21402444 129.64 -33.00918904
Pak Oilfield 10817.27611 33.55234525 322.01 -13.08541465
Attock Pet. 10140.69045 28.88920988 353.72 78.00086668
National Ref. 11145.86121 38.23360734 286.5 -191.9327089
WEEK 5 Purchases
New Stocks (P0) No. Of Shares
Exide (PAK) 183 54.44355886
Indus Dyeing 313.54 28.55477852

8/6/2019 Stocks Trading
http://slidepdf.com/reader/full/stocks-trading 11/23
Financial Management Stocks Trading
Final Project pg. 11
Stocks Selling & Purchasing Information:
I have purchased 2 new stocks Exide Pakistan and Indus Dyeing in place of Millat Tractors
and Cherat Paper respectively. Share price of all stocks fall to some extent but fall in prices of
these stocks were high as compared to other stocks so this is main reason due to which I soldthese stocks.
Reasons for purchasing new Stocks:
Exide Pakistan and Indus Dyeing are those companies whose share price is increasing and
Dividend Yield of these companies is also good which create attractiveness for the investors to
invest in these companies. Although there is downfall in share prices of these stocks but that
downfall is low as others in market so a persistent decrement and increment in prices are more
preferable than great fluctuations.

8/6/2019 Stocks Trading
http://slidepdf.com/reader/full/stocks-trading 12/23
Financial Management Stocks Trading
Final Project pg. 12
Stocks Information:
WEEK 6 (1st Apr, 2011)
Company Investment No. Of Shares Closing Price (P0) Gain/Loss
Nishat Mills 9876.586017 154.4181679 64.99 159.0507129
D.G. Khan Ce. 10341.87214 434.3499431 25.73 833.9518907
Pak Cables 9932.755052 191.0145202 53 191.0145202
Exide (PAK) 9963.171272 54.44355886 193.41 566.7574478
P. S. O. 10109.6371 36.5457004 277.51 32.16021635Indus Dyeing 8953.065259 28.55477852 309 -129.6386945
Fauji Fert. 11565.70613 89.21402444 137.88 735.1235614
Pak Oilfield 10804.19069 33.55234525 325.09 103.3412234
Attock Pet. 10218.69132 28.88920988 367.1 386.5376282
National Ref. 10953.9285 38.23360734 311.42 952.7814949
WEEK 6 Purchases
New Stocks (P0) No. Of Shares
Atlas Honda 141.75 71.54707102
Siemens Pak. 1051 8.395267901

8/6/2019 Stocks Trading
http://slidepdf.com/reader/full/stocks-trading 13/23
Financial Management Stocks Trading
Final Project pg. 13
Stocks Selling & Purchasing Information:
I have purchased 2 new stocks Atlas Honda and Siemens Pak. in place of P. S. O. and
Indus dyeing respectively. Share price of all stocks fall to some extent but fall in prices of
these stocks were high as compared to other stocks so this is main reason due to which I sold
these stocks.
Reasons for purchasing new Stocks:
Atlas Honda and Siemens Pak. are those companies whose share price is increasing and
Dividend Yield of these companies is also good which create attractiveness for the investors to
invest in these companies. Earnings per share of these two companies are also good that’s why I
have chosen these stocks. Downfall of last weeks is also low.

8/6/2019 Stocks Trading
http://slidepdf.com/reader/full/stocks-trading 14/23
Financial Management Stocks Trading
Final Project pg. 14
Stocks Information:
WEEK 7 (8th Apr, 2011)
Company Investment No. Of Shares Closing Price (P0) Gain/Loss
Nishat Mills 10035.63673 154.4181679 63.8 -183.7576198
D.G. Khan Ce. 11175.82404 434.3499431 26.12 169.3964778
Pak Cables 10123.76957 191.0145202 52.52 -91.68696971
Exide (PAK) 10529.92872 54.44355886 193.01 -21.77742355
Atlas Honda 10141.79732 71.54707102 140.15 -114.4753136
Siemens Pak. 8823.426564 8.395267901 1051 0
Fauji Fert. 12300.82969 89.21402444 137.88 0
Pak Oilfield 10907.53192 33.55234525 322.55 -85.22295694
Attock Pet. 10605.22895 28.88920988 368.38 36.97818865
National Ref. 11906.71 38.23360734 324.69 507.3599694
WEEK 7 Purchases
New Stocks (P0) No. Of Shares
Pak Engg. 95.2 103.4861251
Clariant Pak 141.5 70.86446646

8/6/2019 Stocks Trading
http://slidepdf.com/reader/full/stocks-trading 15/23
Financial Management Stocks Trading
Final Project pg. 15
Stocks Information:
WEEK 8 (15th Apr, 2011) Company Investment No. Of Shares Closing Price (P0) Gain/Loss
Pak Engg. 9851.87911 103.4861251 99.7 465.687563
D.G. Khan Ce. 11345.22051 434.3499431 24.39 -751.4254015
Pak Cables 10032.0826 191.0145202 53.7 225.3971339
Exide (PAK) 10508.1513 54.44355886 194.77 95.8206636
Clariant Pak 10027.322 70.86446646 144.96 245.1910539
Siemens Pak. 8823.426564 8.395267901 1064 109.1384827
Fauji Fert. 12300.82969 89.21402444 138.71 74.04764029
Pak Oilfield 10822.30896 33.55234525 322.73 6.039422145
Attock Pet. 10642.20714 28.88920988 363.88 -130.0014445
National Ref. 12414.06997 38.23360734 319.81 -186.5800038
WEEK 8 Purchases
New Stocks (P0) No. Of Shares
Tri-Pack Films 150.81 70.24597249
Rafhan Maize 2455.46 4.177416752

8/6/2019 Stocks Trading
http://slidepdf.com/reader/full/stocks-trading 16/23
Financial Management Stocks Trading
Final Project pg. 16
Stocks Information:
WEEK 9 (15th Apr, 2011) S2 Company Investment No. Of Shares Closing Price (P0) Gain/Loss
Pak Engg. 10317.56667 103.4861251 99.84 14.48805752
Tri-Pack Films 10593.79511 70.24597249 153.51 189.6641257
Rafhan Maize 10257.47974 4.177416752 2561.55 443.1821432
Exide (PAK) 10603.97196 54.44355886 194 -41.92154033
Clariant Pak 10272.51306 70.86446646 144.95 -0.708644665
Siemens Pak. 8932.565047 8.395267901 1075 92.34794691
Fauji Fert. 12374.87733 89.21402444 139.89 105.2725488
Pak Oilfield 10828.34838 33.55234525 326.72 133.8738576
Attock Pet. 10512.20569 28.88920988 375.81 344.6482739
National Ref. 12227.48996 38.23360734 332.47 484.0374689
WEEK 9 PurchasesNew Stocks (P0) No. Of Shares
Colgate Palm. 681.43 15.49983185
Bata (Pak) 467.92 21.95205252

8/6/2019 Stocks Trading
http://slidepdf.com/reader/full/stocks-trading 17/23
Financial Management Stocks Trading
Final Project pg. 17
Stocks Selling & Purchasing Information:
Stocks which I sold the reason behind these selling are downfall in share prices of these stocks.
There was a downfall in prices all stocks of that are registered in Karachi Stocks Exchange
during last two or three weeks but the prices of stocks that I sold gone down speedily.
New stocks chosen were based on their past performance. Earnings per Shares of these stocks
were high and downfall in last 52 weeks was also low. Dividend yield of new selected stocks is
also good and these companies stocks are growing in market. This creates attractiveness for the
investors to invest in these companies.

8/6/2019 Stocks Trading
http://slidepdf.com/reader/full/stocks-trading 18/23
Financial Management Stocks Trading
Final Project pg. 18
Stocks Information:
WEEK 10 (29th Apr, 2011)
Company Investment No. Of Shares Closing Price (P0) Gain/Loss
Pak Engg. 10332.05473 103.4861251 100.99 119.0090439
Tri-Pack Films 10783.45924 70.24597249 166.06 881.5869548
Rafhan Maize 10700.66188 4.177416752 2744.4 763.840653
Colgate Palm. 10562.05042 15.49983185 699.93 286.7468893
Bata (Pak) 10271.80441 21.95205252 459.12 -193.1780621
Siemens Pak. 9024.912994 8.395267901 1067.5 -62.96450926
Fauji Fert. 12480.14988 89.21402444 141.27 123.1153537
Pak Oilfield 10962.22224 33.55234525 325.59 -37.91415013
Attock Pet. 10856.85397 28.88920988 376.37 16.17795753
National Ref. 12711.52743 38.23360734 349.8 662.5884152
WEEK 10 Purchases
New Stocks (P0) No. Of Shares
Ghazi Tractors 214.01 47.09418416
I.C.I 154.91 57.85261432

8/6/2019 Stocks Trading
http://slidepdf.com/reader/full/stocks-trading 19/23
Financial Management Stocks Trading
Final Project pg. 19
Reasons of stocks replacement:
Two new stocks with which I replaced the older ones is because the older stocks was not
generating profit and rating of new companies is going these days. Companies are providing
more and more investing opportunities. P/E ratio is also good. These companies financial
position is strong as compared to others in same industry, this create attraction for the investors.

8/6/2019 Stocks Trading
http://slidepdf.com/reader/full/stocks-trading 20/23
Financial Management Stocks Trading
Final Project pg. 20
Stocks Information:
WEEK 11 (6th May, 2011)
Company Investment No. Of Shares Closing Price (P0) Gain/Loss
Pak Engg. 10451.06377 103.4861251 104 311.4932366
Tri-Pack Films 11665.04619 70.24597249 164.75 -92.02222397
Rafhan Maize 11464.50253 4.177416752 2702.3 -175.8692452
Colgate Palm. 10848.79731 15.49983185 729.82 463.2899741
Ghazi Tractors 10078.62635 47.09418416 226.38 582.555058I.C.I 8961.948484 57.85261432 153 -110.4984934
Fauji Fert. 12603.26523 89.21402444 139.02 -200.731555
Pak Oilfield 10924.30809 33.55234525 326.1 17.11169608
Attock Pet. 10873.03192 28.88920988 379.06 77.71197458
National Ref. 13374.11585 38.23360734 340.43 -358.2489008
WEEK 11 Purchases
New Stocks (P0) No. Of Shares
Sui Northern 17.91 646.1766593
Nishat Power 16.68 530.6624695

8/6/2019 Stocks Trading
http://slidepdf.com/reader/full/stocks-trading 21/23
Financial Management Stocks Trading
Final Project pg. 21
Stocks Information:
This is last week so I sold all my stocks on May 13, 2011 by the closing price of this day.
WEEK 12 (13th May, 2011)
Company Investment No. Of Shares Closing Price (P0) Gain/Loss
Pak Engg. 10762.55701 103.4861251 94 -1034.861251
Sui Northern 11573.02397 646.1766593 18.2 187.3912312
Rafhan Maize 11288.63329 4.177416752 2778.78 319.4888332
Colgate Palm. 11312.08728 15.49983185 746.53 259.0021903
Ghazi Tractors 10661.18141 47.09418416 224.45 -90.89177542
Nishat Power 8851.449991 530.6624695 16.86 95.51924451
Fauji Fert. 12402.53368 89.21402444 141.21 195.3787135
Pak Oilfield 10941.41979 33.55234525 326.17 2.348664168
Attock Pet. 10950.7439 28.88920988 374.96 -118.4457605
National Ref. 13015.86695 38.23360734 329.88 -403.3645574

8/6/2019 Stocks Trading
http://slidepdf.com/reader/full/stocks-trading 22/23
Financial Management Stocks Trading
Final Project pg. 22
Gain / Loss (May 13, 2011)
After operating 12 weeks in stock market the overall gain or loss on initial investment is givenbelow:
Overall Gain / Loss (13th May, 2011) Stocks Purchased Initial Investment Finally Sold Earnings Net Gain/Loss
Bata Pakistan 10000 Pak Engg. 9727.69576 -272.3042397
ICI Pak. 10000 Sui Northern 11760.4152 1760.4152
Siemens Pak. 10000 Rafhan Maize 11608.12212 1608.122121
GUL Ahmed Tex. 10000 Colgate Palm. 11571.08947 1571.089473P. S. O. 10000 Ghazi Tractors 10570.28963 570.2896336
Engro Corp. 10000 Nishat Power 8946.969236 -1053.030764
Fauji Fert. 10000 Fauji Fert. 12597.91239 2597.912392
Pak Suzuki 10000 Pak Oilfield 10943.76845 943.7684508
Attock Pet. 10000 Attock Pet. 10832.29814 832.2981366
National Ref. 10000 National Ref. 12612.50239 2612.50239
Total 100000 111171.0628 11171.06279
During these 12 weeks I have purchased and sold many stocks. Old stocks which were cause of
loss replaced with newer ones so that profit can be generated. At the end of week 12 net gain was
on initial investment of 100000 is 11171.06279.

8/6/2019 Stocks Trading
http://slidepdf.com/reader/full/stocks-trading 23/23
Financial Management Stocks Trading
Final Project pg. 23
Return on Revenue:
A meausre of coporation profitability calculated as net income divided by revenue.
Finally Sold Net Gain/Loss ROR
Pak Engg. -272.3042397 -2.723042397
Sui Northern 1760.4152 17.604152
Rafhan Maize 1608.122121 16.08122121
Colgate Palm. 1571.089473 15.71089473
Ghazi Tractors 570.2896336 5.702896336
Nishat Power -1053.030764 -10.53030764
Fauji Fert. 2597.912392 25.97912392
Pak Oilfield 943.7684508 9.437684508
Attock Pet. 832.2981366 8.322981366
National Ref. 2612.50239 26.1250239