
? Education Technology. School of Tomorrow: Visions Henrik Hansson Stockholm University Sweden.
Upload
buck-mclaughlinCategory
view
221download
1
Stockholm Economy Q2 2015 September 2015
Photo: Henrik Trygg

Stockholm EconomyQ2 2015
Positive figures for Stockholm
Stockholm’s economic growth continued during the second quarter of 2015. Aggregated gross pay data show positive growth figures both for Stockholm County as well as the City of Stockholm compared with the same quarter 2014.
5 321 new companies were registered in Stockholm County during the second quarter 2015, whereof the City of Stockholm accounted for 3 111. This represents a 3% increase for the county and 2% increase for the city compared to the second quarter 2014.
The number of people employed has increased during the last quarter.The number of listed positions increased and the number of people given notice decreased. The unemployment rate decreased both in Stockholm County and the City of Stockholm compared with the same quarter 2014.
The last four quarters the number of residents has increased by 32 200 in Stockholm County, of which the City of Stockholm accounted for 12 100, representing a 1% increase in population for both regions.
The number of housing projects decreased in Stockholm County but increased in the City of Stockholm in the last quarter. In total12 000 apartments were started in Stockholm County during the last four quarters, whereof about 3 800 in the City of Stockholm.
Olle ZetterbergCEO Stockholm Business Region
About the reportThe report is published each quarter by Stockholm Business Region.The report includes Stockholm County and the City of Stockholm. Statistics used is collected from Statistics Sweden, The Labour Exchange and The Swedish Companies Registration Office.
The report can be downloaded from:http://www.stockholmbusinessregion.se/en/facts--figures/#facts-about-business
The Stockholm Region is defined as Stockholm County, Uppsala County, Gävleborg County, Västmanland County, Örebro County and Södermanland County. Individual county reports for the above mentioned can be found in Swedish here: http://www.stockholmbusinessalliance.se/konjunkturrapporter/
Questions can be addressed to Vanessa Gisbert at Stockholm Business Region Development. Publisher: Olle Zetterberg.
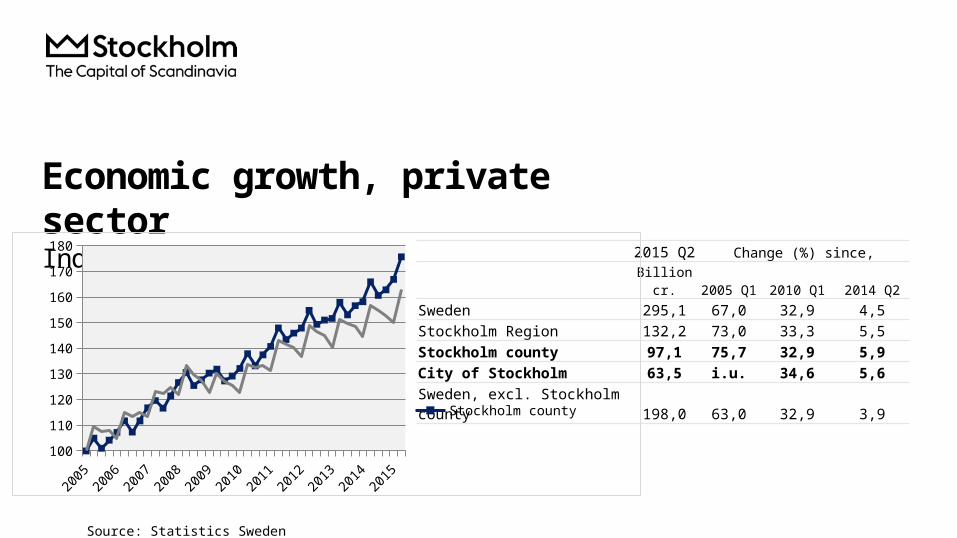
Economic growth, private sector
Index 100 = 2005 Q1 2015 Q2 Change (%) since,Billion cr. 2005 Q1 2010 Q1 2014 Q2
Sweden 295,1 67,0 32,9 4,5Stockholm Region 132,2 73,0 33,3 5,5Stockholm county 97,1 75,7 32,9 5,9City of Stockholm 63,5 i.u. 34,6 5,6Sweden, excl. Stockholm county 198,0 63,0 32,9 3,9
Source: Statistics Sweden
20052006
20072008
20092010
20112012
20132014
2015100
110
120
130
140
150
160
170
180
Stockholm countySweden, excl. Stockholm county

Economic growth, 2015 Q2Stockholm county City of Stockholm
Growth (%) since, Growth (%) since,Billion cr. 2009 Q1 2010 Q1 2014 Q2 Billion cr. 2009 Q1 2010 Q1 2014 Q2
Total 118,0 33,1 31,4 5,4 73,4 34,1 32,1 5,2Agriculture, forestry & fishing 0,2 60,6 41,8 5,8 0,0 109,6 37,6 3,0Manufacturing, mining, quarrying & utilities 9,7 19,1 23,7 7,0 4,9 29,7 30,0 11,6Energy & Environment 1,1 36,0 34,4 -4,5 0,4 -15,7 -5,4 2,3Construction 7,1 59,8 54,8 8,2 3,4 76,4 91,9 8,9Trade 15,2 27,9 22,3 3,7 8,5 31,5 23,8 3,7Transport 5,4 23,4 19,2 3,1 2,6 30,1 23,1 8,6Accommodation & food services 3,3 74,6 62,3 7,8 2,4 75,7 65,2 8,4Information & communication 11,6 24,6 28,8 5,1 9,6 30,3 35,2 5,3Financial & insurance 9,0 12,5 14,7 3,3 7,0 5,7 8,0 -5,7Real Estate 2,2 58,8 53,4 7,0 1,5 55,4 52,1 8,3Business services 18,2 44,2 43,8 8,2 14,4 44,5 44,4 9,2Public administration 0,1 45,1 31,4 -4,2 0,1 38,7 30,4 2,9Education 2,7 57,2 49,3 9,0 1,5 54,5 47,8 6,6Health 7,3 68,2 50,7 8,2 4,1 64,4 44,6 7,0Personal & cultural services 3,9 42,5 36,3 3,9 2,9 41,3 34,5 3,6Unspecified 0,2 -10,0 6,9 6,3 0,0 30,0 3,4 36,8Private sector 97,1 34,8 32,9 5,9 63,5 36,1 34,6 5,6State 8,1 30,2 26,9 2,0 5,6 24,5 19,9 1,4Municipal 9,6 24,1 22,3 4,7 3,5 18,4 15,8 4,5County council 3,2 20,9 27,4 3,7 0,8 27,6 16,1 2,3Public sector 20,9 25,8 24,8 3,5 10,0 22,5 18,1 2,5
Source: Statistics Sweden

The number of newly registred businesses
2015 Q2 Yearly change*Number Ch., % Number Ch., %
Sweden 14 633 -1,7 62 834 4,0Stockholm Region 7 018 1,5 29 748 4,9Stockholm county 5 321 2,5 22 397 4,8City of Stockholm 3 111 2,2 13 252 6,1Sweden, excl. Stockholm county 9 312 -4,0 40 437 3,6
Source: The Swedish Companies Registration Office.
*Last four quarters
20052006
20072008
20092010
20112012
20132014
20150
2,000
4,000
6,000
8,000
10,000
12,000
14,000
16,000
Stockholm countyCity of StockholmSweden, excl. Stockholm county

Company bankruptcies
Source: Statistics Sweden
2015 Q2 Yearly change*Number Ch., % Number Ch., %
Sweden 1 934 -4,8 6 881 -5,1Stockholm Region 871 -9,0 3 055 -6,9Stockholm county 633 -11,1 2 172 -10,2City of Stockholm 398 -12,5 1 359 -10,2Sweden, excl. Stockholm county 1 301 -1,4 4 709 -2,6
*Last four quarters
20052006
20072008
20092010
20112012
20132014
20150
200
400
600
800
1,000
1,200
1,400
1,600
Stockholm countyCity of StockholmSweden, excl. Stockholm county

Employment rateIndex 100 = 2008 Q1
Number Growth Growth (%) since,2015 Q2 Yearly ch.* 2008 Q1 2010 Q1 2014 Q2
Sweden 4 836 600 58 000 7,0 9,6 1,2Stockholm Region 1 866 600 30 700 10,8 10,5 1,7
Stockholm county1 171 100 19 800 14,4 11,8 1,7
City of Stockholm 515 200 4 100 18,4 13,2 0,8Sweden, excl. Stockholm county 3 665 500 38 200 4,8 8,9 1,1
Source: Statistics Sweden
*Last four quarters
20082009
20102011
20122013
20142015
90
95
100
105
110
115
120
Stockholm countyCity of StockholmSweden, excl. Stockholm county
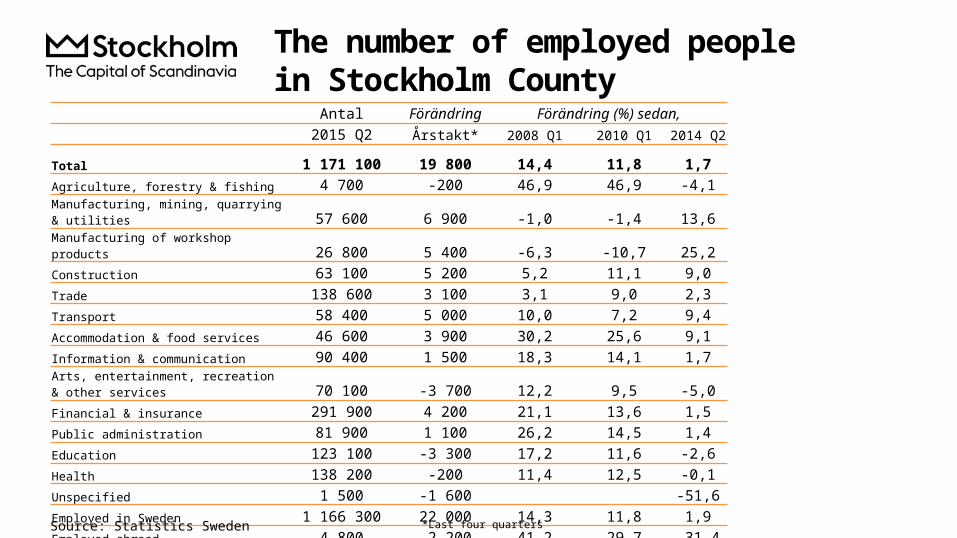
The number of employed peoplein Stockholm County
Antal Förändring Förändring (%) sedan,
2015 Q2 Årstakt* 2008 Q1 2010 Q12014 Q2
Total 1 171 100 19 800 14,4 11,8 1,7Agriculture, forestry & fishing 4 700 -200 46,9 46,9 -4,1Manufacturing, mining, quarrying & utilities 57 600 6 900 -1,0 -1,4 13,6Manufacturing of workshop products 26 800 5 400 -6,3 -10,7 25,2Construction 63 100 5 200 5,2 11,1 9,0Trade 138 600 3 100 3,1 9,0 2,3Transport 58 400 5 000 10,0 7,2 9,4Accommodation & food services 46 600 3 900 30,2 25,6 9,1Information & communication 90 400 1 500 18,3 14,1 1,7Arts, entertainment, recreation & other services 70 100 -3 700 12,2 9,5 -5,0Financial & insurance 291 900 4 200 21,1 13,6 1,5Public administration 81 900 1 100 26,2 14,5 1,4Education 123 100 -3 300 17,2 11,6 -2,6Health 138 200 -200 11,4 12,5 -0,1Unspecified 1 500 -1 600 -51,6Employed in Sweden 1 166 300 22 000 14,3 11,8 1,9Employed abroad 4 800 -2 200 41,2 29,7 -31,4
*Last four quartersSource: Statistics Sweden

Number of recently listed positions Index 100 = 2005 Q1
Source: The Labor Exchange
2015 Q2 Yearly growth*Number Ch., % Number Ch., %
Sweden 266 836 30,2 934 265 33,9Stockholm Region 113 239 24,3 404 929 36,4Stockholm county 80 280 26,1 287 538 38,6City of Stockholm 49 247 14,3 185 713 34,5Sweden, excl. Stockholm county 186 556 32,0 646 727 31,8
*Last four quarters
20052006
20072008
20092010
20112012
20132014
20150
50
100
150
200
250
300
Stockholm countyCity of StockholmSweden, excl. Stockholm county

The number of people given noticeIndex 100 = 2005 Q1
2015 Q2 Yearly change*Number Ch., % Number Ch., %
Sweden 8 973 -28,7 47 131 -8,8Stockholm Region 3 461 -35,8 19 339 -3,9Stockholm county 2 441 -29,5 12 671 0,0City of Stockholm 1 211 -36,9 6 857 -0,8Sweden, excl. Stockholm county 6 532 -28,4 34 460 -11,6
*Last four quarters
Source: The Labor Exchange
20052006
20072008
20092010
20112012
20132014
20150
50
100
150
200
250
300
350
400
Stockholm countyCity of StockholmSweden, excl. Stockholm county

Unemployment in relation to the population (%), 15-74 years
Source: The Labor Exchange and Statistics Sweden
Number Yearly Unemployed out of
population, 15-74 years
2015 Q2 change*2010 Q1
2014 Q2
2015 Q2
Sweden 358 658 -8 764 4,9 6,2 5,1Stockholm Region 129 409 -1 767 4,6 5,5 4,8Stockholm county 69 544 -1 232 3,8 4,4 4,3City of Stockholm 30 729 -593 4,3 4,7 4,5Sweden, excl. Stockholm county 289 114 -7 532 5,2 6,7 5,3
*Last four quarters
20052006
20072008
20092010
20112012
20132014
20150.0
1.0
2.0
3.0
4.0
5.0
6.0
7.0
Stockholm countyCity of StockholmSweden, excl. Stockholm county

PopulationIndex 100 = 2005 Q1
2015 Q2Yearly ch.* Growth (%) since,
(in thousands) 2005 Q1 2010 Q1 2014 Q2
Sweden 9 793,2 99,0 8,6 4,7 1,0Stockholm Region 3 680,2 46,0 13,2 7,1 1,3Stockholm county 2 213,5 32,2 18,0 9,3 1,5City of Stockholm 917,3 12,1 19,8 10,2 1,3Sweden, excl. Stockholm county 7 579,6 66,8 6,2 3,4 0,9
Source: Statistics Sweden
*Development last four quarters
20062007
20082009
20102011
20122013
20142015
100
105
110
115
120
125
Stockholm countyCity of StockholmSweden, excl. Stockholm county

Number of housing projects startedIndex 100 = 2005 Q1
Source: Statistics Sweden
2015 Q2 Yearly change*Number Ch., % Number Ch., %
Sweden 11 444 5,2 45 999 11,9Stockholm Region 4 252 -9,8 18 563 7,3Stockholm county 2 652 -26,7 11 719 -7,8City of Stockholm 1 158 36,1 3 840 -11,9Sweden, excl. Stockholm county 8 792 21,1 34 280 20,8
*Last four quarters
20052006
20072008
20092010
20112012
20132014
20150
100
200
300
400
500
600
Stockholm countyCity of StockholmSweden, excl. Stockholm county

Commercial AccommodationsIndex 100 = 2008 Q2 (Q2, 2008 - 2015)
Source: Statistics Sweden
2015 Q2Yearly ch.* Growth (%) since,
(in thousands)2008 Q1 2010 Q1 2014 Q2
Sweden 14 199 57 563 45,0 46,4 2,8Stockholm Region 4 609 17 251 88,3 84,6 4,5Stockholm county 3 300 12 244 91,4 84,9 6,0City of Stockholm 2 176 8 132 89,1 76,1 3,4Sweden, excl. Stockholm county 10 899 45 320 35,1 37,7 1,8*Development last four quarters
20082009
20102011
20122013
20142015
90
95
100
105
110
115
120
125
130
135
140
Stockholm countyCity of StockholmSweden, excl. Stockholm county

Stockholm Business Region
Stockholm Business Region is responsible for developing and promoting Stockholm as a business and tourist destination under the brand Stockholm - The Capital of Scandinavia.
The aim is to make Stockholm the leading sustainable growth region in Europe.
Stockholm Business Region is owned by the city of Stockholm and has two subsidiaries Stockholm Business Region Development and Stockholm Visitors Board.
For questions: Contact Vanessa Gisbert , Stockholm Business Region. Publisher: Olle Zetterberg, CEO Stockholm Business Region
Stockholm Business Region P.O. Box 16282 SE-103 25 Stockholm, Sweden Phone + 46 8 508 280 00 www.visitstockholm.com investstockholm.com stockholmbusinessregion.se